3.4.1. Environmental Performance (EP)
For the assessment of concrete eco-efficiency, environmental performance was assessed using a lifecycle assessment (LCA) technique.
- (1)
Definition of purpose and scope
General concrete was selected as the product subject to LCA, and the formation of concrete structure and concrete product was selected as the primary function of concrete. The functional unit was defined as 1 m3 of concrete based on the primary function.
- (2)
Life Cycle Impact Assessment (LCIA)
Life Cycle Impact Assessment (LCIA) is a process that assesses the potential effects of indicators (input and output) created during lifecycle impact analysis on the environment.
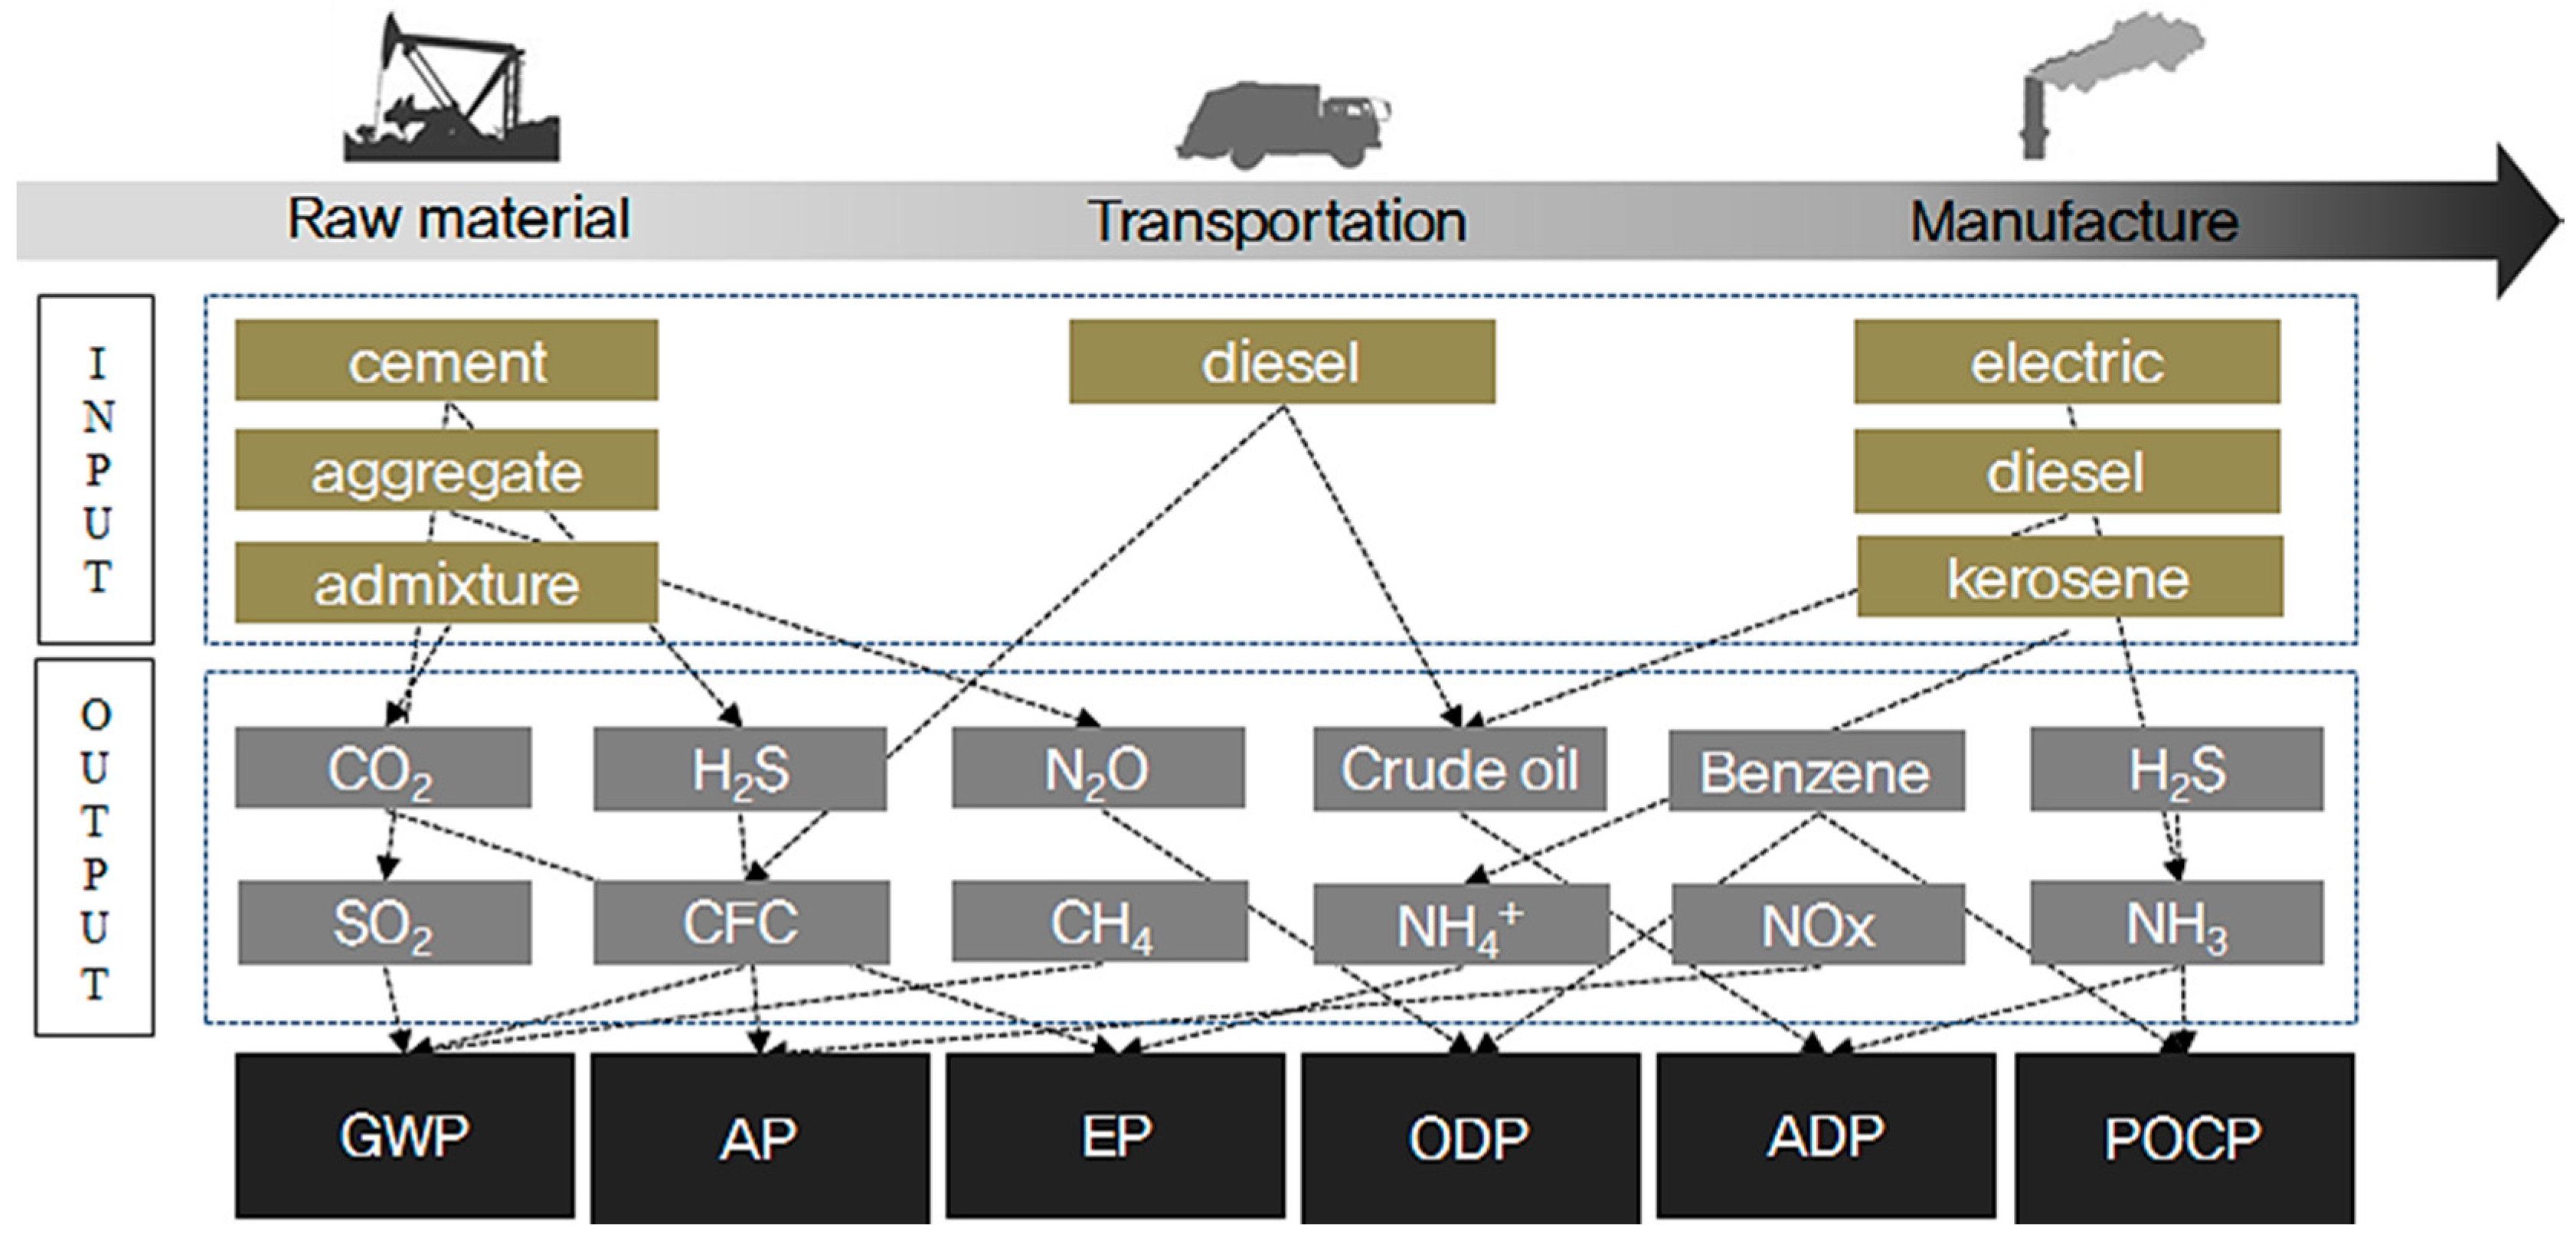
Concrete is a mixture of cement, aggregates, and admixtures. Large amounts of energy are consumed during the collection of limestone or clay and the manufacture of clinker. Soil erosion or destruction of the ecosystem may occur from the collection of aggregates. In addition, because energy is also used during the transport of materials such as cement and aggregate to concrete manufacturers and during the production of concrete, diverse substances that incur environmental loads on air, water systems, and soil are emitted.
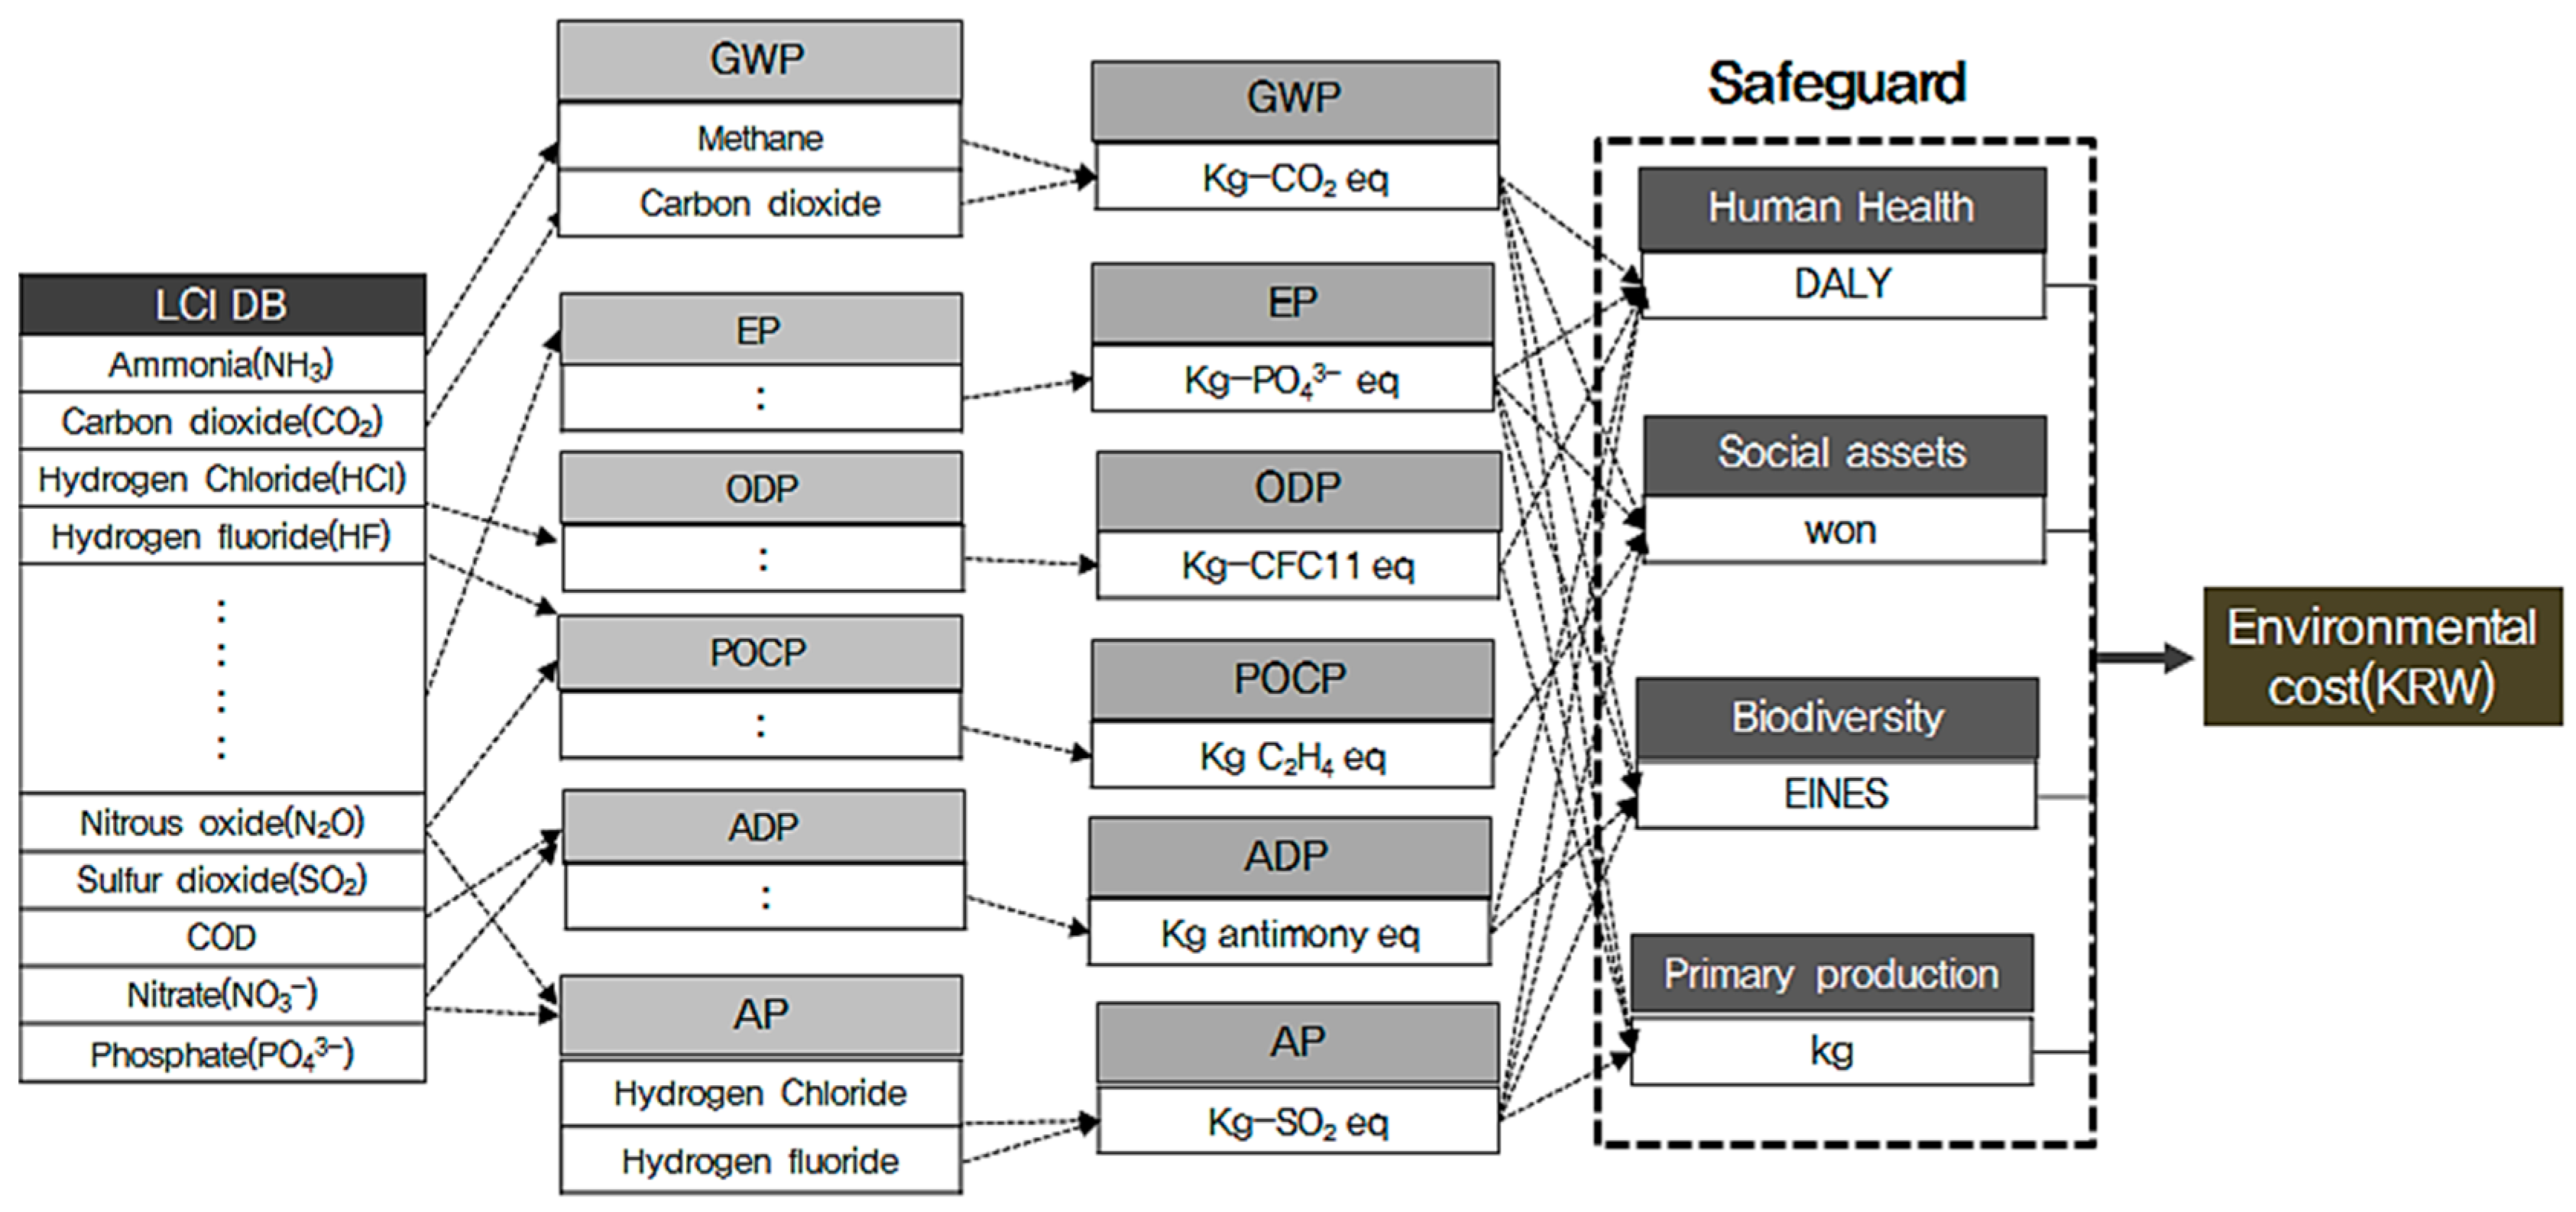
Because different environmental impacts occur during the lifecycle of concrete, multiple environmental impact assessments must be conducted on various aspects from production to use and disposal of functional units of concrete. Indeed, the assessment of a single environmental impact, such as global warming, fails to comprehensively assess the environmental performance of concrete (
Figure 5). Accordingly, Life Cycle Impact Assessment (LCIA) on concrete was conducted based on standard substances and impact indicators for each of the six environmental impact categories, global warming, resource consumption, acidification, eutrophication, effects on the ozone layer, and creation of photochemical oxides [
17].
Life Cycle Impact Assessment (LCIA) is divided into four steps: (1) classification in which the inventory items extracted from the inventory analysis are assigned to the corresponding impact categories; (2) characterization in which the impact of each item classified into its impact category on each category is quantified; (3) normalization in which the environmental impact exerted on the environmental categories are divided into local or global environmental impacts; and (4) weighting in which relative importance among the impact categories is determined. According to ISO 14044 [
18], the classification and characterization steps are mandatory assessment steps, and the normalization and weighting steps may be optionally assessed depending on the assessment purpose. In this study, assessment was performed for the classification and characterization steps because factors for concrete-related normalization and weighting suitable for Korean situations are yet to be developed.
The standard substances and impact potentials for environmental impact categories were applied in accordance with the respective databases used in the Ministry of Environment for the eco-labeling of the Environmental Declaration of Products [
19,
20]. The classification and characterization steps of assessment were performed on the basis of the previously selected LCI (Life Cycle Inventory) database [
21].
Classification is done by categorizing and compiling the inventory items according to the environmental impact categories. By linking the inventory items derived from the LCI database to the pertinent environmental impact categories and integrating them by category, the environmental impact of each inventory item can be clearly identified.
CO
2, CH
4, and N
2O belong to the 23 GHGs specified in the Intergovernmental Panel on Climate Change (IPCC) guidelines [
22], of which the standard substance is CO
2.
The classification of abiotic depletion potential (ADP) based on the standards provided by Guinee (1995) [
23], takes into account a total of 89 resource items including crude oil, natural gas, and uranium (U). Acidification potential (AP) varies widely according to regional characteristics and atmospheric environments, and we applied the AP index presented by Heijung et al. and Hauschild and Wenzel [
24] applicable to all regional types. A total of 23 inventory items linked to acidification category, including sulfur dioxide (SO
2), hydrogen sulfide (H
2S), and hydrogen fluoride (HF), are expressed in terms of their standard substance SO
2. Likewise, the index proposed by Heijung et al. and Hauschild and Wenzel was applied for the classification of the eutrophication potential (EP), with phosphate (PO
43−) used as the standard substance for a total of 11 inventory items including phosphate (PO
43−), ammonia (NH
3), and nitrogen oxides (NO
x). For the ozone depletion potential (ODP), we applied the ODP index specified in the World Meteorological Organization (WMO) [
25] for a total of 23 inventory items, including CFC-11, Halon-1301, and CFC-114, with trichloro-fluoro-methane (CFC-11) as the standard substance. For the photochemical oxidant creation potential (POCP), a total of 128 inventory items were considered, including ethylene, NMVOC, and ethanol, with ethylene being the standard substance, thereby applying the POCP index proposed by Derwent et al. [
26] and Jenkin and Hayman [
27].
Characterization is a process of quantifying the environmental impact of inventory items itemized for each category in the classification step.
In the classification step, inventory items are assigned to their respective environmental impact categories, but there is a limitation in quantifying the potential impacts of inventory items in common metrics due to different impact potentials. Category indicator results, i.e., characterization values, are calculated in the characterization step where the environmental impact (=inventory data) of each inventory item is multiplied with the characterization factor (=impact potential) unique to the impact category concerned, and the resulting environmental impact thus converted into impacts are aggregated within each impact category to yield the overall environmental impact of that category (Equations (3)–(8)).
- (3)
Damage assessment
Environmental cost, shown by Equation (9), converts the damage done to human beings and the ecosystem by the production of concrete into an economic value. Environmental cost is calculated by multiplying the damage factor of each safeguard subject and the economic value of each damage indicator for influential substances that belong to an environmental impact category (
Figure 6).
Here, Loadi,j is the environmental load of influential substance j that belongs to impact category i, DFk,i,j is the damage factor for the damage caused by influential substance j that belongs to impact category i on safeguard subject k, and Kc is the economic value (KRW) of safeguard subject k.
- (a)
Safeguard subject
From the viewpoint of environmental ethics, the environment is mainly divided into the human environment and the ecosystem. The human environment can be subdivided into human health and social assets that sustain human society, such as crops and resources.
Accordingly, as shown in
Table 2, human health, biodiversity, social assets, and primary production were selected in this study as four safeguard subjects. Rather than the Eco-indicator 99 [
28] (which reflects the environmental situation of Europe), the Korean lifecycle impact assessment index based on damage-oriented modeling (KOLID) [
29] benchmarks the lifecycle impact assessment method based on endpoint modeling (LIME) of Japan [
30], which clearly describes the philosophical grounds for the selection of safeguard subjects. Therefore, it is appropriate for the current analysis to use the safeguard subjects of KOLID for the calculation of the environmental costs of concrete.
- (b)
Damage indicators
Table 2 shows damage indicators for each safeguard subject, unit of each damage indicator, and scope of assessment necessary for quantification of damage received by the four safeguard subjects according to environmental load. For human health, the degree of damage on human health caused by specific disease or physical factor was quantified as Disability Adjusted Life Year (DALY), a value that expresses the degree of damage on human health using the concept of life year. DALY can be used to assess cases of early death from disease or accident and cases of unhealthy life due to disability. For example, one DALY means that life year during which death from disease or accident and unhealthy life occurs is 1 year. As shown by Equation (10), DALY can be expressed as the sum of “Years of Life Lost (YLL)” from disease or accident and “Years Lost due to Disability (YLD).” YLD can be derived by reflecting importance of disability (D) and social value of age upon death. However, only importance of disability was accounted without consideration on importance of age and time discount originally considered in DALY. DALY was used as an indicator to show combined years lost from death and disability [
31,
32].
Social assets [
33] can be classified into “production capacity of the ecosystem” that corresponds to the biological world and “non-biological resources” related to non-biological elements. In this study, forest resources, marine resources, and agricultural crops correspond to production capacity of the ecosystem, and fossil fuels and mineral resources correspond to non-biological elements. Current value assessment method, which uses actual market price, was applied as an indicator to measure the amount of damage for each item. When assessing biodiversity, general method involves classification of species according to the Endangered Species Act of the United States, the Convention on international angered Species of Wild Flora and Fauna (CITES), and Red Data Book (RDB) published by the International Union for Conservation of Nature (IUCN) [
34]. The conventional damage oriented methods of impact assessment reflect such reality and conduct assessment based on quantifiable species [
35,
36]. In this study, “Expected Increase in Number of Extinct Species (EINES)” based on preservation ecology was adopted as damage indicator for ease of interpretation and agreement with data from Red Data Book. EINES, obtained from the increase in number of extinct species caused by environmental load, can be expressed as Equation (11).
Here, Rs is the extinction risk increase by environmental impact; Ta,s is the extinction hours after caused environmental impact; and Tb,s is the extinction hours ago caused environmental impact.
Damage indicators to assess the effects of primary production include gross primary production (GPP), net primary production (NPP), and plant biomass. From the perspective of plant supply to consumers, plant biomass seems to be an optimal indicator given that a certain critical mass of plants must be accumulated and secured. Considering, however, that this certain level of plant supply must be consistently maintained, the provision of large accumulations at specific points in time will not satisfy the long-term requirements for plants. Plants must be grown at a constant rate. Accordingly, the damage indicator for primary production is shown by the change of NPP per unit of environmental load.
- (4)
Integrated DB for each safeguard subject
The marginal willingness to pay per unit of environmental property was the unit converted for each unit of the four safeguard subjects considered, as presented in
Table 3 and
Table 4. Economic values (KRW, Korea Won) in
Table 5 form the integrated DB for each safeguard subject. For reference, the unit conversion assumed that the loss of social assets (national economy) and economic loss are identical.
3.4.3. Durability Performance (DP)
Durability performance assessment of concrete was assumed to assess the service life of concrete used on a reinforced concrete (RC) structure based on carbonation. In addition, the covering thickness was 30 mm. For our purposes, service life was defined as the duration of utility until the carbonation depth of concrete reaches the outermost reinforcement. The most appropriate equation was selected as the standard specification for concrete to indicate that equations other than the proposed equation should be used. For this, service life was assessed on covering thicknesses of 30 and 40 mm with a water-binder ratio of 60%.
- (1)
Selection of prediction equation for the service life of concrete
Service life was assessed for covering thicknesses of 30 mm and 40 mm with a water-binder ratio of 60%. Although conditions for the calculation of service life differ, concrete comprised of ordinary Portland cement was assessed under outdoor conditions in order to apply identical parameters.
As shown in
Table 7, an equation from the Architectural Institute of Japan (AIJ) [
37] was used to deduce the results of assessment. The AIJ formula is appropriate because it yields results that are closest to the average service life of concrete.
- (2)
Prediction factors of the service life of concrete
Among existing carbonation prediction equations, Equations (13) and (14) (originating from the Architectural Institute of Japan) were used to derive the service life of concrete in order to assess the durability performance of concrete. However, because conditions of temperature and humidity in Japan (as presented in the values of the equations) are different from the values in Korea for an average year, more apt coefficients for the conditions of Korea were derived with annual average values provided by the Korea Meteorological Administration.
Here, T is the service life (year), C is the carbonation depth (mm), A is the carbonation velocity coefficient, K is the Kishitani coefficient, α1 is the coefficient by type of concrete, α2 is the coefficient by type of cement, α3 is the coefficient by the water-cement ratio, β1 is the coefficient by temperature, β2 is the coefficient by moisture, and β3 is the coefficient by the concentration of carbon dioxide.
- (3)
Selection of covering thickness
Korean structural design standards for reinforced concrete have similar criteria to the code of the American Concrete Institute (ACI) [
43]. Item 7.7.1 of ACI 318 suggests a covering thickness of 1.5 inches (38 mm) for reinforcement No. 14 and No. 18, and ¾ inches (19 mm) for reinforcement No. 11 and below in the case of slabs, walls, and joist structures. The Korean standards suggest a covering thickness of 1.5 inches (38 mm) for main reinforcement, hoop reinforcement, and stirrup spiral reinforcement of beams and columns. In addition, the Japanese Architectural Standard Specification (JASS) [
44] suggests covering thicknesses of 30 mm for slabs and 40 mm for column and bearing walls under the same conditions (i.e., when the structures do not directly contact soil and air).
Japan does not apply different criteria according to varying thicknesses of reinforcement. This study applied version 8.1.1 of the durability assessment criteria of green building certification standards (2013) [
45]. The criteria of green building certification (2013) were selected based on the “Korean Building Code (KBC-2009) [
46] and Concrete Structure Design Standards (2012)” [
47]. Green building certification presents the legal minimum covering thickness to ensure the safety of structures by reflecting errors in covering thickness during actual construction. Accordingly, the covering thickness of reinforced concrete was defined as 30 mm to assess the service life of concrete based on carbonation according to the standards of green building certification.


