Article

CO2 Emissions and Cost by Floor Types of Public Apartment Houses in South Korea

1
Technological Development Team, Hanyang Corporation, 558 Songpadae-Ro, Songpa-Gu, Seoul 05510, Korea
2
Building and Urban Research Institute, Korea Institute of Civil Engineering and Building Technology, Daehwa-Dong 283, Goyandae-Ro, ILsanseo-Gu, Goyang-Si 10223, Korea
*
Author to whom correspondence should be addressed.
Sustainability 2016, 8(5), 445; https://doi.org/10.3390/su8050445
Submission received: 3 February 2016 / Revised: 8 April 2016 / Accepted: 26 April 2016 / Published: 5 May 2016
(This article belongs to the Section Sustainable Engineering and Science)

Abstract

:
In each country in the world, there is a strong need for all industries to reduce CO2 emissions for sustainable development as a preparation for climatic change. The biggest issue in many developed countries, including the United States, is to reduce CO2 emissions for the upcoming implementation of Carbon Emissions Trading. The construction industry, in particular, which accounts for up about 30% of CO2 emissions, will need studies on the amount of CO2 emissions. The purpose of this study is to present the most environmentally friendly and economical apartment house plan types according to the increasing number of layers by evaluating the amount of CO2 emissions and economic efficiency. The results indicated that flat and Y-shaped types are more eco-friendly and economical in lower levels of less than 20 stories. However, the L-shaped type is more highly eco-friendly and economically efficient in higher levels of more than 20 stories. The results of this paper would help to make a decision on the building types and the number of stories in the early stages of construction.

1. Introduction

Internationally, greenhouse gases (GHGs) are arguably the most prevalent environmental problem. According to the International Energy Agency (IEA), buildings account for almost 30% of GHG emissions. Accordingly, extensive effort has been focused on reducing GHG emissions in the building industry over the last few decades. In addition, the reduction of GHGs and the execution of carbon emissions trading schemes have become some of the most important issues in the world. As a result, many nations have announced their goals for the long-term reduction of CO2 emissions generated in a variety of industries. To comply with this international trend and to achieve sustainable development, Korea has also established a business-as-usual (BAU) GHG emission reduction target of 37% (851 million tons) by 2030 [1]. The construction industry consumes extensive energy, accounting for 30% to 40% of the CO2 emissions generated by all industries. Accordingly, it plays a critical role in the reduction of CO2 emissions in all countries, thus requiring practical reduction measures. As of 2010, 13,883,571 units of public apartment houses have been constructed in Korea, which accounts for 59% of the total number of houses in Korea. The amount of GHG emissions by energy use is 570.70 million metric tons of CO2 equivalent, which accounts for 85.3% of the total GHG emissions in Korea [2,3]. To proactively cope with the Convention on Climate Change and to achieve sustainable development, CO2 emissions of public apartment houses have been evaluated extensively. In Korea, flat-type public apartment houses, which provide suitable ventilation and air flow, were frequently constructed prior to the 2000s; recently, tower-type public apartment houses have primarily been constructed to maximize views and land use efficiency [4]. As such, different types of public apartment houses with various numbers of floors have been constructed. However, despite their construction, the CO2 emissions and costs have not been evaluated based on variations in the amount of material according to the number of floors and type of apartment [5,6]. Studies evaluating the energy performance and CO2 emissions of public apartment houses have been steadily conducted. Lee et al. [7] analyzed the energy performance of tower Y-type apartment houses. In addition, Noh [8] analyzed cooling and heating energy according to types of apartment houses. However, existing studies are limited because they performed analyses using only the reference floor, without applying real data from construction structures or considering variations in the amount of material according to the number of floors. Therefore, this study analyzed the type and number of floors of apartment houses that have been constructed in Korea and calculated the amounts of primary materials.
More specifically, architectural floor plans and structural plans of 100 public apartment houses built in Korea in the last five years were analyzed. Based on the results, public apartments were categorized as flat, tower Y, and tower L types as shown Figure 1, and two buildings of each type for 15, 20, 25, and 30 floors were selected as representative models. In addition, the amounts of expensive construction materials that can influence CO2 emissions, such as concretes, reinforcement bars, and forms, were calculated according to the number of floors in public apartment houses. Thus, this study aims to recommend the most eco-friendly and economical types of apartment houses, considering the number of floors, by analyzing CO2 emissions and costs for the calculated material amounts [9,10].

2. Literature Review

Oha et al. [11] proposed an optimum design model to analyze the relationship. A concrete-filled steel tube (CFT) column is one of the composite columns frequently used in building construction because of its structural performance, economic feasibility, and good space utilization; it has a high potential to reduce CO2 emissions because, due to the combining of two heterogeneous materials, the relationship among CO2 emissions, cost, and structural parameters in the green construction of buildings with CFT columns was not yet carried out. Boqiang et al. [12] provided an assessment of the potential of CO2 mitigation in buildings by conducting empirical research on the determinants of building energy-related CO2 emissions.
To build a calculation model for CO2 emissions in the materialization stage of office buildings, Zhixing et al. [13] considered the CO2 emissions generated from the production and transportation of construction materials and equipment, as well as the CO2 emissions generated from the construction process. Guomin et al. [14] developed a model to estimate and compare emissions at foundation construction and demonstrate its application using two case studies. Foundation construction involves heavy machine usage which contributes to greenhouse gas (GHG) and non-GHG emissions. Chau et al. [15] applied the Monte Carlo method to generate probabilistic distributions for describing the CO2 footprint of the superstructure of a high-rise concrete office building. The distribution profile was constructed with the material use data collected from 13 high-rise office concrete buildings in Hong Kong. Jingke et al. [16] analyzed GHG emissions during the construction phase of a case study building on the basis of an extended system boundary in the context of China by utilizing detailed onsite process data.

3. Evaluation Scope and Building Setup

One hundred architectural drawings and floor plans used in actual developments by companies in Korea were analyzed and categorized into flat, tower Y, and tower L types, as listed in Figure 1. For each type, two buildings were selected for 15, 20, 25, and 30 floors. As listed in Table 1, buildings with the same construction conditions were selected: an internal area of 84 m2, four households on a floor, three bays, and a floor height of 2.8 m.
The evaluation buildings were chosen from three locations, namely Seoul, Chungcheongnam-do, and Ulsan, to reduce the variations in building material amount due to land conditions [17,18].

4. Calculation of Material Amounts in Evaluation Buildings

4.1. Basis for Calculating Material Amounts

This study calculated the amounts of concrete, reinforcement bars, and forms by using the following equations. In a 2D drawing-based manual quantity estimation method, calculation procedures can vary, causing differences in results. In this study, therefore, the following were referred to: Reinforced Concrete Structure Estimation Standards, Korea Building Code (KBC); Korea Structural Concrete Design Code; Korean Construction Standard Specification (2013); and Construction Work Quantity Estimation (2007) [19,20,21,22].
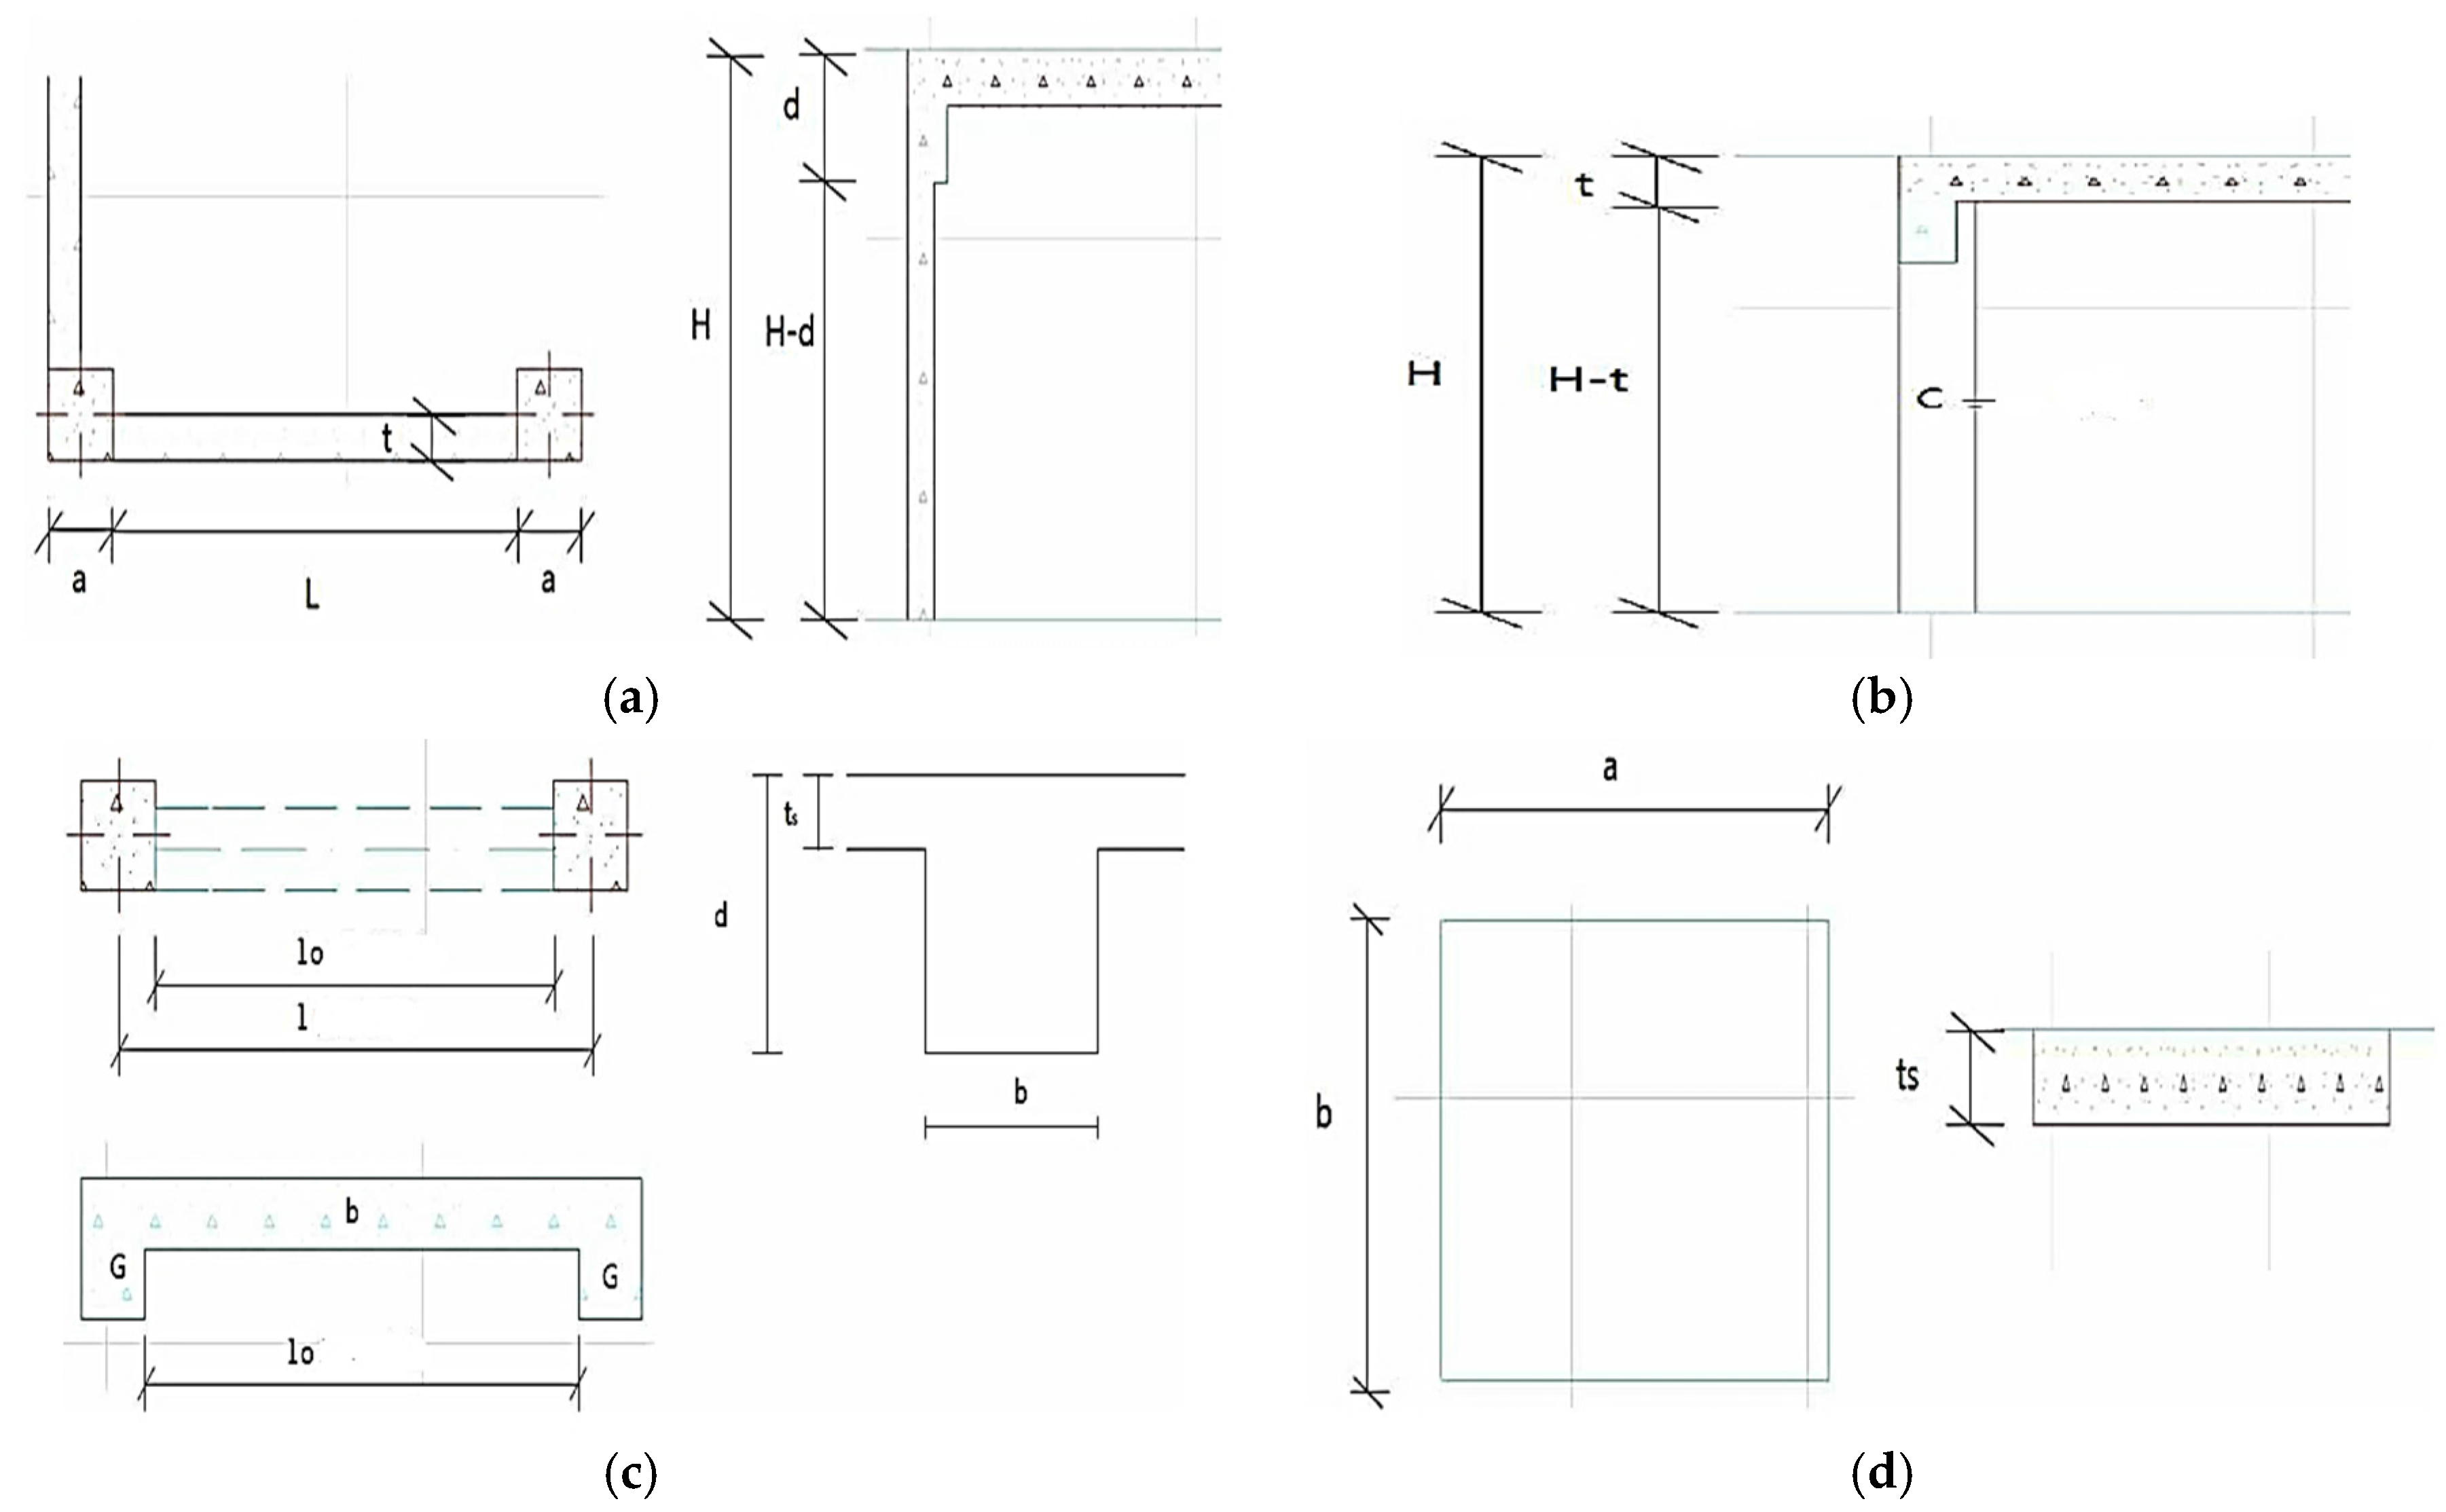
First, for the manual quantity estimation for walls, wall thickness is multiplied by wall area (area of openings not included) in the column-beam wall. In the column-less walls, wall thickness is multiplied by wall height (floor height minus baseplate height) and the same number of walls as shown in Figure 2a.
At the form estimation, the column-wall combined parts are not subtracted. In addition, the openings (less than 1 m2) in the wall are not subtracted from the form area, considering the materials that are present. They are subtracted from the form only when they are 1 m2 or greater. The wall quantity estimation formulas are shown in Table 2.
Second, a column volume is calculated by multiplying a section area by column height and number of the columns with the same dimensions as shown in Figure 2b. In the column height, however, the thickness between the upper-floor baseplate and target-floor baseplate is subtracted.
For the estimation of the quantity of slab-less columns, the section area is multiplied by the column height. The column quantity estimation formulas are stated in Table 3.
Third, beam height is subtracted from the baseplate thickness and multiplied by beam width. Then, the results are multiplied by beam length. After that, they are multiplied by the number of beams with the same dimensions as shown in Figure 2c. In this case, a large beam is set with inside distance among between the columns while a small beam is determined with inside length between the large beams. For the calculation of slab-less beams, the beam section area is multiplied by beam length without any subtraction. In addition, in the case of haunch parts, they are subtracted accordingly. The beam quantity estimation formulas are shown in Table 4.
Fourth, for the estimation of slab quantity, floor thickness is multiplied by floor area. At the estimation of floor form with the area under the slab, it should be subtracted from the wall thickness if the lower-floor wall is masonry as shown in Figure 2d. In the case of reinforced concrete walls, on the contrary, a total floor area is estimated without any subtraction. The slab quantity estimation formulas are shown in Table 5.
The length of reinforcing bars is estimated by type and diameter. Then, the total length is multiplied by unit weight (kg/m) to get the total weight. Each floor is divided into wall, column, beam and slab to make sure that there is no redundancy in calculation. The total length of reinforcing bars is estimated after calculating the length of each piece and multiplying it by total quantity. In estimating the length of each piece of reinforcing bar, member length, joint length, dowel length and hook length should be considered as shown in Table 6.
In principle, the quantity of reinforcing bars should be calculated after checking a drawing. If it is not possible to check the drawing, the quantity of reinforcing bars is estimated after dividing a scope of reinforcement placement by the placement interval. Then, a minor difference (one or two) can occur depending on the start point of reinforcement placement.
First, the quantity of wall reinforcing bars can be estimated by dividing them into line/point reinforcing bars or horizontal/vertical reinforcing bars. In vertical ones, dowel length is considered. In horizontal reinforcing bars, in contrast, joint length and number of joints are considered as shown in Figure 3a. In terms of the estimation of the number of joints, member length is divided by the length of each reinforcing bar as shown in Table 7.
Second, for the estimation of the quantity of column reinforcing bars, they are divided into main bars, hoop bars and diagonal hoop bars. The length of the main bar member is set with column height, and the number of joints occurs at every floor as shown in Figure 3b. Furthermore, a hook is installed at column end only. The length of each main bar/diagonal hoop bar is set with the column circumference. Then, the number of main bars and diagonal hoop bars is estimated by dividing the column height by the reinforcement placement interval as shown in Table 8.
Third, for the estimation of the quantity of beam reinforcing bars, they are divided into upper main bars, bent-up bars, lower main bars and stirrup bars. In case of beams, estimation standards for the top-floor and middle-floor beams differ. In terms of the length of reinforcing bars in top-floor beams, the lengths of upper main bars and bent-up bars are estimated with the outside length, while the length of lower main bars is calculated with the inside length. For the length of reinforcing bars for middle-floor beams, however, the lengths of upper main bars, bent-up bars and lower main bars are all estimated with inside length as shown in Table 9.
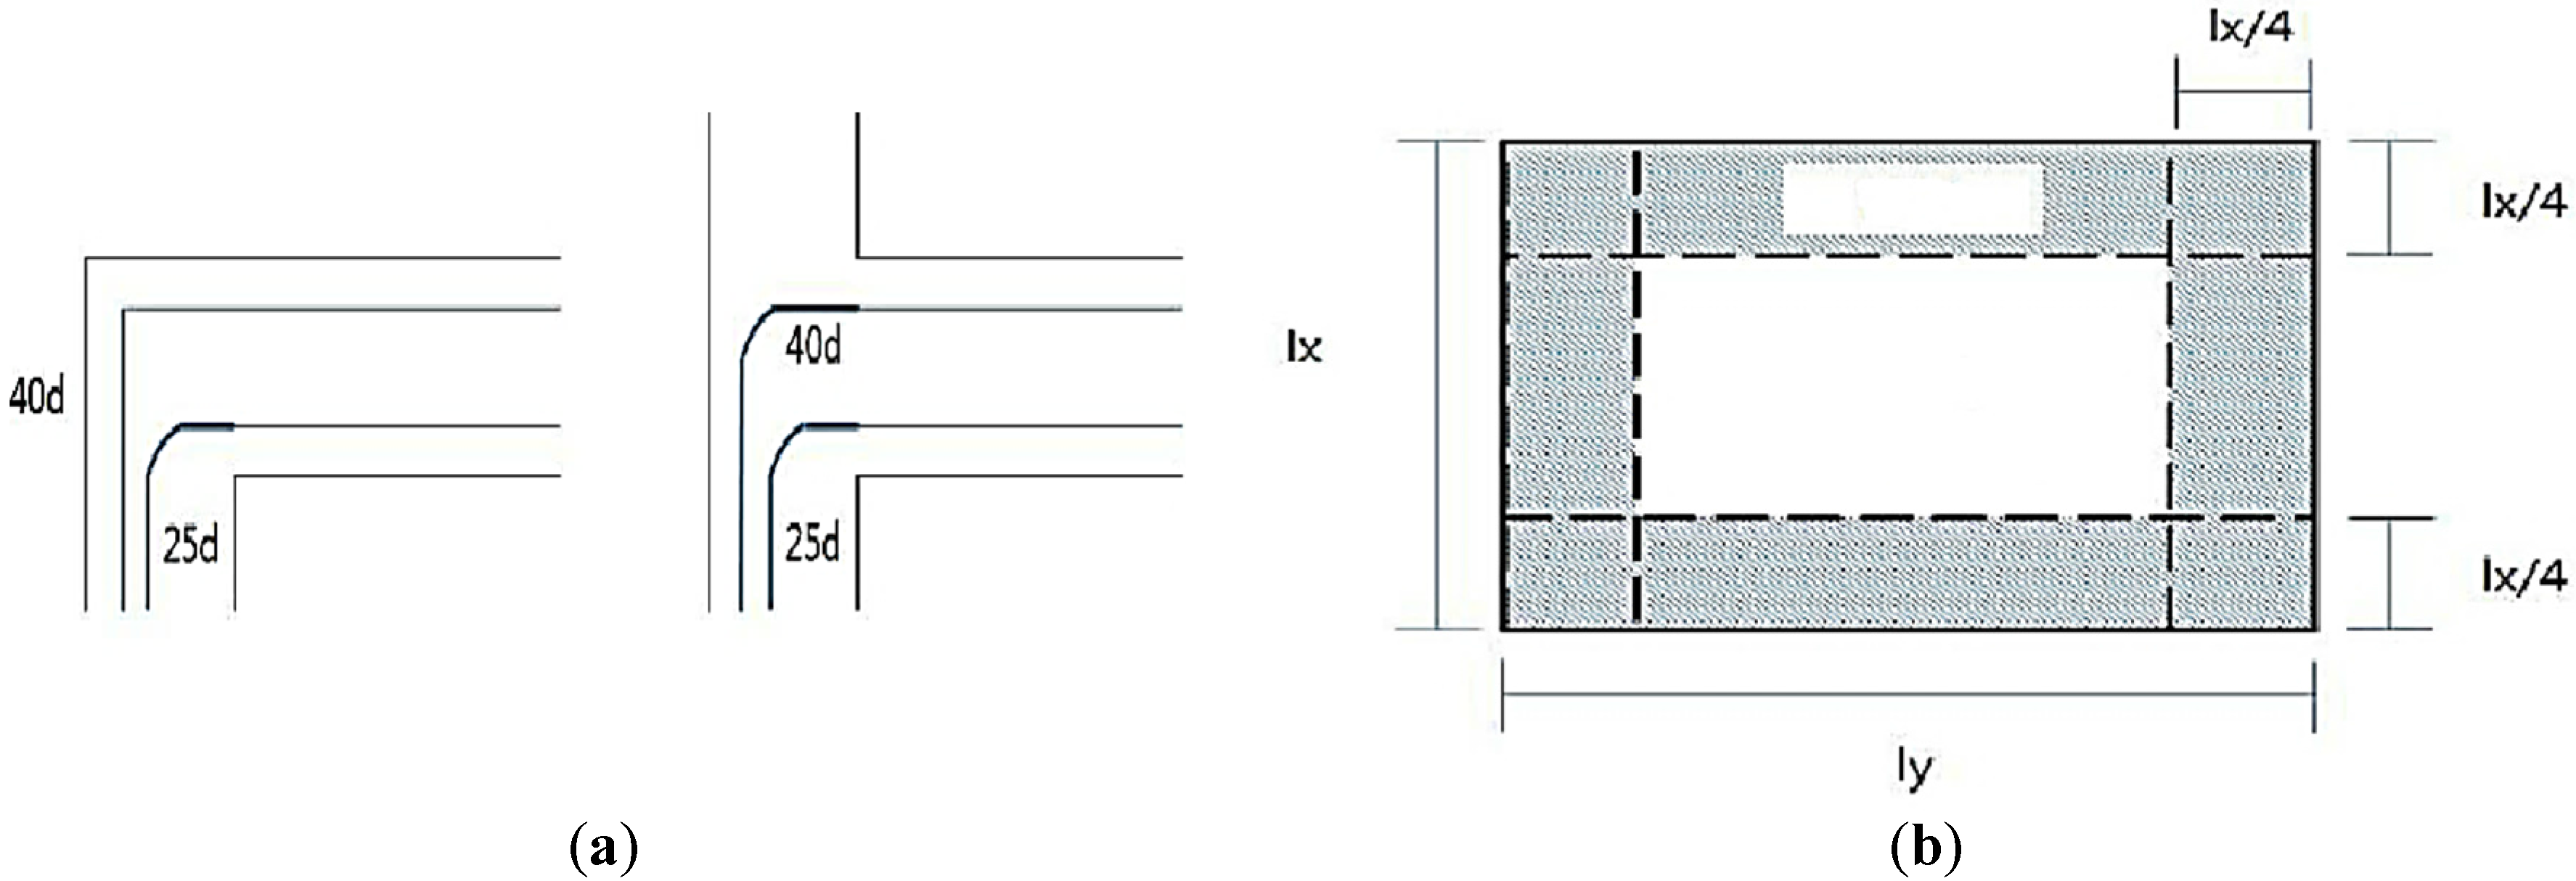
Fourth, for the estimation of the quantity of slab reinforcing bars, they were divided into end and center and classified by type of placement. Then, the length and quantity are estimated. In this case, slab dimensions are estimated with beams and their inside dimensions. Unless beams are available, total dimensions are used.
After figuring out the range of each reinforcing bar’s placement after classifying the reinforcing bars by short and long sides up to one-fourth of inside length (lx) in a short-side direction, the quantity is estimated. Furthermore, upper and lower reinforcing bars are classified in short- and long-side directions. In this case, the upper bars are divided into bent-up and top bars as shown in Table 10.
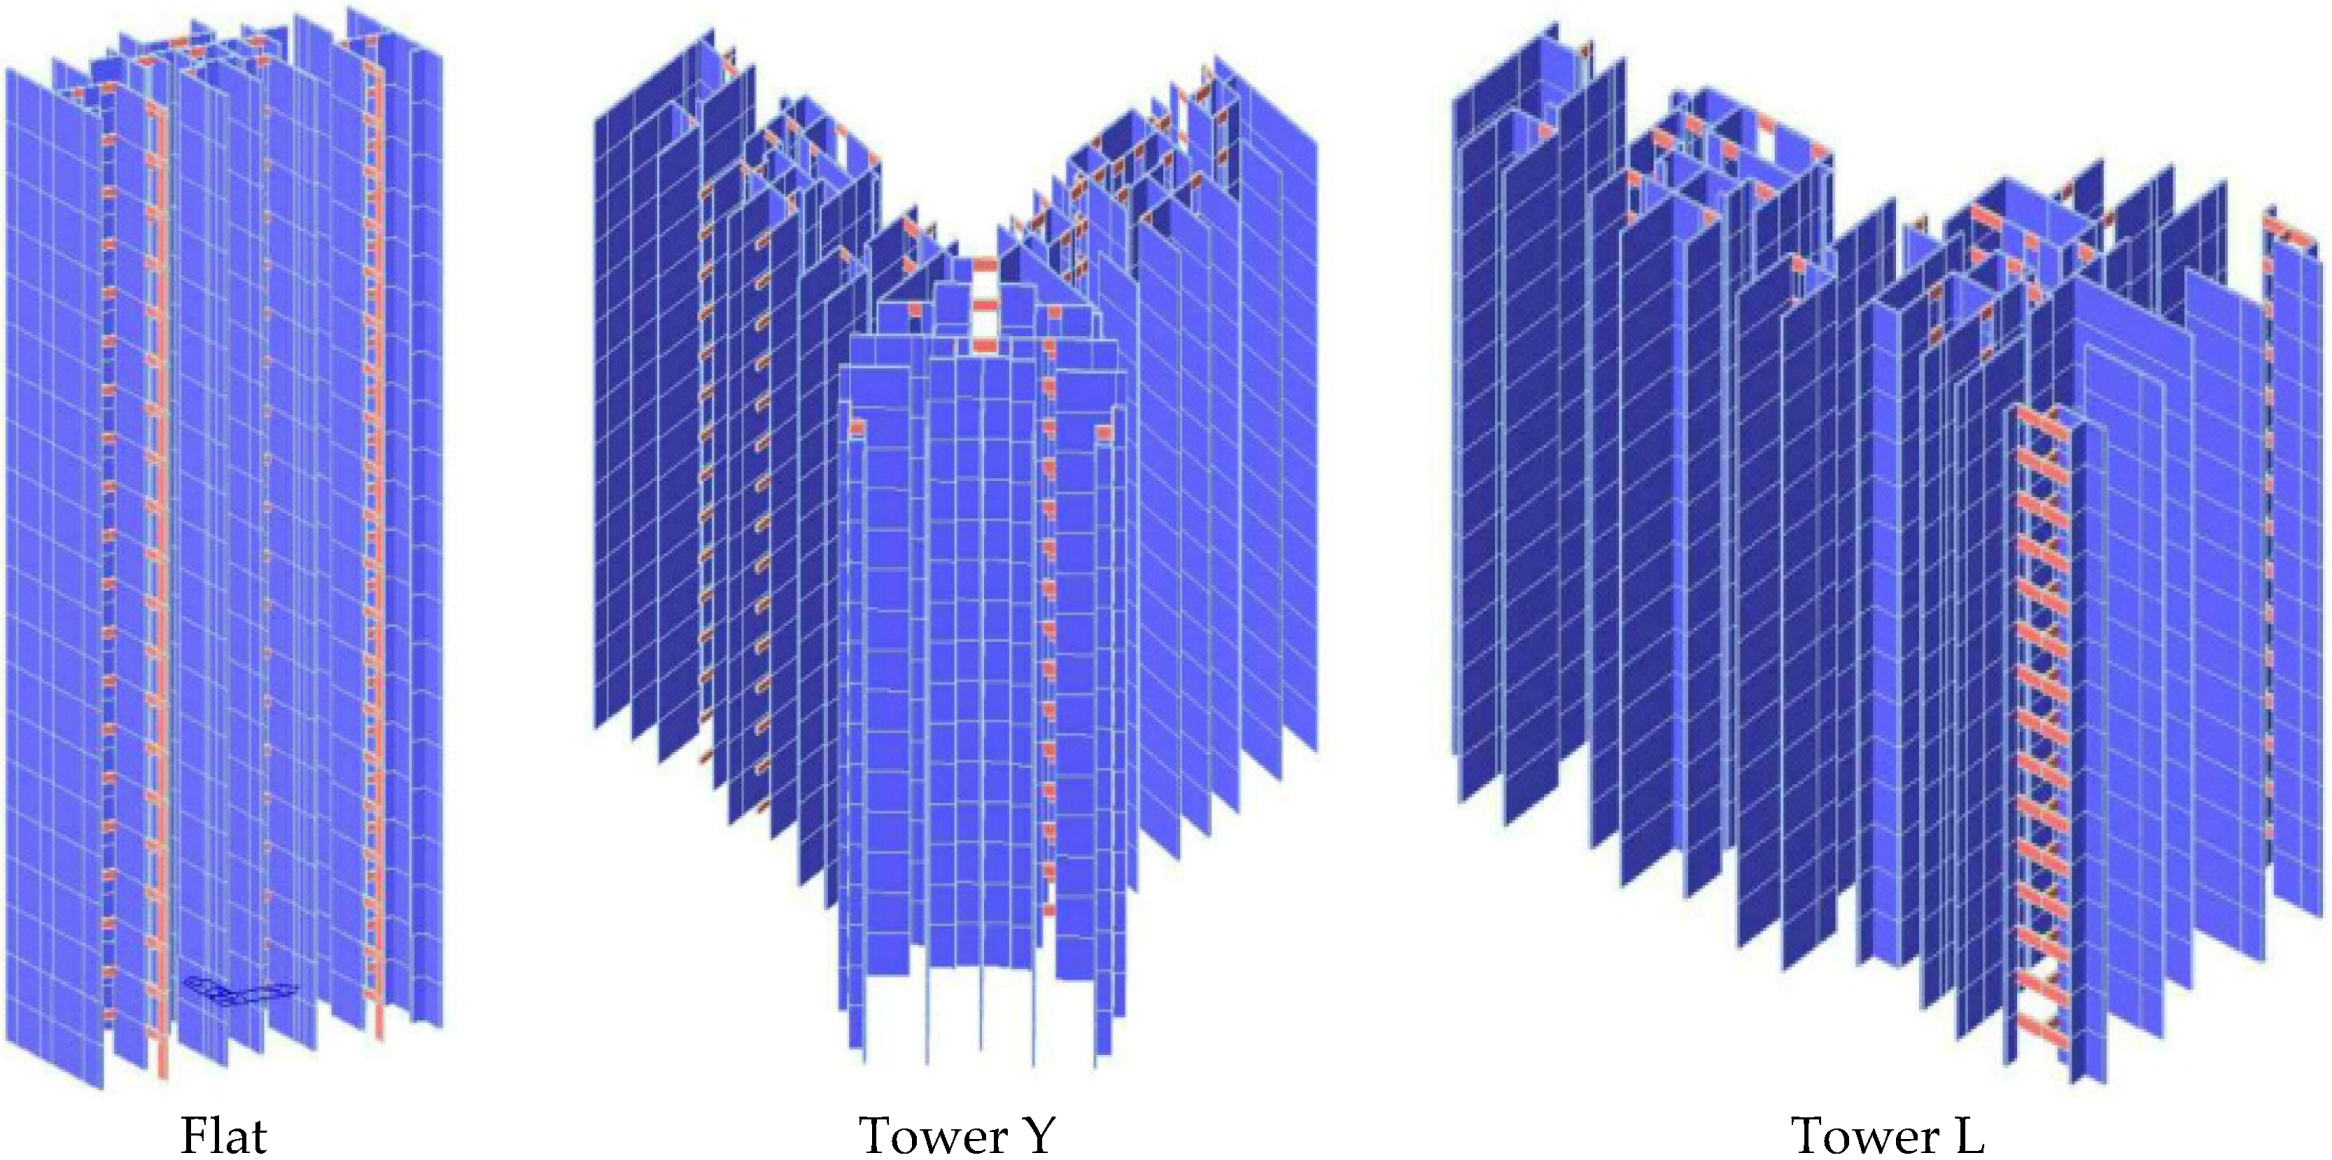
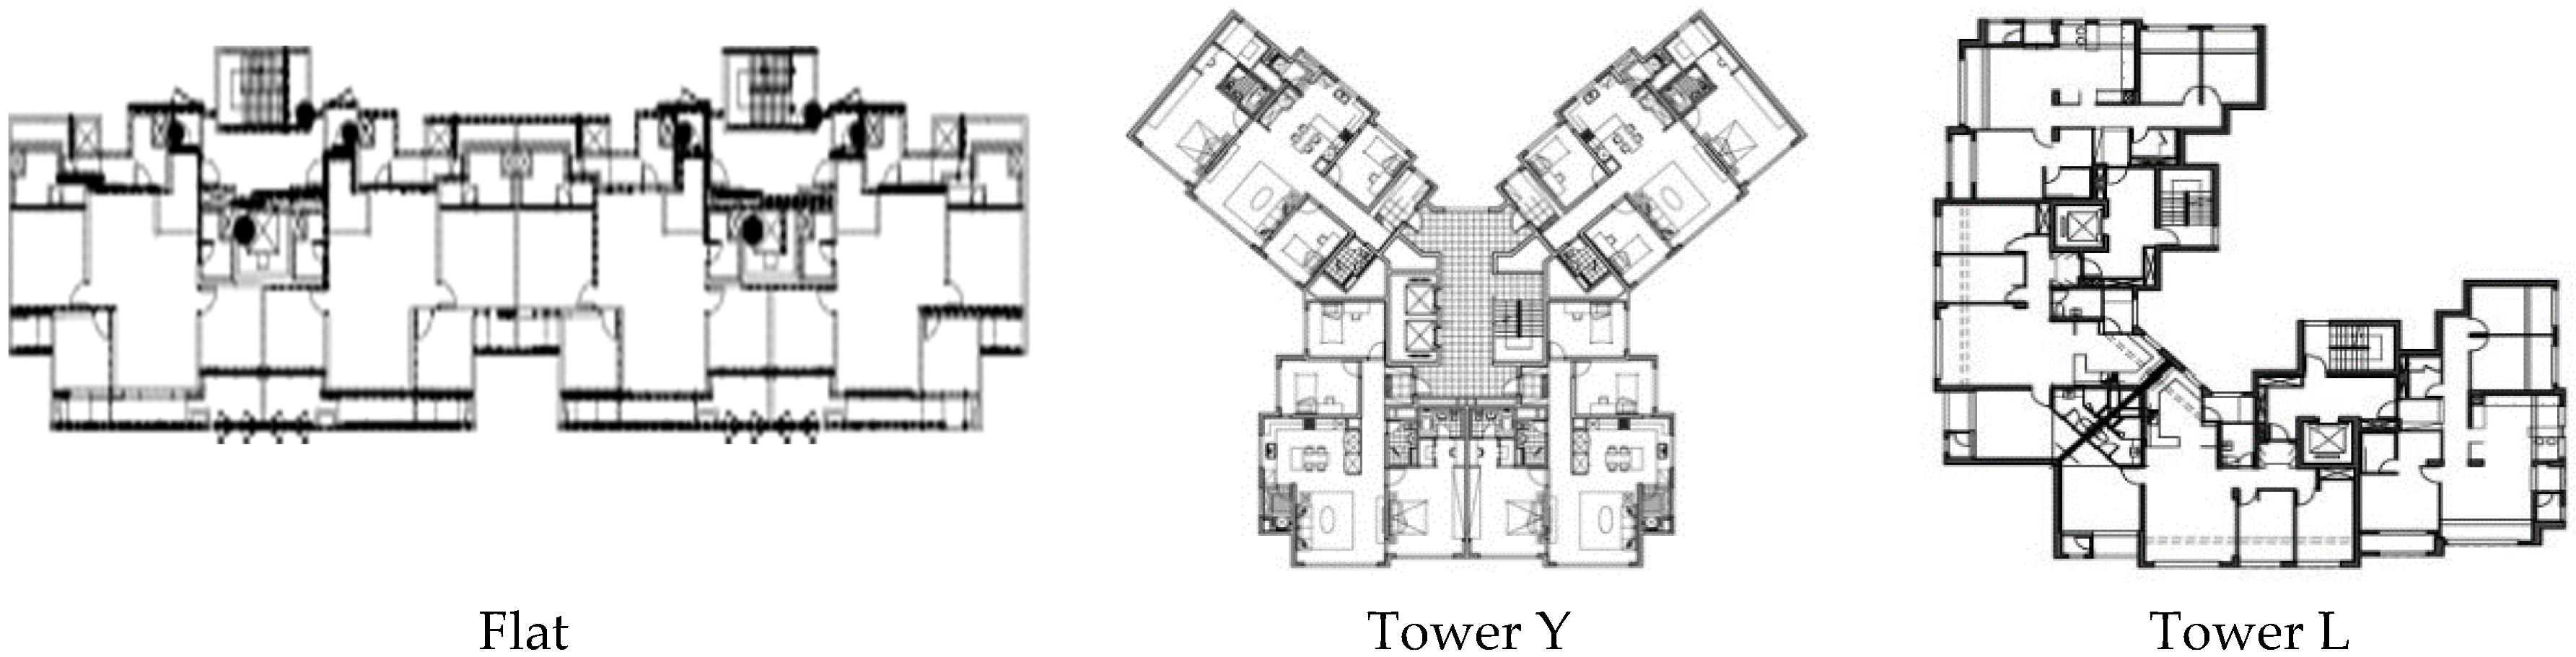
To evaluate the results of the quantity estimation performed by building type, they were modeled with a structural analysis programs in Korea called MIDAS [23]. For this, there was structural analysis on the load combination set by Korea Building Code-Structural (KBCS), using architectural and structural drawings by building type. Additionally, for the reinforcement placement, MIDAS-GEN’s automatic reinforcement placement was used. Figure 4 reveals the results of each plane type’s modeling.
The concrete, form and reinforcing bar quantities obtained through a 2D drawing-based manual quantity estimation method and a program-based automatic quantity estimation method were almost same.
In the drawing-based quantity estimation, however, the parts that overlapped in the factor design dimensions are subtracted. In a program-based automatic quantity estimation method, in contrast, the quantity is estimated based on the factor information which has been modeled under design dimensions. Therefore, factor-overlapped parts are not subtracted. In this case, there is no subtraction of vertical length in the wall-beam, wall-slab and column-slab combinations. To minimize differences in the results, therefore, there should be modeling which considers the subtraction of the overlapped parts in a height direction equivalent to the manual quantity estimation standards at the time of building modeling.
In case of beams, columns and slabs, a difference was found in hoop bars, diagonal hoop bars, stirrup bars and main bent-up bars. Therefore, an error in the hoop bar and stirrup bar results can be minimized by adding the cover thickness of columns and beams during quantity estimation after building modeling.

4.2. Calculation and Variation Rates of Material Amounts in the Evaluation of Apartment Houses

In the use of concrete, vertical members such as core walls and columns were mostly divided in the vertical direction such as low, middle and high floors. Therefore, compressive strength is applied from high to low levels after zoning.
The classification of low floors is found in diverse forms depending on the building type. In general, however, it is about one-third of the total building floors. In this section, the compressive strength was revealed to be 24 MPa on average in walls and columns (vertical members). In general, concrete with a strength of 35 MPa is used for low floors.
In the case of high floors, the compressive strength of vertical members was 24 MPa on average. For middle floors, 35 MPa concrete is commonly used. In terms of horizontal members, 24 MPa concrete was mostly used for slabs. Recently, however, concrete with a strength of 30 MPa or stronger is used for slabs. Slab concrete appears to get stronger in connection with the vertical members [24]. In this study, therefore, a building was divided into two zones: Low zone (20th floor or lower) and high zone (above 20th floor). Concrete with a strength of 35 MPa was applied to the low zone, while 24 MPa concrete was used for the high zone, which was applied equally according to building type.
The amounts of concrete, reinforcement bars, and forms of a 15-floor flat-type apartment house were established at reference value of 1, and the change rate in the amount of materials was analyzed according to the number of floors and building types.
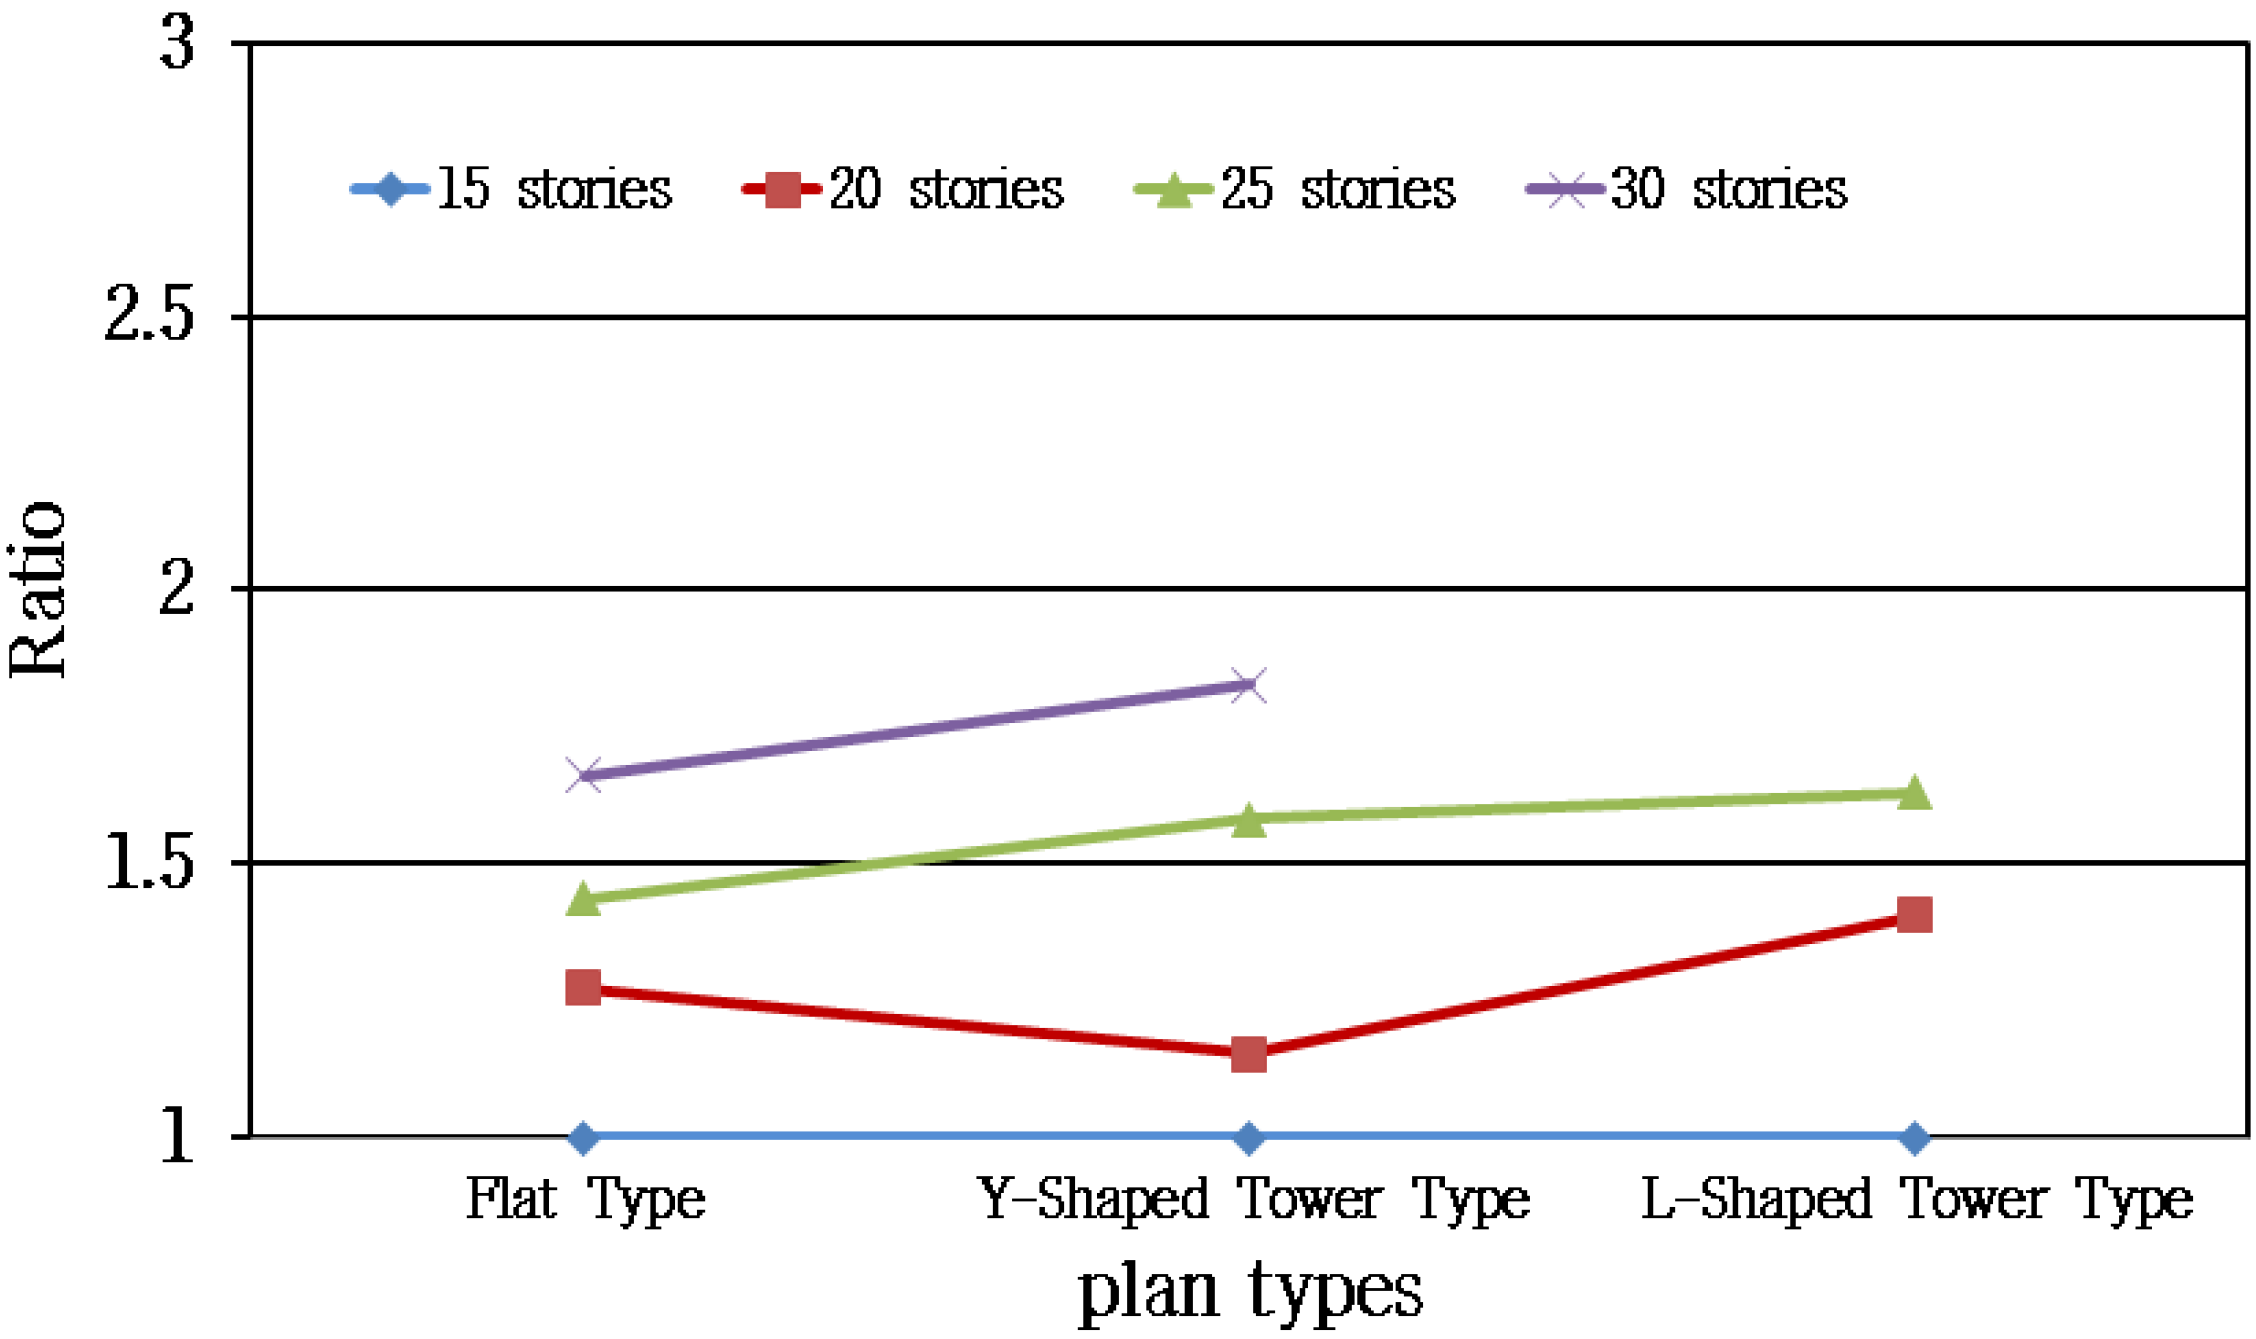
Table 11 lists the calculated amount and variation rate of concrete according to the number of floors for each type, and Figure 5 and Figure 6 show the variation rate of the amount of concrete according to the number of floors and type of apartment house [25,26].
The rate of change in the calculated amount of concrete according to the number of floors was the most abrupt between the 20th and 25th floors at 0.48, which increased according to the number of floors.
For the tower Y type, the rate of increase was nearly constant at 0.3 for 20-floor or higher apartments.
For the tower L type, the most abrupt rate of change occurred in the lower floors between the 15th and 20th floors, at 0.51, but decreased to 0.11 in the higher floors at the 20th floor or above [27,28].
The comparison of the rate of change in the amount of concrete showed that the tower L type had the largest rate of change at the 20th floor, whereas the flat type had the largest rate of increase between the 25th and 30th floors.
Therefore, in terms of CO2 emissions and cost, flat-type apartments are superior at floors lower than the 20th, whereas tower L-type apartments are superior at floors higher than the 20th.
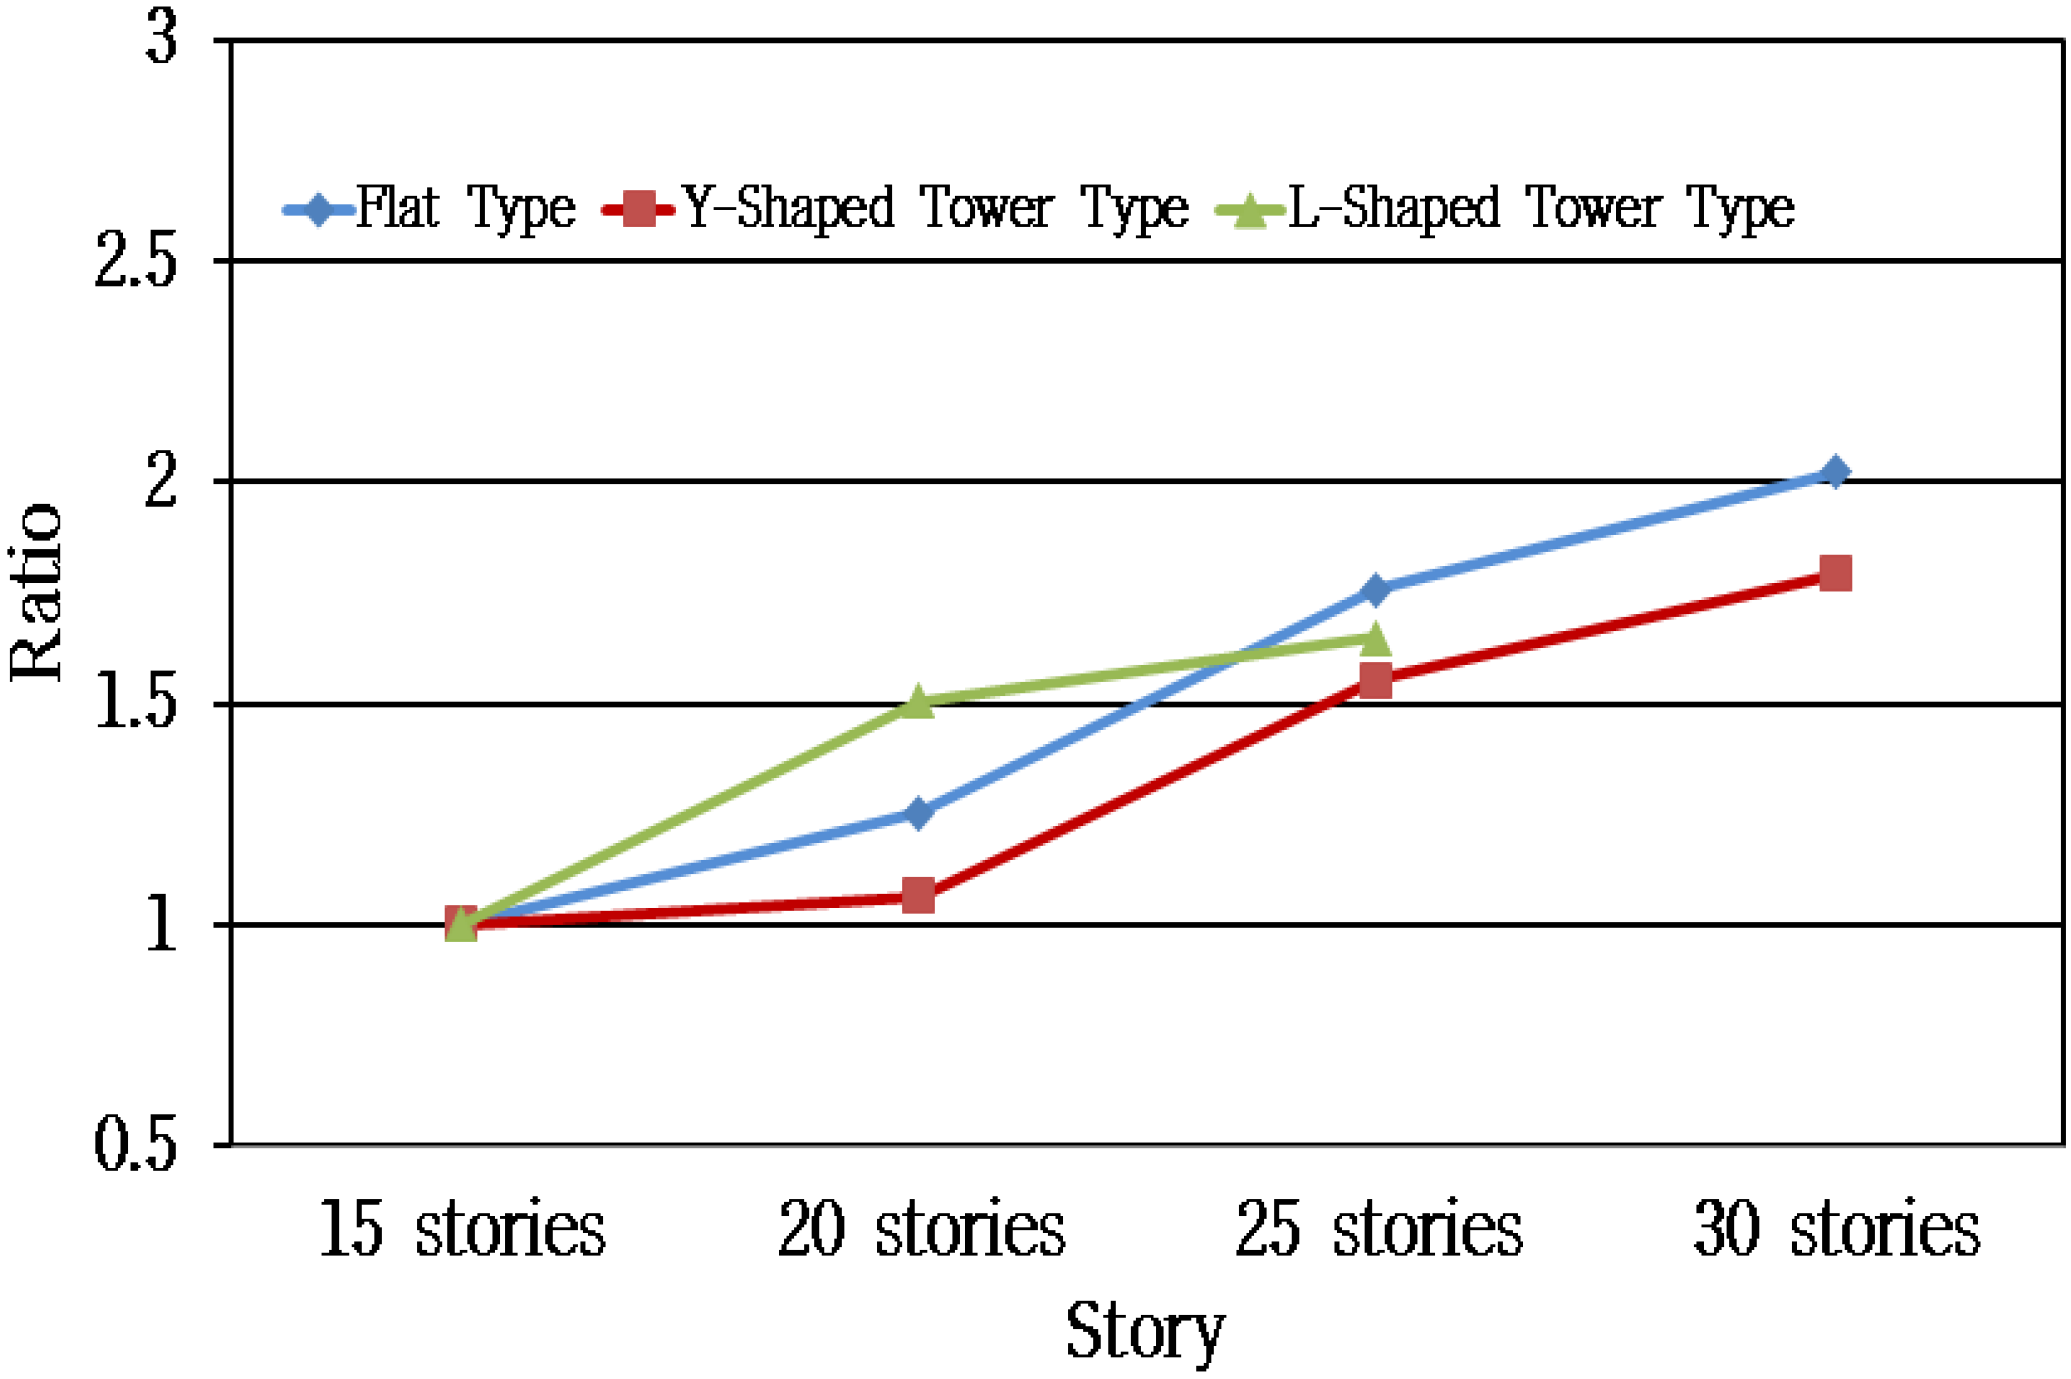
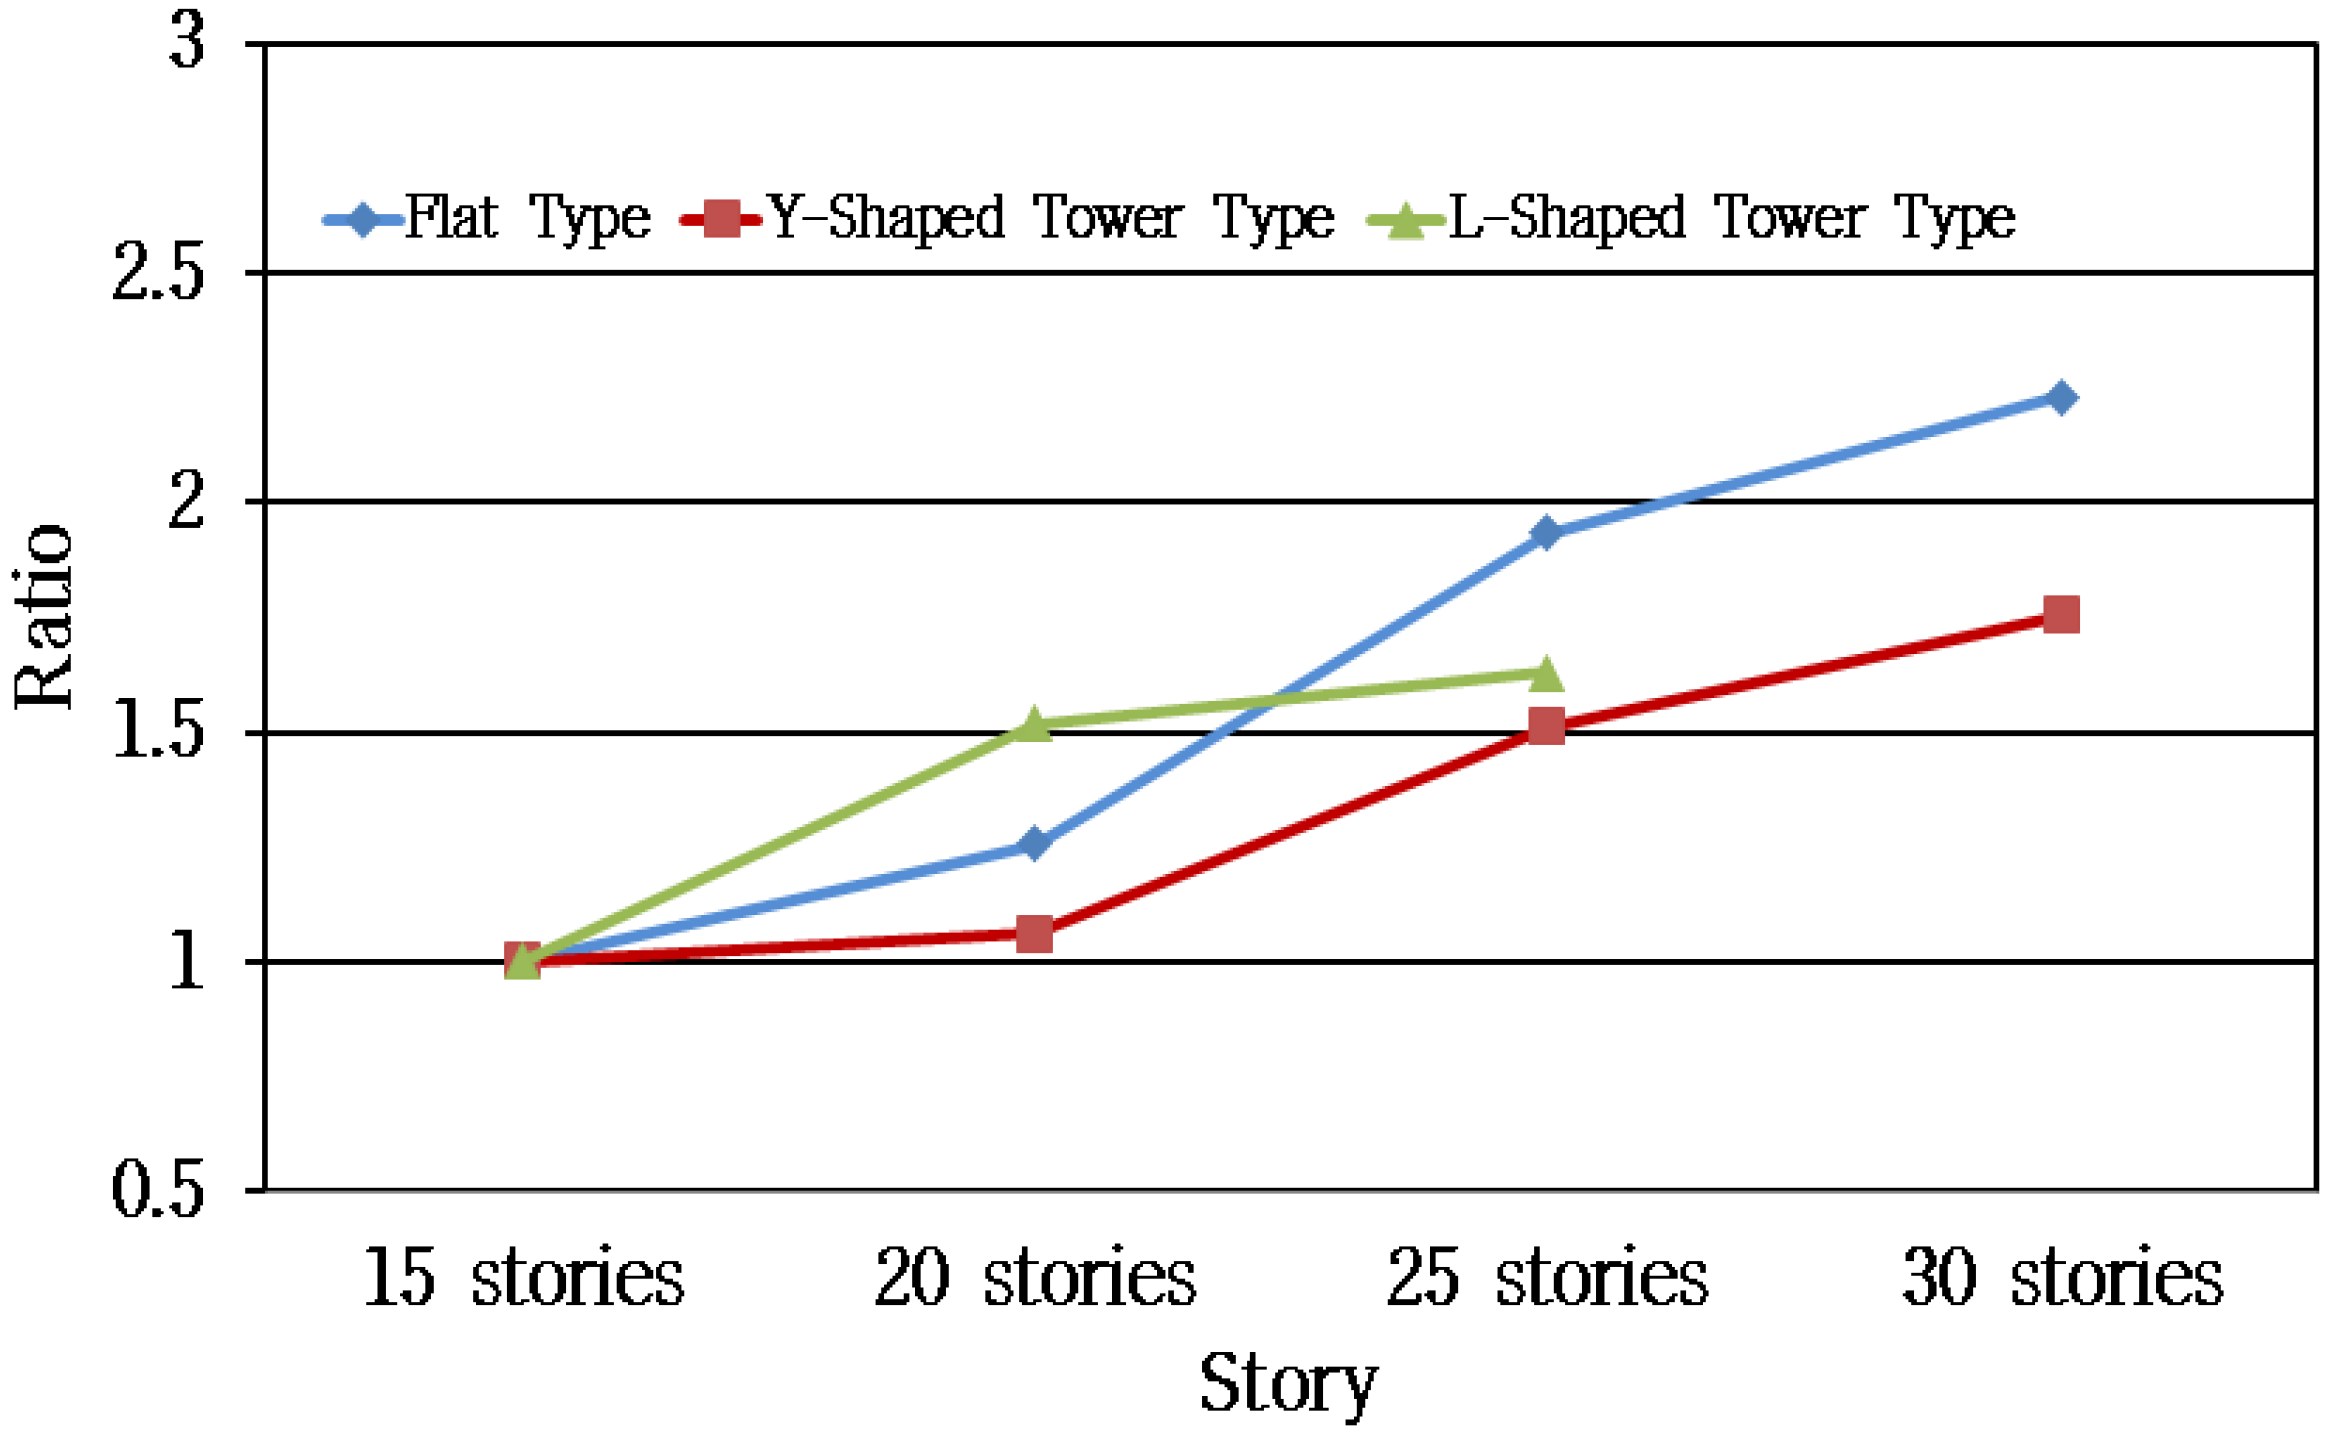
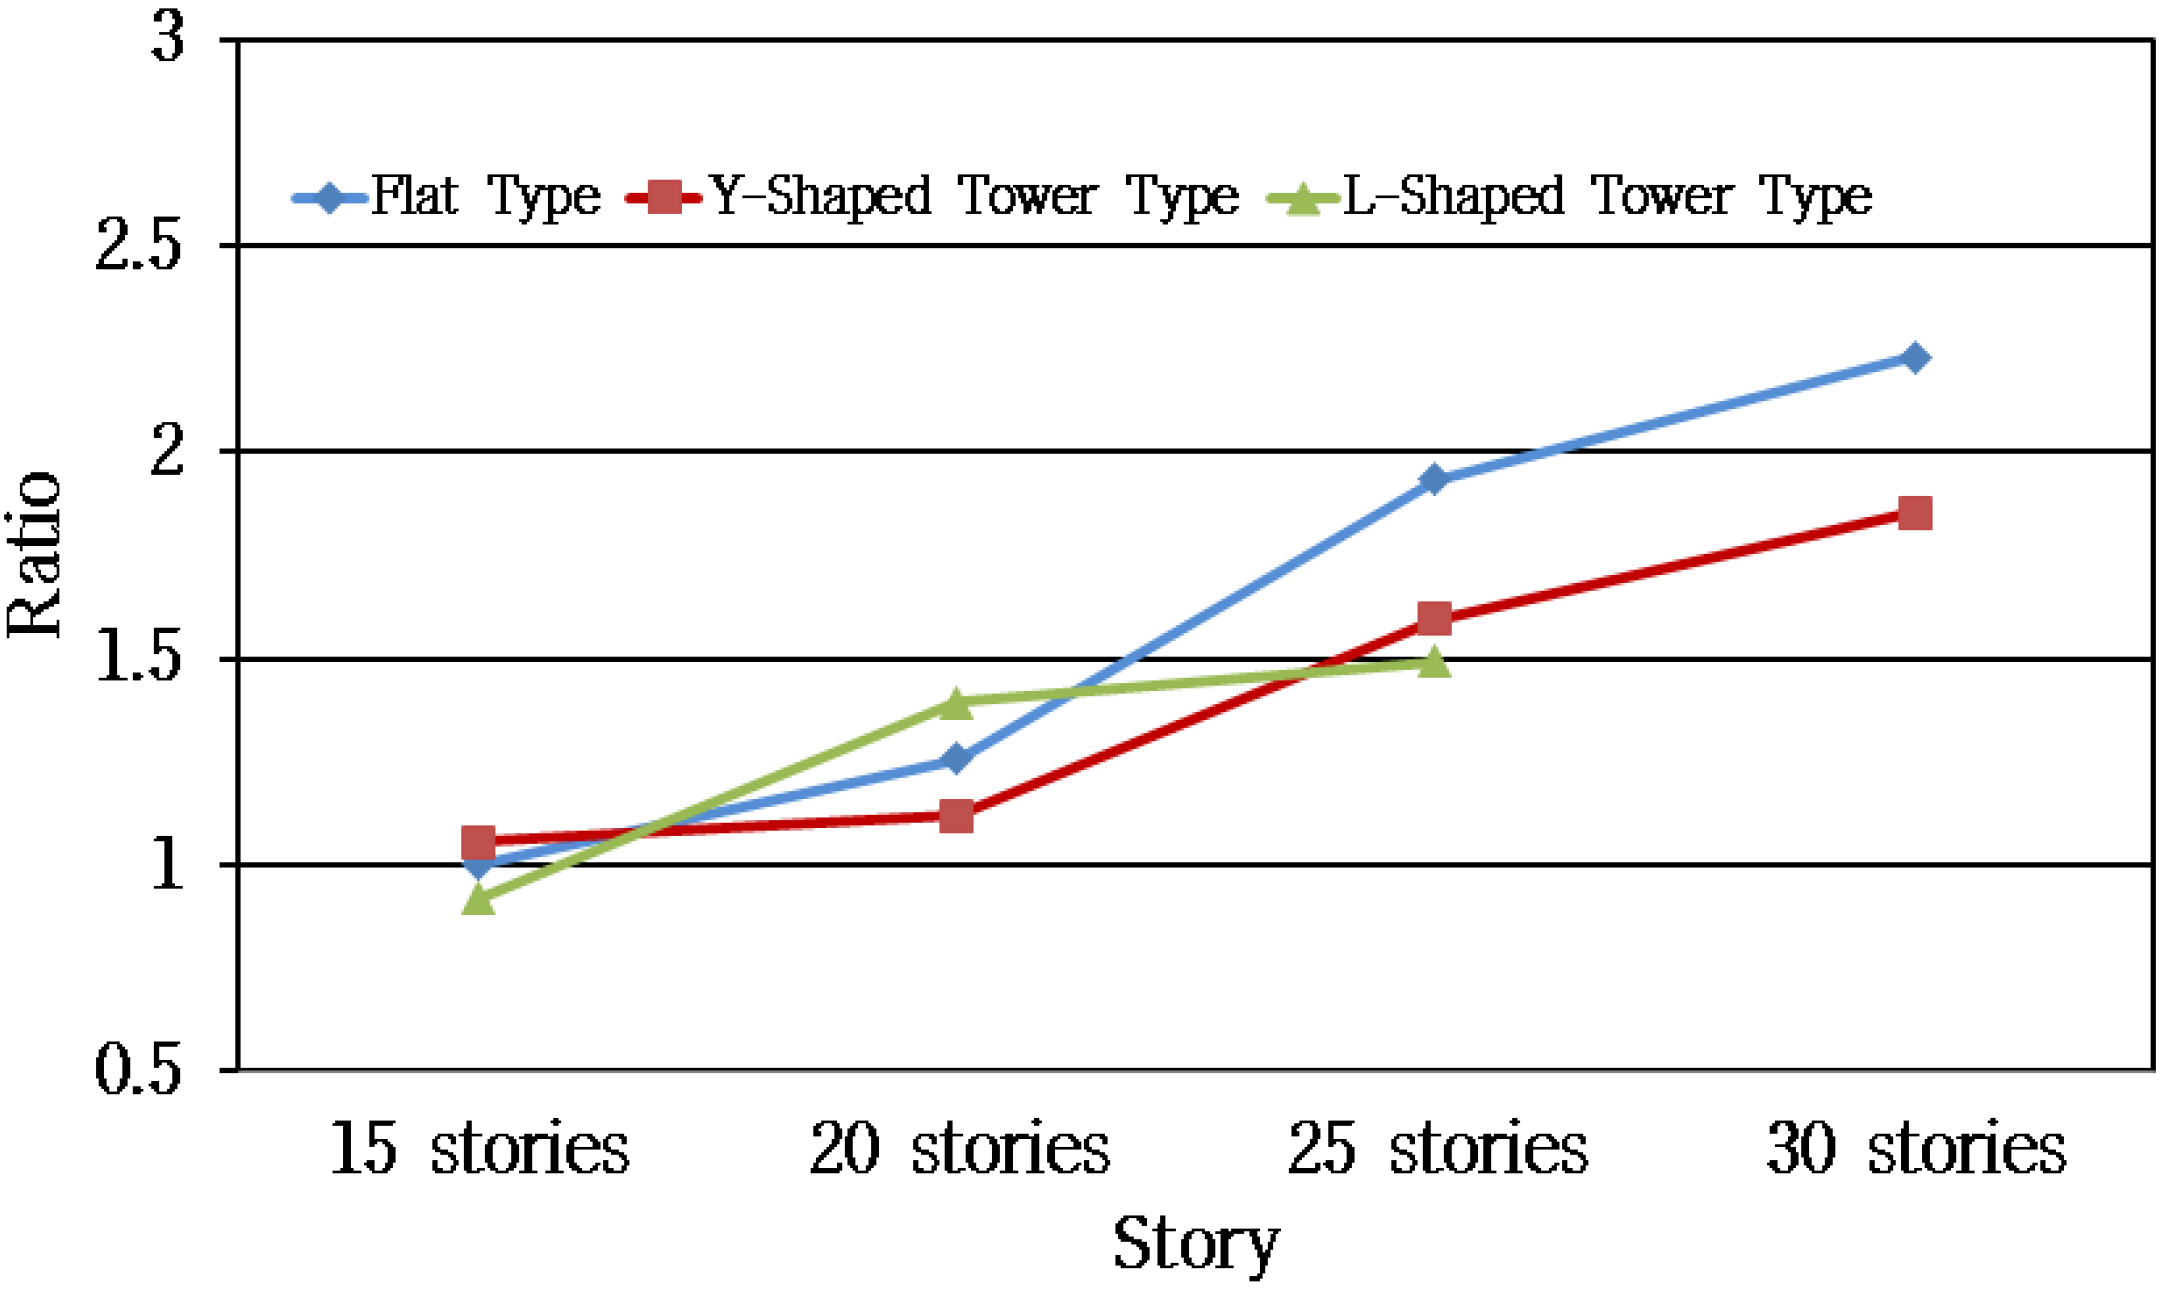
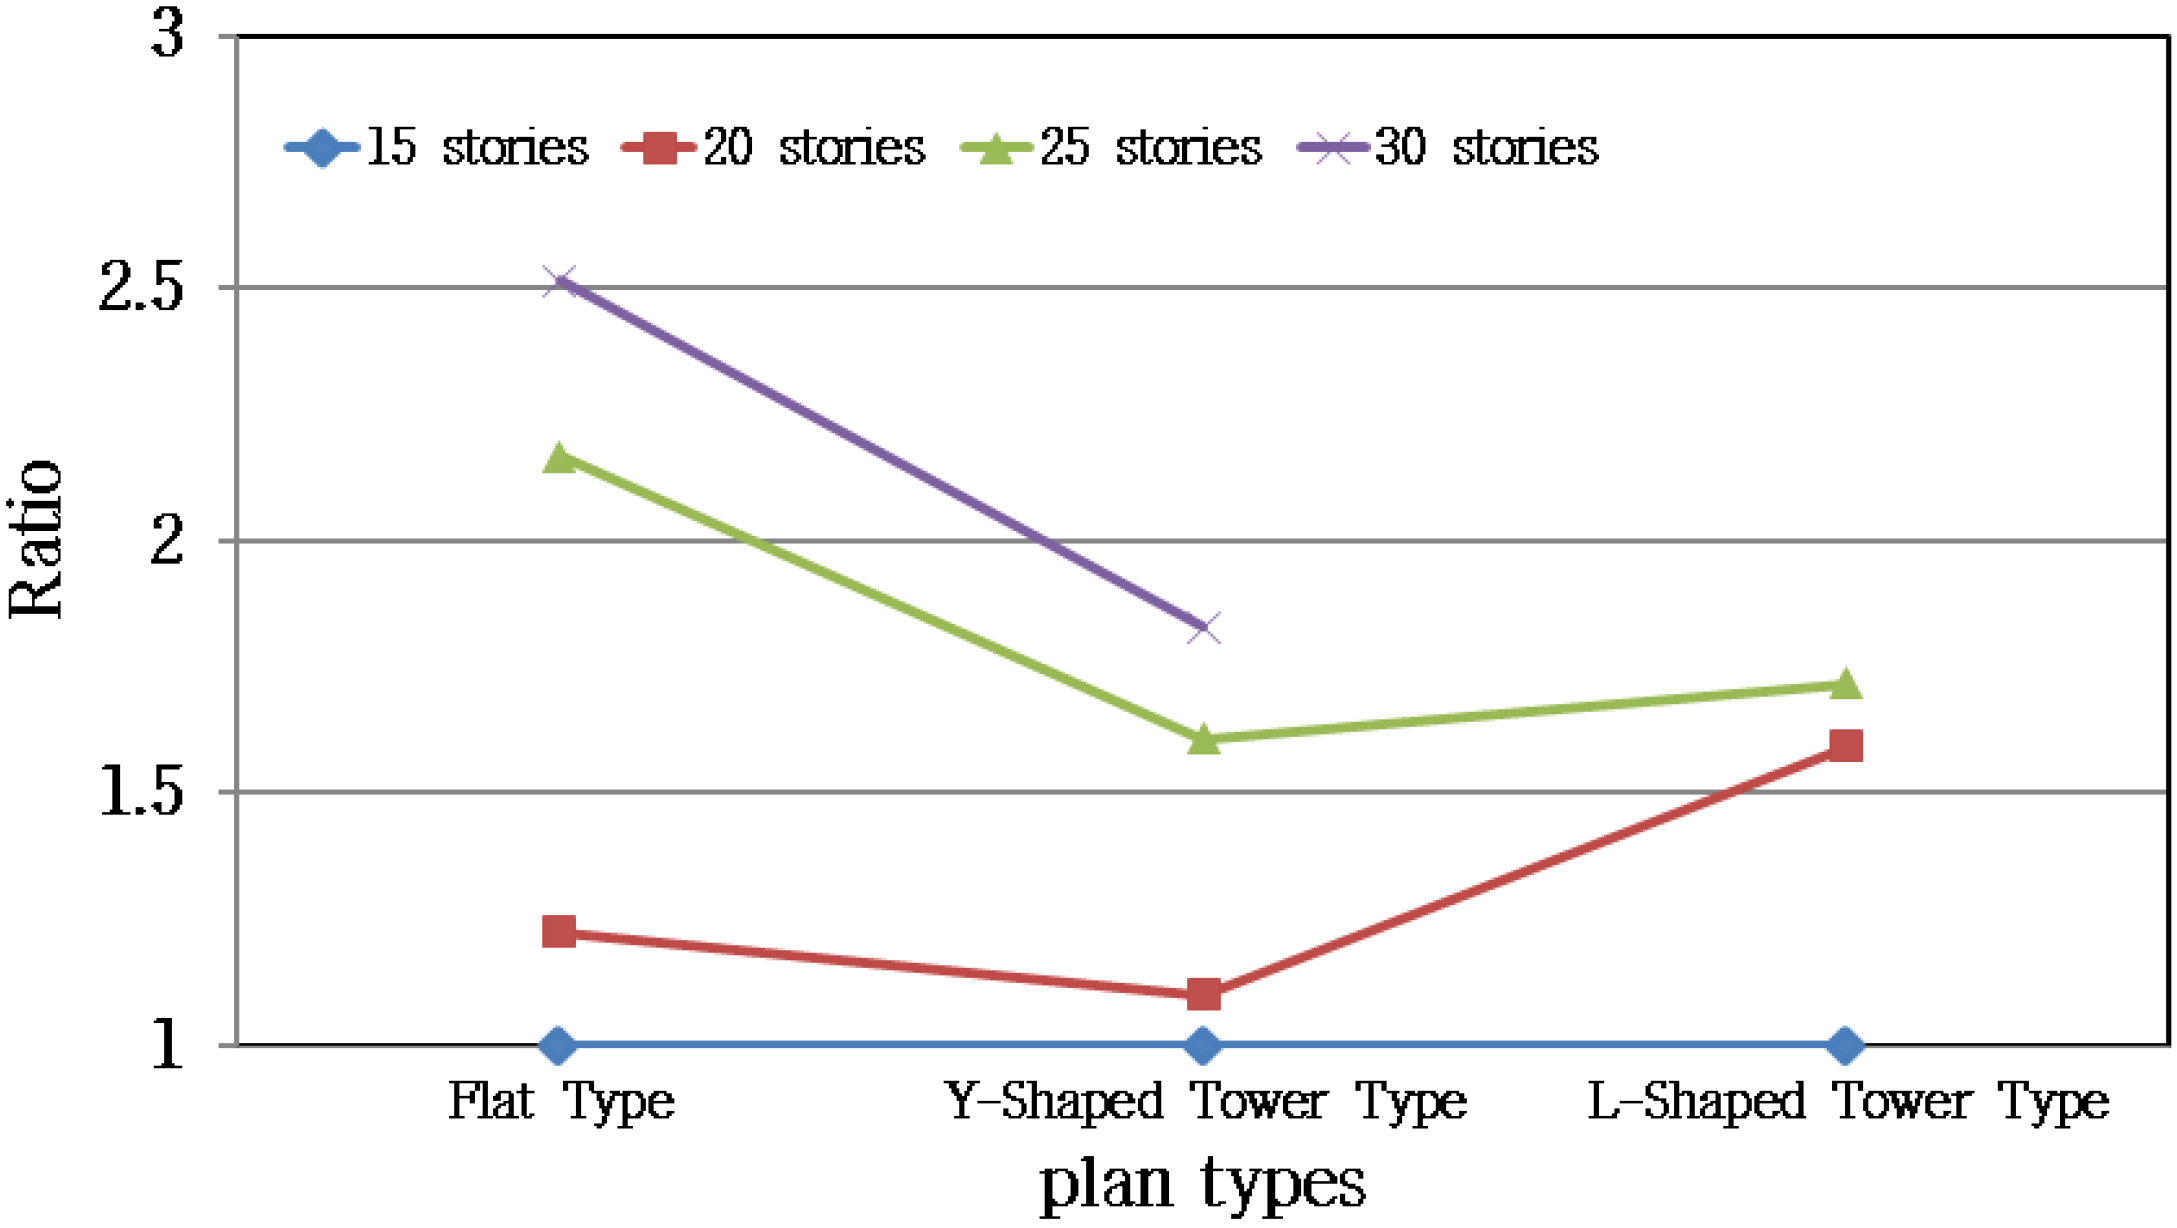
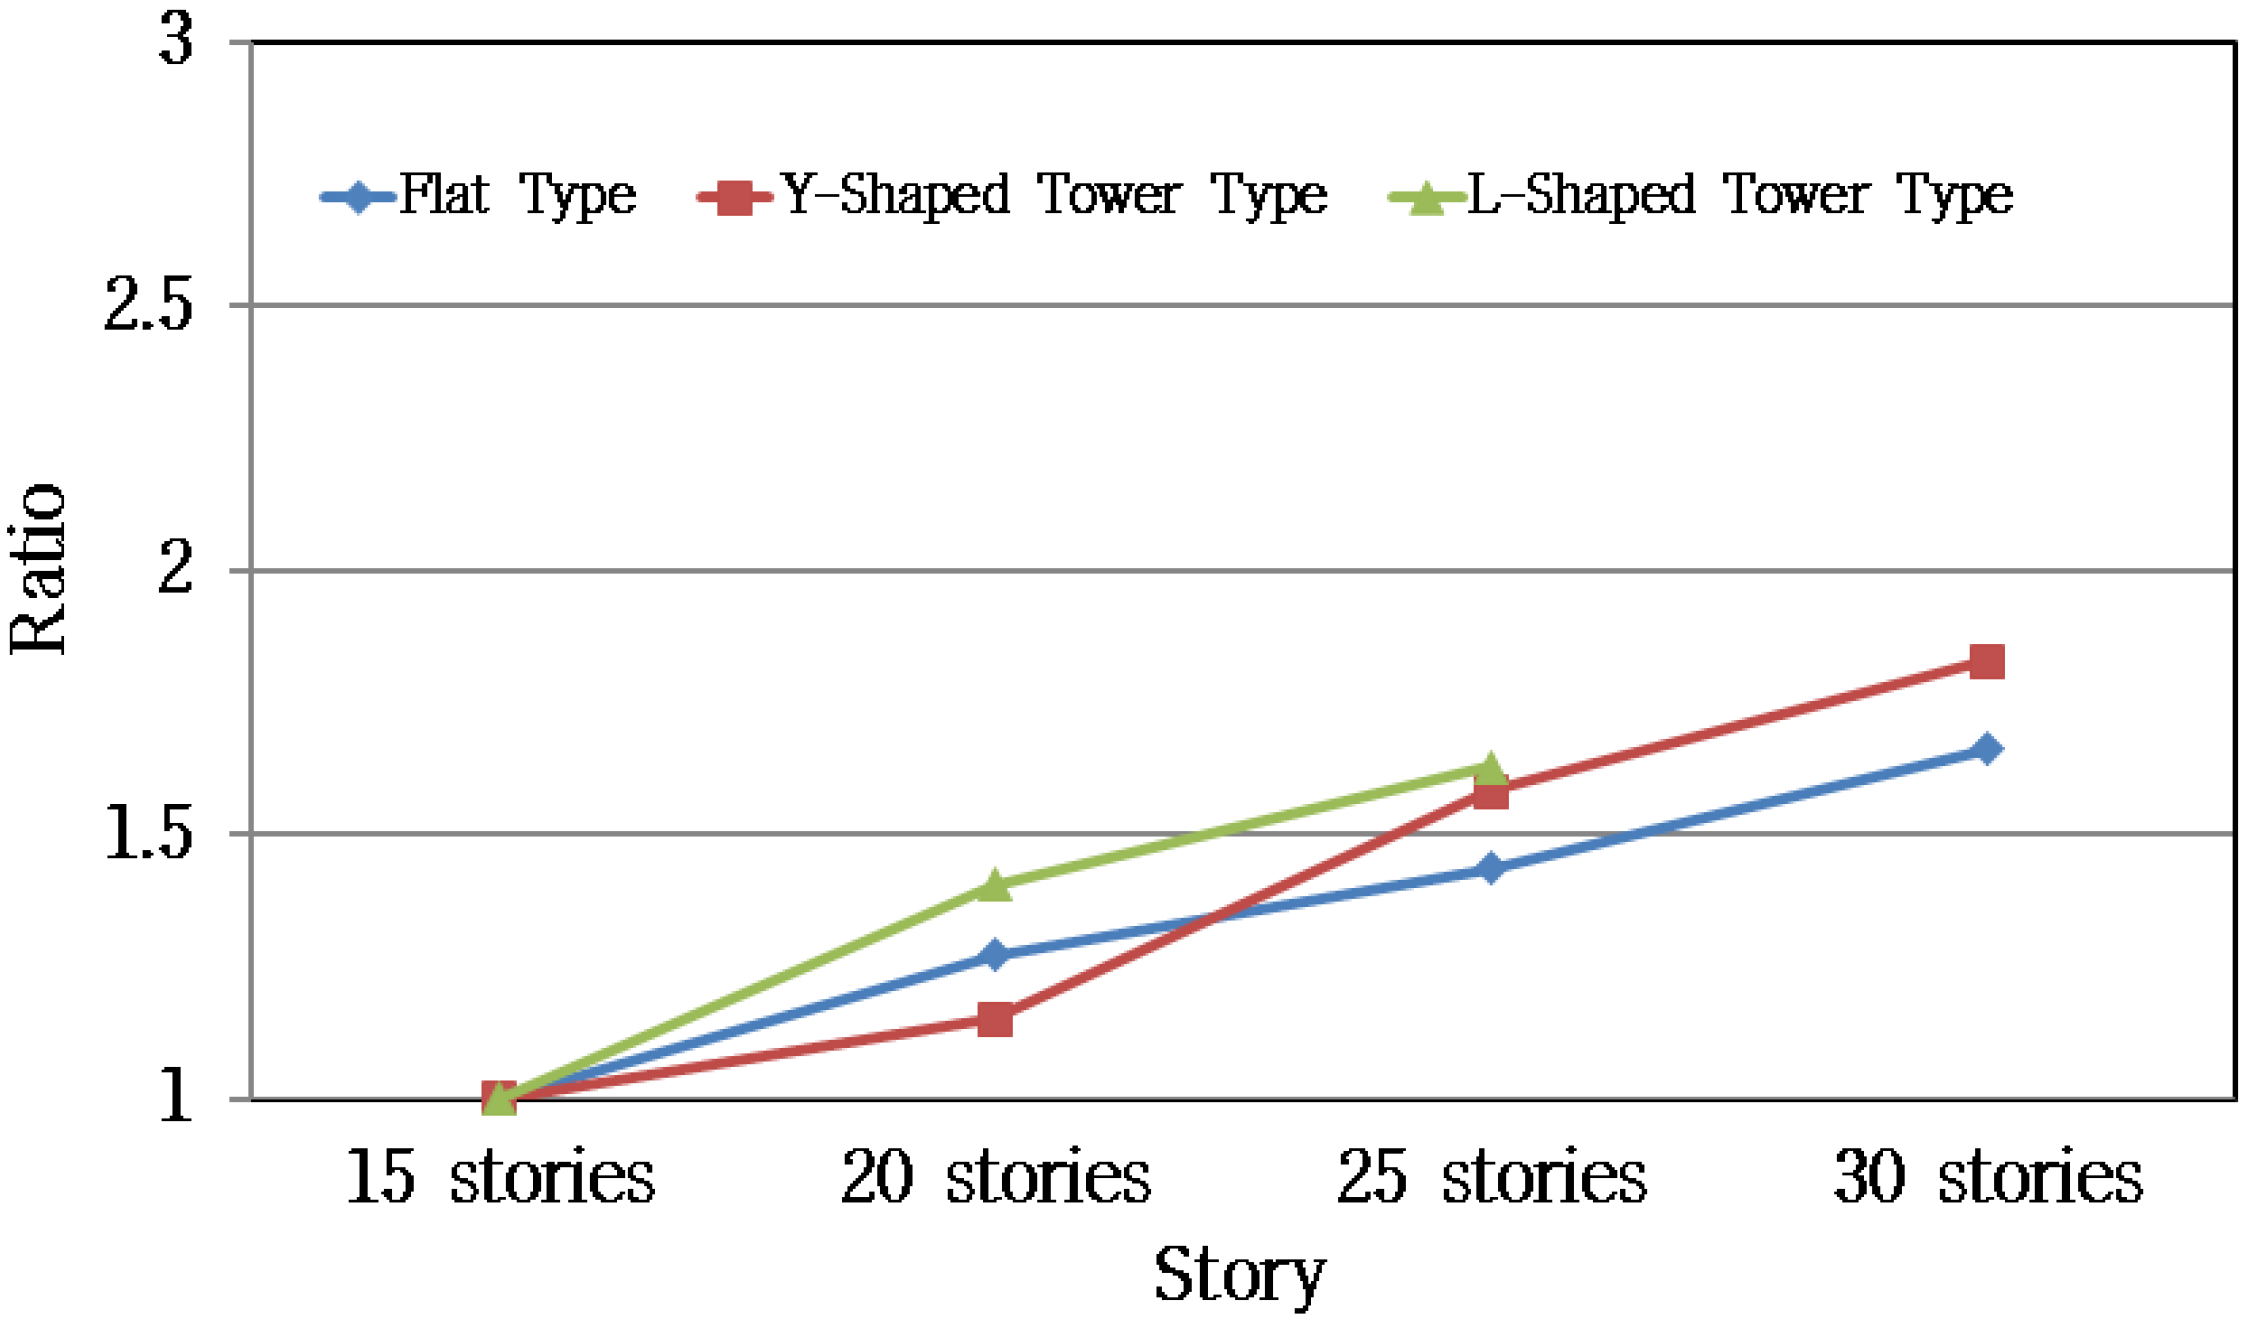
Table 12 lists the results of the calculated amounts and their rates of change for reinforcement bars according to the number of floors and type; Figure 7 and Figure 8 show rates of change for the amount of reinforcement bars according to the number of floors and type, respectively [29,30].
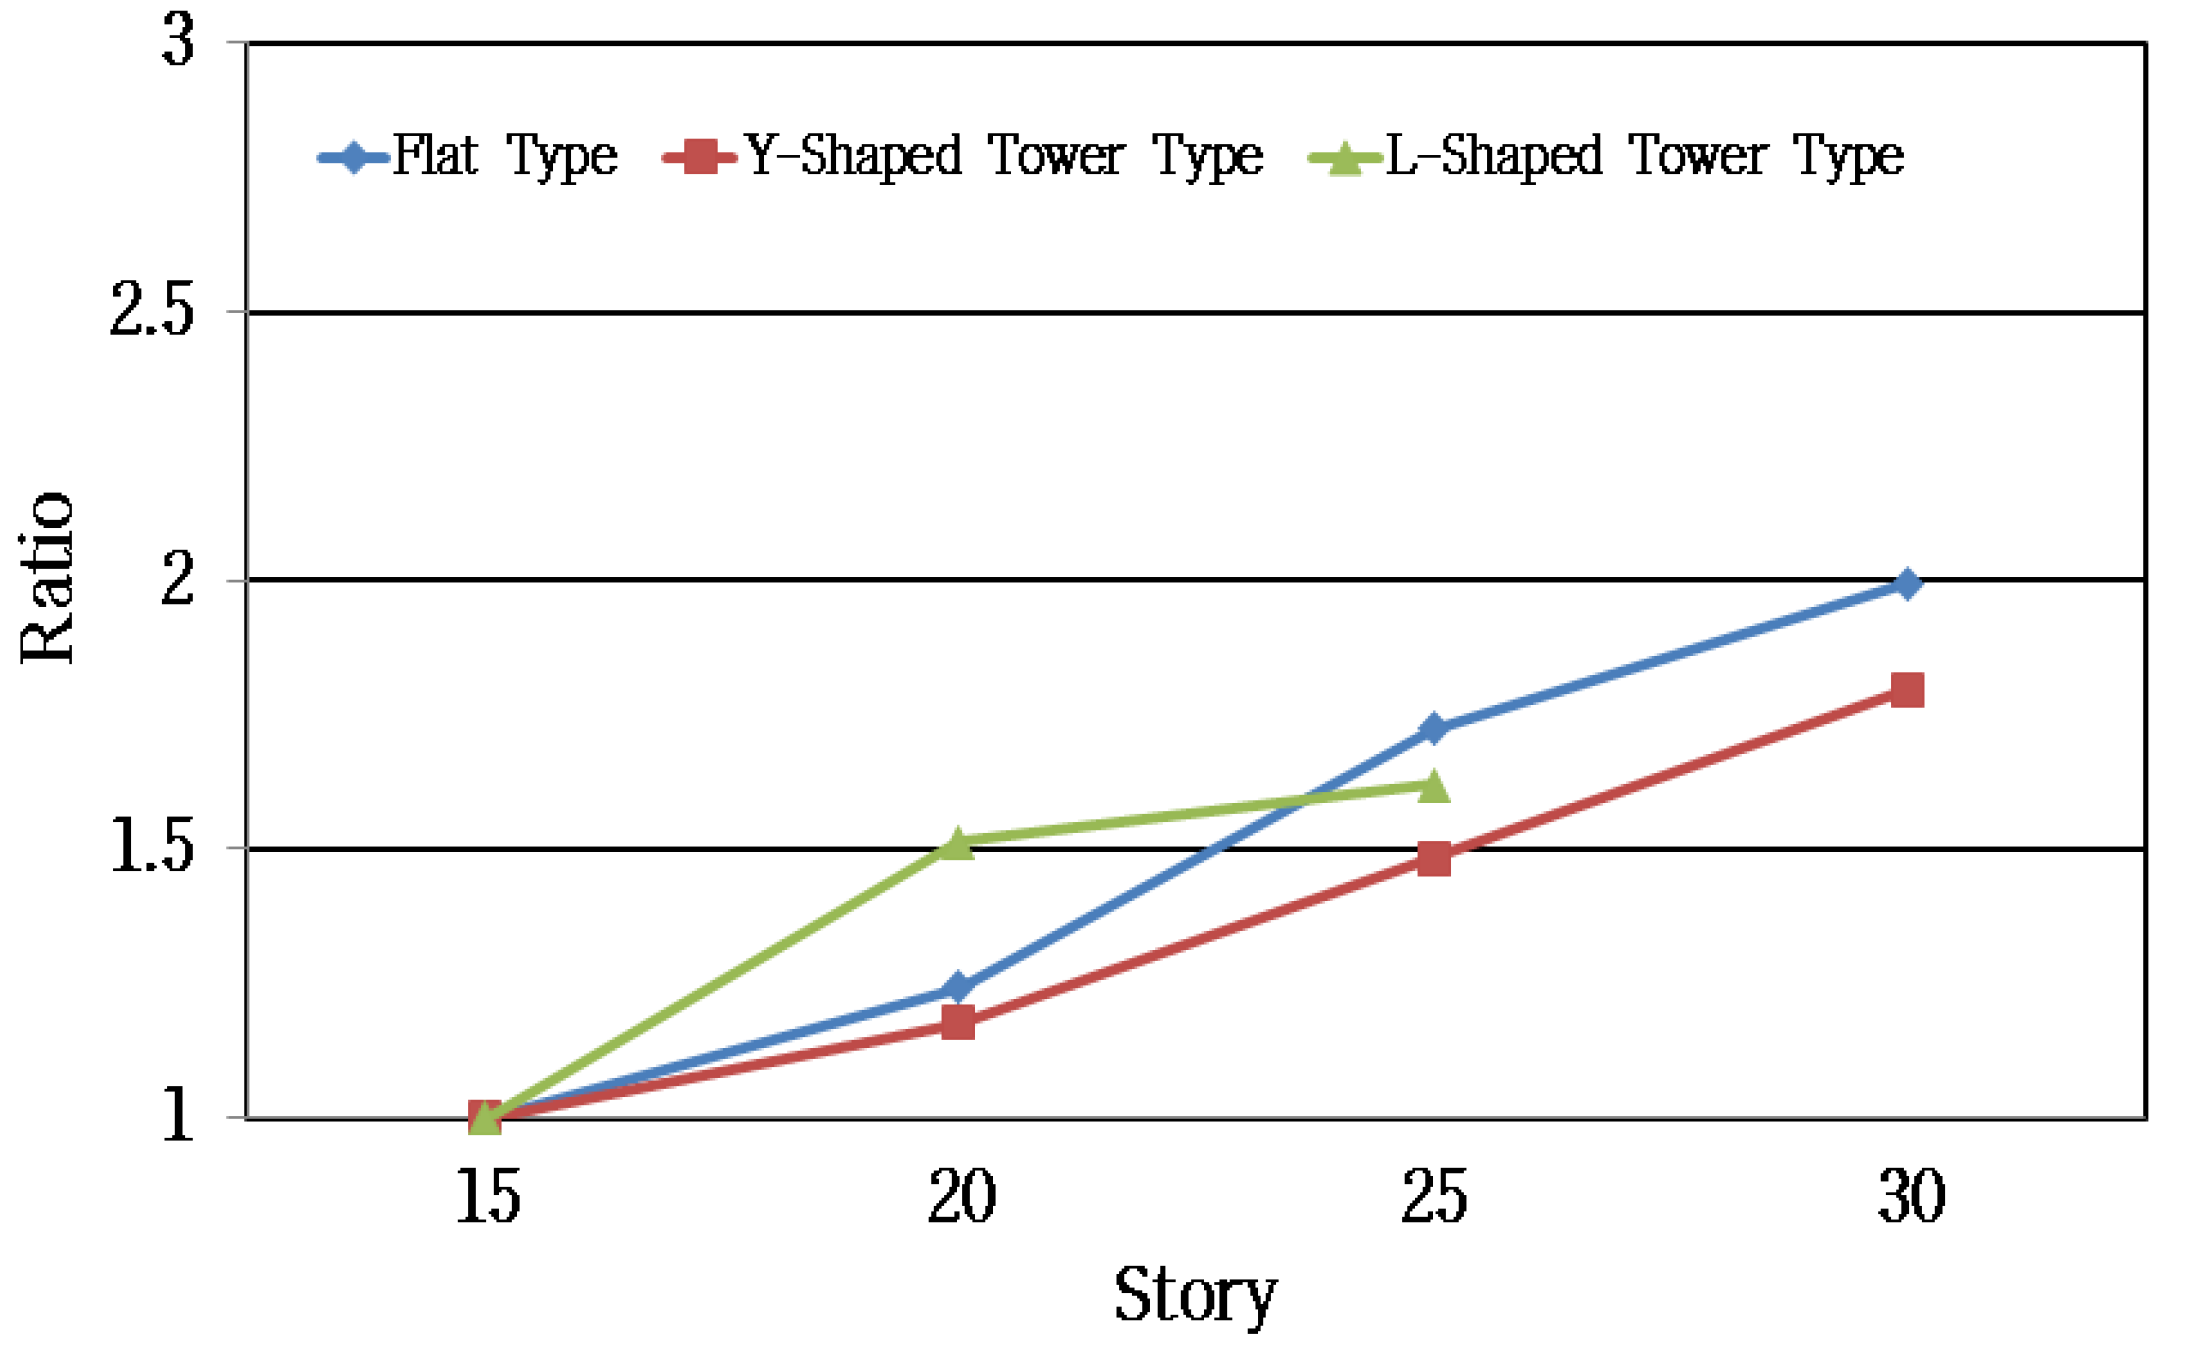
The rate of change in the calculated amount of reinforcement bars according to the number of floors was the highest between the 20th and 25th floors at 0.94; as for concrete, this value increased according to the number of floors. The tower Y type showed the largest increase in materials between the 20th and 25th floors, at 0.51.
For the tower L type, the most rapid rate of change occurred between the 15th and 20th floors, at 0.59, but this rate decreased to 0.13 at the 20th floor or above. Therefore, as for reinforced concrete, flat and tower Y types are superior at lower floors, whereas the tower L type is superior at higher floors in terms of CO2 emission and cost [31,32].
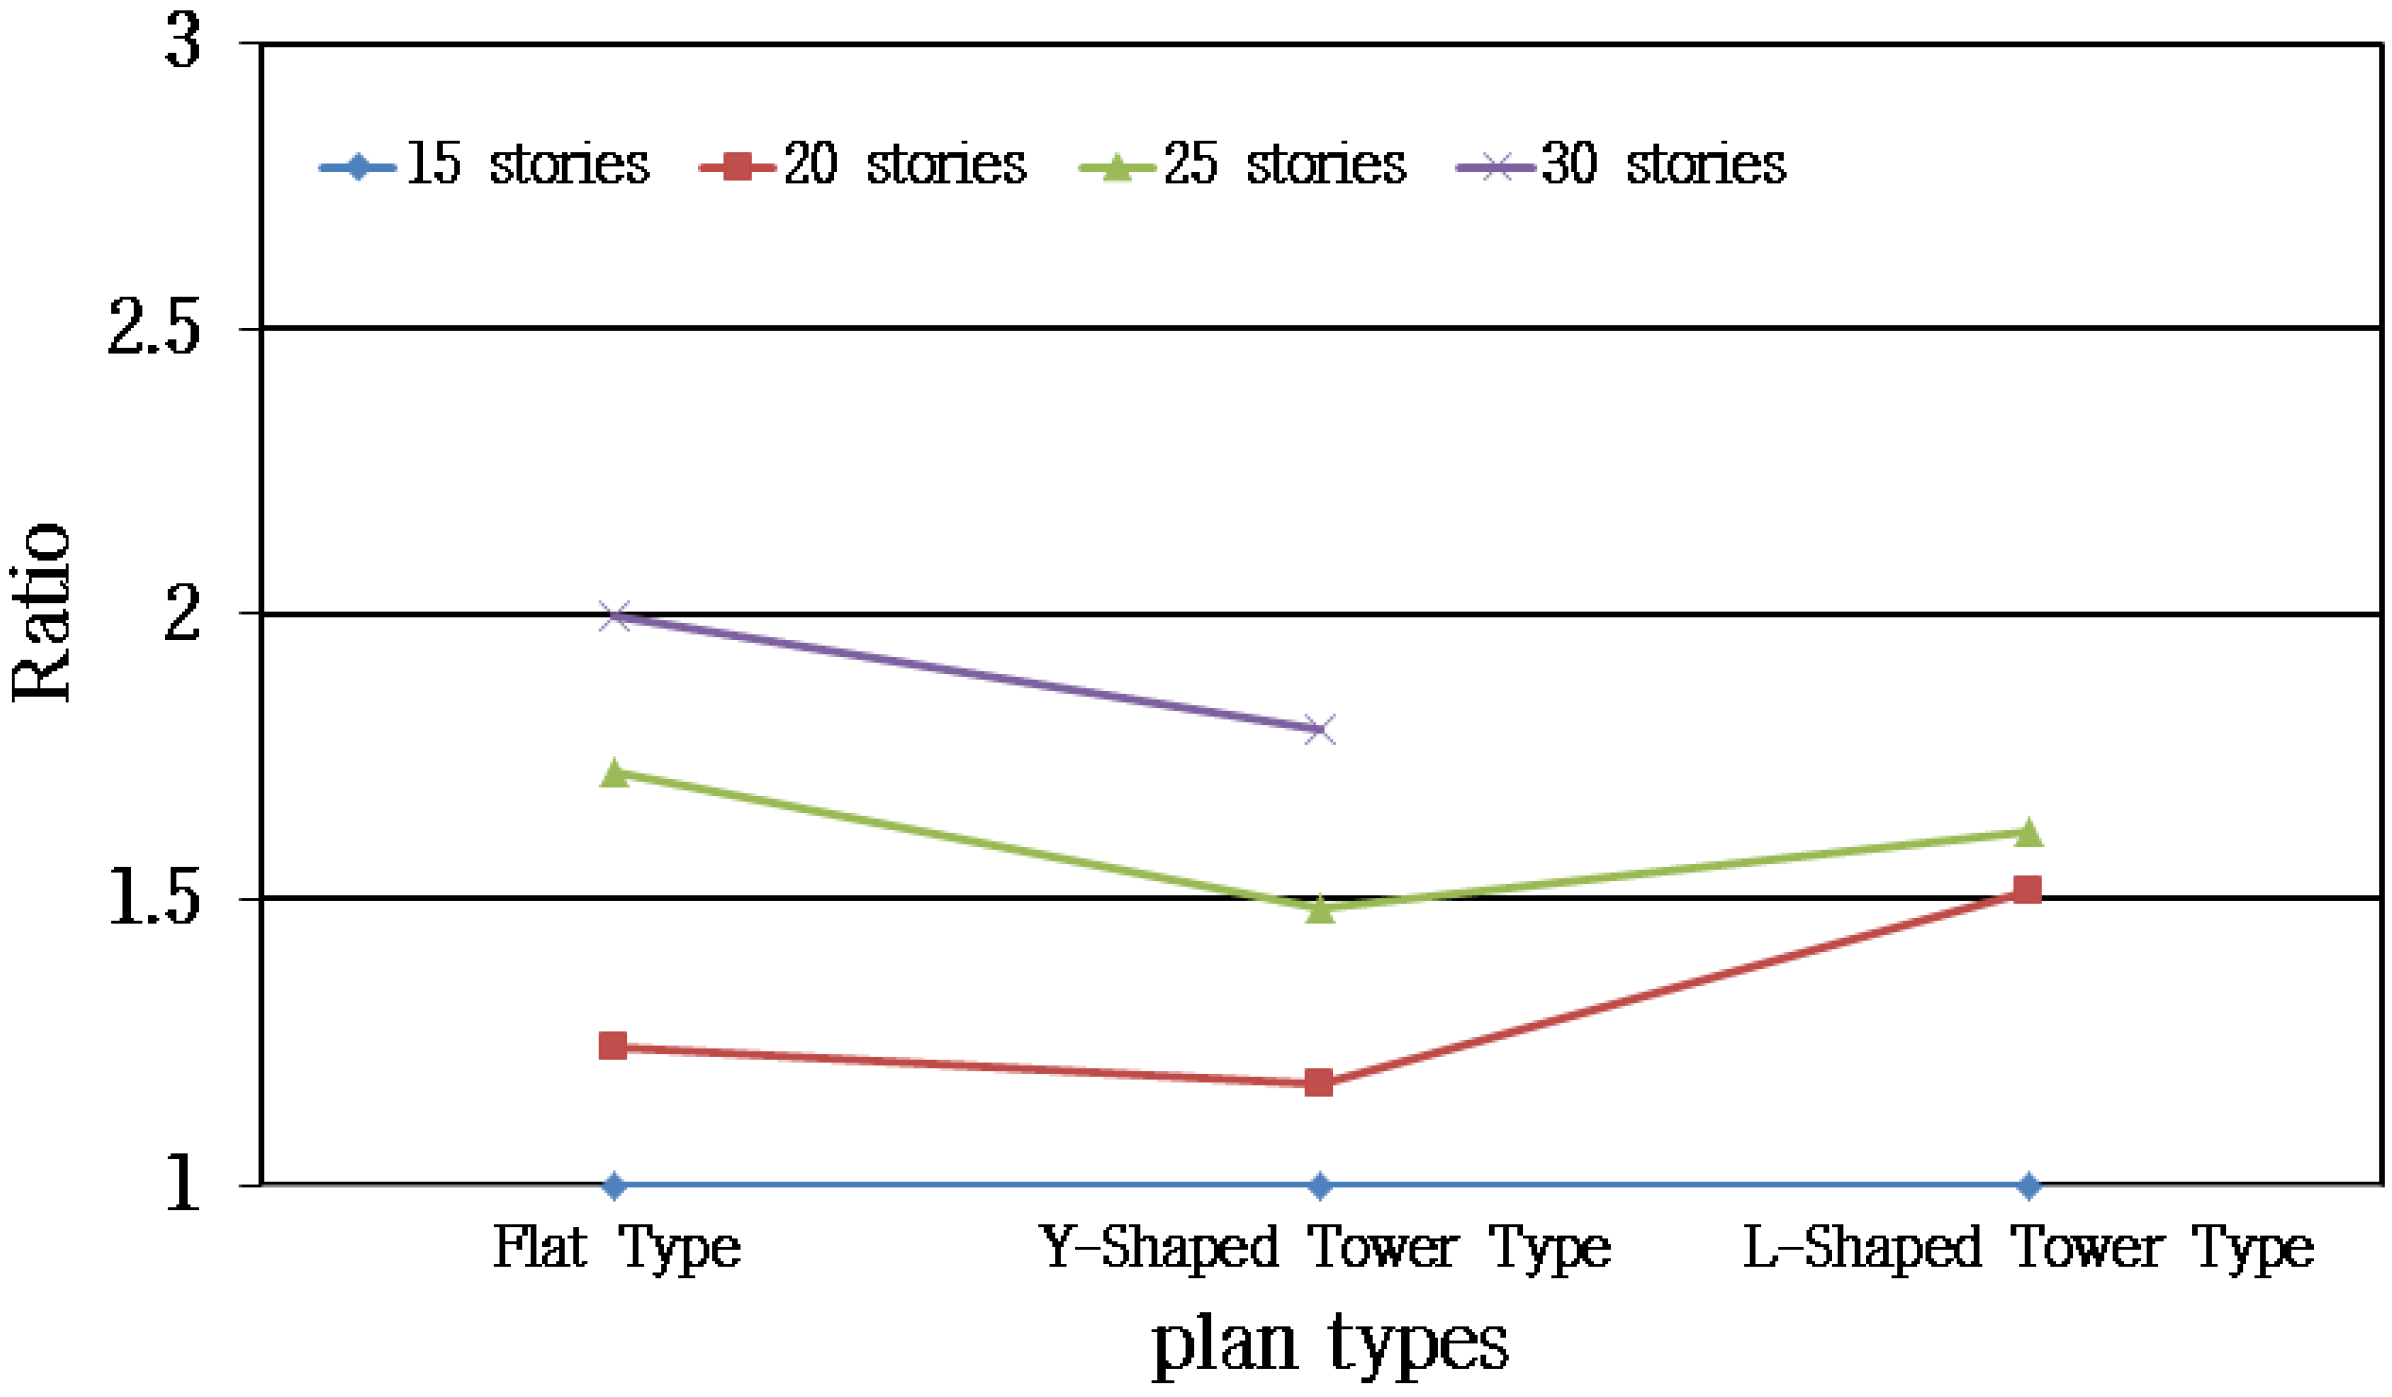
The comparison of the rate of change in the amount of reinforcement bars by type showed that tower L type had the largest rate of change at the lower floors, whereas flat type showed the largest rate of increase between the 25th and 30th floors. In contrast, because tower Y type showed the largest increase between the 20th and 25th floors, it may be slightly disadvantageous to construct buildings of 20 floors or higher.
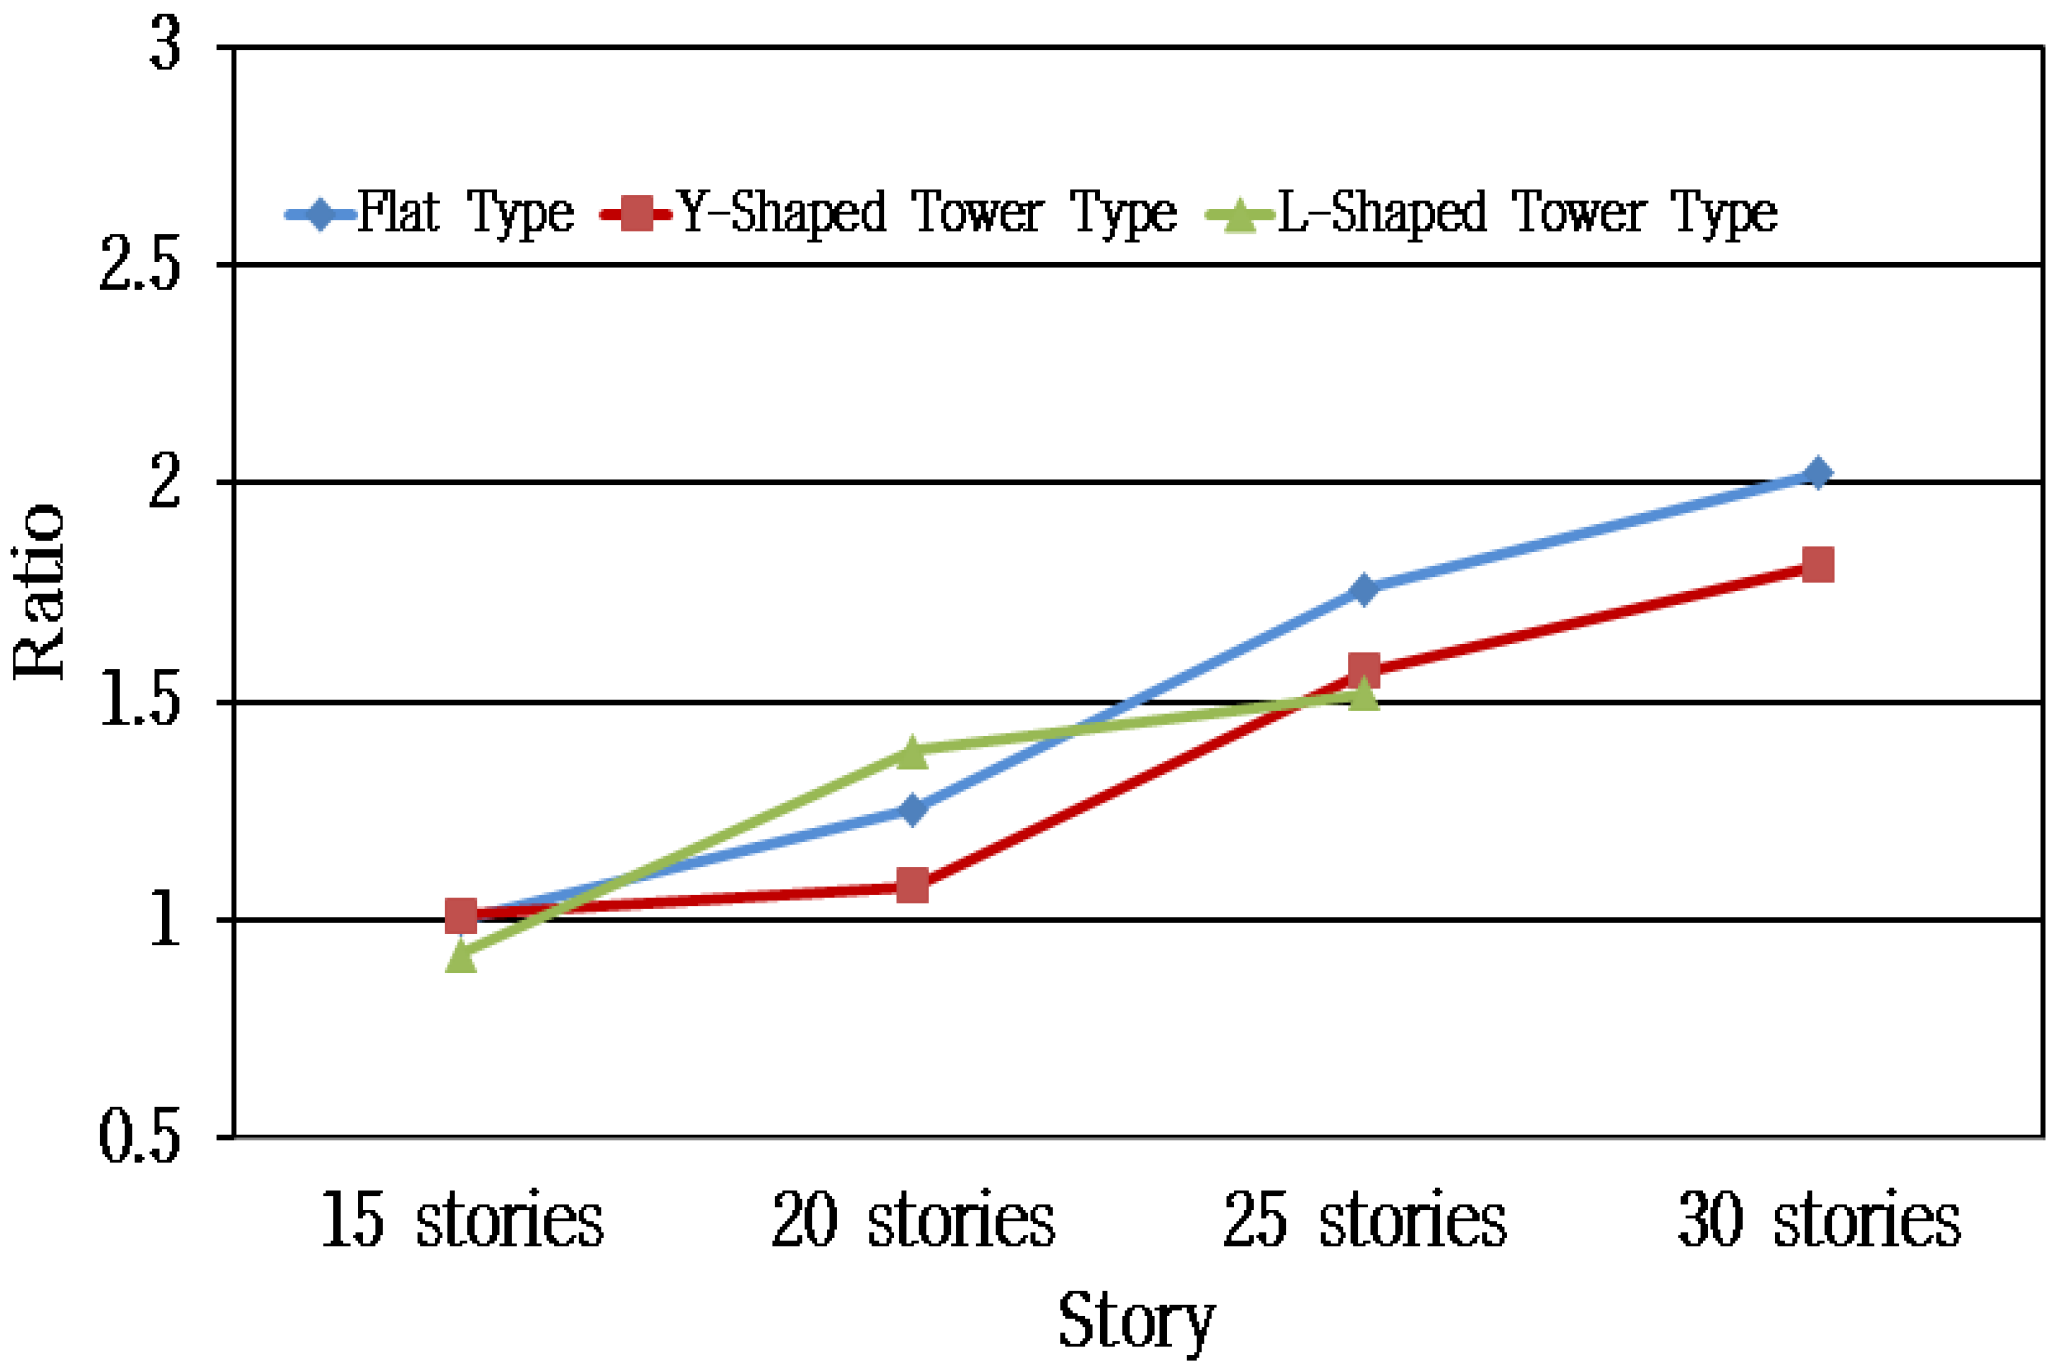
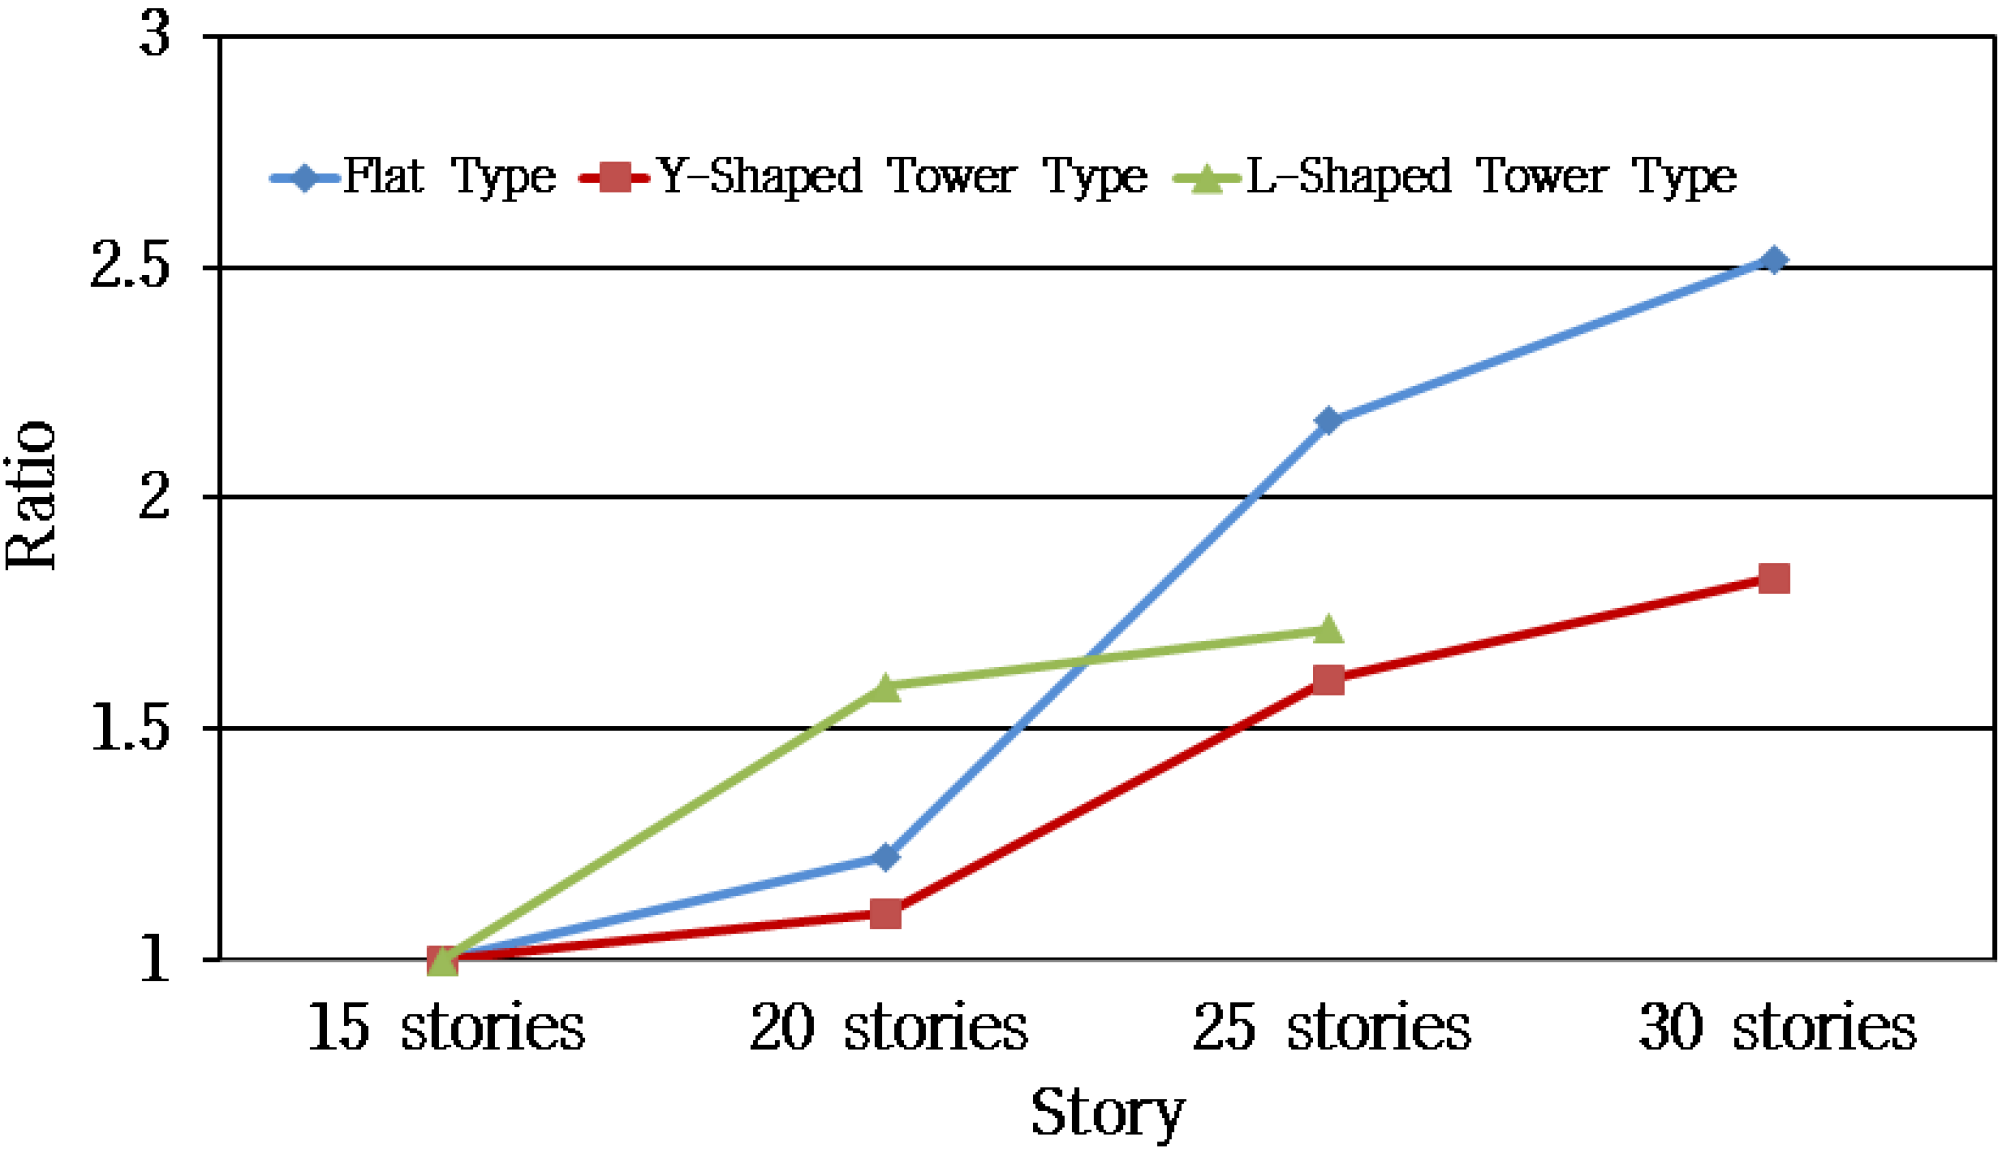
Table 13 lists the results of the calculated amounts of forms and their rates of change according to the number of floors and type; Figure 9 and Figure 10 show rates of change according to the number of floors and type.
The calculation results for the amount of forms according to the number of floors revealed that flat type experienced a relatively low rate of increase but the lowest rate of change at the 25th floor or higher. The tower Y type showed the largest increase in materials between the 20th and 25th floors, at 0.43.
Therefore, the tower Y type is inferior at higher than the 25th floor. The tower L type showed a relatively high rate of increase for all floors.
The comparison of the rate of change in the amount of forms showed that the tower L type had the largest rate of change at the 20th and 25th floors, whereas the tower Y type had the largest rate of increase at the 30th floor.

5. Evaluation of CO2 Emissions in Apartment Houses

5.1. Evaluation Method

The amount of CO2 emissions was evaluated with respect to the concretes, reinforcement bars, and forms inputted per type of apartment houses; the evaluation scope was established as a production phase (cradle to gate). For the CO2 emission factor of concrete, reinforcing bars and forms, the Korea Life Cycle Inventory DataBase (LCI DB) was applied [33,34,35,36].

5.2. Evaluation Results

Table 14 lists the evaluation results and the rate of change for CO2 emissions in apartment houses.
Figure 11 shows the CO2 emission rate of change; the values of 15-floor apartment houses per type were established as reference value 1. The difference in the rate of increase between the 15th and 20th floors of flat type was 0.25, but this difference rapidly increased to 0.51 between the 20th and 25th floors. The rate of increase decreased to 0.26 between the 20th and 30th floors. The difference in the rate of increase between the 15th and 20th floors of the tower Y type was low, at 0.06, but this increased rapidly to 0.49 between the 20th and 25th floors. The rate of increase decreased to 0.14 between the 20th and 30th floors. Finally, the difference in the rate of increase between the 15th and 20th floors of the tower L type increased rapidly to 0.51, but decreased as the number of floors increased. Therefore, flat and tower Y types are advantageous for lower floors, while the tower L type is advantageous for floors above the 25th floor.
To analyze the CO2 emissions of apartment houses by type according to the number of floors, a flat-type 15-floor apartment house was established at reference value 1 to analyze the relative rates of increase or decrease of all other apartment houses. Figure 12 shows the rate of change of CO2 emissions on the basis of a flat-type 15-floor apartment house. On the 15th floor, the amount of CO2 emissions of the tower L type was the lowest, at 0.92.
However, on the 20th floor, the amount of CO2 emissions of the tower L type was the largest, whereas the rate of increase of the tower Y type was the lowest, at 1.08.
Therefore, an eco-friendly design can be achieved: The lowest CO2 emissions were produced in the tower Y type at floors below the 20th floor, while the tower L type had the lowest CO2 emissions at floors above the 25th floor.

6. Evaluation of Cost in Apartment Houses

6.1. Evaluation Method

The cost evaluation of apartment houses by type used information from the Korea Public Procurement Service and Korea Price Information (KPI) to establish the unit prices of the primary construction materials [37].
Table 15 lists the cost (US$) evaluation result and its rate of change for apartment houses.

6.2. Evaluation Result

Figure 13 shows a graph of the rate of change in cost, with the cost of a 15-floor apartment house established at the reference value of 1 for each type. The difference in the rate of increase for a flat between the 20th and 25th floors was 0.67, and the material cost increased the most, surpassing the cost of the tower L type.
The difference in the rate of increase for the tower Y type between the 15th and 20th floors was low, at 0.06, but increased rapidly to 0.45 between the 20th and 25th floors. Finally, the difference in the rate of increase for the tower L type between the 15th and 20th floors increased rapidly to 0.52, but decreased as the number of floors increased.
Figure 14 shows a rate of change of material cost based on the 15th floor of a flat. At the 15th floor, the tower L type was evaluated to have the lowest cost, at 0.92; however, its cost at the 20th floor increased rapidly and was evaluated as having the highest cost.
In floors above the 25th, the costs of flats and tower Y types increased continuously, whereas the tower L type was advantageous in terms of cost as the number of floors increased.

7. Conclusions

This study classified apartment houses in Korea by types and analyzed input material amounts, CO2 emissions, and cost of primary materials. This study aimed to recommend eco-friendly and economical types of apartment houses; through this study, the following conclusions have been made.
(1) The calculation results for amounts of material used in apartment houses showed that concrete and reinforcement bars were used least for the 15-floor tower L type, but rapidly increased at the 20th floor, thereby outperforming the flat and tower Y types. However, in higher floors above the 20th floor, material use decreased more for the tower L type than other types. This phenomenon was particularly evident for reinforcement bars.
Therefore, flat and tower Y types of apartment houses were advantageous at lower floors, while the tower L type was advantageous at higher floors in terms of CO2 emissions and cost.
(2) The evaluation results for CO2 emissions in apartment houses showed that the most economical types were the 15-floor tower L at 1,597,141 kg-CO2, the 20-floor tower Y at 1,865,951 kg-CO2, the 25-floor tower L at 2,633,778 kg-CO2, and the 30-floor tower Y at 3,140,295 kg-CO2. Therefore, a flat was advantageous at 20 floors or lower in terms of eco-friendliness, but CO2 emissions increased rapidly as the number of floors increased above the 20th floor. On the other hand, CO2 emissions rapidly decreased for tower L types as the number of floors increased above the 20th floor; thus, it was evaluated as being the most eco-friendly plan for higher floors.
(3) The results of the evaluation of the cost of apartment houses showed that the cost of a flat was US$899,066 for 15 floors, which was less than the tower Y type, and US$1,129,722 for 20 floors, which was less than the tower L type. However, for 20 floors or higher, the cost increased rapidly. Accordingly, a flat was evaluated to be economically inferior to tower types as the number of floors increased.
(4) The highly useful study results will be utilized as data during the process of determining floor types and number of floors, considering emissions and cost in the construction phase of apartment houses upon the implementation of carbon trading in Korea.
(5) The study has been conducted on buildings in the Republic of Korea only. Therefore, the study results are not applicable to the buildings outside the country. It is planned to improve the reliability of the study by performing quantity analysis and CO2 emission evaluation on buildings in other countries.

Acknowledgments

This research was supported by a grant (Code 11-Technology Innovation-F04) from the Construction Technology Research Program (CTIP) funded by Ministry of Land, Infrastructure and Transport.

Author Contributions

The paper was written, revised and developed by Hyoung Jae Jang. Tae Hyoung Kim conducted the experimental and analytical works. Chang U Chae designed and supervised the project. All authors contributed to the analysis and conclusion, and revised the paper. All authors read and approved the final manuscript.

Conflicts of Interest

The authors declare no conflict of interest.

References

  1. International Energy Agency. World Energy Outlook 2015. Available online: http://www.worldenergyoutlook.org/ (accessed on 11 April 2016).
  2. Law of Low-Carbon on Green Growth; Ministry of government legislation: Sejong-Si, Korea, 2013.
  3. Details of Laws and Enforcement Ordinance and Regulations on Recycling Promotion of Construction Wastes; Ministry of government legislation: Sejong-Si, Korea, 2010.
  4. Shin, S.W. Environment-Friendly Technologies; Kimoondang Publishing: Seoul, Korea, 2007. [Google Scholar]
  5. Department of Climate Policy. Climate Change Handbook, Korea Meteorological Administration; Korea Meteorological Administration: Seoul, Korea, 2009. [Google Scholar]
  6. Intergovernmental Panel on Climate Change, Climate Change 2007: Impacts, Adaptation and Vulnerability Contribution of Working Group II to the Fourth Assessment Report (2007). Available online: http://www.ipcc.ch/ (accessed on 16 April 2016).
  7. Lee, B.H.; Lee, G.W.; Yeo, Y.H. Comparative Study of Environmental Sustainability in Basic Community Planning for Multiple Stock Housing based on Lay-out Types. Archit. Inst. Korea 2010, 26, 271–282. [Google Scholar]
  8. Noh, J.W. An Analysis of Heating and Cooling Energy Cost according to Building Type of Apartment Complex. J. Korean Sol. Energy Soc. 2013, 32, 96–105. [Google Scholar]
  9. Lee, S.E. Technology and policy goals for zero energy buildings. Archit. Inst. Korea 2010, 54, 52–58. Available online: http://www.nl.go.kr/nl/search/bookdetail/online.jsp?contents_id=CNTS-00053196004 (accessed on 16 April 2016). [Google Scholar]
  10. Van den Heede, P.; De Belie, N. Environmental impact and life cycle assessment (LCA) of traditional and “green” concretes: Literature review and theoretical calculations. Cem. Concr. Compos. 2012, 34, 431–442. [Google Scholar] [CrossRef]
  11. Oha, B.K.; Park, J.S.; Choi, S.W.; Park, H.S. Design model for analysis of relationships among CO2 emissions, cost, and structural parameters in green building construction with composite columns. Energy Build. 2016, 118, 301–315. [Google Scholar] [CrossRef]
  12. Boqiang, L.; Hongxun, L. CO2 emissions of China’s commercial and residential buildings: Evidence and reduction policy. Build. Environ. 2015, 92, 418–431. [Google Scholar]
  13. Zhixing, L.; Liu, Y.; Jiaping, L. Embodied carbon emissions of office building: A case study of China’s 78 office buildings. Build. Environ. 2016, 95, 365–371. [Google Scholar]
  14. Guomin, Z.; Sujeeva, S.; Malindu, S. Environmental emissions at foundation construction stage of buildings—Two case studies. Build. Environ. 2016, 95, 189–198. [Google Scholar]
  15. Chau, C.K.; Hui, W.K.; Ng, W.Y.; Powell, G. Assessment of CO2 emissions reduction in high-rise concrete office buildings using different material use options. Resour. Conserv. Recycl. 2012, 61, 22–34. [Google Scholar] [CrossRef]
  16. Jingke, H.; Geoffrey, Q.S.; Yong, F.; William, S.L.; Chao, M. Greenhouse gas emissions during the construction phase of a building: A case study in China. J. Clean. Prod. 2015, 103, 249–259. [Google Scholar]
  17. Ooteghem, K.V.; Xu, L. The life cycle assessment of a single storey retail building in Canada. Build. Environ. 2012, 49, 212–226. [Google Scholar] [CrossRef]
  18. Castellano, J.; Castellano, D.; Ribera, A.; Ciurana, J. Development of a scale of building construction systems according to CO2 emissions in the use stage of their life cycle. Build. Environ. 2014, 82, 618–627. [Google Scholar] [CrossRef]
  19. Lee, S.J. Modelling for Estimation of RC Structural Material by BIM. Master’s Thesis, Hoseo University, Asan, Korea, 2013. [Google Scholar]
  20. Concrete Structure Design Criteria of Korea; Korea Concrete Institute: Seoul, Korea, 2012.
  21. Building Structure Design Criteria of Korea; Architectural Institute of Korea: Seoul, Korea, 2013.
  22. Guideline of Quantity Calculation for Building Construction. 2007. Available online: http://www.e-bid.co.kr/community/dataView.htm?nb_no=2440&type=D&pattern=F&cate=&searchKey=&searchValue= (accessed on 16 April 2016).
  23. MIDAS Information Technology. General Structure Design System for Window. Available online: http://midasarchi.com/ (accessed on 11 March 2016).
  24. Kim, S.Y. A Study on the Structure Types and Concrete Strength Zoning of Domestic Tall Apartment Buildings. Land Hous. Inst. Korea 2013, 4, 295–301. [Google Scholar] [CrossRef]
  25. Jongsuk, J.; Jaesung, L.; Yangjin, A.; Kyunghee, L.; Kisun, B.; Myunghun, J. An Analysis of Emission of Carbon Dioxide from Recycling of Waste Concrete. Archit. Inst. Korea 2008, 24, 109–116. [Google Scholar]
  26. Thormark, C.; Bonnet, C.; Bruno, J.C.; Castells, F. The effect of material choice on the total energy need and recycling potential of a building. Build. Environ. 2006, 41, 1019–1026. [Google Scholar] [CrossRef]
  27. Gustaysson, L.; Joelsson, A.; Sathre, R. Life cycle primary energy use and carbon emission of an eight-storey wood-framed apartment building. Energy Build. 2010, 42, 230–242. [Google Scholar] [CrossRef]
  28. Jesus, G.M.; Justo, G.N. Assessment of the decrease of CO2 emissions in the construction field through the selection of materials: Practical case study of three houses of low environmental impact. Build. Environ. 2006, 41, 902–909. [Google Scholar]
  29. Airaksinen, M.; Matilainen, P. Carbon efficient building solutions. Sustainability 2010, 2, 844–858. [Google Scholar] [CrossRef]
  30. Lin, B.; Liu, H. CO2 mitigation potential in China’s building construction industry: A comparison of energy performance. Build. Environ. 2015, 94, 239–251. [Google Scholar] [CrossRef]
  31. Li, J.; Colombier, M. Managing carbon emissions in china through building energy efficiency. J. Environ. Manag. 2009, 90, 2436–2447. [Google Scholar] [CrossRef] [PubMed]
  32. Chau, C.K.; Yik, F.W.H.; Hui, W.K.; Liu, H.C.; Yu, H.K. Environmental impacts of building materials and building services components for commercial buildings in Hong Kong. J. Clean Prod. 2007, 15, 1840–1851. [Google Scholar] [CrossRef]
  33. Nam, H.J.; Moon, J.H.; Kim, K.G.; Kim, G.H. An analysis of environmental factors and efficiency in the apartment housing project, 11. Archit. Inst. Korea 2011, 27, 203–210. Available online: http://www.nl.go.kr/nl/search/bookdetail/online.jsp?contents_id=CNTS-00056432289 (accessed on 14 April 2016). [Google Scholar]
  34. National Database for Environmental Information of Building Products; Ministry of Land, Transport and Maritime Affairs of the Korean government: Sejong-Si, Korea, 2008.
  35. National Life Cycle Index Database Information Network. Available online: http://www.edp.or.kr (accessed on 11 August 2015).
  36. Guidelines for National Greenhouse Gas Inventories; IPCC (International Panel Climate Change): Geneva, Swiss, 2006.
  37. Korea Price Information (2015). Available online: http://www.kpi.or.kr/ (accessed on 13 April 2016).
Figure 1. Floor types of apartment houses.
Sustainability 08 00445 g001
Figure 2. The standard of quantity estimation: (a) The standard of quantity estimation for the wall; (b) The standard of quantity estimation for the column; (c) The standard of quantity estimation for the beam; (d) The standard of quantity estimation for the slab.
Sustainability 08 00445 g002
Figure 3. The standard of quantity estimation for the reinforcing bar: (a) The standard of quantity estimation for the beam reinforcing bar; (b) The standard of quantity estimation for the slab reinforcing bar.
Sustainability 08 00445 g003
Figure 4. The results of plane type’s modeling.
Sustainability 08 00445 g004
Figure 5. Change rate for amount of concrete based on the number of floor.
Sustainability 08 00445 g005
Figure 6. Change rate for amount of concrete based on each reference type.
Sustainability 08 00445 g006
Figure 7. Change rate for amount of rebar based on the number of floor.
Sustainability 08 00445 g007
Figure 8. Change rate for amount of rebar based on each reference type.
Sustainability 08 00445 g008
Figure 9. Change rate for amount of form based on the number of floor.
Sustainability 08 00445 g009
Figure 10. Change rate for amount of form based on each reference type.
Sustainability 08 00445 g010
Figure 11. Rate of change for CO2 emissions based on 15-floor flat.
Sustainability 08 00445 g011
Figure 12. Rate of change for CO2 emissions based on each reference type.
Sustainability 08 00445 g012
Figure 13. Rate of change for cost based on 15-floor flat.
Sustainability 08 00445 g013
Figure 14. Rate of change for cost based on the 15th floor of a flat.
Sustainability 08 00445 g014
Table 1. Overview of evaluation building.
No.TypeNo. of FloorsInternal Area (m2)No. of Households on a FloorBayFloor Height (m)Location
1Flat1584432.8Chung-nam
21584432.8Chung-nam
32084432.8Chung-nam
42084432.8Chung-nam
52584432.8Ulsan
62584432.8Ulsan
73084432.8Ulsan
83084432.8Ulsan
9Tower Y1584432.8Chung-nam
102084432.8Chung-nam
112084432.8Chung-nam
122584432.8Chung-nam
132584432.8Chung-nam
143084432.8Chung-nam
153084432.8Chung-nam
16Tower L1584432.8Seoul
171584432.8Seoul
182084432.8Chung-nam
192084432.8Chung-nam
202584432.8Chung-nam
212584432.8Chung-nam
Note: No. = Number.
Table 2. Calculation formula for the wall.
DivisionEstimation Formula
concreteL × t × (H − d)
formL × 2 × (H − d)
Table 3. Calculation formula for the column.
DivisionEstimation Formula
concretea × b × (H − t)
form2(a + b) × (H − t)
Table 4. Calculation formula for the beam.
DivisionEstimation Formula
concreteb × (d − ts) × lo
form(d − ts) × 2 × lo
Table 5. Calculation formula for the slab.
DivisionEstimation Formula
concretea × b × ts
form(a × b) + [2(a + b) × ts]
Table 6. Calculation formula for length/piece of reinforcing bar.
CategoryCalculation Formulas
Member LengthInside length = Dimension between member inside measurements (lo)
Front length = Dimension of member front line (l)
Outside length = Dimension between member outsides (l’)
Joint LengthUnder tensile load = 40distance (unit: cm)
Under compressive force = 25distance (unit: cm)
Dowel LengthUnder tensile load = 40distance (unit: cm)
Under compressive force = 25distance (unit: cm)
Hook LengthColumn and beam = 10.3distance (unit: cm)
Table 7. Calculation formula for the wall reinforcing bar.
CategoryCalculation Formulas
Vertical reinforcing bars(Member length + Dowel length) × quantity
Horizontal reinforcing bars[Member length + (Joint length × Joint number)] × quantity
Table 8. Calculation formula for the column reinforcing bar.
CategoryCalculation Formulas
Main Bar(Member length + joint length + dowel length + hook) × quantity
Hoop BarColumn circumference × quantity
Diagonal Hoop BarColumn circumference × quantity
Table 9. Calculation formula for the beam reinforcing bar.
CategoryCalculation Formulas
Top-floor BeamUpper Main Bar[Outside length + (dowel length + hook) × 2 (both sides)] × quantity
Bent-up Bar[Outside length + (dowel length + hook) × 2 (both sides) + length of increase in bent-up bar] × quantity
Lower Main Bar[Outside length + (dowel length + hook) × 2 (both sides)] × quantity
Stirrup BarEnd: Beam circumference × quantity
Center: Beam circumference × quantity
Middle-floor BeamUpper Main Bar[Inside length + (dowel length + hook) × 2 (both sides)] × quantity
Bent-up Bar[Inside length + (dowel length + hook) × 2 (both sides) + length of increase in bent-up bar] × quantity
Lower Main Bar[Outside length + (dowel length + hook) × 2 (both sides)] × quantity
Stirrup BarEnd: Beam circumference × quantity
Center: Beam circumference × quantity
Table 10. Calculation formula for the slab reinforcing bar.
CategoryCalculation Formulas
Short-sides directionUpper Main Barlx × quantity
Lower Main Barlx × quantity
Bent-uplx × quantity
Main Bar(lx/4 + dowel length) × quantity
Long-sides directionUpper Main Barlx × quantity
Lower Main Barlx × quantity
Bent-uplx × quantity
Main Bar(lx/4 + dowel length) × quantity
Table 11. Calculated amount of concrete according to the number of floors and type.
Number of FloorsTypeMaterial Amount [m3]Average [m3]Change Rate
15 floorsFlat377637861.00
3795
Tower Y385438541.00
Tower L347234951.00
3519
20 floorsFlat466047061.24
4751
Tower Y418042391.18
4298
Tower L518352871.51
5392
25 floorsFlat640065281.72
6656
Tower Y567557191.48
5763
Tower L535556601.62
5965
30 floorsFlat742475521.99
7680
Tower L651466251.80
6736
Table 12. Result of calculated amounts of reinforcement bars according to number of floors and type.
Number of FloorsTypeMaterial Amount [ton]Average [ton]Change Rate
15 floorsFlat1801811.00
181
Tower Y1981981.00
Tower L1471471.00
147
20 floorsFlat2122221.23
231
Tower Y2152181.10
222
Tower L2302351.59
239
25 floorsFlat3853922.17
399
Tower L2872891.61
292
Tower L2482531.72
258
30 floorsFlat4484552.52
463
Tower L3373431.83
349
Table 13. Result of calculated amounts of form according to the number of floors and types.
Number of FloorsTypeMaterial Amount (m3)Average (m2)Change Rate
15 floorsFlat33,46533,5471.00
33,629
Tower Y32,03132,0311.00
Tower L30,93931,1611.00
31,383
20 floorsFlat42,21742,6691.27
43,121
Tower Y35,96236,9451.15
37,928
Tower L43,01343,8451.41
44,676
25 floorsFlat47,25848,2031.44
49,148
Tower L49,72250,7051.58
51,688
Tower L49,78250,7831.63
51,783
30 floorsFlat54,81955,7641.66
56,710
Tower L57,58558,5681.83
59,551
Table 14. Results of evaluation and rate of change for CO2 emissions per evaluation building.
Number of FloorsTypeCO2 Emission (kg-CO2)Average (kg-CO2)Based on Each Reference TypeBased on 15-Floor Flat
15 floorsFlat1,728,9581,733,2981.001.00
1,737,637
Tower Y1,752,2701,752,2701.001.01
Tower L1,586,5231,597,1411.000.92
1,607,759
20 floorsFlat2,138,9022,172,1801.251.25
2,205,457
Tower Y1,835,5351,865,9511.061.08
1,896,366
Tower L2,359,3042,406,8751.511.39
2,454,446
25 floorsFlat2,987,6413,044,9631.761.76
3,102,286
Tower Y2,698,2982,722,7291.551.57
2,747,160
Tower L2,510,8542,633,7781.651.52
2,756,702
30 floorsFlat3,448,4573,505,7642.022.02
3,563,071
Tower Y3,089,4053,140,2951.791.81
Tower L3,191,186
Table 15. Cost evaluation result and change rate per building of apartment houses.
Number of FloorsTypeCost [$]Average Cost [$]Based on Each Reference TypeBased on 15-Floor Flat
15 floorsFlat896,703899,0661.001.00
901,429
Tower Y949,445949,4451.001.06
Tower L819,684824,2471.000.92
828,810
20 floorsFlat1,099,1361,129,7221.261.26
1,160,309
Tower Y992,4831,007,6511.061.12
1,022,819
Tower L1,227,3801,252,3261.521.39
1,277,273
25 floorsFlat1,706,6971,738,8771.931.93
1,771,057
Tower Y1,423,6651,434,0641.511.60
1,444,463
Tower L1,285,3371,343,4051.631.49
1,401,474
30 floorsFlat1,973,7062,005,8202.232.23
2,037,934
Tower L1,639,4931,666,5121.761.85
1,693,531

