Article

Sustainability of Global and Local Food Value Chains: An Empirical Comparison of Peruvian and Belgian Asparagus

Department of Earth and Environmental Sciences, KU Leuven, Division of Bioeconomics, Celestijnenlaan 200 E, Leuven 3001, Belgium
*
Author to whom correspondence should be addressed.
Sustainability 2016, 8(4), 344; https://doi.org/10.3390/su8040344
Submission received: 26 February 2016 / Revised: 29 March 2016 / Accepted: 1 April 2016 / Published: 7 April 2016

Abstract

:
The sustainability of food value chains is an increasing concern for consumers, food companies and policy-makers. Global food chains are often perceived to be less sustainable than local food chains. Yet, thorough food chain analyses and comparisons of different food chains across sustainability dimensions are rare. In this article we analyze the local Belgian and global Peruvian asparagus value chains and explore their sustainability performance. A range of indicators linked to environmental, economic and social impacts is calculated to analyze the contribution of the supply chains to economic development, resource use, labor relations, distribution of added value and governance issues. Our findings suggest that none of the two supply chains performs invariably better and that there are trade-offs among and between sustainability dimensions. Whereas the global chain uses water and other inputs more intensively and generates more employment per unit of land and higher yields, the local chain generates more revenue per unit of land.

1. Introduction

Consumers are increasingly concerned about the sustainability performance of their food consumption [1,2]. A particular consumer choice is between food products that are sourced locally and global food products. Global food products are often perceived to be less sustainable than local food products—a perception that is confirmed by concepts such as “food miles”, “think global, eat local”, “short food chains”, “local food systems” and “local food movements”. Yet, the evidence on the sustainability performance of local versus global food chains is mixed and often focuses on one single component of sustainability. The largest part of the evidence comes from environmental impact models that compare domestic and imported food, in terms of “food miles” and related differences in greenhouse gas (GHG) emissions. For example, Stoessel et al. [3] use Life Cycle Assessment (LCA) to find very high carbon emissions related to asparagus and papaya imports by airfreight compared to local fruits and vegetables. Also, Van Hauwermeiren et al. [4] find a large difference in energy use and resulting carbon emissions between imported versus domestic food, but highlight that consumers’ purchasing behavior and in-season production also play an important role for emissions. Other authors also conclude that seasonality is an important element when comparing GHG emissions, as their findings suggest that the duration and form of storage between production and consumption have large impacts on total emissions [5,6]. By applying general equilibrium modeling, Avetisyan et al. [7] highlight that differences in regional emission intensities related to on-farm production of ruminant livestock have a much bigger impact on global GHG emissions than changes in transport-related emissions. In this respect, there is no straightforward universal answer to the total environmental impact of local versus global food consumption.
A second stream of the literature focuses on the economic impact of consuming local or global food and the exclusion or inclusion of farmers, as well as workers in these value chains. It has been shown that consumers prefer local food to support regional farms and local economic activities [2] and that local value chains have positive impacts on the local economy through multiplier effects [8], employment creation and economic gains [9]. Ballingall and Winchester [10] assess increasing consumption of local food from a different angle and examine the potential impact of reducing imports in the UK, Germany and France on welfare in the countries of origin of the imported products. They find the largest welfare loss relative to GDP in New Zealand, Malawi and Madagascar. It has also been shown that the participation of low- and middle-income countries in international trade can have positive development impacts through economic growth and poverty reduction [11]. Positive income effects for the local population may happen through inclusion of smallholder farms in global food value chains and creation of employment possibilities for rural households [12,13,14].
Relatively few studies analyze social impacts of local versus global food supply chains. One strand of the literature focuses on low-income countries and finds positive impacts of the inclusion of farmers in export supply chains on happiness [15], on primary school enrolment [16] and on food security [17]. Regarding the creation of employment opportunities, Van den Broeck and Maertens [18] find that female labor market participation reduces fertility rates. It has also been shown that increasing compliance with private labor standards improves labor conditions in food export chains [19]. Some studies express specific concerns about the kind of employment that is created and highlight that the overall well-being of workers in high-value export chains crucially depends on the quality of employment [20,21]. Other concerns relate to the exclusion of the poorest farmers from global value chains and increasing inequality due to high food quality and safety requirements [22,23]. Regarding social impacts of local supply chains, Macias [24] claims that local agriculture can have positive impacts on food equity, social integration, and experiential knowledge of nature.
Most of the above-cited studies focus on only one single sustainability dimension or use only one methodology to assess food chain performance, such as LCA or Input-Output analysis. There are some studies that apply multidimensional sustainability analysis to local food systems using qualitative indicators, e.g., [25]. Quantitative studies comparing the performance of local and global food supply chains across dimensions are rare. In this article we explore the sustainability of local and imported asparagus considering environmental, economic and social impacts. We take a multidimensional approach and combine different methods for analyzing two case studies in depth: first, a chain of asparagus produced and consumed in Belgium, and second, a global chain of asparagus produced in Peru and exported to Belgium. The analysis focuses on asparagus, a vegetable historically grown during a short season in Belgium, and with a high importance as export crop in Peru. Both are sold to Belgian consumers who can buy domestic asparagus seasonally or imported asparagus the whole year round. The paper is structured as follows. In the next two sections we describe the Belgian and the Peruvian asparagus sectors in detail, including the identification of the most critical sustainability issues in each chain identified based on stakeholder interviews and literature review. In Section 4, we present the materials and methods used in this study, specifically the choice of sustainability attributes and indicators for our analysis, and data collection methods. The results are presented in Section 5 and discussed according to sustainability attributes in Section 6. Section 7 concludes.

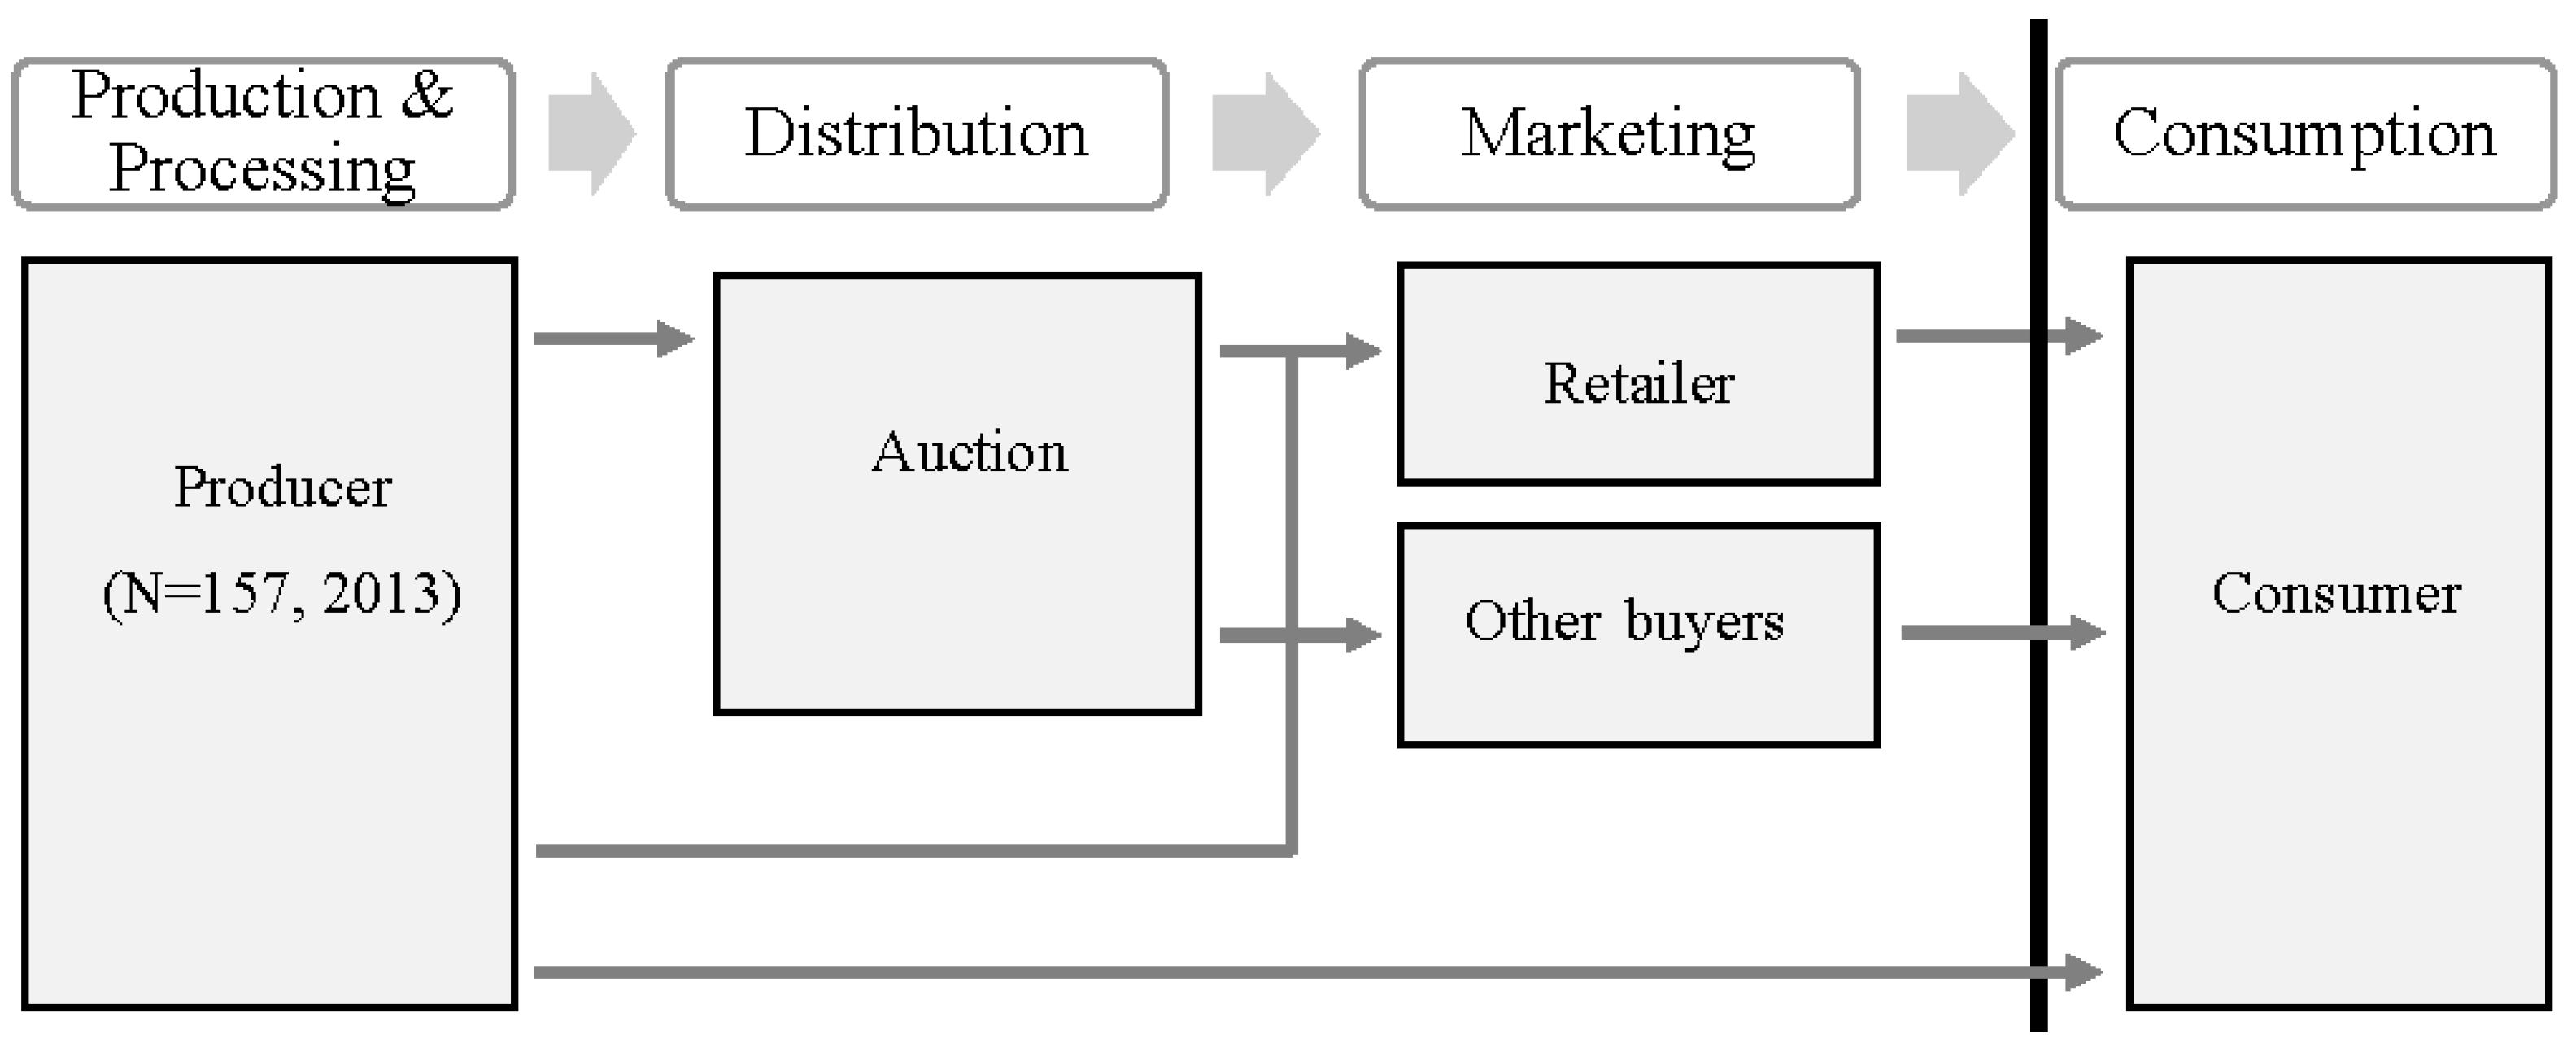
2. Belgian Asparagus

2.1. Value Chain Description

Figure 1 shows the Belgian asparagus value chain. In 2013, there were 157 asparagus producers in Belgium of which 137 have their holding in Flanders. The area devoted to asparagus production nearly doubled between 2009 and 2013, from 174 ha to 326 ha [26], but remains small in the total agricultural area of more than one million ha in Belgium. Growers usually only dedicate part of their agricultural land to asparagus production and also cultivate other vegetables such as leek. Yields have increased from around 6 tons/ha at the beginning of the 2000s to around 9 tons/ha in 2012 [27]. Predominantly white asparagus is grown. In 2014, only one farmer cultivated green asparagus on 17 ha [28]. Regarding production techniques, only 9 ha of asparagus were grown in a greenhouse in 2014, the remaining production taking place in open field. Given an average labor input of 1.56 workers per ha (see Section 5), the Belgian asparagus sector provides on-farm employment to around 500 workers.
Asparagus harvest takes place between the beginning of April and mid-June. After harvest, the asparagus is processed, i.e., it is bathed and sorted based on five classes of thickness and four classes of form. The higher quality asparagus is generally delivered to a cooperative auction where the product is inspected for quality, weight, size and packaging. Then the asparagus is grouped according to quality codes and stored until it is sold. The best quality asparagus (with the form “straight and white” and thickness category A (16 mm–22 mm) or AA (22 mm–28 mm)) receives the Flandria quality label after inspection by an auction official. The leading auction for asparagus is the BelOrta auction situated near the city of Mechelen in the province of Antwerp. On average, the auction sells 2 million kg of asparagus per year. In the sales hall of the auction, fruits and vegetables are offered to the buyers, many of which are retailers. The auction starts with a high price which then descends until the first buyer concludes the transaction. In 2013, the average price received by farmers for Flandria asparagus at the auction was 3.75 EUR/kg. Almost immediately after the sale has been concluded, the product is ready to be collected by the buyer, many of which are retailers. Other buyers include exporters, wholesalers or restaurants. After being sold at the auction, the asparagus is distributed and sold to the consumer.
A part of the production, often the lower quality asparagus, is sold directly to the consumer on-farm. This marketing channel is very common in the asparagus sector and of increasing importance for the growers. For code B asparagus, farmers can receive 5 EUR/kg, considerably more than at the auction. However, farmers who are auction-members are obliged to supply the high-quality asparagus to the cooperative.
Finally, some farmers sell their produce directly to retailers and other buyers before it reaches the consumer.

2.2. Case Study Context and Critical Issues

The critical supply chain issues have been identified through stakeholder interviews with the farmer’s association, the cooperative auction and farmers in 2014 (see Section 4.2).

2.2.1. Global-Local Issues

Belgian asparagus is a very seasonal product with a very short harvest season from the end of April to June. It is only grown in specific regions in Belgium due to soil quality requirements and sold mainly within the country. This is especially the case for asparagus sold at the farm shop to consumers who generally live in the vicinity. During the past years, the amount of asparagus sold directly on the farm has greatly increased [29]. However, there are also some global aspects in asparagus production. The rhizomes are imported from nurseries in the Netherlands and often the transplanting is also done by external Dutch companies. Moreover, the largest share of seasonal workers for harvesting and packing comes from Eastern European countries. Thus, the local product depends on input supplies from other countries.

2.2.2. Standards and Certifications

In order to sell their product to an auction, asparagus farmers need to comply with GlobalGAP and the Vegaplan standard, basic production standards including food safety and traceability requirements. For instance, GlobalGAP includes compliance criteria for all stages of production, from pre-harvest activities such as soil management and fertilizer use to post-harvest activities like packing and storing. The BelOrta auction holds a group certificate for asparagus including a producer group of 86 farms [30]. This means that all producers have to comply with the standard, but certification costs are lower than in the case of individual certification. Compliance with GlobalGAP and Vegaplan is required for obtaining the Flandria quality label which includes requirements on (i) cultivation practices such as planting material and fertilizers used; (ii) quality standards such as the shape of the product and the absence of foreign products; and (iii) traceability and control in order to be able to trace each product from the soil to the consumer [31].

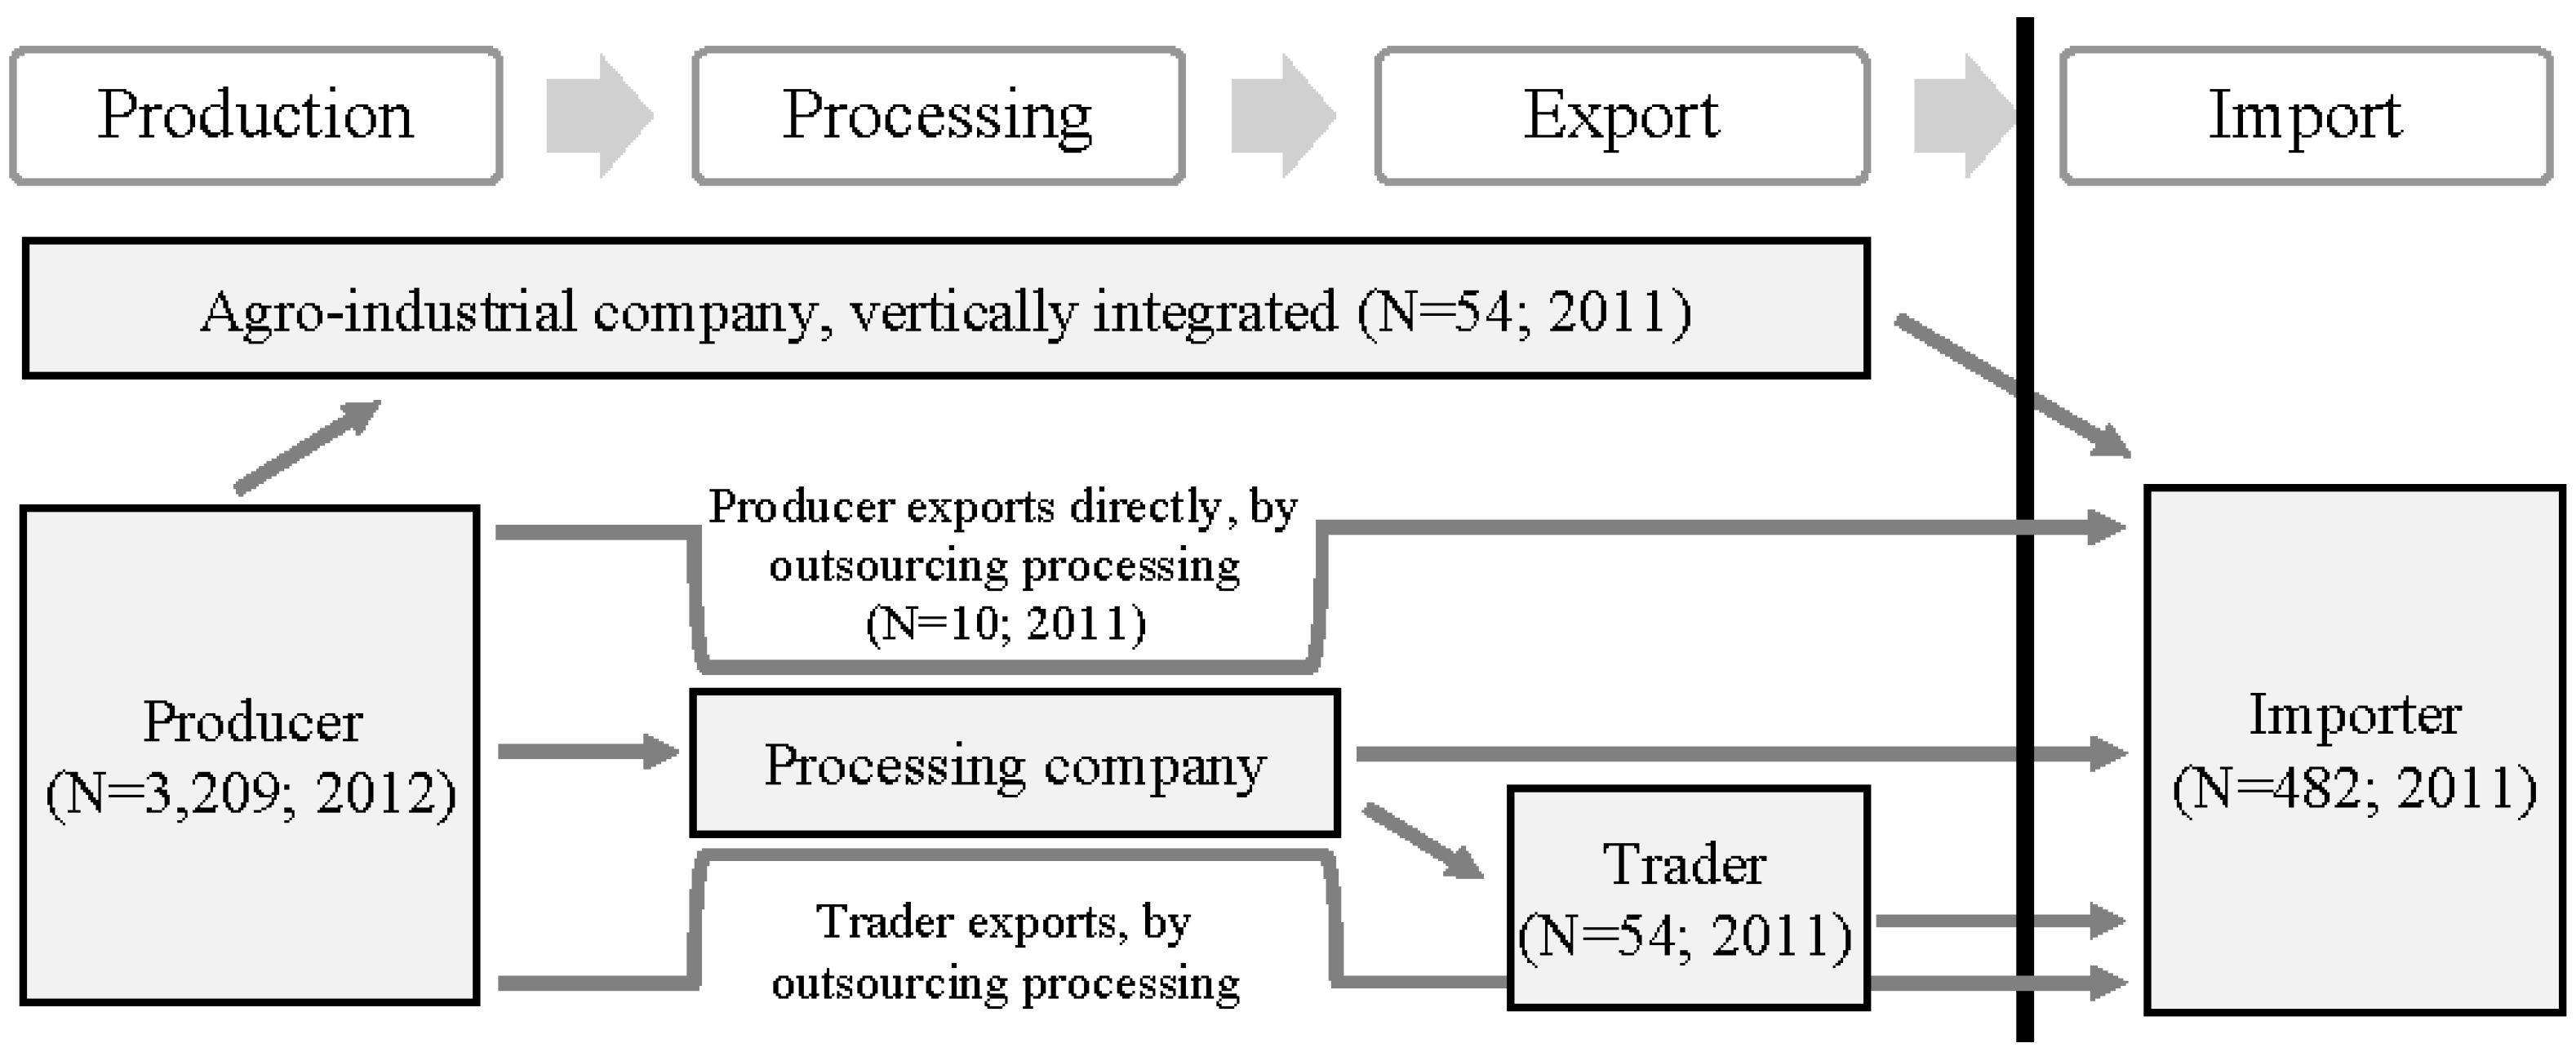
3. Peruvian Asparagus

3.1. Value Chain Description

Peru is the largest exporter of asparagus worldwide. The sector currently accounts for about 25% of the country’s total agricultural exports [32] and has thus an important role in the national economy and the labor market in the production regions. Exports of asparagus more than doubled between 2000 and 2013, amounting to nearly 185,000 tons in 2013 and earning Peru more than 600 million USD FOB [32]. The product is exported fresh (around 70% of all production), preserved (around 25%) or frozen (around 5%) and all forms require a selection, cutting and packaging procedure in a local processing plant. There is no domestic market for asparagus and 99% of the entire production is exported. The main destination markets are European countries (25% of all fresh; 26% of all frozen and 71% of all preserved produce [32]) and the United States (70% of all fresh; 51% of all frozen and 22% of all preserved produce [32]). The asparagus production area ranges from 300 km south (Ica region) to 600 km north (La Libertad region) of Lima along the desert coast. Both green and white asparagus are produced, but the production of green varieties outnumbers the production of white asparagus (83% green vs. 17% white [33]). Due to the favorable climate in the production regions, asparagus yields on average 11.4 tons per ha per year, being among the highest yields in the world [34]. Depending on the region, two to three harvests are possible per year [34].
Despite the long distance between production and consumption of the product, the Peruvian asparagus value chain is highly vertically integrated. Figure 2 presents an overview on the Peruvian asparagus supply chain. It is characterized by modern inputs, latest production, processing and transport technologies and conforms to international quality standards. Most agricultural inputs, such as seeds, agrochemicals and machinery, are imported, while agricultural production and processing takes place in different coastal regions in Peru. After processing, the produce is transported to the Constitutional Province of Callao, from where it is either shipped from the harbor of Callao (99% of all preserved produce in 2011 [32]) or the Jorge Chavez international airport (86% of all fresh produce in 2011 [32]). In 2011 in Peru, there were 131 agro-export companies that sold to international importers; they can be further divided into four categories: (1) Fully vertically integrated export companies with own production and processing (54 companies); (2) Export companies with production but without processing capacities (10 companies); (3) Export companies without own production but processing (13 companies); and (4) Pure trading companies (54 companies). As all exported products are processed, companies that do not own a processing plant but export, rent in capacity from external processing companies. Alternatively, pure producers sell their product to vertically integrated export companies or on the spot market to traders and processors [35]. According to the latest agricultural census in 2012 [36] and our own survey, there are around nearly 3200 asparagus-growing entities that produce but do not export directly. The size of production units varies between 1 and 1600 ha. The largest share of producers (around 80%) grows asparagus on up to 50 ha, 17% cultivate between 6 and 50 ha and 3% more than 50 ha. The size of cultivated asparagus land of only the vertically integrated companies is considerably larger, with an average of around 450 ha; four vertically integrated companies grow asparagus on more than 1000 ha. While the annual number of exporters is relatively constant and fluctuates around 100 companies, a total of 656 companies exported asparagus from Peru between the years 2000 and 2014 [32]. This indicates a large entry and exit of the export market of—mainly trading—companies that easily adapt to temporary market conditions. The number of asparagus importers fluctuates between 350 and 490 over time, with a similar amount of buyers from the US and Europe (169 and 176, respectively, in 2011 [32]).
In Belgium in 2011, there were five main importers of asparagus from Peru. Together, these companies cover more than 80% of Belgian imports and bought 1251 tons of either fresh or preserved asparagus [32]. The majority of the fresh asparagus is flown to the Amsterdam Schiphol airport, while the preserved asparagus is shipped to the ports of Rotterdam or Hamburg. From there, the asparagus is transported by truck to the wholesaler or supermarket central distribution centers in Belgium.

3.2. Case Study Context and Critical Issues

The identification of the critical issues is based on a literature review and stakeholder interviews that were carried out in Peru between 2011 and 2014 (see Section 4.2).

3.2.1. Water Issues

A critical issue associated with the Peruvian asparagus supply chain is the use of scarce water resources for the production of export crops. This is especially crucial when bearing in mind that asparagus production takes place in the Peruvian coastal regions under desert conditions and that asparagus production consumes relatively high amounts of irrigation water. Per ha and year, asparagus producers in Ica need around 14,500 m3 of irrigation water using drip-irrigation techniques and 23,000 m3 using flood irrigation [38]. In Peru in 2012, on 54% of the asparagus land, drip irrigation was used, and on 44% of the land, flood irrigation was applied. The remaining area was irrigated using sprinkler and exudation irrigation [36].
Water-related problems differ between the two largest asparagus production regions. In Ica, irrigation water for asparagus cultivation is mainly pumped from groundwater resources as surface water availability varies strongly with the seasons and irrigation water demand exceeds availability. The heavy reliance on groundwater resources from the local aquifer leads to the decrease of the groundwater table of up to 1.5 m per year on average [39] and, depending on the location, the depth of perforation is deeper than 100 m below the surface [38]. In order to slow down the overexploitation of the aquifer the ANA has prohibited the perforation of new wells and to deepen existing ones [39]. The water stress in Ica has been the subject of critical NGO reports, blaming the asparagus export industry for being responsible for unsustainable water extractions [40]. Besides ecological threats of groundwater overexploitation, water scarcity also has negative economic implications for the agro-export companies themselves because water is the limiting factor of production.
In La Libertad, a large irrigation project named Chavimochic—covering the valleys of Chao, Virú, Moche and Chicama—has been underway since the 1960s. The project brings water from the Santa River to the coastal valleys and has thus been crucial for the transformation of deserts into agricultural lands. However, it has been criticized for mainly benefiting large export companies as opposed to small farmers. Between 1994 and 2006, nearly 44,000 ha of new land were developed, of which nearly 38,000 ha were bought by 11 agro-industrial companies [41].

3.2.2. Labor Relations

Two important laws increased the competitiveness of the agro-export sector by lowering labor costs. First, the “Decree Law 22342” provides non-traditional export companies, including asparagus exporters [42], with flexibility in hiring; it allows an open-ended employment of workers on short-term contracts, as well as the possibility to legally suspend employees if agricultural seasonality requires it. Second, the “Agricultural Sector Promotion Law 27360” establishes a special labor regime for agricultural workers, stipulating lower rights and benefits for workers in export-oriented non-traditional agri-food businesses, including lower wages, contributions to the social security system and reduced annual leave [43].
From a social and ethical perspective, issues related to working conditions and labor welfare in the Peruvian asparagus chain are debated. On the one hand, asparagus production and processing is very labor intensive and provides considerable employment opportunities in the production regions. The two above regulations have contributed to reducing the cost of hiring temporary workers, resulting in an increase in the absolute number of—mainly low-skilled—employees, but also formally registered jobs [44]. This has led to an agricultural wage increase in the export sector, which, according to Cannock [45], are around 30% higher than wages in local agriculture. On the other hand, some stakeholders heavily criticize both above laws because of decreased protection of labor rights in the agro-industry [46]. Wages are said to be still extremely low and often only paid on piece rates. Employment is often temporary and no job security is guaranteed to workers throughout the whole year. Moreover, concerns about bad working conditions and labor right violations such as discrimination against union members, long working hours and dismissal of workers during “seasonal recessions” have been raised, e.g., [47].

3.2.3. Role of Private Standards and Certifications

Private standards started to gain importance in the Peruvian asparagus export sector in the year 2000, and certification to these standards by companies spread rapidly from then on. While until 1998 no export company was certified, certification took off from the year 2000 and, since 2006, the number of companies certified to at least one private standard exceeds that of non-certified companies [37]. These private standards are diverse and include pre-farm gate or production standards as well as post-farm-gate or processing standards. Basic standards focus on quality and safety issues while the more specific standards that emerged towards the end of the 2000s focus on environmental and social issues related to the production, processing and distribution of food. Companies in the sector are often certified to multiple standards, first adopting more basic production and processing standards (such as GAP, GlobalGAP, or HACCP) and later more specific standards related to environmental and labor issues (such as SA8000—see Schuster and Maertens [19]). This has increased the reliability and efficiency of the asparagus supply chain. The fact that the asparagus was produced in Peru is not used as a sales argument in marketing. On the sale label, the origin of the product is indicated, but generally there are no further label specifications for differentiating Peruvian asparagus from asparagus originating in other countries.

3.2.4. Role of Public Policies and Institutions

International cooperation and public policies have played a prominent role in supporting the growth of the Peruvian asparagus sector. In the mid-1980s, asparagus export expanded considerably as a result of a U.S. Agency for International Development (USAID) assistance project in the region of Ica. In the 1990s, multiple government operations under president Fujimori created an institutional framework to increase the competitiveness of the agro-export sector and thus foster economic development [48]. More specifically, institutions and policies were created to facilitate access to land and water resources, improve export infrastructure, increase export quality to meet international standards, enable foreign direct investment and provide cheap labor inputs. Reforms led to the establishment of institutions such as the Promotion Agency of Peru (PROMPERU) in 1993, the Peruvian Export Promotion Agency (PROMPEX) in 1996 [49], the National Agrarian Health Service (SENASA) in 1992 and the Peruvian Institute of Asparagus and Vegetables (IPEH) in 1998. These institutes have significantly supported Peruvian companies in becoming key players in the international market and have acted as an important communication channel for local and foreign government agencies.
Besides these collaborations and initiatives of the agro-industry and the state, specific laws have influenced the asparagus value chain and helped to increase Peru’s comparative advantage. The 1991 “Foreign Investment Promotion Law” led to the equal treatment of foreign and domestic investors and liberalized land markets. This has not only attracted foreign investment but also investors from other Peruvian sectors, such as mining. The “Agricultural Sector Promotional Law 27360”, introduced in 2000 and recently extended until 2021, as well as the “Decree Law 22342”, in place since the 1970s, have reduced the tax burden for agricultural companies and significantly lowered agricultural employment costs (see Section 3.2.2 above). At the international level, free trade agreements (FTAs), especially with the US and the EU, have provided the basis for the tremendous growth of the Peruvian asparagus sector. In early 1991, the Andean Trade Promotion and Drug Eradication Act (ATPDEA) came into force, thereby granting Peruvian asparagus exports tariff-free access to the US market. An FTA was signed with the US in 2006. The EU-Peru FTA was signed in June 2012 and led to the reduction of tariffs for fresh asparagus from 10.2% to 0%. On average, tariffs have been reduced from 66% in July 1990 to 3.4% in 2011 due to unilateral reductions and FTAs [45].

4. Material and Methods

A universally accepted definition of local food does not yet exist. Often, the local-global dichotomy is based on the geographical distance between producer and consumer and the supply chain configuration, such as the number of supply chain steps and the kind of marketing channel, e.g., [4,50,51]. However, the maximum distance at which a product changes from being “local” to being “global” is not clearly defined. In some studies, local food refers to food that has been grown within a country’s boundaries and global food refers to imported products [6,52]. In other cases, “local” food is defined as food that is grown and consumed within a county [8], or that is marketed through a short supply chain, such as a farm shop, a farmers’ market or a CSA (community-supported agriculture) system [4,53]. International sourcing of production inputs for locally produced and consumed products complicates the distinction of “local versus global” [1]. In this article we follow the definition based on national boundaries and distinguish between a local chain including production and consumption of asparagus in Belgium, and a global chain including production of asparagus in Peru and export to Belgium.
The framework of our analysis is formed by five attributes related to the sustainability performance of food supply chains. Each attribute is measured by a set of indicators.

4.1. Sustainability Attributes and Performance Indicators

We consider five attributes related to the social, economic and environmental sustainability of asparagus chains: contribution to economic development, resource use, labor relations, distribution of added value and governance. They were selected from a list of food chain performance attributes elaborated by Kirwan et al. [54]. In their study, the authors synthesized the findings of 12 national reports on the perception of local and global food chain performance in European countries, Senegal, and Peru. For the current study, we have identified the most critical asparagus supply chain issues through literature review and stakeholder interviews in Peru and Belgium and then selected the according sustainability attribute from the list provided by Kirwan et al. [54]. The critical issues described in Section 2.2 and Section 3.2 are water use, labor relations and the role of standards and certifications; they are linked to the attributes resource use, labor relations and governance. The selection of the attributes contribution to economic development and distribution of added value, follows from the fact that Peru is a middle-income country and increasing trade might have considerable development impacts. For each of the five attributes, we have defined a set of indicators to assess and compare the performance of the two asparagus supply chains. Most indicators were adapted from a list of 118 indicators elaborated in the SAFA (Sustainability Assessment of Food and Agriculture systems) Guidelines [55,56]. They provide a holistic framework for the sustainability assessment of food and agricultural supply chains based on four broad dimensions of sustainability: good governance, environmental integrity, economic resilience and social wellbeing. Our analysis includes the following attributes and related performance indicators.
First, the attribute contribution to economic development refers to the contribution that food supply chains can make to economic development at a national, regional and local level. This attribute is especially important when thinking about possible positive development effects of a global food supply chain. The consumption of imported products in Europe can have positive impacts on economic development overseas. At the same time, the consumption of local products supports the local economy. The attribute is represented through four indicators. (i) Regional employment generation indicates the number of full-time equivalent workers employed for field work and processing activities such as cleaning and packaging per ha of asparagus production. It shows how the asparagus chains contribute to local value creation through employment opportunities and, ultimately, wages; (ii) Regional hiring measures the share of farm workers who come from outside the production region. In Belgium, these are workers who come from other countries. In Peru, these are workers that do not come from one of the asparagus-producing departments. Hiring employees from the region where operations are based contributes to sustaining the local economy [56]; (iii) Economic land productivity measures the economic value generated per unit of land use; (iv) Similarly, the indicator economic labor productivity compares the economic value generated per farm worker in the two countries.
Second, the attribute resource use was selected due to its relevance mainly for the Peruvian asparagus sector which relies heavily on scarce water resources. The use of energy, land and labor also fits into the scope of this attribute. Differences in climate and production methods lead to differences in the ecological efficiency of asparagus production in the two countries, making it interesting to assess the overall efficiency of resource use of local and global chains including economic and ecological aspects. The attribute is measured with six indicators. (i) Physical land productivity indicates differences in yields per ha between Belgium and Peru while (ii) physical labor productivity measures the yield per farm worker; (iii) Greenhouse gas emissions related to asparagus transportation are calculated to reflect food miles and carbon emissions of the two chains. The indicators of water use per ton (iv) and per ha (v) measure the volume of consumptive water use through evapotranspiration, i.e., the water footprint of production [57] relative to the yield and the land use, respectively; (vi) Water withdrawal puts the water use of the asparagus sector into context relative to the total water withdrawal of the national agricultural sector.
Third, the attribute labor relations refers to employment relations and working conditions which might differ between Peru and Belgium due to institutional differences. All indicators refer to workers at the farming and processing stage where most employment is generated. (i) The indicator wage level compares workers’ average wage to the local living wage; (ii) Wage payment refers to the percentage of workers who receive at least the domestic minimum wage; (iii) The indicator collective bargaining and association is measured through the percentage of workers who are members of a labor union. It indicates whether workers have the freedom to associate to efficiently negotiate working relations [56]; (iv) The indicator work contract indicates the share of workers who have signed a legally binding work contract and (v) working hours compares actual working time with regular working time on a daily and weekly basis; (vi) The percentage of workers with access to clean sanitary facilities and drinking water is used to quantify decent working conditions.
Fourth, distribution of added value refers to how value is distributed within the food value chain. This is expected to differ between local and global chains mainly due to differences in the number of supply chain actors, their bargaining and market power. The attribute is represented by the indicator revenue distribution which measures the price a farmer receives relative to the price the consumer pays in the supermarket.
Fifth, governance refers to regulation and governance structure and to power and democracy [54]. Public and private standards emerged to address increasing quality and safety requirements of consumers on agricultural products. We see them as a main component of governance as they shape production practices, power relations between supply chain actors, and market access. Whereas public standards are set by public authorities and focus mainly on food safety and quality, private standards are set by private companies and non-public organizations and add environmental and ethical aspects [58]. In the asparagus case, the attribute governance relates especially to private standards, certification and labels in governing food supply chains. Two variants of the indicator certification are calculated. (i) The percentage of certified producers and companies that comply with at least one private standard and (ii) the percentage of certified produce. The more producers are certified, the higher the influence of private standards on supply chain governance.
Table 1 summarizes the indicators per sustainability attribute. We provide a short definition and the data sources used for calculation. In Section 4.2 we describe the data collection methods in detail.

4.2. Data

Qualitative and quantitative data were collected in Peru and Belgium through interviews, surveys and secondary data collection.
First, qualitative unstructured interviews with key respondents and stakeholders involved in the Peruvian and the Belgian asparagus supply chain were carried out. These interviews did not follow a predetermined structure, but were used to get a better understanding of the asparagus sector, the functioning of the supply chains and to identify critical issues. In Peru, fifteen asparagus producers—ranging from a cooperative of small-scale farmers to medium-sized companies and then to the two largest agro-export companies—were visited and interviewed. Different water use organizations, the National Water Authority (ANA) and the Chavimochic project—a huge irrigation project along the Peruvian coast covering more than 140,000 ha—were visited in order to discuss water-related issues such as the overexploitation and distribution of water resources in the agricultural sector. Government officials (e.g., ministry of agriculture and ministry of labor and employment promotion), policy institutes (e.g., IPEH, PROMPERU), logistic operators (e.g., Frio Aereo; transport intermediaries) and researchers were interviewed regarding critical issues of the asparagus supply chain. Different NGOs that support farm workers in the agro-export industry and smallholders were visited. In Belgium, we met with representatives of one large Belgian importer and one Belgian retailer to discuss their asparagus supply chain configuration. In addition, field visits were paid to asparagus farmers in Flanders and to BelOrta—Europe’s largest cooperative auction and the most important auction for Belgian asparagus. We have interviewed a representative of the national farmers’ association responsible for vegetable growers. Interviews and farm visits in Peru took place between January and February 2011, in April 2013 and between February and April 2014. In Belgium, interviews were conducted between May and October 2014. Primary quantitative data were collected together with the qualitative interviews. The quantitative data includes the quantities of inputs used in the production process, prices and time series of cultivated areas.
Second, we use data collected through surveys. In Peru, 95 asparagus export companies were surveyed between July and September 2011. The questionnaires included recall questions on certification to private food standards, on ownership and management structure, on processing and production procedures, and on sourcing and marketing strategies. Moreover, two rounds of a survey among young workers in the horticultural agro-export industry in the regions of Ica and La Libertad were carried out in August/September 2013, and in February/March 2014. In that survey, questions about the workers’ socio-demographic background, economic and employment situation, health, education, overall wellbeing, and employment and working conditions were asked. In the first round, 592 workers were surveyed. In the second round, 528 workers of the original sample could be re-surveyed and 85 additional workers were surveyed only in 2014. In Belgium, a small survey of three Flemish asparagus farms was carried out in September/October 2014 in order to gather information on asparagus production practices, resource use, labor relations, prices and other supply chain characteristics. The large difference in the number of observations is mainly due to large differences in size of asparagus production in Peru and Belgium.
Third, information was collected from a literature and document review and from publicly available trade (Faostat [27]; SUNAT—custom data [32]) and agricultural production databases [36]. There are some previous studies on the Peruvian asparagus sector, mostly focusing on the production and processing stage. There is hardly any literature on the Belgian asparagus sector due to its limited economic importance.
For the attributes labor relations and governance, no detailed quantitative data could be obtained for Belgium. In these cases we have based our estimations on expert interviews and on the assumption that Belgian farmers largely comply with laws and regulations.

5. Results

5.1. Indicators

The main result of our research is a list of indicators to quantify and explore the sustainability performance of the Belgian and the Peruvian asparagus value chains. It is very important to take into account the case study context information when interpreting and comparing indicator values for the two countries. Below, we explain the underlying calculation steps for each indicator. Table 2 summarizes our results.

5.1.1. Regional Employment Generated

The number of workers per ha in Belgium was obtained from farm interviews. In our sample, an average of 1.56 workers/ha are employed for working on the fields and for carrying out processing activities. Given 326 ha of asparagus land this leads to 509 full-time equivalent jobs. In Peru, on average, 1.5 field workers are employed per ha and 18 worker-days are needed to process one ton of asparagus [59]. Given 33,673 ha of asparagus production and 383,144 produced tons from Peru in 2013 [27], 50,510 full-time equivalent field workers and 21,286 full-time equivalent processing plant workers are required. This adds up to a total of 71,796 workers and 2.13 workers per ha.

5.1.2. Regional Hiring

For Belgium, the share of migrant workers on asparagus fields has been estimated at 99% by a representative of the farmers’ union. Migrants in this case are defined as people not having their permanent residence in Belgium. For Peru, migrants are defined as coming from a department other than the asparagus producing department (i.e., Ica or La Libertad) and the information comes from the worker survey.

5.1.3. Economic Land Productivity

Economic land productivity has been estimated for 2013 by multiplying the quantity produced [27] with the producer price [27] and dividing the product by the acreage used for production (Faostat [27] for Peru and Statistics Belgium [26] for Belgium). The producer price has been converted to international USD using the 2013 average annual exchange rate and the PPP conversion rate provided by the World Bank. For Belgium, the farm gate price is 3118.7 USD/ton which results in 2763.43 international USD/ton. For Peru, the producer price of 1130.25 USD/ton converts into 2028.8 international USD/ton.
Belgium: (2800 ton × 2763.43 int’l USD/ton)/326 ha = 23,735 int’l USD/ha
Peru: (383,144 ton × 2028.8 int’l USD/ton)/33,673 ha = 23,084 int’l USD/ha

5.1.4. Economic Labor Productivity

Economic labor productivity has been estimated by multiplying the total annual production with the producer price [27] and dividing the product by the number of field and processing plant workers. It has been calculated for the year 2013 and indicates how much value is generated by one farm and processing worker per year. Costs are not considered. As above, USD have been converted into international USD.
Belgium: (2800 ton × 2763.43 int’l USD/ton)/509 workers = 15,202 int’l USD/worker
Peru: (383,144 ton × 2028.8 int’l USD/ton)/ 71,796 workers = 10,827 int’l USD/worker

5.1.5. Greenhouse Gas Emissions

The calculation of GHG emissions relates only to the transport phase of the asparagus from the producer to a store in Brussels. Peruvian asparagus is transported by truck from the production regions to Lima. Then the asparagus is transported by plane to Amsterdam and then by truck to Brussels. In total, this amounts to 650 km by truck and 10,000 km by plane. For Belgian asparagus we assume transportation by truck from the production region Hamont-Achel to the BelOrta auction in Mechelen and from Mechelen to Brussels. This amounts to 164 km of road transport.
GHG emissions for freight transport by plane and by truck come from the ecoinventv3.0 database in Simapro© (PRé Sustainability, Amersfoort, The Netherlands). Embedded emissions for manufacturing the truck and plane and for the necessary infrastructure are also included in the database. The total impact in kg CO2 equivalents per kg of asparagus was calculated based on the Recipe midpoint method. We multiply the impact in kg CO2 equivalents per ton.kilometer for each transport method (1.1 by airplane and 0.178 by truck) with the transport distance. By summing up the emissions of each transport phase we obtain the total emission of CO2 equivalents: 0.03 for Belgium and 11.12 for Peru. This is in line with a total impact of 12.2 kg CO2 equivalents/kg airfreighted Peruvian asparagus that was calculated by Stoessel et al. [3] including agricultural production.

5.1.6. Physical Land Productivity

Faostat [27] provides worldwide annual yield data by crop and by country (ton/ha). This indicator was directly taken for asparagus yields in Peru and Belgium. The latest data are available for the year 2013.

5.1.7. Physical Labor Productivity

For calculating labor productivity we use production data from Faostat [27] for the year 2013. By dividing production by the total number of full-time equivalent workers calculated for the indicator regional employment generated, we receive the productivity per worker in 2013.
Belgium: 2800 ton/509 workers = 5.5 ton/worker
Peru: 383,144 ton/71,796 workers = 5.34 ton/worker

5.1.8. Water Use

Mekonnen and Hoekstra [57] have estimated the average national and subnational water requirements of a number of different crops and countries. Their estimates include all the water a plant needs for evapotranspiration and are calculated on a 5 arc minutes spatial scale. We take the average national water consumption of asparagus produced in Belgium and Peru. The water use efficiency per ha is calculated by multiplying the efficiency per ton with the yield per ha obtained from Faostat [27].
Belgium: 889 m³/ton × 7.65 ton/ha = 6,801 m³/ha
Peru: 1137 m³/ton × 11.38 ton/ha = 12,939 m³/ha

5.1.9. Water Withdrawal

The water withdrawal has been calculated by multiplying the total asparagus production of 2013 with the average blue water footprint (i.e., the consumption of ground- and surface water) [57]. This volume is then divided by the annual water withdrawal of the national agricultural sector [60]. For Belgium, the latest information is provided for the year 2009 and the volume of water withdrawn by the agricultural sector amounted to 0.04 × 10⁹ m3/year. In Peru, the latest data is for the year 2008 and the volume of water withdrawn amounts to 12.12 × 10⁹ m3/year.
Belgium: (2800 ton × 17.16 m³/ton)/(0.04 × 109 m3) × 100 = 0.12%
Peru: (383,144 ton × 478.48 m³/ton)/(12.12 × 109 m3) × 100 = 1.51%

5.1.10. Wage Level

For Belgium, we assume strong institutional capacity and that the wage level for agricultural workers is hence compliant with the national minimum wage of 851 EUR/ month or 1157 USD/month as we do not have accurate data for this indicator. In Peru, the average monthly wage received by the workers in our sample in Peru is 901 PEN or 317 USD [61].
We divide these values by the respective local living wage for one person in Peru and Belgium as estimated by wageindicator.org for the year 2014 [62]. We take the upper bound estimate of the living wage which is defined as “the monthly net wage needed [to] afford a decent standard of living for the individual worker” in the most expensive part of the country. This is done as the coastal region in Peru is among the most expensive areas in Peru. The living wage includes “cost of food based on local consumption patter[n]s, a monthly rental of an apartment in a non-central area, transportation costs and 10% allowance for other costs (clothing, medical care, education, culture…)”.
Belgium: 1157 USD/month/1006 USD/month = 1.15
Peru: 317 USD/month/159 USD/month = 1.99
A value of one would indicate that the monthly wage covers exactly the living cost.

5.1.11. Wage Payment

For Belgium, we assume that farmers comply with the law and that practically all workers are paid the minimum wage (99%). In Peru, we know from our quantitative worker survey that 77% of our sampled workers are paid at least the national minimum wage of 750 PEN/month or 264 USD/month.

5.1.12. Collective Bargaining and Association

In Belgium, no reliable quantitative information exists for this indicator; yet, there is very little organization among the workers because of the seasonality and high presence of migrants in the sector [29]. For Peru we do not have specific data on asparagus only, but on all horticultural export companies producing a variety of export crops, among which is asparagus. In 2013, five horticultural companies in Ica and three in La Libertad had a trade union, with 328 and 1160 members respectively [63]. This represents less than 1.5% of the total population of horticultural field and processing plant workers. We assume that this percentage is the same for asparagus workers only.

5.1.13. Work Contracts

For Belgium we assume that all farmers comply with the law and thus almost all workers have a work contract (99%). In Peru, we know from our quantitative worker survey that 68% of our sampled workers sign a formal employment contract; one third of the workers thus have no job security at all.

5.1.14. Working Hours and Overtime Payment

For Belgium we do not have detailed information on real working hours and assume that practically all farmers comply with the law. Thus, working time in the asparagus sector does not exceed 11 hours/day and 50 hours/week for seasonal workers. The value for the indicator is set at 99%. In Peru, workers in our sample work for an average of 8.27 hours/day and 49.27 hours/week in either field or processing plant activities. The Peruvian law foresees that employees must not exceed 48 working hours/week, without receiving overtime compensation. While this translates into a maximum of 8 hours per day in the “Common Labour Regime—Law 728,” under the “Agricultural Sector Promotion Law 27360,” weekly working time can be accumulated and overtime is only paid when it exceeds the average working time of 48 hours/week. In 77% of all employment cases in our sample, working hours comply with the 8 hours/day. In 69% of all cases they comply with the average of 48 hours/week.

5.1.15. Decent Working Conditions

In Belgium, due to the high share of GlobalGAP certified farms, it can be assumed that most farmers provide access to toilets and showers as required by the standard. However, we do not have detailed data on this issue. In Peru, data come from the worker survey. The indicator is subdivided into three subcategories indicating the percentage of the workforce at the field and processing level with access to (a) clean drinking water; (b) toilet and (c) shower facilities.

5.1.16. Revenue Distribution

Average annual producer prices for asparagus are provided until 2013 by Faostat [27] and supermarket prices for fresh asparagus were obtained from a Belgian retail company. For Peruvian asparagus, the average supermarket price per kg over 2 years, i.e., from December 2012 until November 2014 is based on average prices for a 200 g box of green asparagus tips (3.84 EUR) and a 500 g bunch of white asparagus (3.72 EUR). The unweighted average price per kg is thus (5 × 3.84 + 2 × 3.72)/2 = 13.32 EUR/kg which we convert to USD using the average annual exchange rate of 2013. This yields 17.69 USD/kg. For Belgian fresh white asparagus, the average prices received for a box of 500 g during the season (April until June) was 4.425 EUR/box in 2013 and 3.328 EUR/box in 2014. The average per kg is thus 7.75 EUR/kg or 10.29 USD/kg.
Belgium: (3.19 USD/kg/10.29 USD/kg) × 100 = 31%
Peru: (1.13 USD/kg/17.69 USD/kg) × 100 = 6.39%

5.1.17. Labels and Certification

The percentage of companies that have at least one certification has been estimated by Schuster and Maertens [37] for Peruvian asparagus agro-export companies. For the year 2011, this was 38% of the companies, out of which 35% are certified to at least one production standard (mostly GlobalGAP) and 25% to at least one processing standard (mostly BRC—British Retail Consortium). Since most of the largest companies are certified, however, 81% of all exported asparagus from Peru is certified in 2011. For Belgium we assume that 99% of farmers are certified as all farmers that are members of an auction (i.e., most asparagus farmers) have to be Vegaplan, GlobalGAP and Flandria certified.

6. Discussion

6.1. Contribution to Economic Development

There are several channels through which asparagus production can foster economic development. We are considering two channels: First, participation in the value chain through farming activities; and second, through employment in the labor market. The absolute development impact through participation of farmers and workers in the asparagus value chain is much larger in Peru compared to the small Belgian sector. Whereas in Peru around 3200 farms were involved in asparagus production in 2012, only 157 farmers cultivated the crop in Belgium. Similarly, we estimate that the Belgian asparagus sector created 509 full-time equivalent jobs per year, whereas in Peru 71,796 jobs were created.
For comparing the relative economic impact of asparagus production we use two indicators: the farm revenue per unit of land use and per agricultural worker. First, economic land productivity measured in international USD is lower in Peru (23,084 int’l USD/ha) compared to Belgium (23,735 int’l USD/ha), indicating that Belgian asparagus farmers generate nearly 700 USD more per ha than their Peruvian counterparts. However, asparagus cultivation in Peru generally provides a higher added value per ha than the production of crops for the national market [64]. Second, economic labor productivity measured in international USD is around 4400 USD higher in Belgium (15,202 int’l USD/worker) compared to Peru (10,827 int’l USD/worker). Differences in these two indicators may be due to differences in the average producer price received by Belgian and Peruvian farmers which is around 700 international USD/ton higher in Belgium than in Peru. The better performance of the Belgian asparagus sector regarding land and labor productivity might change when also considering the cost of production in the two countries. For instance, labor costs are more than three times higher in Belgium, where farm workers are paid around 10 international USD/hour whereas Peruvian workers receive 3 international USD/hour [65].
The economic development through labor market effects is assessed through two indicators. First, the number of field and processing plant workers per ha proxies the employment impact of the sector. We estimate that in Peru, 2.13 full-time equivalent workers are needed per ha of asparagus production and in Belgium 1.5 workers/ha. This can be attributed to the large number of workers needed for post-harvest activities in Peru. Second, the share of migrant workers in the asparagus sector indicates the impact on regional employment creation. In Belgium, nearly all workers come from other countries. In Peru, the regional employment effect is larger as more than half of the workers come from the production area; the other half of the workers come from outside the production regions and migrate to the coastal areas to work in the horticultural sector. One has to be careful when interpreting these results, as employment generation in the asparagus sector is very seasonal, providing work for up to 3 months per year in Belgium and up to 5–6 months per year in Peru.
In summary, we find that asparagus production has a higher impact on employment creation in Peru but generates less revenue per ha and per worker. This can be linked to the policy environment in Peru which has been created to increase the competitiveness of the non-traditional export sector.

6.2. Resource Use

The attribute resource use is represented by six indicators. We find a huge difference in GHG emissions per kg of asparagus that can be attributed to the distance and the mode of transportation. Whereas Belgian asparagus is transported within Belgium by truck which emits 0.03 CO2-eq./kg, Peruvian asparagus travels around 10,000 km by plane and emits 11.12 CO2-eq./kg. This result is comparable to the findings of Stoessel et al. [3] who have calculated carbon emissions of asparagus supply chains from cradle-to-gate. When comparing land and labor productivity, the Peruvian supply chain has much higher yields (11.38 ton/ha compared to 7.65 ton/ha in Belgium). This can be due to the fact that in Peru up to two harvests are possible per year which increases the physical land productivity for asparagus production. Despite differences in yields, the difference in physical labor productivity between the two countries is very small, between 5.34 and 5.5 tons per full-time equivalent worker. This is related to the considerably higher number of workers per ha in Peru which compensates for the yield advantage. Regarding the use of water resources, asparagus cultivation in Peru requires much more water than production in Belgium due to differences in climate. In Peru, asparagus cultivation takes place in desert areas with very little rainfall. The difference in consumptive water use per ton of asparagus amounts to nearly 250 m³ between the two countries. Bearing in mind the water problems in the Peruvian production areas and the relatively high water needs of asparagus, asparagus cultivation is not beneficial from an environmental point of view. Also when considering the economic value that can be generated per unit of water input we find that Peru has both a higher water input and a lower land productivity than Belgium, leading to a lower economic water efficiency of Peruvian asparagus [66]. Per ha, Peruvian asparagus consumes 12,939 m3 of water, nearly twice the volume of Belgian asparagus (6801 m3/ha). The last indicator belonging to the attribute resource use compares the irrigation water use for asparagus production to the total water withdrawal of the agricultural sector. In Peru, this amounts to 1.49%, whereas in Belgium this only represents 0.12%. This percentage is more than twelve times higher in Peru due to the size of the asparagus sector.
Generally, we find that the Peruvian asparagus sector is more resource intensive with regards to inputs but also output. More water is used per ha and per ton, but also yields are nearly 50% higher. Moreover, Peruvian asparagus imports are associated with a much higher impact on GHG emissions than local asparagus due to airfreight.

6.3. Labor Relations

Regarding labor relations in asparagus production we can compare the performance of the Belgian and Peruvian asparagus chains based on five indicators. In most cases, the Belgian chain performs better, e.g., regarding the payment of the minimum wage, providing legal work contracts and the compliance of working hours with national standards. However, it is important to keep in mind that the indicator values for Belgium are based on assumptions as no detailed data are available on labor relations. When comparing the wage level of asparagus workers to the local living wage, the Peruvian chain performs better. The wage workers receive is nearly twice as high as the local living wage whereas in Belgium, the wage is only slightly above the living wage. By interpreting these data, it is important to consider that in Peru, employment in the horticultural export sector is unstable and workers generally do not work all year round (6.7 months/year [19]). Workers are possibly unemployed outside the main production season, as employment alternatives to the agroindustry are rare in the main agricultural export regions. When looking at the total salary a person received from the agro-industrial employment in one year, the number of employed people per household (1.92 on average; worker survey 2013/2014) and the total household size (4.3 household members on average; worker survey 2013/2014), we find that 28% of the sampled households would fall below the poverty line of 118 USD/person/month (Peruvian National Institute of Statistics and Information’s estimation for the coastal area in 2013—INEI) and 56% below the living wage line of 159 USD/person/month [62] if they were only relying on their agro-industrial employment. Finally, despite the large number of employees and the relatively high formality of the sector, in both chains, the percentage of workers who are members of a labor union is extremely low, indicating that workers are poorly organized. This is mainly due to the fact that there are hardly any permanent workers in asparagus production which makes it difficult to organize, as well as to a historical disapproval of labor unions in Peru [19].

6.4. Distribution of Added Value

For assessing the distribution of added value we have calculated an indicator called revenue distribution. On average, a Peruvian farmer only receives around 6% of the price the consumer pays for fresh asparagus, whereas a Belgian farmer receives 31%, nearly 5 times more. Thus, although the average supermarket price of Peruvian asparagus is higher than the price of Belgian asparagus (13.32 EUR/kg vs. 7.75 EUR/kg), Peruvian farmers receive a much lower share than their Belgian counterparts. There are many possible reasons for these differences. First, there may be differences in product attributes and in the type of processing. Peruvian asparagus is mainly green and Belgian asparagus is mostly white. Moreover, Peruvian asparagus is often further processed, whereas Belgian asparagus is mainly sold fresh. This can lead to price differences along the production chain and to lower average farm gate prices in Peru. Second, Peruvian producers might sell their produce in much higher quantities than Belgian farmers, leading to a lower price per unit. Third, the global Peruvian asparagus supply chain involves more actors than the Belgian chain and the final sales price needs to be shared between more actors. Lastly, distance and means of transportation differ between the two supply chains, leading to differences in transportation costs. Especially air transportation is expensive; it has been estimated that airfreight costs account for 38% of the final price of fresh asparagus exported from Peru to the United States [48].

6.5. Governance

The attribute governance is represented by two indicators: the percentage of producers or export companies that are certified or have a food label, and the percentage of total certified produce. In the Belgian chain we assume that nearly all producers are certified. In Peru, nearly 40 percent of the agro-export companies comply with at least one certification scheme. This percentage is thus much lower in Peru than in the Belgian chain. Yet, since all largest producers and exporters in Peru are usually certified, the gap between Peru and Belgium is considerably smaller when looking at the total volumes that are certified in both countries (respectively 99% and 81%). Over time, the certification to private standards in Peru has been steadily increasing, in terms of the number of certified companies [35], as well as the variety of standards [19]. We expect this trend to continue and Peru to catch up with the Belgian values for these two indicators.

7. Conclusions

In this article we have explored the sustainability of local and global asparagus chains. We have done this by describing and analyzing two supply chains of Belgian and Peruvian asparagus in depth. We have calculated a set of indicators to compare different aspects of the two supply chains covering environmental, economic, and social sustainability dimensions.
Our results show that trade-offs occur especially between employment generation and resource use, and between employment generation and economic productivity. Concerning the first trade-off, we find that the Peruvian asparagus value chain is more resource intensive than the Belgian chain regarding inputs of labor and water and physical output. More employment and higher yields are generated per ha, but asparagus production in Peru also consumes nearly twice the amount of water through evapotranspiration. This is especially critical against the background of debated labor laws and water-related problems in the production regions. In absolute terms, the sector still plays an important role in the national economy and for employment generation. Concerning the second trade-off, we find that the Belgian chain generates more revenue per ha and per worker and Belgian farmers receive a much higher share of the supermarket price compared to their Peruvian counterparts. Thus, the local economic impact per unit of asparagus is higher in Belgium. However, Belgian asparagus can only be supplied during a very short season of around three months whereas Peruvian asparagus is a year-round business.
These trade-offs imply that neither of the two asparagus supply chains is superior to the other when taking different sustainability attributes into account. This challenges the presumption that global food supply chains are generally less sustainable than local chains, as intrinsically present in the concepts of “food miles”, “think global, eat local”, “short food chains”, “local food systems” and “local food movements”. Global food value chains can, for example, have important development impacts through employment generation. On the other hand, increasing imports might lead to the outsourcing of environmental problems, such as the water problems in the Peruvian case. These trade-offs are case-specific and make it very difficult for consumers to make deliberate and well-informed decisions on food purchases. One solution to this dilemma could be more complete food labels, including information on several sustainability dimensions, as suggested by Vlaeminck et al. [67]. Further research on the capability of labels to provide comprehensive sustainability information—e.g., based on the indicators developed and used in this study—to consumers, and the costs involved in such a strategy is required.
The multi-method approach to cross-dimensional sustainability assessment applied in this study has proven valuable for comparing two greatly differing supply chains and to identify trade-offs. Further research could explore multi-criteria approaches based on the participatory selection and weighting of sustainability attributes and indicators. We acknowledge that most of the indicators used in this study focus on the agricultural production stage and do not capture effects along the whole supply chain. This is mainly due to data availability but also reflects that the largest environmental and social impacts are linked to farm and processing activities. Another limitation of the study is that we had to make many assumptions for the Belgian case study as there is very little data available on the asparagus sector, especially on issues related to labor relations. Many of these estimations are based on the assumptions of strong institutional capacity and farmers’ behavior conforming to the law. Although most farm workers are migrants in a more vulnerable position than local workers, we nonetheless assume that breaking of the law is an exception in Belgium. Wherever possible we have based our assumptions on expert interviews and trust that they are good approximations that do not challenge our findings.

Acknowledgments

The research leading to these results has received funding from the European Union’s Seventh Framework Programme for research, technological development and demonstration under grant agreement No. 311778. We also gratefully acknowledge scholarship funding from the FWO—Research Foundation Flanders and South Mobility Travel Grants from the KU Leuven International Office. We thank two anonymous reviewers for valuable comments on a previous version of this article.

Author Contributions

Jana Schwarz, Monica Schuster, Miet Maertens and Erik Mathijs designed the research. Jana Schwarz and Monica Schuster collected data in Peru and Monica Schuster conducted the worker survey. Bernd Annaert collected data in Belgium. Monica Schuster, Jana Schwarz and Bernd Annaert calculated the indicators. Jana Schwarz, Monica Schuster, Miet Maertens and Erik Mathijs interpreted the results and Jana Schwarz and Monica Schuster wrote the article.

Conflicts of Interest

The authors declare no conflict of interest.

References and Notes

  1. Feldmann, C.; Hamm, U. Consumers’ perceptions and preferences for local food: A review. Food Qual. Preference 2015, 40, 152–164. [Google Scholar] [CrossRef]
  2. Meas, T.; Hu, W.; Batte, M.T.; Woods, T.A.; Ernst, S. Substitutes or complements? Consumer preference for local and organic food attribute. Am. J. Agric. Econ. 2015, 97, 1044–1071. [Google Scholar] [CrossRef]
  3. Stoessel, F.; Juraske, R.; Pfister, S.; Hellweg, S. Life cycle inventory and carbon and water foodprint of fruits and vegetables. Application to a Swiss retailer. Environ. Sci. Technol. 2012, 46, 3253–3262. [Google Scholar] [CrossRef] [PubMed]
  4. Van Hauwermeiren, A.; Coene, H.; Engelen, G.; Mathijs, E. Energy lifecycle inputs in food systems: A comparison of local versus mainstream cases. J. Environ. Policy Plan. 2007, 9, 31–51. [Google Scholar] [CrossRef]
  5. Edwards-Jones, G. Does eating local food reduce the environmental impact of food production and enhance consumer health? Proc. Nutr. Soc. 2010, 69, 582–591. [Google Scholar] [CrossRef] [PubMed]
  6. i Canals, L.M.; Cowell, S.J.; Sim, S.; Basson, L. Comparing domestic versus imported apples: A focus on energy use. Environ. Sci. Pollut. Res. Int. 2007, 14, 338–344. [Google Scholar] [CrossRef]
  7. Avetisyan, M.; Hertel, T.; Sampson, G. Is local food more environmentally friendly? The GHG emissions impacts of consuming imported versus domestically produced food. Environ. Resour. Econ. 2014, 58, 415–462. [Google Scholar] [CrossRef]
  8. Swenson, D. Selected Measures of the Economic Value of Increased Fruit and Vegetable Production and Consumption in the Upper Midwest; Leopold Centre for Sustainable Agriculture: Ames, IA, USA, 2010. [Google Scholar]
  9. Hughes, D.W.; Brown, C.; Miller, S.; McConnel, T. Evaluating the economic impact of farmers’ markets using an opportunity cost framework. J. Agric. Appl. Econ. 2008, 40, 253–265. [Google Scholar] [CrossRef]
  10. Ballingall, J.; Winchester, N. Food miles. Starving the poor? World Econ. 2010, 33, 1201–1217. [Google Scholar] [CrossRef]
  11. Dollar, D.; Kraay, A. Trade, growth, and poverty. Econ. J. 2004, 114, 22–39. [Google Scholar] [CrossRef]
  12. Maertens, M.; Swinnen, J. Trade, standards, and poverty: Evidence from Senegal. World Dev. 2009, 37, 161–178. [Google Scholar] [CrossRef]
  13. Maertens, M.; Colen, L.; Swinnen, J. Globalisation and poverty in Senegal: A worst case scenario? Eur. Rev. Agric. Econ. 2011, 38, 31–54. [Google Scholar] [CrossRef]
  14. Asfaw, S.; Mithöfer, D.; Waibel, H. EU food safety standards, pesticide use and farm-level productivity: The case of high-value crops in Kenya. J. Agric. Econ. 2009, 60, 645–667. [Google Scholar] [CrossRef]
  15. Dedehouanou, S.; Maertens, M.; Swinnen, J. Does contracting make farmers happy? Evidence from Senegal. Rev. Income Wealth 2013, 59, 138–160. [Google Scholar] [CrossRef]
  16. Maertens, M.; Verhofstadt, E. Horticultural exports, female wage employment and primary school enrolment: Theory and evidence from Senegal. Food Policy 2013, 43, 118–131. [Google Scholar] [CrossRef]
  17. Bellemare, M.F.; Novak, L. Contract Farming and Food Security; MPRA Paper No. 65817; University of Minnesota: Minneapolis- Saint Paul, MN, USA, 2015. [Google Scholar]
  18. Van den Broeck, G.; Maertens, M. Female Employment Reduces Fertility in Rural Senegal. PLoS ONE 2015, 10. [Google Scholar] [CrossRef]
  19. Schuster, M.; Maertens, M. Do private standards benefit workers in horticultural export chains in Peru? J. Clean. Prod. 2016, 112, 2392–2406. [Google Scholar] [CrossRef]
  20. Barrientos, S.; Mayer, F.; Pickles, J.; Posthuma, A. Decent work in global production networks: Framing the policy debate. Int. Labour Rev. 2011, 150, 297–317. [Google Scholar] [CrossRef]
  21. Selwyn, B. Social upgrading and labour in global production networks: A critique and an alternative conception. Compet. Chang. 2013, 17, 75–90. [Google Scholar] [CrossRef]
  22. Asfaw, S.; Mithöfer, D.; Waibel, H. What impact are EU supermarket standards having on developing countries’ export of high-value horticultural products? Evidence from Kenya. J. Int. Food Agribus. Market. 2010, 22, 252–276. [Google Scholar] [CrossRef]
  23. Handschuch, C.; Wollni, M.; Villalobos, P. Adoption of food safety and quality standards among Chilean raspberry producers—Do smallholders benefit? Food Policy 2013, 40, 64–73. [Google Scholar] [CrossRef]
  24. Macias, T. Working toward a just, equitable, and local food system: The social impact of community based agriculture. Soc. Sci. Q. 2008, 89, 1086–1101. [Google Scholar] [CrossRef]
  25. Peano, C.; Tecco, N.; Dansero, E.; Girgenti, V.; Sottile, F. Evaluating the sustainability in complex agri-food systems: The SAEMETH framework. Sustainability 2015, 7, 6721–6741. [Google Scholar] [CrossRef]
  26. Statistics Belgium Personal Correspondence. 2014.
  27. Faostat Database. Available online: http://faostat3.fao.org (accessed on 30 November 2015).
  28. Anonymous. BelOrta, Sint-Katelijne-Waver, Belgium. Personal Communication, 2014. [Google Scholar]
  29. Anonymous. Boerenbond, Leuven, Belgium. Personal Communication, 2014. [Google Scholar]
  30. GlobalGAP Online Certificate Validation Tool. Available online: https://database.GlobalGAP.org/GlobalGAP/search/Certificate_V4.faces?cert=529771&lang=en (accessed on 15 October 2014).
  31. BelOrta. 2014. Available online: www.belorta.be (accessed on 15 October 2014).
  32. SUNAT—Superintendencia Nacional de Aduanas y de Administración Tributaria. Database. Available online: http://www.sunat.gob.pe/ (accessed on 20 December 2015). (In Spanish)
  33. Benson, B.L. 2009 Update of the World’s Asparagus Production Areas, Spear Utilization and Production Periods. Acta Hortic. 2012, 950, 87–100. [Google Scholar] [CrossRef]
  34. O’Brien, T.M.; Díaz Rodríguez, A. Improving Competitiveness and Market Access for Agricultural Exports through the Development and Application of Food Safety and Quality Standards: The Example of Peruvian asparagus; Inter-American Institute for Cooperation on Agriculture (IICA): Coronado, Costa Rica, 2004. [Google Scholar]
  35. Schuster, M.; Maertens, M. Do Private Standards Create Exclusive Supply Chains? New Evidence from the Peruvian Asparagus Export Sector. Food Policy 2013, 43, 291–305. [Google Scholar] [CrossRef]
  36. INEI—Instituto Nacional de Estadística e Informática, IV Censo Nacional Agropecuario. 2012. Available online: http://www.inei.gob.pe/estadisticas/censos/ (accessed on 4 April 2016). (In Spanish)
  37. Schuster, M.; Maertens, M. The Impact of Private Food Standards on Developing Countries’ Export Performance: An Analysis of Asparagus Firms in Peru. World Dev. 2015, 66, 208–221. [Google Scholar] [CrossRef]
  38. MINAGRI—Ministerio de Agricultura y Riego. Plan de Gestión de los Acuíferos del Valle de Ica y Pampas de Villacurí y Lanchas. Programa N° 03—Disminución de los volúmenes de explotación; MINAGRI: Ica, Peru, 2015. (In Spanish) [Google Scholar]
  39. ANA—Autoridad Nacional del agua. Plan de Gestión de los Acuíferos del Valle de Ica y Pampas de Villacurí y Lanchas; Dirección de Conservación y Planeamiento de Recursos Hídricos: Lima, Peru, 2012. (In Spanish) [Google Scholar]
  40. Hepworth, N.D.; Postigo, J.C.; Guemes Delgado, B.; Kjell, P. Drop by Drop. Understanding the Impacts of the UK’s Water Footprint through a Case Study of Peruvian asparagus; Progressio, CEPES and Water Witness International: London, UK, 2010. [Google Scholar]
  41. Burneo, Z. The Process of Land Concentration in Peru. 2011. Available online: http://www.landcoalition.org/sites/default/files/documents/resources/PERU_ENG_web_21.06.11%202.pdf (accessed on 5 April 2016).
  42. Other non-traditional export sectors include some agriculture, livestock and textile products, but also fishing, wood and paper, chemical, metallurgic and non-metallic mining products.
  43. PLADES-Programa Laboral de Desarollo. Régimen Laboral Agrario. Marco Normativo y Situación de los Trabajadores; Programa Laboral de Desarrollo: Lima, Peru, 2012. (In Spanish) [Google Scholar]
  44. Chacaltana, J. El Boom del Empleo en Ica. Desafiando al Desierto: Realidad y Perspectivas del Empleo en Ica; Chacaltana, J., Ed.; CEDEP: Lima, Peru, 2007. (In Spanish) [Google Scholar]
  45. Cannock, G. Peru and China as Competitors in World Markets: The Asparagus Case. Presentation Prepared for the FAO Workshop on Agricultural Trade Linkages between Latin America and China, FAO Rome, Italy, 2011. Available online: http://www.fao.org/fileadmin/templates/tci/pdf/presentations/Geoffrey_Cannock_-Asparragus.pdf (accessed on 5 April 2016).
  46. Ferm, N. Non-traditional agricultural export industries: Conditions for women workers in Colombia and Peru. Gend. Dev. 2008, 16, 13–26. [Google Scholar] [CrossRef]
  47. USLEAP. 2013. Available online: http://www.usleap.org/articles/world%E2%80%99s-leading-asparagus-company-violates-worker-rights-says-peruvian-union (accessed on 24 September 2014).
  48. Díaz Rios, L. Agro-Industries Characterization and Appraisal: Asparagus in Peru; Agricultural Management, Marketing and Finance Working Document 23; Food and Agriculture Organization of the United Nations: Rome, Italy, 2007. [Google Scholar]
  49. PROMPEX was merged with PROMPERU in 2007.
  50. Galli, F.; Bartolini, F.; Brunori, G.; Colombo, L.; Gava, O.; Grando, S.; Marescotti, A. Sustainability assessment of food supply chains: And application to local and global bread in Italy. Agric. Food Econ. 2015, 3, 1–17. [Google Scholar] [CrossRef]
  51. Taillie, L.; Jaacks, L. Toward a just, nutritious, and sustainable food system: The false dichotomy of localism versus supercenterism. J. Nutr. 2015, 145, 1380–1385. [Google Scholar] [CrossRef] [PubMed]
  52. Blanke, M.M.; Burdick, B. Food (miles) for thought—Energy balance for locally-grown versus imported apple fruit. Environ. Sci. Pollut. Res. Int. 2015, 12, 125–127. [Google Scholar] [CrossRef]
  53. Kneafsey, M.; Venn, L.; Schmutz, U.; Balázs, B.; Trenchard, L.; Eyden-Wood, T.; Bos, E.; Sutton, G.; Blackett, M. Short Food Supply Chains and Local Food Systems in the EU: A state of Play of Their Socio-Economic Characteristics; JRC Scientific and Policy Reports No. EUR 25911 EN; European Comission Joint Research Centre: Sevilla, Spain, 2013. [Google Scholar]
  54. Kirwan, J.; Maye, D.; Bundhoo, D.; Keech, D.; Brunori, G. GLAMUR WP2—Scoping/Framing General Comparative Report on Food Chain Performance (Deliverable 2.3); Countryside and Community Research Institute, University of Gloucestershire: Gloucester, UK, 2014. [Google Scholar]
  55. FAO. SAFA—Sustainability Assessment of Food and Agriculture Systems. Guidelines; Version 3.0; Food and Agriculture Organization of the United Nations: Rome, Italy, 2013. [Google Scholar]
  56. FAO. SAFA—Sustainability Assessment of Food and Agriculture Systems. Indicators; Food and Agriculture Organization of the United Nations: Rome, Italy, 2013. [Google Scholar]
  57. Mekonnen, M.M.; Hoekstra, A.Y. The Green, Blue and Grey Water Footprint of Crops and Derived Crop Products; Value of Water Research Report Series No. 47; UNESCO-IHE: Delft, The Netherlands, 2010. [Google Scholar]
  58. Henson, S.; Humphrey, J. Understanding the complexities of private standards in global agri-food chains as they impact developing countries. J. Dev. Stud. 2010, 46, 1628–1646. [Google Scholar] [CrossRef] [PubMed]
  59. Danper. Informe de Gestión Ambiental y Social—IGAS. Available online: http://idbdocs.iadb.org/wsdocs/getdocument.aspx?docnum=38351218 (accessed on 11 December 2014). (In Spanish)
  60. Aquastat. Main Country Database. Available online: http://www.fao.org/nr/water/aquastat/data/query/index.html?lang=en (accessed on 9 February 2015).
  61. The conversion of EUR to PEN is based on the average exchange rate between August 2013 and April 2014, the period of the worker survey (oanda.com).
  62. Wage Indicator Foundation. Available online: http://www.wageindicator.org/main (accessed on 5 April 2016).
  63. Anonymous. FENTAGRO—Federacion Nacional de Trabajadores de la Agroindustria y Afines, Lima, Peru. Personal Communication, 2013. [Google Scholar]
  64. Schwarz, J.; Maertens, M.; Mathijs, E. Globalization and the Sustainable Exploitation of Scarce Groundwater Resources in Peru; KU Leuven: Leuven, Belgium, 2011. [Google Scholar]
  65. Calculations based on average hourly wages from farm surveys (8.5 EUR in Belgium and 4.64 PEN in Peru).
  66. Schwarz, J.; Mathijs, E.; Maertens, M. Changing patterns of global agri-food trade and the economic efficiency of virtual water flows. Sustainability 2015, 7, 5542–5563. [Google Scholar] [CrossRef]
  67. Vlaeminck, P.; Jiang, T.; Vranken, L. Food labelling and eco-friendly consumption: Experimental evidence from a Belgian supermarket. Ecol. Econ. 2014, 108, 180–190. [Google Scholar] [CrossRef]
Figure 1. Belgian asparagus value chain (Source: Data on producers: Statistics Belgium [26].)
Sustainability 08 00344 g001
Figure 2. Peruvian asparagus value chain (Sources: Data on farmers: INEI [36]; Data on exporters and importers: SUNAT [32]; Subdivision of exporters into vertically integrated, only producing, only processing company or trader: company survey by Schuster and Maertens [35,37]).
Sustainability 08 00344 g002
Table 1. Indicator definition and data sources.
Indicator NameDefinitionData Source
PeruBelgium
Contribution to economic development
Regional hiring% of migrant workersWorker surveyFarm survey
Regional employment generatedNumber of field and processing workers per haDanper [59]Farm survey
Economic land productivity(Yield × farm gate price)/acreageFaostatFaostat/Statistics Belgium
Economic labor productivity(Yield × farm gate price)/farm workerFaostat
Resource use
GHG emissionsGHG emissions related to transportationEcoinvent
Physical land productivityYield/acreageFaostat
Physical labor productivityYield/workerFaostat
Water use (per ton)Consumptive water use through evapotranspiration (water footprint) per tonMekonnen and Hoekstra [57]
Water use (per ha)Consumptive water use through evapotranspiration (water footprint) per haMekonnen and Hoekstra [57]
Water withdrawal% of water used of asparagus sector (blue water footprint)/ total agricultural water withdrawalMekonnen and Hoekstra [57]/Aquastat
Labor relations
Wage levelWorkers wage level/local living wageWorker surveyEst.
Wage payment% workers who receive at least minimum wageWorker surveyEst.
Collective bargaining and association% of workers being member of a labor unionWorker surveyEst.
Work contract% of workers having signed a legally binding work contractWorker surveyEst.
Working hours% of workers whose working hours are within regular work day and weekWorker surveyEst.
Decent working conditions% of workforce with access to clean sanitary facilities and drinking waterWorker surveyn.a.
Distribution of added value
Revenue distributionFarm gate price/supermarket priceFaostat/retailer
Governance
Certification (producer)% of producers/ export companies being certifiedCompany surveyEst.
Certification (produce)% of produce certifiedCompany surveyEst.
n.a.—no data available, Est.—own estimation.
Table 2. Performance indicators for Peru and Belgium.
Indicator NameDefinitionUnitValue
PeruBelgium
Contribution to economic development
Regional employment generatedNumber of field and processing workers per hafull-time equivalen/ha2.131.56
Regional hiring% of migrant workers%4899
Economic land productivity(Yield × farm gate price)/acreageInt’l USD/ha23,08423,735
Economic labor productivity(Yield × farm gate price)/farm workerInt’l USD/full-time equivalent10,82715,202
Resource use
GHG emissionsGHG emissions related to transportationCO2 eq./kg11.120.03
Physical land productivityYield/acreageton/ha11.387.65
Physical labor productivityYield/workerton/full-time equivalent5.345.5
Water use (per ton)Consumptive water use through evapotranspiration (water footprint) per tonm3/ton1137889
Water use (per ha)consumptive water use through evapotranspiration (water footprint) per ham3/ha12,9396801
Water withdrawal% of water used by asparagus sector (blue water footprint)/total agricultural water withdrawal%1.510.12
Labor relations
Wage levelwage level/local living wageshare1.991.15
Wage payment% workers who receive at least minimum wage%7799
Collective bargaining and association% of workers being member of a labor union%<1.5very low
Work contract% of workers having signed a legally binding work contract%6899
Working hours% of workers whose working hours are within regular work day and week%6999
Decent working conditions% of workforce with access to clean sanitary facilities and drinking water% n.a.
(a) Drinking water%79n.a.
(b) Toilet%94n.a.
(c) Shower%64n.a.
Distribution of added value
Revenue distributionFarm gate price/supermarket price%6.3931
Governance
Certification (producer)% of producers/export companies being certified%3899
Certification (produce)% of produce certified%8199
n.a.—no data available.

