Article

Engineering Behavior and Characteristics of Water-Soluble Polymers: Implication on Soil Remediation and Enhanced Oil Recovery

1
Department of Civil and Environmental Engineering, Louisiana State University, Baton Rouge, LA 70803, USA
2
Department of Civil, Architectural and Environmental Engineering, Missouri University of Science and Technology, Rolla, MO 65409, USA
3
Department of Civil and Environmental Engineering, Incheon National University, Incheon 22012, Korea
4
Incheon Disaster Prevention Research Center, Incheon National University, Incheon 22012, Korea
5
Department of Civil and Environmental Engineering, Louisiana State University, Baton Rouge, LA 70803, USA
*
Author to whom correspondence should be addressed.
These authors contributed equally to this work.
Sustainability 2016, 8(3), 205; https://doi.org/10.3390/su8030205
Submission received: 5 October 2015 / Revised: 5 February 2016 / Accepted: 19 February 2016 / Published: 25 February 2016

Abstract

:
Biopolymers have shown a great effect in enhanced oil recovery because of the improvement of water-flood performance by mobility control, as well as having been considered for oil contaminated-soil remediation thanks to their mobility control and water-flood performance. This study focused on the wettability analysis of biopolymers such as chitosan (85% deacetylated power), PEO (polyethylene oxide), Xanthan (xanthan gum), SA (Alginic Acid Sodium Salt), and PAA (polyacrylic acid), including the measurements of contact angles, interfacial tension, and viscosity. Furthermore, a micromodel study was conducted to explore pore-scale displacement phenomena during biopolymer injection into the pores. The contact angles of biopolymer solutions are higher on silica surfaces submerged in decane than at atmospheric conditions. While interfacial tensions of the biopolymer solutions have a relatively small range of 25 to 39 mN/m, the viscosities of biopolymer solutions have a wide range, 0.002 to 0.4 Pa·s, that dramatically affect both the capillary number and viscosity number. Both contact angles and interfacial tension have effects on the capillary entry pressure that increases along with an applied effective stress by overburden pressure in sediments. Additionally, a high injection rate of biopolymer solutions into the pores illustrates a high level of displacement ratio. Thus, oil-contaminated soil remediation and enhanced oil recovery should be operated in cost-efficient ways considering the injection rates and capillary entry pressure.

1. Introduction

Recently, organic agents such as polymers, biopolymers, and surfactants have been developed for soil improvement and have demonstrated their abilities to improve the shear strength, stiffness, soil remediation, and erosion resistance of geomaterials [1,2,3,4,5,6,7,8,9]. Furthermore, biopolymers, such as polyacrylamide (PAM) and xanthan gum, have shown a great effect in enhanced oil recovery (EOR) thanks to its mobility control in EOR that improves water-flood performance [10,11,12]. Thus, water flooding by biopolymers and polymers has become a superior method in enhancing the oil recovery according to laboratory and field tests [13,14,15]. Additionally, biopolymers have been considered for oil-contaminated soil remediation thanks to their mobility control and water flood performance [16,17,18,19]. However, engineering behavior and characteristic of biopolymers have yet to be well recognized. Thus, in order to improve the capacity of biopolymers for oil-contaminated soil remediation and enhanced oil recovery (EOR), we explored the wettability of biopolymers, including contact angle, surface tension, interfacial tension, and viscosity that influences on capillary pressure, biopolymer solution flow, and biopolymer solutions–oil displacement in porous media. Additionally, the micromodel study was intended to understand the flow behavior of biopolymer solutions and biopolymer solutions–oil displacement in porous media.

2. Literature Review

2.1. Utilization of Biopolymer in Soil Remediation and Enhanced Oil Recovery

Soil contamination in urban and rural environments is usually caused by industrial activities, such as mining wastes, dumping and landfill settlement, or quarries [20]. Important characteristics and remediation techniques have been developed over the years to deal with soil contamination [21]. Various technologies are under development for remediation of soils and sediments [22]. For instance, soil remediation technologies, such as soil excavation, soil vapor extraction, bioremediation, and steam injection are basic methods used for soil remediation for years [23,24,25,26]. Due to the limitation in soil excavation, including high cost and lack of available landfill sites [22,23,24,25,26,27], flushing and bioremediation methods that do not require the soil excavation have become more popular recently [22]. For example, the surfactant flush has been used to improve the rate of soil remediation [22]. Recently, more suitable eco-friendly soil remediation methods have been required. Thus, application of bio-surfactant and biopolymers could provide the sustainability because they are mainly obtained from plants containing eco-friendly properties [28,29,30,31]. Biopolymer flushing was originally developed for petroleum recovery areas which, afterwards, had been used for the remediation of petroleum waste-contaminated sites [32,33,34,35,36,37,38]. Biopolymers are biologically-available compounds that could be obtained using the basic principles of lowering the mobility ratio and increasing the capillary number of fluids [39,40]. They aim to increase the viscosity and the mobility and to reduce the interfacial tension to enhance contamination recovery and accelerate contamination mobilization [41].
A large portion of the world’s oil reserves still have low permeability. Thus, enhanced oil recovery (EOR) technology has been used for exploitation [42]. Polymer solutions have been used to improve the water-flood performance in enhanced oil recovery (EOR) for 70 years [13]. In general, two types of polymers could be applied to reservoir application, which are synthetic polymers and biopolymers [43,44,45]. While synthetic polymers are not stable at high temperatures and high salinity, biopolymers are more stable, relatively [43]. The basic principles of biopolymer flooding are to increase the viscous forces, control mobility, as well as to reduce the interfacial tension in the reservoir for enhanced oil recovery [39,40,41]. Considering their lower cost and higher viscosity, the most widely-used biopolymers for enhanced oil recovery (EOR) application are xanthan gum [10,12], pullulan [46], levan [47], curdlan [48], dextran [49], and scleroglucan [50]. However, better understanding of wettability of biopolymers, including contact angle, surface tension, interfacial tension, and viscosity, are required for both oil-contaminated soil remediation and enhanced oil recovery (EOR).

2.2. Capillary Pressure

Wettability of mineral and interfacial tension between two fluids are key factors controlling the mobility of biopolymer solution, biopolymer solution–oil displacement, and capillary pressure in porous media. Due to the differences in mineral surface wettability by biopolymer solution and oil, a capillary pressure difference (Pc) between these two phases must exceed in order for biopolymer solution to enter the pores in the porous media. As described by the Young–Laplace equation (Equation (1)), capillary entry pressure of biopolymer solution into the original oil-filled pores is determined by the pore radius (R), the biopolymer solution-oil interfacial tension (σ), and the contact angle (θ) among the biopolymer solution–oil–mineral surface [51]:
P c = P b i o p o l y m e r P o i l = 2 σ   c o s θ R
where, the values of pore radius (R) are quite fixed depending on in-site geological conditions. However, both the biopolymer solution–oil interfacial tension (σ) and the contact angle (θ) among the biopolymer solution–oil–mineral surface have not been well identified. Therefore, the biopolymer solution–oil interfacial tension (σ) and contact angle (θ) cause the greatest uncertainty to the predictions of biopolymer solution mobility, saturation, and capillary entry pressure.

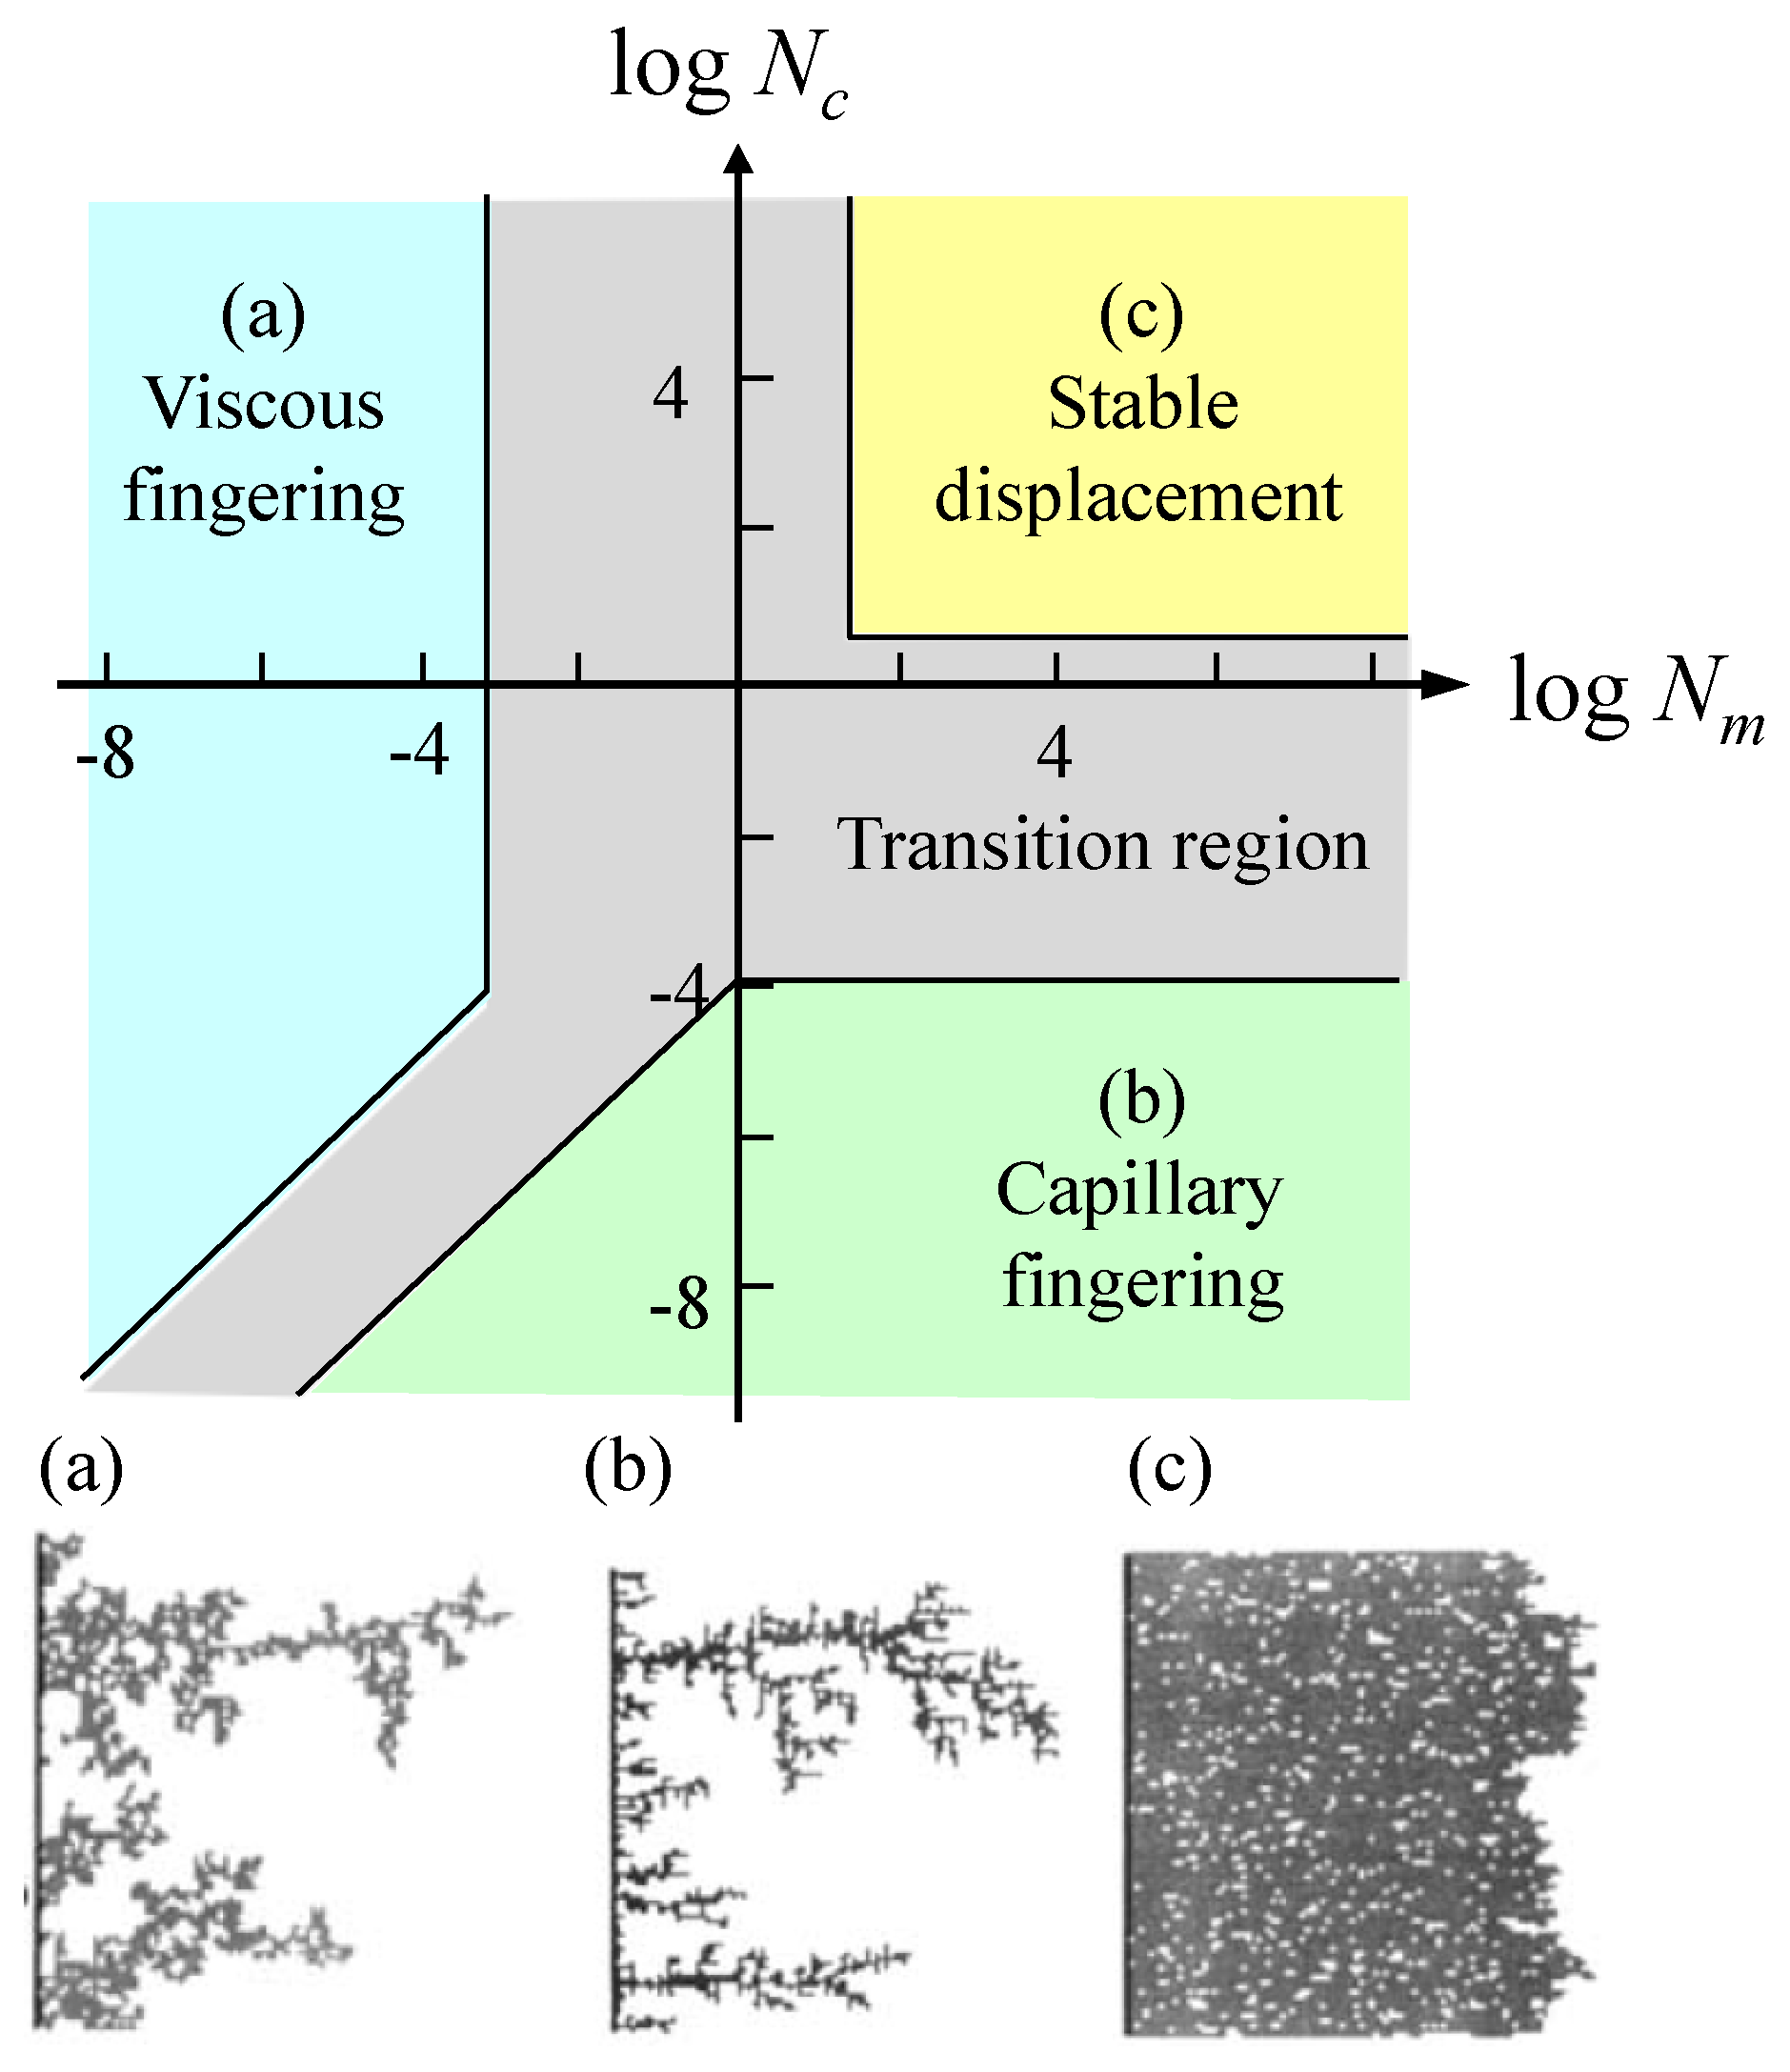
2.3. Multiphase Fluids Flow in Porous Media

In multiphase fluids flow, displacement ratios in porous media is determined by two dimensionless numbers [52,53]:
N m = μ inv μ def
N c = μ inv v σ · cos θ
where, viscosity number (Nm) is defined as the ratio of the injected fluid viscosity (μinv) and the defensed fluid viscosity (μdef); in addition, capillary number (Nc) represents the ratio of viscous force over capillary force and is associated with the injected fluid velocity (vinv), injected fluid viscosity (μinv), the contact angle on mineral surface (θ), and the interfacial tension between injected- and defensed- fluids (σ). These two dimensionless numbers govern three dominant regions with distinct displacement patterns and efficiencies (Figure 1): capillary fingering, viscous fingering, and stable displacement [54,55,56].

3. Experimental Methods and Results
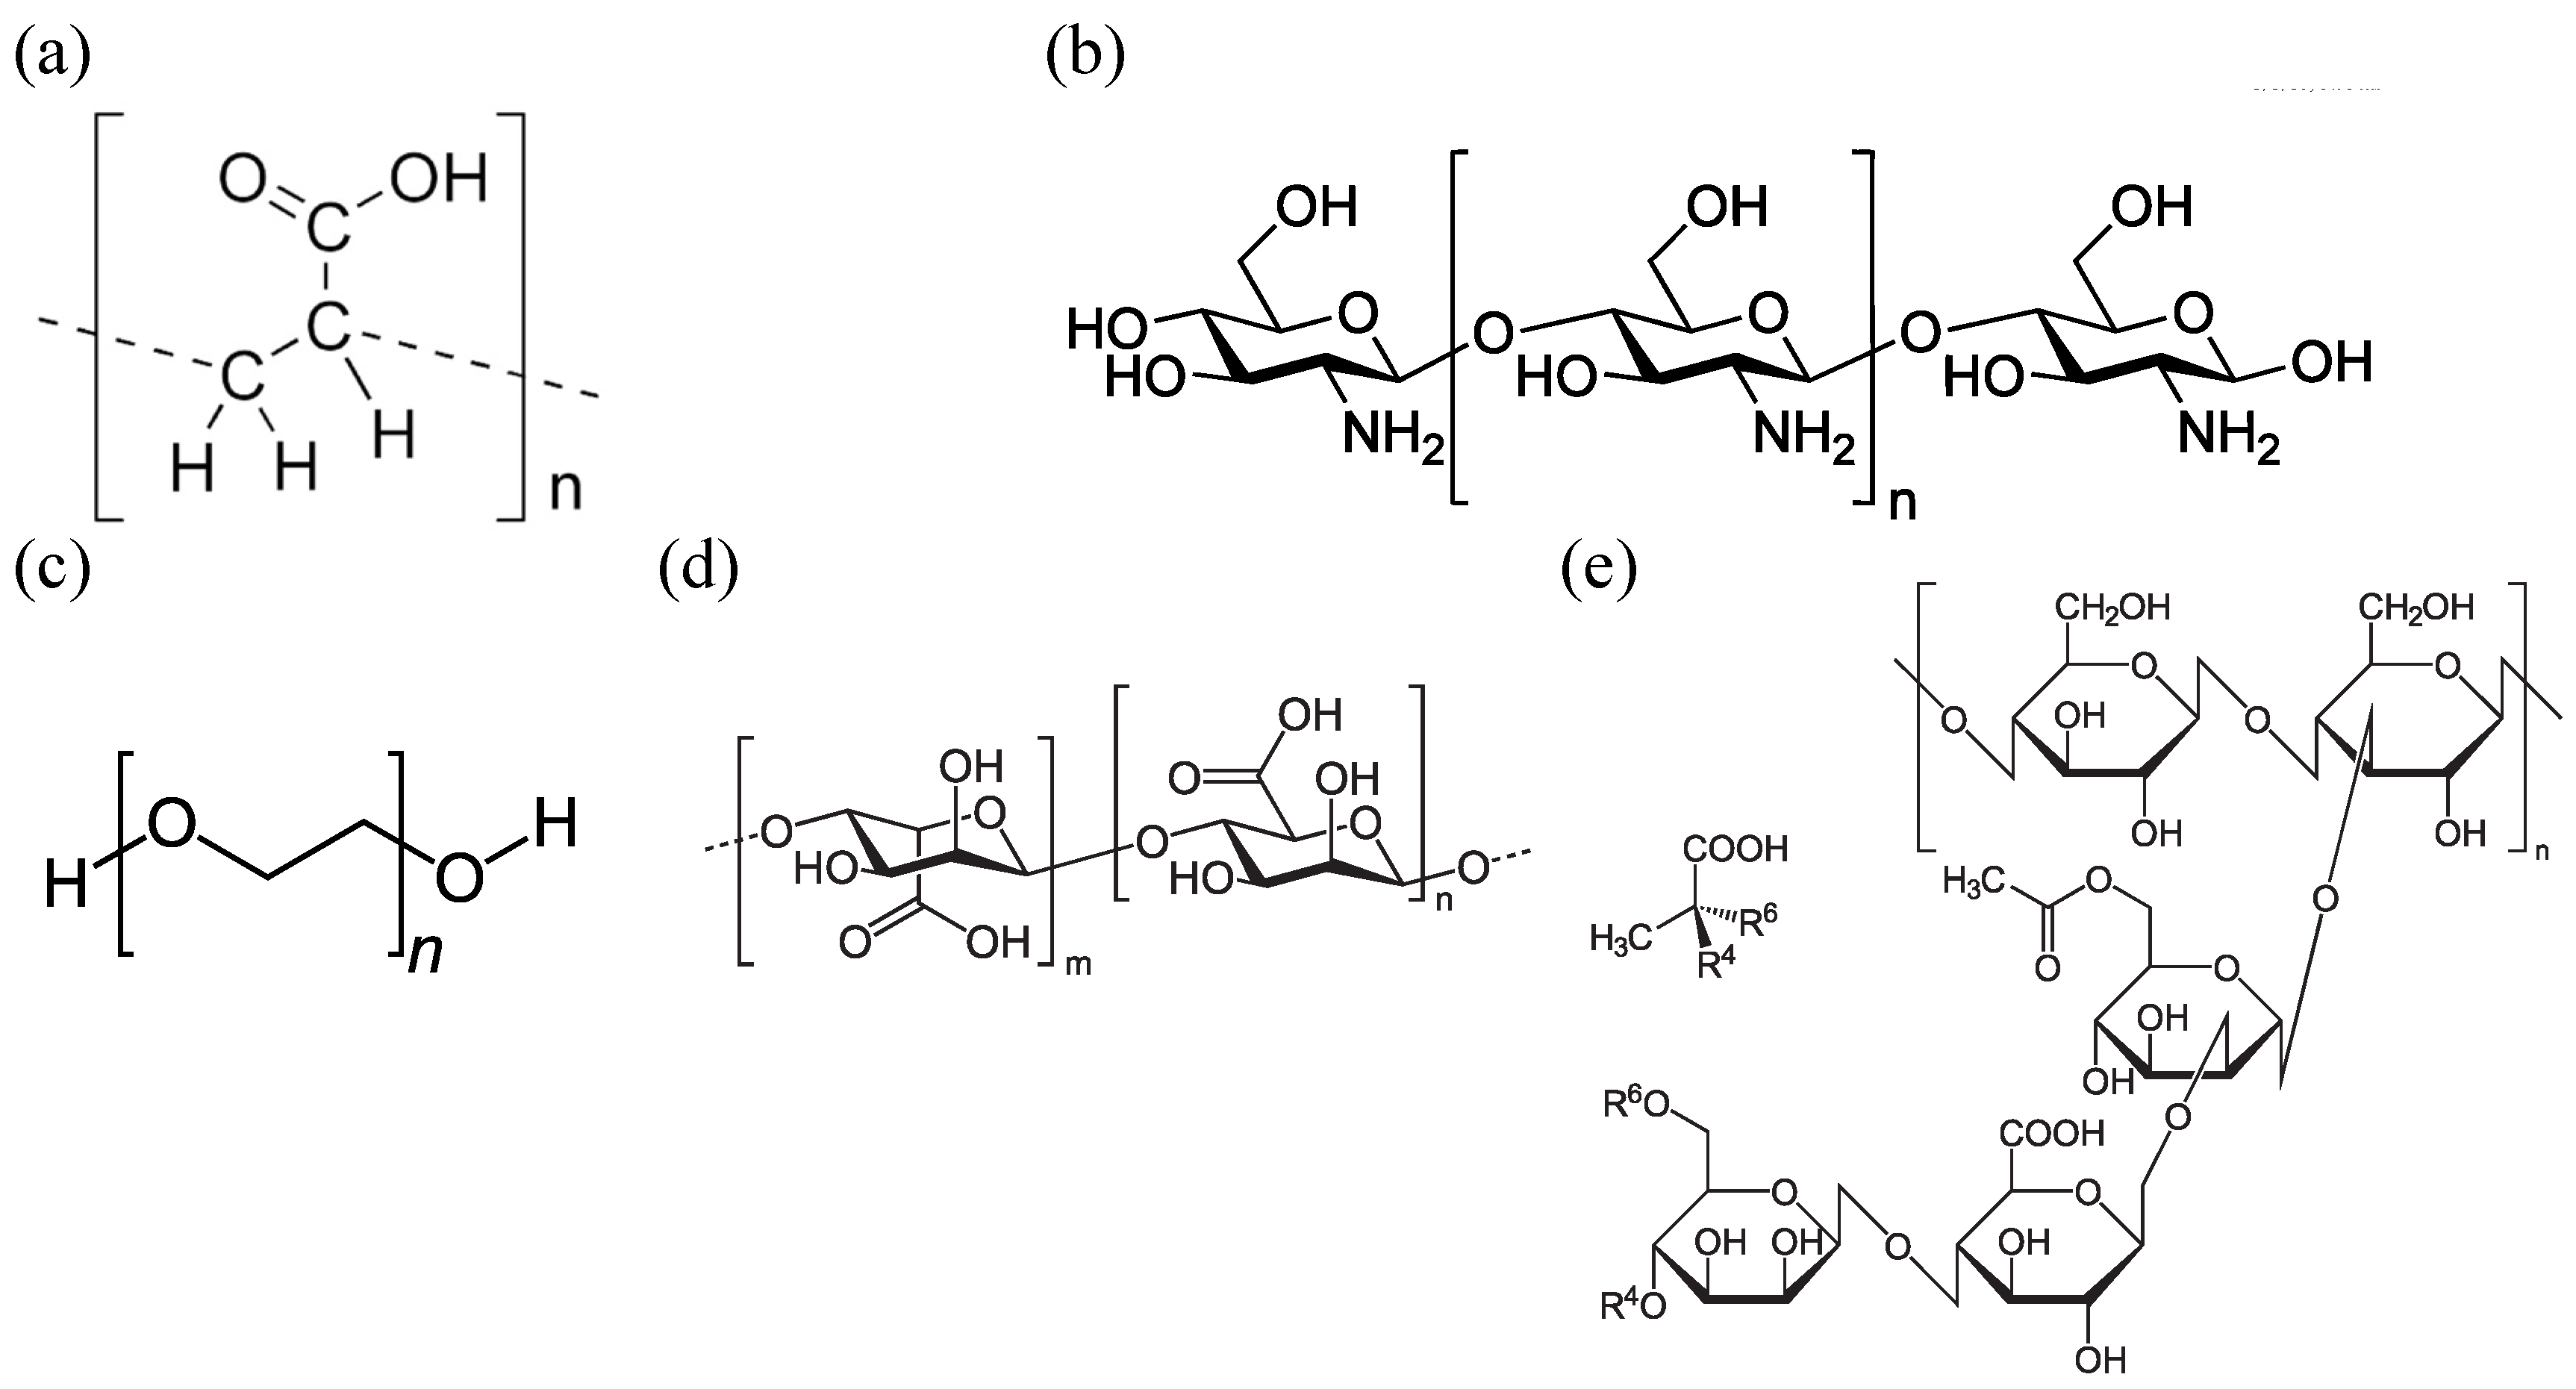
3.1. Material

Five different biopolymers were selected in this study that are popular in soil remediation and enhanced oil recovery: chitosan (85% deacetylated power, Alfa Aesar), PEO (polyethylene oxide, Acros), xanthan (xanthan gum, Pfaltz and Bauer), SA (Alginic Acid Sodium Salt, MP Blomedicals), and PAA (polyacrylic acid, Polysciences) (Figure 2). Chitosan is obtained by deacetylating chitin which is the structural element in the exoskeleton of crustaceans and cell walls of fungi [57,58]. PEO is produced through the interaction of ethylene oxide with water, ethylene glycol, or ethylene glycol oligomers [59]. Xanthan gum is obtained from common allergens such as corn, wheat, dairy, and soy [10,12]. SA is refined from brown seaweeds. PAA is the generic name for synthetic high molecular weight (~1,000,000 g/mol) polymers of acrylic acid which is produced from propene, which is the byproduct of ethylene and gasoline production [60]. The biopolymers were mixed with deionized (DI) water and biopolymer solutions were applied in this study (Table 1).

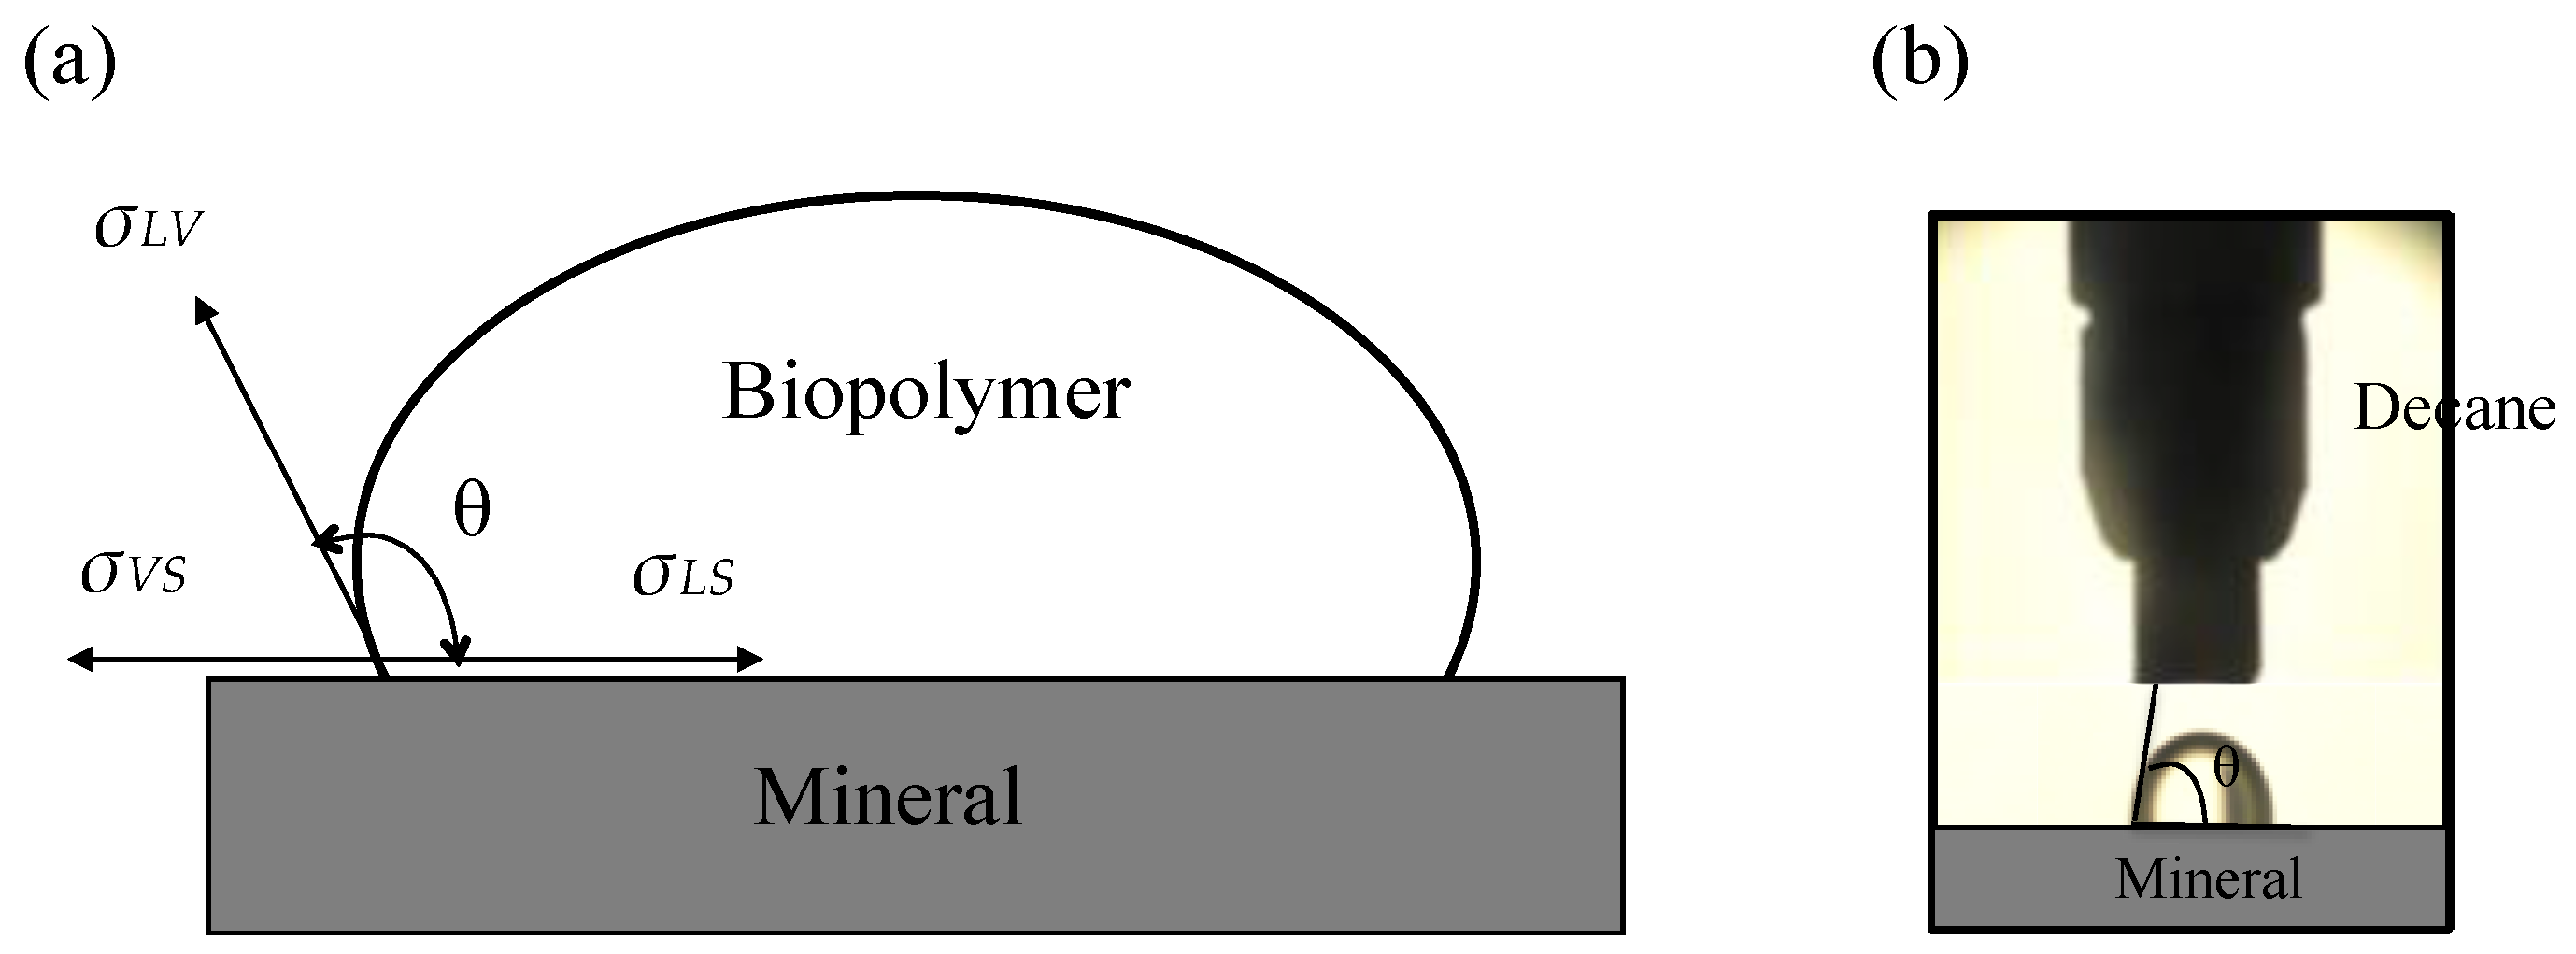
3.2. Contact Angle of Biopolymer Solution

3.2.1. Material and Test Procedure
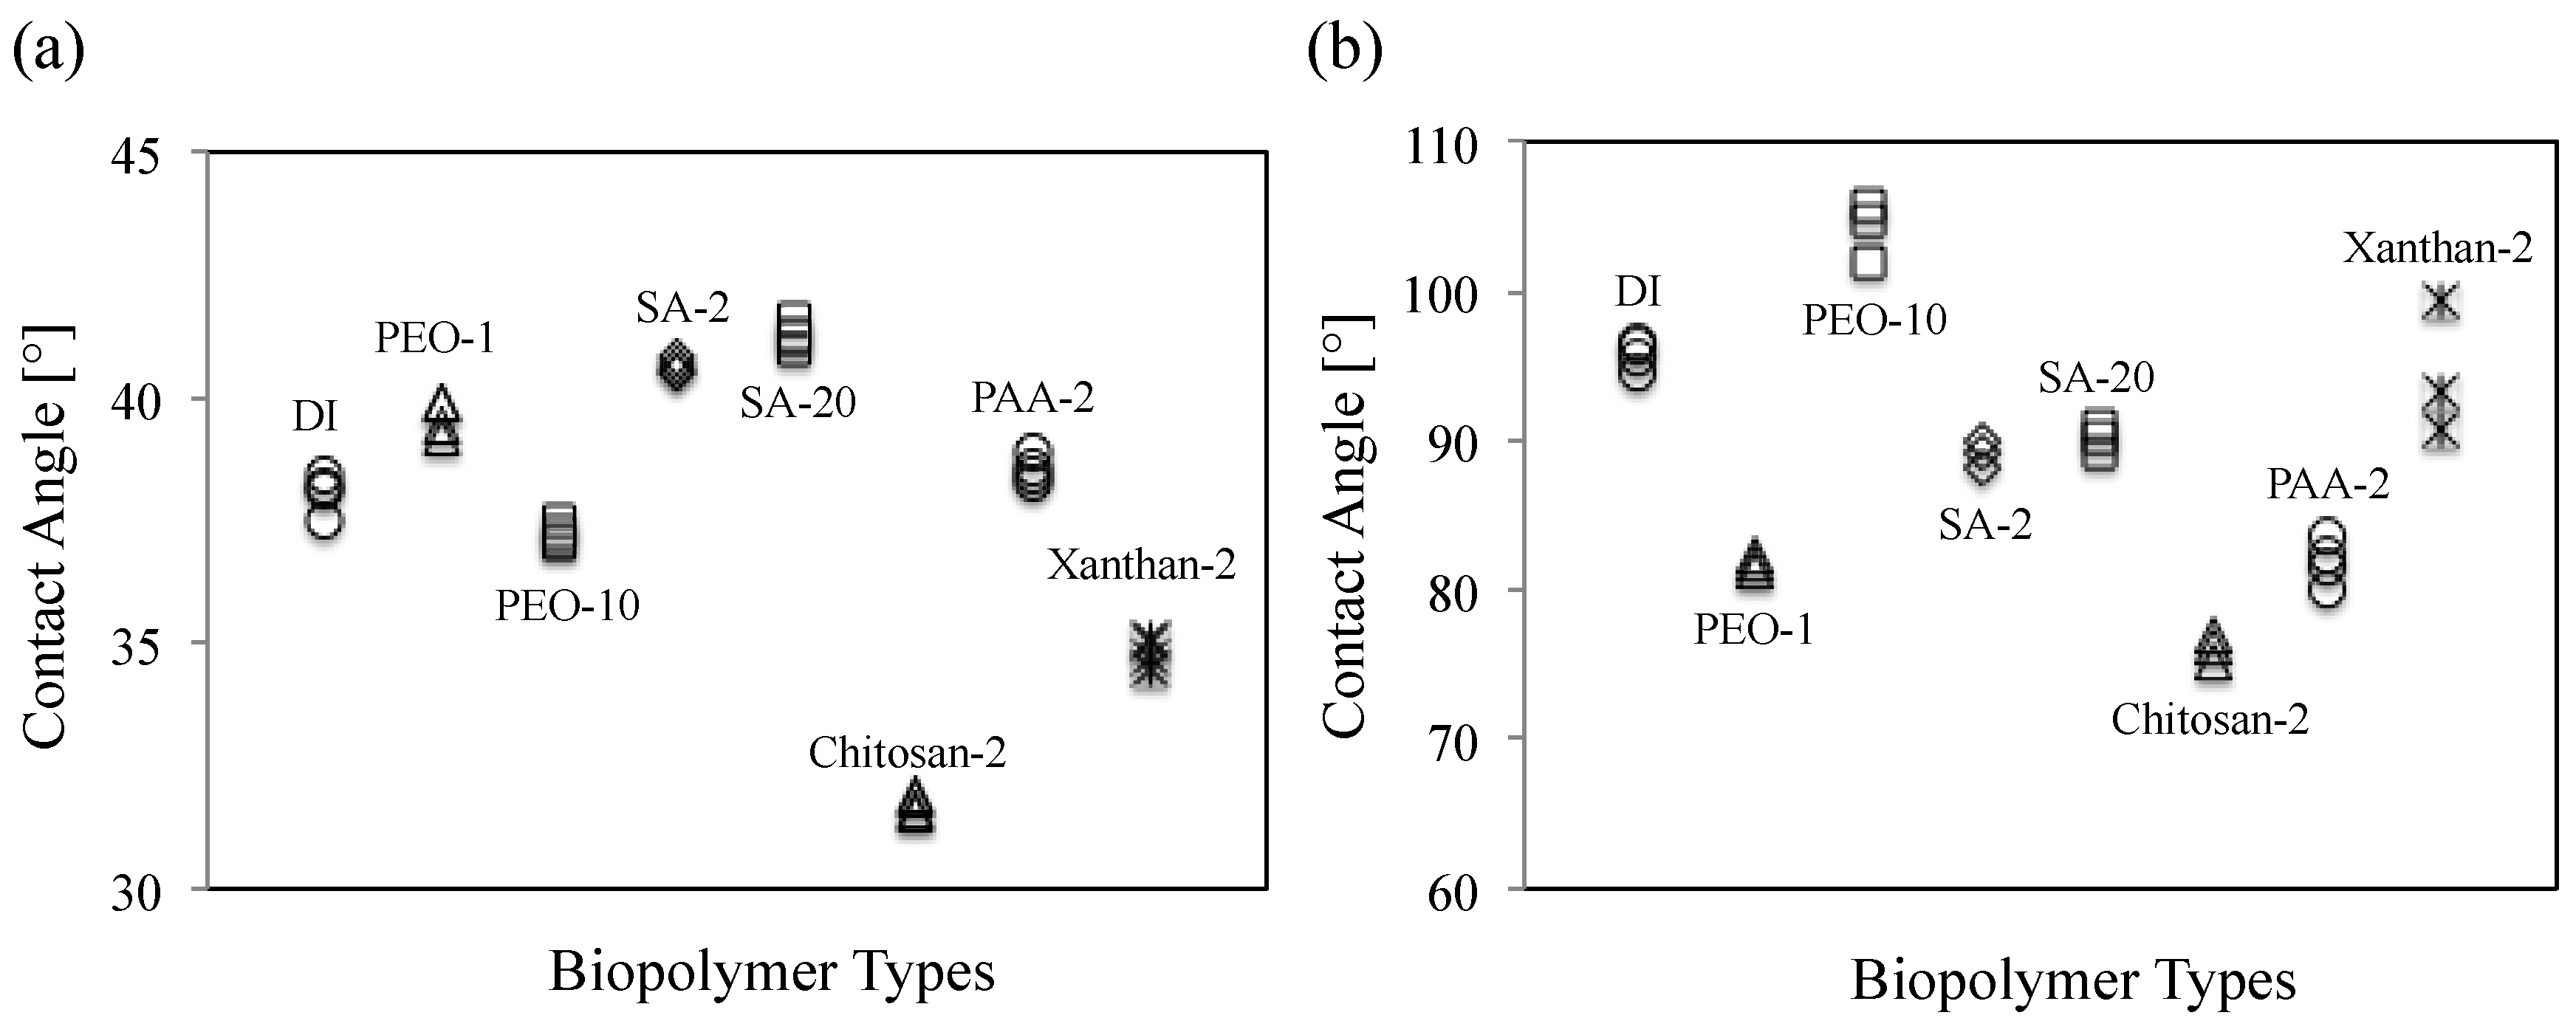
The sessile drop technique was used to measure the contact angle of biopolymer solution on a silica surface. Smooth-fused pure silica plates (VWR Vista Vision—Cover Glasses, amorphous SiO2) were used as the substrates that represent Ottawa sand. Figure 3 shows the apparatus used in this research. Contact angles of different biopolymer solutions were measured both on silica plates submerged in decane (alkane hydrocarbon, anhydrous, ≥99%, C10H22), which are the main component consisting of natural oil, and on the silica plates at atmospheric conditions. The temperature was maintained constantly (24 °C) at room temperature. To prepare the experiment, a silica plate was cleaned using ethanol (Malickrodt Baker, ACS reagent grad) and handled with gloved-hand. Each silica plate was not reused in order to avoid uncertainty from reaction history with decane and biopolymer solution. The droplet of biopolymer solution was foamed on the silica surface at atmospheric conditions and the contact angle was measured. In other tests, biopolymer was introduced into the decane-filled chamber and released on the silica plate which was placed in the chamber (Figure 3b). The change in the biopolymer droplet was monitored using high-resolution time-lapse photography (12.3 megapixel, Nikon D90). The tests were repeated 3–4 times under same conditions. Images of the droplets captured were used for measuring the contact angle and analyzed with ImageJ (Figure 3b).

3.2.2. Result

Contact angles obtained using ImageJ are presented in Figure 4. The result shows that: (1) all biopolymer solutions used in this study are hydrophilic on the silica surface at atmospheric conditions and overall contact angles are within the range of 31.7° to 41.2°, which is similar to deionized (DI) water (~39.1°); (2) contact angles on a silica surface submerged in decane are higher than that at atmospheric conditions. Even biopolymer solutions such as PEO-10, SA-20, Xanthan-2, including deionized (DI) water, are hydrophobic on a silica surface in decane (>90°), (3) while contact angles of PEO at atmospheric conditions decrease in line with the increase in PEO concentration, but increase in decane with its concentration; and (4) contact angles of SA increased both at atmospheric conditions and in decane with its concentration.

3.3. Interfacial Tension and Surface Tension of Biopolymer Solution

3.3.1. Material and Test Procedure

SensaDyne QC 6000 Surface Tensiometer (SensaDyne Instrument Division, Flagstaff, AZ, USA) was used to measure the surface tension of biopolymer solutions. This device can blow a nitrogen bubble using two probes with different radii into the liquid, which generates the differential pressure. The dynamic surface tension can be calculated using Equation (5) with consideration of both differential pressure measured and the calibration factor k supported by the device [61].
Δp = pmax − pmin
σ = k × Δp
where, σ is surface tension, k is calibration factor, Δp is a differential pressure between the maximum pressure pmax and the minimum pressure pmin.
Additionally, interfacial tension was measured using a force Tensiometer (Sigma 703D) based on the Du Nouy ring method. In the Du Nouy ring method, the container including two fluids (decane and biopolymer solution) is prepared (note: the Du Nouy ring method may not give an accurate value compared to the Wilhelmy plate method for viscoelastic water-soluble polymers). Decane is placed on the biopolymer solution due to its lower density. The platinum ring (with a diameter of 6 cm) is initially submerged into biopolymer solution and then raised to the decane phase forming a fluid meniscus. The meniscus tears from the ring and the maximum force required to support the ring is measured. The force measured is the interfacial tension between decane and the biopolymer solution.

3.3.2. Result

Figure 5 shows the surface tensions and interfacial tensions measured. Figure 5a shows that (1) PEO-1 and PEO-10 have lower surface tensions than deionized (DI) water; and (2) surface tensions of other biopolymer solutions used in this study (i.e., SA-2, SA-20, Chitosan-2, and Xanthan-2) are in the range of 74–81 (mN/m) and are slightly higher than deionized (DI) water (73 mN/m). Figure 5b shows that (1) the interfacial tensions among all fluids and decane are lower than its surface tension, and (2) the interfacial tensions of all biopolymer solutions (25–39 mN/m) are lower than deionized (DI) water (51 mN/m).

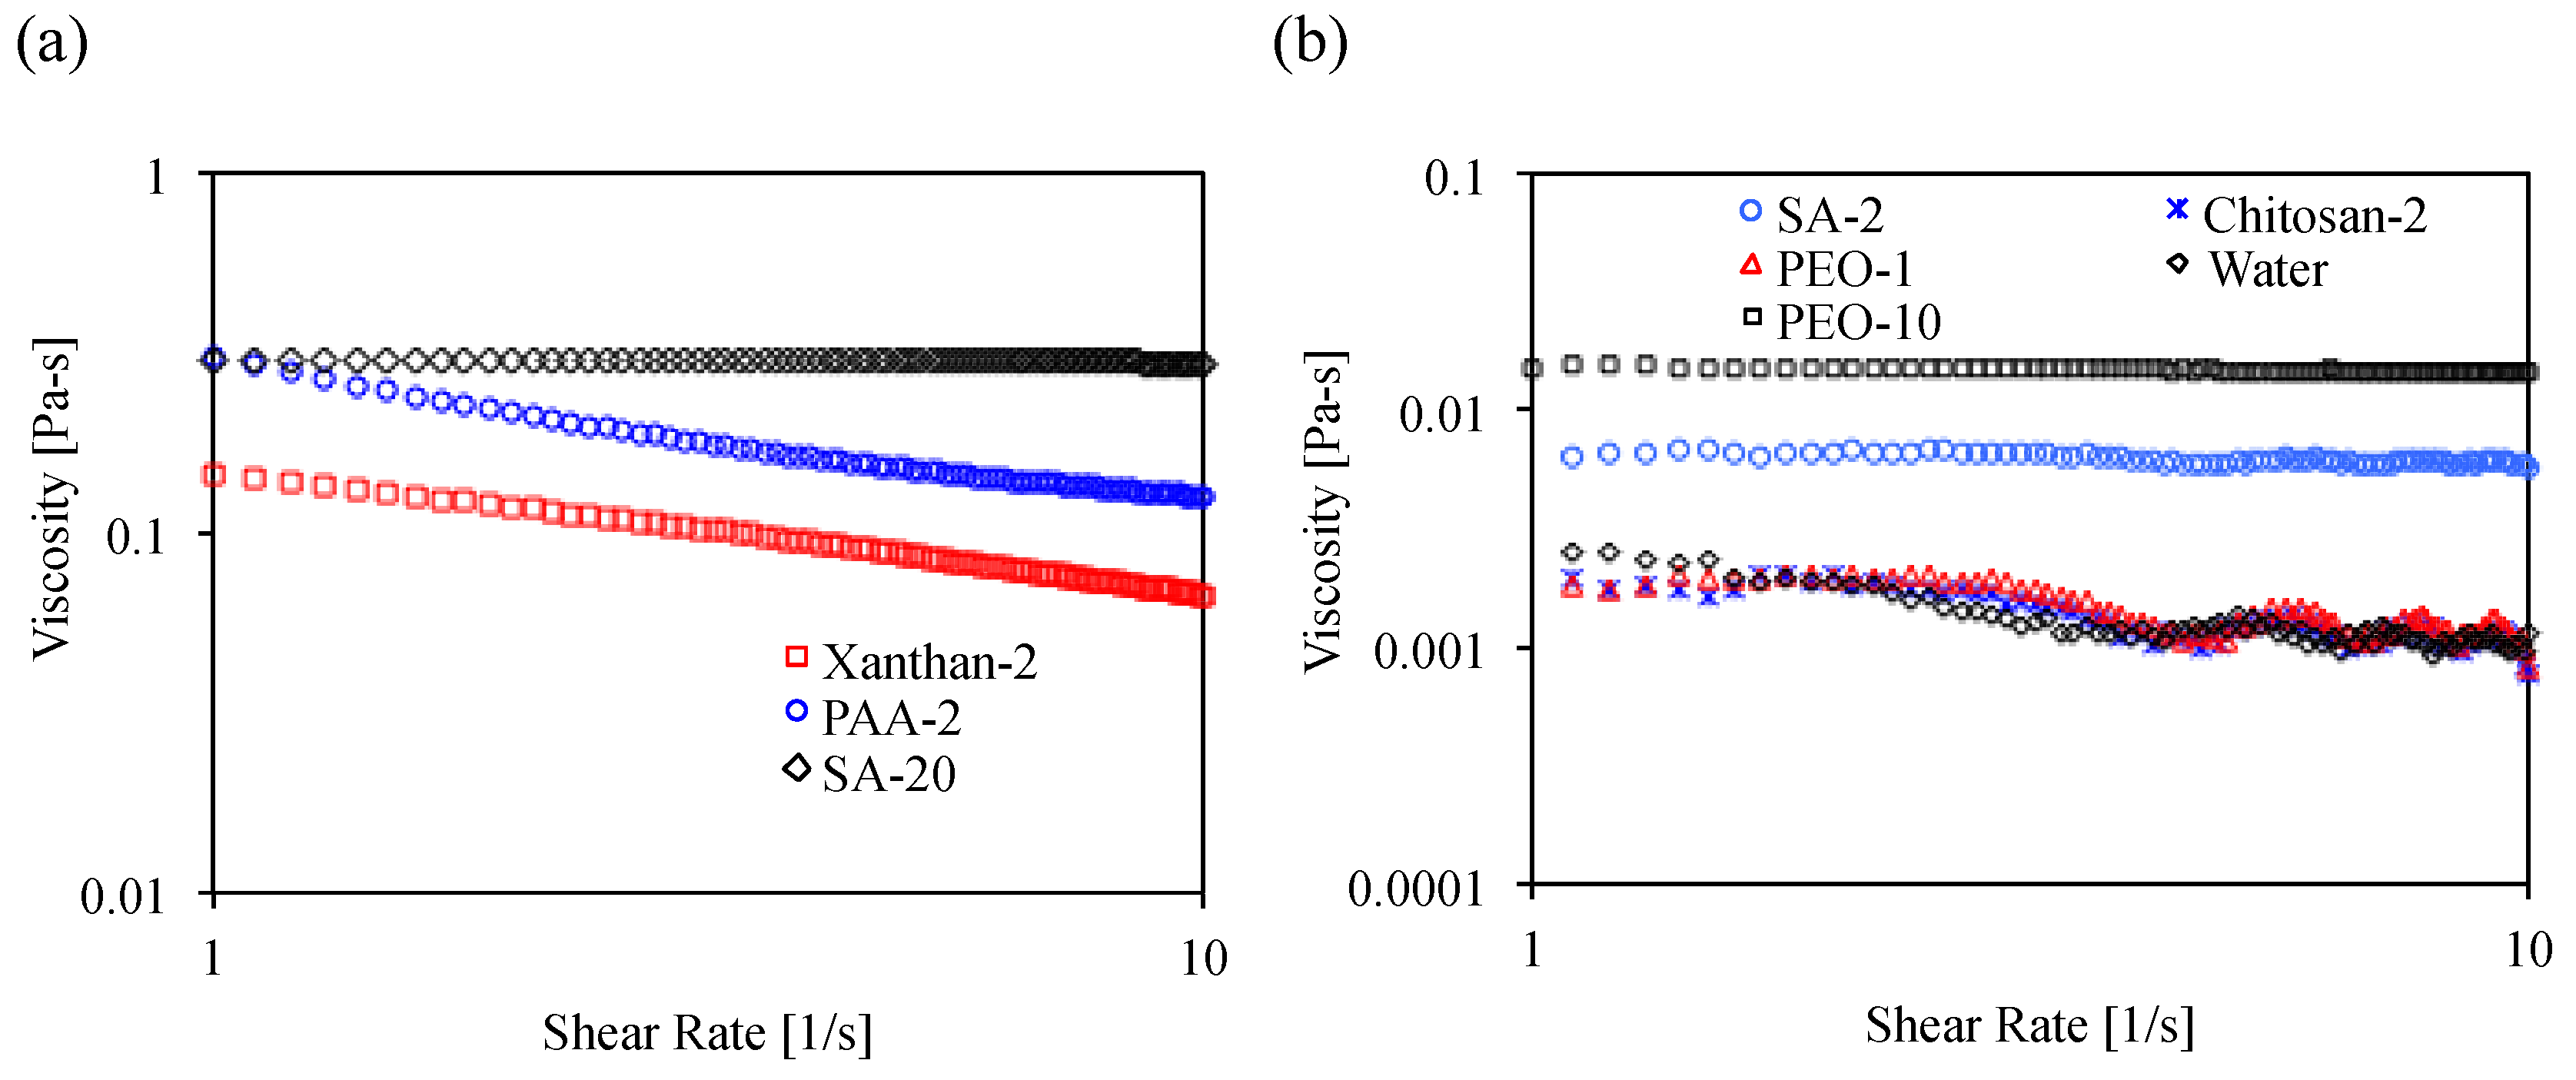
3.4. Viscosity of Biopolymer Solution

3.4.1. Material and Test Procedure

The values of the biopolymer solutions’ viscosities were measured through the spindle rotation method using the Anton Paar MCR302 rheometer at room temperature and atmospheric pressure. Each solution was placed in Anton Paar MCR302 rheometer that controls the shear rate at the range of 0.1 to 10 (1/s) and measured shear stress (Pa) at the same time. The values of viscosity were estimated using both shear rate and shear stress.

3.4.2. Result

Figure 6a shows that (1) while biopolymer solutions such as PEO-1, SA-2, and Chitosan-2 have similar viscosity to deionized (DI) water, the rest of them (PEO-10, SA-20, PAA-2, Xanthan-2) have higher viscosities than deionized (DI) water; (2) while viscosities of PAA-2 and Xanthan-2 decrease in line with the increase of shear rate that represent non-Newtonian fluids, the rest of them have relatively constant viscosities; and (3) the viscosities of both SA and PEO increase in line with their concentration.

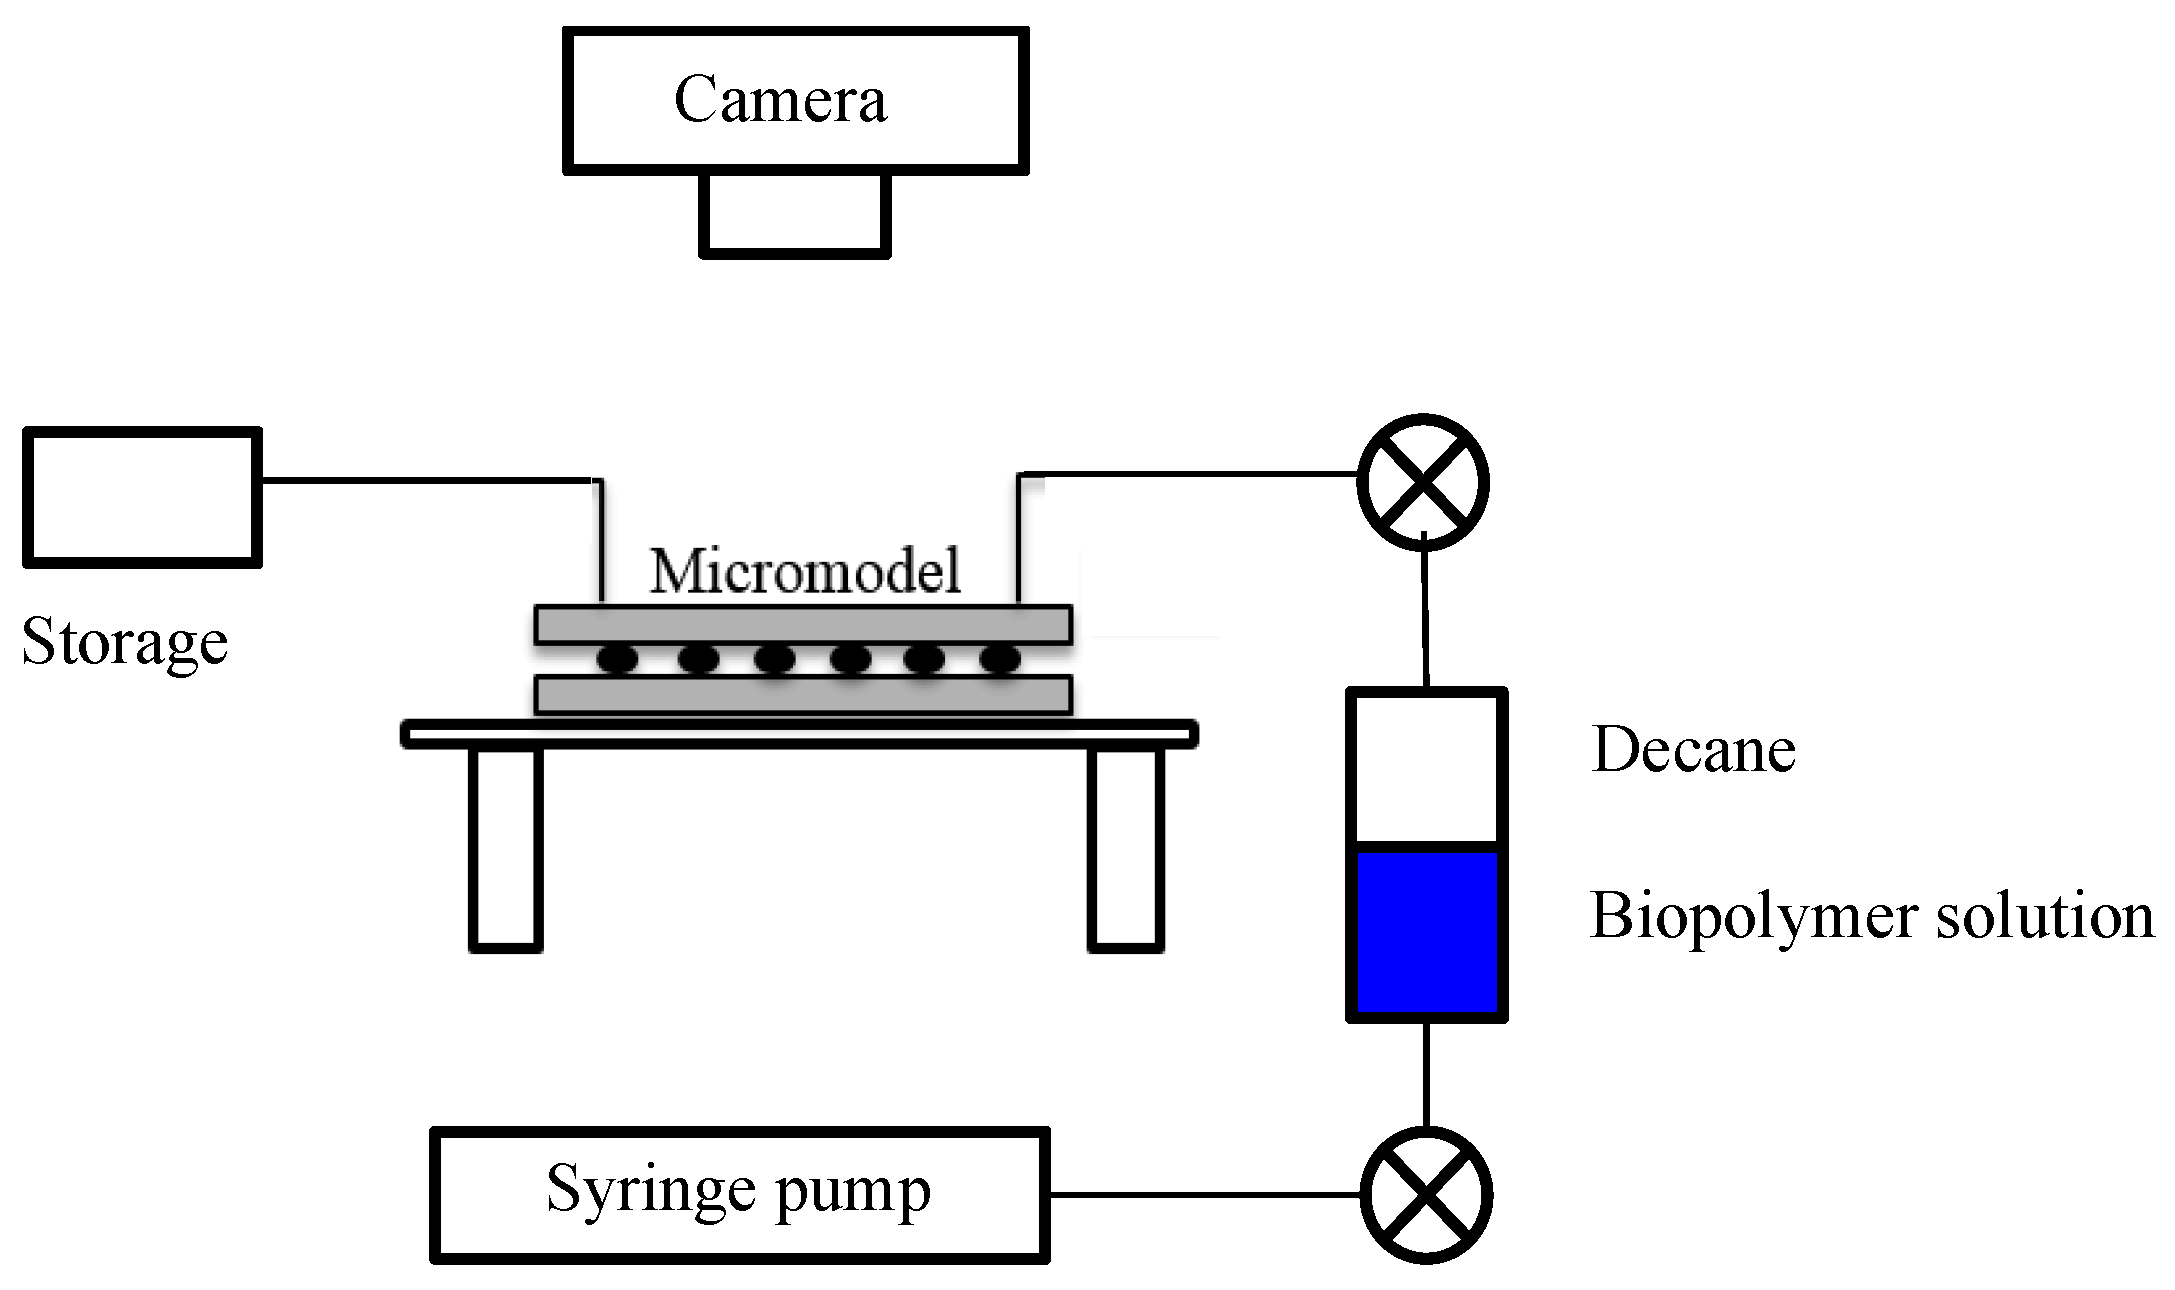
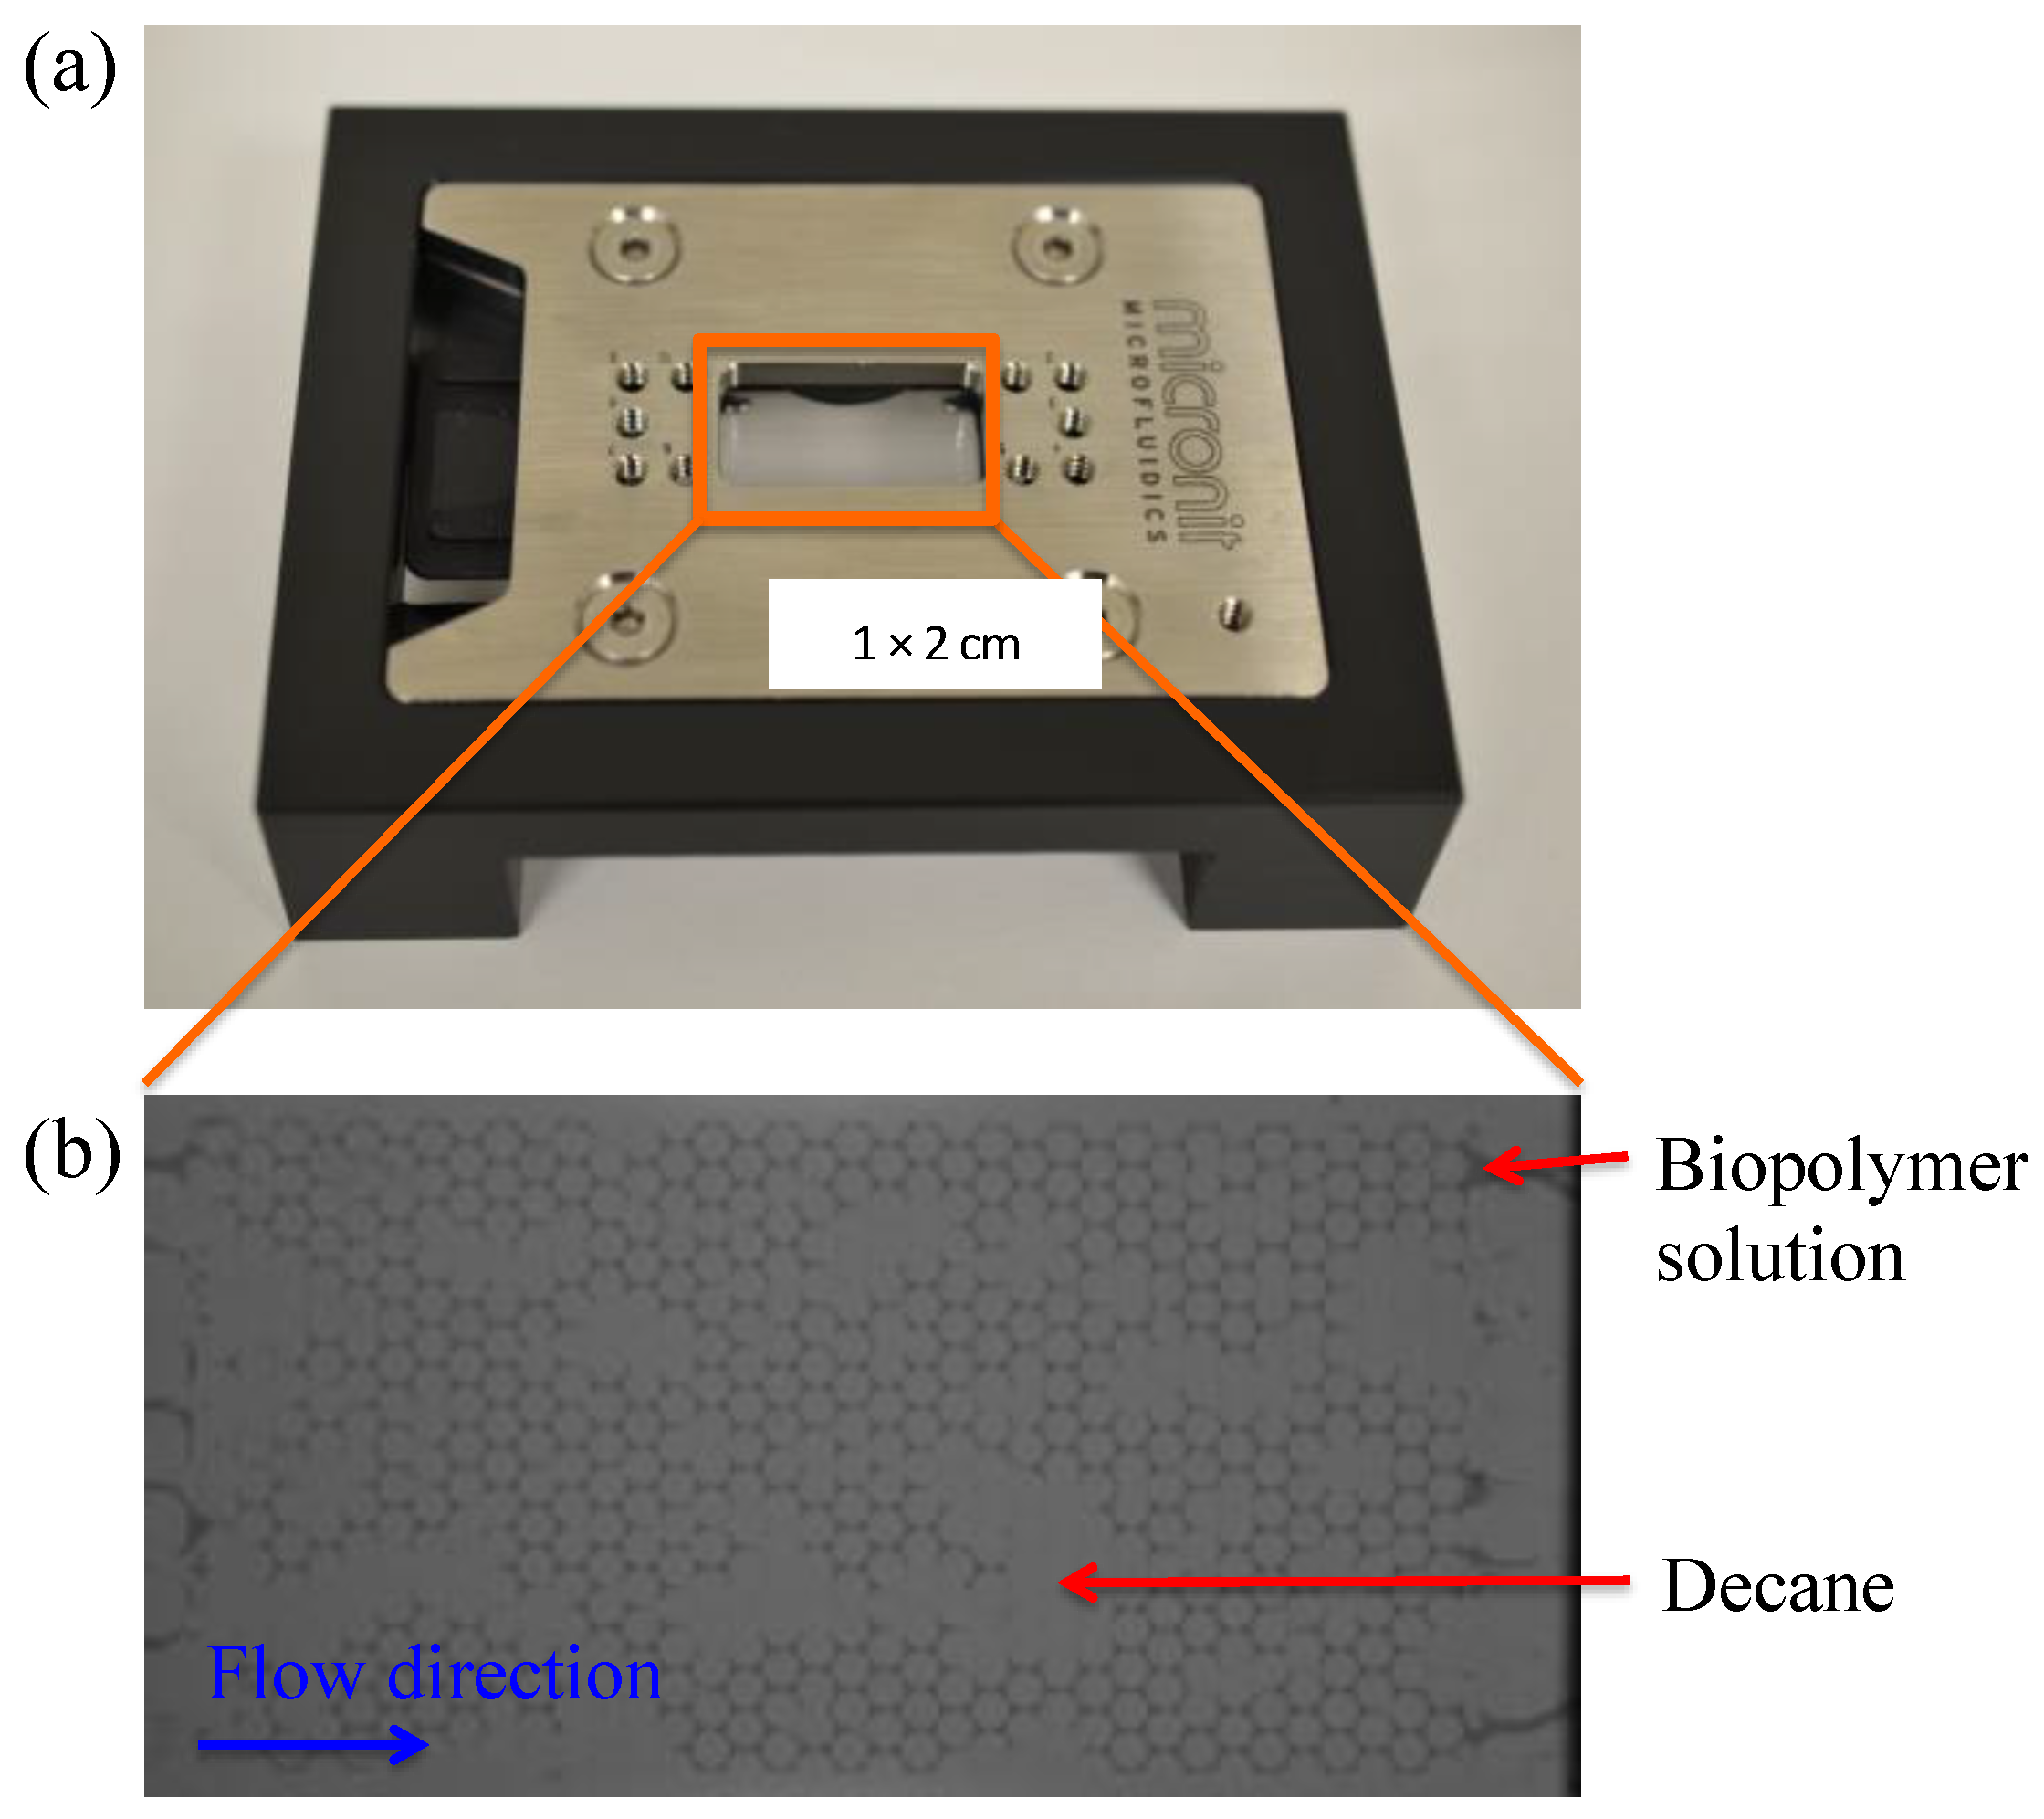
3.5. Micromodel Test

3.5.1. Apparatus and Materials

The experimental configuration of this study is schematically shown in Figure 7. The silica micromodel is placed horizontally on a customized jack stage. A syringe (2.5 mL with 1/16 inch fitting), controlled by a precision syringe pump (Kats Scientific, NE-1010), is connected with the micromodel for biopolymer solution injection. To monitor the flow processes in the micromodel, a high-resolution camera (Nikon D7000, 16.2 megapixels), with image and video- capturing function controlled by the computer, is used. SA-20 and PAA-2 were not used in the micromodel test due to excessively high viscosity.

3.5.2. Micromodel

The micromodel fabricated by Micronit Microfluidics BV is made of fused silica. Customized pore networks are etched on two symmetrically-patterned silica plates, which are then fused together to form a two-dimensional porous network. The patterned area is 20 mm × 10 mm, containing 576 discoid silica grains (590 μm in diameter and 1186 pore bodies). The pore throat is 20 μm deep and around 30 μm wide. Figure 8a shows the top view of the micromodel within a chip holder for protection and tubing connection.

3.5.3. Experimental Procedure
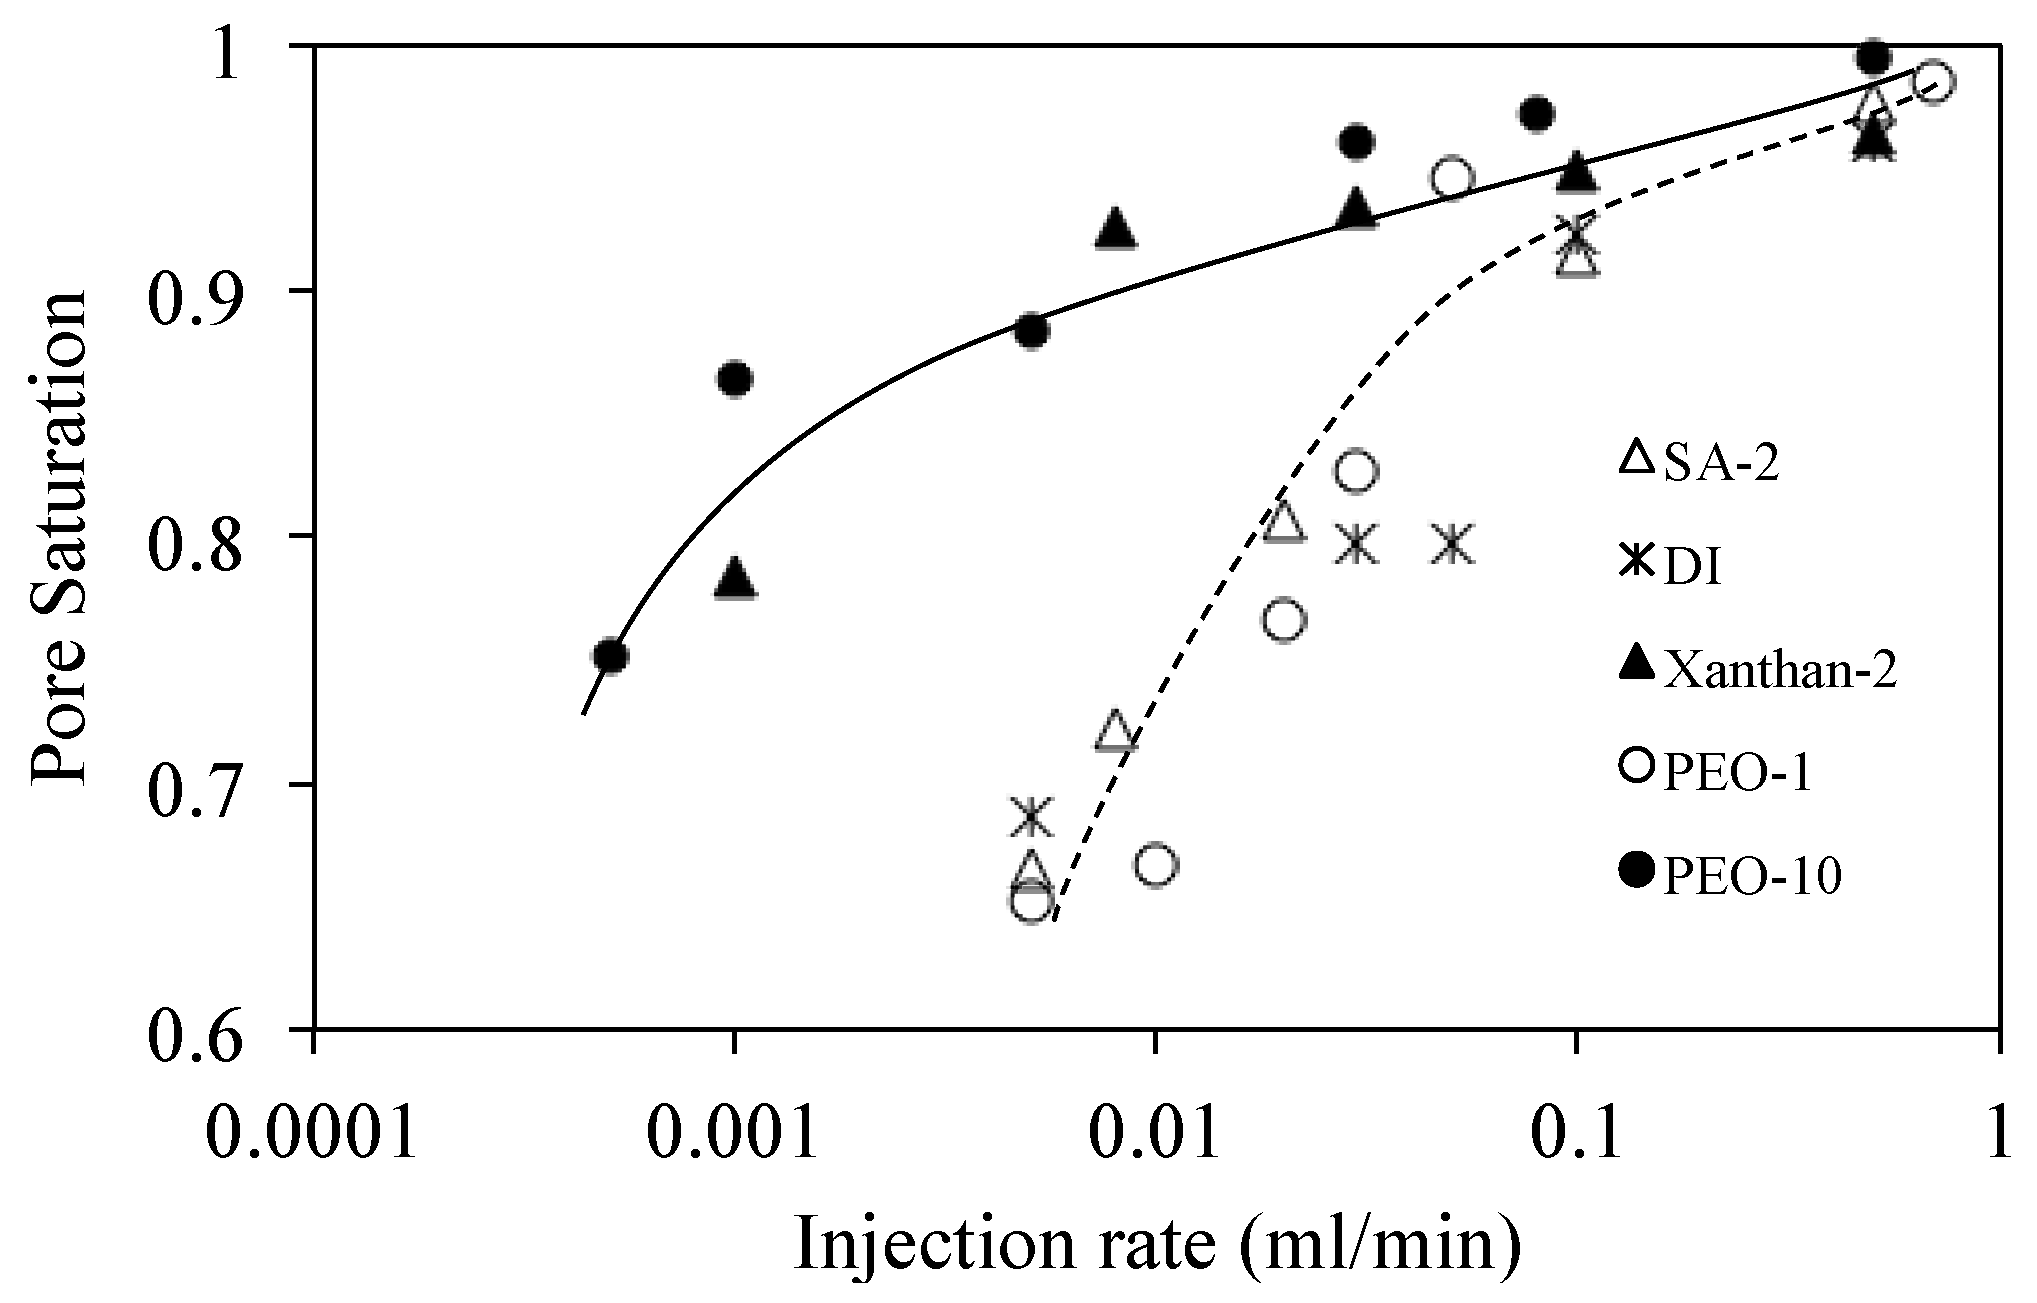
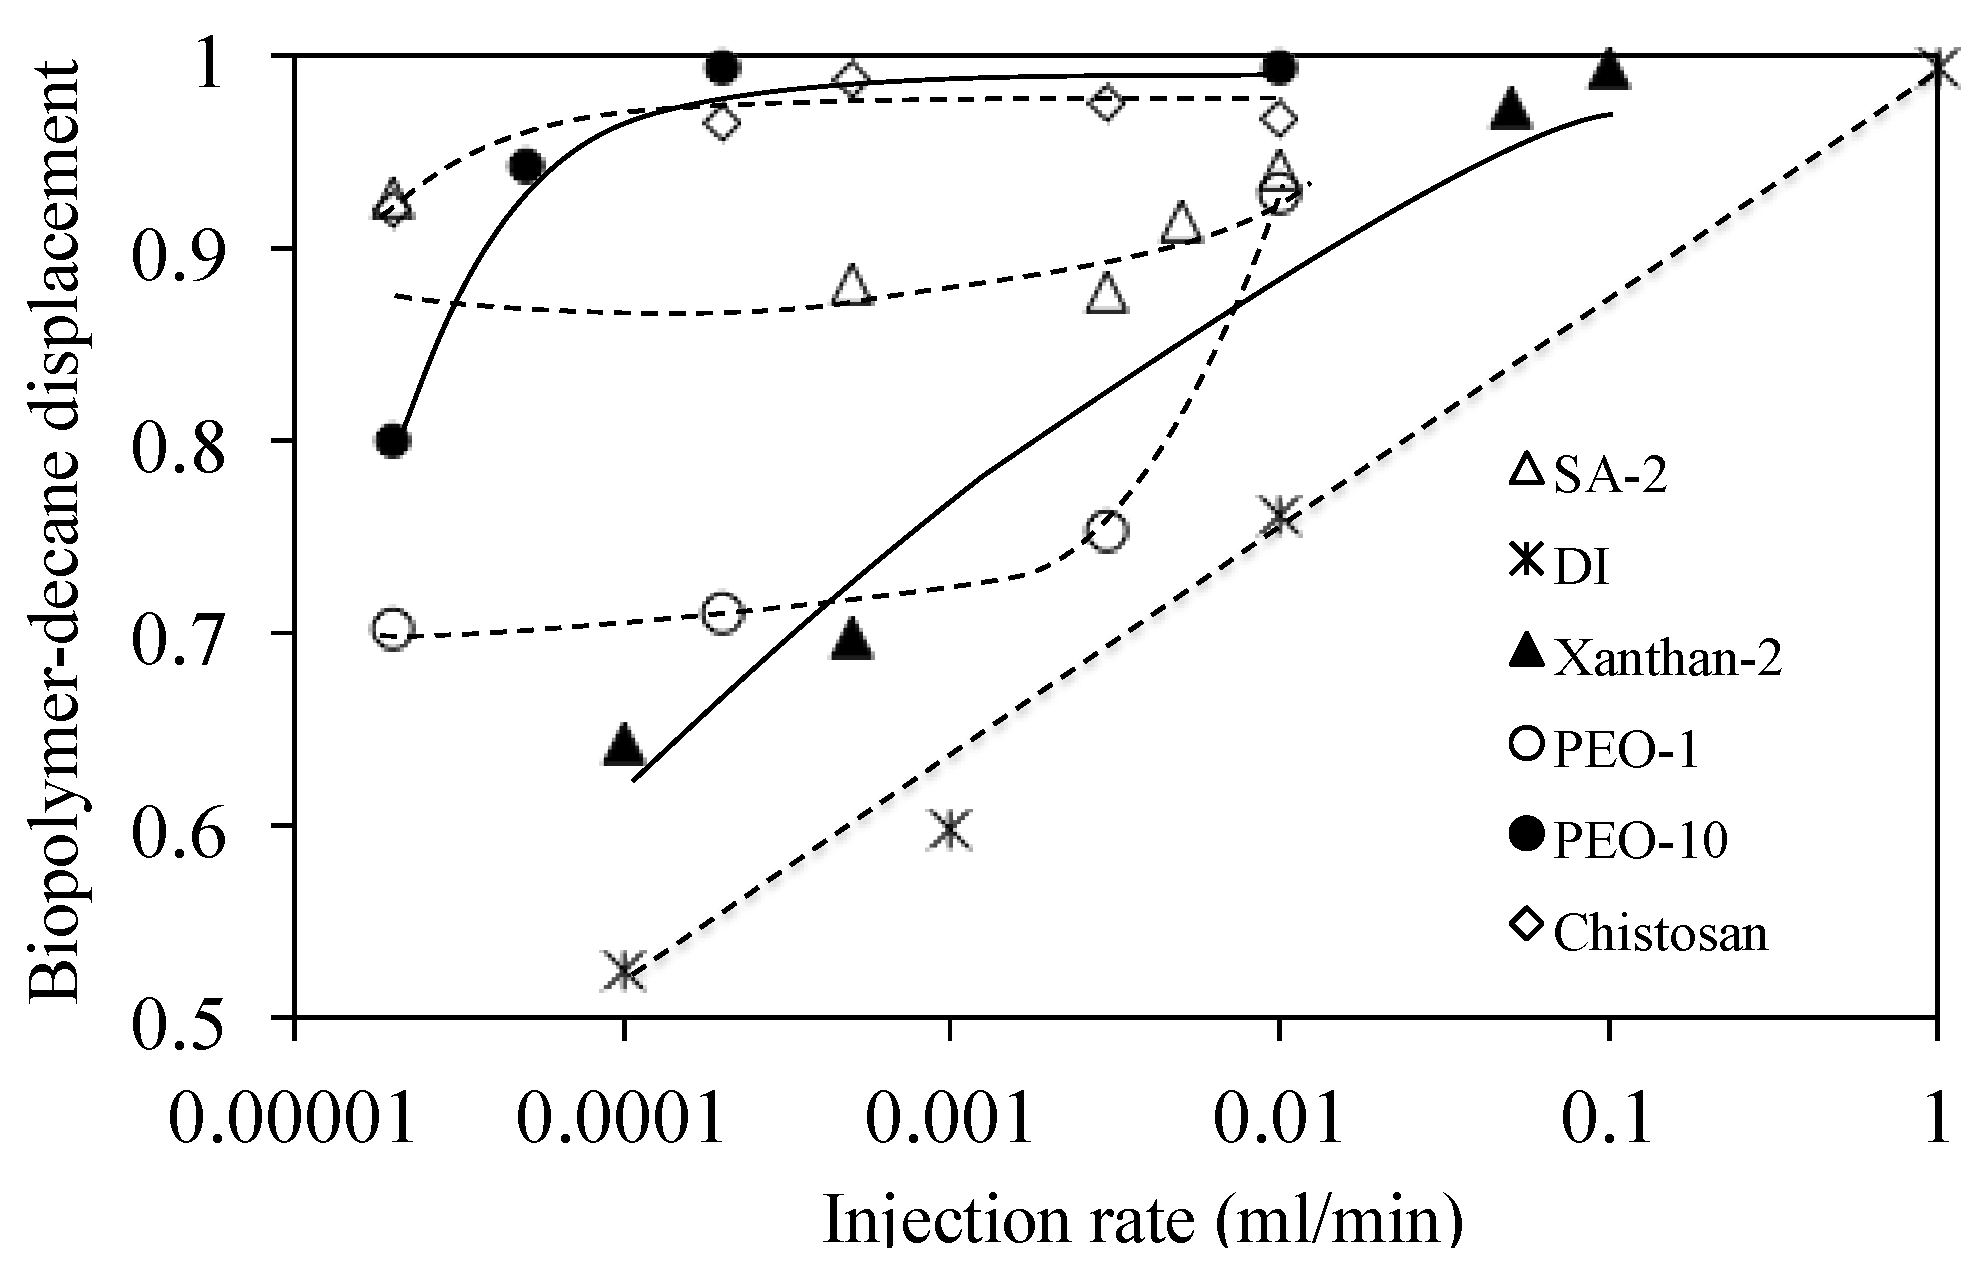
The micromodel was firstly cleaned by way of injecting 10 mL of absolute ethanol (Mallinckodt Baker, ACS reagent grad) which was followed by 30mL of deionized (DI) water and then oven-dried at 120 °C for 48 h. After cleaning, the experimental system was assembled accordingly as illustrated in Figure 7. Two types of tests were conducted using the micromodel. The first test was the biopolymer injection into the air-filled micromodel at atmospheric conditions. Biopolymer injection into the micromodel was initiated at a constant flow rate in the range of 0.7 to 70 μL/min. The injection continued until biopolymer percolated through the micromodel. Additional one hundred pore volume (PV) of biopolymer was eventually injected into the micromodel after the biopolymer had percolated through the micromodel. The second test was the biopolymer injection into the decane-saturated micromodel. A small tubing chamber was placed between the micromodel and the syringe pump that was filled with biopolymer solution and decane (Figure 7). Decane was always placed on the upper layer in this chamber considering its lower density than the biopolymer solutions. Thus, the micromodel was initially saturated with decane (Sigma-Aldrich, anhydrous, >99%) first. After that, biopolymer injection into the micromodel was initiated at a constant flow rate in the range of 0.5 to 50 μL/min. Injection continued until no more decane was drained from the micromodel. Furthermore, an additional one hundred pore volume (PV) of biopolymer was finally injected into the micromodel after the biopolymer had percolated through the micromodel. Additional injection of 100 PV is intended to clarify the displacement change after the percolation of fluid in the micromodel.
Captured images and videos during such injection processes were used to compute the time-lapse biopolymer saturations and biopolymer–decane displacement ratios in the micromodel. Biopolymer saturation is defined as the ratio between the volume of biopolymer solution and the pore volume in micromodel obtained from biopolymer injection into the air-filled micromodel test. Additionally, the biopolymer–decane displacement ratio is defined as the ratio between the volume of biopolymer solution and the pore volume in the micromodel obtained from the biopolymer injection into the decane–saturated micromodel test.

3.5.4. Result

Figure 8b shows the snapshot of biopolymer injection into the initially decane-saturated micromodel. With this image, the biopolymer–decane displacement ratio was obtained. In this case, the injected biopolymer solution percolates through the micromodel within 2.0 s. While additional 100 pore volume (PV) biopolymer solution is injected into the micromodel after percolation (>2.0 s), distribution of residual decane remains unchanged. Biopolymer solution injection was controlled at constant flow rates (from 0.5 μL/minto ~70 μL/min) during the tests. Figure 9 shows that (1) biopolymer saturation (biopolymer-air displacement) was obviously increased in line with the increase in injection rate, which agrees with previous study by Kuo et al. (2011); (2) the pore saturations of SA-2 and PEO-1, according to injection rate, have a similar pattern with deionized (DI) water; (3) the pore saturation of Xanthan-2 and PEO-10 are higher than others, including SA-2, PEO-1, and deionized (DI) water at the same injection rate; and (4) at higher injection rate (>0.1 mL/s), the pore saturations of all fluids are relatively high (>90%).
Figure 10 shows that: (1) biopolymer–decane displacement was obviously increased in line with the increase in the injection rate, which also agrees with previous study; (2) at a higher injection rate (>0.1 mL/s), the biopolymer–decane displacements of all fluids are relatively high (>90%); and (3) the biopolymer–decane displacement ratios with SA-2, PEO-10 and chistosan are immensely high even at a lower injection rate (~0.00002 mL/min).

4. Analyses and Discussion

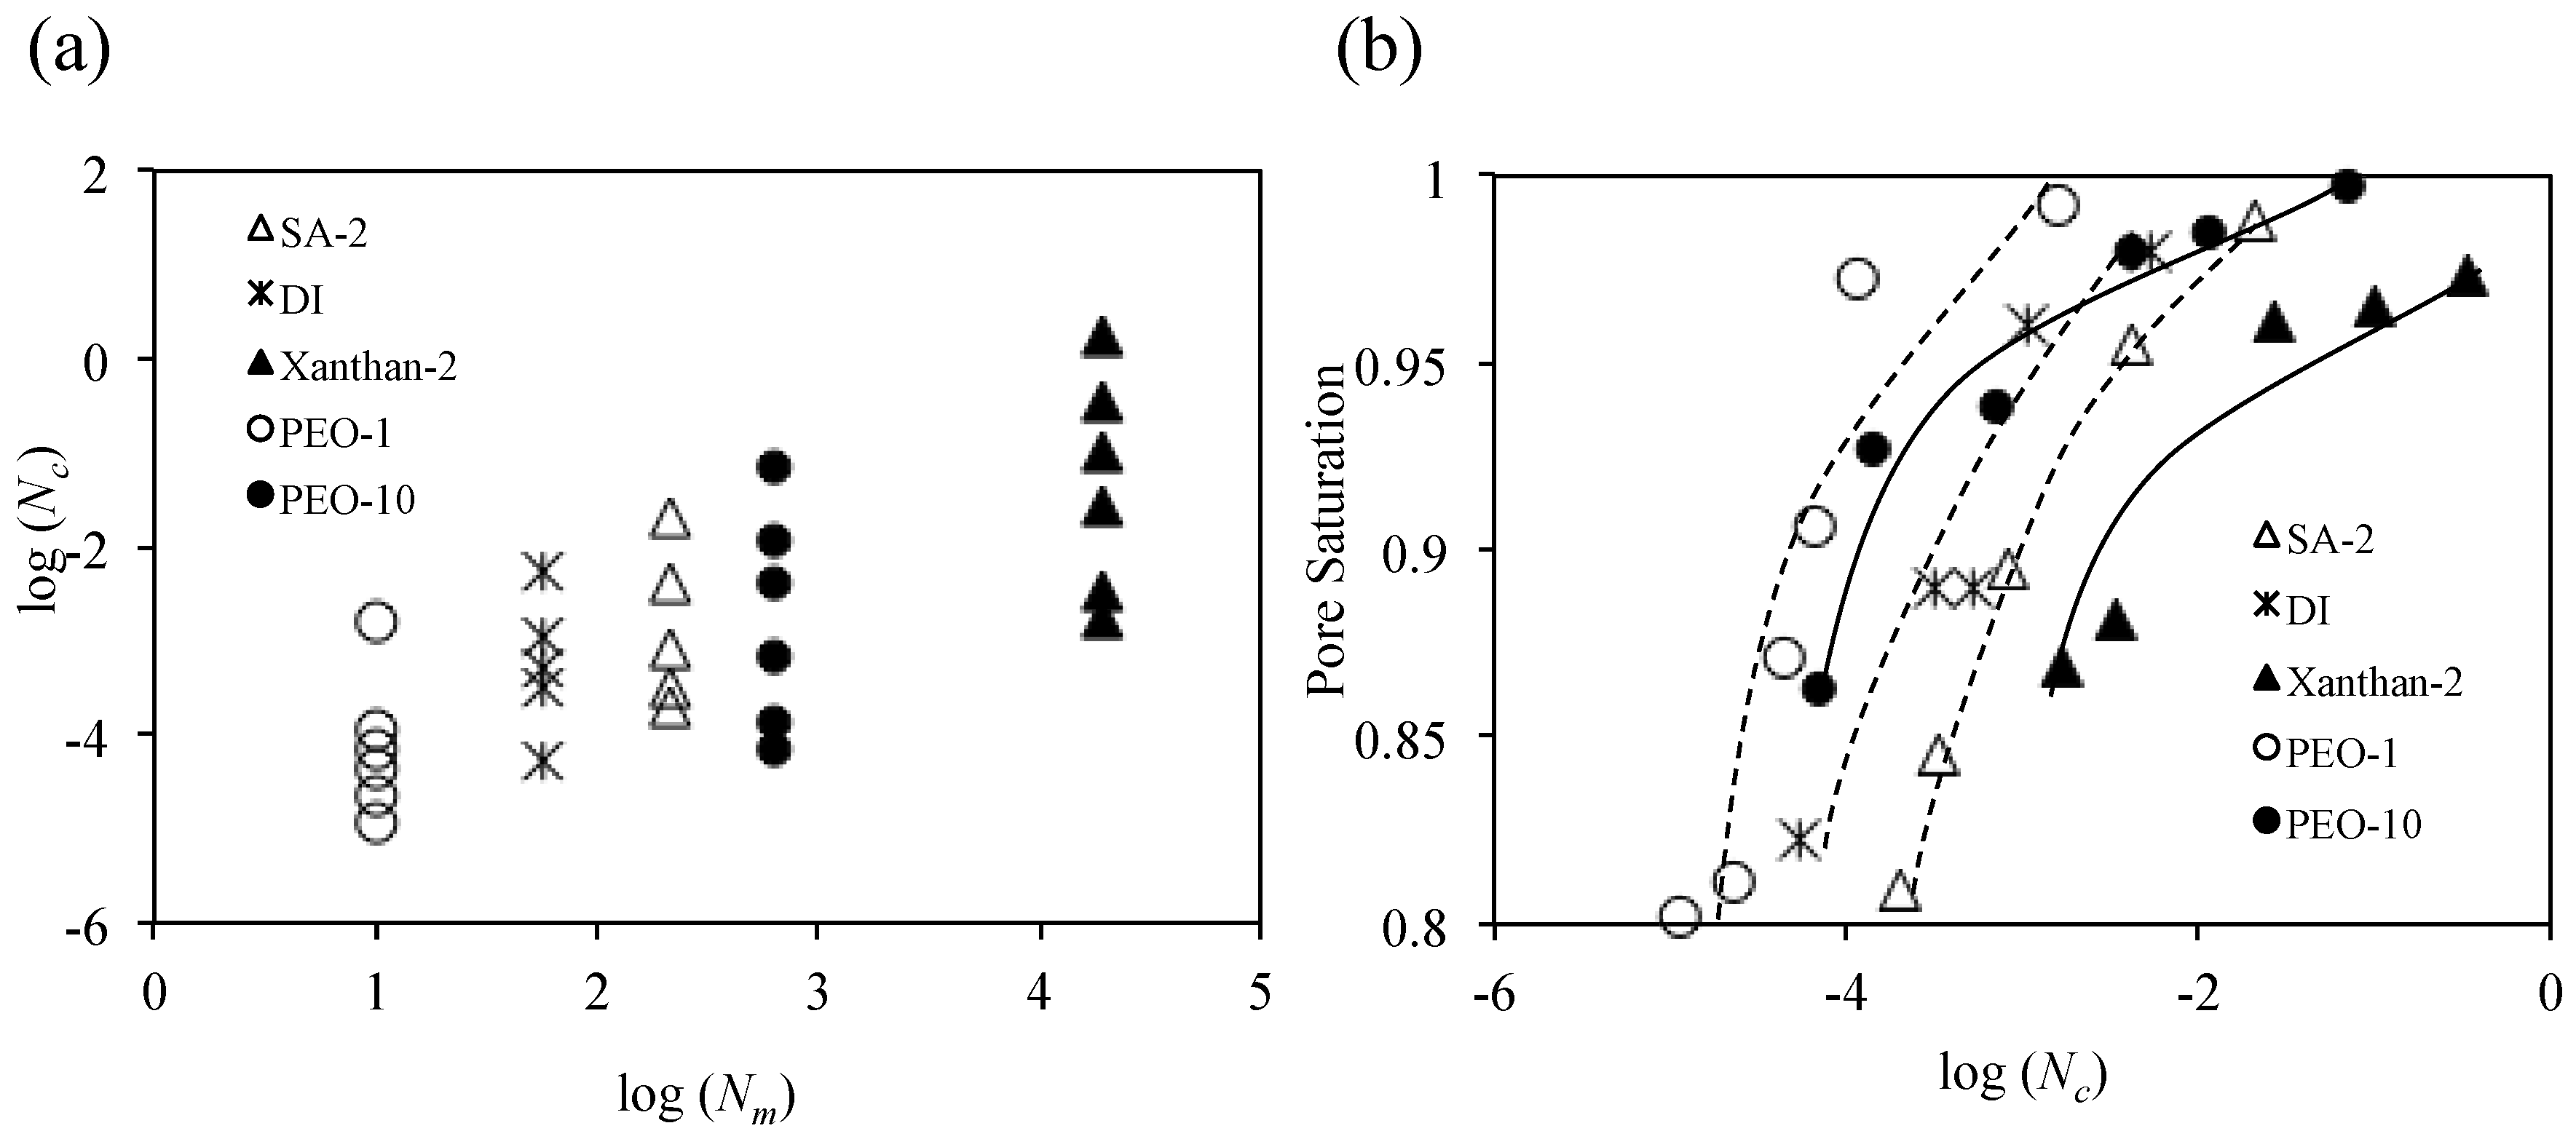
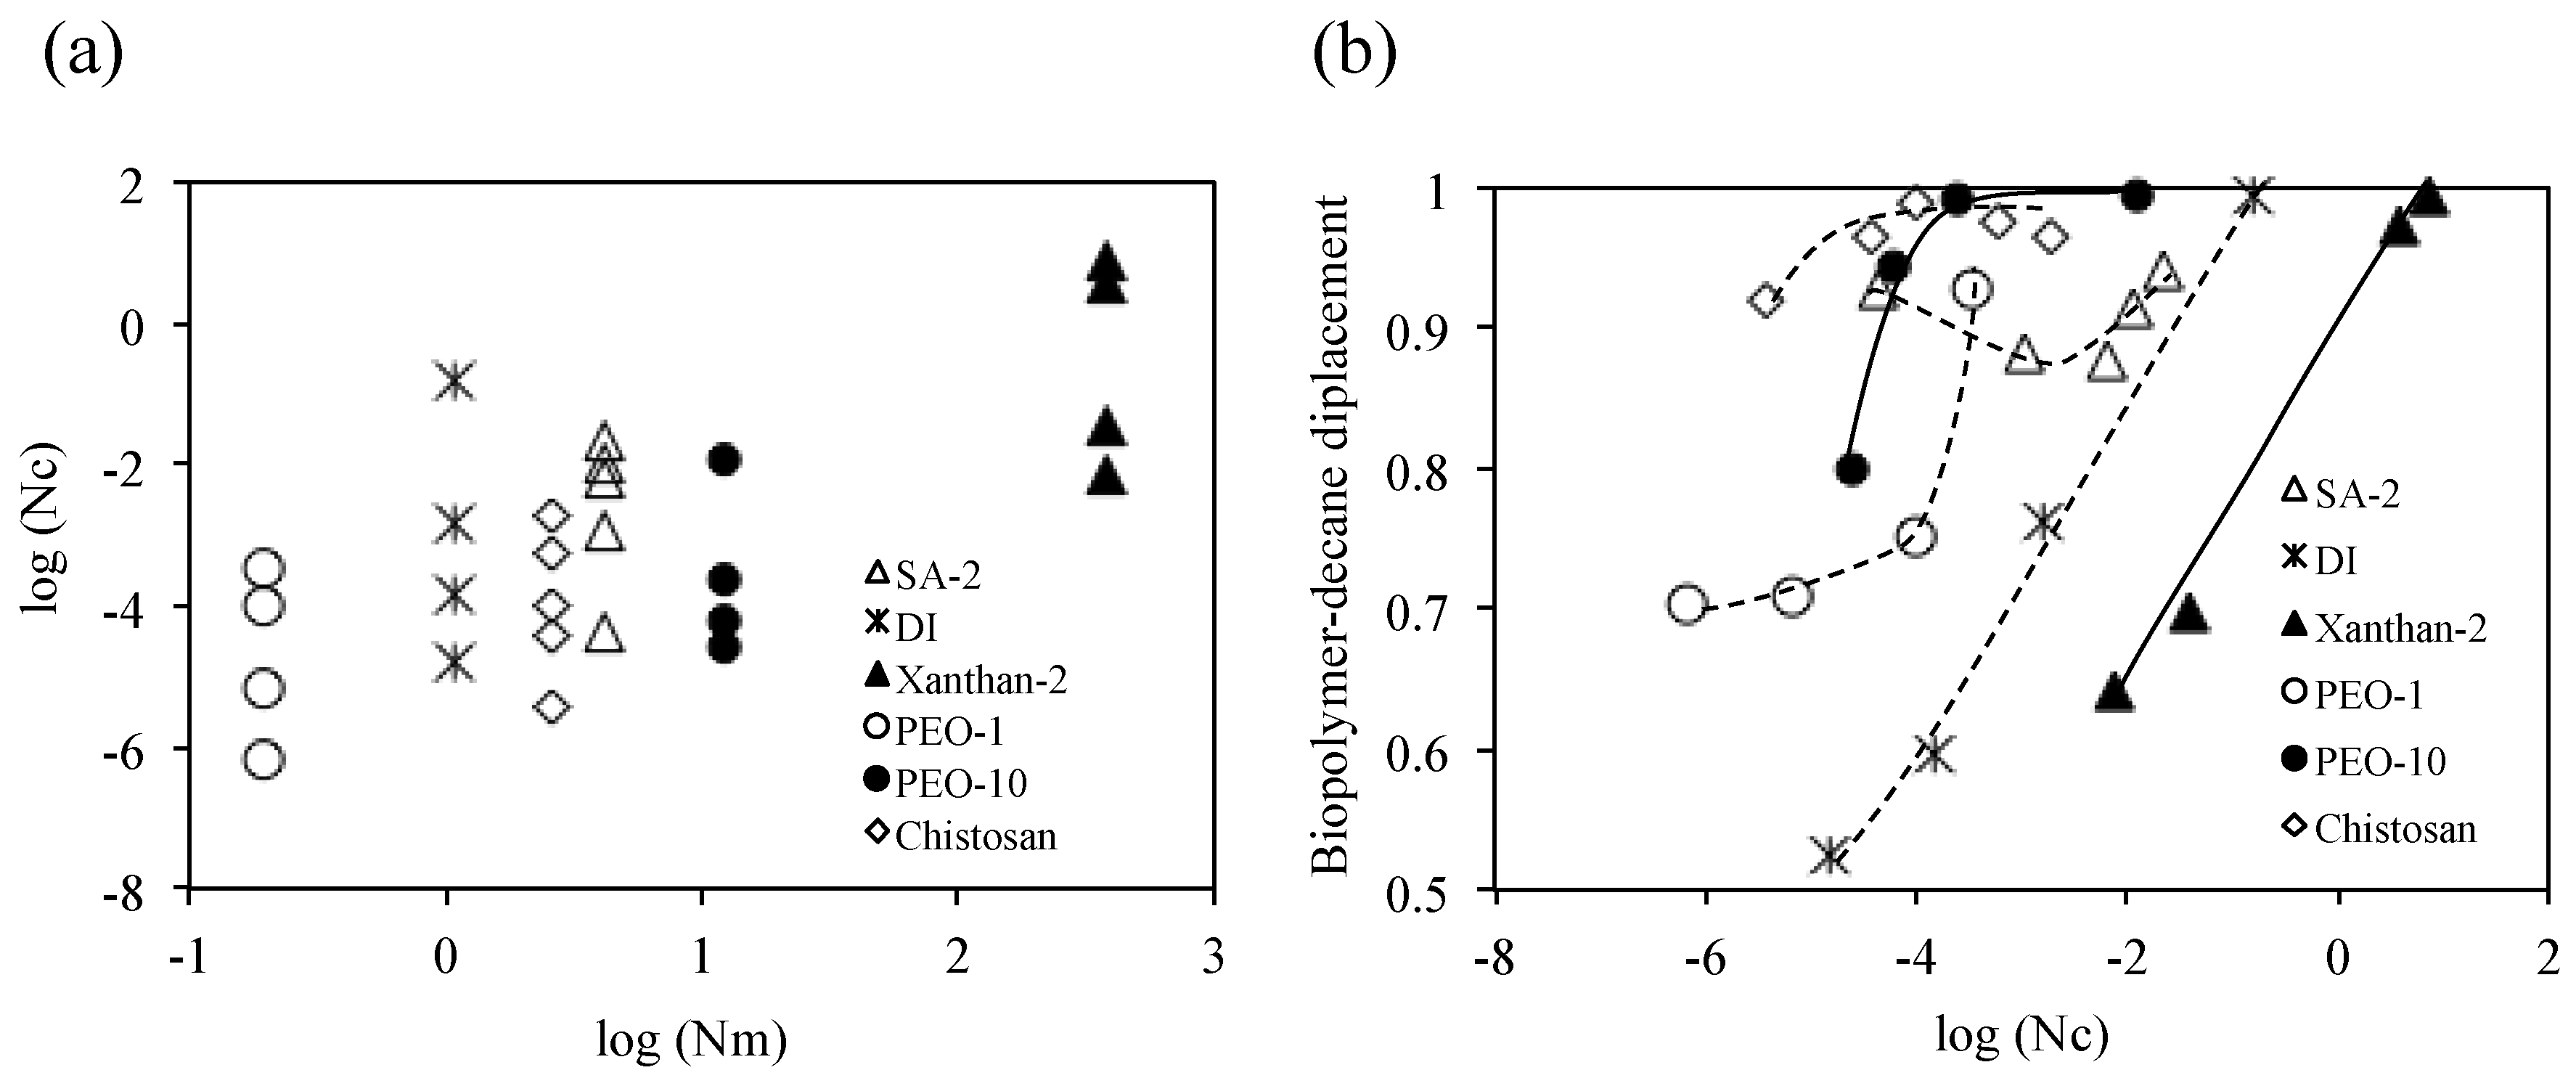
4.1. Viscous Number (Nm) and Capillary Number (Nc)

Nm and Nc values of each test in this study are calculated based on Equations (2) and (3), respectively. Injection velocity of biopolymer solution vinv is computed using the injection rate divided by the cross-sectional pore area (20 μm × 30 μm) of the micromodel. For example, an injection rate of 10 μL/min in this study corresponds to the injection velocity of 104.16 cm/min. Figure 11 and Figure 12 show the Nc and Nm values in our experiments, which are also relevant to field conditions, located at the transition region among the invading patterns represented by Lenormand (1990) [52]. Within this region, while the changes of Nm do not show any clear tendency in this study (Figure 11a and Figure 12a), biopolymer solution–decane displacement ratio (or biopolymer saturation) was clearly increased with Nc (Figure 11b and Figure 12b). This finding also agrees with previous pore network simulation results [62]. Thus, increasing the Nc value is recommended to increase the biopolymer solution–decane displacement ratio (or biopolymer saturation). Nc is proportional to injection velocity vinv, injected biopolymer solution viscosity μinv, and contact angle on the mineral surface θ, but inversely proportional to the interfacial tension σ (Equation (3)). The following techniques which increase Nc values are recommended for biopolymer solution injection into the porous media for oil-contaminated soil remediation and enhanced oil recovery: (1) increasing the biopolymer solution injection velocity (note: while excessively increasing velocity may cause potential plugging problems or others in the field, however, this study focuses on relations between injection velocity and displacement efficiency in the laboratory); (2) increasing the viscosity of biopolymer solutions by adding more biopolymer; and (3) increasing the contact angle and decreasing interfacial tension (or surface tension) controlling the concentration of biopolymer solution (note: preliminary results show the proportional changes of viscosity, contact angle, and interfacial tension with the concentration of biopolymer solutions). Conversely, any event that decreases the Nc value will impede the biopolymer solution injection efficiency for oil-contaminated soil remediation and enhanced oil recovery.

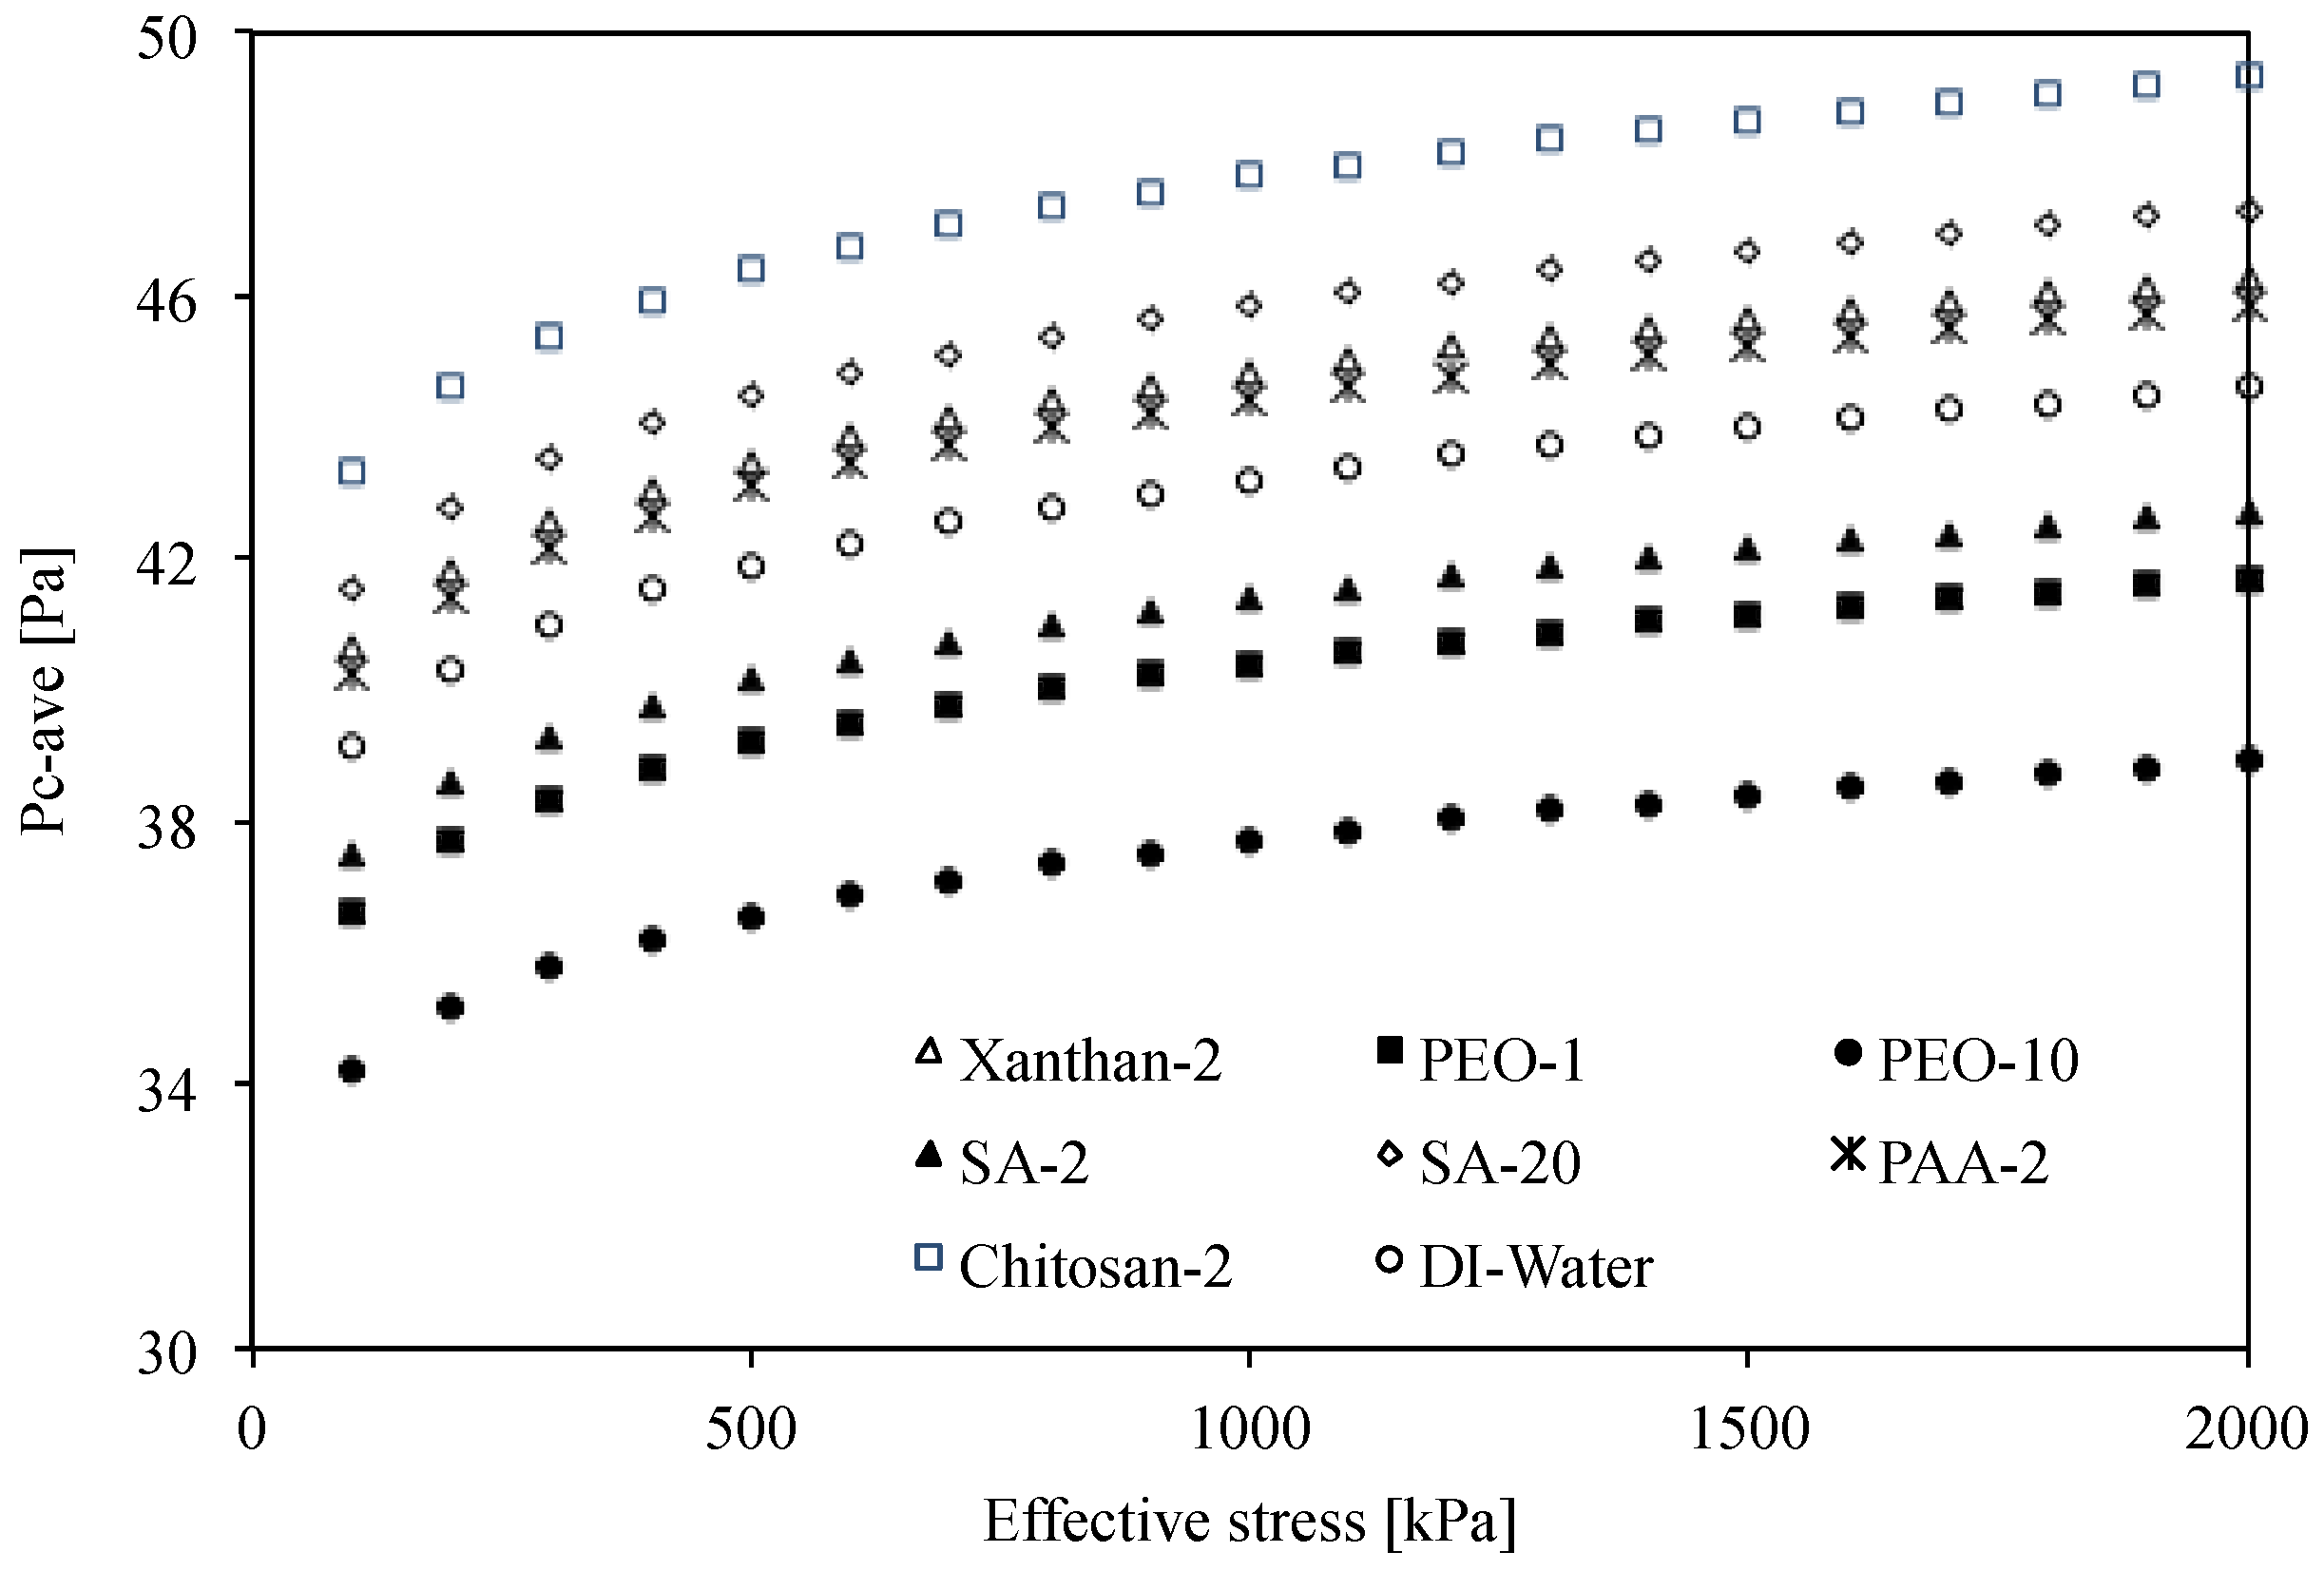
4.2. Effects of Effective Stress on Capillary Pressure

The capillary pressure curve is inherently dependent on pore-scale characteristics, including pore connectivity, size distribution, and gas–fluid–mineral contact properties in the manifestations of contact angle, interfacial tension (or surface tension), and hysteresis. To prove the effect of pore size distribution on the capillarity development during biopolymer solution–decane displacement, the following analysis is conducted to identify the influential factors and their interrelation. Capillary pressure as a function of effective stress p′, sediment compressibility (e1kps, Cc), pore structure (Ss, ασx), pressure-dependent surface tension σ, and contact angle θ are expressed (Equations (6) and (7)) [63]:
P c * = ψ S s   ρ σ   c o s θ e 1 k p a C c l o g p 1 k P a
ψ = 4 k 10 α σ x
where, p′ is the effective stress of sediments that are defined with a depth and unit weight of soil, Cc is the compressive index of sediments, e1kpa is the void ration of sediments at 1kPa effective stress, Ss is the specific surface, ρ is the density of mineral, k is the geometric factor between 6 and 12, σx is the standard deviation of pore size distribution, α is the factor of standard deviation, σ is the interfacial tension, and θ is the contact angle.
In general, the factor ψ = 4/   k 10 α σ x is in the range of 0.04 to 0.08 [63]. Table 2 shows soil properties of sand, silt, kaolinite, illite, and montmorillonite. For example, considering various effective stress conditions, the capillary pressure for each biopolymer solution to inject into silt sediments can be interpreted using both surface tension and contact angle measured in this study and the soil properties in Table 2. The results show that capillary pressure was increased with applied effective stress (Figure 13). It also shows that PEO-10 causes smallest capillary pressure, while Chitosan-2 causes the largest capillary pressure. Furthermore, higher capillary pressures are expected with (1) higher density minerals, (2) increase in the effective stress of sediments p′ that can be increased with the depth of sediments, (3) higher specific surface of mineral Ss, like clay materials, (4) higher compressive index Cc material, like clay, and (5) lower void ratio at 1kPa effective stress e1kpa.

5. Conclusions

Biopolymer solutions, such as chitosan, PEO, xanthan, SA, and PAA, are tested to identify the contact angle, surface tension, interfacial tension, and viscosity. Flow characteristics have been studied using a micromodel. The implications from the test results with regard to soil remediation and enhanced oil recovery are discussed below.
In the air, overall contact angles of all biopolymer solutions on silica surfaces are within the range of 31.7° to 41.2°, which is similar to deionized (DI) water (39.1°). Contact angles on silica surfaces submerged in decane are higher than those at atmospheric conditions and biopolymer solutions such as PEO-10, SA-20 and Xanthan-2, including deionized (DI) water (94.5°), even present as hydrophobic in decane. Overall contact angles of all biopolymer solutions on silica surfaces submerged in decane are within the range of 76.1° to 102.6°. Within the given range of contact angles, the effect of contact angles on flow behavior in porous media would be minor compared to the fluid injection rate.
While PEO-1 and PEO-10 solutions have lower surface tensions than deionized (DI) water, the rest of them (i.e., SA-2, SA-20, Chitosan-2, PAA-2, and Xanthan-2) have higher surface tensions than deionized (DI) water. Overall surface tensions are within the small range of 62 mN/m to 81 mN/m. Thus, the influence of surface tension for capillary pressure (Pc) and capillary number (Nc) is significant and more obvious than the contact angle (θ).
The viscosities of PAA-2 and Xanthan-2 have higher values than deionized (DI) water, which causes biopolymer solution–decane (or air) displacements to increase. Biopolymers have lower viscosities effect on less biopolymer solution–decane (or air) displacement at the same flow rates. Additionally, the viscosities of PAA-2 and Xanthan-2 solutions are highly dependent on shear rate. Therefore, it is important to properly determine the shear rate (that is, in turn, injection rate) in order to design soil remediation process and calculate the efficiency.
The biopolymer solution–decane (or air) displacement ratio was increased with the capillary number Nc, while its dependency on the viscosity number Nm remains unclear. The capillary number Nc in microscopic multiphase flow is different from that of the macroscopic flow, which is also associated with length scale, saturation history, and relative permeability. However, the biopolymer solution–decane (or air) displacement ratio was clearly increased with the increase in flow rate. Low flow rate results in low levels of displacement ratio, but the displacement ratio is higher for biopolymer solutions than deionized (DI) water. Thus, biopolymer injection would possibly lead to cost-efficient high flow rates.
In high-pressure reservoirs, the capillarity at the early stage is relatively lower, which is attributable to both increased contact angle and decreased interfacial tension. Within the function of effective stress of capillary pressure, estimation of capillary pressure can be achieved with measured interfacial tension and contact angle of fluids at different effective stress levels. In this research, the capillary pressure for each biopolymer has been estimated in silt sediments at different effective stress levels. Compared with all biopolymers, PEO-10 could result in the smallest capillary pressure at the same effective stress level compared with other biopolymers. On the contrary, Chitosan-2 leads to the largest capillary pressure. Furthermore, higher capillary pressure can be expected within (1) a decrease in contact angle θ, such as PEO-1 and PEO-10; (2) an increase in surface tension σ, like SA-2 and SA-20; (3) a higher density mineral; (4) an increase in effective stress of sediments p′ that can be increased with the depth of sediments; (5) a higher specific surface of mineral Ss, like clay materials; (6) a higher compressive index Cc material, like clay; and (7) lower void ratio at 1kPa effective stress.

Acknowledgments

This work was supported by FIER (The Fund for Innovative Engineering Research - Round V) grand award in Louisiana State University. This research was also supported by Basic Science Research Program through the National Research Foundation of Korea (NRF) funded by the Ministry of Science, ICT, and Future Planning (Grant No. 2015R1A2A1A15054704). Xiaoyi Zhao, a former master student at Missouri University of Science and Technology performed the viscosity, surface tension and contact angle measurements at water-air interface in low pressure.

Author Contributions

Bate Bate and Jongwon Jung conceived and designed the experiments; Bate Bate, Shuang Cindy Cao and Jong Wan Hu performed the experiments. Shuang Cindy Cao, Jong Wan Hu and Jongwon Jung analyzed the data and wrote the paper. All authors read and approved the final manuscript.

Conflicts of Interest

The authors declare no conflict of interest.

References

  1. Mitchell, R.; Nevo, Z. Effect of bacterial polysaccharide accumulation on infiltration of water through sand. Appl. Microbiol. Biotechnol. 1964, 12, 219–223. [Google Scholar]
  2. Bate, B.; Zhao, Q.; Burns, S. Impact of organic coatings on frictional strength of organically modified clay. J. Geotech. Geoenviron. Eng. 2013, 140, 228–236. [Google Scholar] [CrossRef]
  3. Briscoe, W.H.; Klein, J. Friction and adhesion hysteresis between surfactant monolayers in water. J. Adhes. 2007, 83, 705–722. [Google Scholar] [CrossRef]
  4. Cabalar, A.F.; Canakci, H. Ground Improvement by Bacteria; Taylor and Francis Group: Norman, OK, USA, 2005; pp. 707–712. [Google Scholar]
  5. Kang, X.; Kang, G.C.; Bate, B. Measurement of Stiffness Anisotropy of Kaolinite Using Bender Element Tests in a Floating Wall Consolidometer. Geotechn. Test. J. 2014, 37, 869–883. [Google Scholar] [CrossRef]
  6. Kavazanjian, E., Jr.; Iglesias, E.; Karatas, I. Biopolymer soil stabilization for wind erosion control. In Proceedings of the 17th International Conference Soil Mechnics Geotechnical Engineering, Alexandria, Egypt, 5–9 October 2009; pp. 881–884.
  7. Martin, G.; Yen, T.; Karimi, S. Application of biopolymer technology in silty soil matrices to form impervious barriers. In Proceedings of the 7th Australia New Zealand Conference on Geomechanics: Geomechanics in a Changing World, Melbourne, Australia, 1–5 July 1996; p. 814.
  8. Nugent, R.; Zhang, G.; Gambrell, R. The Effect of Exopolymers and Void Ratio on the Erosional Resistance of Cohesive Sediments; In Proceedings of Geo-Frontiers 2011@ Advances in Geotechnical Engineering, Dallas, TX, USA, 13–16 March 2011; ASCE: Reston, VA, USA, 2011; pp. 1493–1502.
  9. Yoshikawa, T.; Naito, Y.; Kishi, A.; Tomii, T.; Kaneko, T.; Iinuma, S.; Ichikawa, H.; Yasuda, M.; Takahashi, S.; Kondo, M. Role of active oxygen, lipid peroxidation, and antioxidants in the pathogenesis of gastric mucosal injury induced by indomethacin in rats. Gut 1993, 34, 732–737. [Google Scholar] [CrossRef] [PubMed]
  10. Hove, A.O.; Nilson, V.; Loknes, J. Visualization of xanthan flood behavior in core samples by means of x-ray tomography. SPE Reserv. Eng. 1990, 5, 475–480. [Google Scholar] [CrossRef]
  11. Philips, J.C.; Miller, J.W.; Wernau, W.C.; Tate, B.E.; Auerbach, M.H. A high-pyruvate xanthan for eor. Soc. Pet. Eng. J. 1985, 25, 594–602. [Google Scholar] [CrossRef]
  12. Pollock, T.J.; Thorne, L. Xanthomonas campestris strain for production of xanthan gum. Google Patents US5279961 A, 1994. [Google Scholar]
  13. Sandiford, B.B. Laboratory and field studies of water floods using polymer solutions to increase oil recoveries. J. Pet. Technol. 1964, 16, 917–922. [Google Scholar] [CrossRef]
  14. Strom, T.E.; Paul, J.M.; Phelps, C.H.; Sampath, K. A New Biopolymer for High-Temperature Profile Control: Part 1-Laboratory Testing. Soc. Pet. Eng. J. 1991, 6, 360–364. [Google Scholar] [CrossRef]
  15. Blokker, N.C.M. Analysis of Alginate-like Exopolysaccharides for the Application in Enhanced Oil Recovery. Master’s Thesis, Delft University of Technology, Delft, The Netherlands, 2014. [Google Scholar]
  16. Bailey, S.A.; Bryant, R.S.; Duncan, K.E. Use of Biocatalysts for Triggering Biopolymer Gelants; Society of Petroleum Engineers: Tulsa, OK, USA, 2000. [Google Scholar]
  17. Kosaric, N. Biosurfactants and their application for soil bioremediation. Food Technol. Biotechno. 2001, 39, 295–304. [Google Scholar]
  18. Leveratto, M.A.; Lauri, J.; Sanz, C.; Sigal, J.; Farouq Ali, S.M. EOR Polymer Screening For An Oil Field With High Salinity Brines. Soc. Pet. Eng. J. 1996, 4, 73–81. [Google Scholar] [CrossRef]
  19. Stepp, A.K.; Bailey, S.A.; Bryant, R.S.; Evans, D.B. Alternative Methods for Permeability Modification Using Biotechnology; Society of Petroleum Engineers: Denver, CA, USA, 1996. [Google Scholar]
  20. Meuser, H. Soil Remediation and Rehabilitation; Springer: Dordrecht, Germany, 2010; Volume 23, pp. 1–2. [Google Scholar]
  21. Swartjes, F.A. Dealing with Contaminated Sites; Springer: Dordrecht, Germany, 2011. [Google Scholar]
  22. Mulligan, C.; Eftekhari, F. Remediation with surfactant foam of pcp-contaminated soil. Eng. Geol. 2003, 70, 269–279. [Google Scholar] [CrossRef]
  23. Chai, J.C.; Miura, N. Field vapor extraction and long-term monitoring at a pce contaminated site. J. Hazard. Mat. 2004, 110, 85–92. [Google Scholar] [CrossRef] [PubMed]
  24. Cho, J.S.; DiGiulio, D.C.; Wilson, J.T. In-situ air injection, soil vacuum extraction aqnd enhanced biodegradation: A case study in a jp-4 jet fuel contaminated site. Environ. Prog. 1997, 16, 570–576. [Google Scholar] [CrossRef]
  25. Hall, B.L.; Lachmar, T.E.; Dupont, R.R. Field monitoring and performance evaluation of a field-scale in-well aeration system at a gasoline-contaminated site. J. Hazard. Mater 2001, 82, 197–212. [Google Scholar] [CrossRef]
  26. Tse, K.K.C.; Lo, S.L.; Wang, J.W.H. Pilot study of in-situ thermal treatment for the remediation of pentachlorophenol-contaminated aquifers. Environ. Sci. Technol. 2001, 35, 4910–4915. [Google Scholar] [CrossRef] [PubMed]
  27. Mann, M.; Dahlstrom, J.D.; Esposito, P.; Everett, G.; Peterson, G.; Traver, R.P. Soil washing/soil flushing. In Innovative Site Remediation Technology; Anderson, W.C., Ed.; WASTECH (American Academy of Engineers): Annapolis, MD, USA, 1993. [Google Scholar]
  28. Khatami, H.R.; O’Kelly, B.C. Improving mechanical properties of sand using biopolymers. J. Geotech. Geoenviron. Eng. 2013, 139, 1402–1406. [Google Scholar] [CrossRef]
  29. Lee, M.; Chung, S.; Kang, D.; Choi, S.; Kim, M. Surfactant enhanced in-site soil flushing pilot test for the soil and groundwater remediation in an oil contaminated site. J. Korean Soc. Soil Groundw. Environ. 2002, 7, 77–86. [Google Scholar]
  30. Rouse, J.D.; Sabatini, D.A.; Brown, R.E.; Harwel, L.J.H. Evaluation of ethoxylated alkylsulfate surfactants for use in subsurface remediation. Water Environ. Res. 1996, 68, 162–168. [Google Scholar] [CrossRef]
  31. Sabatini, D.A.; Knox, R.C. Transport and Remediation of Subsurface Contaminants: Colloidal, Interfacial and Surfactant Phenomena; ACS: Washington, DC, USA, 1992; p. 834. [Google Scholar]
  32. Jafvert, C.T. Surfactants/Cosolvents, Technology Evaluation Report TE-96-02; Groundwater Remediation Technologies Analysis Center: Pittsburgh, PA, USA, 1996; p. 45. [Google Scholar]
  33. Jawitz, J.W.; Annable, M.D.; Rao, P.S.C.; Rhue, R.D. Field implementation of a winsor typesurfactant/alcohol mixture for in situ solubilization of a complex lnapl as a single-phase microemulsion. Environ. Sci. Technol. 1998, 32, 523–530. [Google Scholar] [CrossRef]
  34. Lee, M.; Kang, H.; Do, W. Application of nonionic surfactant-enhanced in situ flushing to a diesel contaminated site. Water Res. 2005, 39, 139–146. [Google Scholar] [CrossRef] [PubMed]
  35. Mulligan, C.N.; Yong, B.R.; Gibbs, B.F. Surfactant-enhanced remediation of contaminated soil: A review. Eng. Geol. 2001, 60, 371–380. [Google Scholar] [CrossRef]
  36. Park, S.K.; Bielefeldt, A.R. Non-ionic surfactant flushing of pentachlorophenol from napl-contaminated soil. Water Res. 2005, 39, 1388–1396. [Google Scholar] [CrossRef] [PubMed]
  37. Tsai, T.T.; Kao, C.M.; Yeh, T.Y.; Liang, S.H.; Chien, H.Y. Application of surfactant enhanced permanganate oxidation and biodegradation of trichloroethylene in groundwater. J. Hazard. Mater. 2009, 161, 111–119. [Google Scholar] [CrossRef] [PubMed]
  38. Zhou, W.; Zhu, L. Enhanced soil flushing of phenanthrene by anionic-nonionic mixed surfactant. Water Res. 2008, 42, 101–108. [Google Scholar] [CrossRef] [PubMed]
  39. Lake, L.W.; Johns, R.; Rossen, B.; Pope, G. Fundamentals of enhanced oil recovery; Society of Petroleum Engineers: Richardson, TX, USA, 2014. [Google Scholar]
  40. Hong, C.H.; Jang, C.H.; Choi, H.J. Turbulent drag reduction with polymers in rotating disk flow. Polymers 2015, 7, 1279–1298. [Google Scholar] [CrossRef]
  41. Sorbie, K.S. Polymer-Improved Oil Recovery; Blackie & Son: Glasgow, UK, 1991; p. 359. [Google Scholar]
  42. Delamaide, E.; Zaitoun, A.; Gérard, R.; Tabary, T. Pelican lake field: First successful application of polymer flooding in a heavy-oil reservoir. SPE Reserv. Elval. Eng. 2013, 17, 340–354. [Google Scholar]
  43. Moawad, T.; Elhomadhi, E.; Gawish, A. Novel promising, high viscosifier, cheap, available and environmental friendley biopolymer (polymtea) for different applications at reservoir conditions under investigation. Part a: Polymer properties. In Processing of The Seventh Egyptian-Syrian Conference in Chemical and Petroleum Engineering, Suez, Egypt, 29–31 October 2007.
  44. Jung, J.C.; Zhang, K.; Chon, B.H.; Choi, H.J. Rheology and polymer characteristics of partially hydrolyzed polyacrylamide for enhanced heavy oil recovery. J. Appl. Polymer Sci. 2013, 127, 4833. [Google Scholar] [CrossRef]
  45. Jang, H.Y.; Zhang, K.; Chon, B.H.; Choi, H.J. Enhanced oil recovery performance and viscosity characteristics of polysaccharide xanthan gum solution. J. Ind. Eng. Chem. 2015, 21, 741–745. [Google Scholar] [CrossRef]
  46. Cho, D.H.; Chae, H.J.; Kim, E.Y. Synthesis and characterization of a novel extracellular polysaccharide by rhodotorula glutinis. Appl. Biochem. Biotechnol. 2001, 98, 183–193. [Google Scholar] [CrossRef]
  47. Akit, R.J.; Cooper, D.G.; Neufield, R.J. Effects of oil reservoir conditions on the production of water-insoluble levan by bacillus licheniformis. Geomicrobiol. J. 1989, 7, 115–165. [Google Scholar]
  48. Canella, W.J.; Huh, C.; Seright, R.S. Prediction of xanthan rheology in porous media. In Processing of SPE Annual Technical Conference and Exhibition, Houston, TX, USA, 2–5 October, 1988; Society of Petroleum Engineers: Richardson, TX, USA, 1988. [Google Scholar]
  49. Kim, D.S.; Fogler, H.S. The effects of exopolymers on cell morphology and culturability of l. Mesenteroides during starvation. Appl. Microbiol. Biotechnol. 1999, 52, 839–844. [Google Scholar] [CrossRef] [PubMed]
  50. Sandford, P.A. Exocellular microbial polysaccharides. Adv. Carbohydr. Chem. Biochem. 1979, 36, 265–312. [Google Scholar] [PubMed]
  51. Bear, J. Dynamics of Fluids in Porous Media; Dover Publications Inc.: New York, NY, USA, 1972. [Google Scholar]
  52. Lenormand, R. Liquids in porous media. J. Phys. Condens. Matter 1990, 2, 79. [Google Scholar] [CrossRef]
  53. Lenormand, R.; Touboul, E.; Zarcone, C. Numerical models and experiments on immiscible displacements in porous media. J. Fluid Mech. 1988, 189, 165–187. [Google Scholar] [CrossRef]
  54. Buchgraber, M. An enhanced oil recovery micromodel study with associative and conventional polymers. Master’s Thesis, University of Leoben, Austria, 2008; pp. 16–30. [Google Scholar]
  55. Daripa, P.; Pasa, G. On capillary slowdown of viscous fingering in immiscible displacement in porous media. Transp. Porous Media 2008, 75, 1–16. [Google Scholar] [CrossRef]
  56. Lenormand, R.; Zarcone, C.; Sarr, A. Mechanisms of the displacement of one fluid by another in a network of capillary ducts. J. Fluid Mech. 1983, 135, 337–353. [Google Scholar] [CrossRef]
  57. Goosen, M.F.A. Applications of Chitin and Chitosan; CRC: Boca Raton, FL, USA, 1996; pp. 132–139. [Google Scholar]
  58. Woodmansey, A. Chitosan Treatment of Sediment Laden Wate-Washington State I-90 Issaquah Project; Federal Highway Administration: Washington, DC, USA, 2012. [Google Scholar]
  59. Kahovec, J.; Fox, R.B.; Hatada, K. Nomenclature of regular single-strand organic polymers. Pure Appl. Chem. 2002, 74, 1921–1956. [Google Scholar] [CrossRef]
  60. Orwoll, R.A.; Yong, C.S. Poly (Acrylic Acid); Oxford University Press, Inc: Oxford, UK, 1999; pp. 252–253. [Google Scholar]
  61. Adamson, A.W.; Gast, A.P. Physical Chemistry of Surfaces, 6th ed.; Wiley: New York, NY, USA, 1997. [Google Scholar]
  62. Ferer, M.; Bromhal, G.S.; Smith, D.H. Pore-level modeling of carbon dioxide sequestration in brine fields. J. Energy Environ. Res. 2002, 2, 120–132. [Google Scholar]
  63. Espinoza, D.N.; Santamarina, J.C. Water-CO2-mineral systems: Interfacial tension, contact angle, and diffusion-implications to CO2 geological storage. Water Resour. Res. 2010, 46, W07537. [Google Scholar] [CrossRef]
  64. Burland, J.B. On the compressibility and shear strength of natural clays. Geotechnique 1990, 40, 329–378. [Google Scholar] [CrossRef]
  65. Lambe, T.W.; Whitman, R.V. Soil Mechanics; Wiley: New York, NY, USA, 1969. [Google Scholar]
  66. Mitchell, J.K.; Soga, K. Fundamentals of Soil Behavior; Wiley: New York, NY, USA, 2005. [Google Scholar]
  67. Santamarina, J.C.; Klein, K.A.; Fam, M.A. Soils and Waves: Particulate Materials Behavior, Characterization and Process Monitoring; Wiley: New York, NY, USA, 2001; pp. 250–280. [Google Scholar]
  68. Skempton, A.W. The consolidation of clays by gravitational compaction. Q. J. Geol. Soc. 1970, 125, 373–411. [Google Scholar] [CrossRef]
Figure 1. Invading patterns of immiscible fluids in porous media. The displacement pattern of non-reactive flow in porous media is determined by the viscosity number (Nm) and capillary number (Nc) [52,53].
Sustainability 08 00205 g001
Figure 2. Chemical composition structure (a) PAA (polyacrylic acid) (~1,000,000 g/mol); (b) chitosan (chitosan, 85% deacetylated power); (c) PEO (polyethylene oxide) (600,000 g/mol); (d) SA (alginic acid sodium salt); and (e) xanthan (xanthan gum).
Sustainability 08 00205 g002
Figure 3. Contact angle of biopolymer solution; (a) schematic diagram of contact angle of biopolymer solution on silica surface, and (b) biopolymer droplet on silica surface submerged in decane.
Sustainability 08 00205 g003
Figure 4. Contact angles of biopolymer solutions. (a) Contact angles on silica surfaces at atmospheric conditions, and (b) contact angle on silica surfaces submerged in decane (DI: deionized water).
Sustainability 08 00205 g004
Figure 5. Surface and interfacial tensions. (a) Surface tensions of biopolymer solutions, and (b) interfacial tensions between biopolymer solution–decane.
Sustainability 08 00205 g005
Figure 6. Shear rate effect on viscosity of biopolymer solution. (a) Viscosity of Xanthan-2, PAA-2, and SA-20. (b) Viscosity of SA-2, PEO-1, PEO-10, Chitosan-2, and deionized (DI) water.
Sustainability 08 00205 g006
Figure 7. Schematic design for micromodel setup (Note: Figure not drawn to scale).
Sustainability 08 00205 g007
Figure 8. Biopolymer solution–decane (or air) displacement using micromodel, (a) micromodel, and (b) the injection of biopolymer solution into the decane-saturated micromodel.
Sustainability 08 00205 g008
Figure 9. Effects of biopolymer injection rate on pore saturation of biopolymer solutions on a logarithmic scale. The pore saturation generally increases with the injection rate of biopolymer solution.
Sustainability 08 00205 g009
Figure 10. Effects of biopolymer injection rate on biopolymer solution–decane displacement ratios on a logarithmic scale. The displacement ratio was generally increased with the injection rate of the biopolymer solution.
Sustainability 08 00205 g010
Figure 11. Pore saturation of biopolymers at various Nc and Nm conditions. (a) The experimental conditions are within the transition region of the log(Nc)-log(Nm) plot. (b) Pore saturation of biopolymers generally increases along with the log(Nc).
Sustainability 08 00205 g011
Figure 12. Biopolymer–decane displacement ratios at various Nc and Nm conditions. (a) The experimental conditions are within the transition region of the log(Nc)-log(Nm) plot. (b) The biopolymer–decane displacement generally increases along with the log(Nc).
Sustainability 08 00205 g012
Figure 13. Capillary pressure caused by different biopolymers into silt sediments as function of effective stress.
Sustainability 08 00205 g013
Table 1. Biopolymer Solutions.
PEO-1PEO-10SA-2SA-20Xanthan-2PAA-2Chitosan-2
Concentration (g/L)110220222
Table 2. Soil properties in relationship between capillary pressure and effective stress [63,64,65,66,67,68].
Soil PropertiesSandSiltKaoliniteIlliteMontmorillonite
Ss (m2/g)0.0440.045–1.010.0–20.065–100300–780
ρparticle (t/m3)2.655–2.6592.7982.652.6–2.92.35
ρbulk (t/m3)1.586–2.0831.37.69--
e100 (at 100 Kpa)0.35–0.850.6–0.80.9–1.12.0–3.02.5–4.0
Cc<0.020.02–0.090.2–0.40.5–1.11.0–2.0

