
Water Quality Assessment and Pollution Source Identification of the Eastern Poyang Lake Basin Using Multivariate Statistical Methods


Abstract
:1. Introduction
2. Materials and Methods
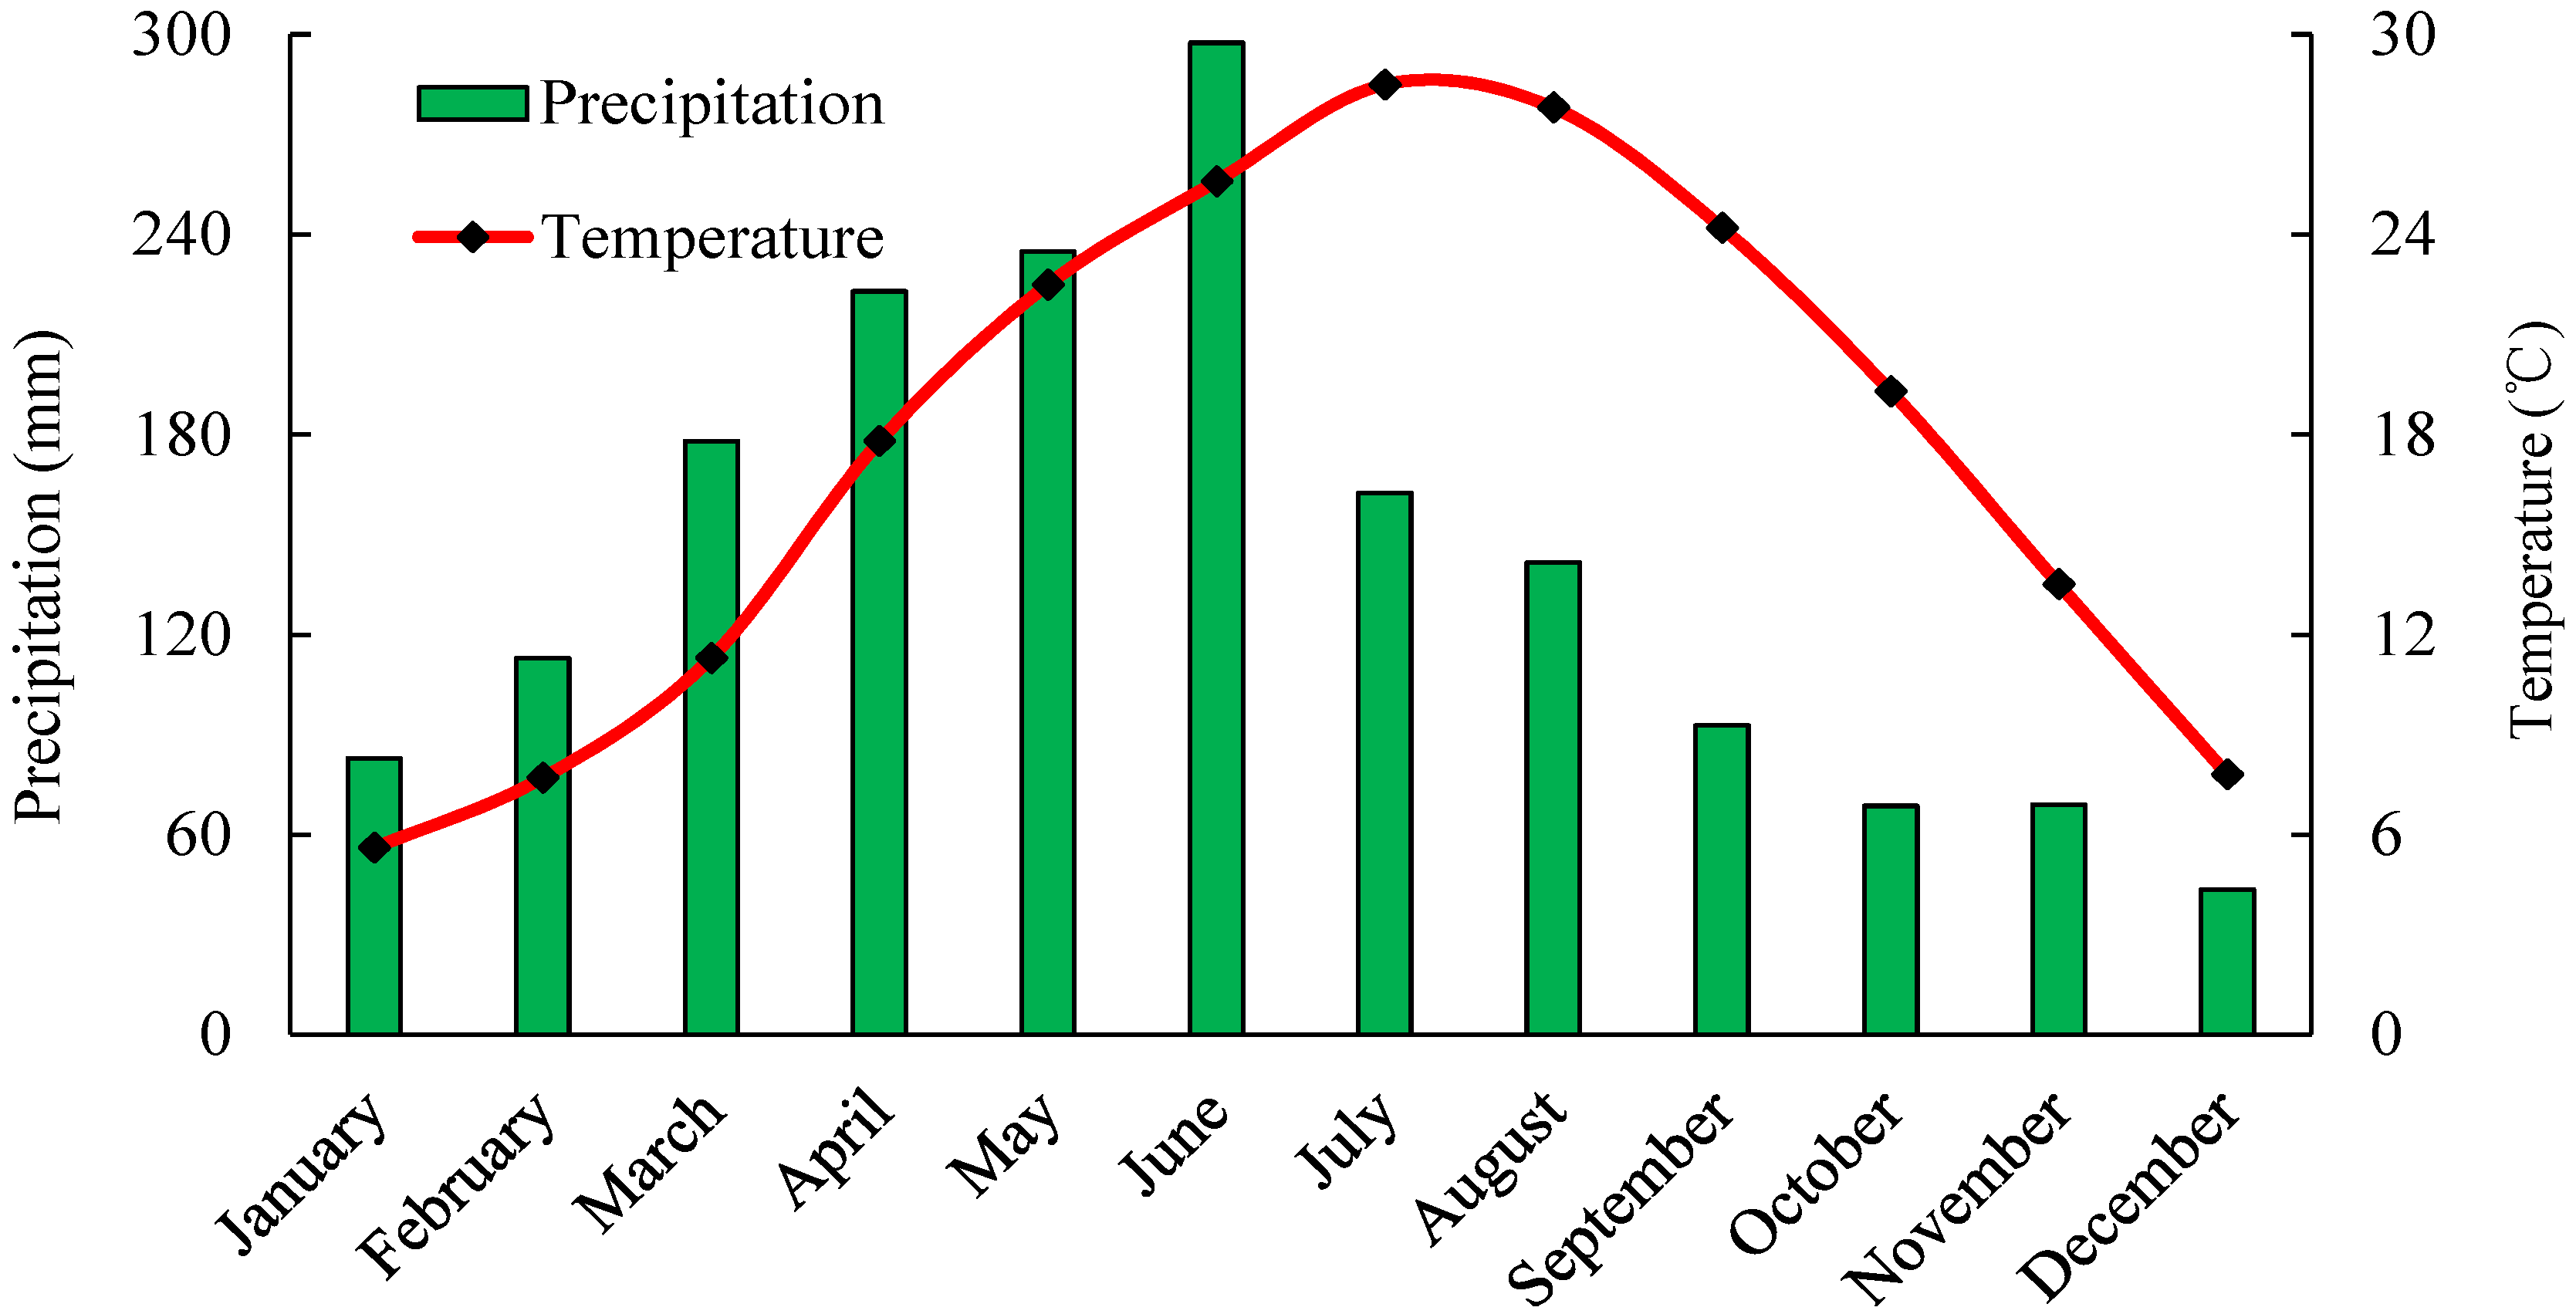
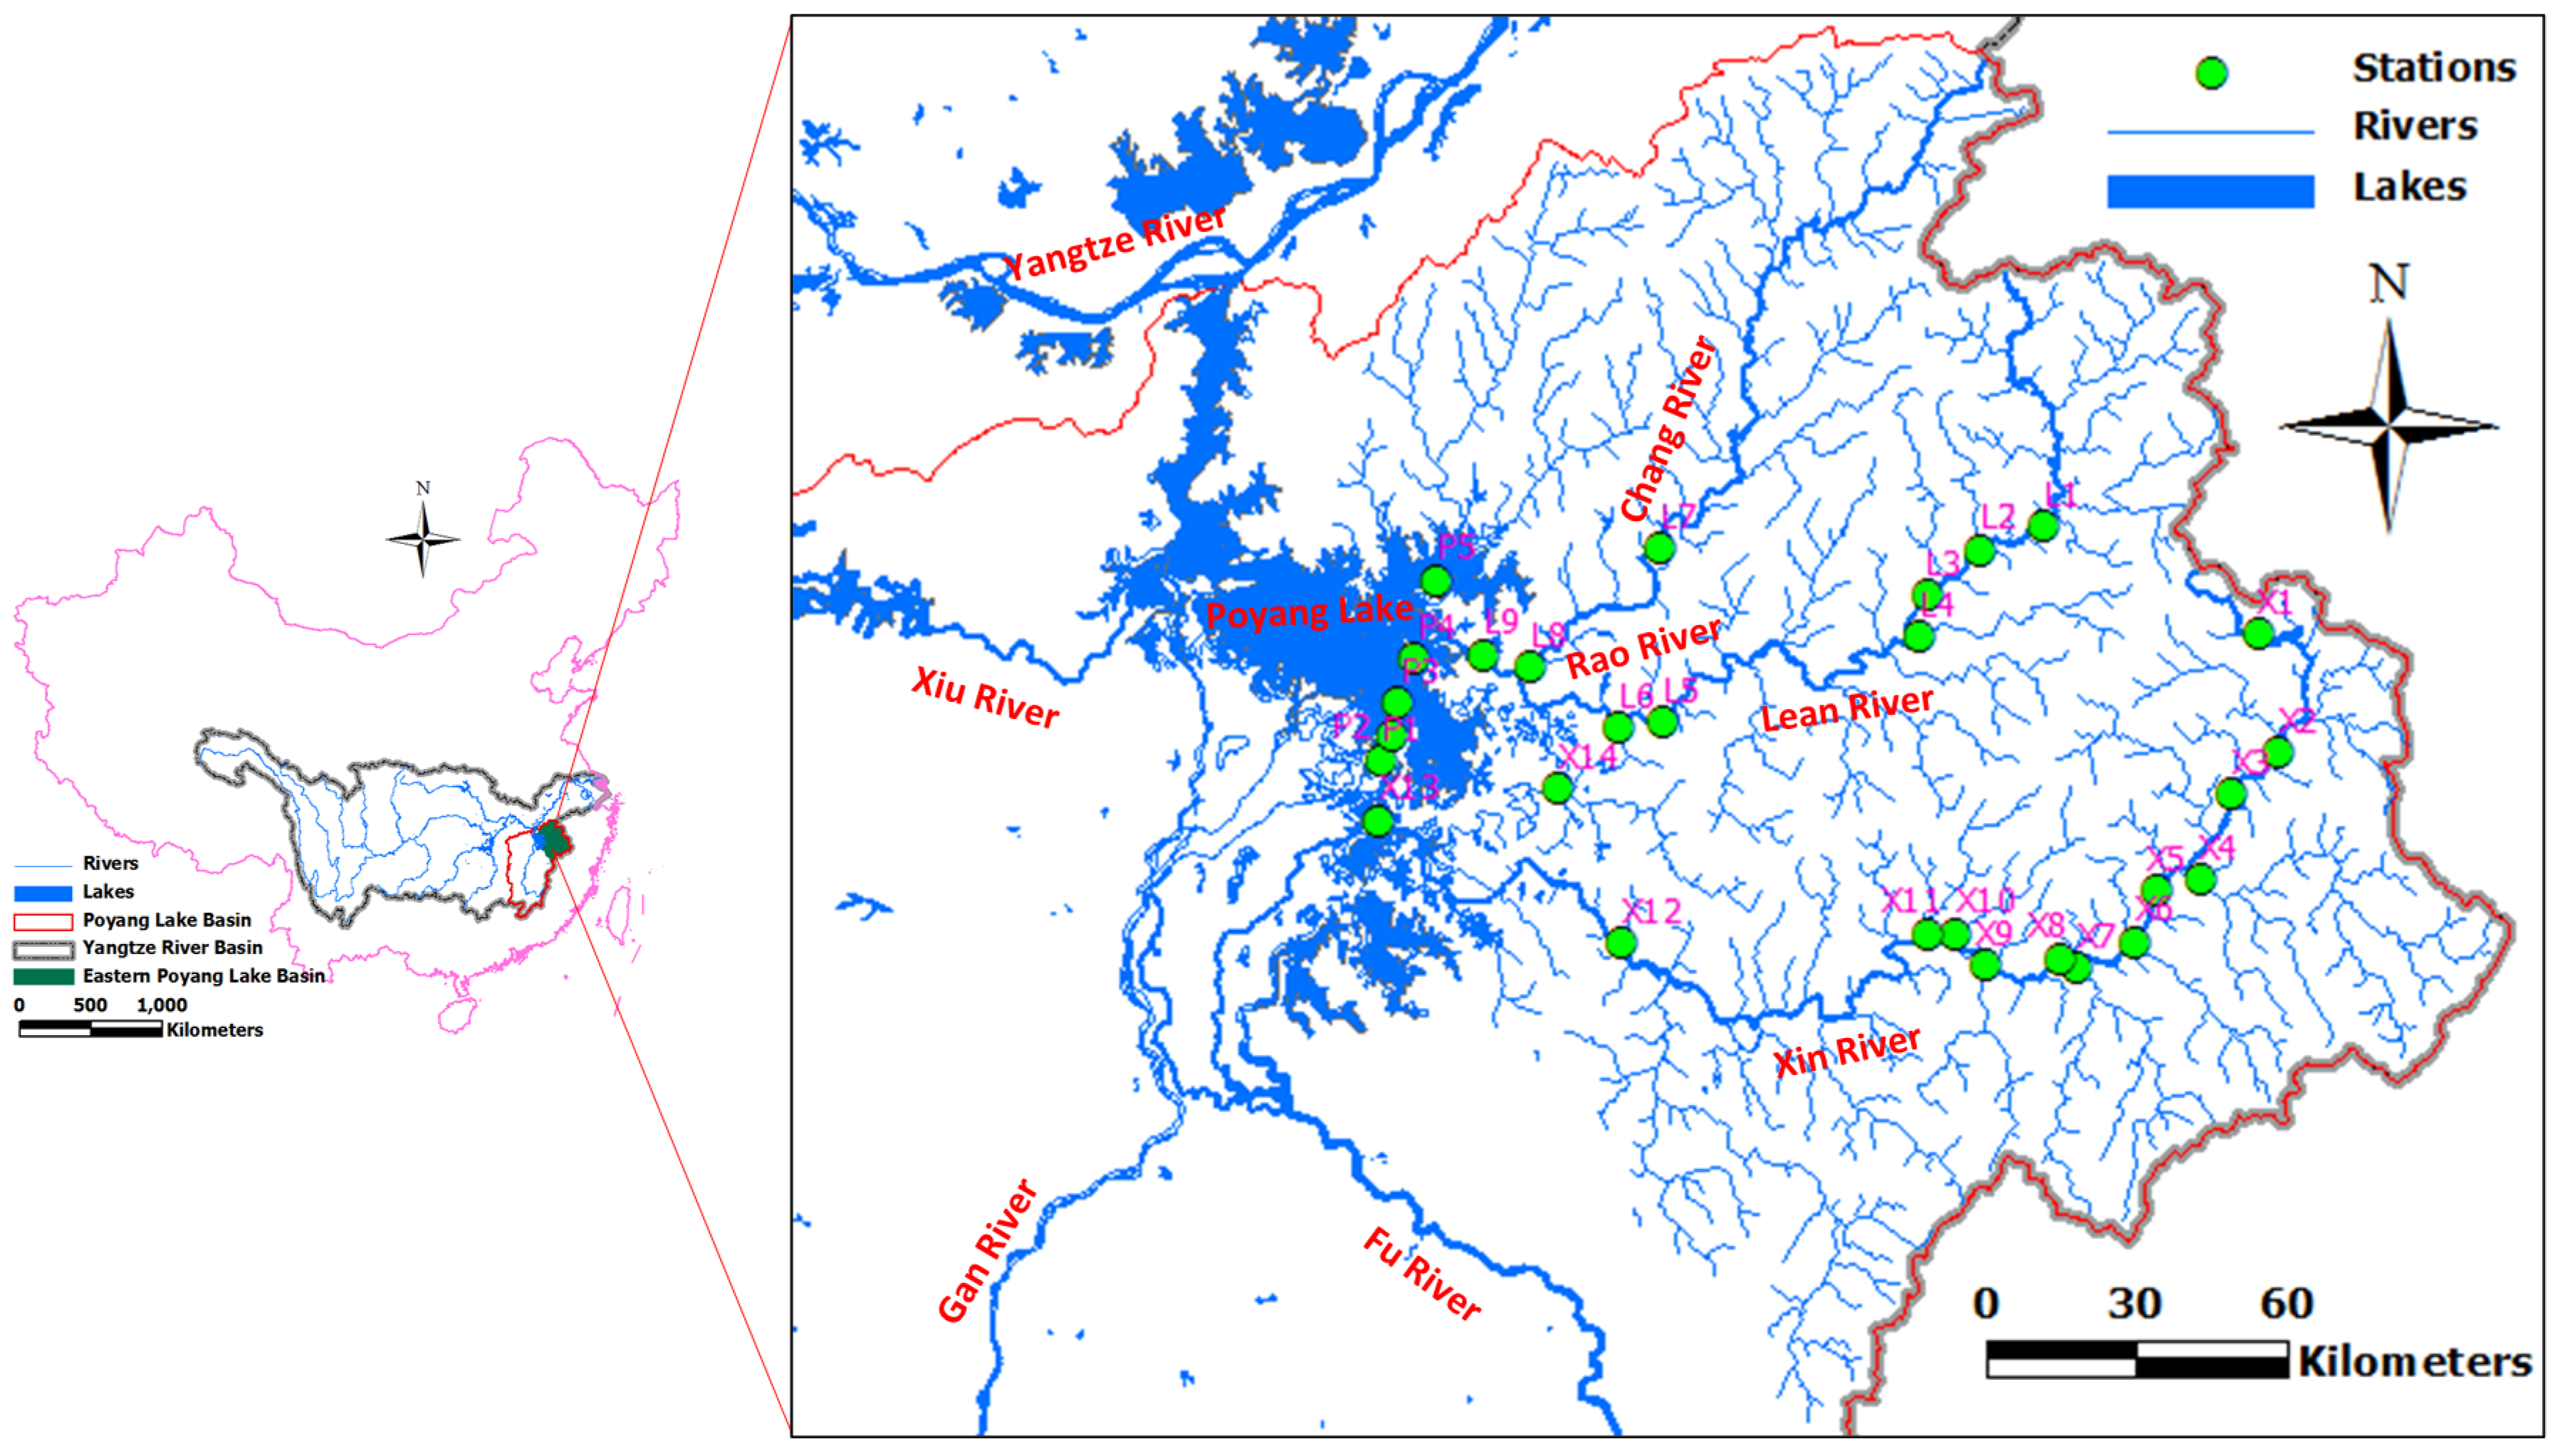
2.1. Study Area

2.2. Monitored Parameters and Analytical Methods

| Parameters | Abbreviations | Units | Analytical Methods | Lowest Detected Limit |
|---|---|---|---|---|
| Temperature | TEMP | °C | Thermometer | - |
| pH | pH | Glass electrode | - | |
| Dissolved oxygen | DO | mg/L | Iodimetry | 0.2 |
| Ammonia nitrogen | NH4+-N | mg/L | N-reagent colorimetry | 0.05 |
| Biochemical oxygen demand | BOD | mg/L | Dilution and inoculation test | 2 |
| Chemical oxygen demand | COD | mg/L | Potassium permanganate method | 0.5 |
| Total nitrogen | TN | mg/L | Ultraviolet spectrophotometry | 0.05 |
| Total phosphorus | TP | mg/L | Ammonium molybdate spectrophotometry | 0.01 |
| Cuprum | Cu | mg/L | Atomic absorption spectrometry | 0.001 |
| Zinc | Zn | mg/L | Atomic absorption spectrometry | 0.05 |
| Fluoride | F | mg/L | Ion chromatography | 0.05 |
| Oil | Oil | mg/L | Infrared spectrophotometry | 0.01 |
| Sulphide | S | mg/L | Methylene blue spectrophotometric | 0.005 |
| chromium | Cr | mg/L | dpc colorimetric | 0.004 |
2.3. Multivariate Statistical Methods
3. Results and Discussion
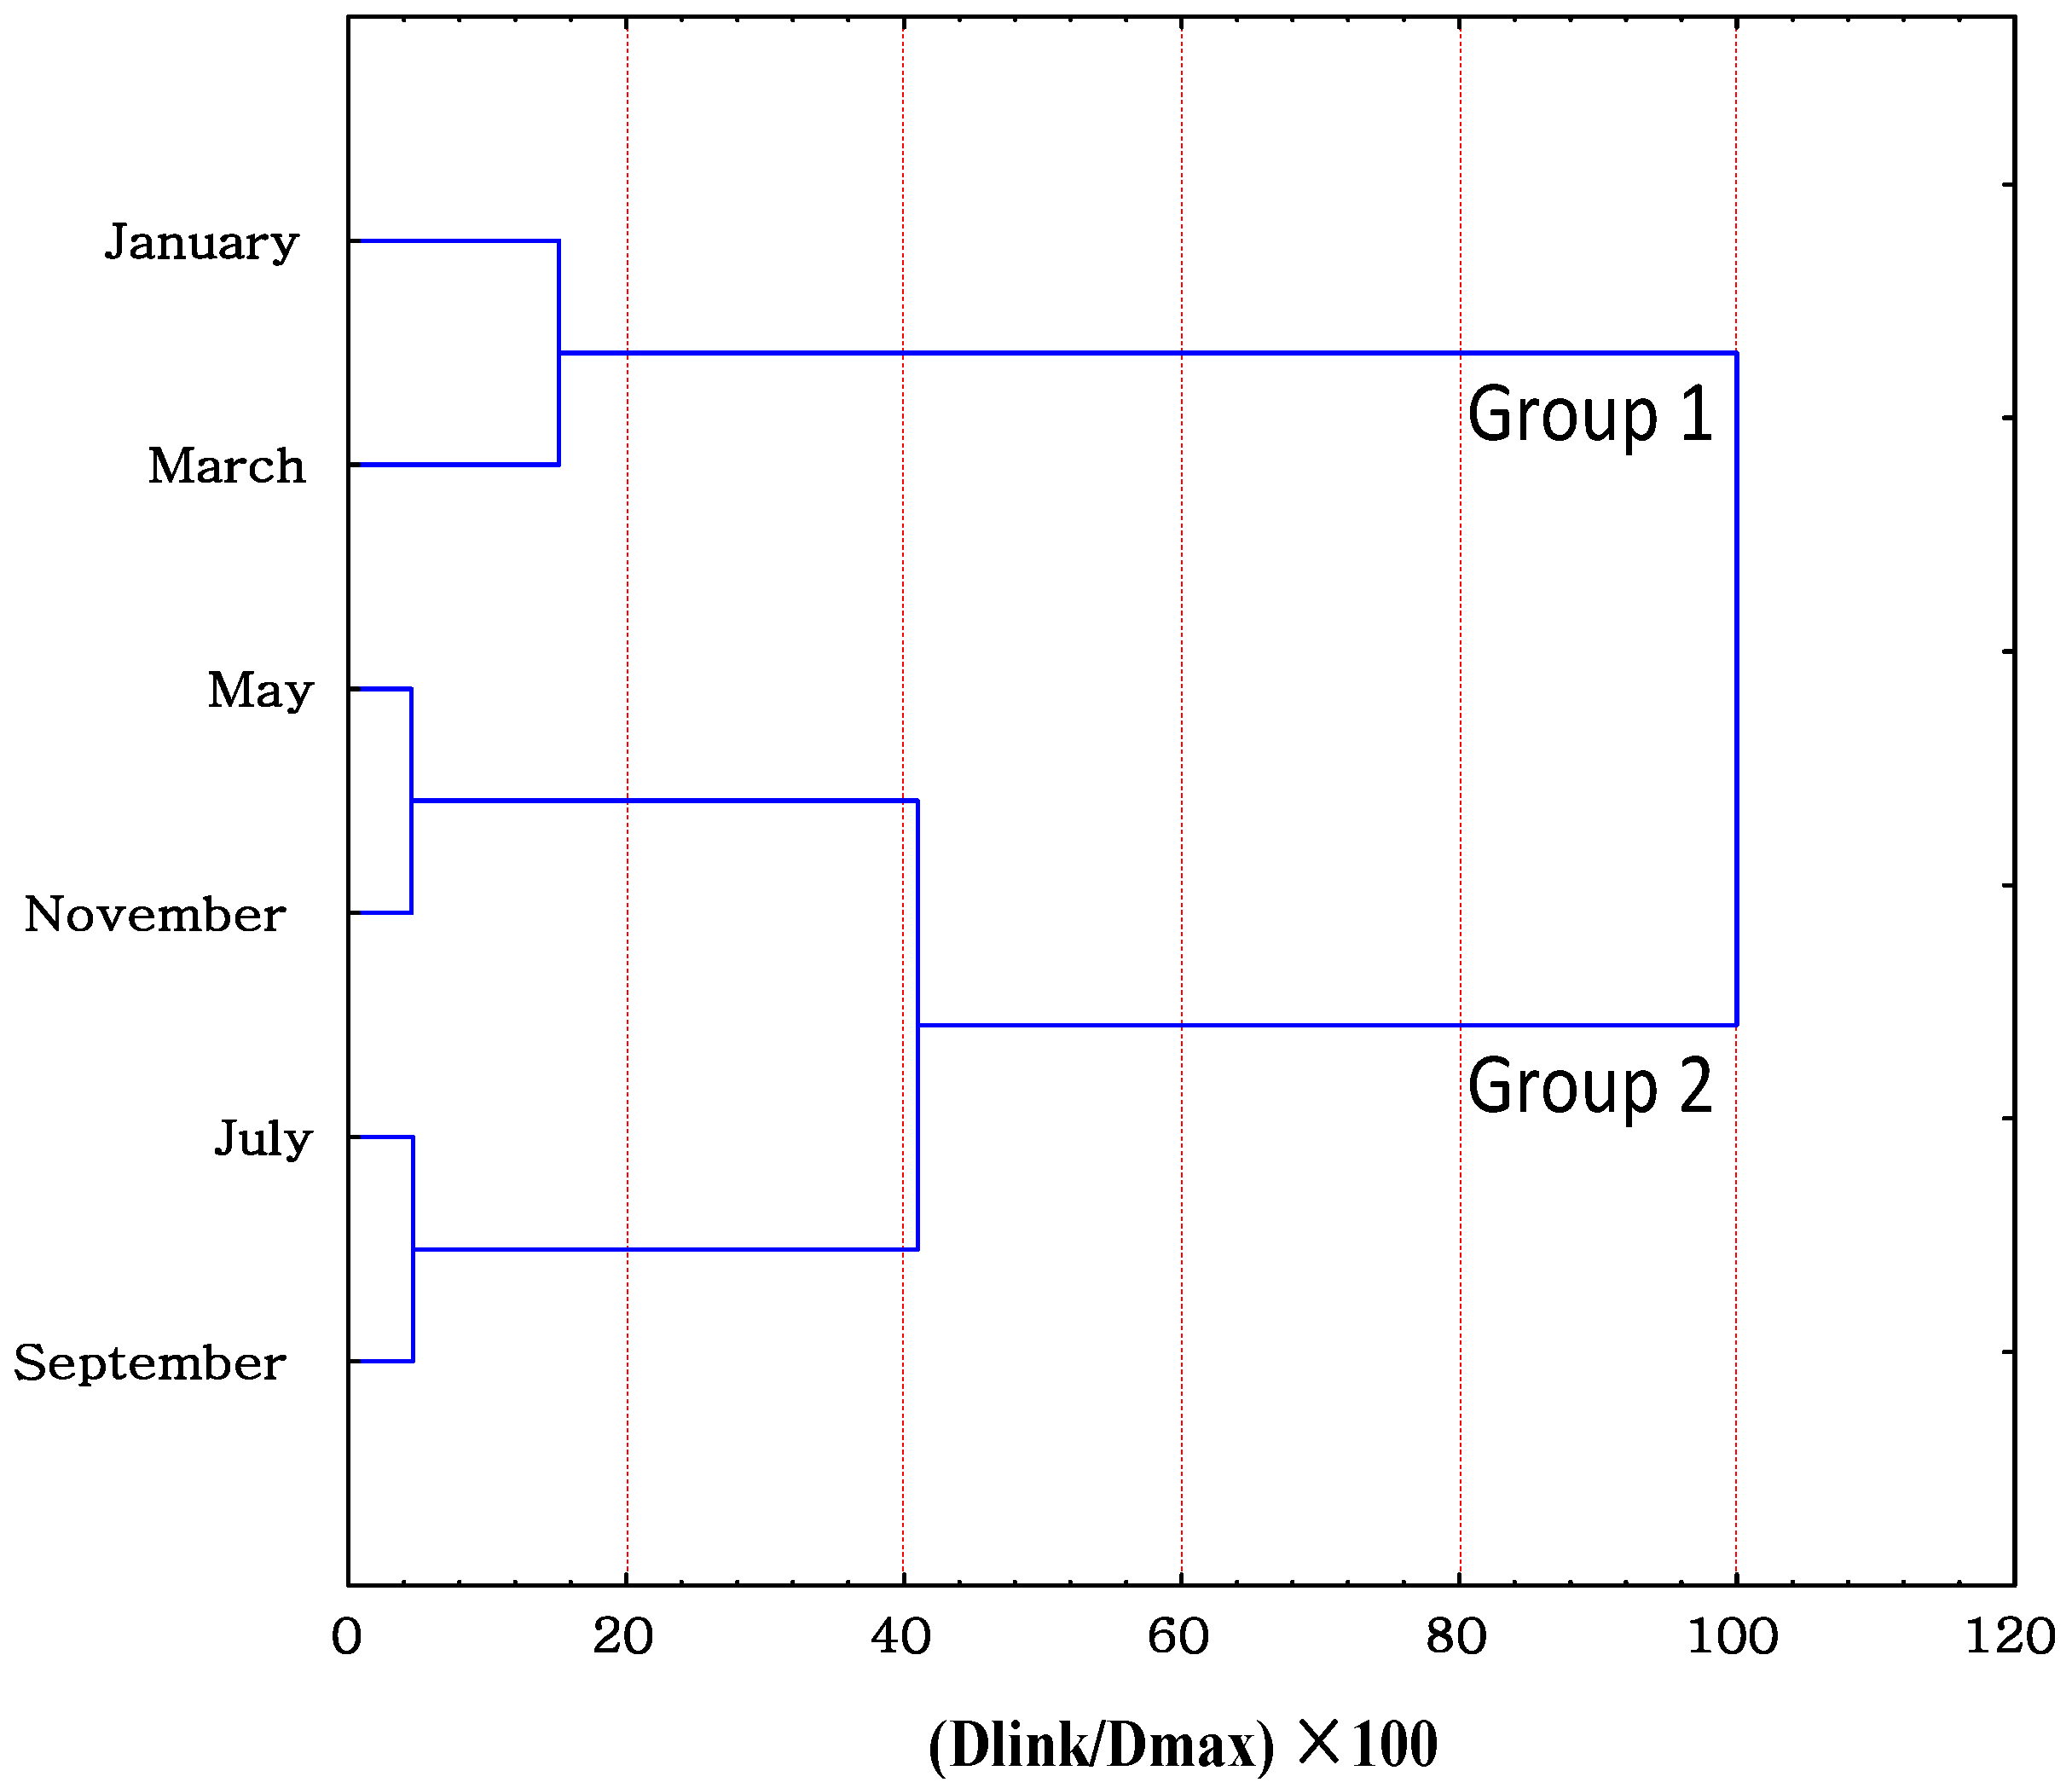
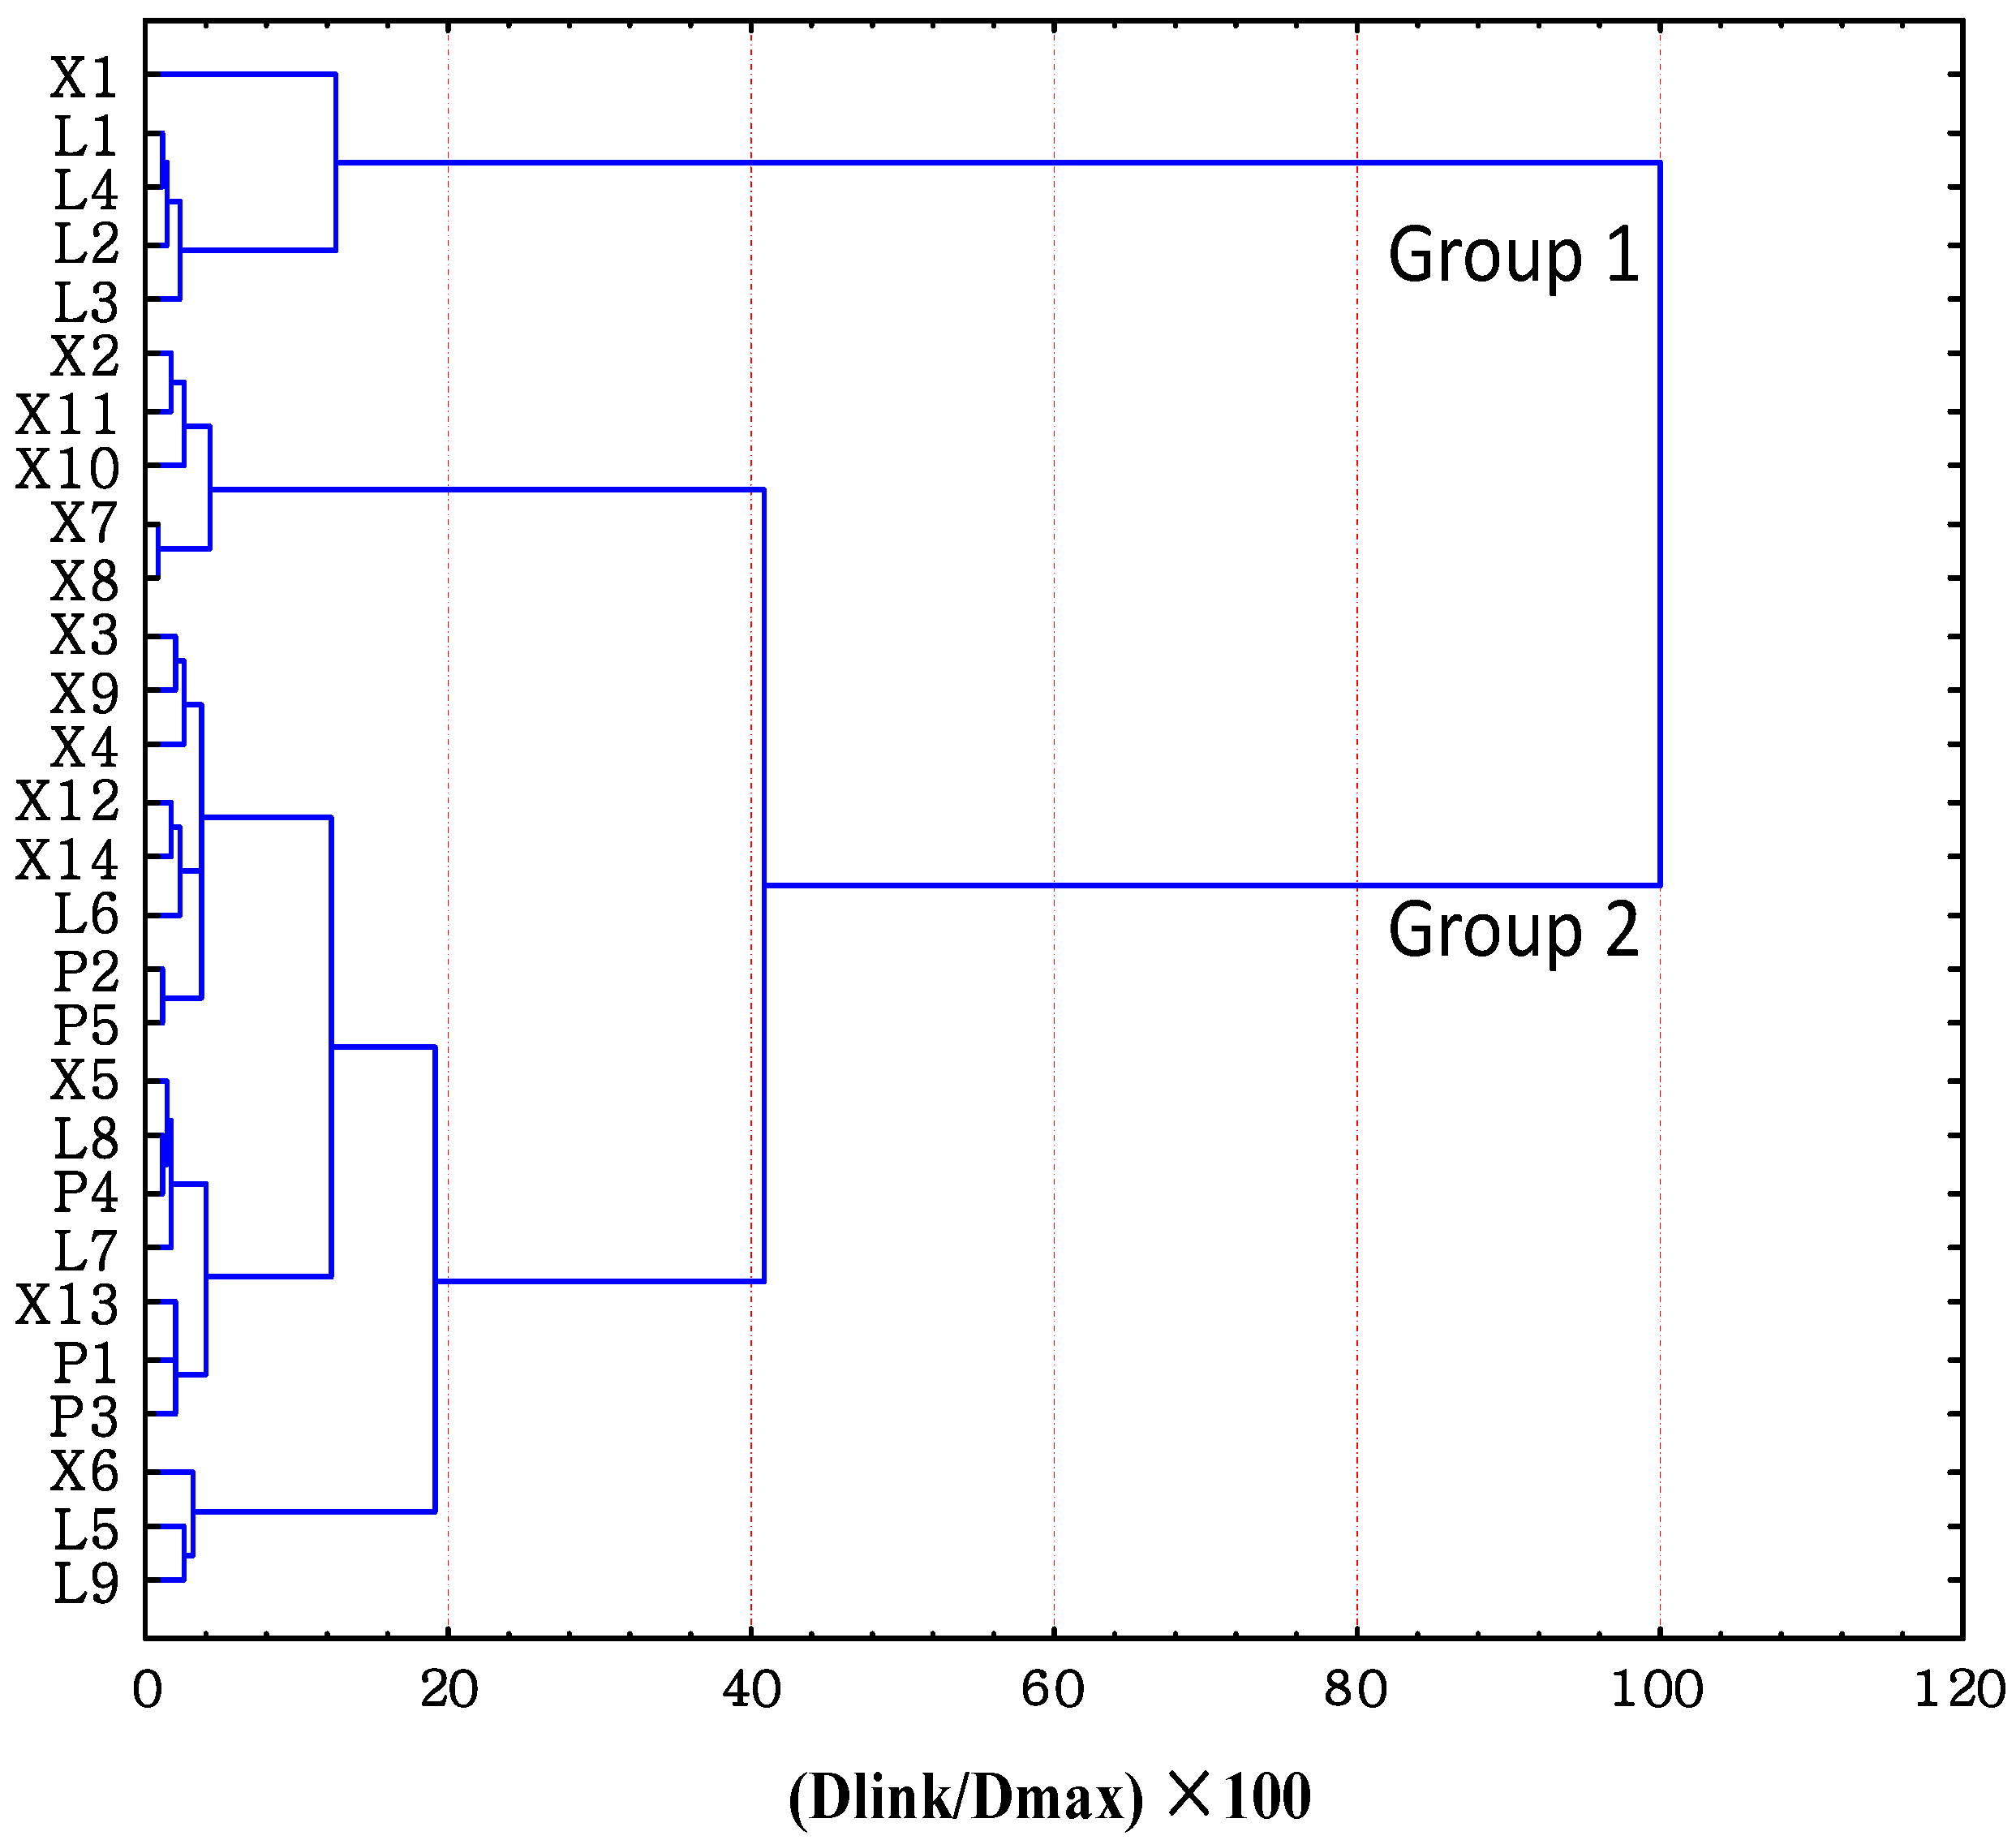
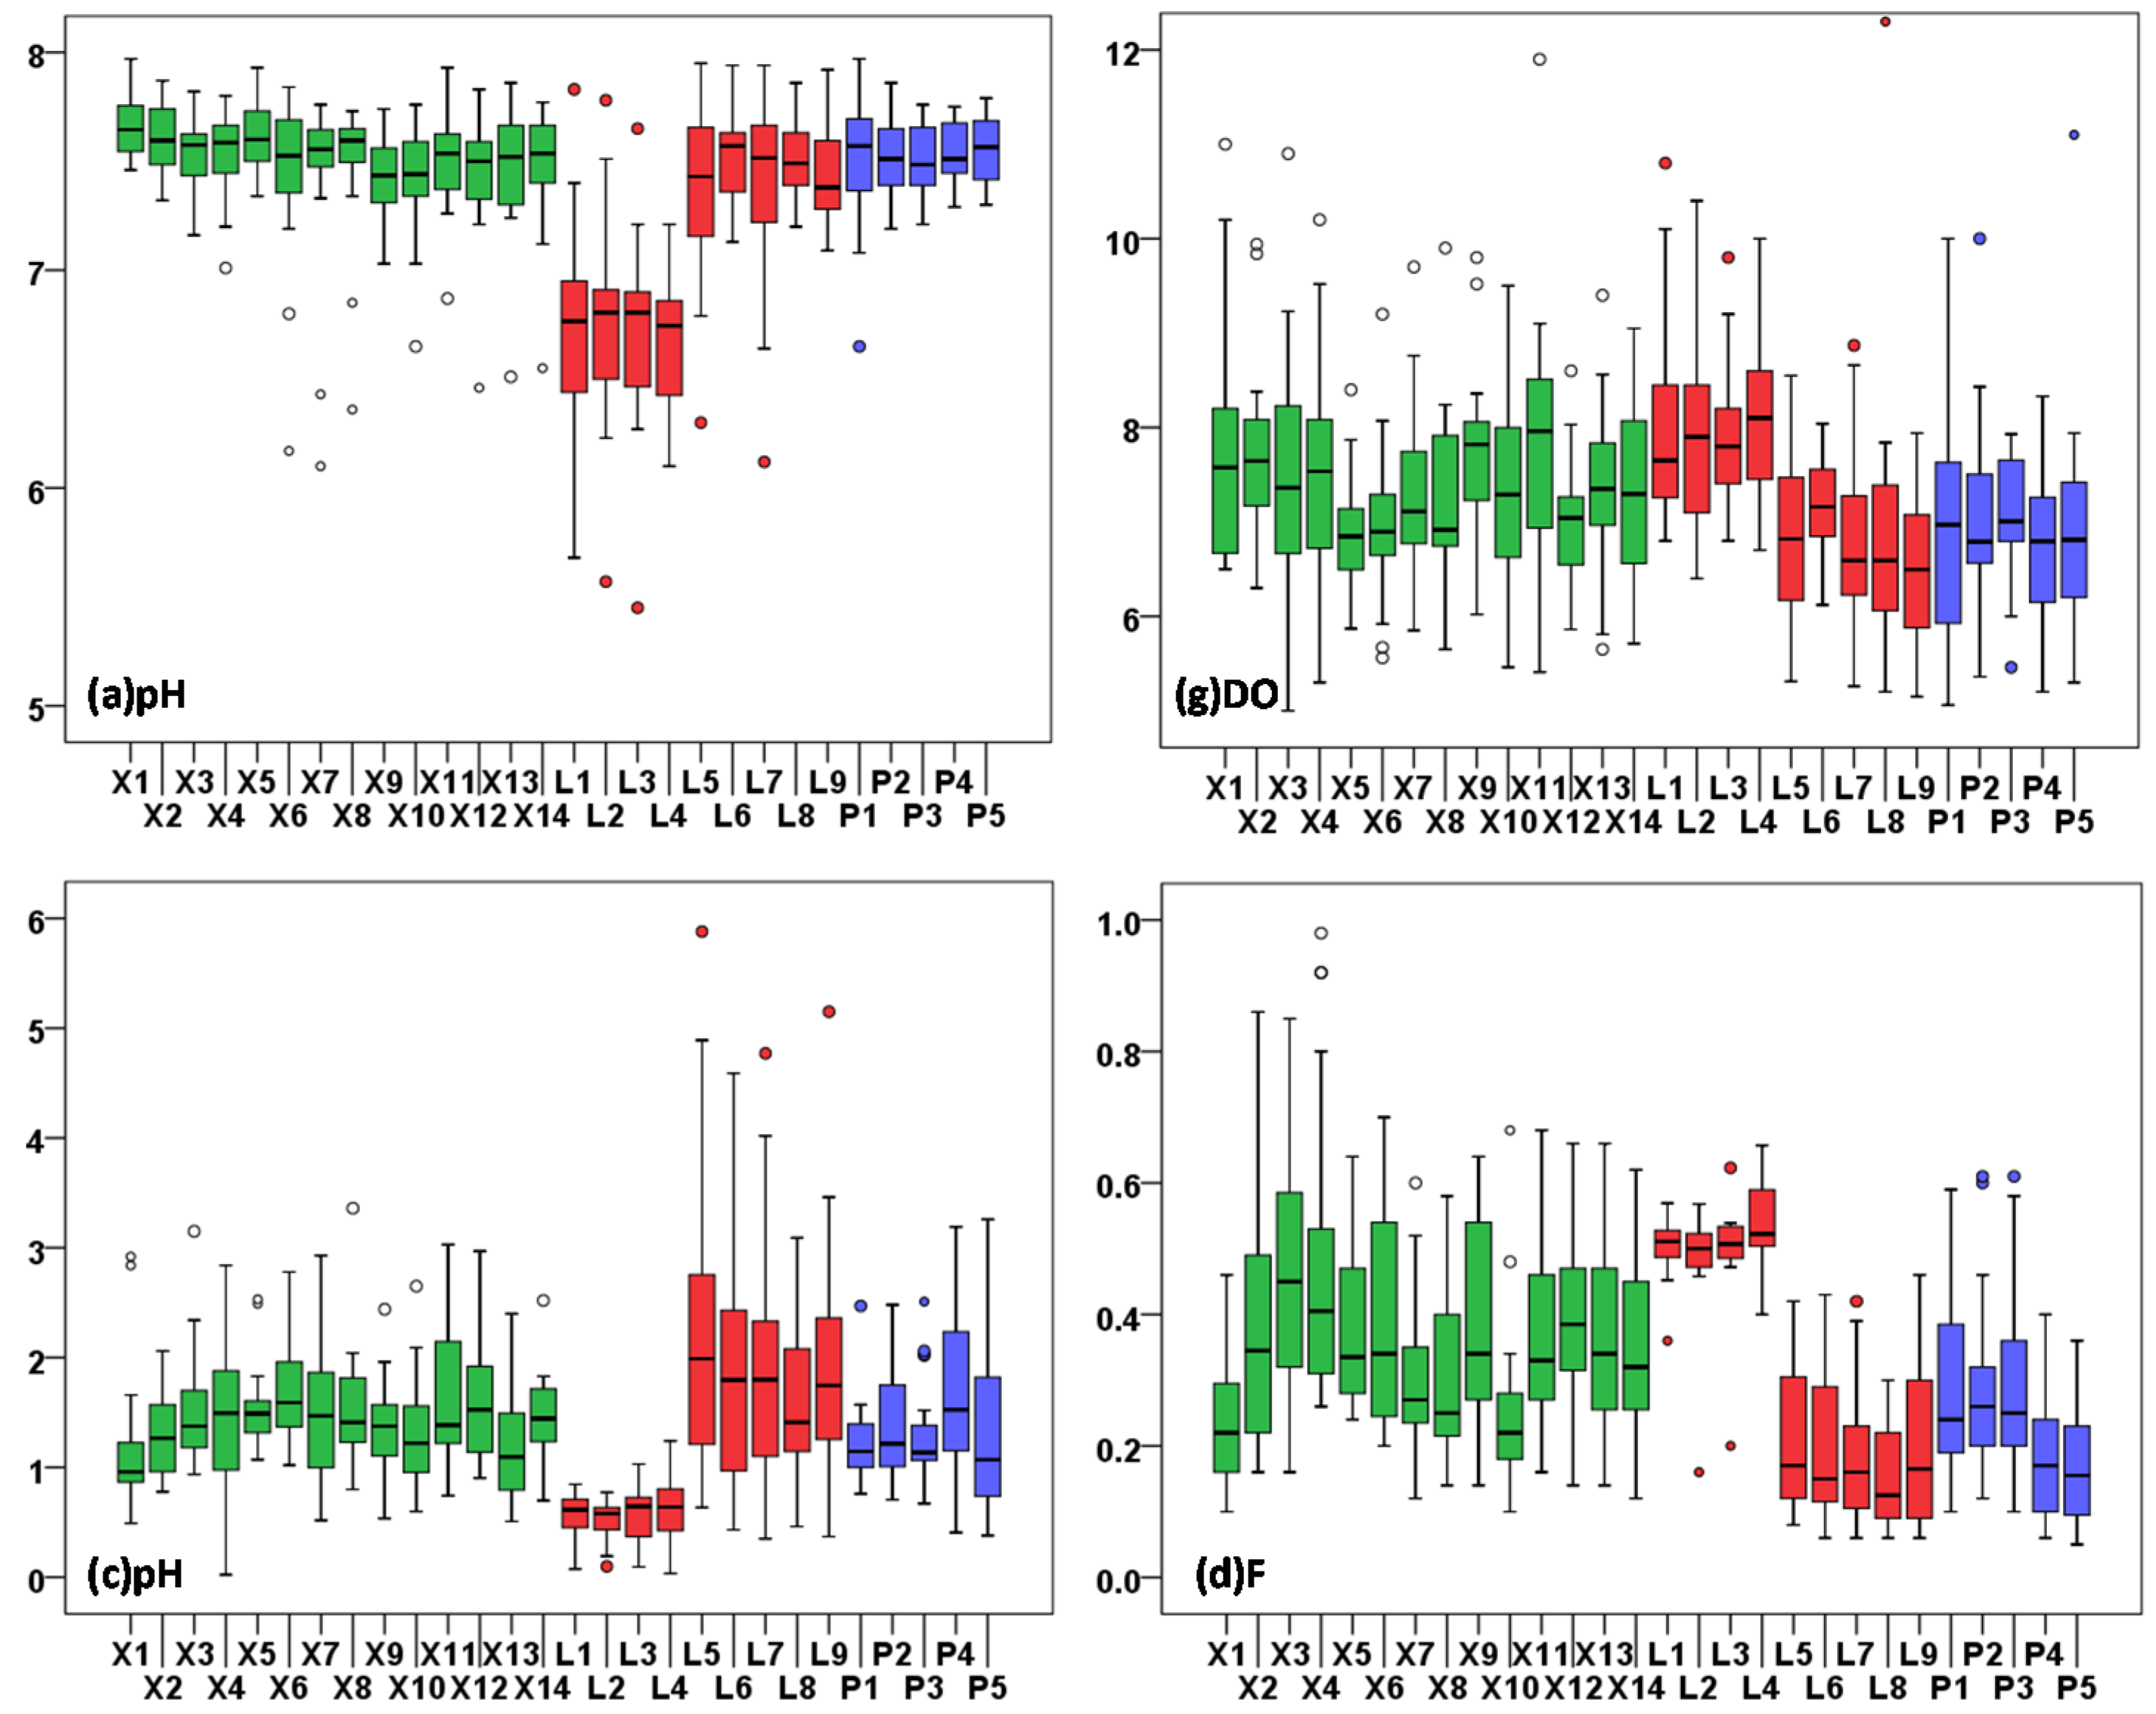
3.1. Temporal/Spatial Similarity and Grouping


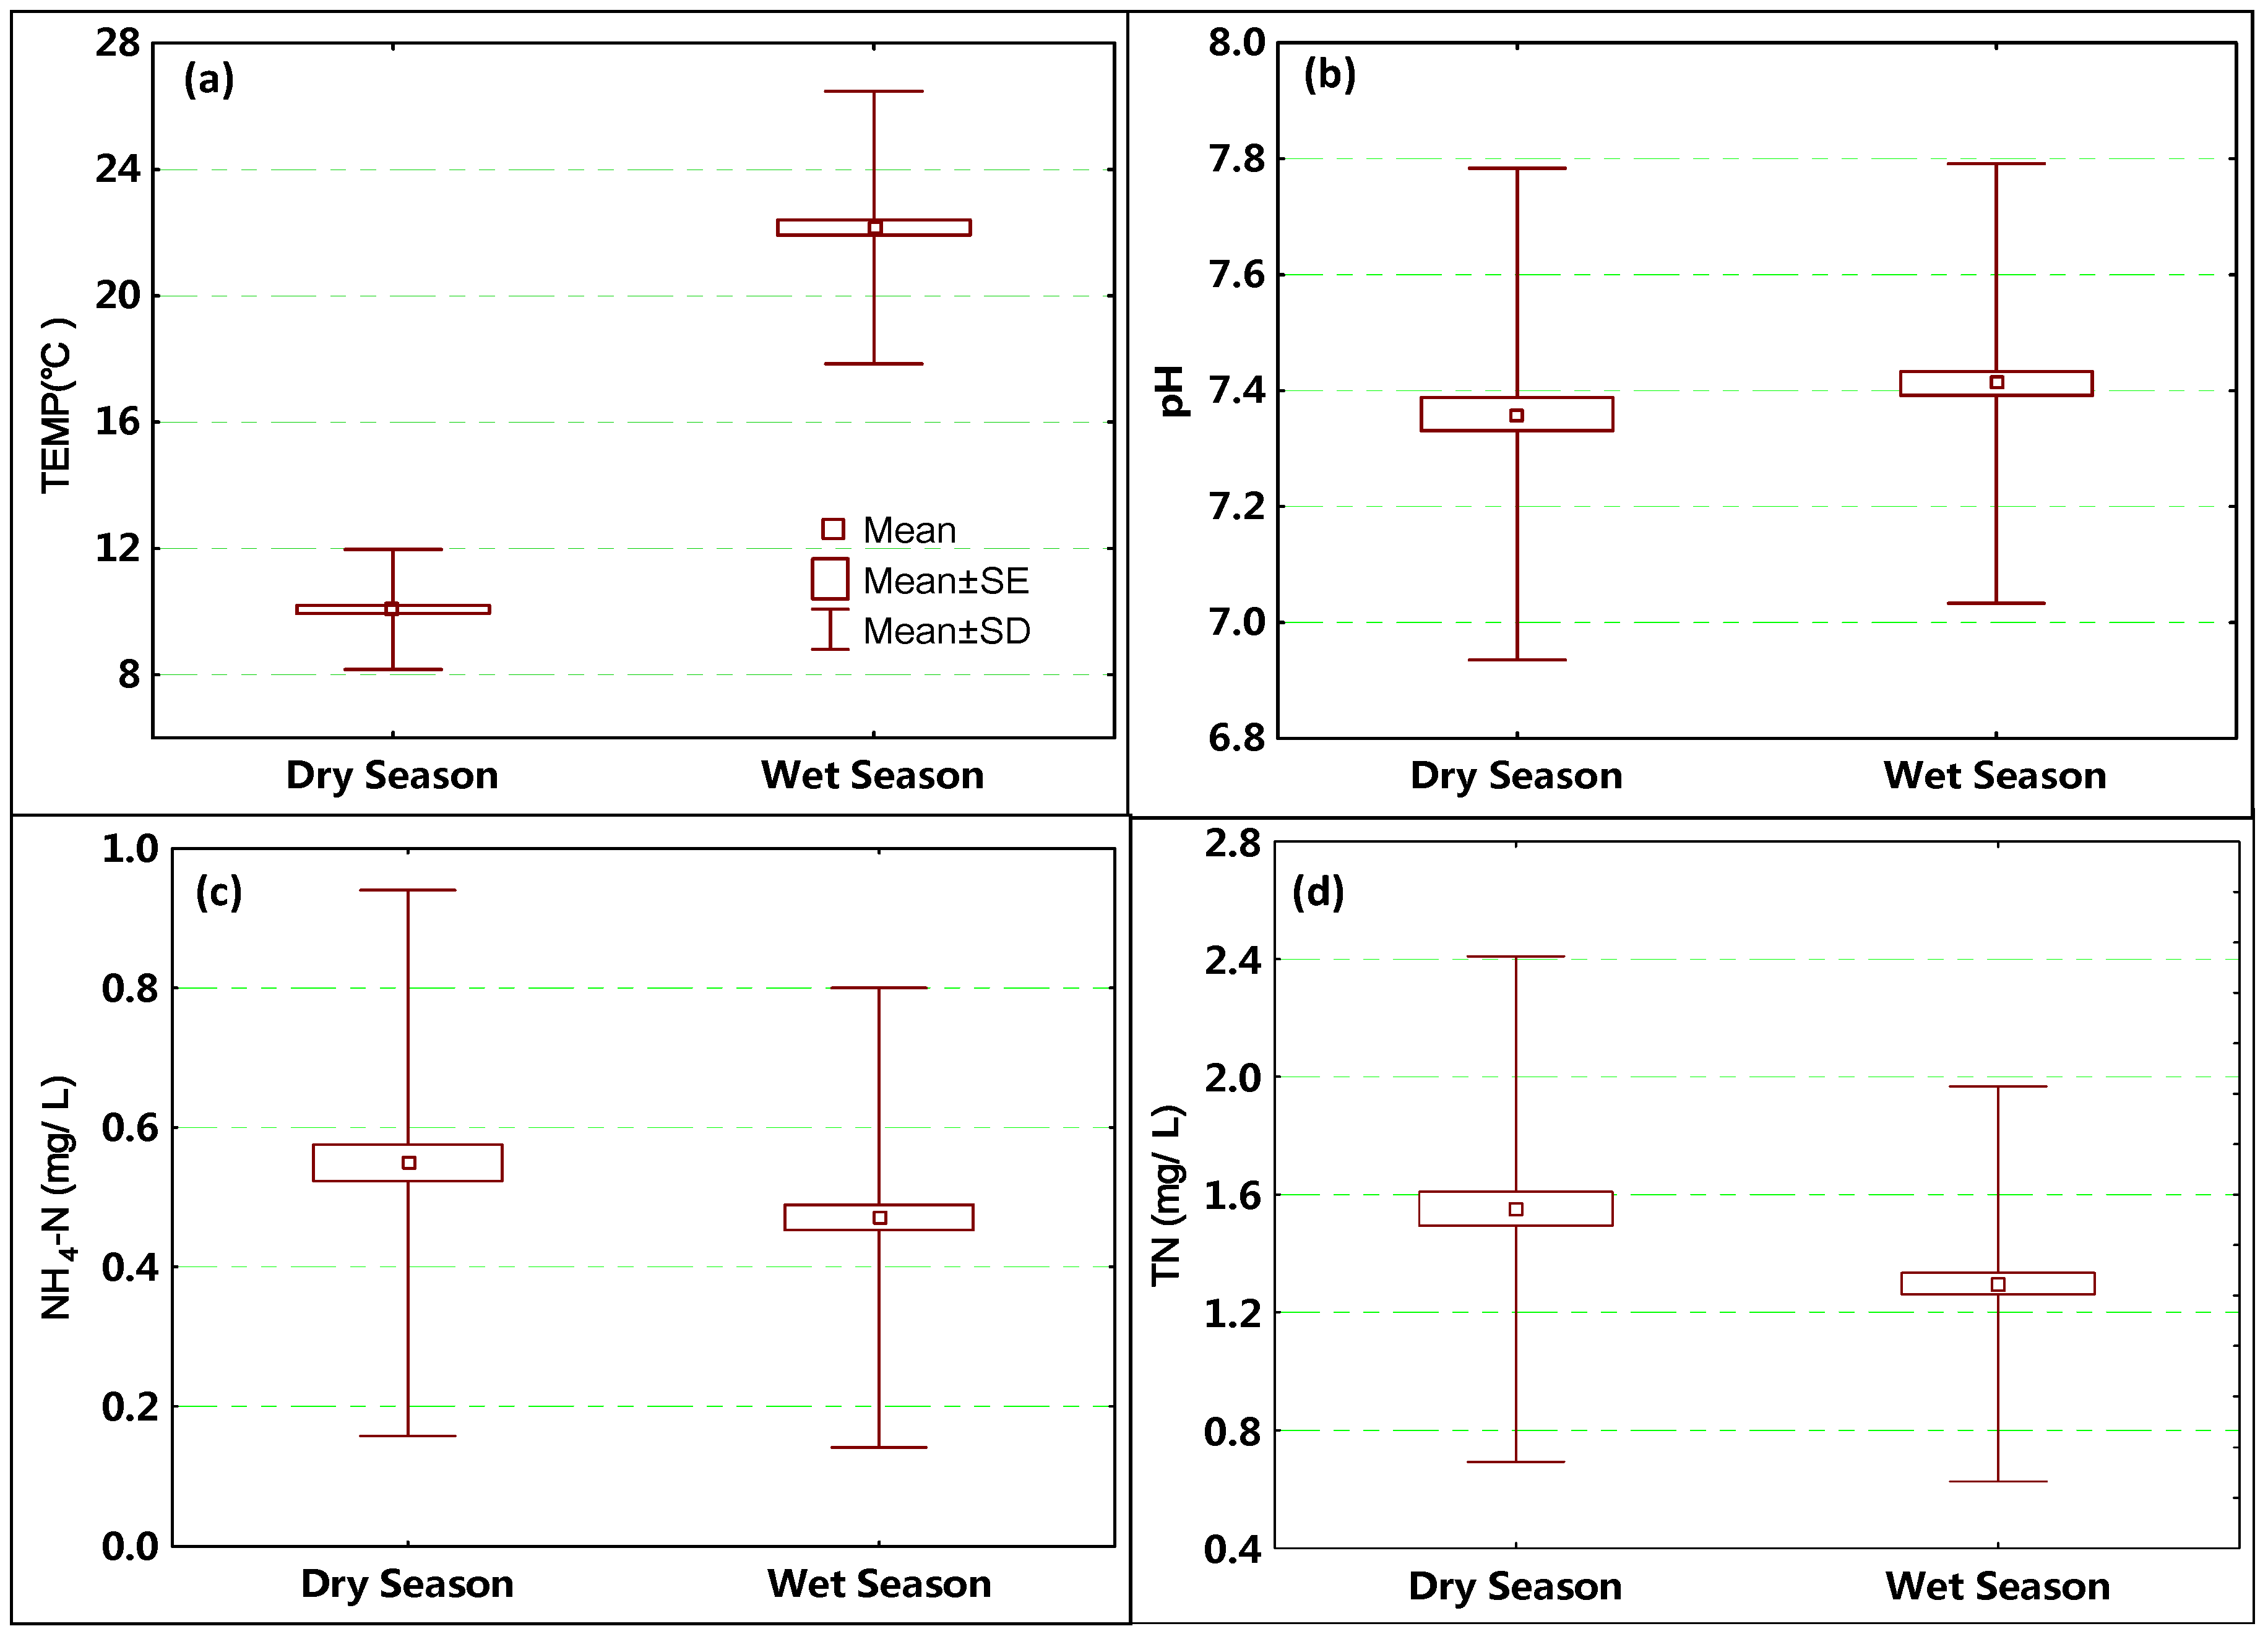
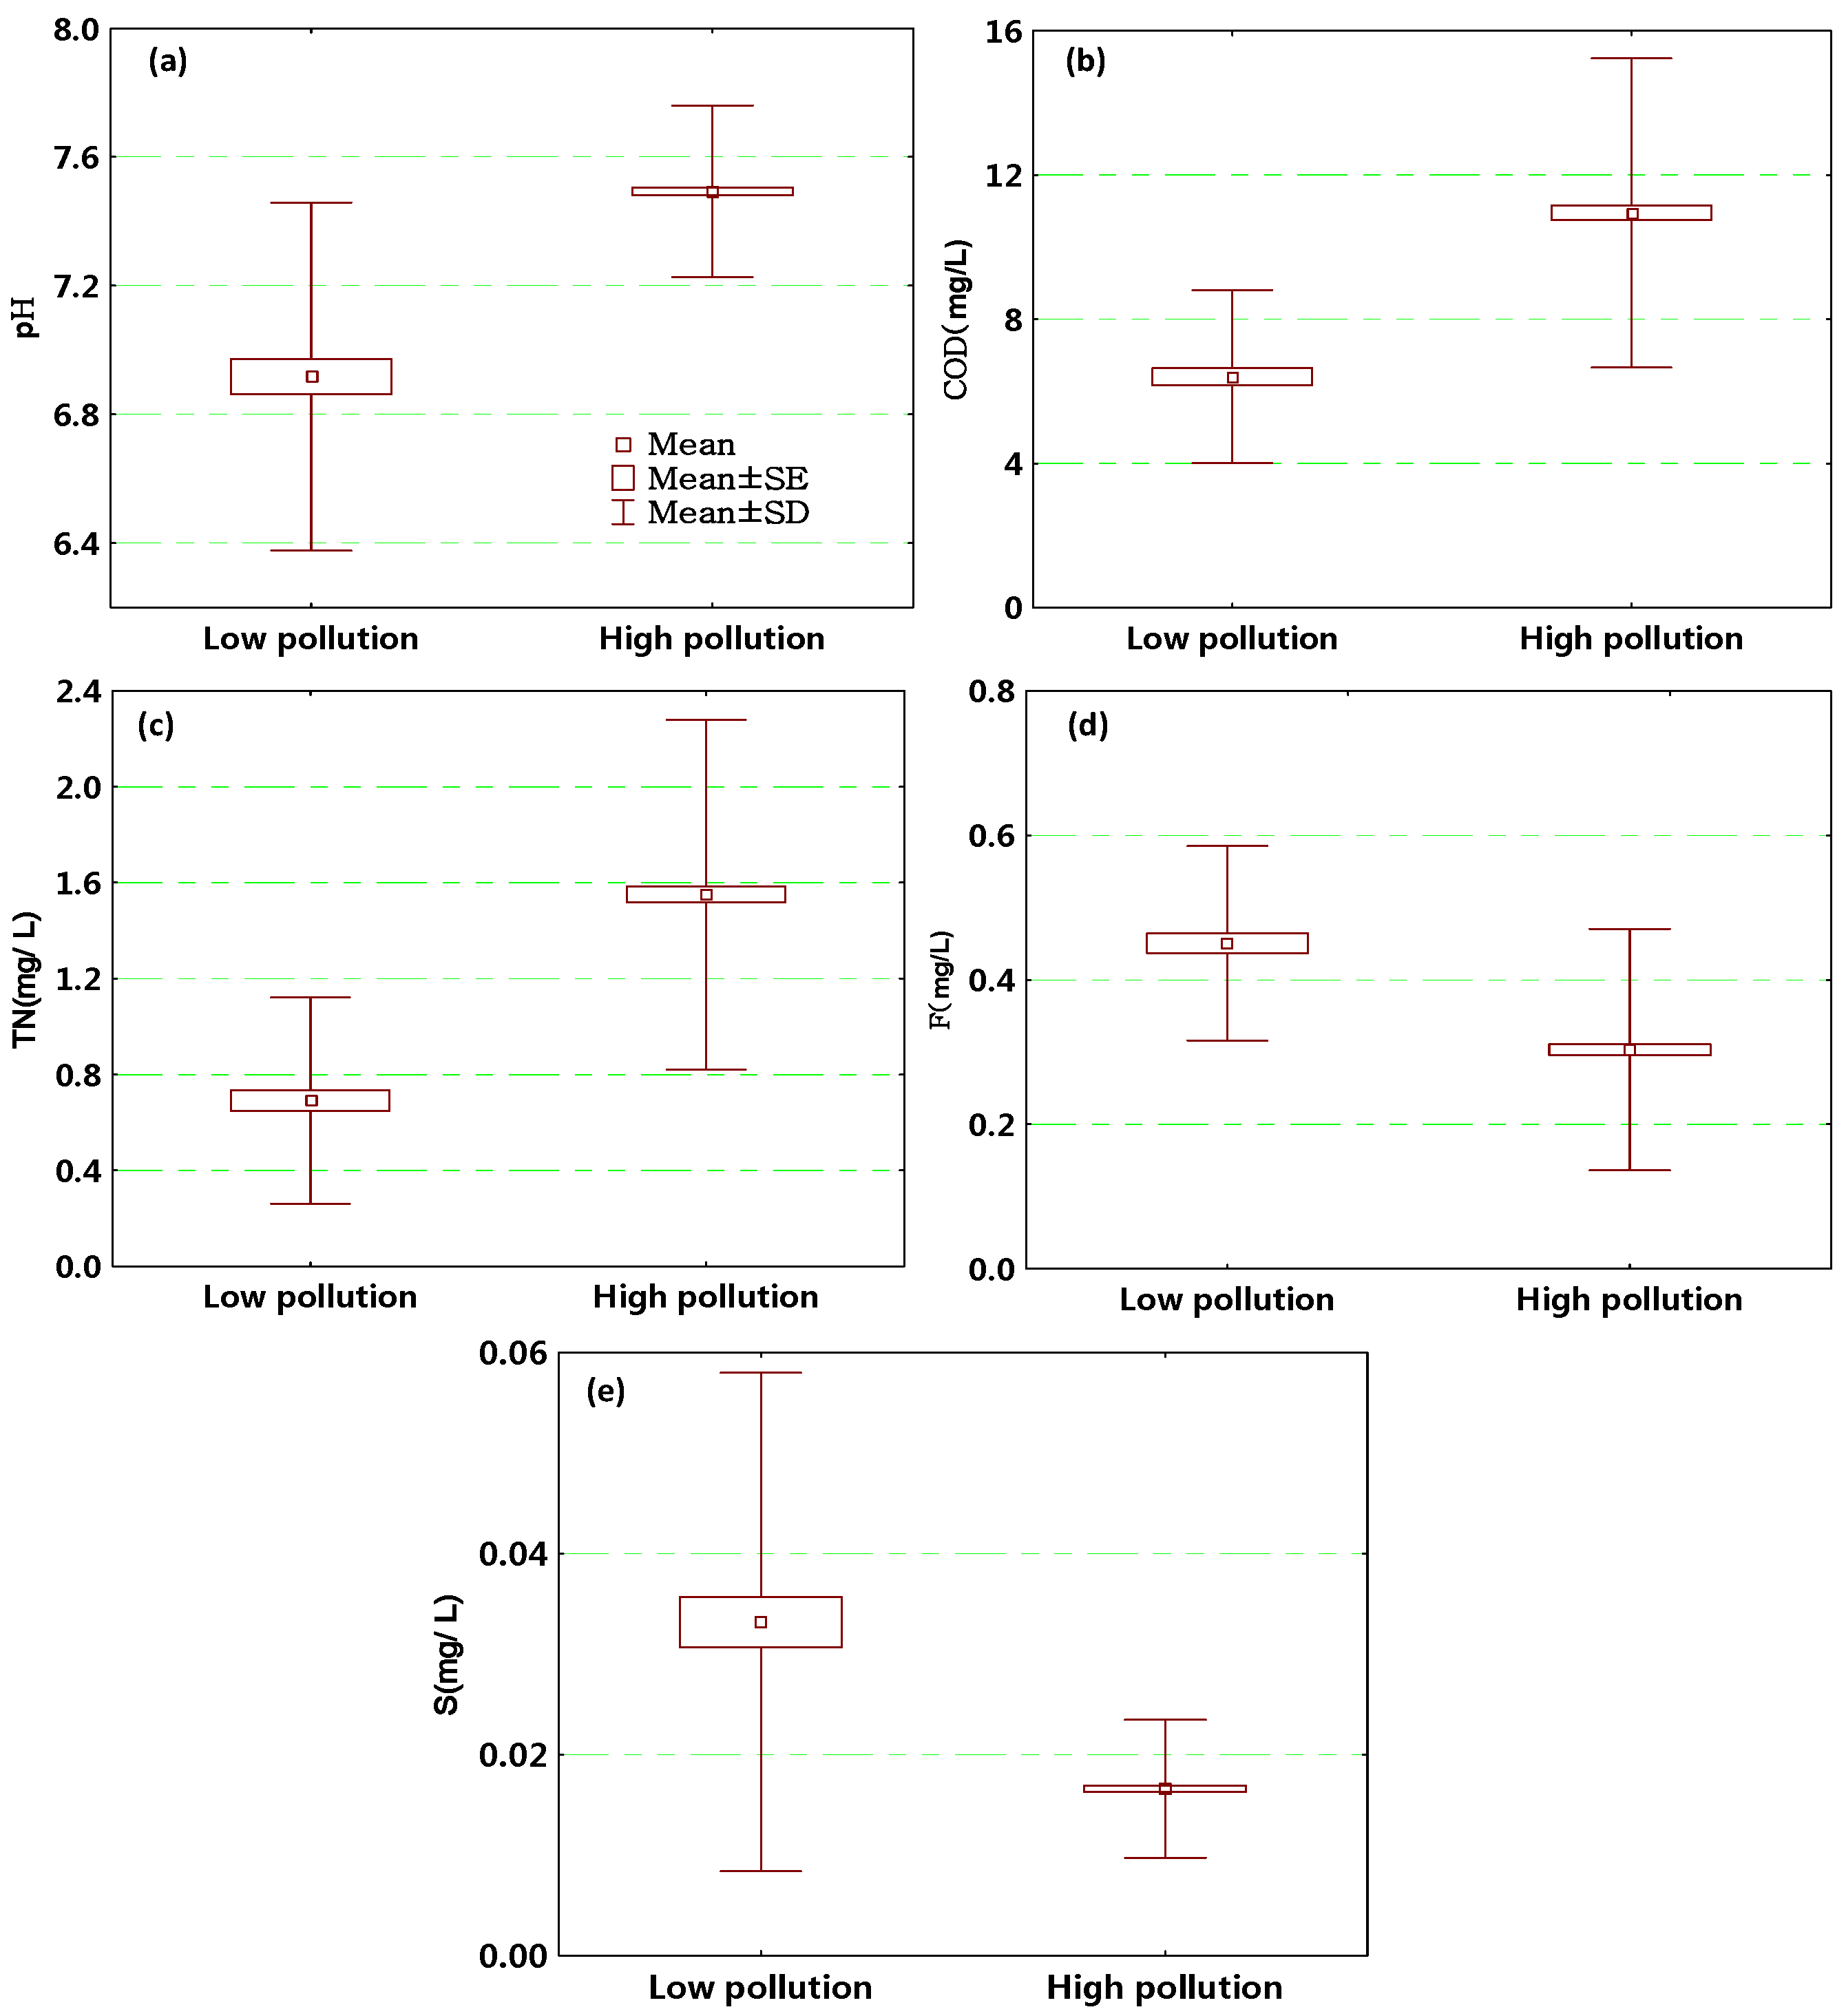
3.2. Temporal/Spatial Variations in River Water Quality
| Parameters | Standard Mode | Forward Stepwise Mode | Backward Stepwise Mode | |||
|---|---|---|---|---|---|---|
| Wet Season | Dry Season | Wet Season | Dry Season | Wet Season | Dry Season | |
| TEMP | 1.989 | 3.033 | 3.241 | 2.207 | 2.613 | 1.577 |
| pH | 82.847 | 84.585 | 59.995 | 58.095 | 56.048 | 54.185 |
| NH4-N | 21.105 | 24.167 | 28.602 | 25.452 | 27.846 | 25.129 |
| BOD | 9.934 | 10.125 | ||||
| COD | −1.194 | −1.189 | ||||
| DO | 10.981 | 10.727 | 12.409 | 12.687 | ||
| TN | −5.506 | −7.395 | −9.417 | −7.549 | −12.533 | −10.631 |
| TP | 7.996 | 6.712 | −3.095 | −1.832 | ||
| F | 46.734 | 46.243 | ||||
| S | 631.996 | 634.440 | ||||
| Cu | −255.025 | −250.116 | ||||
| Oil | −148.788 | −206.928 | 20.532 | 75.009 | ||
| Cr | 374.404 | 403.601 | ||||
| Zn | 53.327 | 52.592 | ||||
| Constant | −378.134 | −403.979 | −302.864 | −276.639 | −235.610 | −206.896 |
| Monitoring Periods | Percent Correct | Temporal Groups | |
|---|---|---|---|
| Wet Season | Dry Season | ||
| Standard mode | |||
| Wet Season | 95.536 | 321 | 15 |
| Dry Season | 100 | 0 | 224 |
| Total | 97.321 | 321 | 239 |
| Forward stepwise mode | |||
| Wet Season | 95.536 | 321 | 15 |
| Dry Season | 100 | 0 | 224 |
| Total | 97.321 | 321 | 239 |
| Backward stepwise mode | |||
| Wet Season | 96.429 | 324 | 12 |
| Dry Season | 100 | 0 | 224 |
| Total | 97.857 | 324 | 236 |

| Parameters | Standard Mode | Forward Stepwise Mode | Backward Stepwise Mode | |||
|---|---|---|---|---|---|---|
| Low Pollution | High Pollution | Low Pollution | High Pollution | Low Pollution | High Pollution | |
| TEMP | 1.028 | 1.07 | 1.214 | 1.260 | ||
| pH | 87.554 | 91.925 | 79.992 | 84.230 | 72.662 | 77.108 |
| NH4-N | 15.389 | 13.534 | 16.827 | 15.151 | ||
| BOD | 10.175 | 10.467 | ||||
| COD | −0.833 | −0.584 | −0.409 | −0.146 | −0.376 | −0.146 |
| DO | 10.645 | 10.246 | 10.144 | 9.730 | ||
| TN | −1.196 | 0.484 | −0.140 | 1.573 | 3.971 | 5.296 |
| TP | 10.63 | 11.57 | ||||
| F | 41.529 | 37.651 | 42.883 | 38.954 | 59.009 | 54.412 |
| S | 518.07 | 441.985 | 479.059 | 401.226 | 416.961 | 330.412 |
| Cu | −244.929 | −234.766 | −205.655 | −195.490 | ||
| Oil | −63.009 | −43.309 | 77.283 | 100.383 | ||
| Cr | 435.253 | 496.253 | 588.508 | 653.149 | ||
| Zn | 54.778 | 55.278 | ||||
| Constant | −384.511 | −413.498 | −349.255 | −376.823 | −273.306 | −303.391 |
| Monitoring Stations | Percent Correct | Spatial Groups | |
|---|---|---|---|
| Low Pollution | High Pollution | ||
| Standard mode | |||
| Low pollution | 72.000 | 72 | 28 |
| High pollution | 100.000 | 0 | 460 |
| Total | 95.000 | 72 | 28 |
| Forward stepwise mode | |||
| Low pollution | 72.000 | 72 | 28 |
| High pollution | 100.000 | 0 | 460 |
| Total | 95.000 | 72 | 488 |
| Backward stepwise mode | |||
| Low pollution | 69.000 | 69 | 31 |
| High pollution | 99.130 | 4 | 456 |
| Total | 93.750 | 73 | 487 |
| Parameters | Low Pollution (Six Significant Principal Components) | High Pollution (four Significant Principal Components) | ||||||||
|---|---|---|---|---|---|---|---|---|---|---|
| VF1 | VF2 | VF3 | VF4 | VF5 | VF6 | VF1 | VF2 | VF3 | VF4 | |
| TEMP | 0.015 | 0.026 | 0.042 | 0.874 | 0.211 | 0.107 | 0.206 | −0.362 | −0.623 | −0.017 |
| pH | 0.730 | 0.230 | 0.201 | −0.068 | −0.243 | −0.169 | −0.657 | −0.149 | −0.114 | −0.081 |
| NH4-N | −0.144 | −0.078 | −0.032 | 0.084 | 0.934 | 0.058 | −0.069 | 0.861 | 0.022 | 0.038 |
| BOD | −0.013 | −0.834 | 0.036 | 0.167 | −0.040 | 0.249 | 0.103 | −0.054 | −0.365 | 0.701 |
| COD | 0.607 | −0.418 | 0.362 | −0.307 | 0.263 | −0.014 | 0.050 | 0.562 | 0.234 | 0.318 |
| DO | −0.172 | 0.197 | −0.214 | −0.745 | 0.138 | 0.165 | −0.165 | −0.107 | 0.794 | −0.012 |
| TN | 0.721 | 0.283 | −0.127 | 0.186 | 0.443 | −0.124 | 0.219 | 0.651 | −0.003 | 0.091 |
| TP | 0.149 | 0.355 | 0.758 | 0.097 | −0.040 | −0.091 | 0.466 | 0.413 | 0.157 | 0.179 |
| F | −0.597 | −0.440 | −0.121 | −0.253 | 0.387 | 0.261 | 0.330 | 0.113 | 0.646 | 0.065 |
| S | −0.779 | 0.139 | 0.067 | −0.152 | 0.155 | −0.052 | −0.664 | 0.364 | −0.095 | −0.178 |
| Cu | 0.094 | 0.741 | 0.156 | −0.023 | −0.109 | 0.334 | −0.831 | −0.079 | 0.224 | −0.055 |
| Oil | 0.420 | 0.021 | 0.611 | 0.165 | −0.253 | −0.126 | 0.131 | 0.202 | 0.026 | 0.626 |
| Cr | −0.188 | −0.154 | 0.887 | 0.075 | 0.065 | 0.117 | 0.073 | 0.129 | 0.266 | 0.639 |
| Zn | −0.123 | −0.011 | −0.026 | −0.017 | 0.061 | 0.931 | 0.835 | 0.098 | −0.169 | 0.073 |
| Eigenvalue | 3.553 | 2.000 | 1.709 | 1.469 | 1.302 | 1.007 | 3.205 | 2.364 | 1.426 | 1.094 |
| %Total variance | 25.382 | 14.287 | 12.208 | 10.491 | 9.303 | 7.190 | 22.890 | 16.883 | 10.189 | 7.817 |
| Cumulative% variance | 25.382 | 39.668 | 51.876 | 62.367 | 71.671 | 78.861 | 22.890 | 39.773 | 49.962 | 57.779 |

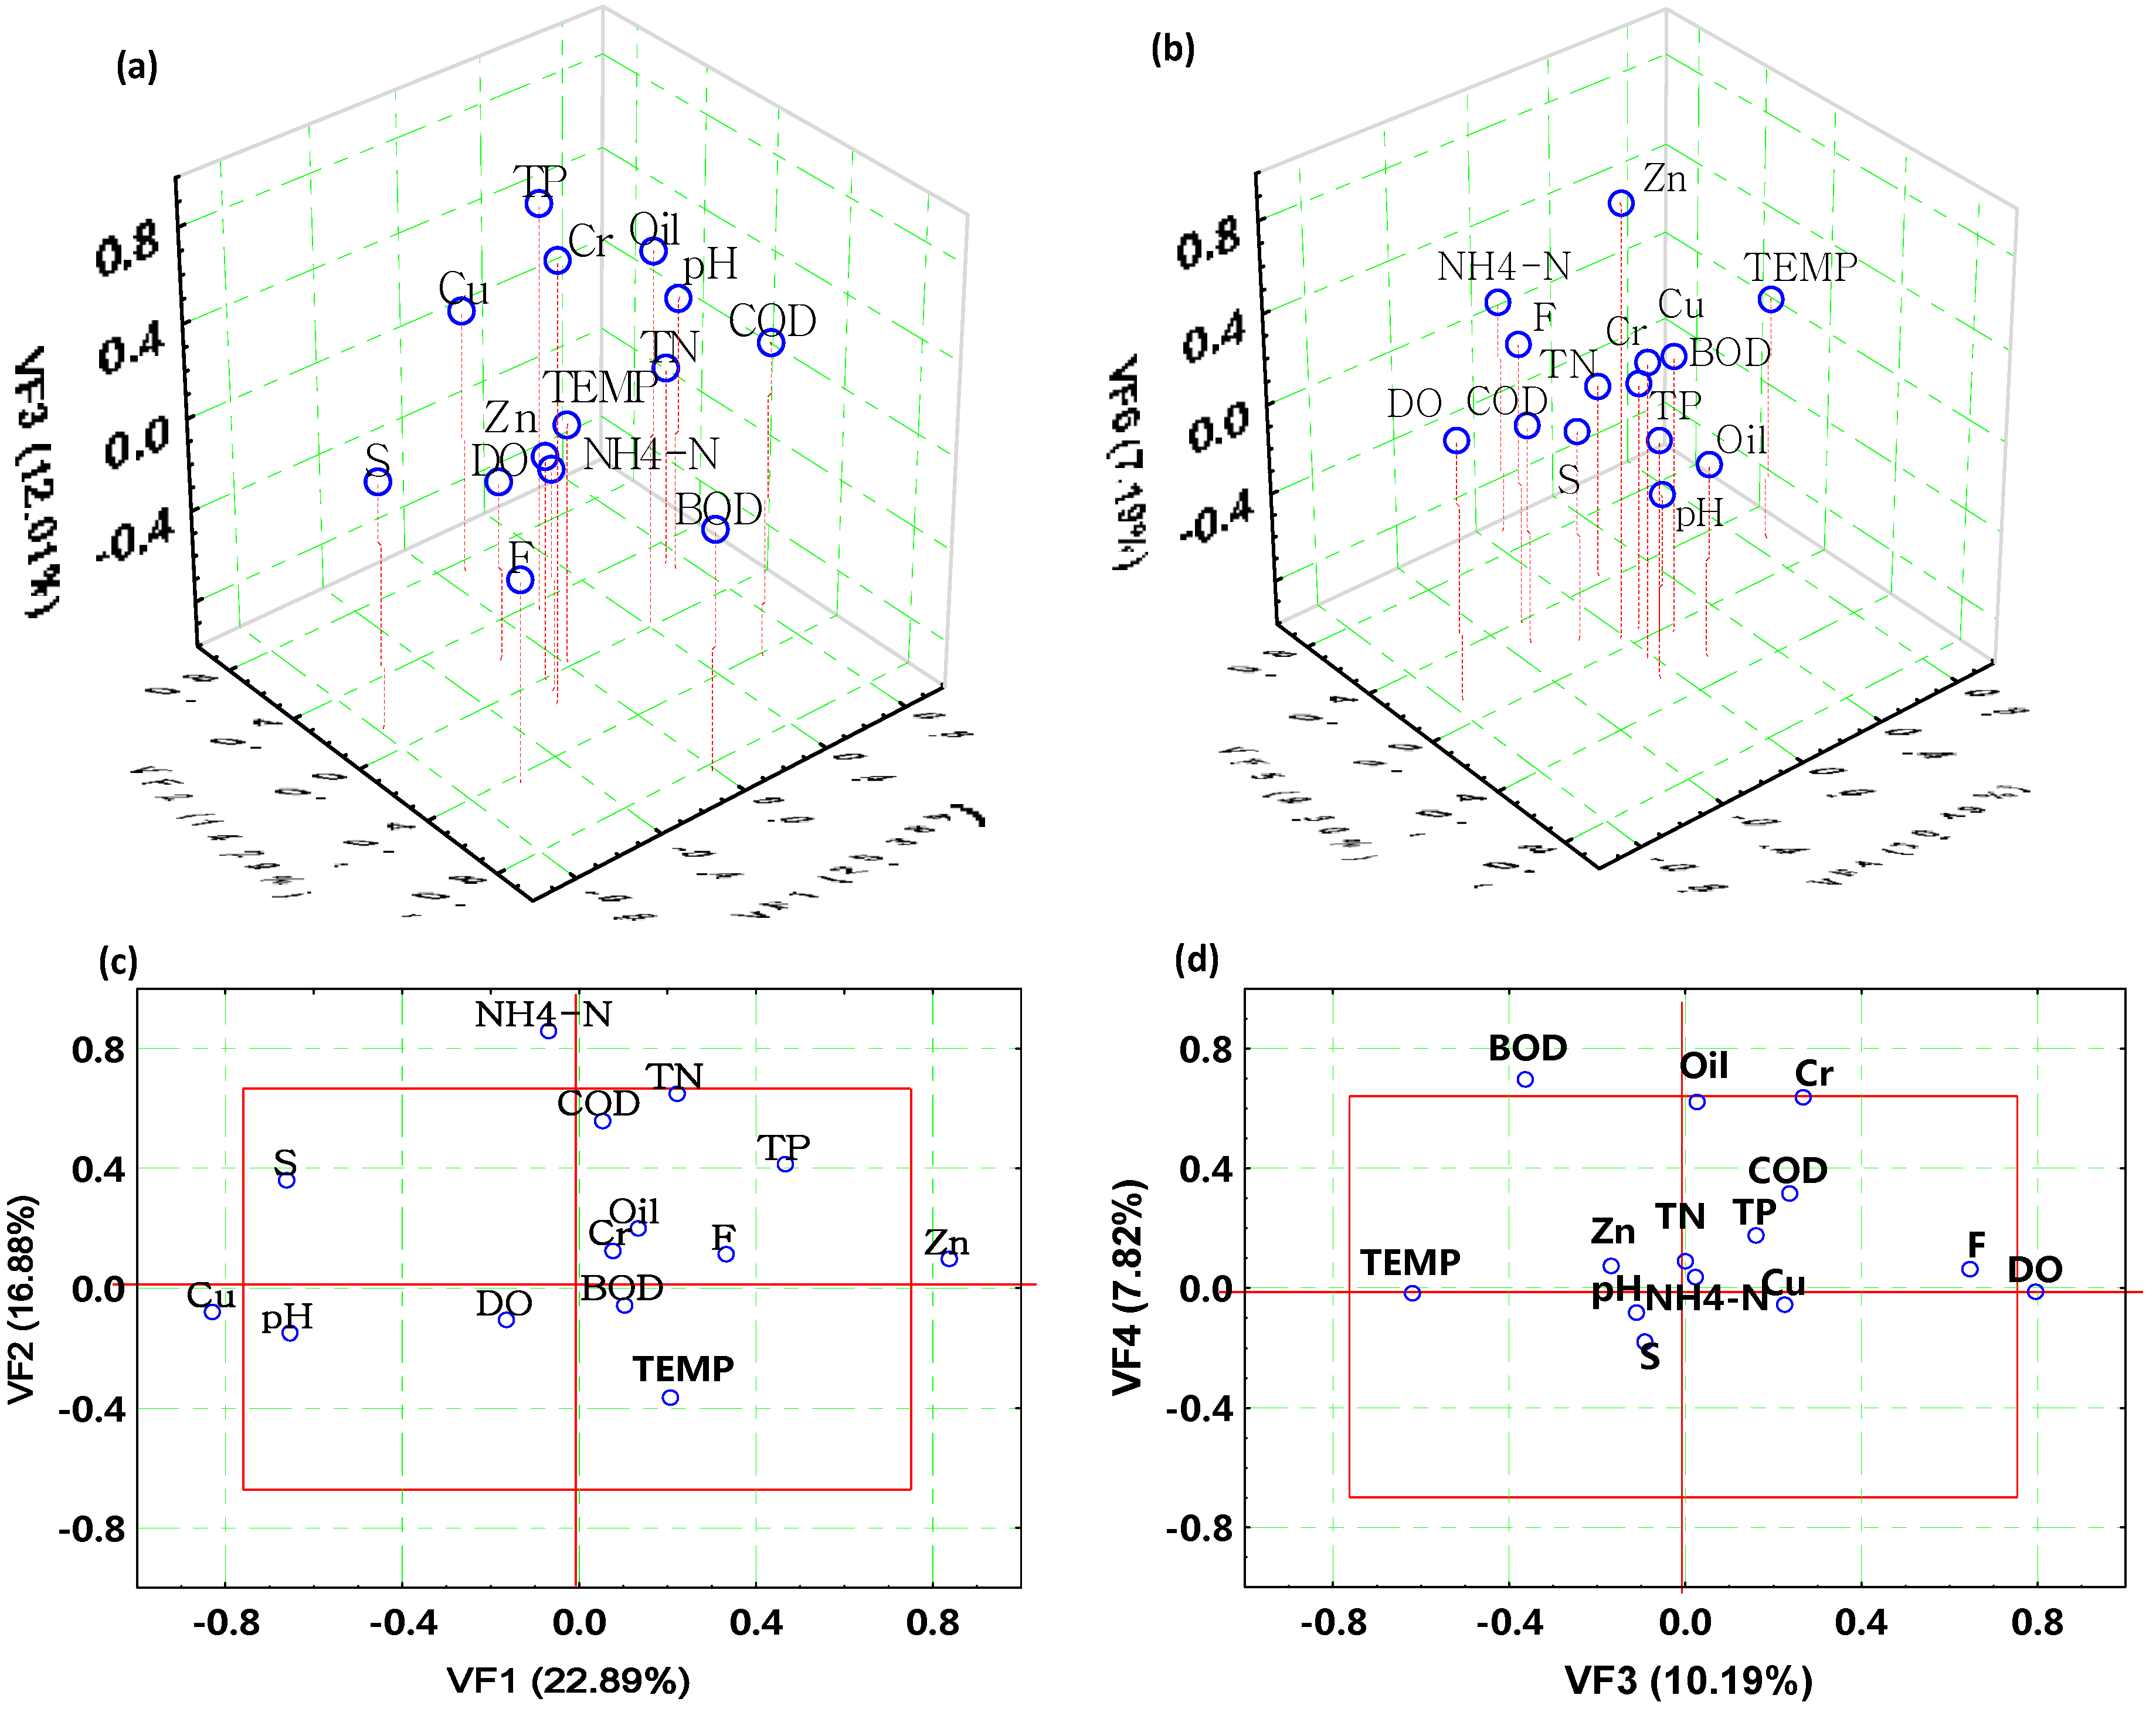
3.3. Data Structure Determination and Source Identification
4. Conclusions and Future Work
Acknowledgments
Author Contributions
Conflicts of Interest
References
- Vörösmarty, C.J.; Green, P.; Salisbury, J.; Lammers, R.B. Global water resources: Vulnerability from climate change and population growth. Science 2000, 289, 284–288. [Google Scholar] [CrossRef] [PubMed]
- Schwarzenbach, R.P.; Egli, T.; Hofstetter, T.B.; von Gunten, U.; Wehrli, B. Global water pollution and human health. Ann. Rev. Environ. Resour. 2010, 35, 109–136. [Google Scholar] [CrossRef]
- Hoekstra, A.Y.; Mekonnen, M.M. The water footprint of humanity. Proc. Natl. Acad. Sci. 2012, 109, 3232–3237. [Google Scholar] [CrossRef] [PubMed]
- Tu, J. Spatial variations in the relationships between land use and water quality across an urbanization gradient in the watersheds of northern Georgia, USA. Environ Manag. 2013, 51, 1–17. [Google Scholar] [CrossRef] [PubMed]
- Duan, W.; Chen, G.; Ye, Q.; Chen, Q. The situation of hazardous chemical accidents in China between 2000 and 2006. J. Hazard Mater. 2011, 186, 1489–1494. [Google Scholar] [CrossRef] [PubMed]
- Duan, W.; He, B.; Takara, K.; Luo, P.; Nover, D.; Sahu, N.; Yamashiki, Y. Spatiotemporal evaluation of water quality incidents in Japan between 1996 and 2007. Chemosphere 2013, 93, 946–953. [Google Scholar] [CrossRef] [PubMed]
- Duan, W.; He, B. Emergency response system for pollution accidents in chemical industrial parks, China. Int. J. Environ. Res. Public Health 2015, 12, 7868–7885. [Google Scholar] [CrossRef] [PubMed]
- Zhao, Q.; Liu, S.; Deng, L.; Yang, Z.; Dong, S.; Wang, C.; Zhang, Z. Spatio-temporal variation of heavy metals in fresh water after dam construction: A case study of the Manwan Reservoir, Lancang River. Environ. Monit. Assess. 2012, 184, 4253–4266. [Google Scholar] [CrossRef] [PubMed]
- Shi, H.; Shao, M. Soil and water loss from the Loess Plateau in China. J. Arid Environ. 2000, 45, 9–20. [Google Scholar] [CrossRef]
- Delpla, I.; Jung, A.; Baures, E.; Clement, M.; Thomas, O. Impacts of climate change on surface water quality in relation to drinking water production. Environ. Int. 2009, 35, 1225–1233. [Google Scholar] [CrossRef] [PubMed]
- Carr, G.M.; Neary, J.P. Water Quality for Ecosystem and Human Health; UNEP/Earthprint: Stevenage, UK, 2008. [Google Scholar]
- Duan, W.; Takara, K.; He, B.; Luo, P.; Nover, D.; Yamashiki, Y. Spatial and temporal trends in estimates of nutrient and suspended sediment loads in the Ishikari River, Japan, 1985 to 2010. Sci. Total Environ. 2013, 461, 499–508. [Google Scholar] [CrossRef] [PubMed]
- Luo, P.; He, B.; Takara, K.; Razafindrabe, B.H.; Nover, D.; Yamashiki, Y. Spatiotemporal trend analysis of recent river water quality conditions in Japan. J. Environ. Monitor. 2011, 13, 2819–2829. [Google Scholar] [CrossRef] [PubMed]
- Kronvang, B.; Jeppesen, E.; Conley, D.J.; Søndergaard, M.; Larsen, S.E.; Ovesen, N.B.; Carstensen, J. Nutrient pressures and ecological responses to nutrient loading reductions in Danish streams, lakes and coastal waters. J. Hydrol. 2005, 304, 274–288. [Google Scholar] [CrossRef]
- Conley, D.J.; Markager, S.; Andersen, J.; Ellermann, T.; Svendsen, L.M. Coastal eutrophication and the Danish national aquatic monitoring and assessment program. Estuar. Coasts 2002, 25, 848–861. [Google Scholar] [CrossRef]
- Morvan, X.; Saby, N.; Arrouays, D.; Le Bas, C.; Jones, R.; Verheijen, F.; Bellamy, P.H.; Stephens, M.; Kibblewhite, M.G. Soil monitoring in Europe: A review of existing systems and requirements for harmonisation. Sci. Total Environ. 2008, 391, 1–12. [Google Scholar] [CrossRef] [PubMed]
- Hurley, M.A.; Currie, J.E.; Gough, J.; Butterwick, C. A framework for the analysis of harmonised monitoring scheme data for England and Wales. Environmetrics 1996, 7, 379–390. [Google Scholar] [CrossRef]
- Gilliom, R.J.; Alley, W.M.; Gurtz, M.E. Design of National Water-Quality Assessment Program; United States Government Printing Office: Washington, DC, USA, 1995.
- Rosen, M.R.; Lapham, W.W. Introduction to the US Geological Survey National Water-Quality Assessment (NAWQA) of ground-water quality trends and comparison to other national programs. J. Environ. Qual. 2008, 37, 190. [Google Scholar]
- Zhang, C.; Sihui, D. A new water quality assessment model based on projection pursuit technique. J. Environ. Sci. 2009, 21, S154–S157. [Google Scholar] [CrossRef]
- He, B.; Oki, T.; Sun, F.; Komori, D.; Kanae, S.; Wang, Y.; Kim, H.; Yamazaki, D. Estimating monthly total nitrogen concentration in streams by using artificial neural network. J. Environ. Manag. 2011, 92, 172–177. [Google Scholar] [CrossRef] [PubMed]
- Wu, C.L.; Chau, K.W.; Li, Y.S. Methods to improve neural network performance in daily flows prediction. J. Hydrol. 2009, 372, 80–93. [Google Scholar] [CrossRef]
- Singh, K.P.; Malik, A.; Mohan, D.; Sinha, S. Multivariate statistical techniques for the evaluation of spatial and temporal variations in water quality of Gomti River (India)-a case study. Water Res. 2004, 38, 3980–3992. [Google Scholar] [CrossRef] [PubMed]
- Wang, W.; Xu, D.; Chau, K.; Lei, G. Assessment of river water quality based on theory of variable fuzzy sets and fuzzy binary comparison method. Water Resour. Manag. 2014, 28, 4183–4200. [Google Scholar] [CrossRef]
- Moriasi, D.N.; Wilson, B.N.; Douglas-Mankin, K.R.; Arnold, J.G.; Gowda, P.H. Hydrologic and water quality models: Use, calibration, and validation. Trans. ASABE 2012, 55, 1241–1247. [Google Scholar] [CrossRef]
- He, B.; Kanae, S.; Oki, T.; Hirabayashi, Y.; Yamashiki, Y.; Takara, K. Assessment of global nitrogen pollution in rivers using an integrated biogeochemical modeling framework. Water Res. 2011, 45, 2573–2586. [Google Scholar] [CrossRef] [PubMed]
- Chau, K.; Wu, C. A hybrid model coupled with singular spectrum analysis for daily rainfall prediction. J. Hydroinform. 2010, 12, 458–473. [Google Scholar] [CrossRef]
- Wang, Y.; Wang, P.; Bai, Y.; Tian, Z.; Li, J.; Shao, X.; Mustavich, L.F.; Li, B. Assessment of surface water quality via multivariate statistical techniques: A case study of the Songhua River Harbin region, China. J. Hydro-Environ. Res. 2013, 7, 30–40. [Google Scholar] [CrossRef]
- He, G.; Lu, Y.; Mol, A.P.; Beckers, T. Changes and challenges: China′s environmental management in transition. Environ. Dev. 2012, 3, 25–38. [Google Scholar] [CrossRef]
- Zhang, Q.; Li, L.; Wang, Y.G.; Werner, A.D.; Xin, P.; Jiang, T.; Barry, D.A. Has the Three-Gorges Dam made the Poyang Lake wetlands wetter and drier? Geophys. Res. Lett. 2012, 39, L20402. [Google Scholar] [CrossRef]
- Ye, X.; Zhang, Q.; Liu, J.; Li, X.; Xu, C. Distinguishing the relative impacts of climate change and human activities on variation of streamflow in the Poyang Lake catchment, China. J. Hydrol. 2013, 494, 83–95. [Google Scholar] [CrossRef]
- Liu, W.X.; Coveney, R.M.; Chen, J.L. Environmental quality assessment on a river system polluted by mining activities. Appl. Geochem. 2003, 18, 749–764. [Google Scholar] [CrossRef]
- Mckenna, J.E. An enhanced cluster analysis program with bootstrap significance testing for ecological community analysis. Environ. Model. Softw. 2003, 18, 205–220. [Google Scholar] [CrossRef]
- Shrestha, S.; Kazama, F. Assessment of surface water quality using multivariate statistical techniques: A case study of the Fuji river basin, Japan. Environ. Model. Softw. 2007, 22, 464–475. [Google Scholar] [CrossRef]
- Johnson, R.A.; Wichern, D.W. Applied Multivariate Statistical Analysis; Prentice hall: Englewood Cliffs, NJ, USA, 1992. [Google Scholar]
- Jolliffe, I. Principal Component Analysis; John Wiley & Sons Inc.: Charlottesville, VA, USA, 2002. [Google Scholar]
- Yidana, S.M.; Ophori, D.; Banoeng-Yakubo, B. A multivariate statistical analysis of surface water chemistry data-The Ankobra Basin, Ghana. J. Environ. Manag. 2008, 86, 80–87. [Google Scholar] [CrossRef] [PubMed]
- Reghunath, R.; Murthy, T.S.; Raghavan, B.R. The utility of multivariate statistical techniques in hydrogeochemical studies: An example from Karnataka, India. Water Res. 2002, 36, 2437–2442. [Google Scholar] [CrossRef]
- Xiao, X.; Wang, Y.; Zhang, H.; Yu, X. Effects of primary productivity and ecosystem size on food-chain length in Raohe River, China. Acta Ecol. Sin. 2015, 35, 29–34. [Google Scholar] [CrossRef]
- Chen, H.; Teng, Y.; Lu, S.; Wang, Y.; Wang, J. Contamination features and health risk of soil heavy metals in China. Sci. Total Environ. 2015, 512, 143–153. [Google Scholar] [CrossRef] [PubMed]
- Chen, P.; Li, L.; Zhang, H. Spatio-Temporal Variations and Source Apportionment of Water Pollution in Danjiangkou Reservoir Basin, Central China. Water 2015, 7, 2591–2611. [Google Scholar] [CrossRef]
- Yang, Y.; Zhou, F.; Guo, H.; Sheng, H.; Liu, H.; Dao, X.; He, C. Analysis of spatial and temporal water pollution patterns in Lake Dianchi using multivariate statistical methods. Environ. Monit. Assess. 2010, 170, 407–416. [Google Scholar] [CrossRef] [PubMed]
- Alexander, R.B.; Smith, R.A.; Schwarz, G.E. Effect of stream channel size on the delivery of nitrogen to the Gulf of Mexico. Nature 2000, 403, 758–761. [Google Scholar] [CrossRef] [PubMed]
- Singh, K.P.; Malik, A.; Sinha, S. Water quality assessment and apportionment of pollution sources of Gomti river (India) using multivariate statistical techniques-a case study. Anal. Chim. Acta 2005, 538, 355–374. [Google Scholar] [CrossRef]
- Juahir, H.; Zain, S.M.; Yusoff, M.K.; Hanidza, T.T.; Armi, A.M.; Toriman, M.E.; Mokhtar, M. Spatial water quality assessment of Langat River Basin (Malaysia) using environmetric techniques. Environ. Monit. Assess. 2011, 173, 625–641. [Google Scholar] [CrossRef] [PubMed]
- He, M.; Wang, Z.; Tang, H. Spatial and temporal patterns of acidity and heavy metals in predicting the potential for ecological impact on the Le An river polluted by acid mine drainage. Sci. Total Environ. 1997, 206, 67–77. [Google Scholar] [CrossRef]
- Ringler, N.H.; Hall, J.D. Effects of logging on water temperature, and dissolved oxygen in spawning Beds. Trans. Am. Fish Soc. 1975, 104, 111–121. [Google Scholar] [CrossRef]
© 2016 by the authors; licensee MDPI, Basel, Switzerland. This article is an open access article distributed under the terms and conditions of the Creative Commons by Attribution (CC-BY) license (http://creativecommons.org/licenses/by/4.0/).
Share and Cite
Duan, W.; He, B.; Nover, D.; Yang, G.; Chen, W.; Meng, H.; Zou, S.; Liu, C. Water Quality Assessment and Pollution Source Identification of the Eastern Poyang Lake Basin Using Multivariate Statistical Methods. Sustainability 2016, 8, 133. https://doi.org/10.3390/su8020133
Duan W, He B, Nover D, Yang G, Chen W, Meng H, Zou S, Liu C. Water Quality Assessment and Pollution Source Identification of the Eastern Poyang Lake Basin Using Multivariate Statistical Methods. Sustainability. 2016; 8(2):133. https://doi.org/10.3390/su8020133
Chicago/Turabian StyleDuan, Weili, Bin He, Daniel Nover, Guishan Yang, Wen Chen, Huifang Meng, Shan Zou, and Chuanming Liu. 2016. "Water Quality Assessment and Pollution Source Identification of the Eastern Poyang Lake Basin Using Multivariate Statistical Methods" Sustainability 8, no. 2: 133. https://doi.org/10.3390/su8020133
APA StyleDuan, W., He, B., Nover, D., Yang, G., Chen, W., Meng, H., Zou, S., & Liu, C. (2016). Water Quality Assessment and Pollution Source Identification of the Eastern Poyang Lake Basin Using Multivariate Statistical Methods. Sustainability, 8(2), 133. https://doi.org/10.3390/su8020133