1. Introduction
With worldwide economic development and natural resources depletion, energy crisis and climate deterioration have become severe issues for the sustainable development. China, as the largest Greenhouse Gas (GHG) emitter and energy consumer, has proposed the corresponding routes and strategies for energy utilization. On the one hand, more and more distributed electrical generators of renewable energy resources have been accessed. On the other hand, many energy bases in western China are under construction to overcome the unbalanced distribution between energy resources and consumption. However, the intermittency of distributed energy and long transmission requirements in China results in fluctuation and high power loss to the grid [
1]. Therefore, in order to promote the acceptance of clean distributed energy resources, State Grid Corporation put forward the strategic plan for establishing a “Strong Smart Grid” (SSG) in 2009. SSG is a new type of highly integrated power grid, which is the combination of modern advanced sensing and measurement technology, information technology, communication technology, control technology and physical power system, which features an ultra-high voltage (UHV) transmission network [
2]. SSG can facilitate the integration of renewable power generation in large-scale concentrated and small-scale distributed ways. SSG can boost various novel innovations and applications in demand response and promote energy efficiency on the demand side. SSG can also realize maximum optimization of energy resources based on the UHV transmission network [
3,
4].
In recent years, the cumulative investment for power grids construction accounts for more than 50% of the total investment in power sector. Moreover, 1.5 trillion yuan has been invested to establish SSG during the period of ”twelfth five-year”, namely 300 billion yuan a year [
5]. As an important platform for the energy delivery and configuration, the construction and operation of SSG represents a strategic way to realize sustainable development, which has significant impacts on the economy, environment, society and technology. Therefore, in order to improve the input–output efficiency and sustainable development of SSG, it is essential to conduct research on the performance evaluation of smart grid from multiple aspects.
“Sustainability” is described as a long-term development integrating three pillars: economic growth, social development and environment protection [
6]. Smart grid is a platform of advanced science and technology, which would promote the technological advance of multiple industries in the long-term. Therefore, different from the classical concept of sustainability, four pillars are involved in this paper to reflect the performance evaluation of “strong smart grid” for sustainability, namely economy, society, environment and technology. For economy dimension, the cost and benefit of smart grid such as annual operation and maintenance cost, loss cost and enterprise income are incorporated into the evaluation process. The society dimension of smart grid performance requires considering employment promotion, improvement of residents’ living standards and promotion of related industries. For environment dimension, the impact on vegetation, emission reduction and energy utilization should be included. For technology dimension, self-healing capacity, coordination of power grid and absorption for distributed generators (DG) are included to evaluate the technology performance of smart grid.
Considering that performance evaluation for smart grid includes four aspects, a Multiple Criteria Decision Making (MCDM) model is employed to evaluate the performance of all alternatives under conflicting criteria in this study. Technique for Order Preference by Similarity to Ideal Solution (TOPSIS) is a compensatory aggregation MCDM method that has been used to appraise performance in many fields. This model has a simple and logical computation process, and it is able to consider the distance both from benefit ideal and cost ideal solutions. However, due to uncertainty, imprecision and subjectivity, precise values are insufficient to model problems in the real world, such as the social criteria of the smart grid performance evaluation. Therefore, fuzzy TOPSIS with triangular fuzzy numbers is adopted to represent criteria performance with fuzzy characteristic [
7,
8]. In addition, in order to calculate the criteria weights for TOPSIS, some weighting methods have been employed. AHP is one of rational and comprehensive frameworks used to compare and weight criteria with hierarchical structure, which has been applied with other MCDM methods in many problems. Based on the Saaty’s pairwise comparison scale, expert assigns a definite number to reflect the importance among different criteria. However, stochastic and uncertain problems widely exist in the decision processes of a real situation. To reflect uncertainty and flexibility in weighting process, the stochastic AHP is introduced to determine the criteria weights, in which experts can flexibly provide precise value, somewhat value, or totally imprecise value. Therefore, in our research, a hybrid framework on the basis of stochastic AHP and fuzzy TOPSIS methods will be employed to evaluate the performance of “Strong Smart Grid” in China.
The remainder of this paper is organized as follows: a review of the literature related to SG in terms of evaluation criteria and methods, and the main contributions of this research are found in
Section 2. In
Section 3, the basic theories of stochastic AHP and fuzzy TOPSIS are elaborated. The evaluation index system for performance evaluation of SSG is built in
Section 4. The performance evaluation of four regional smart grids in China is performed in
Section 5. Results, discussion and sensitivity analysis are performed to check the rationality and robustness of the proposed model and results in
Section 6. Conclusions are drawn in
Section 7.
2. Literature Review
Owning to the energy crisis and climate deterioration, energy conservation and emissions reduction as well as sustainable development have been the foremost concerns of government. Moreover, the electricity market reform and power quality requirement prompt power grid to enhance energy efficiency by improving operation efficiency, integrating more renewable power generators as well as boosting various applications in demand side management. In 2002, the concept of Smart Grid (SG) was firstly proposed by Electric Power Research Institute (EPRI). Over the past years, worldwide studies related to the optimization and construction of SG have been conducted. Through reviewing smart meter technology and applications, Aslam
et al. [
9] implement smart meters to relieve grid congestion and achieve better power quality. Yigit
et al. [
10] explain and introduce the Cloud Computing architecture into Smart Grid in terms of efficiency, security and usability. Dong
et al. [
11] provide a novel hybrid heuristic optimization method based on simulated annealing and particle swarm optimization methods to figure out the optimum generation dispatching of distributed resources in smart grid. Sintov
et al. [
12] present emerging technologies by integrating smart grid infrastructure with behavioral science, so as to manage users’ behavior and maximize energy efficiency. Colmenar-Santos
et al. [
13] propose a smart-grid configuration that is developed with products of proven reliability and uses renewable energies as main generation source. Xu
et al. [
14] analyze two kinds of UHV techniques in terms of security, economic and environmental aspects, and provide useful references for power system planning in other countries. Dong
et al. [
15] analyze self-healing control technique of smart distribution system, which can solve various problems, such as the low capacity utilization rate, low power supply reliability and high line loss rate. Moslehi
et al. [
16] present a grid-wide IT architectural framework to meet the reliability challenges of SG from renewables, demand response and storage.
In recent years, with the development of smart grid techniques, some studies have been carried out on the performance evaluation of SG. Power reliability and quality are the most important issues. Song
et al. [
17] employ a Monte Carlo simulation procedure based on layered fault tree model to evaluate the reliability of smart grids, which focuses on the perspective of the consumers. Shao
et al. [
18] propose a multi-state power output model for a micro-grid with intermittent renewable resources based on the Markov method, and establish a reliability evaluation model for the distribution network with micro-grid. Morsi
et al. [
19] provide a new fuzzy-wavelet packet transform-based power quality index (FWPTPQI) to evaluate the power quality in smart grid, which reduces the size of data procedure. Liu
et al. [
20] analyze the regional grid power quality based on the evaluation of each substation bus by using the genetic projection pursuit method. To improve the competitiveness of enterprises, economic performance is drawn attentions by power grid companies and scholars. Chen [
21] establishes a new index system of economy evaluation for smart distribute grid, which involves financial indicators of Life Cycle Costs (LCC), benefit indicators as well as indicators for distributed generation, and entropy weight and analytic hierarchy process are applied to evaluate the economy performance of a regional smart distribute grid. Yafang
et al. [
22] present an economic evaluation system of distribute power grid from the perspectives of financial benefits, technical and economic benefits. Onen
et al. [
23] employ the Monte Carlo simulation and restoration algorithm to analyze the economic benefits of SG investments from the perspective of improved efficiency, delaying large capital equipment investments, shortened storm restoration times, and reduced customer energy use, which verifies the automation investments could improve the performance and decrease operation costs. Moreover, some studies have been conducted concerning energy saving and emission production of smart grid. Darby
et al. [
24] analyze the potential of emissions reductions in EU smart grid by 2020 under three scenarios. Siddiqui
et al. [
25] quantify the energy savings and emissions reduction of a Smart Grid infrastructure. Above all, most scholars draw attention to a single aspect of the smart grid performance, such as technology performance, economy performance and environmental performance.
Some developed countries have been keeping high levels on the construction and management of power grid, and accumulated rich experiences in performance evaluation. Since the performance assessment could guide the development of SG, more and more developed countries and famous companies are devoted to establishing evaluation systems for SG. The SG maturity model, proposed by IBM corporation, presents five maturity stages of smart grid, in which the system reliability, renewable resources accession and demand-side management are considered. The grid maturity evaluation can guide power companies to identify their deficiencies and find the orientation need to be improved [
26]. Meanwhile, the United States is devoted to the development of a safe, reliable and modern power grid, which reflects the major goals of the US smart grid in providing customers with better services and flexible responding to emergencies [
27]. Accordingly, in 2009, an evaluation system of smart grid was put forward by United States Department of Energy, in which user-participation, new-product-introduction, operation efficiency, power quality, energy storage device and disaster prevention are involved [
28]. In addition, in terms of construction level, Electric Institute of United State provides a cost and benefit evaluation system of smart grid projects [
29]. European countries have been focusing on new energy exploitation and low-carbon development. Therefore, the performance evaluation system of European smart grid pays more attention to environment protection, such as CO
2 emission reduction, capacity of distributed energy, power loss reduction, and so on [
30]. Above all, it can be seen that almost all comprehensive evaluation systems are established based on the characteristics, strategies and goals of national smart grids.
Nowadays, China concentrates on establishing a strong, self-healing, compatible, economical and interactive power grid based on UHV transmission network. However, current research on the comprehensive evaluation for smart grid in China is rare and inconsistent [
31,
32]. The SSG in China could service the economy and society development during the rapid urbanization and industrialization process. Moreover, it will make contributions to energy adjustment, environment protection and technology advances. Therefore, based on this literature review and strategies related to the “strong smart grid”, a comprehensive evaluation system involving economy, society, environment and technology is proposed in this paper.
As noted, performance evaluation of smart grid requires the consideration of multiple criteria, ranging from qualitative to quantitative aspects. Some multi-criteria decision making tools have been developed for such decisions, such as Data Envelopment Analysis (DEA), Analytical Hierarchy Process (AHP), ANP, Factor Analysis and Matter-element Extension model [
33,
34,
35]. However, most of these methods generally need precise values and lead to precise closeness for each alternative. Consequently, fuzzy TOPSIS is provided by integrating the fuzzy theory and TOPSIS method to deal with the qualitative issues. Moreover, this method can evaluate alternatives by considering the shortest geometric distances from benefit ideal solution and the longest distance from cost ideal solution [
36,
37,
38,
39]. On the other hand, some research aims at integrating the TOPSIS method with various weighting methods, such as AHP-TOPSIS, ANP-TOPSIS and so on [
40,
41,
42]. Most of these improved methods directly use the subjective weights, while do not take the uncertainty and stochastic factors into consideration [
43,
44]. Therefore, consider the hierarchy structure of evaluation criteria, the stochastic AHP method is adopted to upgrade the traditional TOPSIS, which can better address the uncertain and stochastic factors within weights determination.
The main contributions of this research are as follows:
- (1)
From the literature review, we can learn that some current studies only address a single aspect of performance, such as the technique efficiency, economy and environment. Meanwhile, studies related to comprehensive performance are conducted according to the characteristics, strategies and goals of smart grid plan. Therefore, in order to analyze the performance of SSG in China, this research provides a complete and detailed list of the economy, society, environment and technology criteria for sustainability, which takes the strategy and situation of “strong smart grid” into consideration.
- (2)
Fuzzy TOPSIS method has been applied to deal with MCDM problem in many fields. To the best of our knowledge, this is a novel hybrid MCDM technique based on stochastic AHP and fuzzy TOSIS for comprehensive evaluation of strong smart grid. This attempt upgrades the conventional TOPSIS method with stochastic AHP, which can address the uncertain and stochastic factors within weights calculation process. In addition, the proposed framework also extents the application domain of fuzzy TOPSIS method.
- (3)
It can be seen that the MCDM approaches mostly focus on prioritizing the performance of smart grids but do not analyze the criteria performance of alternates. Meanwhile, experts with various knowledge backgrounds may have different priorities. Accordingly, in order to have better insight into the performance evaluation of smart grid, sensitivity analysis is performed to probe into the impacts of sub-criteria weights on final results. Additionally, this study is the first paper to research the economy, society, environment and technology for performance evaluation of smart grid by changing the weights of sub-criteria.
3. Stochastic AHP and Fuzzy TOPSIS Methods for Performance Evaluation of SG
This section detailed describes the stochastic AHP and fuzzy TOPSIS methods. In addition, the framework of the performance evaluation of SG is illustrated briefly.
3.1. Stochastic AHP
Analytical Hierarchy Process, introduced by Saaty, is one of the most efficient decision making models. It has been widely used to determine consistent weights and composite performance scores for alternatives with hierarchical structures. The conventional AHP method is usually used in precise decision problems, while is weak in accessing uncertainty and stochastic problems within decisions [
45]. In order to overcome these problems, several scholars integrated AHP with stochastic theory. In this study, a stochastic AHP based on beta distribution with approximation is employed to determine evaluation criteria weights. On the one hand, it allows experts to use precise, fuzzy or totally imprecise numbers in weighting decision process. On the other hand, it converts the beta distribution into precise value with less time than optimization or simulation models [
46]. The specific steps of stochastic AHP are presented as follows:
Step1: Construct the evaluation hierarchy structure for the performance evaluation of SSG considering the various criteria.
Step2: Compare various elements by using Saaty’s pairwise comparisons. Experts are requested to evaluate each element with one another in their corresponding section. One section contains elements placed in the same level and belongs to a specific element of the hierarchy structure. In the stochastic AHP, experts can provide precise values, intervals with upper and lower bounds, or triangular distributions with upper, lower and middle bounds. Since Saaty’s pairwise comparison scale is widely used, it is also employed for pairwise comparison in this paper (
Table 1).
Specifically, means is mildly more important than ; means is mildly or overtly more important than ; and means is equally, mildly or overtly more important than .
Table 1.
Saaty’s pairwise comparison scale.
Table 1.
Saaty’s pairwise comparison scale.
| Scale(aij) | Meaning |
|---|
| 1 | xi is the same importance as xj |
| 3 | xi is slightly more important than xj |
| 5 | xi is strongly more important than xj |
| 7 | xi is very strongly more important than xj |
| 9 | xi is extremely more important than xj |
| 2, 4, 6, 8 | Middle value of the above |
| reciprocal | xi/xj = aij, then xj/xi = aji = 1/aij |
Step3: Convert imprecise preference into stochastic (beta distributed) pairwise comparison.
To convert imprecise preference into stochastic pairwise comparison, is converted by probability density function , in which are the parameters. For the precise preference, when , . For the imprecise preference, is modeled as a triangular distribution with upper bounds (UB), lower bounds (LB) and middle bounds (MB) . is modeled as a uniform distribution as .
Because of the difficulty of weights calculation for different distributions, the stochastic pairwise comparison are converted into beta distributed pairwise comparison,
. According to a previous study [
46] about the stochastic pairwise comparison and beta distribution,
follows the beta distribution
with shape
and
parameters, where
and
.
In order to precisely convert all
to beta random variables
, all parameters are estimated using the method of moments (MOM). First of all, the sample mean
and sample variance
are obtained by taking the first and second moments as follows:
Then, shape parameters (α,β) can be expressed as the following Equations (3) and (4):
In summary, the converting results from stochastic pairwise comparisons to beta distributed pairwise comparisons are shown as follows:
For triangular distributions value,
According to the formulations of standard mean and variance in the study of [
47],
and
can be expressed as follows:
Step 4: Convert beta distributed pairwise comparisons into precise ones.
In order to obtain the precise value of
, the median
of the beta distribution is used, which can be expressed based on the closed form approximation as follows:
In addition, the median is bounded as follows:
Additionally, when
, the order of the inequalities in Equation (7) should be reversed [
48].
Then, the precise value of
can be obtained as follows [
49]:
Step5: Calculate the local weights of elements and check the consistency of precise pairwise comparisons.
The local priority weights equals to the eigenvector of pairwise comparison matrix for the largest eigenvalue.
The local priority weights can be obtained as follows
where
is the matrix of paired comparisons,
is the eigenvector, and
is the largest eigenvalue of
.
The consistency level should be checked for each pairwise comparison matrix. Only when the consistency level is less than the random consistency threshold, the weights can be computed in the next step. If not, the pairwise comparison should be updated by experts in Step 2.
Step 6: Calculate the global weights of elements.
After all matrixes have passed the consistency test, the global weight of each element can be obtained based on the local weights in each level.
3.2. Fuzzy TOPSIS
Fuzzy set theory, proposed by Zadeh, is an extension of the classical method, which can solve real-world problems involving uncertainty and complexity. The basic idea of this theory is that each element has a membership degree in a fuzzy set. The membership function is employed to define the fuzzy set , which maps an element to a degree of membership within an interval of [0, 1]. In concrete terms, when the membership value equals 1, this element fully belongs to the fuzzy set. Conversely, if the element does not attach to the fuzzy set, the membership value equals 0.
Because of the simple computation process, fuzzy linguistic values are always represented by triangular fuzzy numbers (TFN), defined as a triplet
. The membership function
of TFN is expressed as [
50]:
where
are precise numbers
, and
and
are the bounds of available are for evaluation.
In order to transform the linguistic terms of experts into TFN, the transformation rules for criteria performance are shown in
Table 2 [
51].
Table 2.
Linguistic scales and the triangular fuzzy numbers.
Table 2.
Linguistic scales and the triangular fuzzy numbers.
| Linguistic Scales | Triangular Fuzzy Numbers |
|---|
| Very Low | (0,0,0.2) |
| Low | (0,0.2,0.4) |
| Fair | (0.3,0.5,0.7) |
| High | (0.6,0.8,1) |
| Very High | (0.8,1,1) |
TOPSIS, proposed by Hwang and Yoon (1981), is an often used MCDM method for evaluating alternatives through calculating geometric distances from benefit ideal solution as well as from cost ideal solution. In order to handle the vagueness and uncertainty under fuzzy environment, fuzzy TOPSIS is proposed by combining fuzzy set theory and TOPSIS method, which uses TFN to represent the performance of criteria. The specific steps of fuzzy TOPSIS model are as follows:
Suppose alternatives are ranked by criteria . The criteria performance are determined with linguistic terms that are obtained from decision makers.
Step1: Aggregate the fuzzy ratings for criteria performance of all alternatives.
Let
be the rating on criterion
with respect to alternative
by the decision maker
. Then, aggregate the fuzzy ratings for criterion
of alternative
by decision makers
as follows:
Step 2: Assemble the initial fuzzy decision matrix for alternatives.
The initial fuzzy decision matrix
can be obtained by Equation (11), and the entries of matrix
are given in form of TFN, which are shown as follows:
Step 3: Normalize the initial fuzzy decision matrix.
Generally, the attributes of different criteria may be different. Some criteria are benefits, namely the larger the better, such as the annual income of power grid enterprise, while some criteria hold the cost-type contributions, namely the smaller the better, such as the annual operation cost of power grid. Therefore, in order to make sure the compatibility between benefit criteria and cost criteria, the initial fuzzy decision matrix should be normalized [
52]. The dimensionless procedures are as follows:
Suppose the normalized fuzzy decision matrix is .
For the benefit criteria,
Thus, the normalized fuzzy decision matrix
is expressed as follows:
Step 4: Structure the weighted normalized fuzzy decision matrix.
Considering the importance difference among evaluation criteria, the weighted normalized fuzzy decision matrix
are constructed by multiplying the normalized fuzzy decision matrix
with the weights of criteria [
43], as follows:
Step 5: Determine the two type of ideal solutions.
Divide all criteria into the benefit criteria set
and cost criteria set
. On this basis, fuzzy benefit ideal solution
and the fuzzy cost ideal solution
can be computed by Equations (17) and (18), respectively:
Step 6. Calculate the distances of each alternative from two type of ideal solutions, respectively.
Geometrical distance is the common way to calculate the distance between two triangular fuzzy values. Recently, the chi-square distance has demonstrated its own advantages in discrimination and evaluation . Therefore, an improved method based on the modified geometrical distance and chi-square distance is presented to compute the distance between two triangular fuzzy numbers:
Thus, the distances
and
of each alternative from
and
can be obtained based on Equations (22) and (23), respectively:
Step 7. Calculate the closeness coefficients for all alternatives.
The closeness coefficient
can be used to reflect the distance closest to
as well as
, which can be computed by Equation (24):
Figure 1.
The framework of the proposed model for evaluating the performance of SSG.
Figure 1.
The framework of the proposed model for evaluating the performance of SSG.
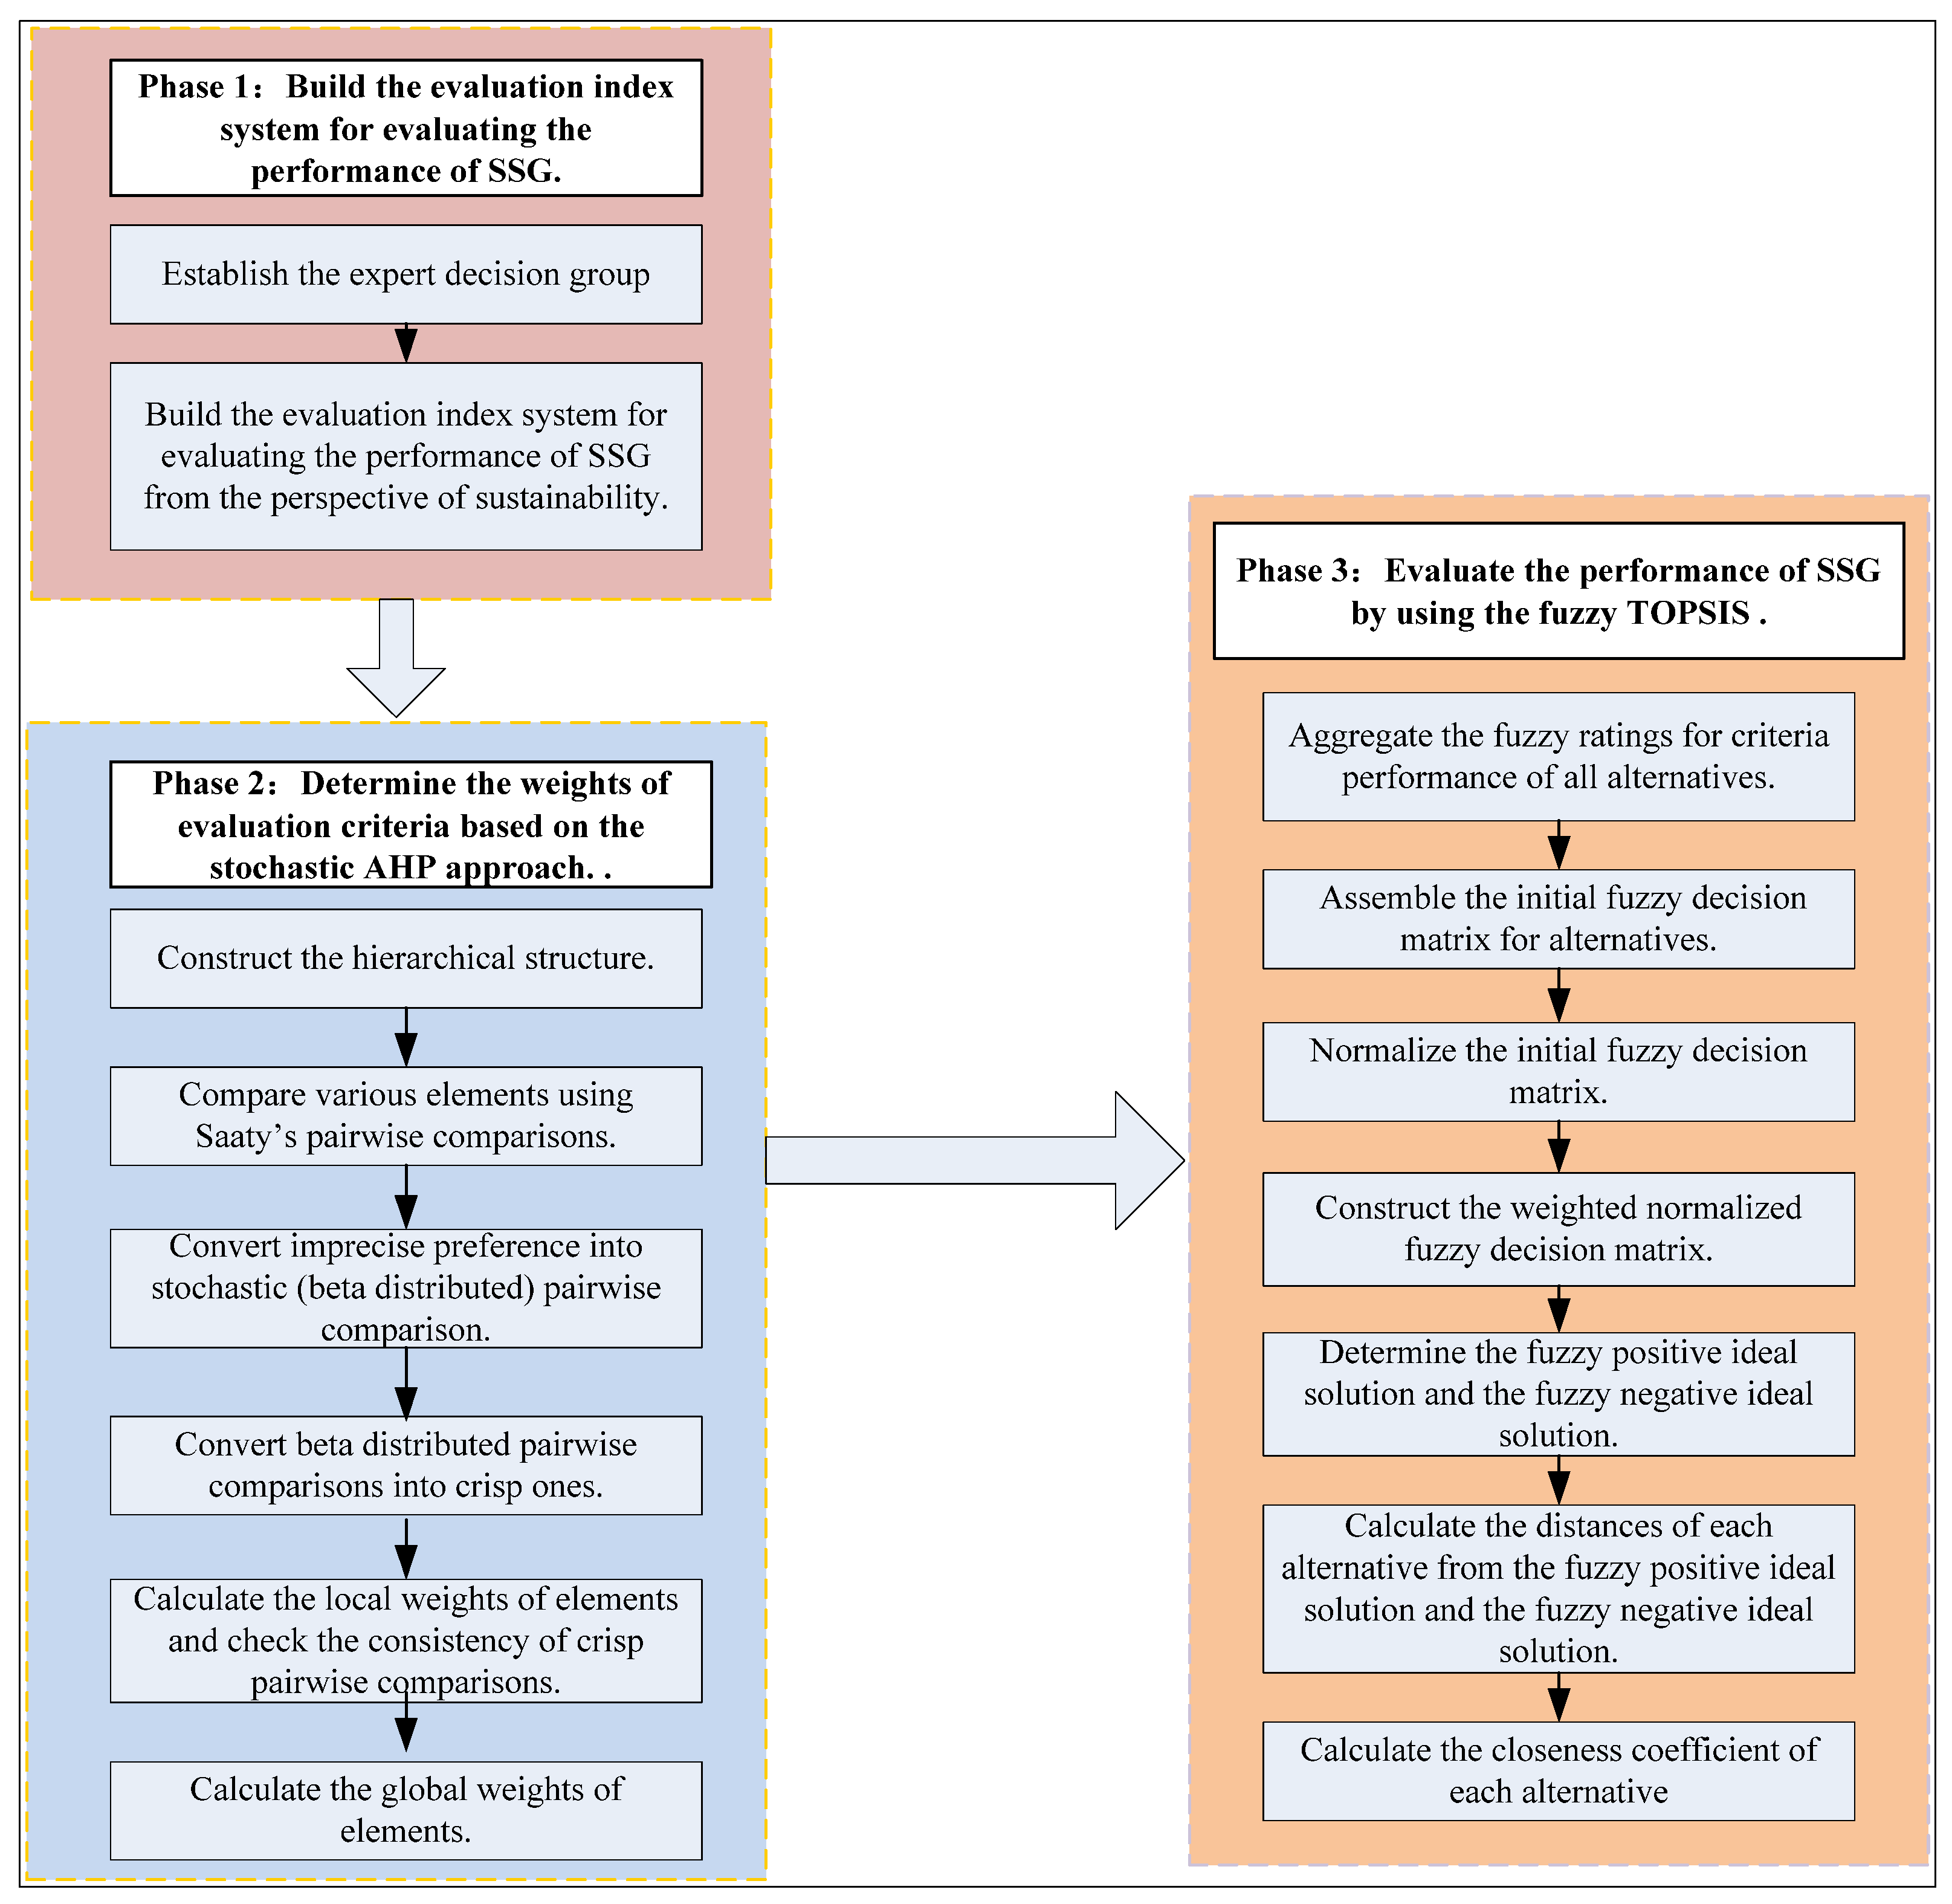
3.3. The Framework of the Proposed Model
The proposed model for evaluating the performance of SSG based on the stochastic AHP and fuzzy TOPSIS involves three phases. First, build the evaluation index system for evaluating the performance of SSG from the perspective of sustainability. Second, calculate the weights of all evaluation criteria based on the stochastic AHP approach. Third, evaluate the performance of SSG using fuzzy TOPSIS. The details are shown in
Figure 1.
4. Evaluation Index System for Performance Evaluation of SSG
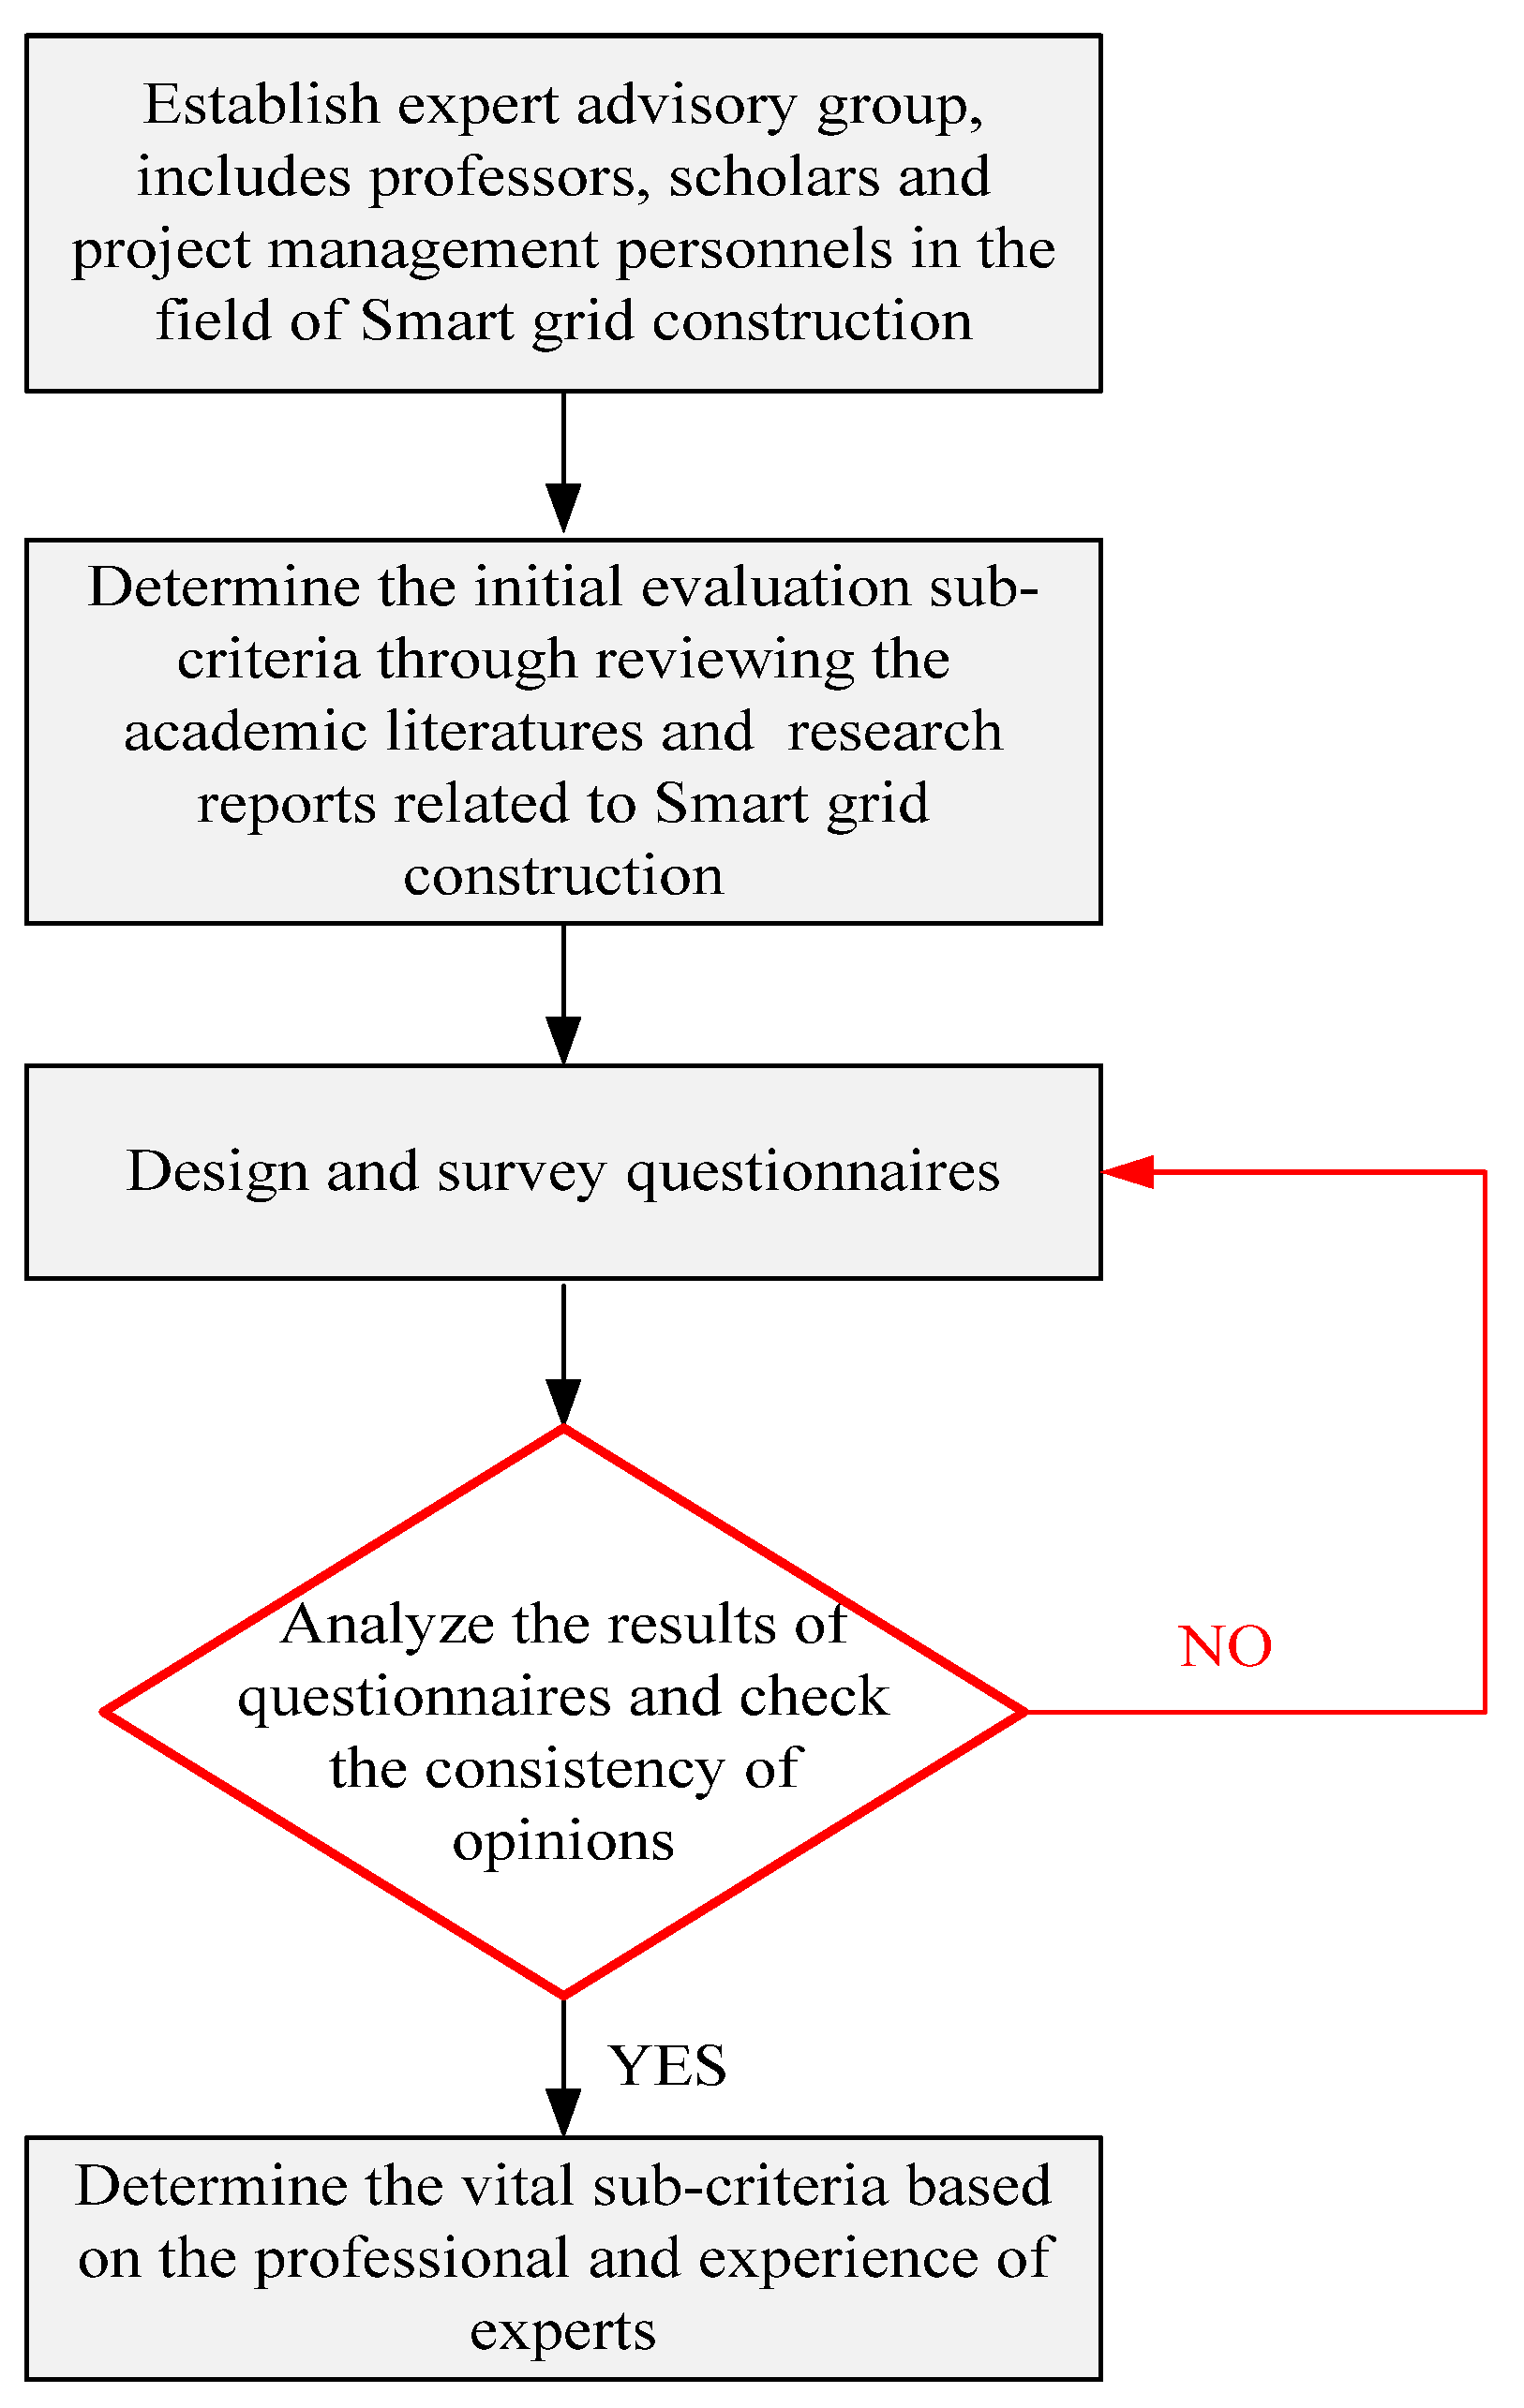
Evaluation criteria are very important to the performance evaluation of SSG. It is important to establish an evaluation index system to comprehensively reflect the inherent characteristics of SSG performance. However, there is no consistent list of criteria for the performance evaluation of SSG in China. In order to promote the sustainable development of SSG, the evaluation index system is built from the perspective of sustainability. Generally, sustainability mainly includes three dimensions, economic, societal and environmental sustainability. Since the digital, automated and interactive SSG in China is supported by large numbers of advanced technologies, technological sustainability is introduced to improve the classical idea of sustainability. Therefore, the evaluation index system for performance evaluation of smart grid includes economy criteria, society criteria, environmental criteria and technology criteria. Further, the sub-criteria affiliated with above four criteria are determined by the following procedure (
Figure 2): First, in order to identify main evaluation sub-criteria, an expert advisory group including professors, scholars and project management personnel in the field of Smart grid construction are established. Second, all experts review the academic literature and research reports related to economy, society, environment, technology and SG construction, and the initial evaluation sub-criteria system is established. Finally, based on the Delphi method, the vital sub-criteria system is determined after analyzing the results of questionnaires and checking the consistency of opinions.
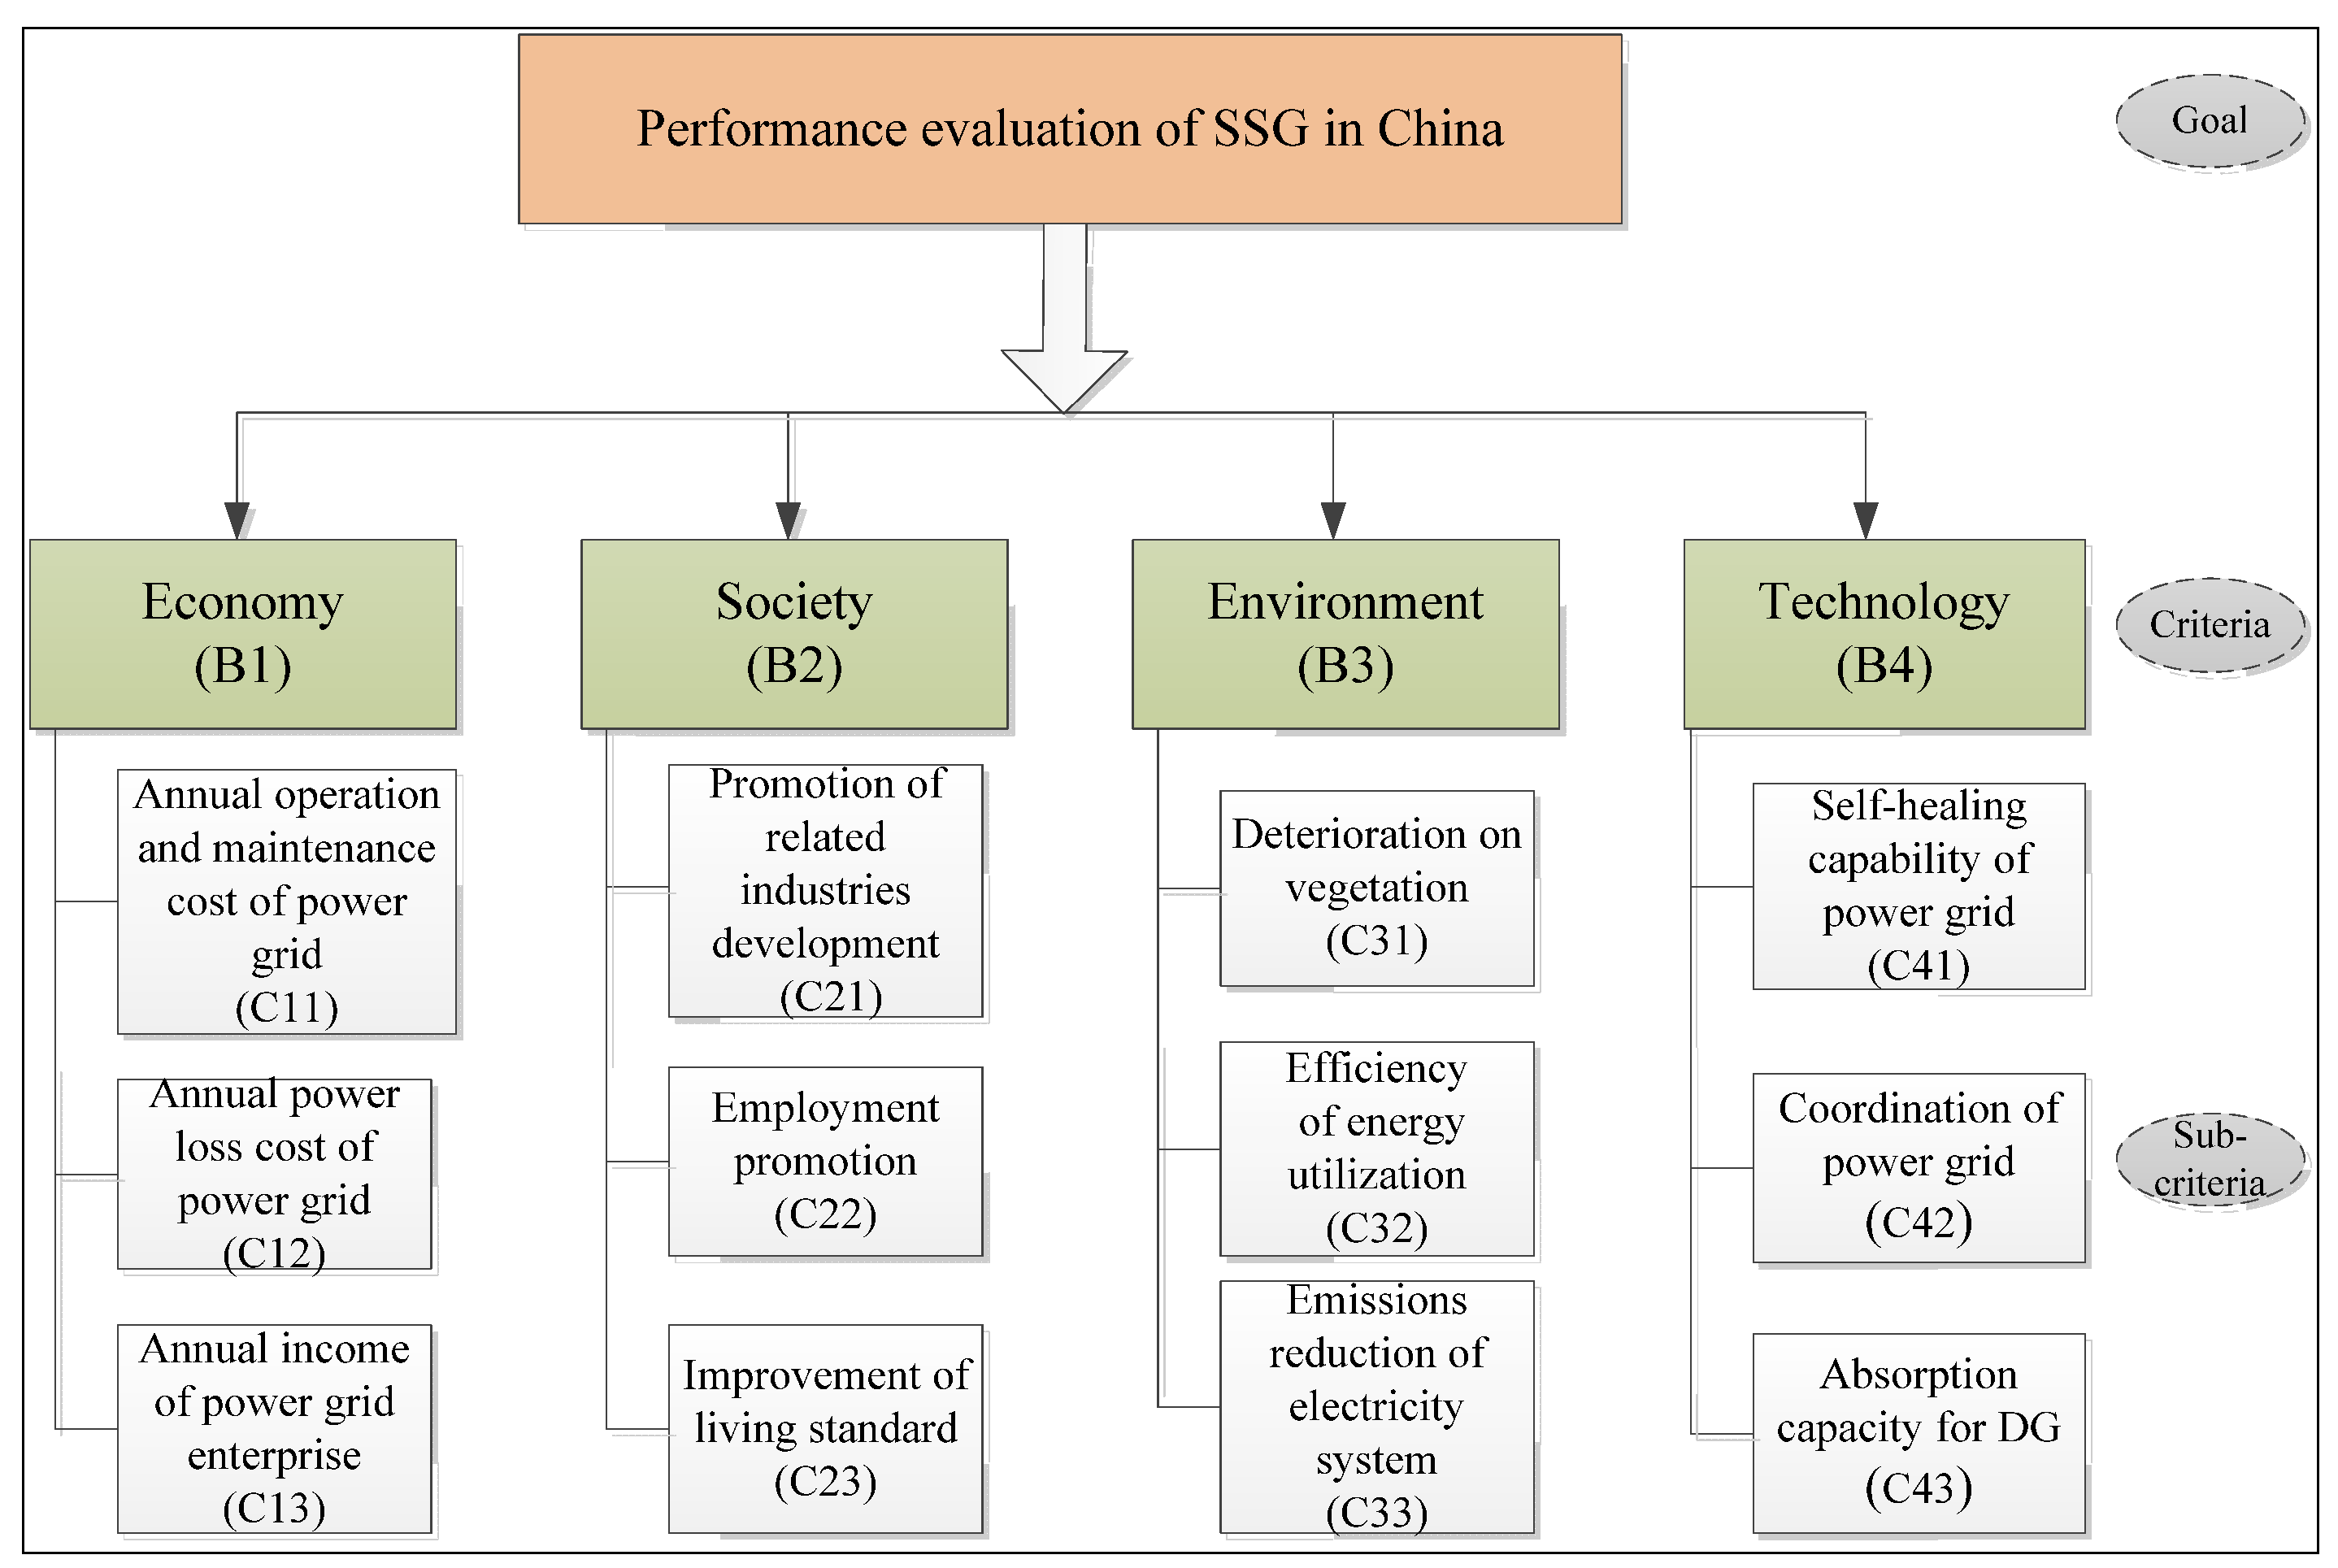
Figure 3 shows the final evaluation index system for performance evaluation of SSG. More details about the interpretation of all sub-criteria are shown as below.
Figure 2.
Evaluation sub-criteria identification procedure.
Figure 2.
Evaluation sub-criteria identification procedure.
Figure 3.
Evaluation index system for performance evaluation of SSG from the sustainability perspective.
Figure 3.
Evaluation index system for performance evaluation of SSG from the sustainability perspective.
4.1. Economy Criteria
Economy performance has drawn the attention of power grid companies. The sub-criteria affiliated with the economy aspect for performance evaluation of SSG are summarized below.
- (1)
Annual operation and maintenance cost of power grid (C11): Includes raw materials, repair, staff repair, tax, financial expenses, and so on.
- (2)
Annual power loss cost of power grid (C12): Refers to transmission loss and management loss of whole power grid.
- (3)
Annual income of power grid enterprise (C13): Includes the main business income, investment income, nonbusiness income, and so on. The main business income from electricity sales income accounts for about 90% of the total income, which is vital to power grid enterprise.
4.2. Society Criteria
The final sub-criteria affiliated with the society criteria for performance evaluation of SSG are summarized below.
- (1)
Promotion of related industries development (C21): The construction of SSG involves a long and complex industry chain, which will promote the development of related industries. This sub-criterion refers to the scale expansion of related enterprises and industries.
- (2)
Employment promotion (C21): Refers to improvement of the employment for related industries.
- (3)
Improvement of living standard (C23): Refers to the improvement of electrification level and living standard due to the construction of SSG.
4.3. Environment Criteria
- (1)
Deterioration of vegetation (C31): Measures the vegetation destruction due to the land development for building network of smart grid.
- (2)
Efficiency of energy utilization (C32): Measures the utilization efficiency of main power generators in the power grid.
- (3)
Emissions reduction of electricity system (C33): Compared to traditional power grid, SSG can absorb more clean distributed generators (such as photovoltaic and wind), which reduces pollutants emissions of electric system. Therefore, this sub-criterion measures the emissions reduction of electric system along with the development of smart grid.
4.4. Technology Criteria
- (1)
Self-healing capability of power grid (C41): Refers to the proportion of automatic recovery users accounting for all fault users.
- (2)
Coordination of power grid (C42): Measures the regulation capacity of peak-load, frequency and pressure.
- (3)
Absorption capacity for DG (C43): Refers to the capacity of distributed generators accessing to the SSG.
5. Empirical Analysis
Northeast China power grid (A1), North China Power Grid (A2), East China power grid (A3) and Central China power grid (A4) are the four most important regional power grids of State Grid Corporation in China. These regional power grids have been devoted to the construction of SSG since 2009. In order to promote the sustainable development and management of SSG, it is necessary to evaluate and rank the performance of different regional smart grids.
Therefore, in this section, the stochastic AHP and fuzzy TOPSIS method are employed to evaluate the performance of four regional smart girds. The MCDM problem related to the performance of SG includes four criteria (economy, society, environment and technology) and twelve sub-criteria. In order to obtain the ratings for criteria weights and performance, four groups of experts with expertise in the field of electric power system, energy management, economy, environment and society are established. More details of evaluation process are shown as below.
5.1. Determine the Evaluation Criteria Weights Based on the Stochastic AHP Approach
Considering the hierarchy structure of evaluation criteria and the stochastic judgment for criteria weights, the stochastic AHP is used to determine the weights of all criteria for evaluation.
- (1)
Compare various elements using Saaty’s pairwise comparison.
Four groups of experts are asked to provide their judgment by comparing each two-element pair under the same section and level in the hierarchy structure. The values of pairwise comparisons provided by experts contain precise values, interval values and triangular distribution values. The judgment of an expert for elements in criteria level is shown in the
Table 3.
Table 3.
Pairwise comparison matrix for elements in the criteria level.
Table 3.
Pairwise comparison matrix for elements in the criteria level.
| | B1 | B2 | B3 | B4 |
|---|
| B1 | 1 | T (3,4,5) | U (1/3,1) | U (5,7) |
| B2 | | 1 | U (1/5,1/3) | T (2,3,4) |
| B3 | | | 1 | U (6,8) |
| B4 | | | | 1 |
- (2)
Convert imprecise preferences into stochastic pairwise comparisons.
According to Equations (1)–(5), all imprecise preference are converted into stochastic beta comparisons, as shown in
Table 4.
Table 4.
Stochastic comparison matrix for elements in the criteria level.
Table 4.
Stochastic comparison matrix for elements in the criteria level.
| | B1 | B2 | B3 | B4 |
|---|
| B1 | 1 | B (2.5,2.5,3,5) | B (1,1,1/3,1) | B (1,1,5,7) |
| B2 | | 1 | B (1,1,1/5,1/3) | B (2.5,2.5,2,4) |
| B3 | | | 1 | B (1,1,6,8) |
| B4 | | | | 1 |
- (3)
Convert beta distributed pairwise comparisons into precise ones.
Then, these stochastic pairwise comparisons are converted into precise ones by using Equations (6)–(8). The comparison with precise matrix for elements in the criteria level is shown in
Table 5.
Table 5.
Stochastic comparison matrix for elements in the criteria level.
Table 5.
Stochastic comparison matrix for elements in the criteria level.
| | B1 | B2 | B3 | B4 |
|---|
| B1 | 1 | 4 | 0.6667 | 6 |
| B2 | 0.2500 | 1 | 0.2667 | 3 |
| B3 | 1.4993 | 3.7453 | 1 | 7 |
| B4 | 0.1667 | 0.3333 | 0.1429 | 1 |
- (4)
Calculate the weights of precise pairwise comparisons.
After checking the consistency of comparisons, the local weights and global weights are calculated by implementing Equation (9).
Table 6 shows the weights of elements in the criteria level for a subset of experts and the aggregated value for all experts. The complete list of aggregated final weights for each criteria and sub-criteria is given in
Table 7.
Table 6.
Weights of elements in the criteria level for four groups and aggregations.
Table 6.
Weights of elements in the criteria level for four groups and aggregations.
| | E1 | E2 | E3 | E4 | Aggregated
(for Four Experts) |
|---|
| B1 | 0.3656 | 0.2881 | 0.3182 | 0.2468 | 0.3047 |
| B2 | 0.1223 | 0.2083 | 0.1303 | 0.1987 | 0.1649 |
| B3 | 0.4576 | 0.3891 | 0.4291 | 0.4412 | 0.4292 |
| B4 | 0.0546 | 0.1145 | 0.1224 | 0.1133 | 0.1012 |
Table 7.
Criteria weights for the performance evaluation of smart grid.
Table 7.
Criteria weights for the performance evaluation of smart grid.
| Main Criteria | Local Weight | Sub-Criteria | Global Weight | Ranking |
|---|
| Economy (B1) | 0.3047 | Annual operation and maintenance cost of power grid (C11) | 0.1233 | 3 |
| Annual power loss cost of power grid (C12) | 0.0856 | 6 |
| Annual income of power grid enterprise (C13) | 0.0958 | 4 |
| Society (B2) | 0.1649 | Promotion of related industries development (C21) | 0.0953 | 5 |
| Employment promotion (C22) | 0.0172 | 12 |
| Improvement of living standard (C23) | 0.0523 | 9 |
| Environment (B3) | 0.4292 | Deterioration of vegetation (C31) | 0.2171 | 1 |
| Efficiency of energy utilization(C32) | 0.1364 | 2 |
| Emissions reduction of electricity system (C33) | 0.0758 | 7 |
| Technology (B4) | 0.1012 | Self-healing capability of power grid (C41) | 0.0597 | 8 |
| Coordination of power grid (C42) | 0.0173 | 11 |
| Absorption capacity for DG (C43) | 0.0242 | 10 |
5.2. Evaluate the Performance of Four Regional Smart Grids Based on Fuzzy-TOPSIS
The fuzzy-TOPSIS method is then employed to evaluate and rank the performance of four regional smart grids in China.
- (1)
Establish the initial fuzzy decision matrix for alternatives.
After reviewing the general information of four regional smart grids, each experts group provided the linguistic ratings for the performance of all sub-criteria (
Table 8).
Table 8.
Linguistic ratings for the sub-criteria of four regional smart grids.
Table 8.
Linguistic ratings for the sub-criteria of four regional smart grids.
| | | C11 | C12 | C13 | C21 | C22 | C23 | C31 | C32 | C33 | C41 | C42 | C43 |
|---|
| E1 | A1 | H | F | L | VL | F | F | H | VL | H | F | VL | L |
| A2 | VL | L | H | F | F | VH | VH | VL | F | VL | F | H |
| A3 | L | H | L | H | H | H | F | L | VL | F | H | H |
| A4 | VH | F | F | H | L | L | H | H | H | F | L | L |
| E2 | A1 | F | F | F | L | L | H | F | F | VH | L | L | VL |
| A2 | GH | F | F | F | F | H | F | L | L | L | VH | F |
| A3 | F | L | L | VH | VH | VH | H | H | H | F | VH | VH |
| A4 | GH | F | H | L | H | F | L | F | L | F | F | VL |
| E3 | A1 | H | H | L | L | F | H | H | L | L | VH | L | L |
| A2 | L | F | H | H | VH | H | L | L | VL | L | H | VH |
| A3 | F | H | H | VH | H | F | H | H | F | F | F | H |
| A4 | GH | H | VL | F | VL | H | VL | VH | VH | L | L | F |
| E4 | A1 | GH | L | F | F | H | F | VH | F | F | H | H | F |
| A2 | F | H | H | VH | H | F | H | H | H | H | L | H |
| A3 | L | L | VL | F | VH | H | L | F | VL | VH | VH | VH |
| A4 | F | F | H | H | L | L | L | H | VH | H | F | H |
Then, according to
Table 2 and
Table 8, the initial fuzzy decision matrix of alternatives is assembled by implementing Equation (12), as follows:
- (2)
Normalize the initial fuzzy decision matrix and assemble the weighted normalized fuzzy decision matrix.
According to Equations (13)–(16), the initial fuzzy decision matrix
and weighted normalized fuzzy decision matrix
can be constructed as below:
- (3)
Compute the closeness coefficient of each regional smart grid.
Then, calculate the fuzzy benefit ideal solution
and fuzzy cost ideal solution
according to Equations (22) and (24), respectively. The distances of each alternative from the benefit ideal solution and the cost ideal solution are as follows:
According to Equation (24), the closeness coefficient (
) of each alternative can be computed as follows:
The results show that A3 and A1 are first and last in the list of priorities, respectively. Therefore, A3, namely the performance of East China power grid outranks the other three regional smart grids.
6. Discussion
The performances of four regional smart grids are ranked using stochastic AHP and fuzzy TOPSIS methods, in which the East China power grid A3 obtains the significantly highest score. In order to obtain better insight from the performance evaluation of SSG, we will probe into the sub-criteria weights and performance of different regional smart grids.
Table 7 shows that the sub-criteria C31 and C32 affiliated with environment criteria obtain much more attention from experts group, which reflects the strategy and goals of SSG in energy utilization. Meanwhile, the sub-criteria affiliated with economy criteria are secondarily important, which is consistent with the development goals of the Chinese government. As we all know, the construction of SSG contributes to the economic development in China, while in recent years, electric industry has suffered pressure from the “twelfth five-year” plan’s environmental protection law. Power grids are responsible for environment protection. Moreover, the severe environment and resource constraints have posed undesirable conditions on human life. Therefore, the environment aspect has been given more consideration by experts for the performance evaluation of SSG in China.
From
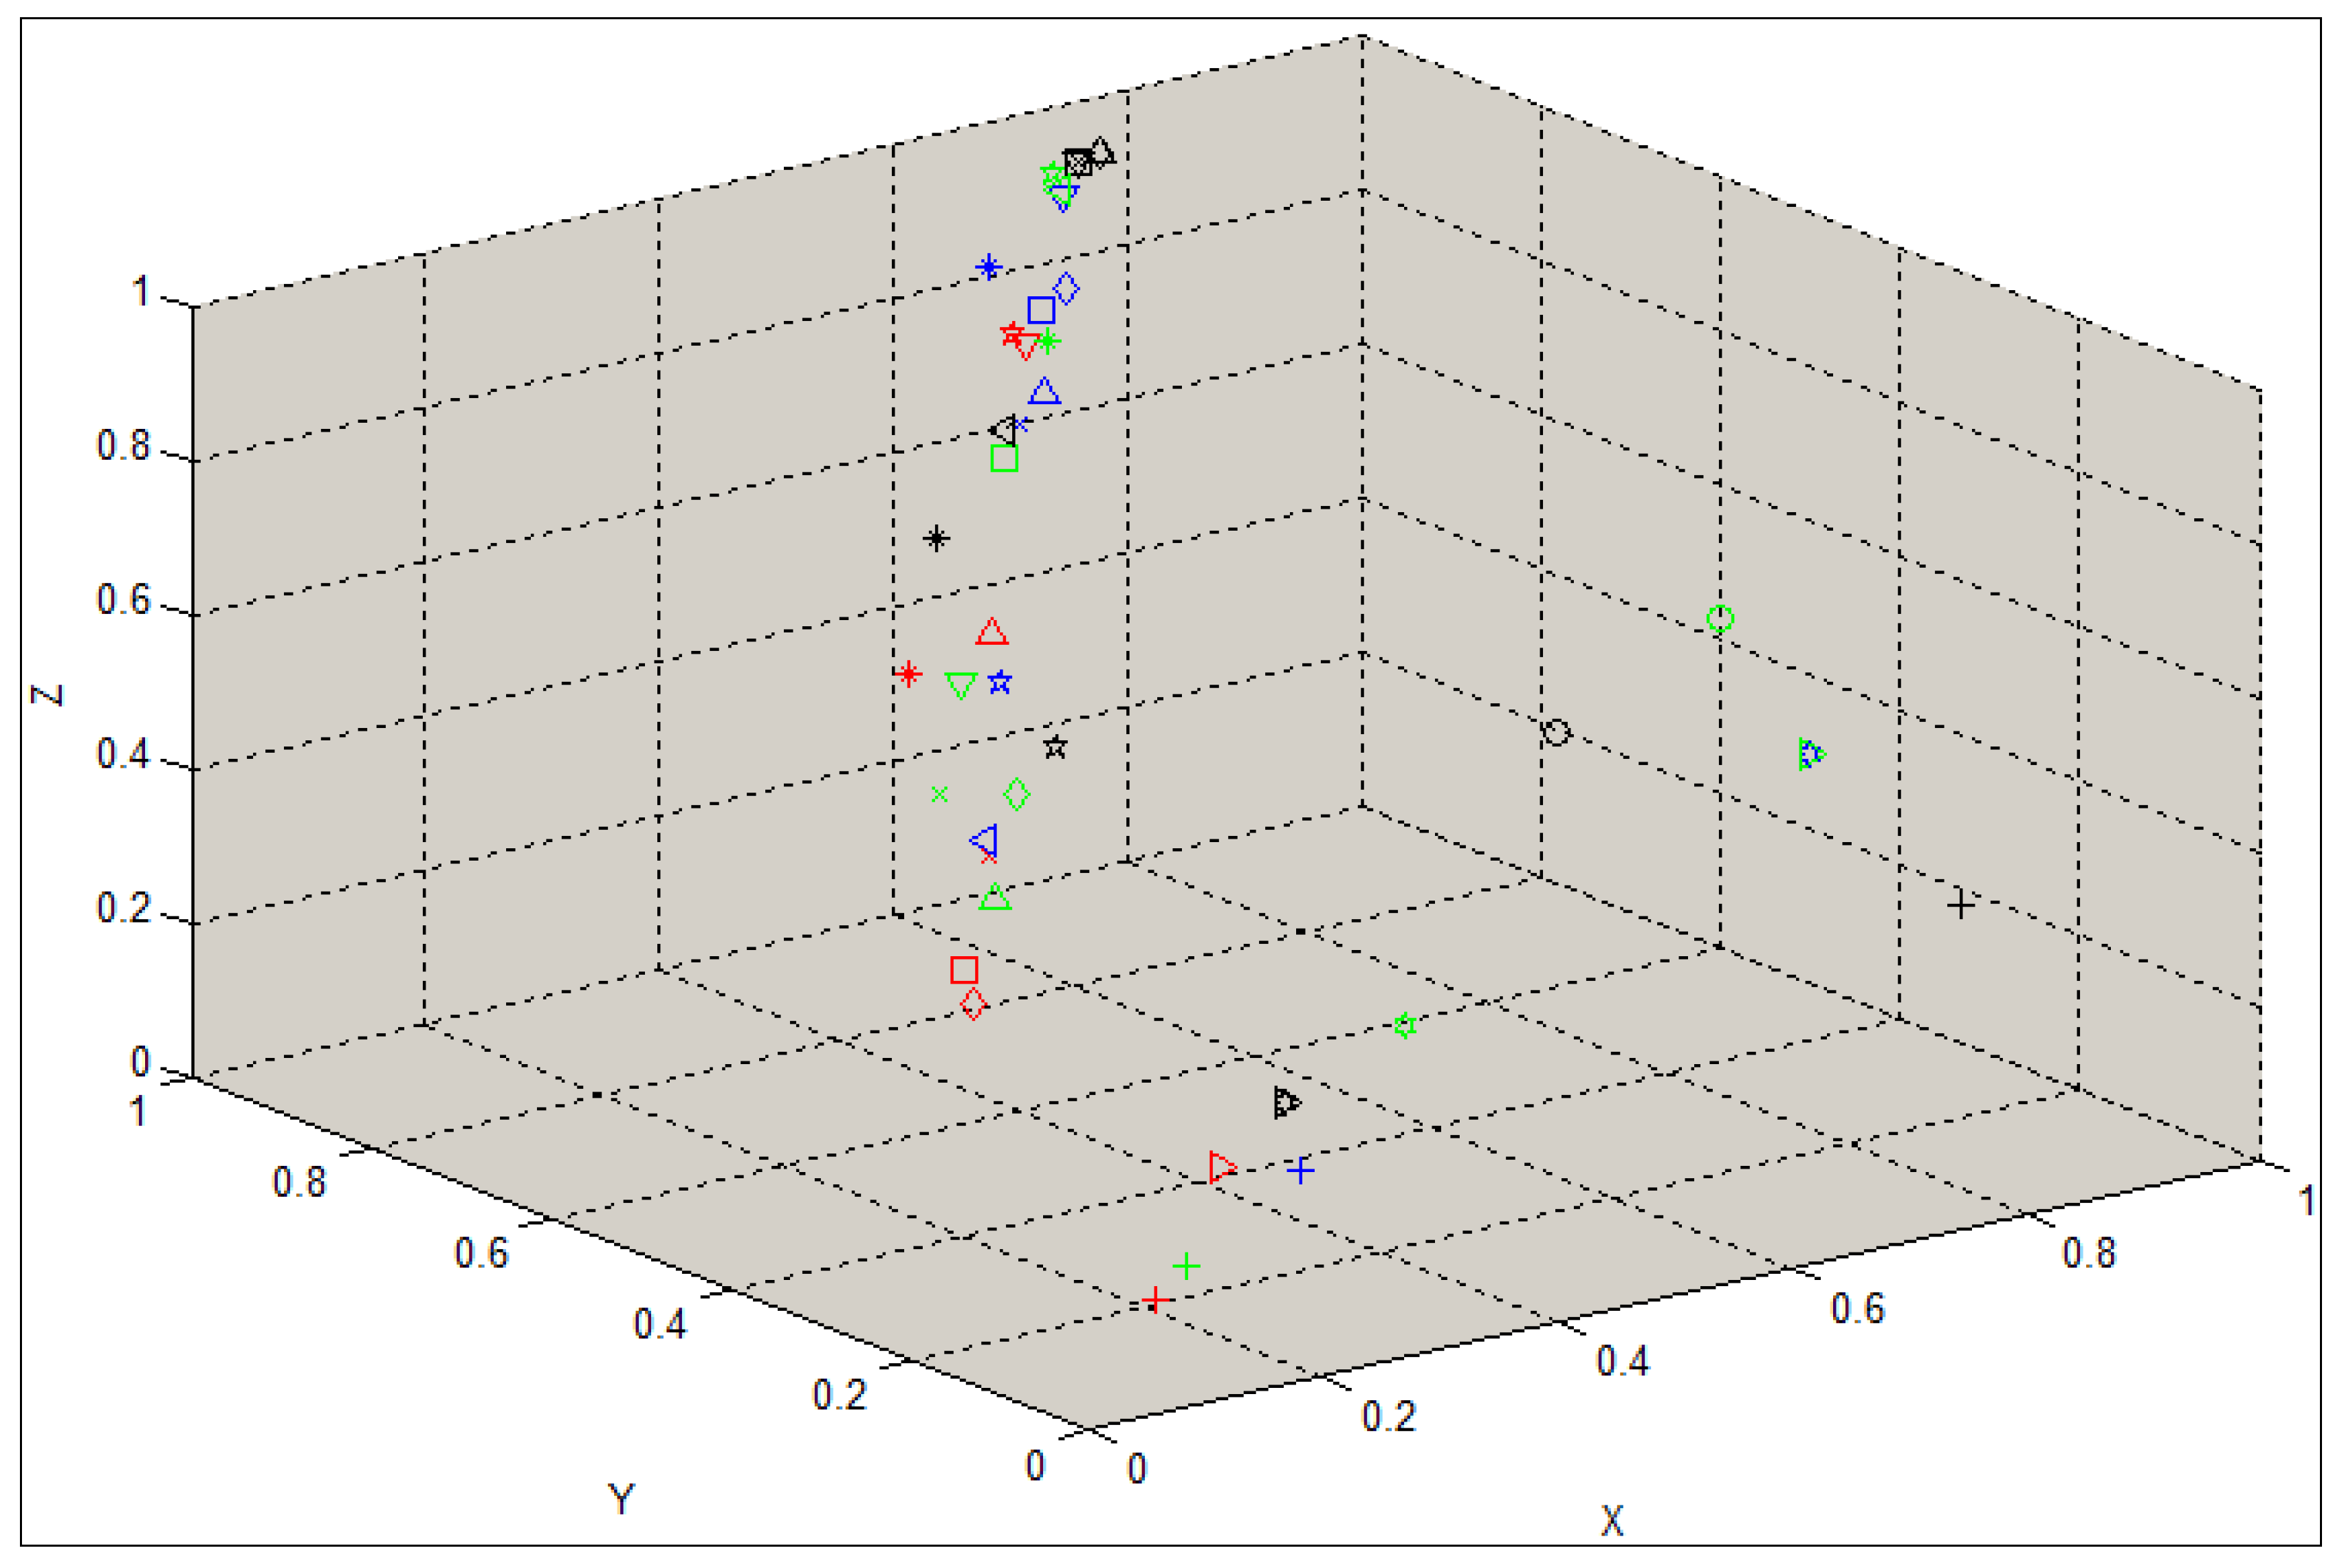
Figure 4, it can be seen that for the smart grid A3 (marked in black), sub-criteria C11, C21, C22, C23, and C42 own the best performance compared to that of the other grids, and the total weights of these criteria account for almost 50% of the total. Sub-criteria C31 and C32 show the second best performance. Meanwhile, C11, C21, C31 and C32 obtain large weights (ranked third for C11, fifth for C21, first for C31, and second for C32). Although sub-criteria C12, C33 and C41 obtain the lowest value, but the gaps are small, and the weights of these three sub-criteria are not large (ranked sixth for C12, seventh for C33, and eighth for C41). Accordingly, the performance of East China power grid (A3) outranks the other three regional smart grids.
For the regional smart grid A2 (marked in blue), the sub-criteria C12, C13, C41, and C31 have the best performance, and C11, C21, C22, C23, C42, and C43 received the second highest scores. Taking the sub-criteria scores as well as weights into consideration, A2 shows the second ranking among four regional smart grids. For the regional smart grid A1 (marked in red), there are eight sub-criteria that received the lowest scores, and these sub-criteria own large weights. As a result, A1 has the worst performance among all the regional grids.
Figure 4.
The sub-criteria performance of four regional smart grids. Notes: (1) X-axis, Y-axis and Z-axis represent the lower bound, middle value and upper bound of the performance for sub-criteria, respectively; (2) “+”, “o”, “
”, “
”, “
”, “
”, “
”, “
”, “☆”, “
![Sustainability 08 00129 i001]()
”, “
”, “
” represent the performance of sub-criteria C11, C12, C13, C21, C22, C23, C31, C32, C33, C41, C42, and C43, respectively; and (3) different colors represent different region smart grids—red represent smart grid A1, blue represents smart grid A2, black represents smart grid A3, and green represents smart grid A4.
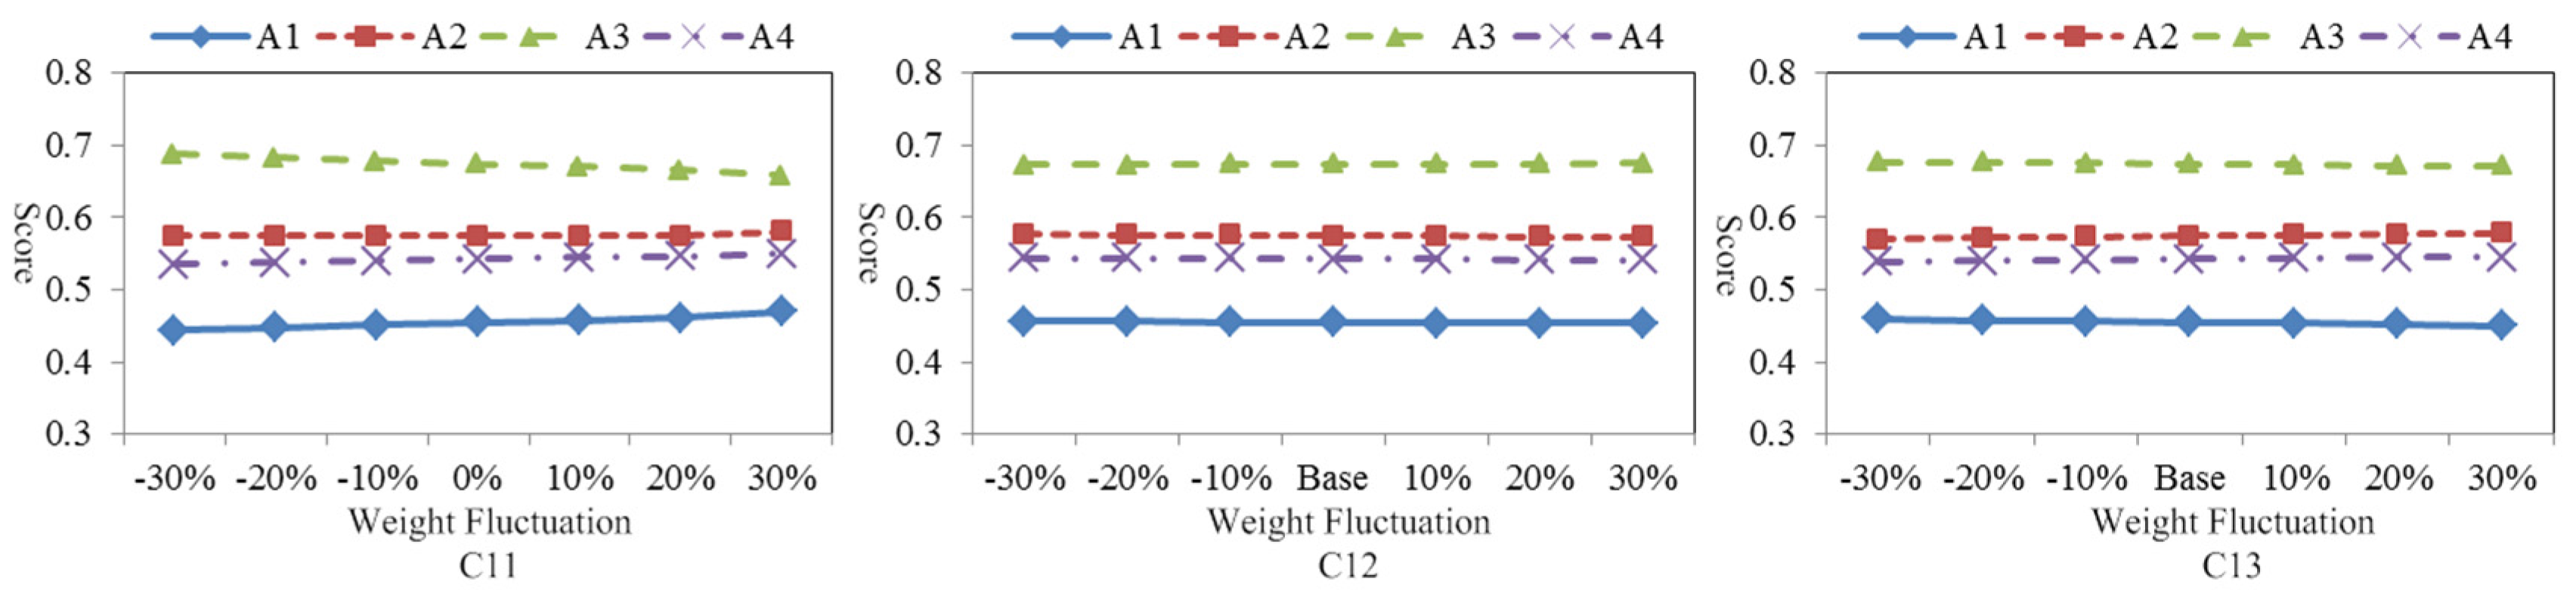
In order to verify the robustness of evaluation results, a sensitivity analysis on the impacts of index weights for the performance evaluation is presented. According to the criteria, twelve sub-criteria are divided into four analysis group, namely economy, society, environment and technology groups. All sub-criteria have 10%, 20% and 30% less weight than base weight and 10%, 20% and 30% more weight than base weight (all base weight are shown in
Table 7).
It can be seen in
Figure 5 that the final score of alternative A3 decreases when the sub-criteria C11 becomes more important. Meanwhile, as C11 is given more importance, the final score of alternative A1, A2 and A4 increases, which move closer to that of alternative A3. However, no matter how C11 weight changes, A3 always keeps the first ranking as the base case. For the weight changes of C12 and C13, the scores of four smart grids more or less decline along with increasing of weights. Therefore, no matter how changes of weights in the economy group, A3 always keeps the highest scores in the performance evaluation of smart grids.
Figure 5.
Sensitivity analysis results of sub-criteria in economy group.
Figure 5.
Sensitivity analysis results of sub-criteria in economy group.
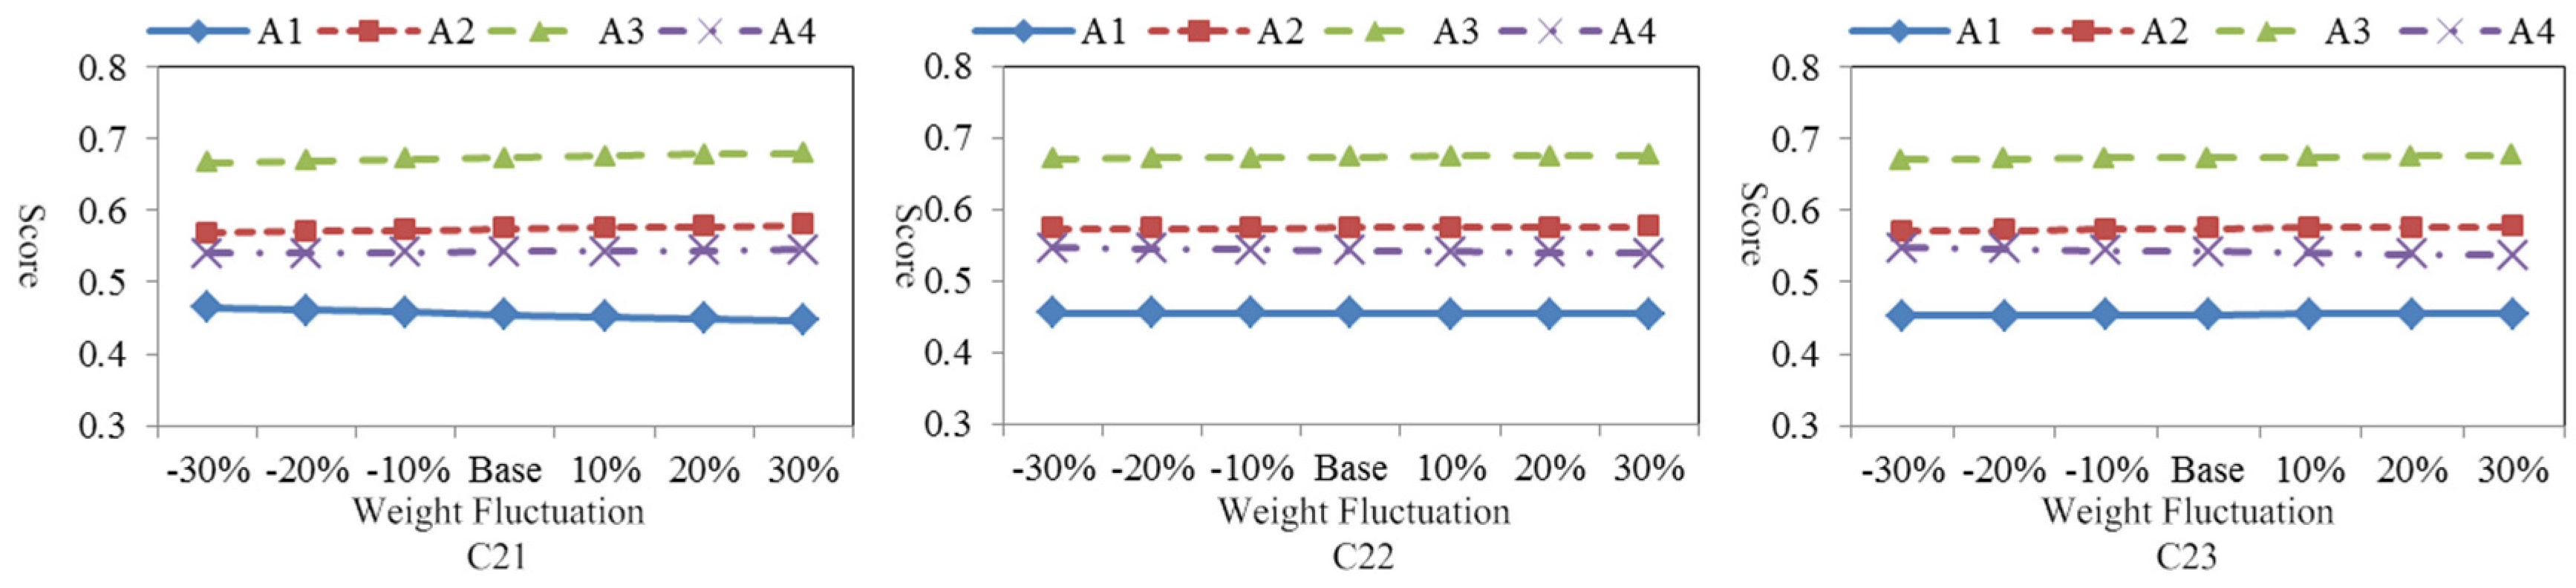
For the weights change of sub-criteria in the society group (
Figure 6), the scores of four regional smart grids have small variations, no matter how the sub-criteria C22 and C23 change. Moreover, when the weight of C21 becomes more important, the scores of the other three smart grids increase, while the score of A1 decreases and keeps its bottom ranking. Therefore, no matter how changes of sub-criteria weight in the society group, A3 and A1 are the optimal and worst regional smart girds, respectively.
Figure 6.
Sensitivity analysis results of sub-criteria in society group.
Figure 6.
Sensitivity analysis results of sub-criteria in society group.
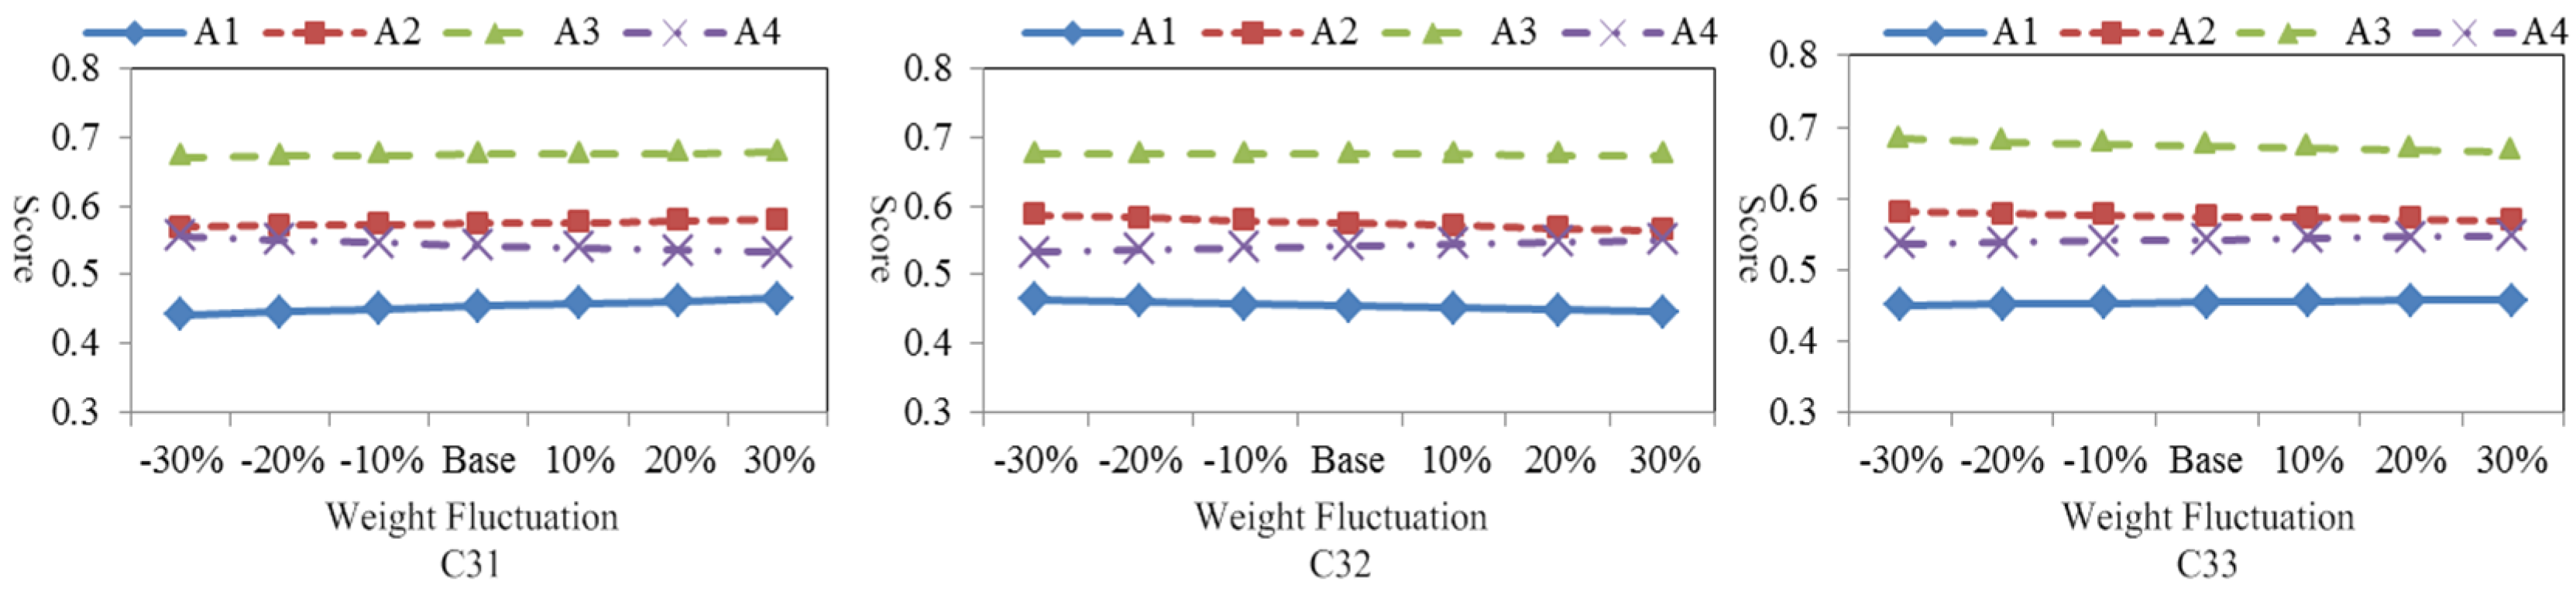
Figure 7 shows A2 and A4 have opposite variation trend in the case of C31, C32 and C33 weights fluctuation. For example, as the sub-criteria C32 becomes more important, the scores of A2 and A4 become much closer, while with the weights of sub-criteria in the environment group, the ranks of these four smart grids remain relatively stable, even though these sub-criteria carry large weights in performance evaluation of smart grid.
Figure 7.
Sensitivity analysis results of sub-criteria in environment group.
Figure 7.
Sensitivity analysis results of sub-criteria in environment group.
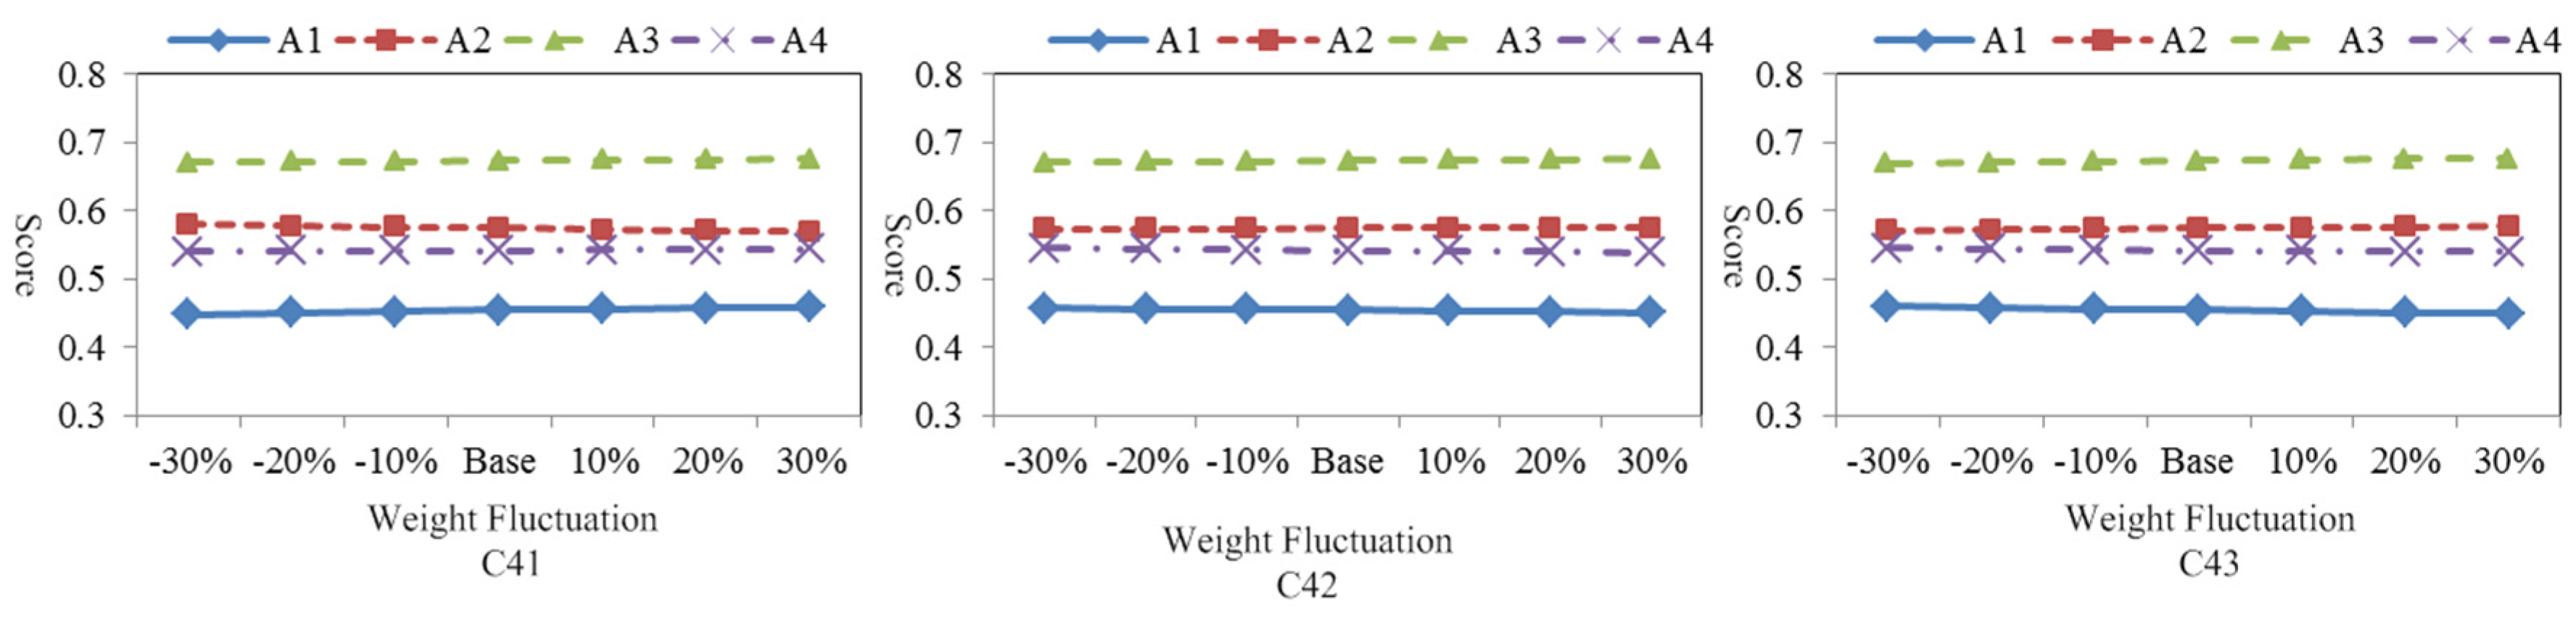
For the sub-criteria in technology group, the scores of all smart grids hold small variation trend in the case of weights fluctuation of C41, C42 and C43 (
Figure 8). The scores of A3 in the three cases keep the same increasing trend as the weights become more important. The scores of A2 and A4 have the opposite variation trend. Moreover, just as that in economy, society and environment groups, A3 and A1 are still the best and worst regional smart grids, respectively, no matter how the sub-criteria weights in the technology group change.
Figure 8.
Sensitivity analysis results of sub-criteria in technology group.
Figure 8.
Sensitivity analysis results of sub-criteria in technology group.
Above all, four regional smart grids always keep their ranks, no matter how the sub-criteria weights change. It can be verified that the performance evaluation of region smart grids using stochastic AHP and fuzzy TOPSIS method is robust and effective.
7. Conclusions
The performance evaluation of SSG is critical because of the significant role it plays in China’s energy saving and emission reduction. Therefore, a novel hybrid framework for evaluating the performance of SSG from the perspective of sustainability is presented. Considering the technology characteristics of SG, the evaluation index system is built including four sustainability criteria, economy, society, environment and technology. In addition, 12 sub-criteria are comprehensively determined based on a literature review and experts opinions from various fields. To address the ambiguity and vagueness of sub-criteria, the fuzzy TOPSIS method is employed to evaluate the performance of smart grids. Moreover, the sub-criteria weights are determined by the stochastic AHP method, which upgrades the traditional TOPSIS by addressing the fuzzy and stochastic factors in the process of weights calculation. The results show that sub-criteria C31 and C32 affiliated with environment criteria obtain much more attention than the other criteria from experts group, which is consistent with the development goals of the Chinese government. Meanwhile, regional smart grid A3 possesses the best performance among all alternatives. This paper not only calculates the performance of all regional smart grids, but also analyzes the performance of sub-criteria in detail. A sensitivity analysis is performed to test the robustness of the evaluation results, which shows that the four regional smart grids always keep their ranks, no matter the sub-criteria weights are changed. Therefore, the hybrid framework proposed in this paper is reasonably practical, effective and robust, showing great potential for evaluating and ranking the performances of SSG from a sustainable perspective.
Although the results obtained from this research are satisfactory, the proposed framework can still be improved. It is worth mentioning that the weights of sub-criteria and even the sub-criteria list need to be re-determined along with the change of objective conditions. Furthermore, an application software based on the proposed framework can be developed to quickly calculate and analyze the performance of SSG.


 ”, “”, “” represent the performance of sub-criteria C11, C12, C13, C21, C22, C23, C31, C32, C33, C41, C42, and C43, respectively; and (3) different colors represent different region smart grids—red represent smart grid A1, blue represents smart grid A2, black represents smart grid A3, and green represents smart grid A4.