
Urban Land Development for Industrial and Commercial Use: A Case Study of Beijing


Abstract
:1. Introduction
2. Methods and Data
2.1. Choice of Independent Variables
2.1.1. Social and Economic Factors
2.1.2. Built Environment
2.1.3. Natural Factors
2.1.4. Institutional Factors
2.2. Data Preparation and Processing
2.2.1. Dependent Variables
2.2.2. Independent Variables
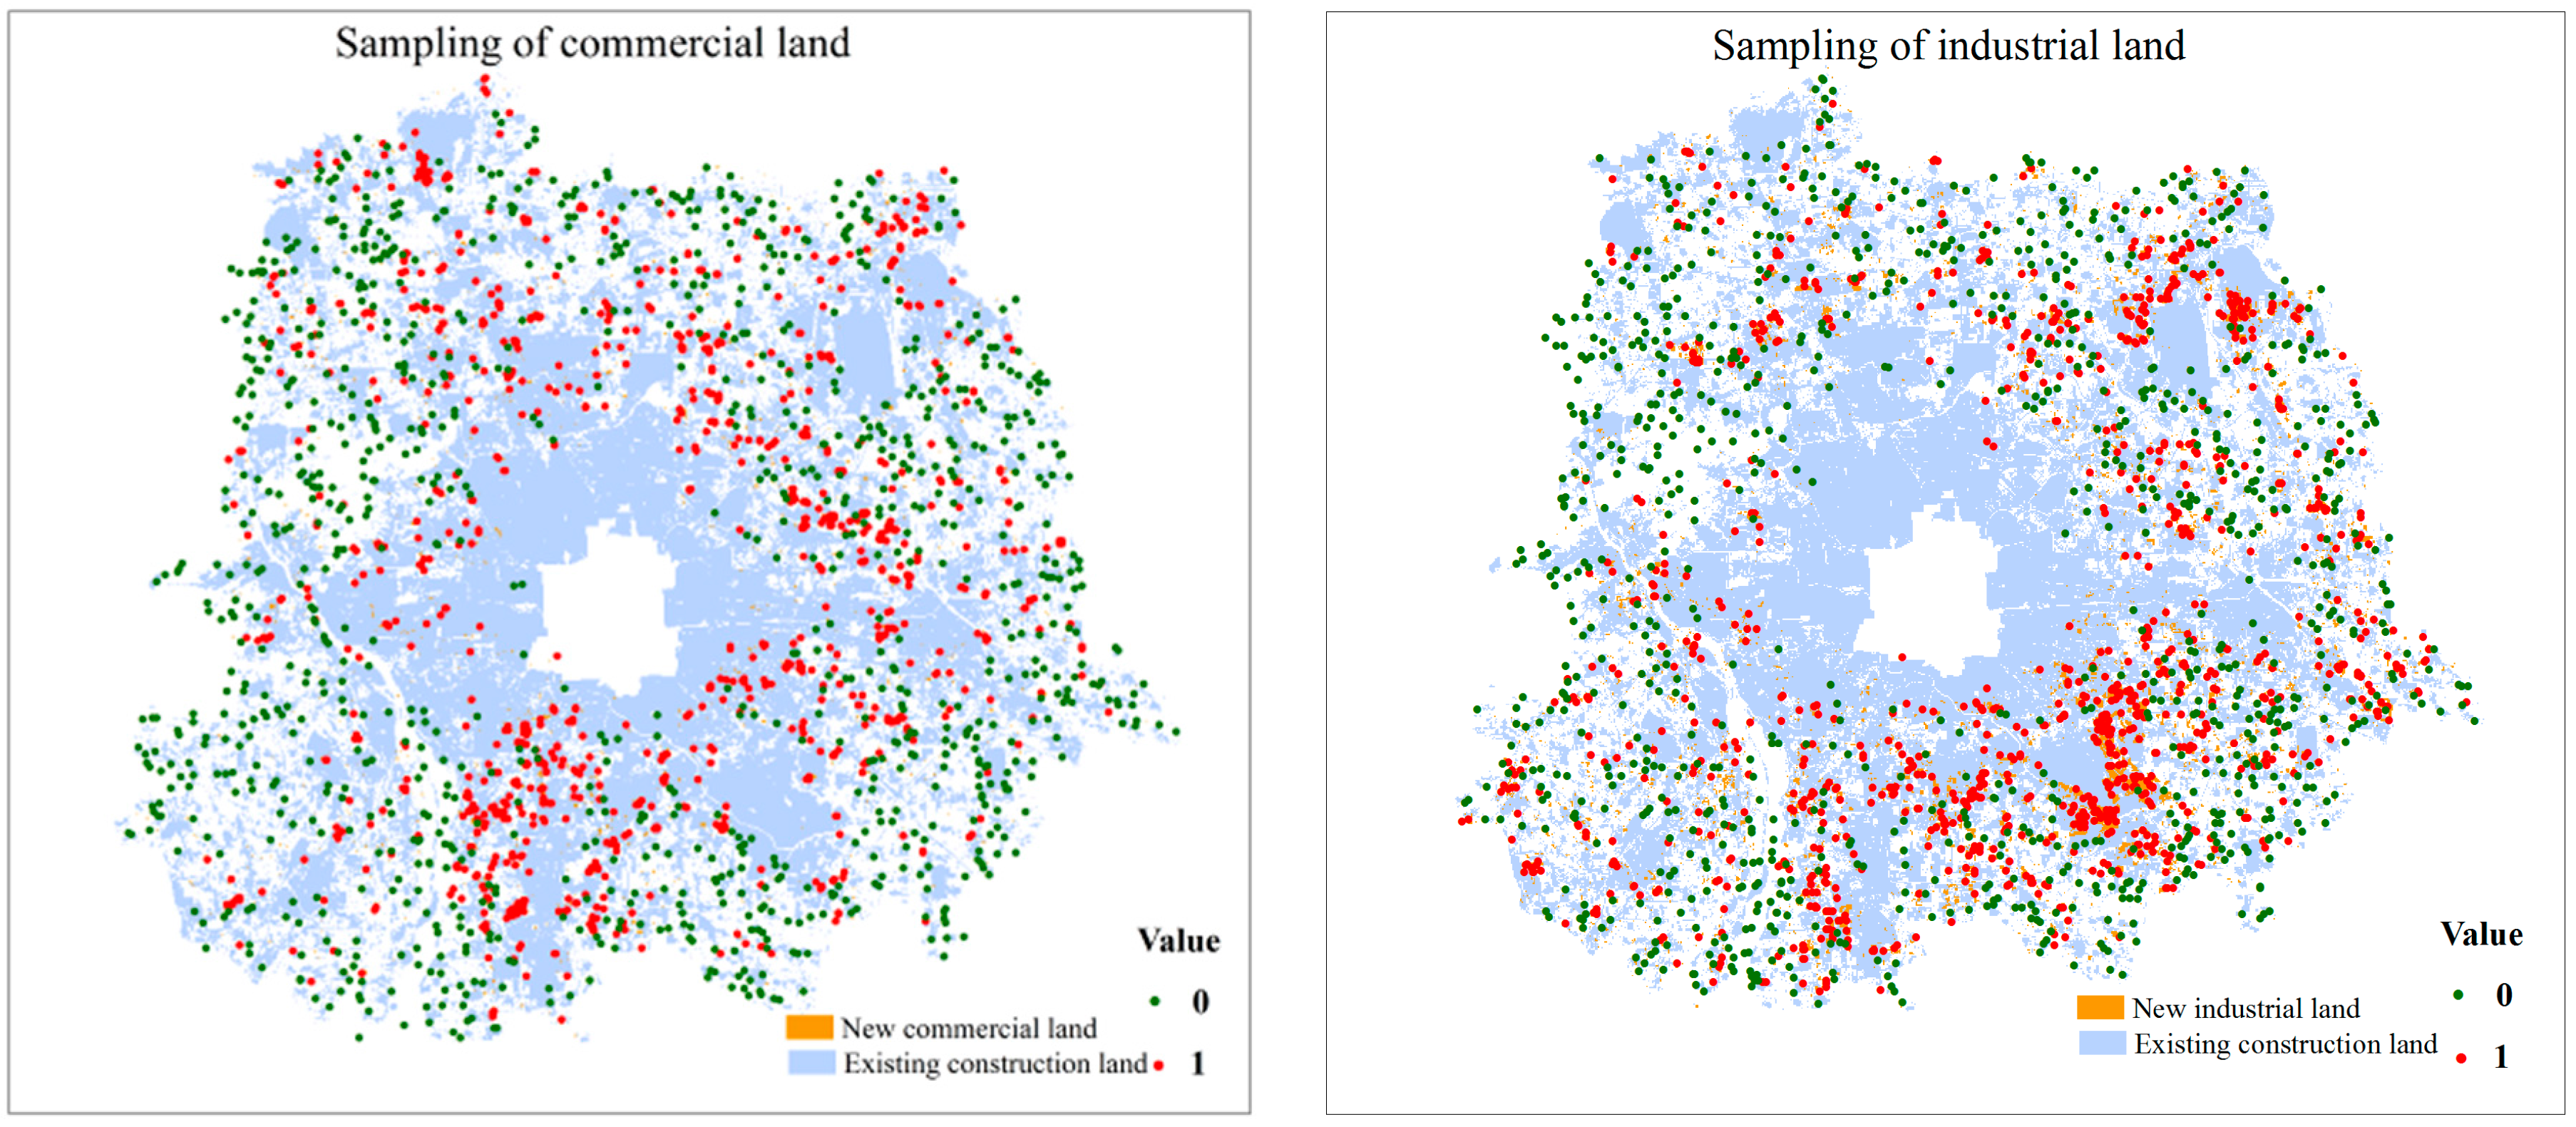
2.3. Spatial Sampling
2.4. Logistic Model to Measure Land Use Change
3. Results
3.1. Industrial and Commercial Land Use Changes
3.2. Estimation of Drivers of Land Use Change
3.3. Determinants of Industrial Land Change
3.4. Determinants of Commercial Land Change
4. Discussion
4.1. Comparison of the Determinants
4.1.1. Socio and Economic Factors
4.1.2. Built Environment
4.1.3. Nature Factor
4.1.4. Urban Planning
4.2. Recommendations of Urban Sustainable Development
5. Conclusions
- (1)
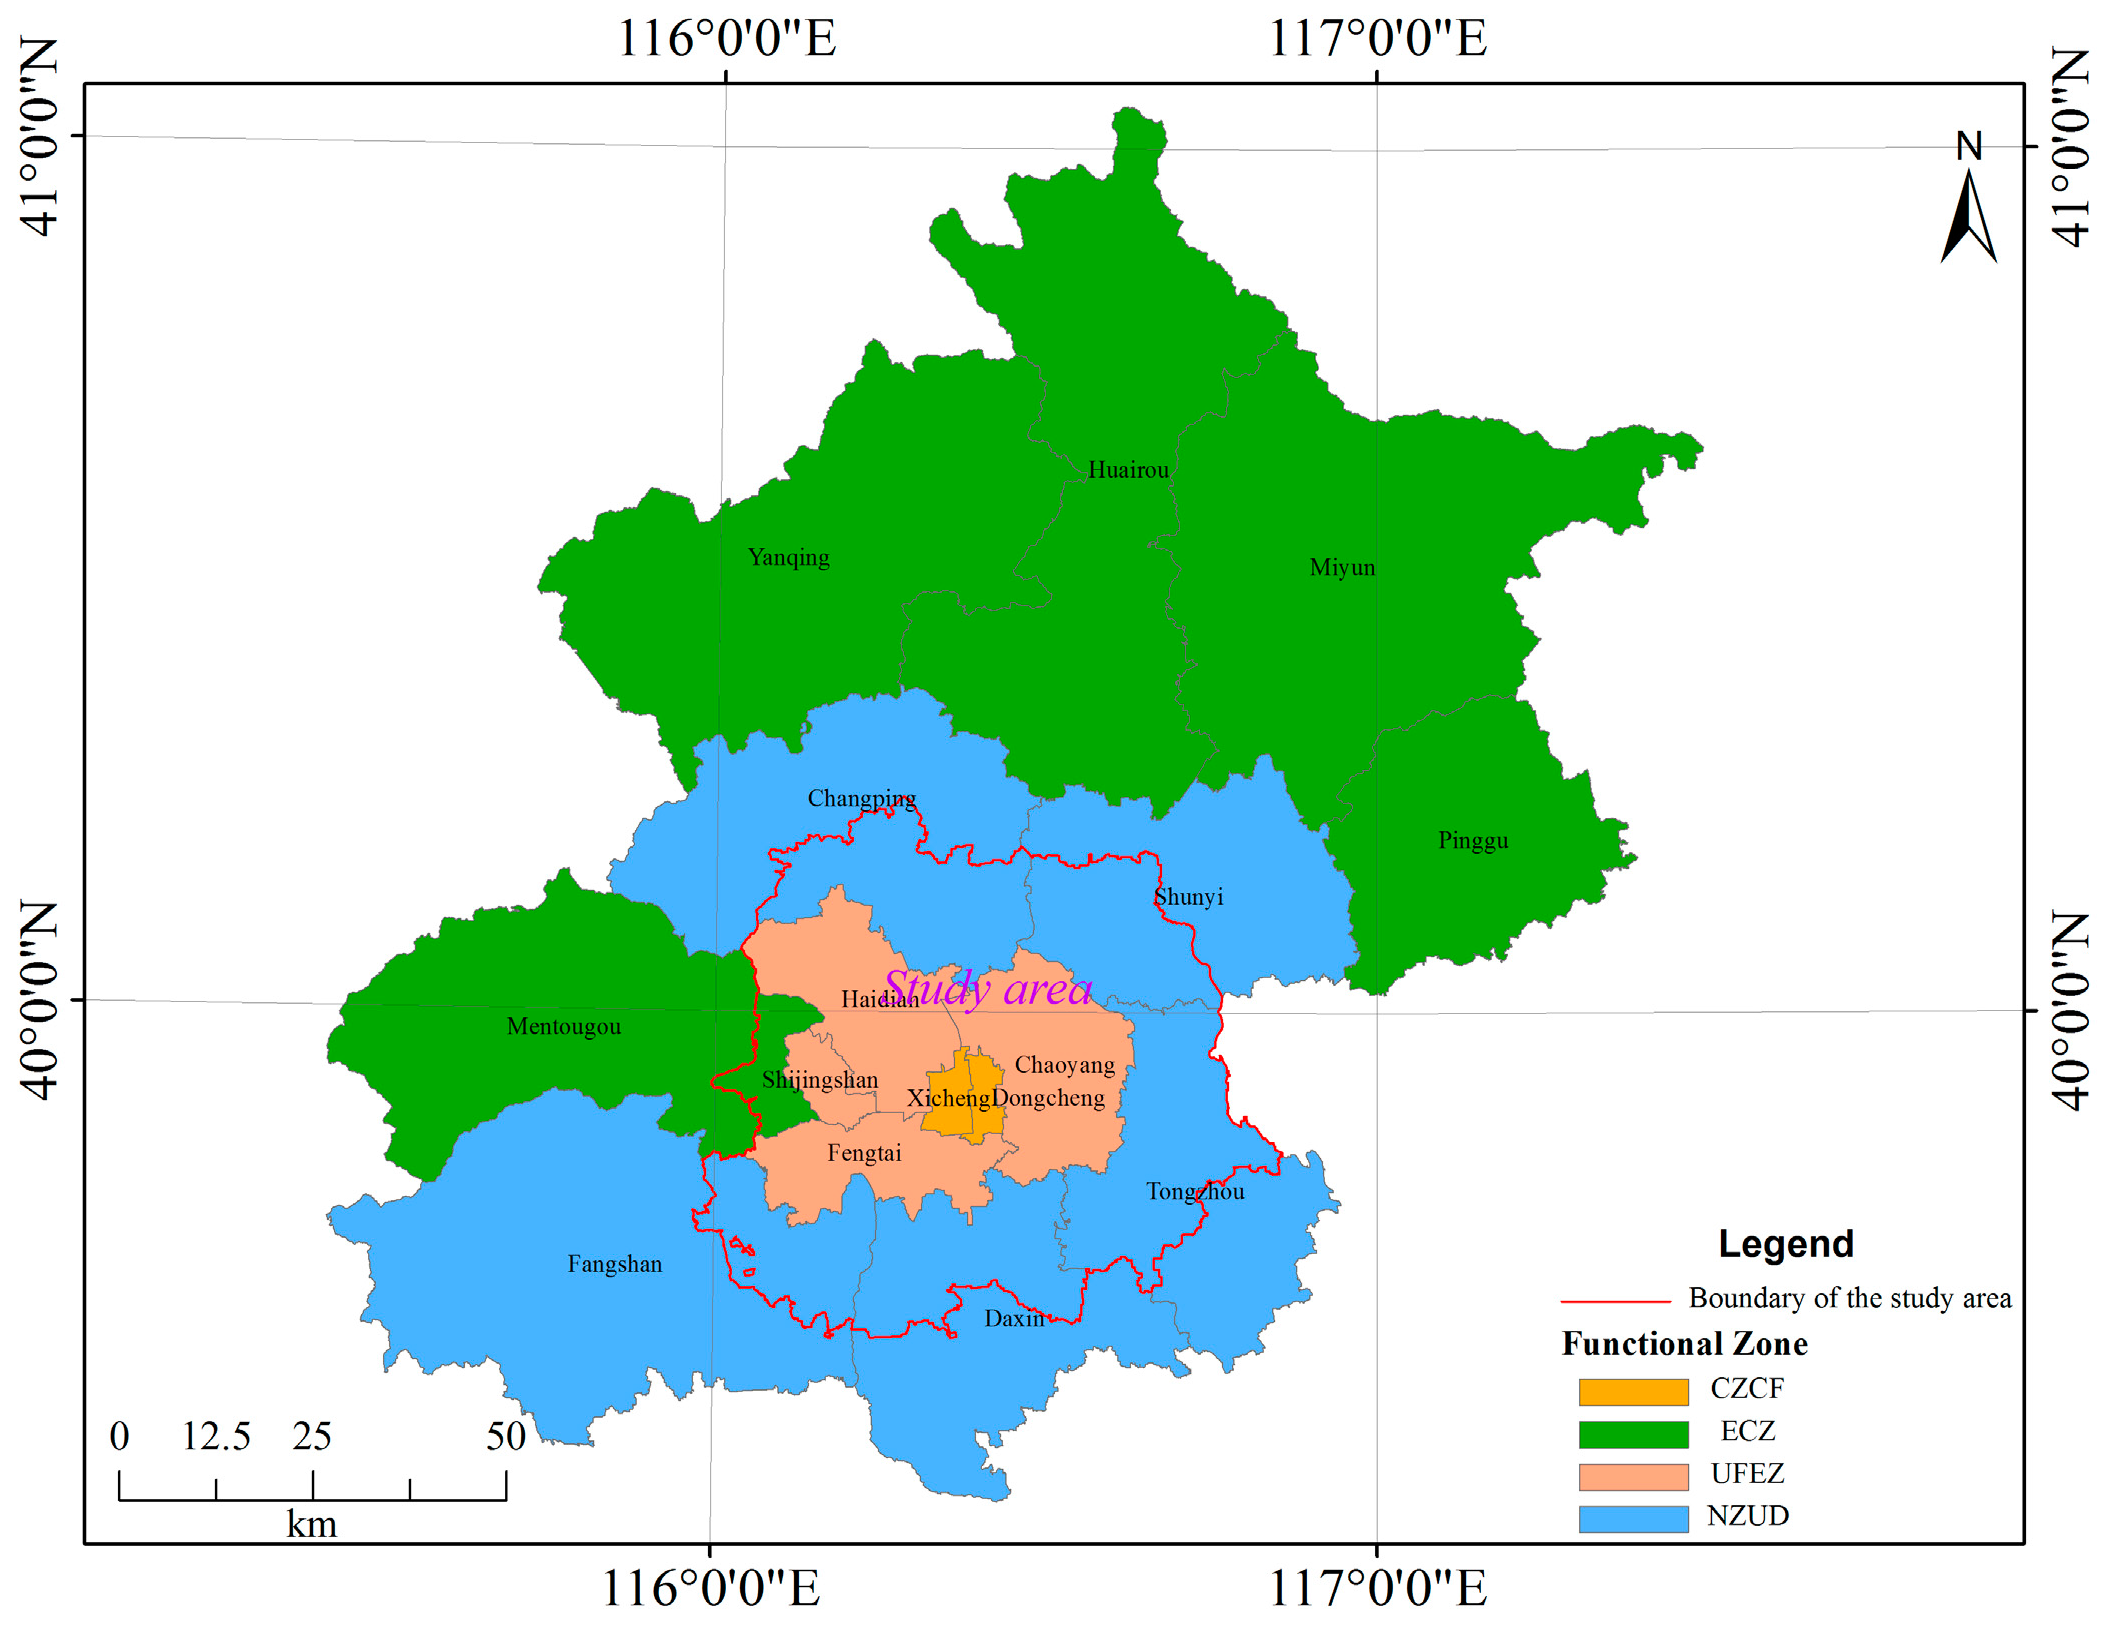
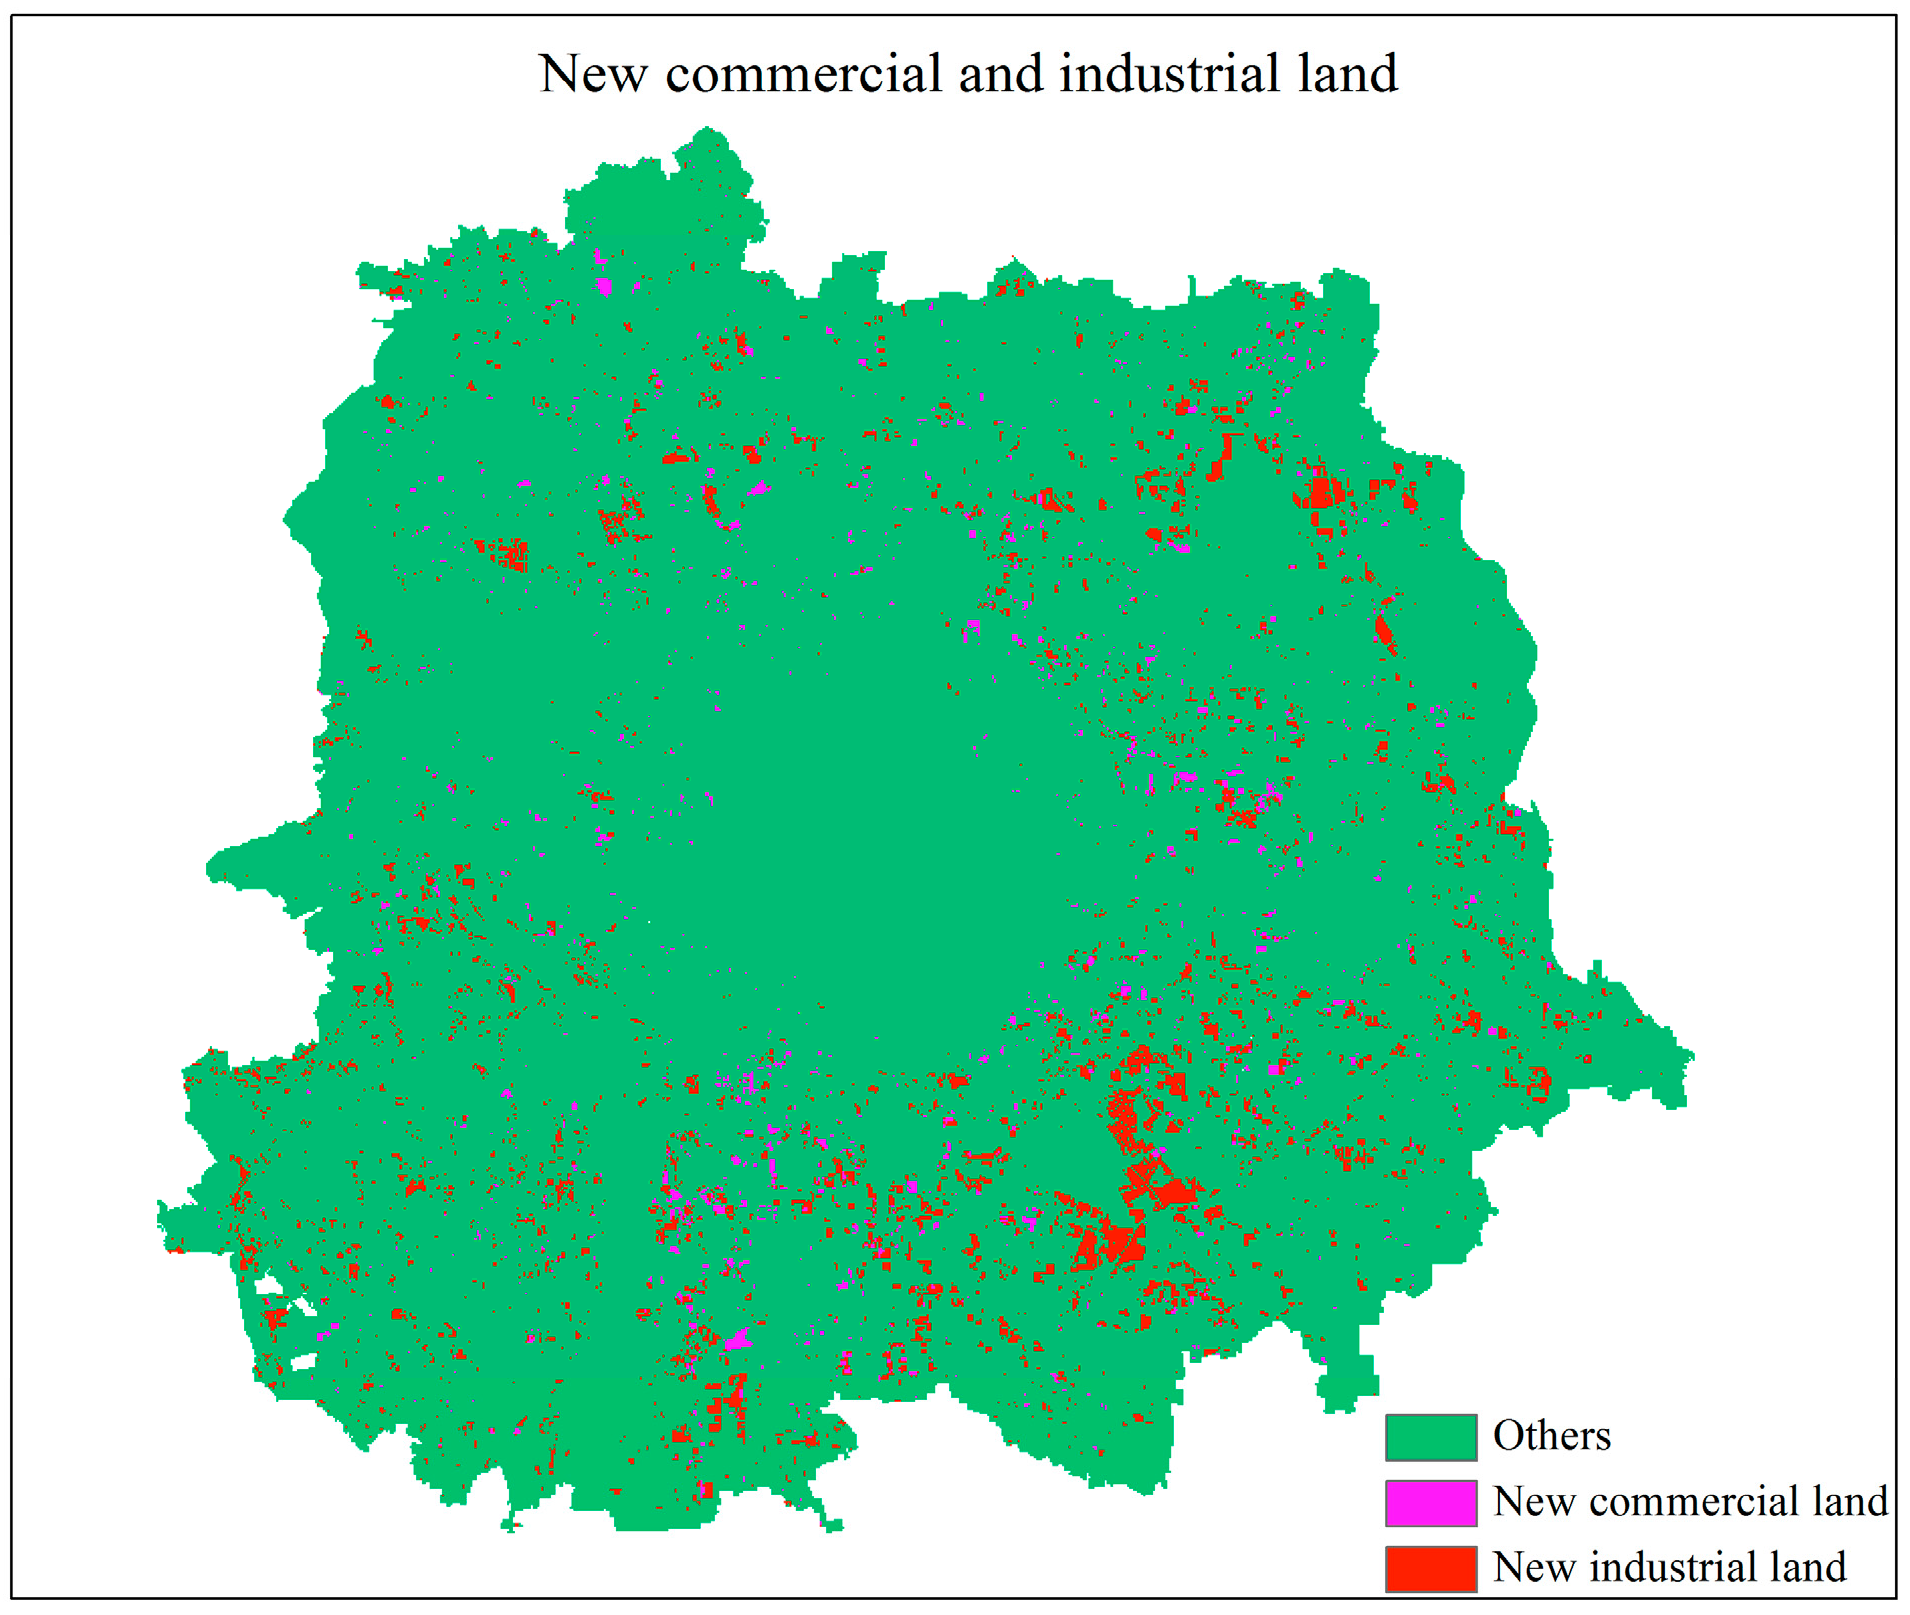
- Over the period of 2000–2010, industrial land and commercial land in the study area grew on a large scale; by 28.50% and 8.76% of the total new construction land in the study area, respectively. New commercial land was mainly distributed around the core area and was present with a balanced distribution characteristic. New industrial land was concentrated in sub-districts.
- (2)
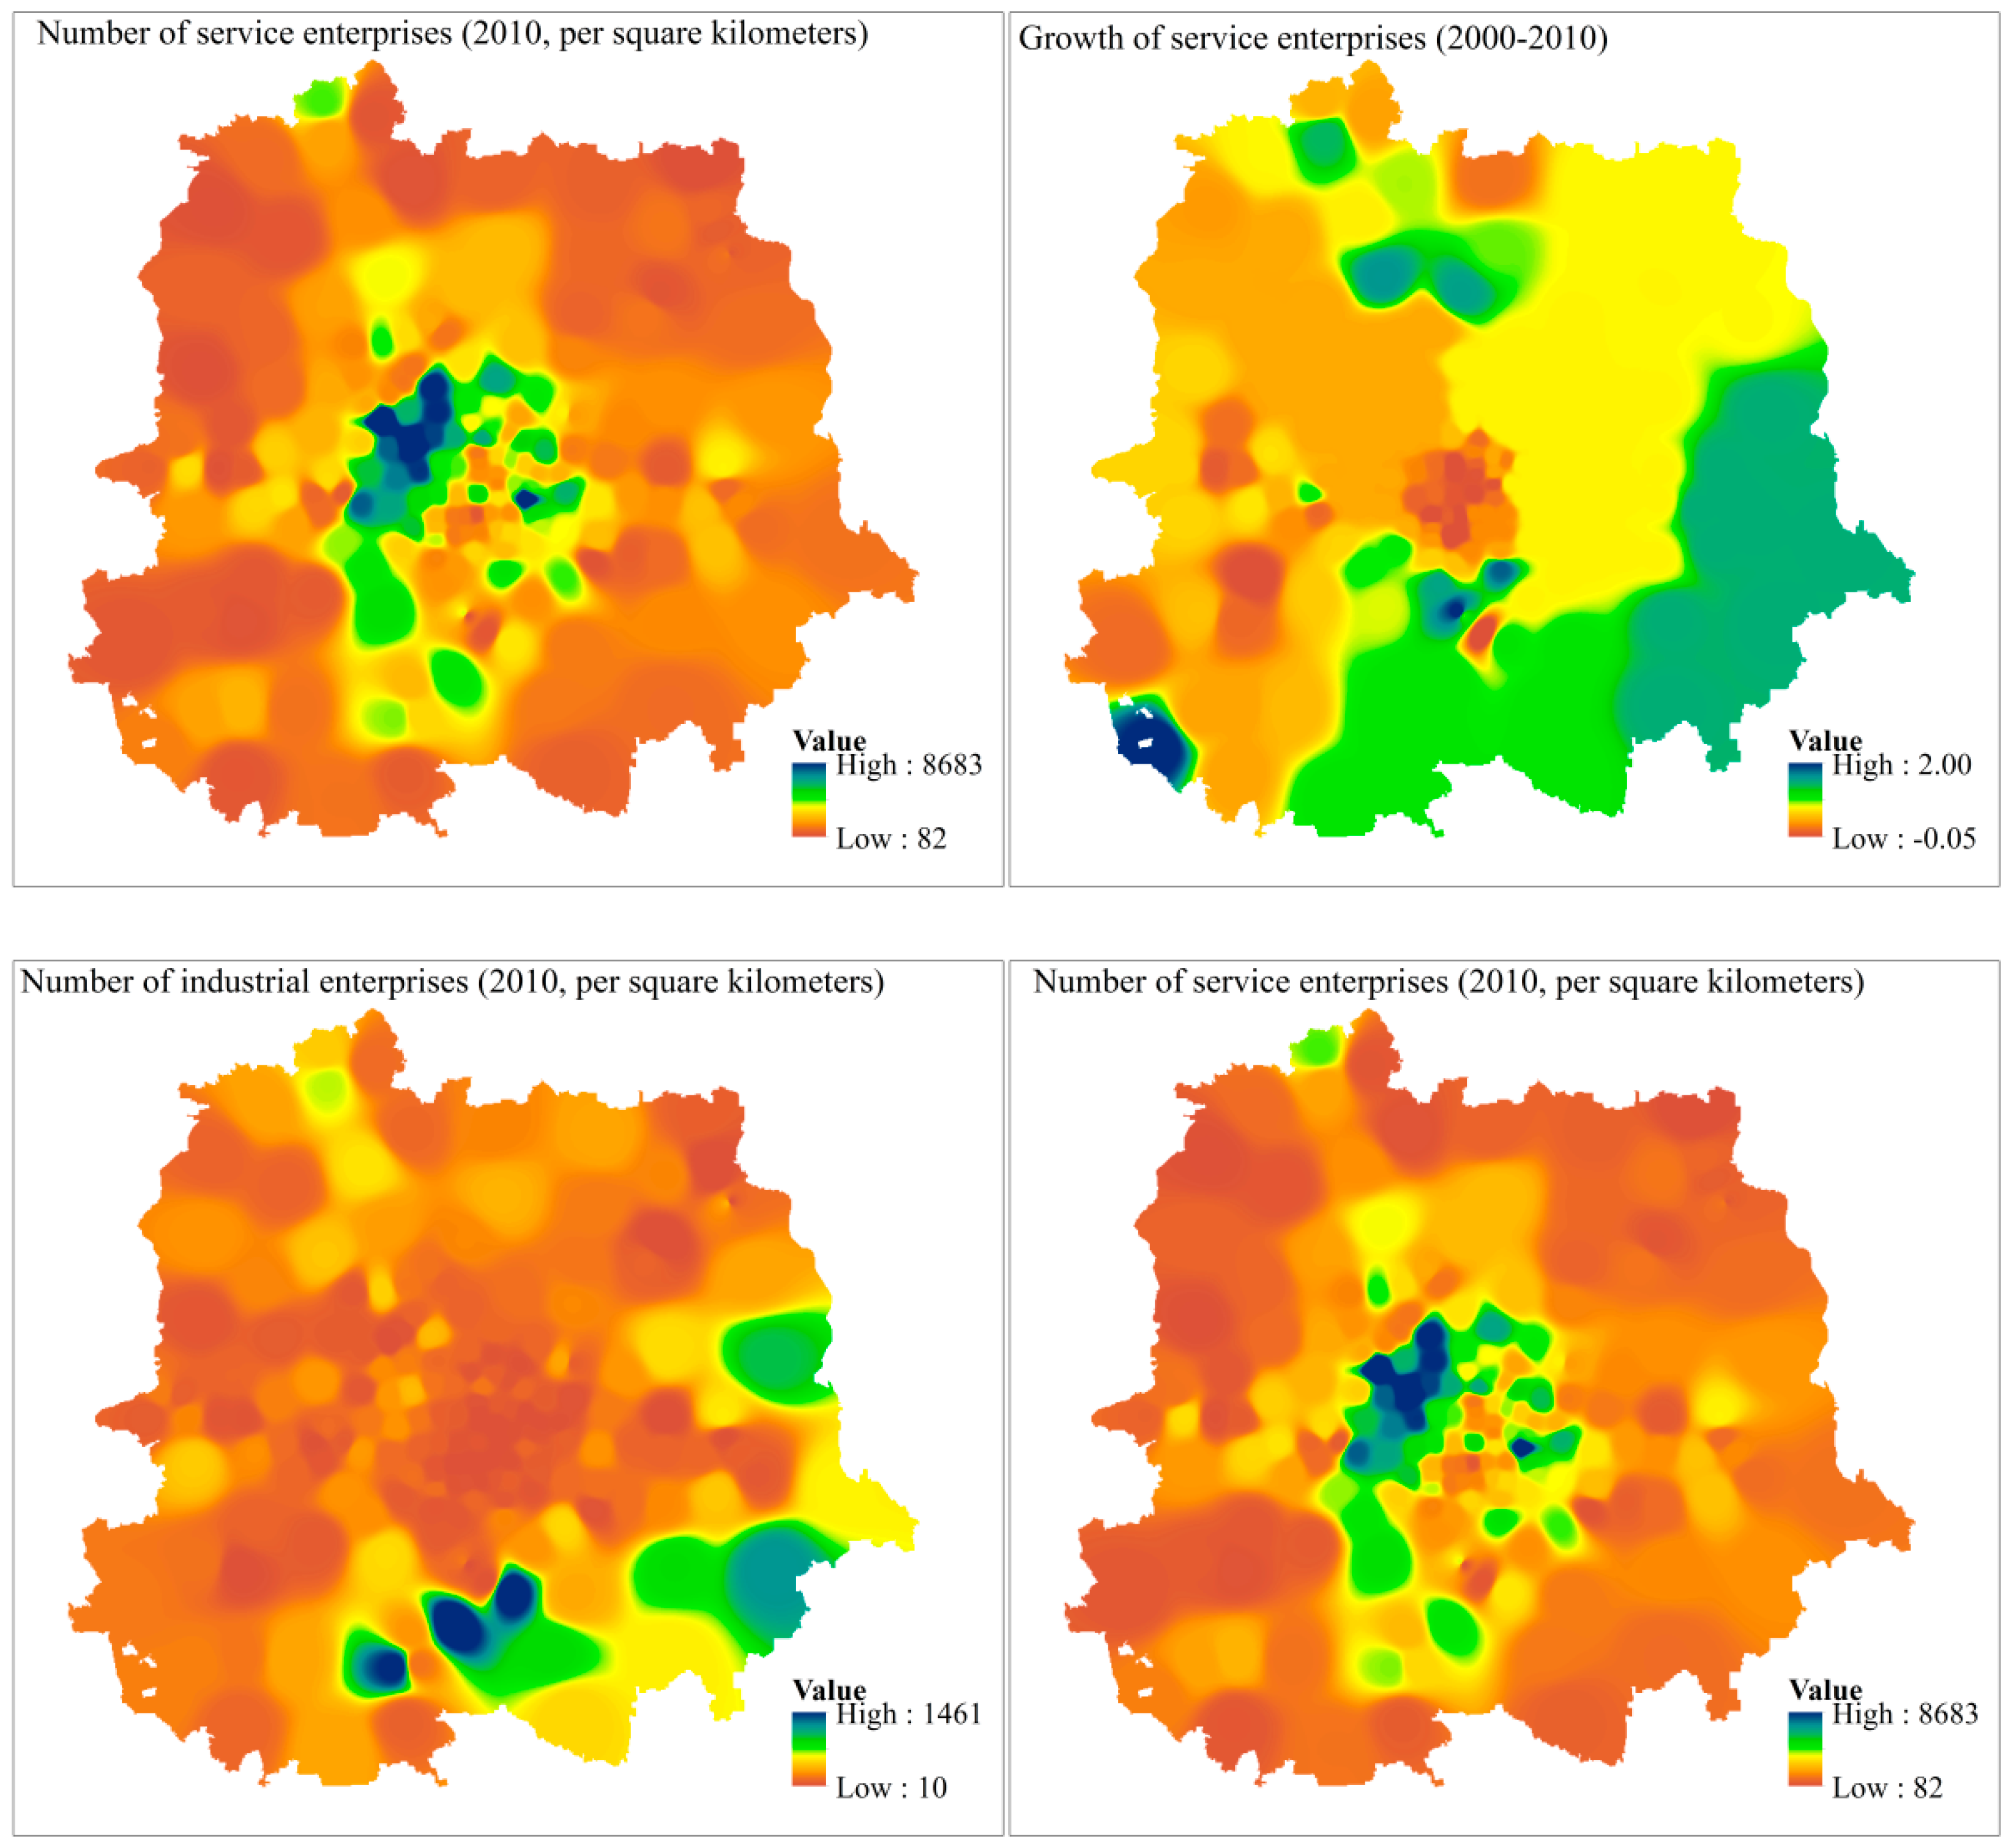
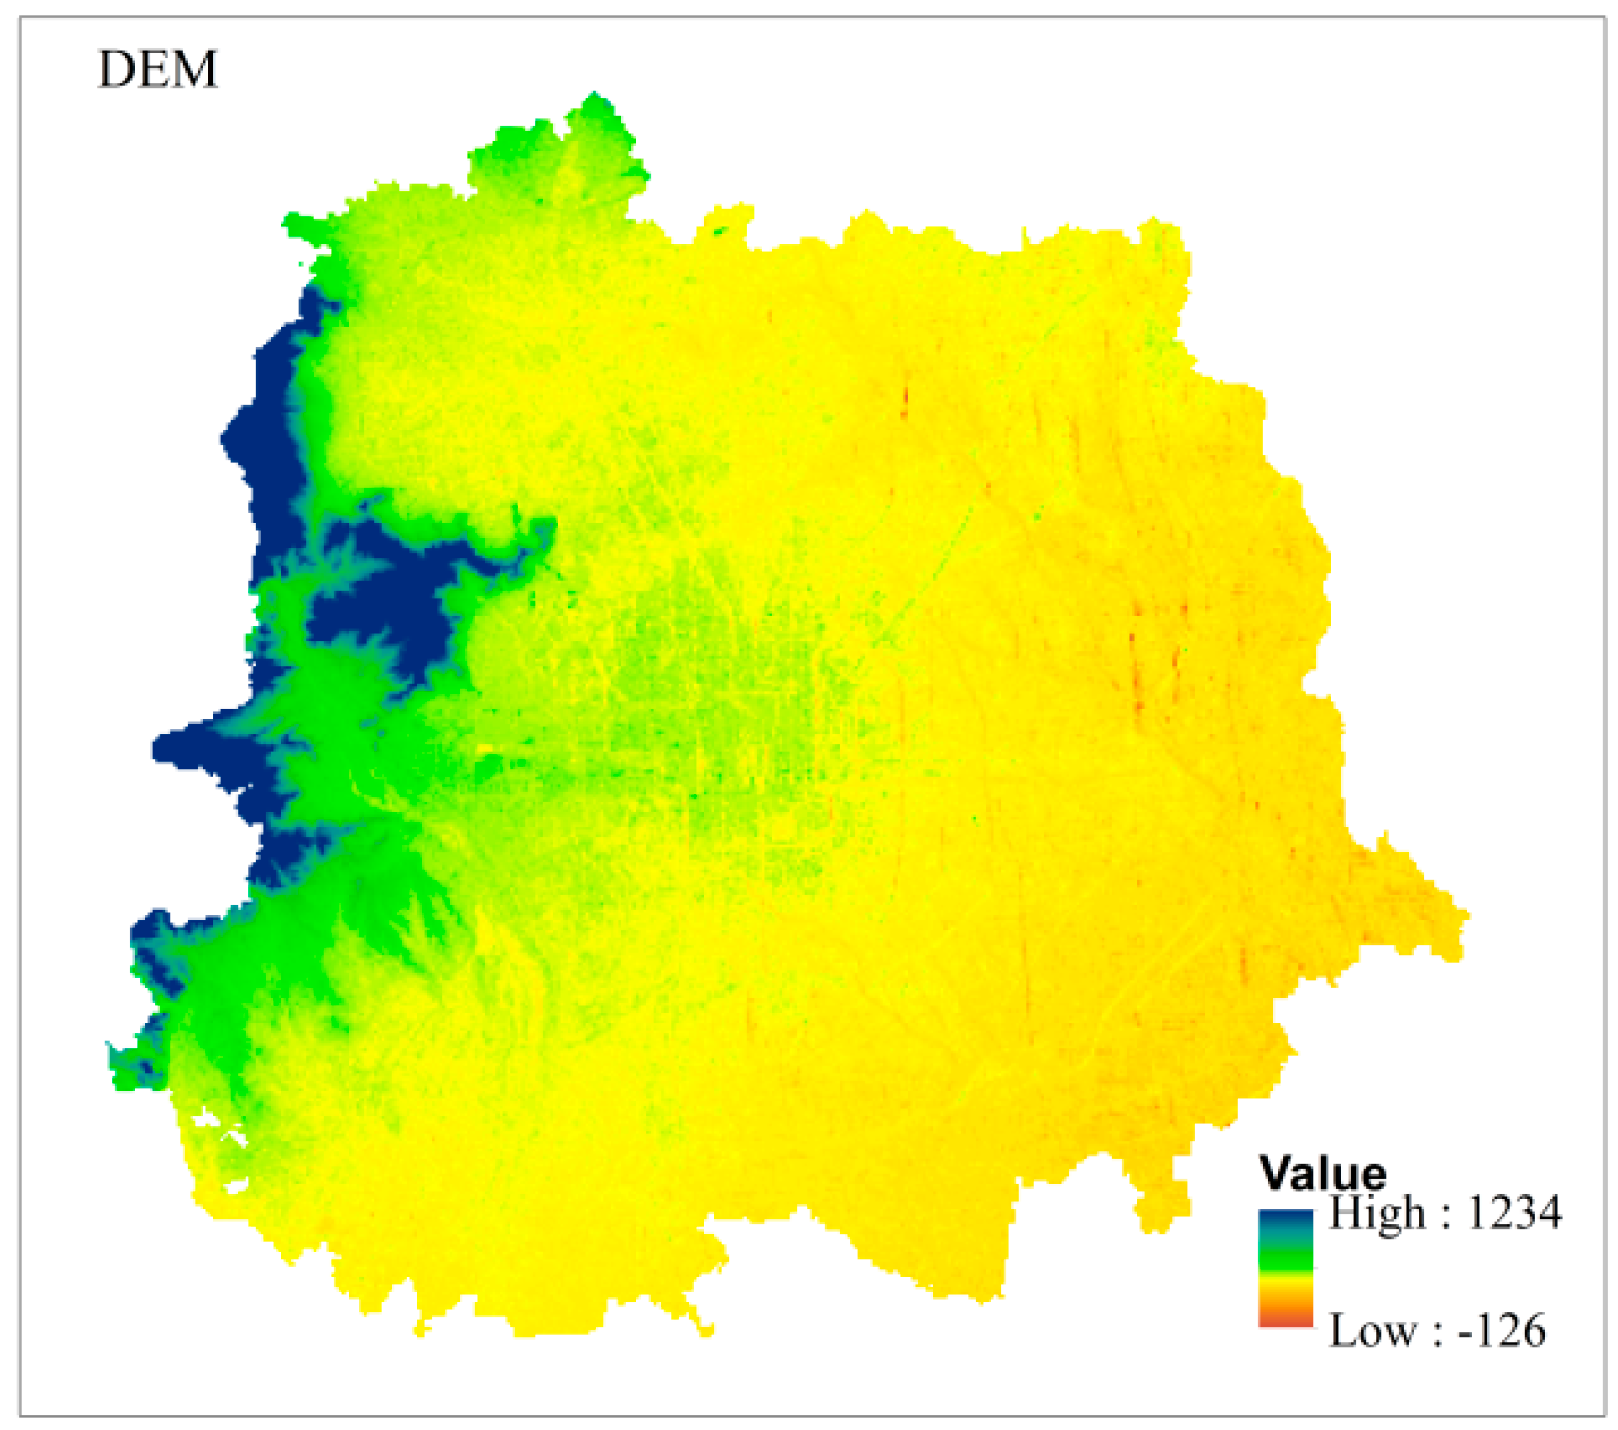
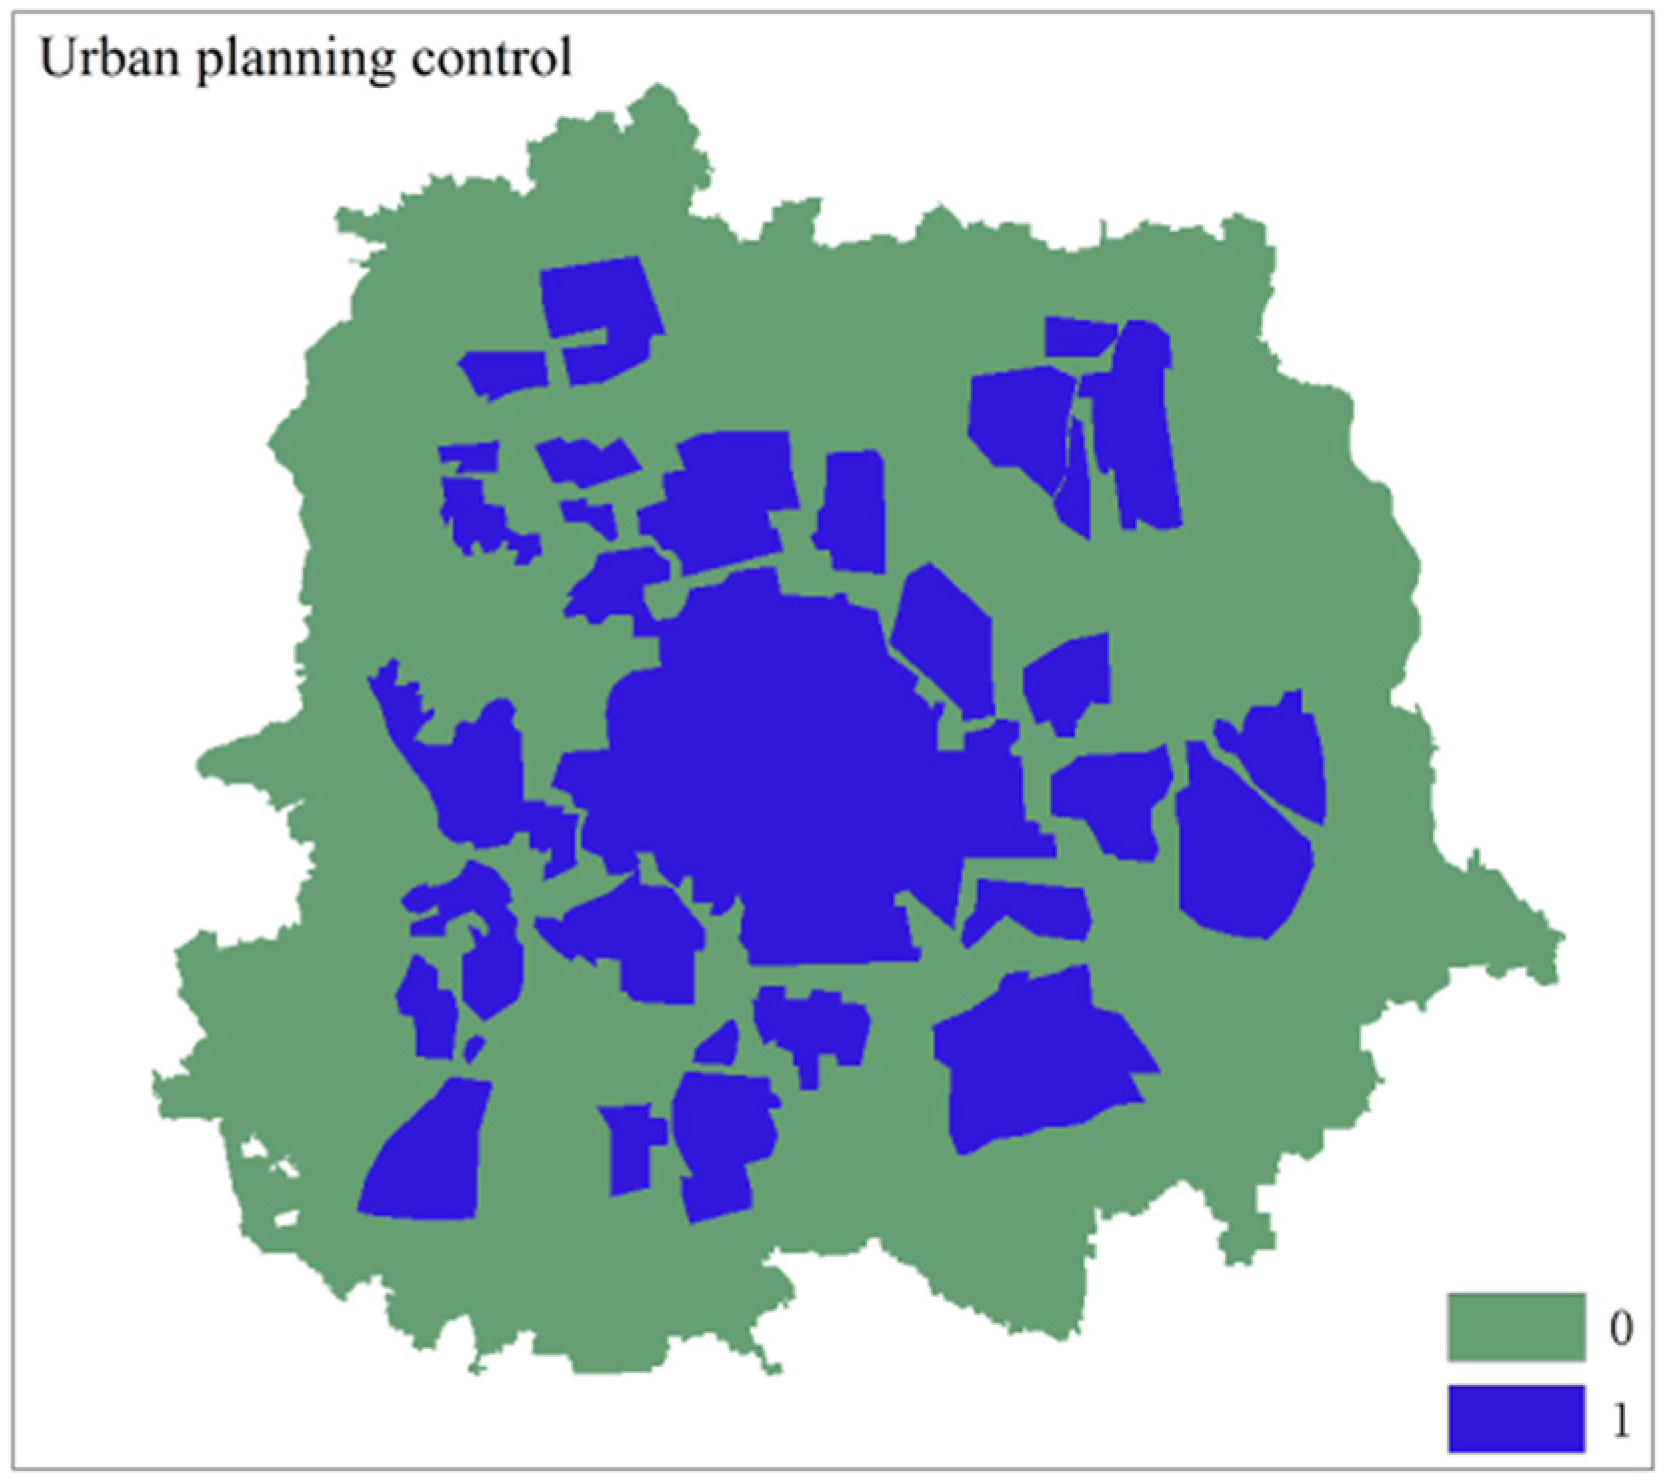
- The number of enterprises engaged in services (NEES) in 2010 in the locale, agriculture and construction land uses in the neighborhood in 2000 and planning orders significantly contributed to newly-added industrial land during 2000–2010. Among these factors, NEES exerted the largest effect on the occurrence of industrial land. Factors hampering land transfer to industrial uses included DEM, accessibility, population density in 2010, the presence of water or forest and the growth of industrial enterprises.
- (3)
- Factors contributing to land transfer for services/commercial use included the NEES with very high odds ratios, construction in the neighborhood and accessibility improvement. However, the current permanent resident population has no significant influence on the increase of commercial land. The number of industrial enterprises and their growth were factors that counteracted the growth of commercial land. New commercial land expanded mostly in peri-urban areas, and accessibility in 2010 was negatively associated.
- (4)
- Urban land use change is driven by social and economic development. During 2000–2010, the city experienced fast growth, as a large amount of industrial land turned into commercial land, in turn creating some new commercial growth. The number of service enterprises correlated positively with both industrial and commercial land increases, which indicated that service enterprises had a strong attraction to all kinds of enterprises. Increases in industrial land occurred in areas with low population density; while commercial land showed the opposite form of development. Moreover, the phenomenon of the separation of workplace and residence was more obvious in industrial areas.
- (5)
- Environment is a major factor in urban land use change. Improved accessibility can significantly contribute to the development of commercial land, but not to industrial land. Construction in the neighborhood exerts a similar effect of attracting industrial and commercial land development. Agriculture in the neighborhood is positively linked to the industrial land growth, but not to that of commercial land. Restrictive factors, including the presence of forest and bodies of water, play a role in prohibiting industrial land development, but are not significant for commercial land.
- (6)
- Regarding the nature factor, landform is the most significant restraining factor for these two types of land developments because of development costs and building restrictions. With regard to institutional factors, urban planning is one of the most important factors influencing land development. However, the model indicates that planning orders are only significant for industrial land development, owing to an industrial parks-dominated policy in Beijing. Conversely, it is not significant for commercial land uses.
Supplementary Materials
Acknowledgments
Author Contributions
Conflicts of Interest
References
- Fohrer, N.; Haverkamp, S.; Frede, H.G. Assessment of the effects of land use patterns on hydrologic landscape functions: Development of sustainable land use concepts for low mountain range areas. Hydrol. Process. 2005, 19, 659–672. [Google Scholar] [CrossRef]
- Ma, L.J.C. Urban transformation in China, 1949–2000: A review and research agenda. Environ. Plan. A 2002, 34, 1545–1569. [Google Scholar] [CrossRef]
- Ding, C. Land policy reform in China: Assessment and prospects. Land Use Policy 2003, 20, 109–120. [Google Scholar] [CrossRef]
- Deng, F.F.; Huang, Y. Uneven land reform and urban sprawl in China: The case of Beijing. Prog. Plan. 2004, 61, 211–236. [Google Scholar] [CrossRef]
- Lin, G.C.S.; Ho, S.P.S. The State, Land System, and Land Development Processes in Contemporary China. Ann. Assoc. Am. Geogr. 2005, 95, 411–436. [Google Scholar] [CrossRef]
- Clarke, K.C.; Hoppen, S.; Gaydos, L. A self-modifying cellular automaton model of historical urbanization in the San Francisco Bay area. Environ. Plan. B 1997, 24, 247–261. [Google Scholar] [CrossRef]
- Landis, J.; Zhang, M. The Second Generation of the California Urban Futures Model. Part 1: Model Logic and Theory. Environ. Plan. B Plan. Des. 1998, 25, 657–666. [Google Scholar] [CrossRef]
- Arai, T.; Akiyama, T. Empirical analysis for estimating land use transition potential functions-case in the Tokyo metropolitan region. Comput. Environ. Urban. Syst. 2004, 28, 65–84. [Google Scholar] [CrossRef]
- Cheng, J.; Masser, I. Urban growth pattern modeling: A case study of Wuhan city, PR China. Landsc. Urban Plan. 2003, 62, 199–217. [Google Scholar] [CrossRef]
- Liu, H.; Zhou, Q. Developing urban growth predictions from spatial indicators based on multi-temporal images. Comput. Environ. Urban Syst. 2005, 29, 580–594. [Google Scholar] [CrossRef]
- Deng, X.; Huang, J.; Rozelle, S.; Uchida, E. Economic Growth and the Expansion of Urban Land in China. Urban Stud. 2010, 47, 813–843. (In Chinese) [Google Scholar] [CrossRef]
- Zhang, S. Land-centered urban politics in transitional China-Can they be explained by Growth Machine Theory? Cities 2014, 41, 179–186. [Google Scholar] [CrossRef]
- Jiang, L.; Deng, X.; Seto, K.C. Multi-level modeling of urban expansion and cultivated land conversion for urban hotspot counties in China. Landsc. Urban Plan. 2012, 108, 131–139. [Google Scholar] [CrossRef]
- Verburg, P.H.; Eck, J.R.R.V.; Nijs, T.C.M.D.; Dijst, M.J.; Schot, P. Determinants of land-use change patterns in the netherlands. Environ. Plan. B Plan. Des. 2004, 31, 125–150. [Google Scholar] [CrossRef]
- Dupuy, G.; Stransky, V. Cities and highway networks in Europe. J. Transp. Geogr. 1996, 4, 107–121. [Google Scholar] [CrossRef]
- Linneker, B.; Spence, N. Road transport infrastructure and regional economic development: The regional development effects of the M25 London orbital motorway. J. Transp. Geogr. 1996, 4, 77–92. [Google Scholar] [CrossRef]
- Bowen, J. Airline hubs in Southeast Asia: National economic development and nodal accessibility. J. Transp. Geogr. 2000, 8, 25–41. [Google Scholar] [CrossRef]
- Jin, C.; Lu, Y.Q.; Zhang, L.; Xu, J. An analysis of accessibility of scenic spots based on land traffic network: A case study of Nanjing. Geogr. Res. 2009, 28, 246–258. (In Chinese) [Google Scholar]
- Deng, Y.; Cai, J.M.; Yang, Z.S.; Wang, H. Measuring Time Accessibility with Its Spatial Characteristicsin Urban Areas of Beijing. Acta Geogr. Sin. 2012, 2, 169–178. [Google Scholar]
- Cheng, J.; Bertolin, L. Measuring urban job accessibility with distance decay, competition and diversity. J. Transp. Geogr. 2013, 30, 100–109. [Google Scholar] [CrossRef]
- Beijing Statistic Bureau. The 6th Beijing Census Report; Beijing Statistic Bureau: Beijing, China, 2015.
- Agarwal, C.; Green, G.M.; Grove, J.M.; Evans, T.P.; Schweik, C.M. A Review and Assessment of Land-Use Change Models. Gen. Tech. Rep. 2002, 297, 1–35. [Google Scholar]
- Allen, J.; Lu, K. Modeling and Prediction of Future Urban Growth in the Charleston Region of South Carolina: A GIS-based Integrated Approach. Ecol. Soc. 2003, 8, 1850–1851. [Google Scholar] [CrossRef]
- Yang, Z.S.; Cai, J.M.; Ottens, H.F.L.; Sliuzas, R. Beijing. Cities 2013, 31, 491–506. [Google Scholar] [CrossRef]
- Yang, Z.; Liang, J.; Cai, J. Urban economic cluster template and its dynamics of Beijing, China. Chin. Geogr. Sci. 2014, 24, 740–750. [Google Scholar] [CrossRef]
- Yang, Z.; Hao, P.; Cai, J. Economic clusters: A bridge between economic and spatial policies in the case of Beijing. Cities 2015, 42, 171–185. [Google Scholar] [CrossRef]
- Næss, P. Built environment, causality and urban planning. Plan. Theory Pract. 2016, 17, 52–71. [Google Scholar] [CrossRef]
- Kevin, R.; Alexander, B. The Smart Location Database: A Nationwide Data Resource Characterizing the Built Environment and Destination Accessibility at the Neighborhood Scale. Cityscape 2014, 16, 145. [Google Scholar]
- Cabrera-Barona, P.; Wei, C.; Hagenlocher, M. Multiscale evaluation of an urban deprivation index: Implications for quality of life and healthcare accessibility planning. Appl. Geogr. 2016, 70, 1–10. [Google Scholar] [CrossRef]
- Irwin, E.G.; Geoghegan, J. Theory, data, methods: Developing spatially explicit economic models of land use change. Agric. Ecosyst. Environ. 2001, 85, 7–24. [Google Scholar] [CrossRef]
- Yang, Z.; Song, T.; Chahine, T. Spatial representations and policy implications of industrial co-agglomerations, a case study of Beijing. Habitat Int. 2016, 55, 32–45. [Google Scholar] [CrossRef]
- Munroe, D.K.; Croissant, C.; York, A.M. Land use policy and landscape fragmentation in an urbanizing region: Assessing the impact of zoning. Appl. Geogr. 2005, 25, 121–141. [Google Scholar] [CrossRef]
- Clark, S.D.; Page, M.W. Cycling and Urban Traffic Management and Control Systems. Transp. Res. Rec. 2000, 1705, 77–84. [Google Scholar] [CrossRef]
- Braimoh, A.K.; Onishi, T. Spatial determinants of urban land use change in Lagos, Nigeria. Land Use Policy 2007, 24, 502–515. [Google Scholar] [CrossRef]
- White, R.; Engelen, G. Cellular automata as the basis of integrated dynamic regional modelling. Environ. Plan. B Plan. Des. 1997, 24, 235–246. [Google Scholar] [CrossRef]
- Dietzel, C.; Clarke, K. The effect of disaggregating land use categories in cellular automata during model calibration and forecasting. Comput. Environ. Urban. Syst. 2006, 30, 78–101. [Google Scholar] [CrossRef]
- Liu, Y.; Liu, Y.S.; Guo, L.Y.; Lu, S.S. Spatial-temporal Patterns of Land-use Change in Typical Transect Area Along China National Highway 106 During 1996–2008. J. Northeast Agric. Univ. 2011, 18, 39–46. [Google Scholar] [CrossRef]
- Jiang, X.F. Statistics of traffic flow of the main road in Beijing. Traffic Secur. 2005, 5, 47–48. (In Chinese) [Google Scholar]
- Transport Operation Analysis of Beijing in 2007. Available online: http://www.docin.com/p-717891659.html (accessed on 29 October 2013).
- The Beijing City Master Plan (2004–2020). Available online: http://www.cityup.org/case/general/20070907/32261.shtml (accessed on 8 September 2007).
- Anselin, L. A test for spatial autocorrelation in seemingly unrelated regressions. Econ. Lett. 1988, 28, 335–341. [Google Scholar] [CrossRef]
- Stehman, S.V.; Czaplewski, R.L. Design and Analysis for Thematic Map Accuracy Assessment: Fundamental Principles. Remote Sens. Environ. 1998, 64, 331–344. [Google Scholar] [CrossRef]
- Weber, K.E.; Tiwari, I.P. Research and Survey Format Design: An Introduction; Asian Institute of Technology: Bangkok, Thailand, 1992. [Google Scholar]
- Pereira, J.M.C.; Itami, R.M. GIS-based habitat modeling using logistic multiple regression—A study of the Mt. Graham red squirrel. Photogramm. Eng. Remote. Sens. 1991, 57, 1475–1486. [Google Scholar]
- Spephen, F. The Analysis of Crosscl Assfied Categorical Data, 2nd ed.; MIT Press: Cambridge, MA, USA, 1985. [Google Scholar]
- Gilruth, P.T.; Hutchinson, C.F. Assessing deforestation in the Guinea Highlands of West Africa using remote sensing. Photogramm. Eng. Remote. Sens. 1990, 56, 1375–1382. [Google Scholar]
- Deng, Y. Optimization of Urban Spatial Organization from the Perspective of Comprehensive Transportation Accessibility—A Case Study of Beijing. Ph.D. Thesis, University of Chinese Academy of Sciences, Beijing, China, 2013. [Google Scholar]
- Meng, B. The Spatial Organization of the Separation between Jobs and Residential Locations in Beijing. Acta Geogr. Sin. 2009, 64, 1457–1466. (In Chinese) [Google Scholar]
- Yang, Z.S.; Xiong, Z.H. Study on development rule of land use along transit in Beijng. Mod. Urban Transit 2015, 57, 61–64. (In Chinese) [Google Scholar]


| Name of Variable | Type | Unit | Max a | Min b | Mean | SD c |
|---|---|---|---|---|---|---|
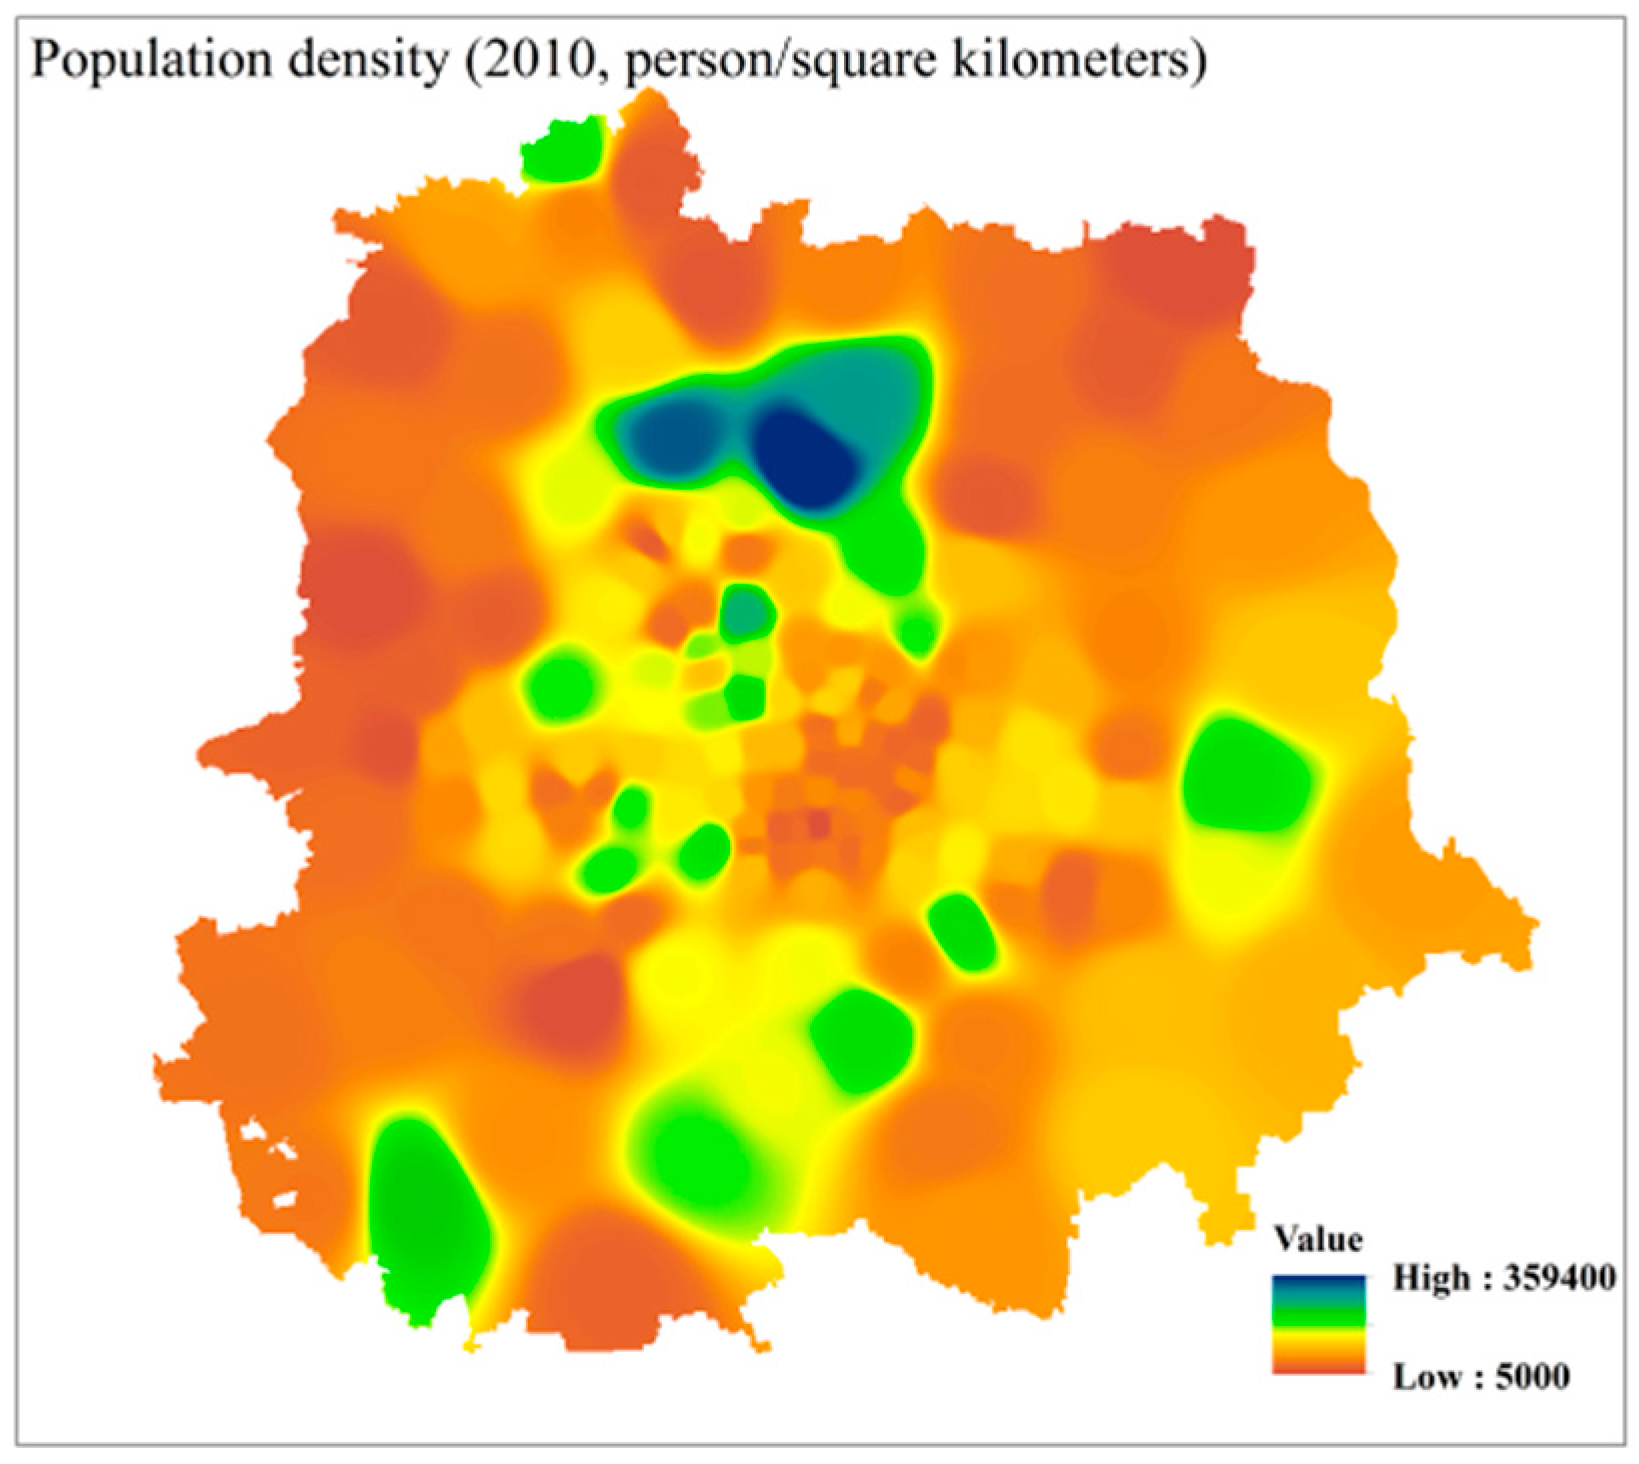
| Population density (2010) | Continuous | Person/sq. km | 359,400 | 5000 | 89,122 | 57,023 |
| Number of service enterprises (2010) | Continuous | Per sq. km | 8683 | 82 | 861 | 766 |
| Growth of service enterprises (2000–2010) | Continuous | Per sq. km | 2.01 | −0.05 | 0.83 | 0.34 |
| Number of industrial enterprises (2010) | Continuous | Per sq. km | 1461 | 10 | 304 | 240 |
| Growth of industrial enterprises (2000–2010) | Continuous | Per sq. km | 0.91 | −0.6 | 0.18 | 0.21 |
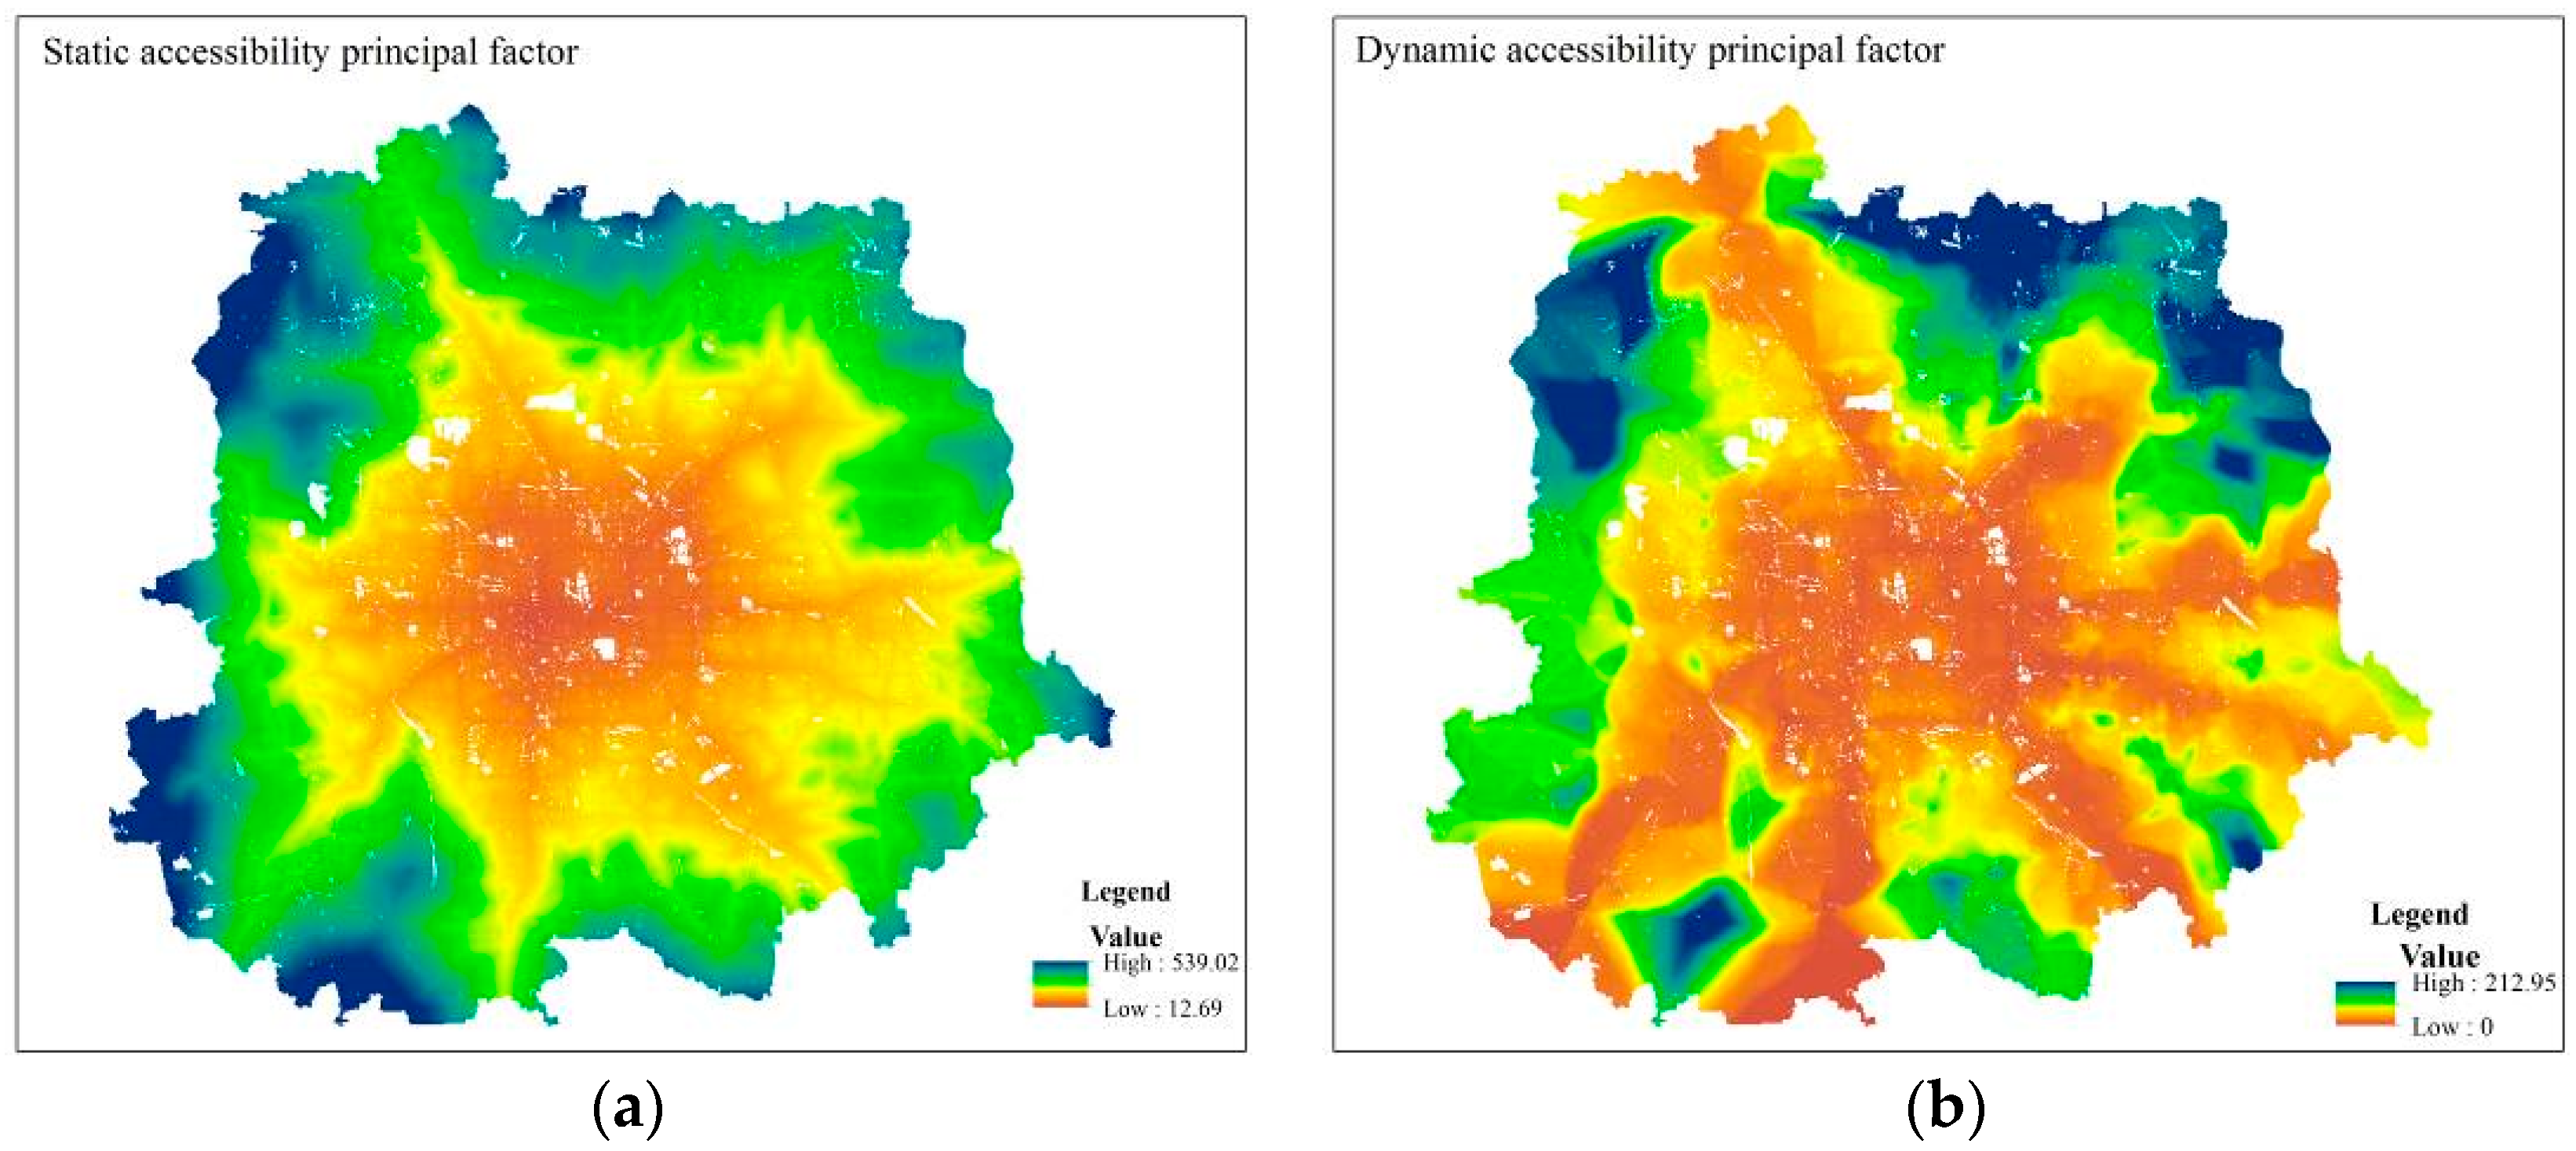
| Static accessibility principal factor | Continuous | Minutes | 539 | 13 | 197 | 94 |
| Dynamic accessibility principal factor | Continuous | Minutes | 213 | 0 | 46 | 36 |
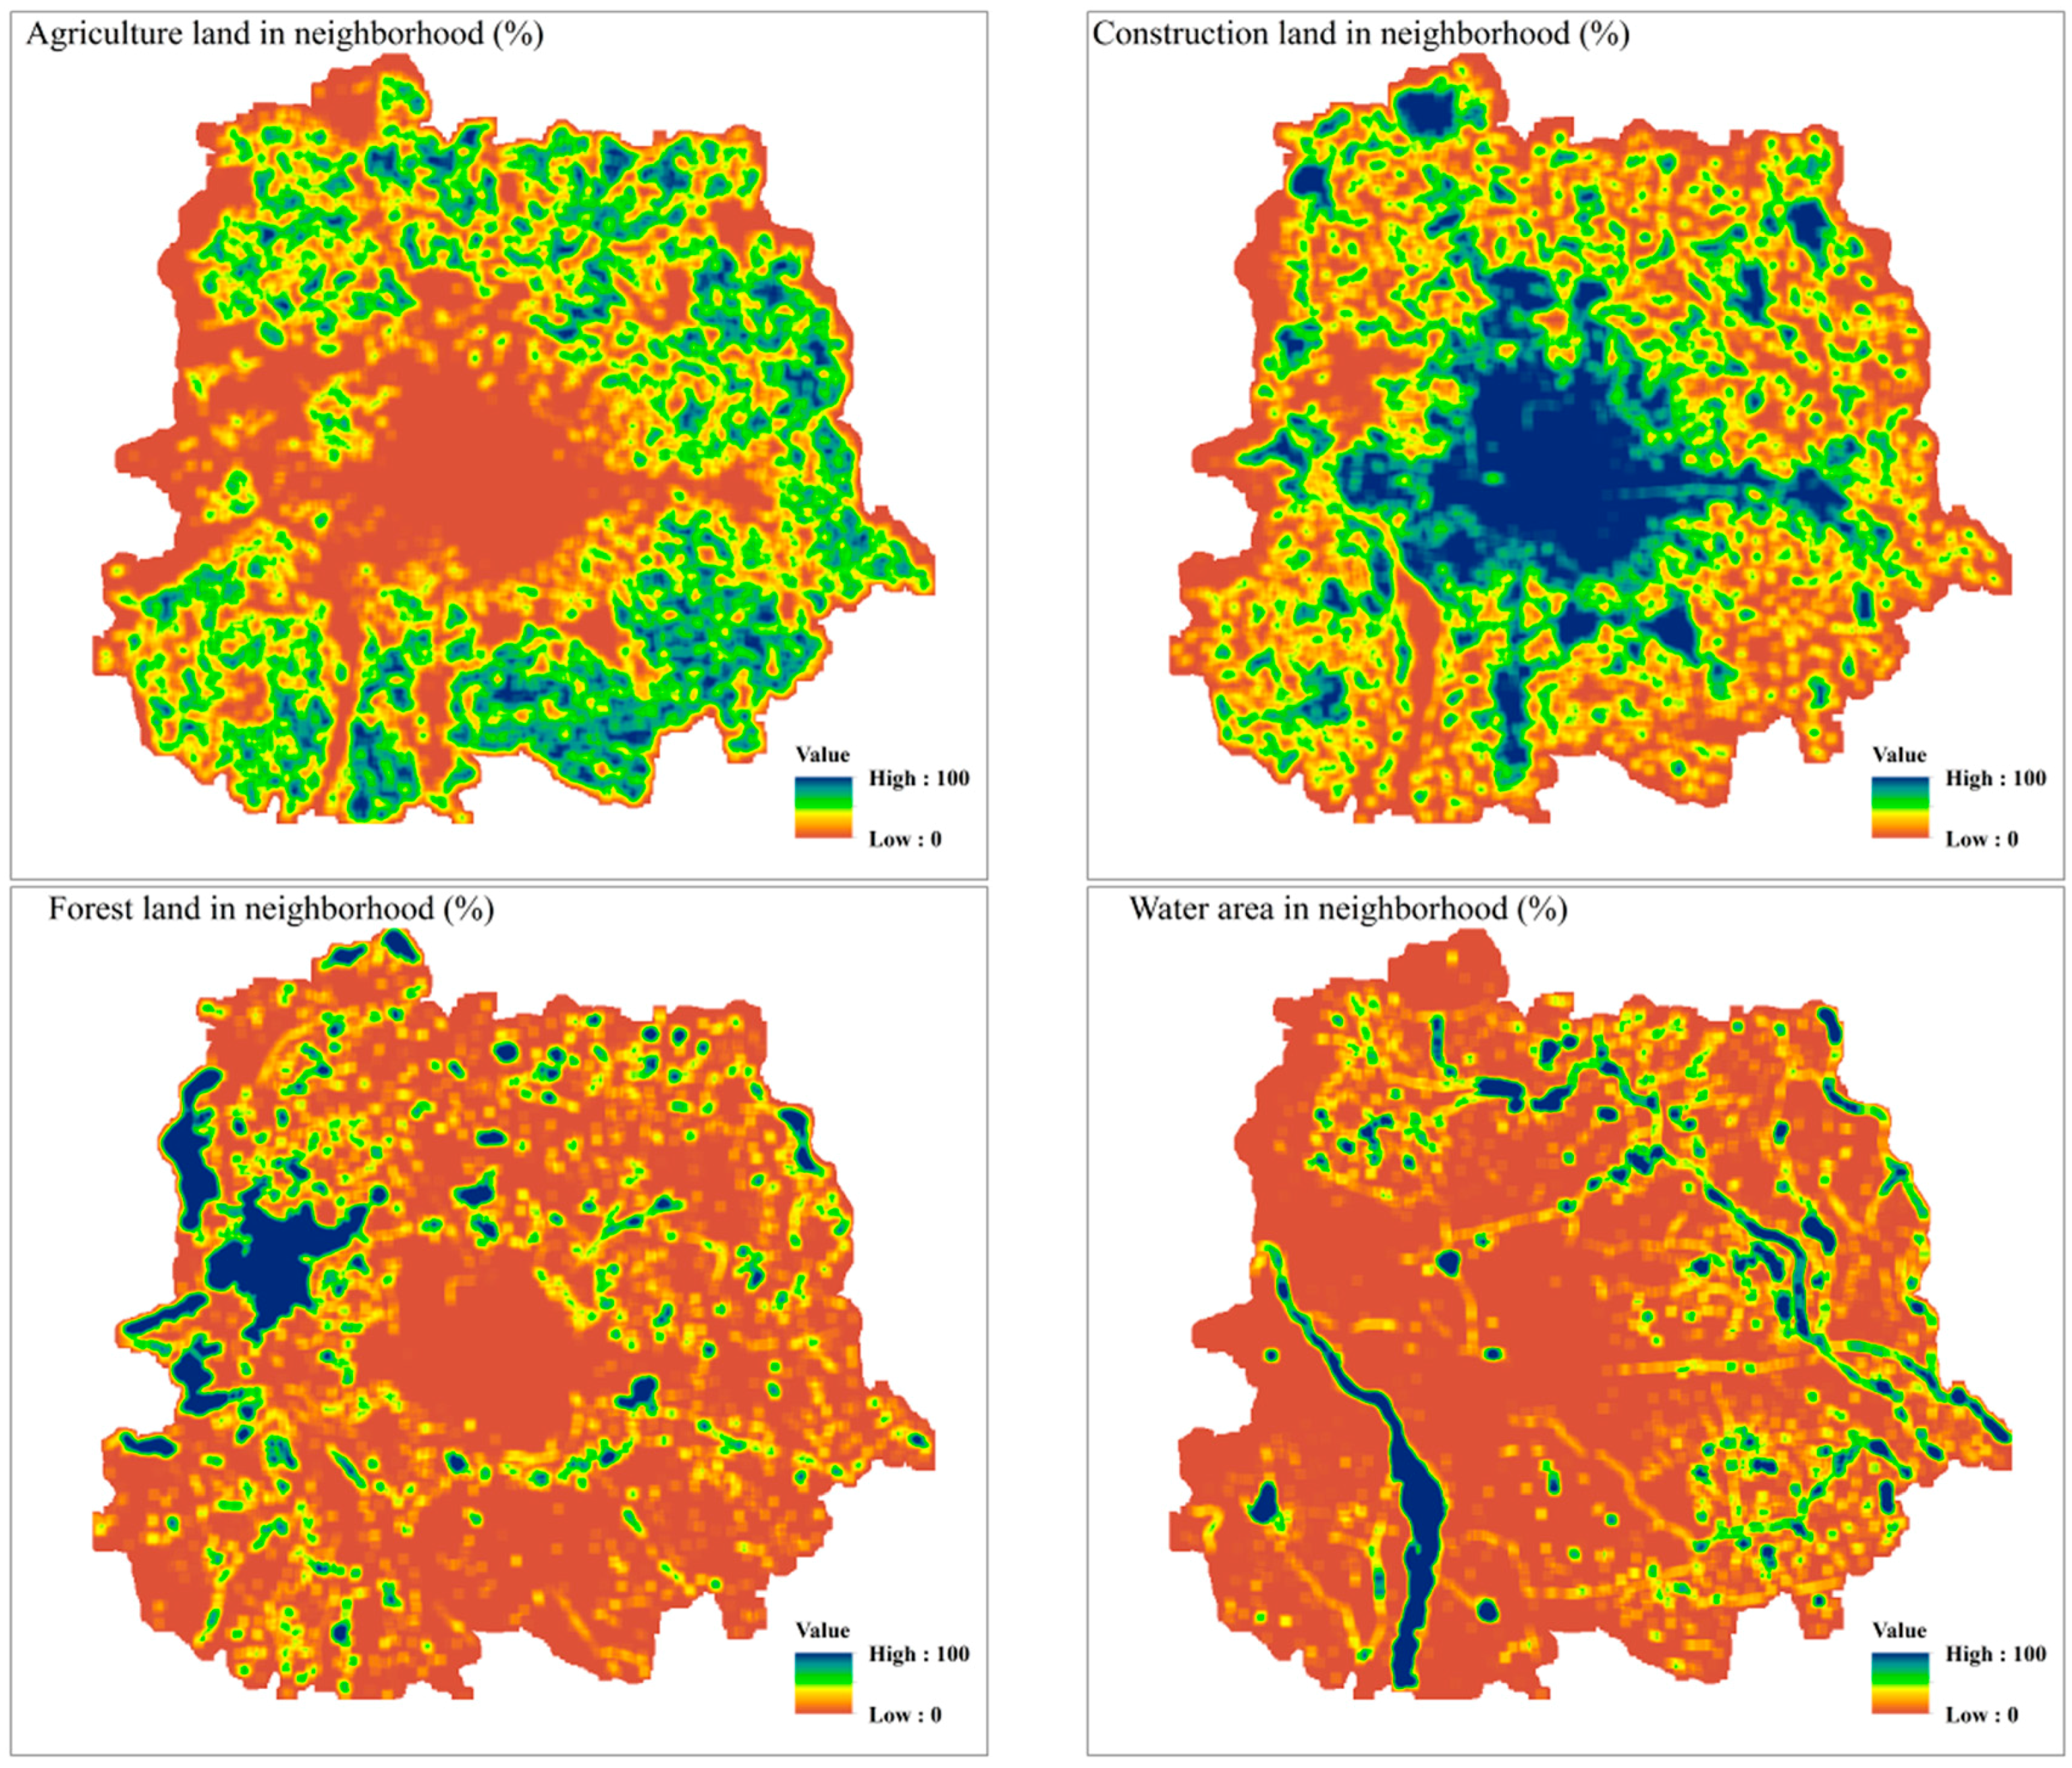
| Construction land in neighborhood | Continuous | % | 100 | 0 | 41.61 | 32.36 |
| Forest land in neighborhood | Continuous | % | 100 | 0 | 10.94 | 18.45 |
| Agriculture land in neighborhood | Continuous | % | 100 | 0 | 32.78 | 27.96 |
| Water area in neighborhood | Continuous | % | 100 | 0 | 6.23 | 12.68 |
| Urban planning control | Binary | -- | 1 | 0 | ||
| DEM | Continuous | Meter | 1234 | −126 | 62 | 100 |
| Percentage Correct | Hosmer–Lemeshow | −2 Log Likelihood | Cox and Snell R Square | Nagelkerke R Square | |
|---|---|---|---|---|---|
| Commercial land | 70.30% | 0.286 | 2260.423 | 0.202 | 0.269 |
| Industrial land | 65.60% | 0.216 | 12,263.909 | 0.141 | 0.189 |
| Variables | Commercial Land | Industrial Land | ||||||
|---|---|---|---|---|---|---|---|---|
| β | p-Value | Wald χ2 | Odds Ratio exp (β) | β | p-Value | Wald χ2 | Odds Ratio exp (β) | |
| Population density (2010) | 0.001 | 0.029 | 4.762 | 1.00 | −1.212 | 0 | 38.306 | 0.30 |
| Number of service enterprises (2010) | 7.55 | 0 | 72.169 | 1900.74 | 1.116 | 0 | 13.245 | 3.05 |
| Growth of service enterprises | -- | 0.293 | -- | -- | -- | 0.699 | -- | -- |
| Number of industrial enterprises (2010) | −0.98 | 0.006 | 7.545 | 0.38 | -- | 0.507 | -- | -- |
| Growth of industrial enterprises (2000–2010) | −1.234 | 0.002 | 9.938 | 0.29 | 0.037 | 4.369 | 1.69 | |
| Accessibility (2010) | −1.925 | 0 | 17.322 | 0.15 | −2.134 | 0 | 108.594 | 0.12 |
| Change of accessibility (2000–2010) | 0.664 | 0.088 | 2.914 | 1.94 | -- | 0.341 | -- | -- |
| Neighborhood construction land | 0.931 | 0 | 18.318 | 2.54 | 0.767 | 0.001 | 11.372 | 2.15 |
| Neighborhood agriculture land | -- | 0.383 | -- | -- | 0.408 | 0.067 | 3.364 | 1.50 |
| Neighborhood forest land | -- | 0.866 | -- | -- | −0.566 | 0.03 | 4.699 | 0.57 |
| Neighborhood waters | -- | 0.296 | -- | -- | −0.617 | 0.02 | 5.447 | 0.54 |
| Urban planning | -- | 0.129 | -- | -- | 0.437 | 0 | 55.541 | 1.55 |
| DEM | −11.928 | 0 | 31.799 | 0.00 | −12.106 | 0 | 117.787 | 0.00 |
| Likelihood: ratio statistic | 2260 | 12,263 | ||||||
| Number in sample | 1000 | 1000 | ||||||
© 2016 by the authors; licensee MDPI, Basel, Switzerland. This article is an open access article distributed under the terms and conditions of the Creative Commons Attribution (CC-BY) license (http://creativecommons.org/licenses/by/4.0/).
Share and Cite
Sun, C.; Sun, C.; Yang, Z.; Zhang, J.; Deng, Y. Urban Land Development for Industrial and Commercial Use: A Case Study of Beijing. Sustainability 2016, 8, 1323. https://doi.org/10.3390/su8121323
Sun C, Sun C, Yang Z, Zhang J, Deng Y. Urban Land Development for Industrial and Commercial Use: A Case Study of Beijing. Sustainability. 2016; 8(12):1323. https://doi.org/10.3390/su8121323
Chicago/Turabian StyleSun, Chuanzhun, Chao Sun, Zhenshan Yang, Jikang Zhang, and Yu Deng. 2016. "Urban Land Development for Industrial and Commercial Use: A Case Study of Beijing" Sustainability 8, no. 12: 1323. https://doi.org/10.3390/su8121323
APA StyleSun, C., Sun, C., Yang, Z., Zhang, J., & Deng, Y. (2016). Urban Land Development for Industrial and Commercial Use: A Case Study of Beijing. Sustainability, 8(12), 1323. https://doi.org/10.3390/su8121323