Abstract
Nowadays, Single Minute Exchange of Dies (SMED) has achieved great industrial popularity. However, it remains unclear to what extent and how SMED implementation at its different stages benefits industries. To address this gap, this research proposes a structural equation model to quantitatively measure SMED effects. The model has six hypotheses that link SMED stages and benefits. To statistically validate such hypotheses, a questionnaire was administered to 373 Mexican maquiladoras located in Ciudad Juárez, Chihuahua. Results show that before starting SMED implementation process, companies must be appropriately familiarized with their production process. Mainly, manufacturing companies in Ciudad Juárez need to focus their efforts on the SMED planning stage (Step 1) in order to identify important internal production activities and turn them into external activities. In fact, SMED planning stage has direct and indirect effects on subsequent stages and SMED benefits.
1. Introduction
Lean manufacturing (LM), also known as the Toyota Production system (TPS), is one of the most popular techniques for quality and productivity improvement in the automotive industry [1], although it has been also adopted by other industrial sectors, including aerospace, electronics, and services, among others [2]. TPS is the result of many efforts from Toyota to keep updated and compete with Western automobile companies after World War II. LM is a strategy to reduce costs, especially those related to production processes [3].
The principles of LM define the value of product or service with a customer focus. Moreover, LM seeks perfection through continuous improvement and eliminates waste by separating value added activities (VA) from non-value added activities (NVA) [4]. In this sense, LM focuses on different aspects of the production process in order to ensure the value flow.
LM is today conceived as a set of techniques, tools, and philosophies rather than as a strict discipline. According to the LM philosophy, one of the main production systems inhibitors is process inflexibility. Thus, in order to reduce delivery times and stock, and to quickly respond to changes in demand and reach just in time production, companies need to reduce this inflexibility in their production processes [5].
According to Chiarini [3], the most important LM tools to eliminate the different kinds of waste in production are value stream map (VSM), cellular manufacturing, total productive maintenance (TPM), and single minute exchange of dies (SMED). A great amount of literature has addressed the first four tools [6], while information on SMED is a bit scarce.
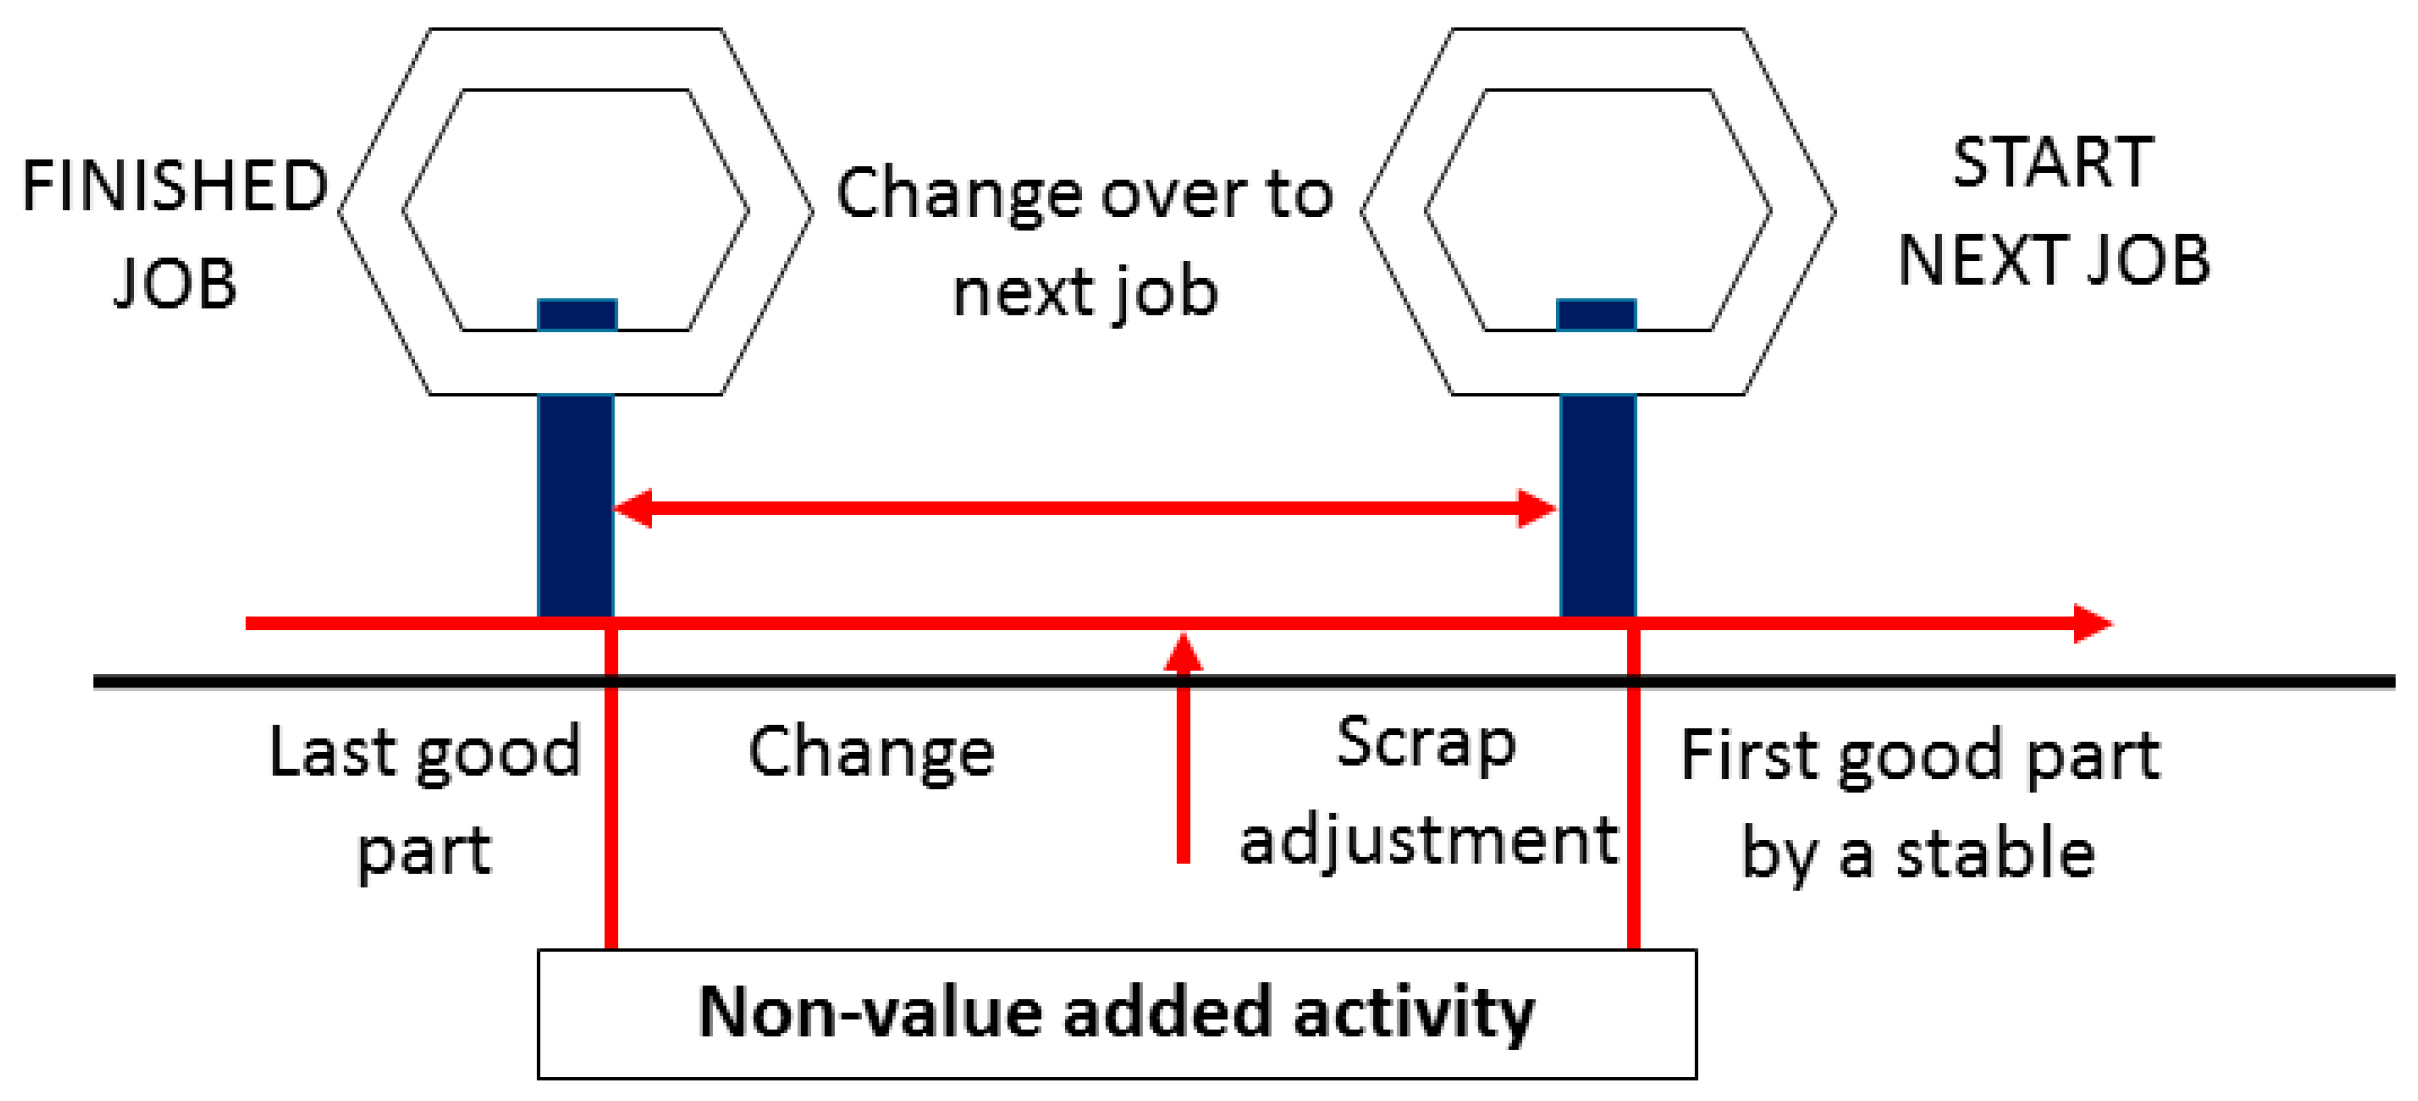
SMED is a tool developed by Shingo [7] as a proposal to reduce bottlenecks caused by stamping presses in Toyota. By the time SMED was developed, these machines were not working at full capacity and, thus, were not bringing the expected benefits. Nowadays, as Ulutas [8] points out, SMED is one of the many LM tools for waste reduction in production processes, since it offers a fast and efficient way to decrease changeover times. Changeover is the process of converting one line/machine from running one product to another and it is depicted in Figure 1.
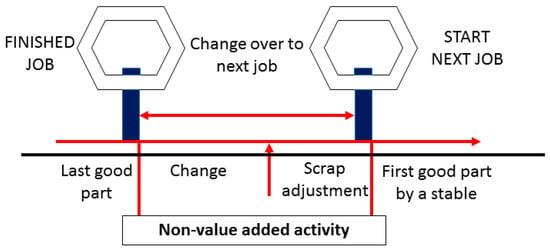
Figure 1.
Representation of changeover time [8].
Changeover time is defined as the time needed to set up a given production system to run a different product with all the requirements [9], and they are a typical example of waste, since changeover is a non-added value activity that incurs hidden costs [10]. Therefore, because machines remain inactive during changeover times, this process must be reduced as much as possible [9]. SMED is a practical LM tool that helps maximize the product value by reducing setup times [4].
1.1. Stages of SMED
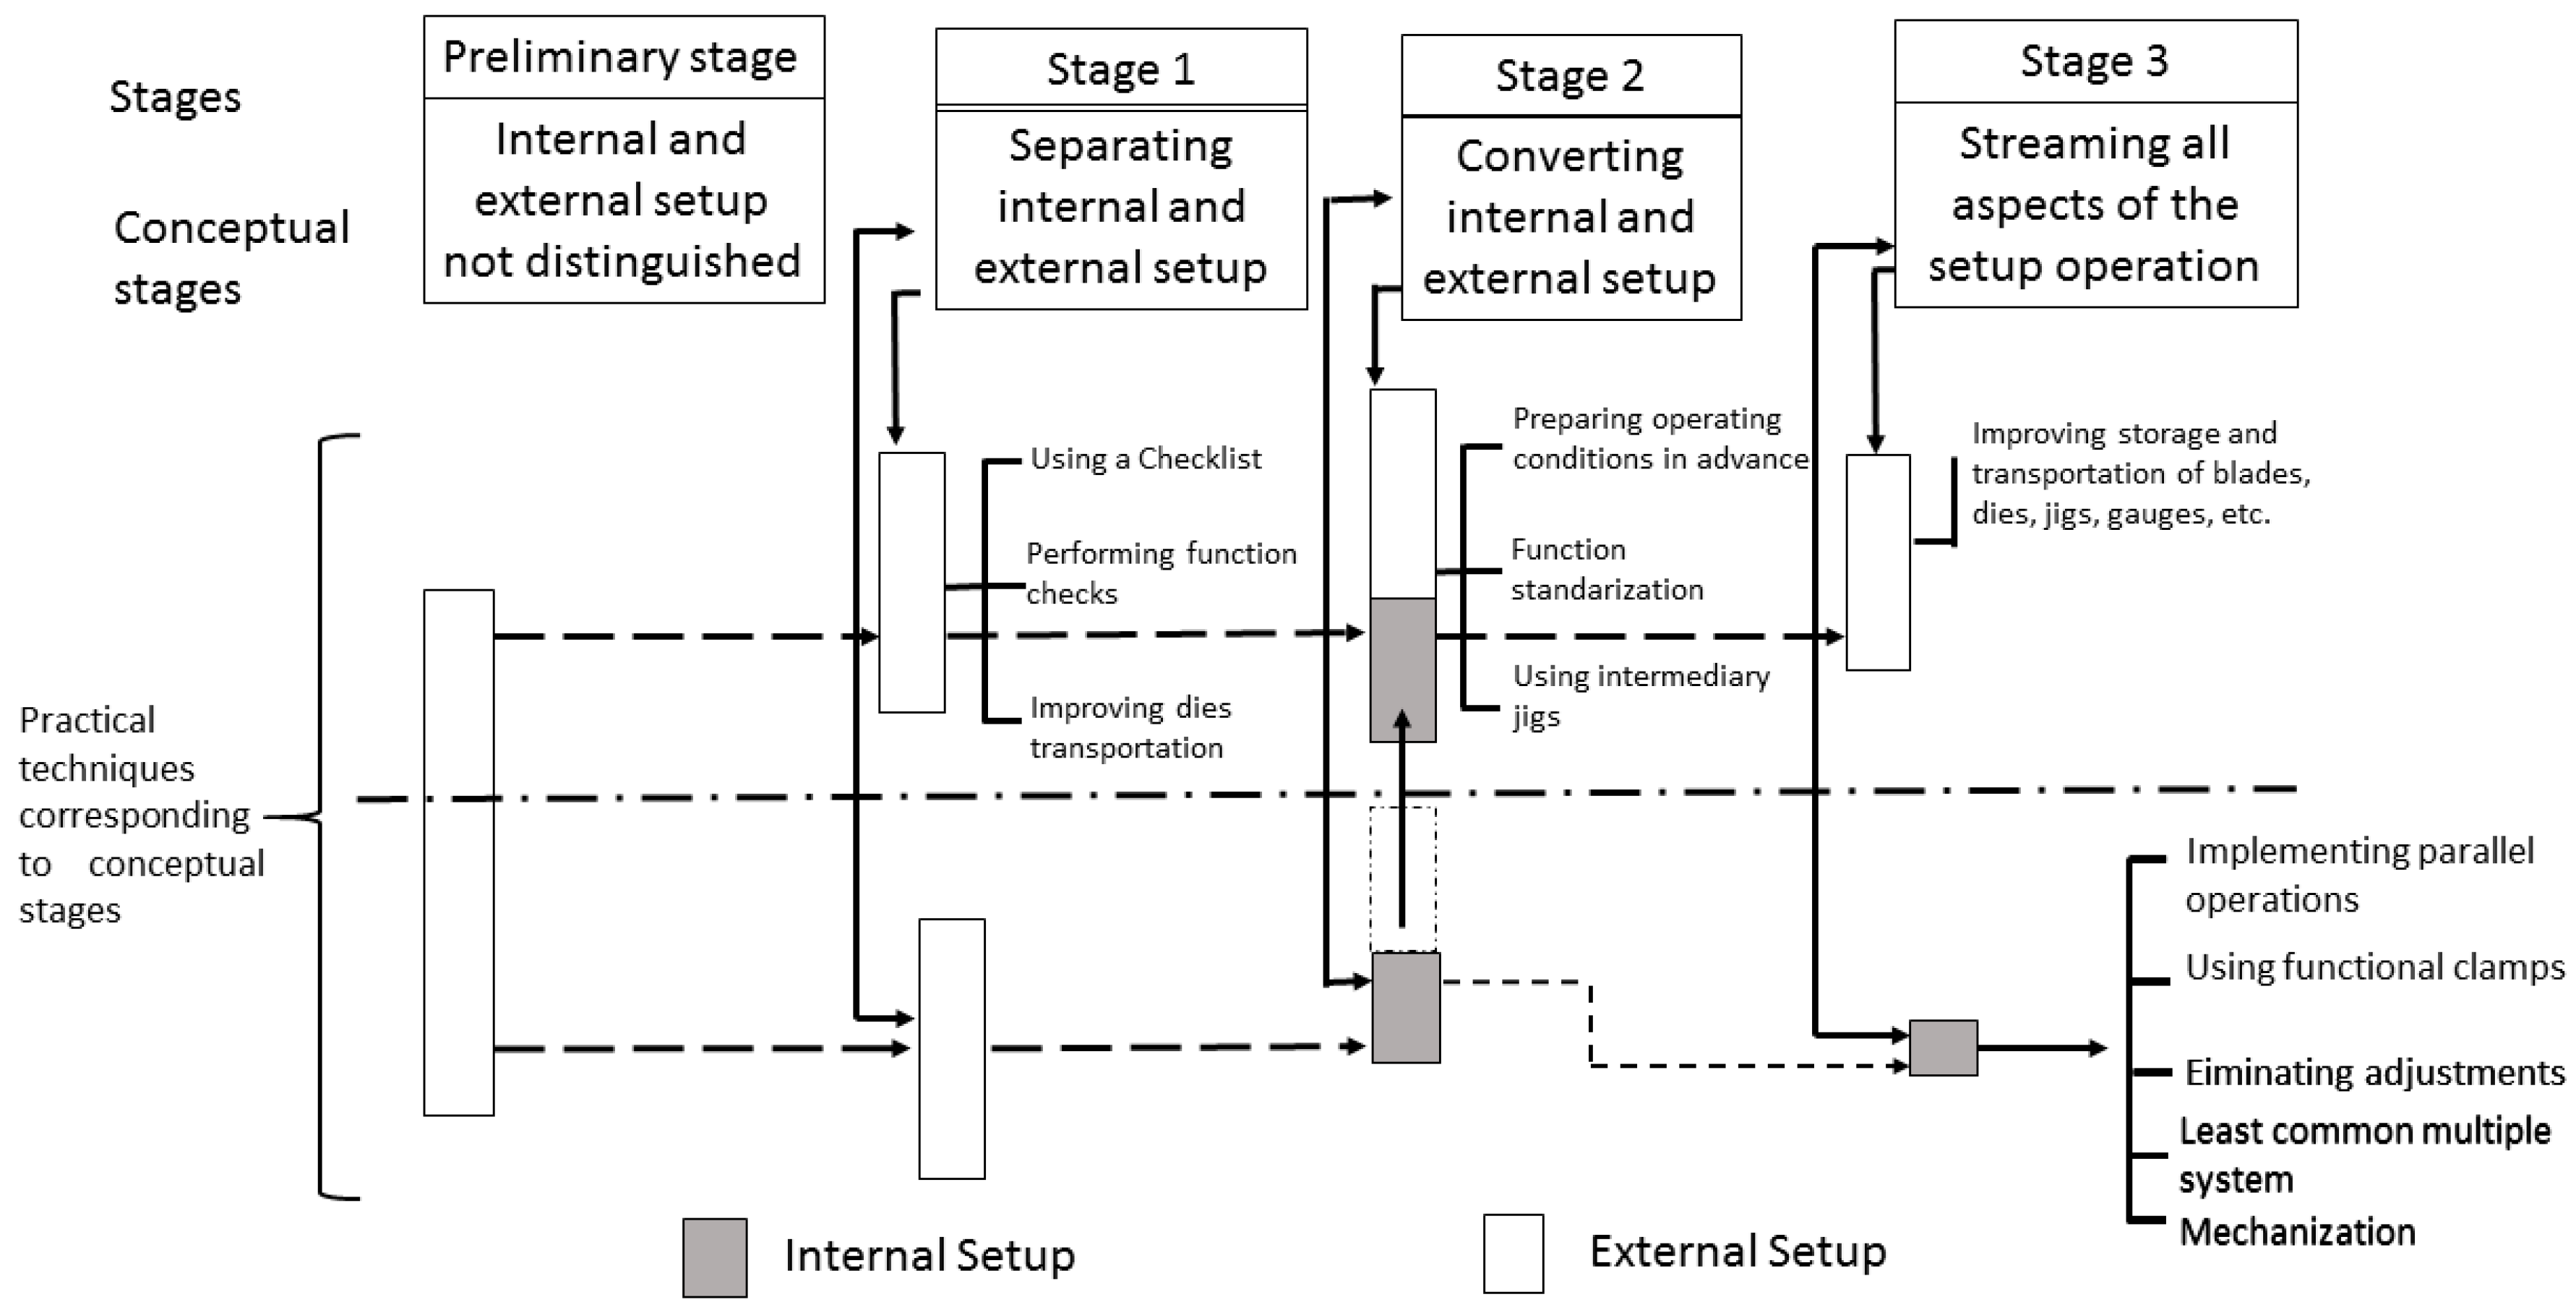
As previously mentioned, SMED is a tool developed by Shingo [7] to reduce bottlenecks caused by stamping press machines that were not working at full capacity. To solve this problem, Shingo divided SMED implementation into four stages, which are depicted in Figure 2. Each stage includes internal and external activities. Internal activities must be completed when the machine is stopped, whereas external activities have to be completed while the equipment is running.
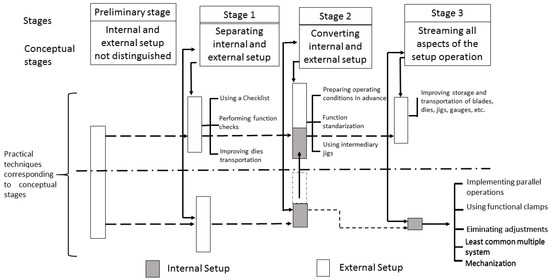
Figure 2.
SMED conceptual stages and practical techniques [7]
Stage 0, called Identification Phase (preliminary stage), does not yet separate internal and external activities. It is rather a stage to identify and study the problem. At this stage, it is necessary to make some questions regarding the production system. Some of these questions are presented below:
- Is a statistical analysis performed to know time variability of the process [11]?
- Is a statistical analysis performed to know the average process time [11]?
- Is there a detailed analysis of the possible causes of time variability in the process [11]?
- Have operators been interviewed about processes and the machines that they operate [12,13]?
- Are operators’ activities being measured with a chronometer [12]?
- Has the company identified activities related to changeovers [14]?
Stage 1, called Separation Phase, focuses on changeover and machine setup activities, since at this stage one must separate internal and external activities. Here, it is important to carry out as many external activities as possible, since they can be performed while the equipment is running. External activities at Stage 1 must be mostly planning operations, which could save between 30% and 50% in setup times.
The main activities performed at this stage are:
- List the main sequential setup operations in order to identify internal activities [15,16].
- List the main sequential setup operations in order to identify external activities [15,16].
- Detect basic problems that are part of the work routine [17].
At Stage 2, called Transformation Phase, one must respond to a series of questions that would improve the work plan. Some of these questions are:
- Is the previous work completed before starting changeover [17]?
- Are visual marks used instead of making trial and error adjustments to calibrations [18]?
- Have steps related to search of tools, raw materials, and products been eliminated [18]?
- Have activities been reexamined to make sure none of them has been wrongly assumed as being internal [19]?
In addition, Stage 2 or Transformation Phase of SMED implementation, consists in transforming internal activities into external. This implies the following actions:
- Reexamine operations to see whether any activities are wrongly assumed as being internal.
- Find the way to convert these activities into external setup.
Stage 3 or Improvement Phase involves streamlining all aspects of the setup, and it includes systematic improvement of all operations. Activities carried out at this stage are:
- Record key setup activities to help improve process time [16,20].
- Train operators to maintain improvement in process time [21].
1.2. SMED Benefits
SMED implementation can be justified by the benefits that it offers to companies. Shingo (1985) pointed out that after company Toyota Amkawa Auto Body Industries K.K. implemented SMED in one of its plants it gained softer production and shorter delivery times. Similarly, authors Musa et al. [12] argued that SMED reduces both setup times and changeover costs, whereas Deros et al. [22] mentioned that this tool increases production flexibility and capacity; it reduces delivery times, inventory levels, and production costs; and, of course, it reduced setup times, which help eliminate waste and defects and thus improve product quality.
In general, SMED offers the following benefits:
- Increased productivity [20];
- Eliminates stocks fail due to errors in estimating demand [23];
- Increased work rates and production capacity of machines [24];
- Fewer or no errors in machines setup [24];
- Improved product quality [13,20];
- Increased security in operations [8,13,20,24];
- Improved setup times [9,19];
- Reduced lot size costs [25].
1.3. Research Problem and Objective
In Ciudad Juárez, Chihuahua, the manufacturing industry has been the major source of employment for more than forty years. According to the National Institute of Statistics and Geography (INEGI), in August 2015, the state of Chihuahua catered for 476 manufacturing industries called maquiladoras. Maquiladoras are foreign-owned companies established in Mexico, and they usually import raw material and export finished products to the origin country and others—such as the United States and Canada—using tax benefits from the North American Free Trade Agreement. The maquiladora industrial sector currently employs 341,374 workers in the state of Chihuahua. More specifically, Ciudad Juárez has 315 active maquiladoras representing 66% of the state’s total and employing 247,730 workers (72% of the state’s total).
Maquiladoras are characterized by high technological capacity and specific employee skills and abilities. These companies are always ready to attend production orders from parent companies located overseas. However, since such production orders usually vary in quantity and product design, changeovers occur frequently. For this reason, SMED has become a traditional technique used in the maquiladora sector. Fortunately, it seems that Mexican manufacturing companies are familiar with SMED implementation activities and benefits. However, because changeovers in machineries occur so often, the effect of SMED is usually unknown and thus rarely analyzed when reporting company benefits.
Currently, structural equation modeling (SEM) has become a popular technique among the engineering sciences to explain dependence among variables in contexts such as Just In Time [26] and Supply Chain [27,28]. From this perspective, the objective of this research is to measure the effect of all SMED stages and activities on the benefits that maquiladoras obtain by using a structural equation model. Results from the model would help managers identify critical activities from trivial ones, thereby focusing their attention on those that are relevant and important.
1.4. Hypotheses
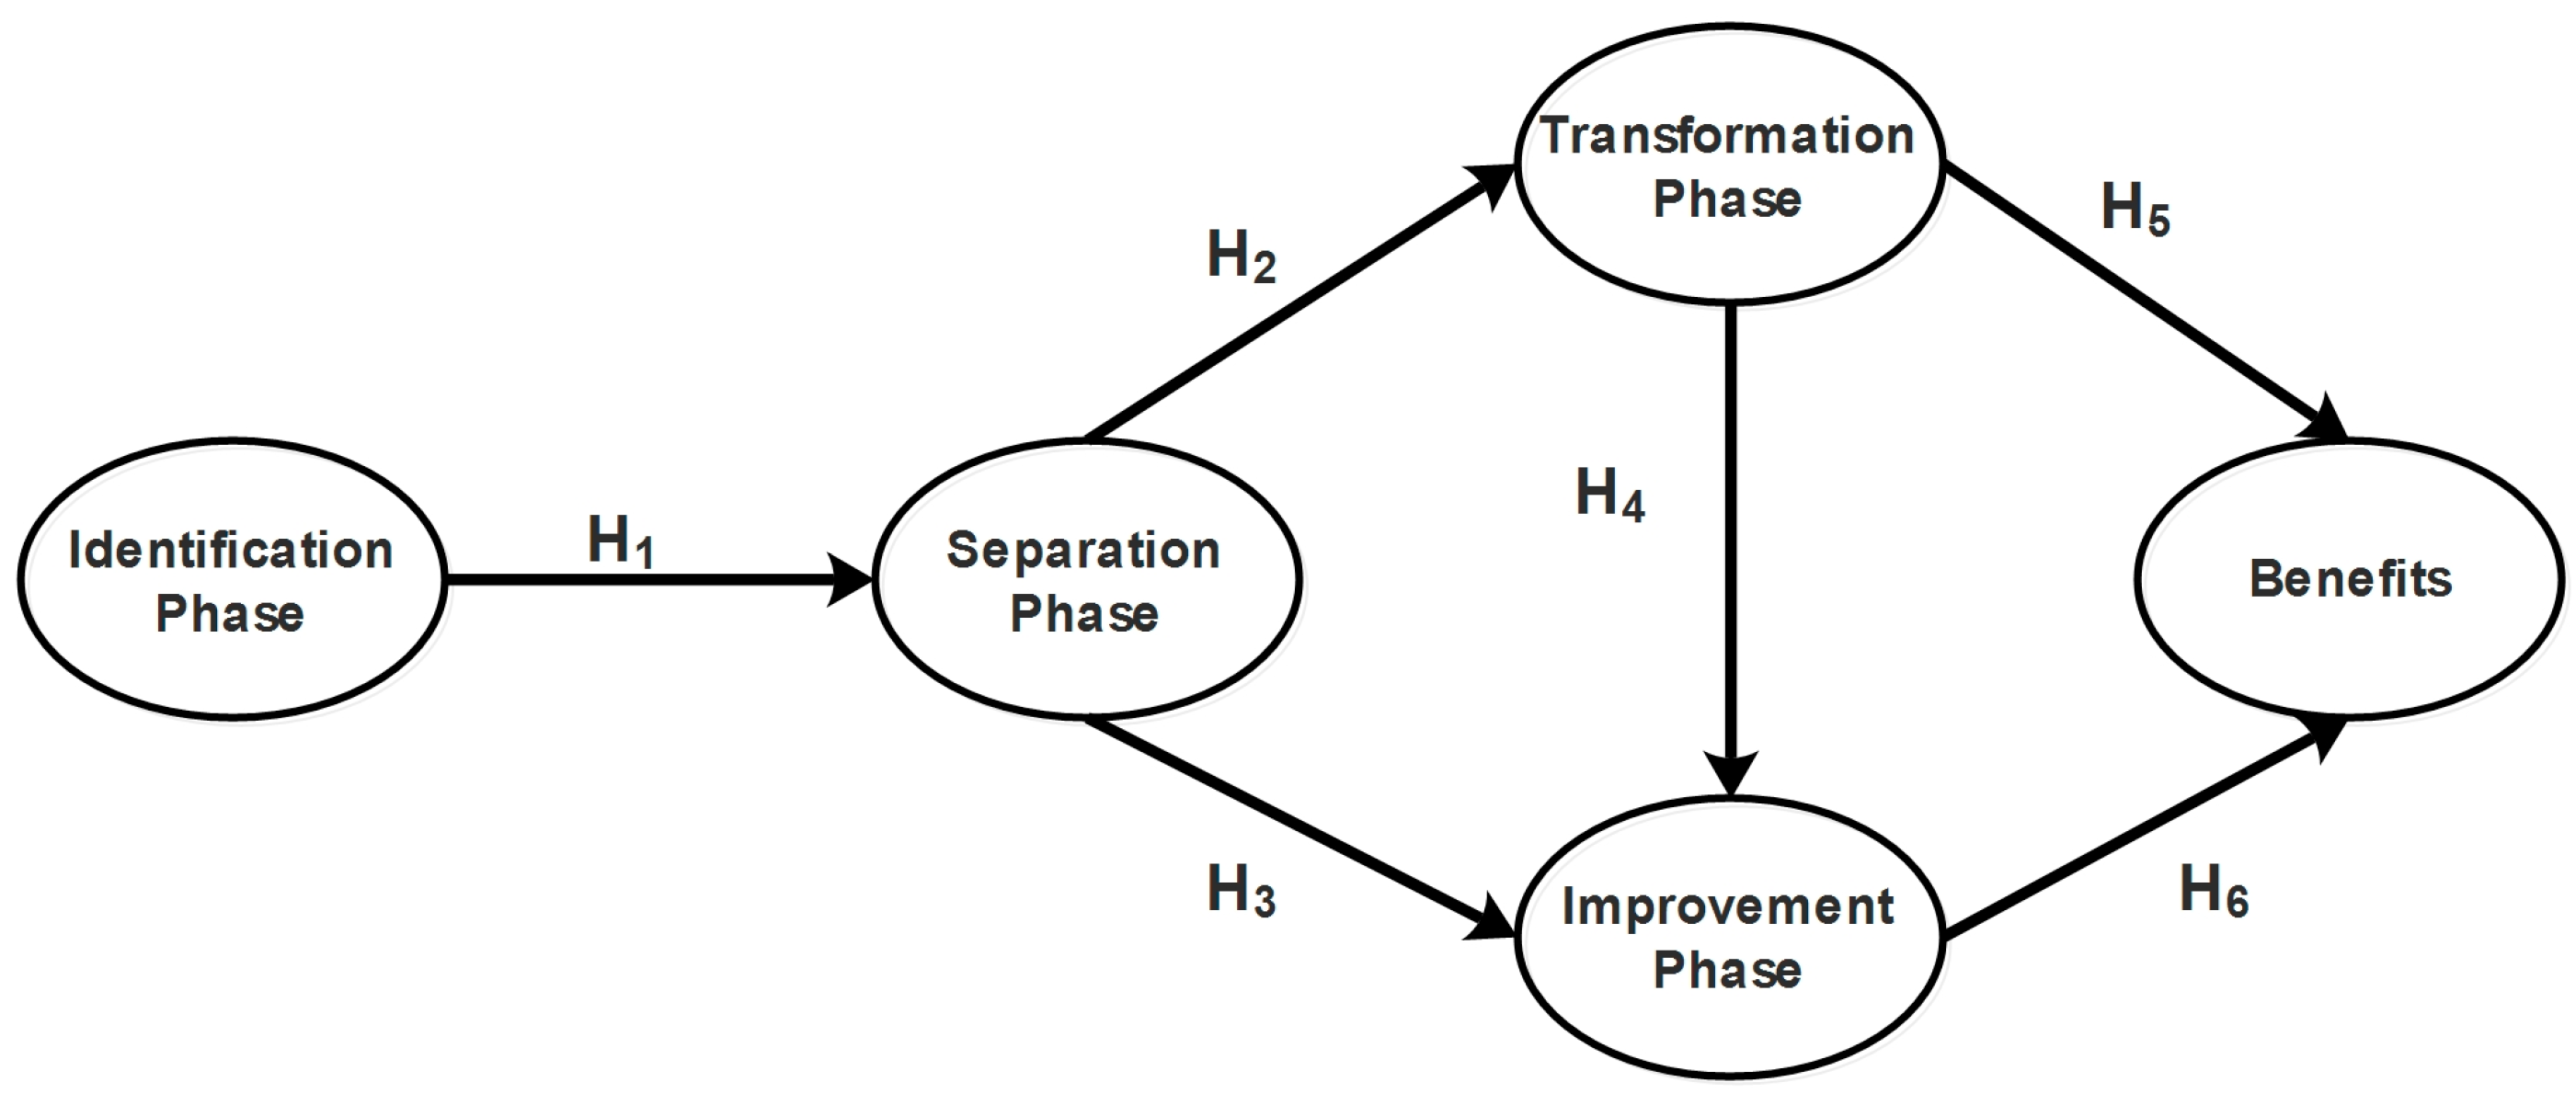
To achieve the proposed objective, we tried to find a dependency measure for each relationship that we proposed between SMED implementation stages and company benefits. To achieve this, we proposed and discussed six working hypotheses. As regards the first hypothesis, it is known that, as part of preventive maintenance programs, manufacturing companies keep record of the activities performed by every machine, its failures, and its effect on product delivery times [29,30,31,32]. Similarly, operators are often interviewed to detect and handle equipment failures [33]. When such events are being recorded, SMED implementation becomes much easier when companies must list the sequential activities to identify which are internal and which are external [14,34]. If every activity is identified, categorization is easier [35]. Let us remind ourselves that internal activities must be performed when the machines are stopped, whereas external activities ought to be carried out while machines are still running. In this sense, the first working hypothesis can be proposed:
H1:
Activities carried out at the Identification Phase of SMED implementation have a direct and positive effect on activities performed at the Separation Phase.
If internal and external activities are successfully identified at the Separation Phase, it is possible to identify the whole pre-work that must be completed before the machine stops to perform the new setup [36,37]. Similarly, it is possible to identify all tools required for the operation and the visual marks to be used to calibrate machines [38]. Therefore, since activities performed at Stage 1 of SMED implementation have an effect on activities at the Transformation Phase, the second working hypothesis can be constructed as follows:
H2:
Activities at the Separation Phase of SMED implementation have a direct and positive effect on activities performed at the Transformation Phase.
A successful list of external and internal activities also helps recognize critical operations. Activities need to be video recorded to be analyzed and identify unnecessary actions and movements that operators perform when machines are stopped. These actions are a waste of time, which is why they must be eliminated [39]. Similarly, they represent an area of opportunity, since SMED helps evaluate setup methods that operators use to see whether they are appropriate [40,41]. Once unnecessary actions are identified, such methods must be improved and programs must be implemented to train operators in these new activities [42]. All of these tasks imply that activities properly performed at the Separation Phase of SMED implementation have an effect on activities performed at the Improvement Phase, which enables to propose the third hypothesis:
H3:
Activities performed at the Separation Phase of SMED implementation have a direct and positive effect on activities performed at the Improvement Phase.
A successful Improvement Phase does not merely depend on activities carried out at the Separation Phase. The Transformation Phase also has an important effect. Let us remind ourselves that, at Transformation Phase, operators make sure all tools, equipment, and raw materials are ready and at hand [40,43]. Similarly, they identify instruments to calibrate machines, employ the correct visual marks, and have operation manuals at their disposal in case they need to be consulted [42,44]. Therefore, since these activities are crucial for successful SMED implementation, it is concluded that they have an influence on the Improvement Phase. The fourth working hypothesis thus states as follows:
H4:
Activities carried out at the Transformation Phase of SMED implementation have a direct and positive effect on activities carried out at the Improvement Phase.
SMED must bring a number of benefits that support its implementation. Maintenance and production managers must work hard to reduce changeover times with SMED [39,45]. Thus, companies will obtain notable economic benefits if all setup tools and instruments are always ready and at hand [46], all changeover activities are planned [45], and the correct visual marks are used [47]. Similarly, they would benefit from reduced setup times and errors in production and high-quality products. Moreover, availability and performance of machines will considerably increase, since more time will be dedicated to production [48,49]. From this perspective, the fifth working hypothesis is constructed:
H5:
Activities carried out at Transformation Phase of SMED implementation have a direct and positive effect on the Benefits gained by manufacturing companies.
SMED benefits are not only obtained from a successful planning stage, since they also depend on properly executed activities [50,51]. In these activities setup methods must be video recorded to analyze and identify unnecessary movements and actions that operators perform in the setup process [44,49,52]. These setup methods must be improved or modified, and the top management department must propose and implement plans and programs to train machine operators [14,35].
Benefits from execution activities mainly include reduced setup costs and small batch production as a result of increased machine productivity and availability [14,53] and increased employee satisfaction [35,54]. Finally, it seems that activities performed when machines are stopped have an important effect on benefits obtained from SMED implementation. Consequently, the sixth working hypothesis is constructed as follows:
H6:
Activities carried out at the Improvement Phase of SMED implementation have a direct and positive effect on Benefits obtained by manufacturing companies.
As can be seen, six working hypotheses are proposed to assess the effect of SMED implementation in the Mexican maquiladora industry of Ciudad Juárez. These hypotheses are graphically represented in Figure 3.
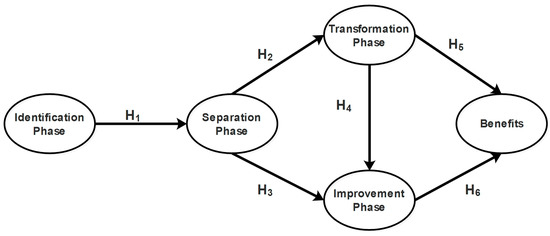
Figure 3.
Initial model with hypotheses.
2. Methodology
This section describes the research methodology that was followed to demonstrate the relationships between the three SMED stages and the benefits that companies obtain from its implementation.
2.1. Survey Design
The survey was designed considering SMED activities and benefits reported in the introduction section, and it comprised 22 items divided in two sections. The first section included demographic questions, such as genre, length of work experience, and the industrial sector of the company, while the second section assessed the five latent variables to be studied: the four stages of SMED implementation and SMED benefits. In addition, the questionnaire included as Appendix A a list of the most common SEM-related abbreviations.
The survey was answered with a five-point Likert scale that rated both the frequency at which SMED activities were performed in surveyed companies at the three stages and the extent to which SMED benefits were obtained. Therefore, the lowest value (1) in the scale implied that a SMED activity was not performed or a SMED benefit was not obtained, while the highest value (5) indicated that a SMED activity was always carried out or a SMED benefit was always obtained. Table 1 shows this scale used for subjective assessment of items.

Table 1.
Scale used.
2.2. Data Collection
To collect information, the survey was administered to industries located in Ciudad Juárez (Mexico), which were reached thanks to an address book provided by IMMEX. The sample included employees from all organizational levels—including managers—involved in changeover or equipment maintenance. In addition, the survey was administered as a personal interview to each participant.
2.3. Data Capture and Screening
Data obtained from the survey were captured in a database designed with statistical software SPSS 21® (IBM, Armonk, New York, USA). Each arrow of the database corresponded to an administered survey (case), while each column included one of the 22 items integrating the five latent variables. Then, data were screened to identify missing values and outliers.
Missing values occur when survey questions have not been answered. Sometimes respondents forget to answer a given item, they may not know the answer, or they simply wish not to respond. That said, if there is more than 10% missing values in a survey, such a case is discarded [55]. However, if the percentage is lower, these values are replaced by the median value of items.
After missing values were solved, we estimated the standard deviation of each case. If it was lower than 0.5, the case was discarded, since it implied that almost all items were rated the same, which suggested little commitment to responding to the survey. Finally, as regards outliers, they were replaced by the median of the item, since we dealt with ordinal data.
2.4. Survey Validation
Two indices were used to determine internal validity of each latent variable: the Cronbach alpha [56] and the composite reliability index. The Cronbach alpha index can be estimated based on the variance or correlation indices between items in a latent variable [57]. When the analysis is based on the variance method, the Cronbach index is similar to the index of determination in a simple linear regression, although it is adjusted with the number of items included in the latent variable.
Values of the Cronbach alpha and the composite reliability index vary between 0 and 1. In any analysis, values close to the unit indicate that a latent variable has enough internal reliability, while values close to 0 imply that a latent variable has little internal reliability and its items are not appropriately measured [58]. In this research, we sought values higher than 0.7 in both indices and for all latent variables, meaning that 50% of variance contained in a variable is explained [59].
Other reliability indices used include average variance extracted (AVE), R-squared, Adjusted R-squared, Q-squared, and variance inflation factor (VIF). Being AVE index a measure of convergent validity, Kock [60] recommends values higher than 0.5; however, some other authors argue that a latent variable is reliable if, in its correlation matrix, the AVE square root is higher than any of the correlated indices in the matrix, checked by row and column. When this does not occur, items or variables included in the latent variable have high factor loadings on other latent variables [58].
As for predictive validity, we estimated R-squared and adjusted R-squared indices as parametric measures, and Q-squared as a non-parametric measure. However, note that for more reliable results, R-squared and Q-squared values should be similar. Finally, we looked for collinearity problems in latent variables through VIF, whose value should not be higher than 3.3.
2.5. Structural Equation Model
In this research, we employed the structural equation modeling technique (SEM) to prove the proposed hypotheses and causal relationships (see Figure 1) [61]. In statistics, SEM is used to validate causal relationships between latent variables and is popular in the social sciences and engineering research [62,63], since it finds dependency among latent variables when these are composed by other observed variables [64]. In this study, the structural equation model was executed in software WarpPLS 5.0 (ScriptWarp Systems, Laredo, TX, USA), using partial least squares (PLS) algorithm, which is widely recommended for small samples sizes and non-normal and ordinal data [60]. Moreover, PLS algorithm has been declared as a technique for understanding complex problems and relationships [65].
In addition, six model fit indices were evaluated in the model: average path coefficient (APC), average R-squared (ARS), average adjusted R-squared, average variance inflation factor (AVIF), average full collinearity VIF (AFVIF), and the Tenenhaus GoF. These indices were proposed by Kock [66] and used by Ketkar and Vaidya [67] in the supply chain environment.
On one the hand, p-values of APC, ARS, and AARS determined the model’s efficiency. The maximum value for these indices was set to 0.05, which implies that inferences were statistically significant at a 95% confidence level, thereby testing the null hypothesis, where APC and ARS equaled 0, versus the alternative hypothesis, where APC and ARS were different from 0. Likewise, it is known in SEM VIF and AFVIF values must be equal to or lower than 3.3 [62], especially in models in which most of the variables are measured through two or more indicators. Finally, in the Tenenhaus GoF index, which is a measure of explanatory capacity [68], values higher than 0.36 [69] are desirable.
The model was executed using WarpPLS 5.0® algorithm with a resampling bootstrap in order to improve values of indices and diminish the effect of possible outliers [62]. In addition, hypotheses were validated by analyzing direct, indirect, and total effects between latent variables. As for direct effects, we estimated values of the beta parameter as a dependency measure, while p-values were used to determine statistical significance of hypotheses. Since statistical tests were run with 95% of confidence level, p-values had to be lower than 0.05. On the other hand, indirect effects between latent variables occurred through a third our fourth latent variable, also known as mediator. Indirect effects are depicted in the model by more than two paths. Finally, to obtain total effects between latent variables, we added their direct and indirect effects.
3. Results
This section presents results obtained from the model analysis. It is divided in three main sections.
3.1. Description of the Sample
In total, 373 surveys were collected. Figure 4 shows the number of participants for every type of surveyed industry. As can be observed, the automotive industry is the most prominent with 168 questionnaires collected.
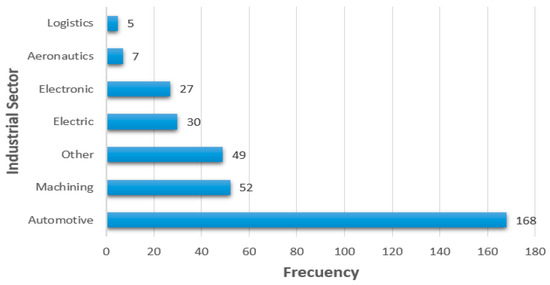
Figure 4.
Surveyed industries.
3.2. Statistical Validation of the Survey
Table 2 shows indices employed to analyze latent variables (stages of SMED implementation and SMED benefits). It is important to mention that certain items (activities or benefits) were removed in order to improve such indices. As can be observed, values of R-squared and adjusted R-squared are all higher than 0.2, thus implying that, from a parametric perspective, all latent variables have enough predictive validity. In addition, the Cronbach alpha (internal validity) shows values above 0.7, which demonstrates that the survey is a reliable instrument to collect data. In addition, all AVE values to measure convergent validity are higher than 0.5, while VIF is lower than 3.3 in all latent variables. This demonstrates that there are no collinearity problems. Finally, since Q-squared values are also higher than 0.2, all latent variables have predictive validity from a non-parametric point of view.
Table 2.
Survey validation.
Table 3 shows the five latent variables and all the observed variables (survey items) included within them after the reliability analysis (please check survey abbreviations in the Appendix A at the end of the paper). The table also shows combined loadings and cross-loadings of these variables to verify convergent validity. Note that some survey items do not appear in the table, since they were eliminated during the validation process. For instance, item S0 01 at the Identification Phase was removed, as it compromised reliability of the latent variable. Finally, note that all p-values in the table are lower than 0.01, thereby demonstrating statistical significance of items and convergent validity for latent variables.
Table 3.
Combined loadings and cross-loading for convergent validity.
3.3. Structural Equation Model
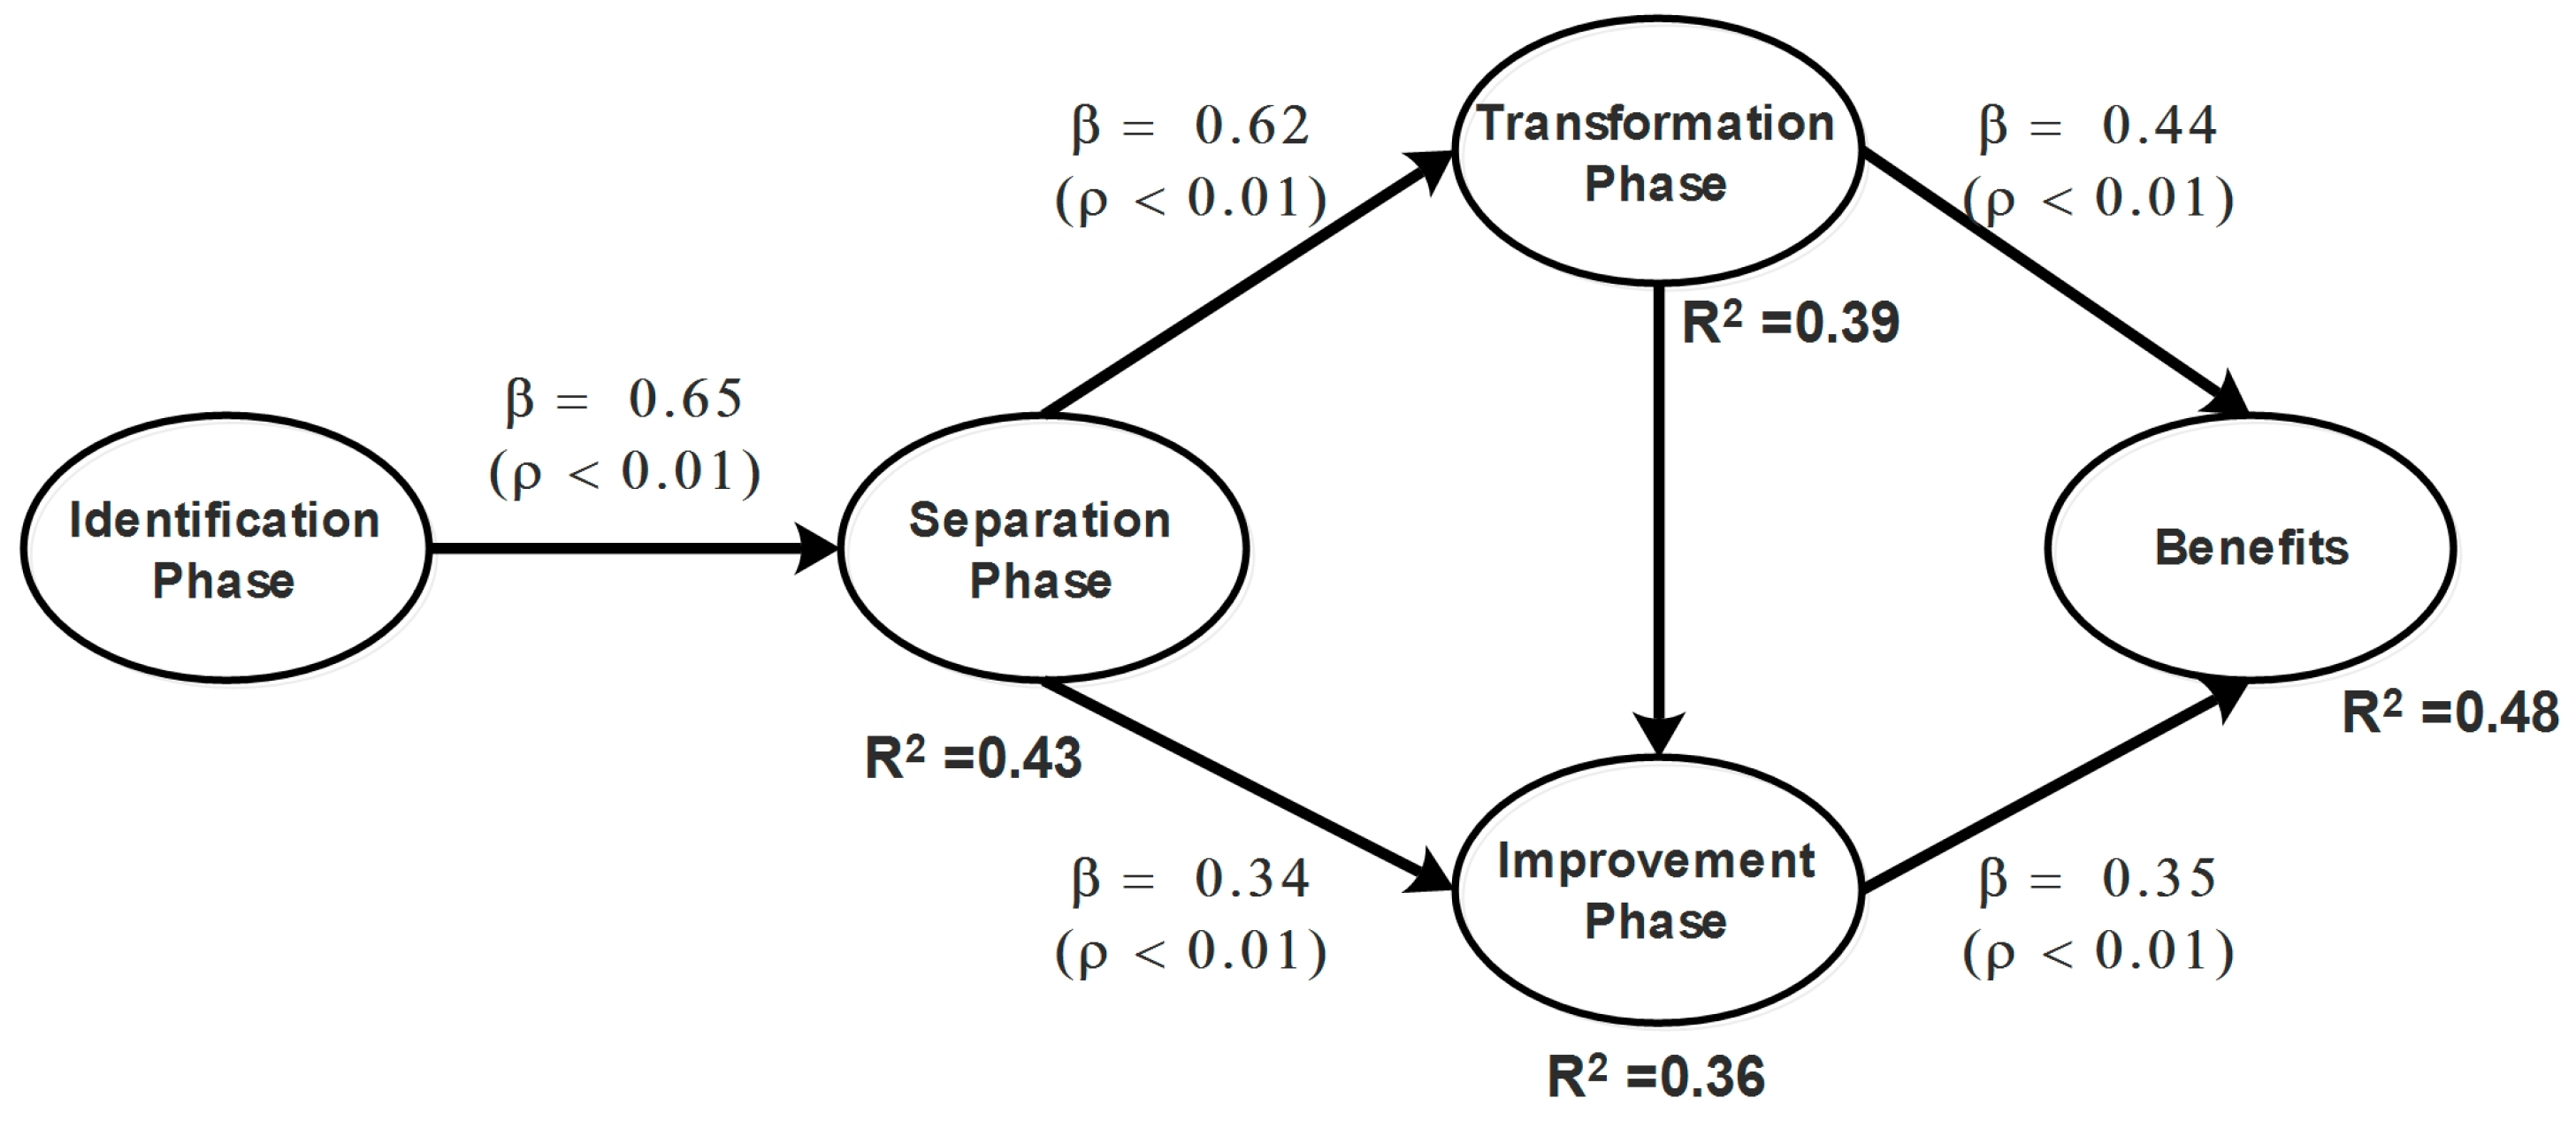
Figure 5 shows the analyzed model. Every relationship shows a β value and a p-value to determine its statistical significance. In addition, every dependent latent variable includes a R-squared value, indicating their variance explained by independent latent variables. According to values of APC, ARS, and AARS, the model has acceptable predictive validity since all p-values are lower than 0.05. In addition, all values of VIF and AFVIF are lower 3.3, which implies that the model is free from collinearity problems. Finally, since the value of the Tenenhaus GoF index is higher than 0.36, the model is adequate. Once these indices were obtained, results from the model can be interpreted.
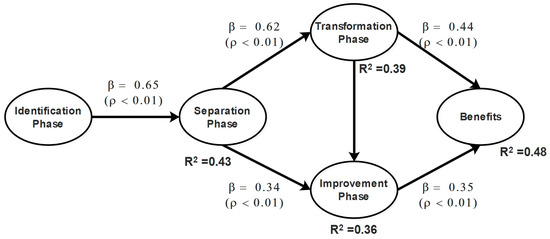
Figure 5.
Initial model evaluated.
Before interpreting the values obtained in the model, it is necessary to validate information. Table 4 illustrates the model fit and quality indices. According to APC, every relationship is valid, since the p value is lower than 0.05. In addition, according to ARS and AARS, the model has enough predictive validity, since its associated p-value is lower than 0.05. Finally, AVIF and AFVIF values are lower than 3.3, thereby indicating that the model is free from collinearity problems, whereas value of Tenenhaus GoF is large, thus demonstrating that data have good fit to the model.
Table 4.
Model fit and quality indices.
3.3.1. Direct Effects
Figure 5 shows the evaluated model with the direct effects between latent variables. For direct effects, we interpret the relationships indicated as arrows. In this case, the beta value indicates the dependency value between two latent variables, while the p-value indicates statistical significance of the relationship. For instance, the relationship between Identification Phase and Separation Phase of SMED implementation shows values of = 0.654 and p < 0.01. This indicates that when the first latent variable increases its standard deviation by one unit, the standard deviation of the second latent variable increases by 0.654 units.
In addition, observe that every dependent latent variable shows a R2 value, indicating the amount of variance explained by independent latent variables. Since all R2 values are lower than one, it means that other variables (not included in this model) also affect that dependent latent variable. In this model, two latent variables (Separation Phase and Transformation Phase) are affected by one independent latent variable, and two more (Improvement Phase and Benefits) are influenced by two independent latent variables.
Since all direct effects are statistically significant, hypotheses of the final model thus state:
H1:
There is enough statistical evidence to affirm that activities performed at the Identification Phase of SMED implementation have a direct and positive effect on activities carried out at the Separation Phase, since when the first latent variable increases its standard deviation by one unit, the standard deviation of the second latent variable increases by 0.65 units. Therefore, activities performed at the Separation Phase have an effect on the setup only if activities at the Identification Phase are properly executed.
H2:
There is enough statistical evidence to affirm that activities performed at the Separation Phase of SMED implementation have a direct and positive effect on activities performed at the Transformation Phase, since when the former latent variable increases its standard deviation by one unit, the latter increases by 0.62 units. Moreover, activities at the Separation Phase can explain 39% of the variability of activities at the Transformation Phase.
H3:
There is enough statistical evidence to affirm that activities performed at the Separation Phase of SMED implementation have a direct and positive effect on activities carried out at the Improvement Phase, since when the first latent variable increases its standard deviation by one unit, the standard deviation of the second latent variable increases by 0.34 units. Moreover, there is an indirect effect of 0.204 between these two latent variables, which occurs through activities at the Transformation Phase. The total effect is therefore 0.544 units.
H4:
There is enough statistical evidence to affirm that activities performed at the Transformation Phase of SMED implementation have a direct and positive effect on activities carried out at the Improvement Phase, since when the first latent variable increases its standard deviation by one unit, the standard deviation of the second latent variable increases by 0.33 units.
H5:
There is enough statistical evidence to affirm that activities carried out at the Transformation Phase of SMED implementation have a direct and positive effect on SMED Benefits, since when the first latent variable increases its standard deviation by one unit, the standard deviation of the second latent variable increases by 0.44 units. Moreover, there is an indirect effect given through activities at the Improvement Phase. The effect has a value of 0.115 units; thus, the total effect in this relationship equals 0.555 units.
H6:
There is enough statistical evidence to affirm that activities carried out at the Improvement Phase of SMED implementation have a direct and positive effect on economic Benefits, since when the first latent variable increases its standard deviation by one unit, the standard deviation of the second latent variable increases by 0.35 units.
3.3.2. Size of Direct Effects
Figure 5 also shows that some dependent latent variables can be explained by one or more independent latent variables. This dependency measure is expressed by the R2 value, which must be decomposed in the number of independent latent variables that explain a dependent latent variable. For instance, Separation Phase is 43% explained by Identification Phase, while the remaining 57% may come from other activities, such as the 5S.
Likewise, latent variable Transformation Phase is 39% explained by latent variable Separation Phase. However, note that Improvement Phase is 36% explained by two latent variables, not just one. In this case, Separation Phase explains 18% of the variability, whereas Transformation Phase explains the remaining 18%. Finally, latent variable Benefits is 48% explained by latent variables Transformation Phase and Improvement Phase. The former is responsible for 27.5%, while the latter explains 20.5%. As can be inferred, activities carried out at the Transformation Phase of SMED implementation are key to gaining SMED Benefits, since this latent variable has the highest explanatory power.
3.3.3. Indirect Effects
Indirect effects between two latent variables occur through other latent variables, also called mediators. In this research, Table 5 introduces the sum of indirect effects for every relationship, the p-values, and the effects size (ES). As can be observed, all p-values are lower than 0.01, which proves that all indirect relationships are statistically significant. Indirect effects are obtained by multiplying the direct effects of the involved latent variables. As example, since Identification Phase is indirectly related to Transformation Phase through Separation Phase, the indirect effect is 0.654 × 0.623 = 0.407.
Table 5.
Sum of indirect effects
Note that the strongest indirect effect occurs between Separation Phase and Benefits. This effect measures 0.463 units, and it shows the highest explanatory power, since it can explain 28.8% of the indirect effects (ES = 0.288). This shows that planning setup operations is key to achieving SMED benefits and goals in mind. The second strongest indirect relationship can be observed between Identification Phase and Transformation Phase through Separation Phase. If the first latent variable increases its standard deviation by one unit, the standard deviation of the second latent variable increases by 0.407 units. Moreover, Separation Phase can explain up to 23.5% of the variability in Transformation Phase (ES = 0.235). This shows that information on production processes and equipment maintenance are key to successfully identifying internal and external activities. All indirect relationships can be similarly interpreted.
3.3.4. Total Effects
Table 6 introduces the total effects between latent variables. Based on the p-values, all total effects are statistically significant at a 99% confidence level. Note that, in relationships without indirect effects, total effects equal direct effects, while, in relationships without direct effects, total effects equal indirect effects. The strongest total effects occur between Identification Phase and Separation Phase, and between Separation Phase and Transformation Phase. However, in these relationships, total effects are only direct. In contrast, the relationship between Separation Phase and Improvement Phase has both direct and indirect effects, and the total effect has a value of 0.547. This implies that when the first latent variable increases its standard deviation by one unit, the standard deviation of the second latent variable increases by 0.547 units. Moreover, Separation Phase explains up to 29.8% of the variability of Improvement Phase (ES = 0.298).
Table 6.
Total effects between latent variables.
Another important total effect is perceived between Transformation Phase and Benefits. The effect has a value of 0.555, implying that when the first latent variable increases its standard deviation by one unit, the standard deviation of the second latent variable increases by 0.555 units. In addition, Transformation Phase explains up to 34.7% of the variability of Benefits (ES = 0.347). The remaining relationships can be similarly interpreted.
4. Conclusions
According to data gathered and analyzed from 379 questionnaires administered in Ciudad Juárez, the following conclusions can be drawn regarding SMED implementation in Mexican maquiladoras:
- (1)
- Before implementing SMED in their processes, companies must have adequate information regarding their processes, since activities performed at the Identification Phase have a strong effect on activities at Separation Phase. Thus, information at the Identification Phase is the basis for SMED success.
- (2)
- Companies must pay attention to SMED activities carried out during the Separation Phase, since proper identification of internal and external activities has direct and positive effects on activities performed at the Transformation Phase and the Improvement Phase. Therefore, the planning stage is key to SMED success, since it helps effectively identify internal and external activities and convert many internal activities into external ones. As a result, machines performance is maximized.
- (3)
- Activities carried out at the Transformation Phase and Improvement Phase are key to obtaining the expected SMED Benefits, since these variables explain up to 48% of them. Transformation Phase is responsible for 27.5%, while Improvement Phase explains 20.2%.
- (4)
- As a LM tool, SMED is extremely useful for the maquiladora industry, since in the manufacturing industry changeovers are recurrent and must be reduced in time.
- (5)
- In this research, we identified many activities required for SMED implementation and several SMED benefits. However, results from the validation process of latent variables showed that not all of these activities or benefits were relevant. Consequently, some of them were removed from the structural equation model.
- (6)
- Based on the highest values of combined loadings shown in Table 3, the most important activity at SMED Identification Phase is the use of a statistical analysis to know time variability of the process. The importance of this activity is supported by the fact that companies must always have at hand empirical evidence on the production process before launching any improvement strategy. As for Separation Phase, results show that the most important activity refers to listing the main sequential setup operations to identify external operations. In other words, with SMED most activities must be performed while the machine is running, thereby saving time wasted during stoppages.
- (7)
- As regards the Transformation Phase, values of combined loadings show that the most important activity is to reevaluate the list made at the Separation Phase to make sure that internal or external activities have been correctly classified. In fact, it is important to clearly identify every activity and assess whether it can be executed while the machine is working. Finally, both activities analyzed at the Improvement Phase showed the same combined loading value, thereby indicating that they are of equal importance.
- (8)
- Finally, as regards Benefits gained from SMED implementation, it seems that setup time improvement is the most important to Mexican manufacturing companies, since it shows the highest value. In fact, improving setup times is the major purpose of and justification for a SMED implementation program.
5. Future Research
The model in Figure 5 shows that variance contained in dependent latent variables is not 100% explained, which implies that other factors can increase it or be the cause of variability. Therefore, in order to increase this value and contribute to the body of knowledge on the effects of SMED implementation in the manufacturing industry, future research will seek to integrate operator training in changeovers and suitability of machinery and equipment as additional latent variables.
Author Contributions
JoséRoberto Díaz-Reza and Jorge Luis García-Alcaraz performed the data collection, data analysis and wrote the paper. Emilio Jimenez-Macías, Julio Blanco-Fernández and Liliana Avelar-Sosa contributed to the univariate and multivariate analysis and also to improving the writing and readability of the paper. Finally, Valeria Martínez-Loya did review the English translation.
Conflicts of Interest
The authors declare no conflict of interest.
Appendix A. SMED Questionnaire
Single Minute Exchange of Dies (SMED) is a lean manufacturing tool developed for continuous improvement of enterprises. SMED seeks to minimize setup times and changing tools, thereby providing companies with enough flexibility when working with small batch production. This questionnaire aims to identify the critical success factors (CSF) for SMED implementation in the Mexican maquiladora industry. The second objective is to identify the benefits obtained from SMED implementation. Please use the Likert scale (1 to 5) provided to rate SMED activities listed below.
| 1 | 2 | 3 | 4 | 5 |
| Never | Rarely | Often | Very frequently | Always |
| Seniority (years) ▯ 0–1 ▯ 1–2 ▯ 2–5 ▯ 5–10 ▯ More than 10 |
| Industrial sector ▯ Machining ▯ Electrical ▯ Automotive ▯ Aeronautics ▯ Electronics ▯ Logistics ▯ Other ______ |
| Gender ▯ Female ▯ Male |
| Position ▯ Manager ▯ Engineer ▯ Supervisor ▯ Technical ▯ Operator |
Preliminary Stage 0: Changeover Activities
Were the following steps completed before implementing SMED?
| 1 | 2 | 3 | 4 | 5 | |
| S0 01 5 s techniques? | |||||
| S0 02 Is a statistical analysis performed to know time variability of the process? | |||||
| S0 03 Is there a statistical analysis to know the average process time | |||||
| S0 04 Is there a detailed analysis of the possible causes of time variability in the process? | |||||
| S0 05 Have operators been interviewed about processes and the machines that they operate? | |||||
| S0 06 Are operators’ activities being measured with a chronometer? | |||||
| S0 07 Is there a video recording of process? | |||||
| S0 08 Were photographs taken of the process? | |||||
| S0 09 Is it necessary to talk to staff to determine any conditions that do not add value? |
First Stage: Separate Internal and External Activities
Were the following steps completed?
| 1 | 2 | 3 | 4 | 5 | |
| S1 01 List the main sequential setup operations to identify internal activities | |||||
| S1 02 List the main sequential setup operations to identify external activities | |||||
| S1 03 Detect basic problems that are part of the work routine. | |||||
| S1 04 Is setup of tools, parts and supplies carried out while machines are running? |
Second Stage: Turn Internal Work into External
| 1 | 2 | 3 | 4 | 5 | |
| S2 01 Is previous work completed before starting changeover? | |||||
| S2 02 Are visual marks used instead of making trial and error adjustments to calibrations? | |||||
| S2 03 Have steps related to the search of tools, raw materials, and products been eliminated? | |||||
| S2 04 Have activities been reexamined to make sure none of them has been wrongly assumed as being internal? |
Third Stage: Streamlining all aspects of setup and systematic improvement of all operations
| 1 | 2 | 3 | 4 | 5 | |
| S3 01 Have key setup activities been recorded to help improve process time? | |||||
| S3 02 Have operators been trained to maintain process improvement? |
SMED Benefits
Were the following benefits obtained?
| 1 | 2 | 3 | 4 | 5 | |
| BE 01 Increased productivity | |||||
| BE 02 It eliminates stocks fail due to errors in estimating demand | |||||
| BE 03 Less product deterioration | |||||
| BE 04 Increased work rates and production capacity of machines | |||||
| BE 05 Fewer or no errors in machines setup | |||||
| BE 06 Improved product quality | |||||
| BE 07 Increased security in operations | |||||
| BE 08 Improved setup times | |||||
| BE 09 Reduced lot size costs | |||||
| BE 10 Improved operators attitude | |||||
| BE 11 Lower training level | |||||
| BE 12 Reduced lead times | |||||
| BE 13 No waiting times | |||||
| BE 14 Small batch production | |||||
| BE 15 Flow production | |||||
| BE 16 Increased production flexibility | |||||
| BE 17 Reduction of setup time into productive time | |||||
| BE 18 Reduced inventory levels | |||||
| BE 19 Reduced lot production size | |||||
| BE 20 Production flow | |||||
| BE 21 Reduced bottlenecks | |||||
| BE 22 Reduced in process inventory | |||||
| BE 23 Quick answer to customer needs | |||||
| BE 24 Increased ability to adapt to changing demands | |||||
| BE 25 Increased machine utilization rate |
References
- Muslimen, R.; Yusof, S.R.; Abidin, A. A case study of lean manufacturing implementation approach in malaysian automotive components manufacturer. In Electrical Engineering and Intelligent Systems; Ao, S.-I., Gelman, L., Eds.; Springer: New York, NY, USA, 2013; pp. 327–335. [Google Scholar]
- Vinodh, S.; Ben Ruben, R. Lean manufacturing: Recent trends, research & development and education perspectives. In Research Advances in Industrial Engineering; Davim, J.P., Ed.; Springer International Publishing: Cham, Switzerland, 2015; pp. 1–16. [Google Scholar]
- Chiarini, A. Sustainable manufacturing-greening processes using specific lean production tools: An empirical observation from European motorcycle component manufacturers. J. Clean. Prod. 2014, 85, 226–233. [Google Scholar] [CrossRef]
- Sundar, R.; Balaji, A.N.; Kumar, R.M.S. A review on lean manufacturing implementation techniques. Procedia Eng. 2014, 97, 1875–1885. [Google Scholar] [CrossRef]
- Haragovics, M.; Mizsey, P. A novel application of exergy analysis: Lean manufacturing tool to improve energy efficiency and flexibility of hydrocarbon processing. Energy 2014, 77, 382–390. [Google Scholar] [CrossRef]
- García-Alcaraz, J.L.; Maldonado-Macías, A.A.; Cortes-Robles, G. Lean Manufacturing in the Developing World: Methodology, Case Studies and Trends from Latin America; Springer: Cham, Switzerland, 2014; pp. 1–584. [Google Scholar]
- Shingo, S. A Revolution in Manufacturing: The SMED System; Productivity Press: New York, NY, USA, 1985. [Google Scholar]
- Ulutas, B. An application of SMED methodology. Int. Sch. Sci. Res. Innov. 2011, 5, 1194–1197. [Google Scholar]
- Sousa, R.M.; Lima, R.M.; Carvalho, J.D.; Alves, A.C. An industrial application of resource constrained scheduling for quick changeover. In Proceedings of the 2009 IEEE International Conference on Industrial Engineering and Engineering Management, Hong Kong, China, 8–11 December 2009; pp. 189–193.
- Van Goubergen, D.; Van Landeghem, H. Rules for integrating fast changeover capabilities into new equipment design. Robot. Comput.-Integr. Manuf. 2002, 18, 205–214. [Google Scholar] [CrossRef]
- Cakmakci, M. Process improvement: Performance analysis of the setup time reduction-smed in the automobile industry. Int. J. Adv. Manuf. Technol. 2009, 41, 168–179. [Google Scholar] [CrossRef]
- Musa, M.A.; Ibrahim, A.M.; Ravi, S.; Abidin, Z.F.Z.; Wan Mat, W.A. A case study and analysis of setup reduction for stamping dies—Smed approach. Glob. Eng. Technol. Rev. 2014, 4, 1–9. [Google Scholar]
- León, J.G.M.; Ruiz, G.A.; Carmen, L.L.V. Implementación de la Metodología Smed (Single Minute Exchange of Die) Como Soporte al Sistema Kanban en un Proceso de Fabricación de Autopartes, Bajo un Enfoque de Valoración y Gestión del Capital Intelectual. Available online: http://www.concyteg.gob.mx/formulario/MT/MT2009/MT5/SESION1/MT51_JM ENDOZA_078.pdf (assessed on 28 October 2016).
- Guzmán Ferradás, P.; Salonitis, K. Improving changeover time: A tailored smed approach for welding cells. In Proceedings of the Forty Sixth CIRP Conference on Manufacturing Systems 2013, Setubal, Portugal, 29–30 May 2013; pp. 598–603.
- Shingo, S. A Study of the Toyota System from an Industrial Engineering Viewpoint; Productivity Press: New York, NY, USA, 1989. [Google Scholar]
- Bajpai, J.D. Smed (single-minute exchange of die) methodology in garment manufacturing industry: Case study in reducing style change over time. In Proceedings of the 5th International & 26th All India Manufacturing Technology, Design and Research Conference (AIMTDR 2014), Guwahati, India, 12–14 December 2014; p. 7.
- Ana, S.A.; Tenera, A. Improving smed in the automotive industry: A case study. In Proceedings of the POMS 20th Annual conference, Orlando, FL, USA, 1–4 May 2009.
- Inteligente, M. Implementar Smed Lean-Single Minute Exchange of Dies. Available online: http://www.manufacturainteligente.com/implementar-smed-lean-single-minute-exchange-of-dies/ (assessed on 28 October 2016).
- Kumar, V.; Bajaj, A. The implementation of single minute exchange of die with 5’s in machining processes for reduction of setup time. Int. J. Recent Technol. Mech. Electr. Eng. 2015, 2, 032–039. [Google Scholar]
- Ribeiro, D.; Braga, F.; Sousa, R.; Carmo-Silvab, S. An Application of the SMED Methodology in an Electric Power Controls Company. Available online: http://repositorium.sdum.uminho.pt/handle/1822/15892 (assessed on 28 October 2016).
- De Miranda Filho, A.N.; Filho, F.M.M.; de Miranda, A.N.; de Miranda, M.I.A. Improving the root pile execution process through setup time reduction. In Proceedings of the 21st Annual ARCOM Conference, London, UK, 7–9 September 2005.
- Niola, V.; Bojkovic, Z.; Garcia-Planas, M.I. Cost Saving in an Automotive Battery Assembly Line Using Setup Time Reduction. Available online: http://www.wseas.us/e-library/conferences/2011/Venice/MUCOM/MUCOM-22.pdf (assessed on 28 October 2016).
- Fritsche, R. Reducing Set-up Times for Improved Flexibility in High-Mix Low-Volume Electric Drives Production. In Proceedings of the 2011 1st International Electric Drives Production Conference (EDPC), Nuremberg, Germany, 28–29 September 2011; pp. 74–77.
- Tilkar, K.; Nagaich, R.; Marwah, K. Improving productivity of a manufacturing plant using single minute exchange of die. Int. J. Adv. Sci. Tech. Res. 2013, 1, 8. [Google Scholar]
- Bikram Jit, S.; Dinesh, K. SMED: For quick changeovers in foundry smes. Int. J. Prod. Perform. Manag. 2010, 59, 98–116. [Google Scholar]
- García-Alcaraz, J.L.; Prieto-Luevano, D.J.; Maldonado-Macías, A.A.; Blanco-Fernández, J.; Jiménez-Macías, E.; Moreno-Jiménez, J.M. Structural equation modeling to identify the human resource value in the jit implementation: Case maquiladora sector. Int. J. Adv. Manuf. Technol. 2015, 77, 1483–1497. [Google Scholar] [CrossRef]
- Balaji, M.; Arshinder, K. Modeling the causes of food wastage in indian perishable food supply chain. Resour. Conserv. Recycl. 2016, 114, 153–167. [Google Scholar]
- Yadav, D.K.; Barve, A. Analysis of critical success factors of humanitarian supply chain: An application of interpretive structural modeling. Int. J. Disaster Risk Reduct. 2015, 12, 213–225. [Google Scholar] [CrossRef]
- Singh, R.; Gohil, A.M.; Shah, D.B.; Desai, S. Total productive maintenance (TPM) implementation in a machine shop: A case study. Procedia Eng. 2013, 51, 592–599. [Google Scholar] [CrossRef]
- Sun, H.; Yam, R.; Wai-Keung, N. The implementation and evaluation of total productive maintenance (tpm)—An action case study in a hong kong manufacturing company. Int. J. Adv. Manuf. Technol. 2003, 22, 224–228. [Google Scholar] [CrossRef]
- Chlebus, E.; Helman, J.; Olejarczyk, M.; Rosienkiewicz, M. A new approach on implementing TPM in a mine—A case study. Arch. Civ. Mech. Eng. 2015, 15, 873–884. [Google Scholar] [CrossRef]
- Eti, M.C.; Ogaji, S.O.T.; Probert, S.D. Development and implementation of preventive-maintenance practices in Nigerian industries. Appl. Energy 2006, 83, 1163–1179. [Google Scholar] [CrossRef]
- Shen, C.C. Discussion on key successful factors of TPM in enterprises. J. Appl. Res. Technol. 2015, 13, 425–427. [Google Scholar] [CrossRef]
- Almomani, M.A.; Aladeemy, M.; Abdelhadi, A.; Mumani, A. A proposed approach for setup time reduction through integrating conventional smed method with multiple criteria decision-making techniques. Comput. Ind. Eng. 2013, 66, 461–469. [Google Scholar] [CrossRef]
- Rodríguez-Méndez, R.; Sánchez-Partida, D.; Martínez-Flores, J.L.; Arvizu-BarrÓn, E. A case study: SMED & JIT methodologies to develop continuous flow of stamped parts into ac disconnect assembly line in schneider electric tlaxcala plant. IFAC Pap. Online 2015, 48, 1399–1404. [Google Scholar]
- Morales Méndez, J.; Silva Rodríguez, R. Set-up reduction in an interconnection axle manufacturing cell using SMED. Int. J. Adv. Manuf. Technol. 2016, 84, 1907–1916. [Google Scholar] [CrossRef]
- Samuel Vieira, C.; Iana Araújo, R.; Andressa Amaral, A.; João Flávio, A.; Fabrício, F.; Adriano, M. Desenvolvimento e implementação de uma metodologia para troca rápida de ferramentas em ambientes de manufatura contratada/development and implementation of a smed methodology in contract manufacturing enviroments. Gestão Produção 2009, 16, 357–369. (In Portuguese) [Google Scholar]
- Miguel, S.; Richard Ian, M.; Olívio, N. Metodologia de shigeo shingo (SMED): Análise crítica e estudo de caso/shingo’s methodology (SMED): Critical evaluation and case study. Gestão Produção 2007, 14, 323–335. [Google Scholar]
- Adanna, I.W.; Shantharam, A. Improvement of setup time and production output with the use of single minute exchange of die principles (SMED). Int. J. Eng. Res. 2014, 2, 274–277. [Google Scholar]
- McIntosh, R.I.; Culley, S.J.; Mileham, A.R.; Owen, G.W. A critical evaluation of shingo’s ‘smed’ (single minute exchange of die) methodology. Int. J. Prod. Res. 2000, 38, 2377–2395. [Google Scholar] [CrossRef]
- Moreira, A.C.; Garcez, P.M.T. Implementation of the single minute exchange of die (SMED) methodology in small to medium-sized enterprises: A portuguese case study. Int. J. Manag. 2013, 30, 66–87. [Google Scholar]
- Vukićević Milan, R.; Vojinović, S.; Mladenović, B. Implementation of SMED method in wood processing. Glas. Šumar. Fak. 2007, 2007, 7–14. [Google Scholar] [CrossRef]
- Wang, C.H.; Kao, J.H.; Thakur, S.K. Implementation of the Lean Model for Carrying out Value Stream Mapping and Smed in the Aerospace engine Case Production; Bertin, G., Ed.; Trans Tech: Zurich, Switzerland, 2012; pp. 302–310. [Google Scholar]
- Perinić, M.; Ikonić, M.; Maričić, S. Die casting process assessment using single minute exchange of dies (SMED) method. Metalurgija 2009, 48, 199–202. [Google Scholar]
- Lingayat, S.S.; Vasani, R.S.; Kulkarni, G.; Ambhore, S.S.; Sharma, S.; Rautela, L.D.S. Optimization of product, tool & process design concept through SMED technique. In Proceedings of the 2015 International Conference on Technologies for Sustainable Development (ICTSD), Mumbai, India, 4–6 February 2015.
- Nee, L.S.; Hou, C.S.; Yee, S.H.; Razalli, S.; Kamaruddin, S. External Setup in Smed Improvement in an Injection Molding Manufacturing Company; Othman, M., Ed.; TTP: Zurich, Switzerland, 2012; p. 2551. [Google Scholar]
- King, P.L. SMED in the process industries. Ind. Eng. 2009, 41, 30–35. [Google Scholar]
- Sanches, H.R.V. Aplicação da Metodologia Smed na Indústria Vidreira. Available online: https://repositorio-aberto.up.pt/handle/10216/78409 (assessed on 28 October 2016).
- Hongda, K.; Youling, C. Strategy Research in eto Manufacture Enterprise by Applying the Smed Methodology; Xia, G., Deng, X., Eds.; Pub House of Electronics Industry: Beijing, China, 2008; pp. 1931–1934. [Google Scholar]
- Da Costa, I.A. Aplicação da Metodologia Smed Numa Linha Cnc de Produção de Mobiliário. Available online: https://repositorio-aberto.up.pt/handle/10216/78401 (assessed on 28 October 2016).
- Paquette, L. Jit, kan Ban, Smed, and Other Funny Names; American Management Association International: New York, NY, USA, 2003; pp. 85–90. (In Portuguese) [Google Scholar]
- Santos, R.P.D. Implementação de Metodologia Smed Para Redução dos Tempos de Preparação do Equipamento Simon 350. Available online: https://www.iconline.ipleiria.pt/handle/10400.8/1533 (assessed on 28 October 2016). (In Portuguese)
- Stadnicka, D. Setup analysis: Combining Smed with other tools. Manag. Prod. Eng. Rev. 2015, 6, 36–50. [Google Scholar] [CrossRef]
- Henry, J.R. Achieving Lean Changeover: Putting SMED to Work; Productivity Press: Boca Raton, NM, USA, 2013. [Google Scholar]
- Hair, J.F., Jr.; Black, W.C.; Babin, B.J.; Anderson, R.E. Multivariate Data Analysis; Prentice Hall: Upper Saddle River, NJ, USA, 2010. [Google Scholar]
- Cronbach, L.J. Coefficient alpha and the internal structure of tests. Psychometrika 1951, 16, 297–334. [Google Scholar] [CrossRef]
- Adamson, K.A.; Prion, S. Reliability: Measuring internal consistency using cronbach’s α. Clin. Simul. Nurs. 2013, 9, e179–e180. [Google Scholar] [CrossRef]
- Garcia-Alcaraz, J.L.; Maldonado-Macías, A.A. Just-in-Time Elements and Benefits; Springer: Cham, Switzerland, 2016. [Google Scholar]
- Kumar, D.; Rahman, Z. Buyer supplier relationship and supply chain sustainability: Empirical study of Indian automobile industry. J. Clean. Prod. 2016, 131, 836–848. [Google Scholar] [CrossRef]
- Kock, N. Warppls 5.0 User Manual; ScripWarp Systems TM: Laredo, TX, USA, 2015. [Google Scholar]
- Rahmadi, R.; Groot, P.; Heins, M.; Knoop, H.; Heskes, T. Causality on Cross-Sectional Data: Stable Specification Search in Constrained Structural Equation Modeling. Available online: https://arxiv.org/pdf/1506.05600v3.pdf (assessed on 28 October 2016).
- Kreiberg, D.; Söderström, T.; Yang-Wallentin, F. Errors-in-variables system identification using structural equation modeling. Automatica 2016, 66, 218–230. [Google Scholar] [CrossRef]
- Hwang, G.H.; Jeong, S.K.; Ban, Y.U. Causal relationship of eco-industrial park development factors: A structural equation analysis. J. Clean. Prod. 2016, 114, 180–188. [Google Scholar] [CrossRef]
- Eisenhauer, N.; Bowker, M.A.; Grace, J.B.; Powell, J.R. From patterns to causal understanding: Structural equation modeling (SEM) in soil ecology. Pedobiologia 2015, 58, 65–72. [Google Scholar] [CrossRef]
- Nitzl, C. The use of partial least squares structural equation modelling (PLS-SEM) in management accounting research: Directions for future theory development. J. Acc. Literat. 2016, 37, 19–35. [Google Scholar] [CrossRef]
- Kock, N. Advanced mediating effects tests, multi-group analyses, and measurement model assessments in PLS-based sem. Int. J. E Collab. 2014, 10, 1–13. [Google Scholar] [CrossRef]
- Ketkar, M.; Vaidya, O.S. Study of emerging issues in supply risk management in India. Procedia Soc. Behav. Sci. 2012, 37, 57–66. [Google Scholar] [CrossRef]
- Vinzi, V.E.; Trinchera, L.; Amato, S. PLS Path Modeling: From Foundation to Recent Developments and Open Issues Form Model Assessment and Improvement. Available online: http://link.springer.com/chapter/10.1007/978-3-540-32827-8_3 (assessed on 28 October 2016).
- Henseler, J.; Sarstedt, M. Goodness-of-fit indices for partial least squares path modeling. Comput. Stat. 2013, 28, 565–580. [Google Scholar] [CrossRef]

© 2016 by the authors; licensee MDPI, Basel, Switzerland. This article is an open access article distributed under the terms and conditions of the Creative Commons Attribution (CC-BY) license (http://creativecommons.org/licenses/by/4.0/).