1. Introduction
The South Korean government has introduced a low carbon policy measure that mandates renewable energy utilization in public buildings [
1]. Under this regulation, over 5% of the total construction cost for new public buildings must be invested for renewable energy (RE) systems. Alternatively, 10% of the estimated annual energy consumption in public buildings with a gross area of over 3000 m
2 must be covered by RE systems.
Since the installation of RE systems requires substantial capital investment, RE systems should be appropriately sized on the basis of an economic feasibility study. Several studies associated with feasibility analysis and system optimization for single RE systems have been conducted. Such studies have been extended to RE hybrid systems (REHSs) that combine conventional energy systems and RE systems.
Feasibility studies on single RE systems are focused on optimal cost evaluation. For instance, Calise [
2] carried out a thermo-economic feasibility study on a solar thermal system installed in schools by running detailed computer simulations. The payback period was evaluated under various scenarios of feed-in tariffs. Agrawal et al. [
3] evaluated the performance of a building-integrated photovoltaic thermal system (BIPVT) in terms of energy, exergy, and life cycle cost.
Studies on REHSs are usually associated with the optimization of system capacities. This optimization is frequently achieved using economic and environmental criteria (e.g., capital cost, energy saving, carbon emission, etc.). Banos et al. [
4] reviewed the state of the art in the current optimization methods applicable to the sizing of RE systems. The review revealed that a large number of authors considered cost-related factors (e.g., interest, capital, energy tariff) as major optimization parameters. Sayyadi et al. [
5] carried out a study on the optimization of a cooling tower-assisted ground source heat pump system. This study suggested a method using the total revenue requirements for multi-objective optimization by thermodynamic and economic models. A similar study was conducted by Bakelli et al. [
6]. This study proposed an optimal sizing model to determine the capacities of the components of a photovoltaic water pumping system on the basis of two criteria: the loss of power supply for reliability and the life cycle cost. Bernal-Agustín et al. [
7] proposed another multi-objective design method for minimizing the total cost and pollutant emissions for an isolated photovoltaic-wind-diesel installation. Nam et al. [
8] studied the feasibility of installing an REHS by hourly demand and supply matching analysis. The temporal matching analysis provided a way to avoid oversizing the REHS installation.
Typically, most of the optimization methodologies for REHSs require extensive data (e.g., thermal and electrical demand profiles, specifications of energy supply systems) and knowledge of computer simulation techniques. In order for energy planners to identify appropriate capacities of REHSs at the planning stage, however, design methods for optimal capacity should be more simplified so that the planners can be supported effectively without the burden of input data preparation and technical skills.
Schools are a suitable public building for RE systems because of site conditions (e.g., open space) and their energy demand profiles (e.g., daytime-based use of hot water and heating/cooling). In addition, operation schedules and use profiles, which are important factors to consider, are almost identical across typical schools. Whereas the thermal energy demand profile of schools is mainly dependent on the total area and the number of occupants (i.e., students, faculty, and staff), it is reasonably predictable because of the modularized classrooms.
In this paper, a possible REHS for schools particularly located in urban areas is specified. The optimal capacities of the REHS are examined on the basis of both available investment budgets and energy demand/supply scales, modulated by numbers of classrooms. This paper presents the results of simulation-based evaluation. A simplified optimal sizing model as a function of the number of classrooms is derived from the results.
2. Why Is a Simplified Sizing Method Required at the Early Design Stage?
As given in the introduction, the purpose of this method development is for use in the early design stage. At this stage, a rapid and relevant method is required to meet regulated renewable energy portion, cover required portion of energy consumption, and proceed to the next levels of engineering. This stage is crucial to estimate required capital costs for renewable energy systems, which become a high priority for public building projects in Korea.
From the authors’ knowledge, rule-of-thumb based simple calculations have been used at this stage. However, these cannot be applied to a hybrid system that employs multiple energy sources since a proper sizing allocation for each system is normally achieved by an elaborate engineering process.
In general, engineers may use some well-known tools for sizing energy systems of multi-energy sources. RETScreen [
9] is a decision-making tool for analyzing the feasibility of renewable energy system projects. This is run under defined parameters, and thus an additional effort is required to optimize the parameters. To cover such an optimization run, Lee et al. [
10] combines an optimization tool with RETScreen. Merit [
11] is an evaluation tool for so-called 100% RE provision. Merit searches for energy demand and supply matching cases by varying RE system sizing. Several existing computer tools for an RE integration were listed and compared by Connolly et al. [
12].
Another type of optimal sizing is adopting an optimization method to a common simulation tool. GenOpt [
13], a generic optimization tool, provides many optimization algorithms to size multi-source energy systems. This tool can be easily integrated into existing simulation tools as it can control float parameters of simulation models until optimized values are found. Some recent works coupled GenOpt with TRNSYS [
14] for renewable energy sizing optimization [
15,
16].
So-called customized models for a specific system configuration were developed. Catalina et al. [
17] selected common RE together with conventional systems, and they proposed possible system combinations with proper sizing. Fabrizio et al. [
18] developed a similar model, but the energy supply is evaluated in a more detailed way. In both models, a target system configuration was prescribed, and thus it is hard to add or eliminate a new RE system. In addition, they all require a detailed load calculation.
In summary, many existing sizing methods still require substantial engineering work which is rarely carried out at the early design stage. However, a relevant early-stage sizing method can be developed for cases where load can be modulated and the system configuration is typical. In such a case, a simple input such as numbers of modules (e.g., numbers of classrooms) may calculate optimized system capacities.
Therefore, simple sizing equations for a target REHS in schools are proposed in this paper. Once the number of classrooms is given as the input value to equations, optimal sizing results are obtained for each component system of the REHS. It may be odd since an optimal system sizing is carried out with a possible budget as the RE is still expensive compared to conventional energy systems. In this work, budgets that are too small or big compared to load matching are ruled out, so a proper budget range is deduced for each number of classrooms. Thus, the number of classrooms can find a minimum budget within the range and then propose optimal sizing of the RE component of the target system.
A development process will be presented that includes statistical load data regression and operation cost analyses.
3. System Configuration and Unit Loads
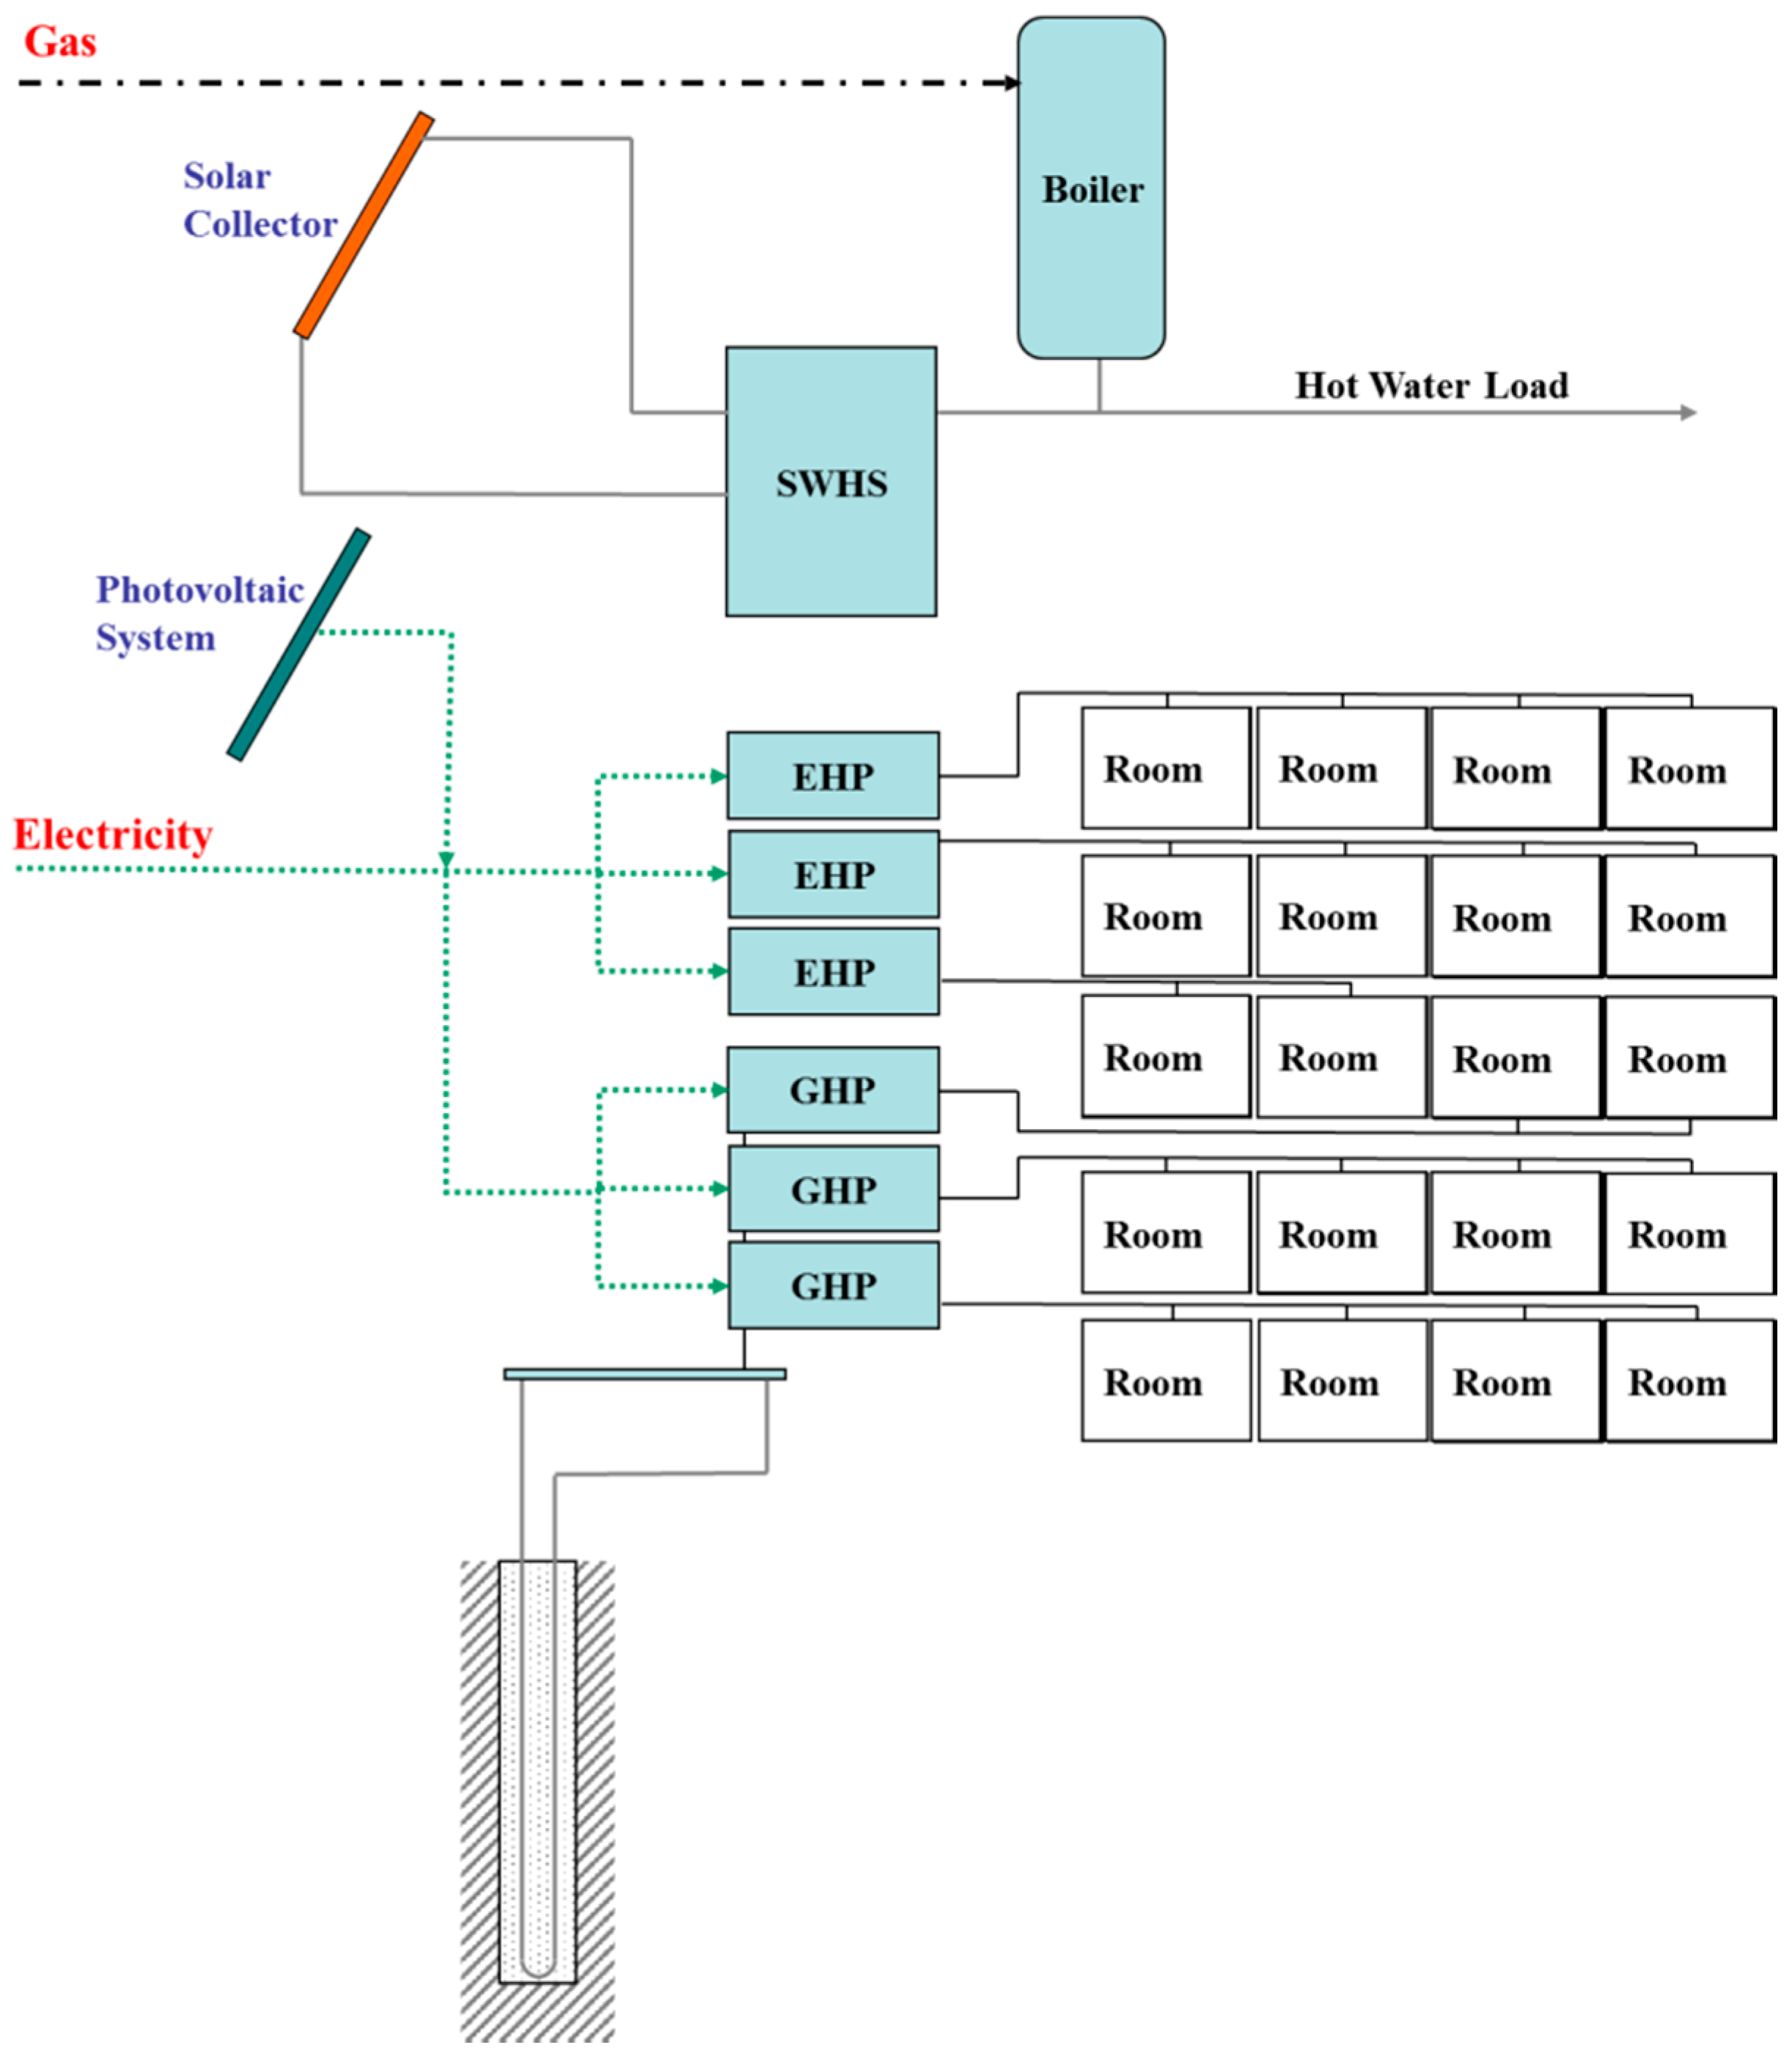
An REHS for schools in an urban area is proposed that comprises air-source electric heat pumps (EHPs) and common RE systems in Korea such as photovoltaic modules (PVs), solar thermal collectors, and geothermal heat pumps (GHPs). Among common RE energy systems, small-scale wind turbine systems are ruled out because of a lack of wind resource in urban areas and turbine-generated noise.
Figure 1 shows a schematic of the proposed REHS.
Both EHPs and GHPs are installed to supply the heating/cooling loads of classrooms. They are not combined but operated separately. Therefore, a classroom is supplied with energy from either an EHP or a GHP. The electricity required for operating both heat pumps is provided from PVs or the electrical grid (when the supplying from PVs is insufficient). When the energy from the solar collectors cannot meet the hot water load, the deficit is compensated by a gas boiler. The storage tanks were not taken into account in this study. Gas is consumed by the boiler and can be reduced by increasing useful energy gain from the solar collectors.
In this study, a simulation was run on an hourly basis. Hourly weather data for Daejeon in Korea were used, and hourly occupancy schedules and operational profiles were deduced from a survey study [
19]. Thermal load profiles for schools are different according to the size, orientation, envelopes, and so on. It is essential to our cost-benefit assessment to deduce the thermal load profiles for various types of schools. However, all possible variances of the model parameters are substantial. To reduce time and computational resources, the thermal load profiles are modularized to obtain a typical thermal load profile for a unit classroom.
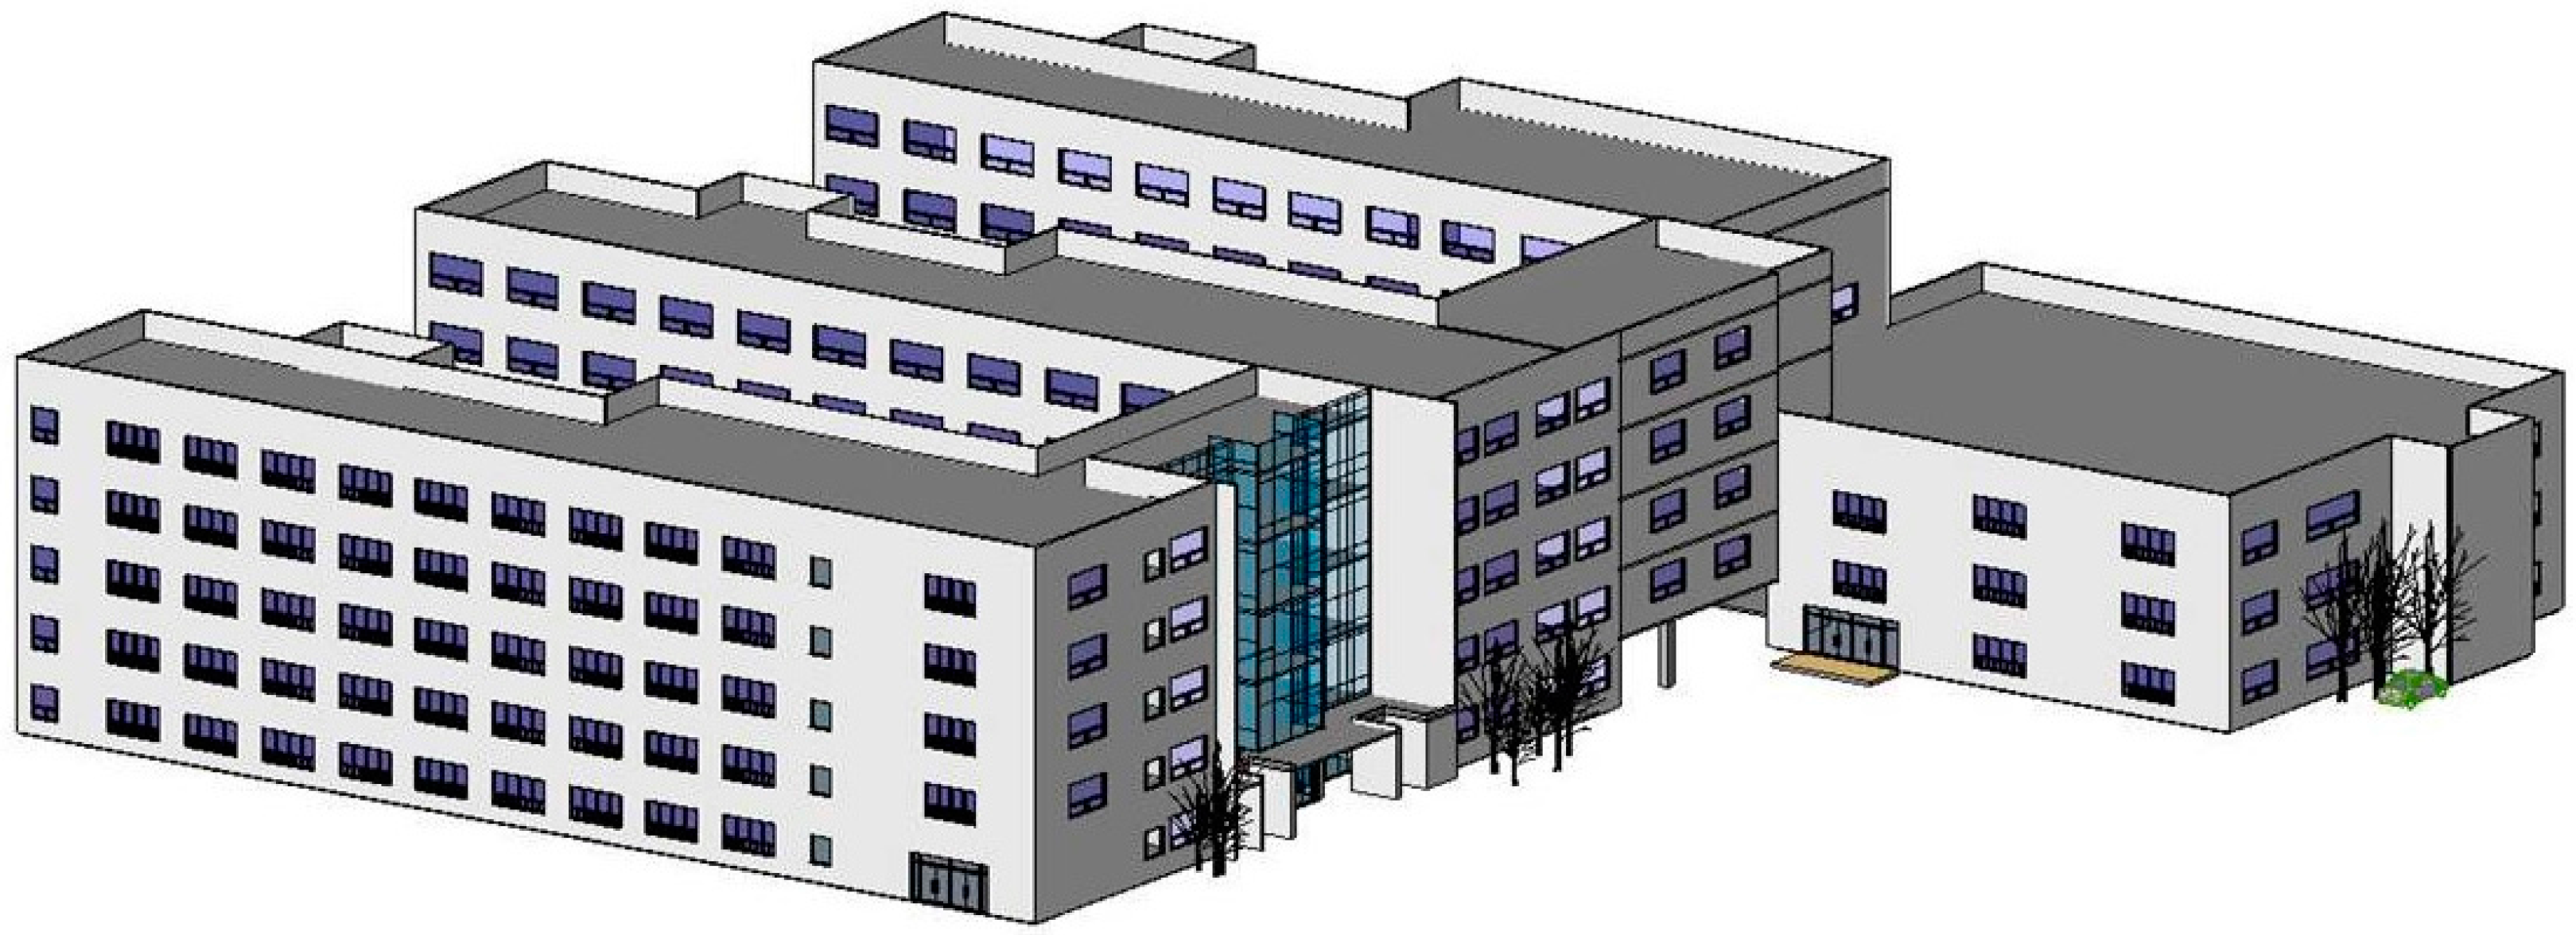
A typical school building plan was also defined from a national survey report [
20], as shown in
Figure 2. Here, averaged floor area per classroom and window ratio are specified.
In Korea, the weather conditions over the nation are similar, and each province has followed regional energy regulations that vary according to weather conditions. For instance, a higher insulation level is mandated for cold regions. This can justify developing an identical load pattern over all the regions. Since a school consists of various room types—classrooms, offices, gymnasium, restrooms, and so on—a detailed simulation including all the room types with weighted area is required. Using the survey study [
20], a number of parameter groups that describe various building thermal performances are prepared to run TRNSYS simulations. The calculated loads were statistically calibrated and averaged, and then a final unit load profile was deduced.
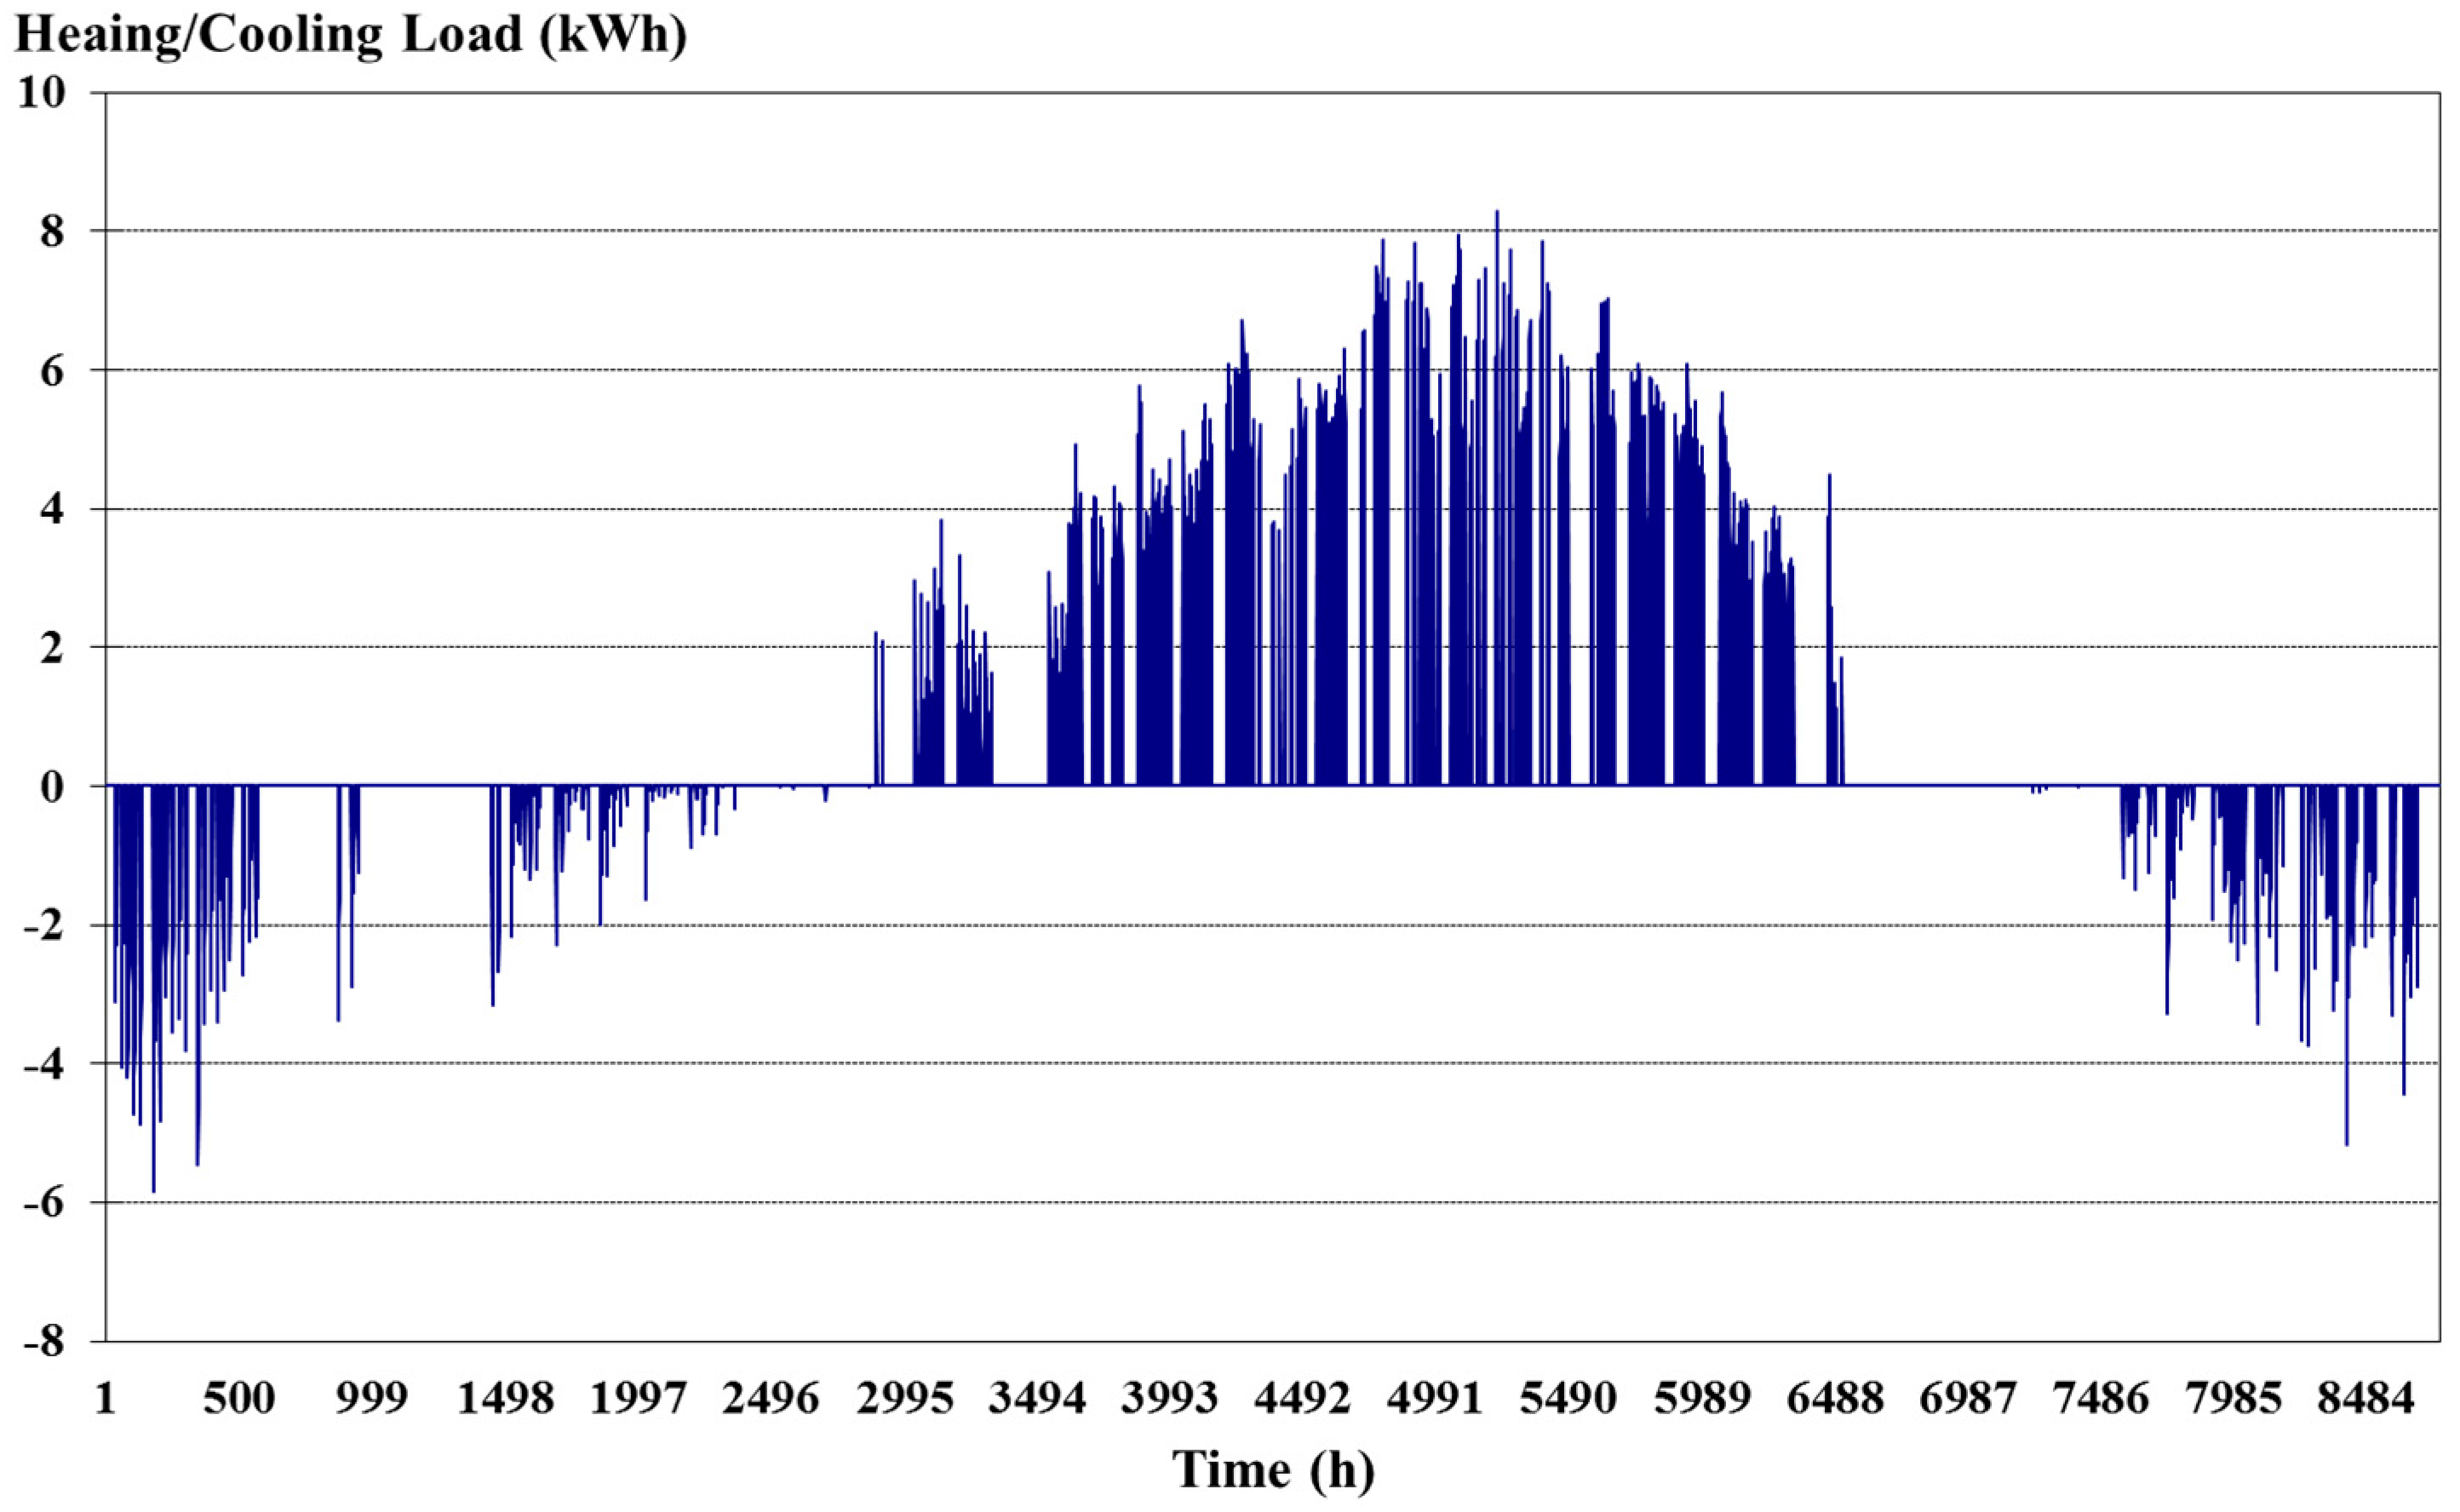
Thus, heating and cooling loads are 12 and 63 kWh/m
2, respectively, for one classroom. The corresponding peak loads are 5.84 and 8.29 kWh, as shown in
Figure 3.
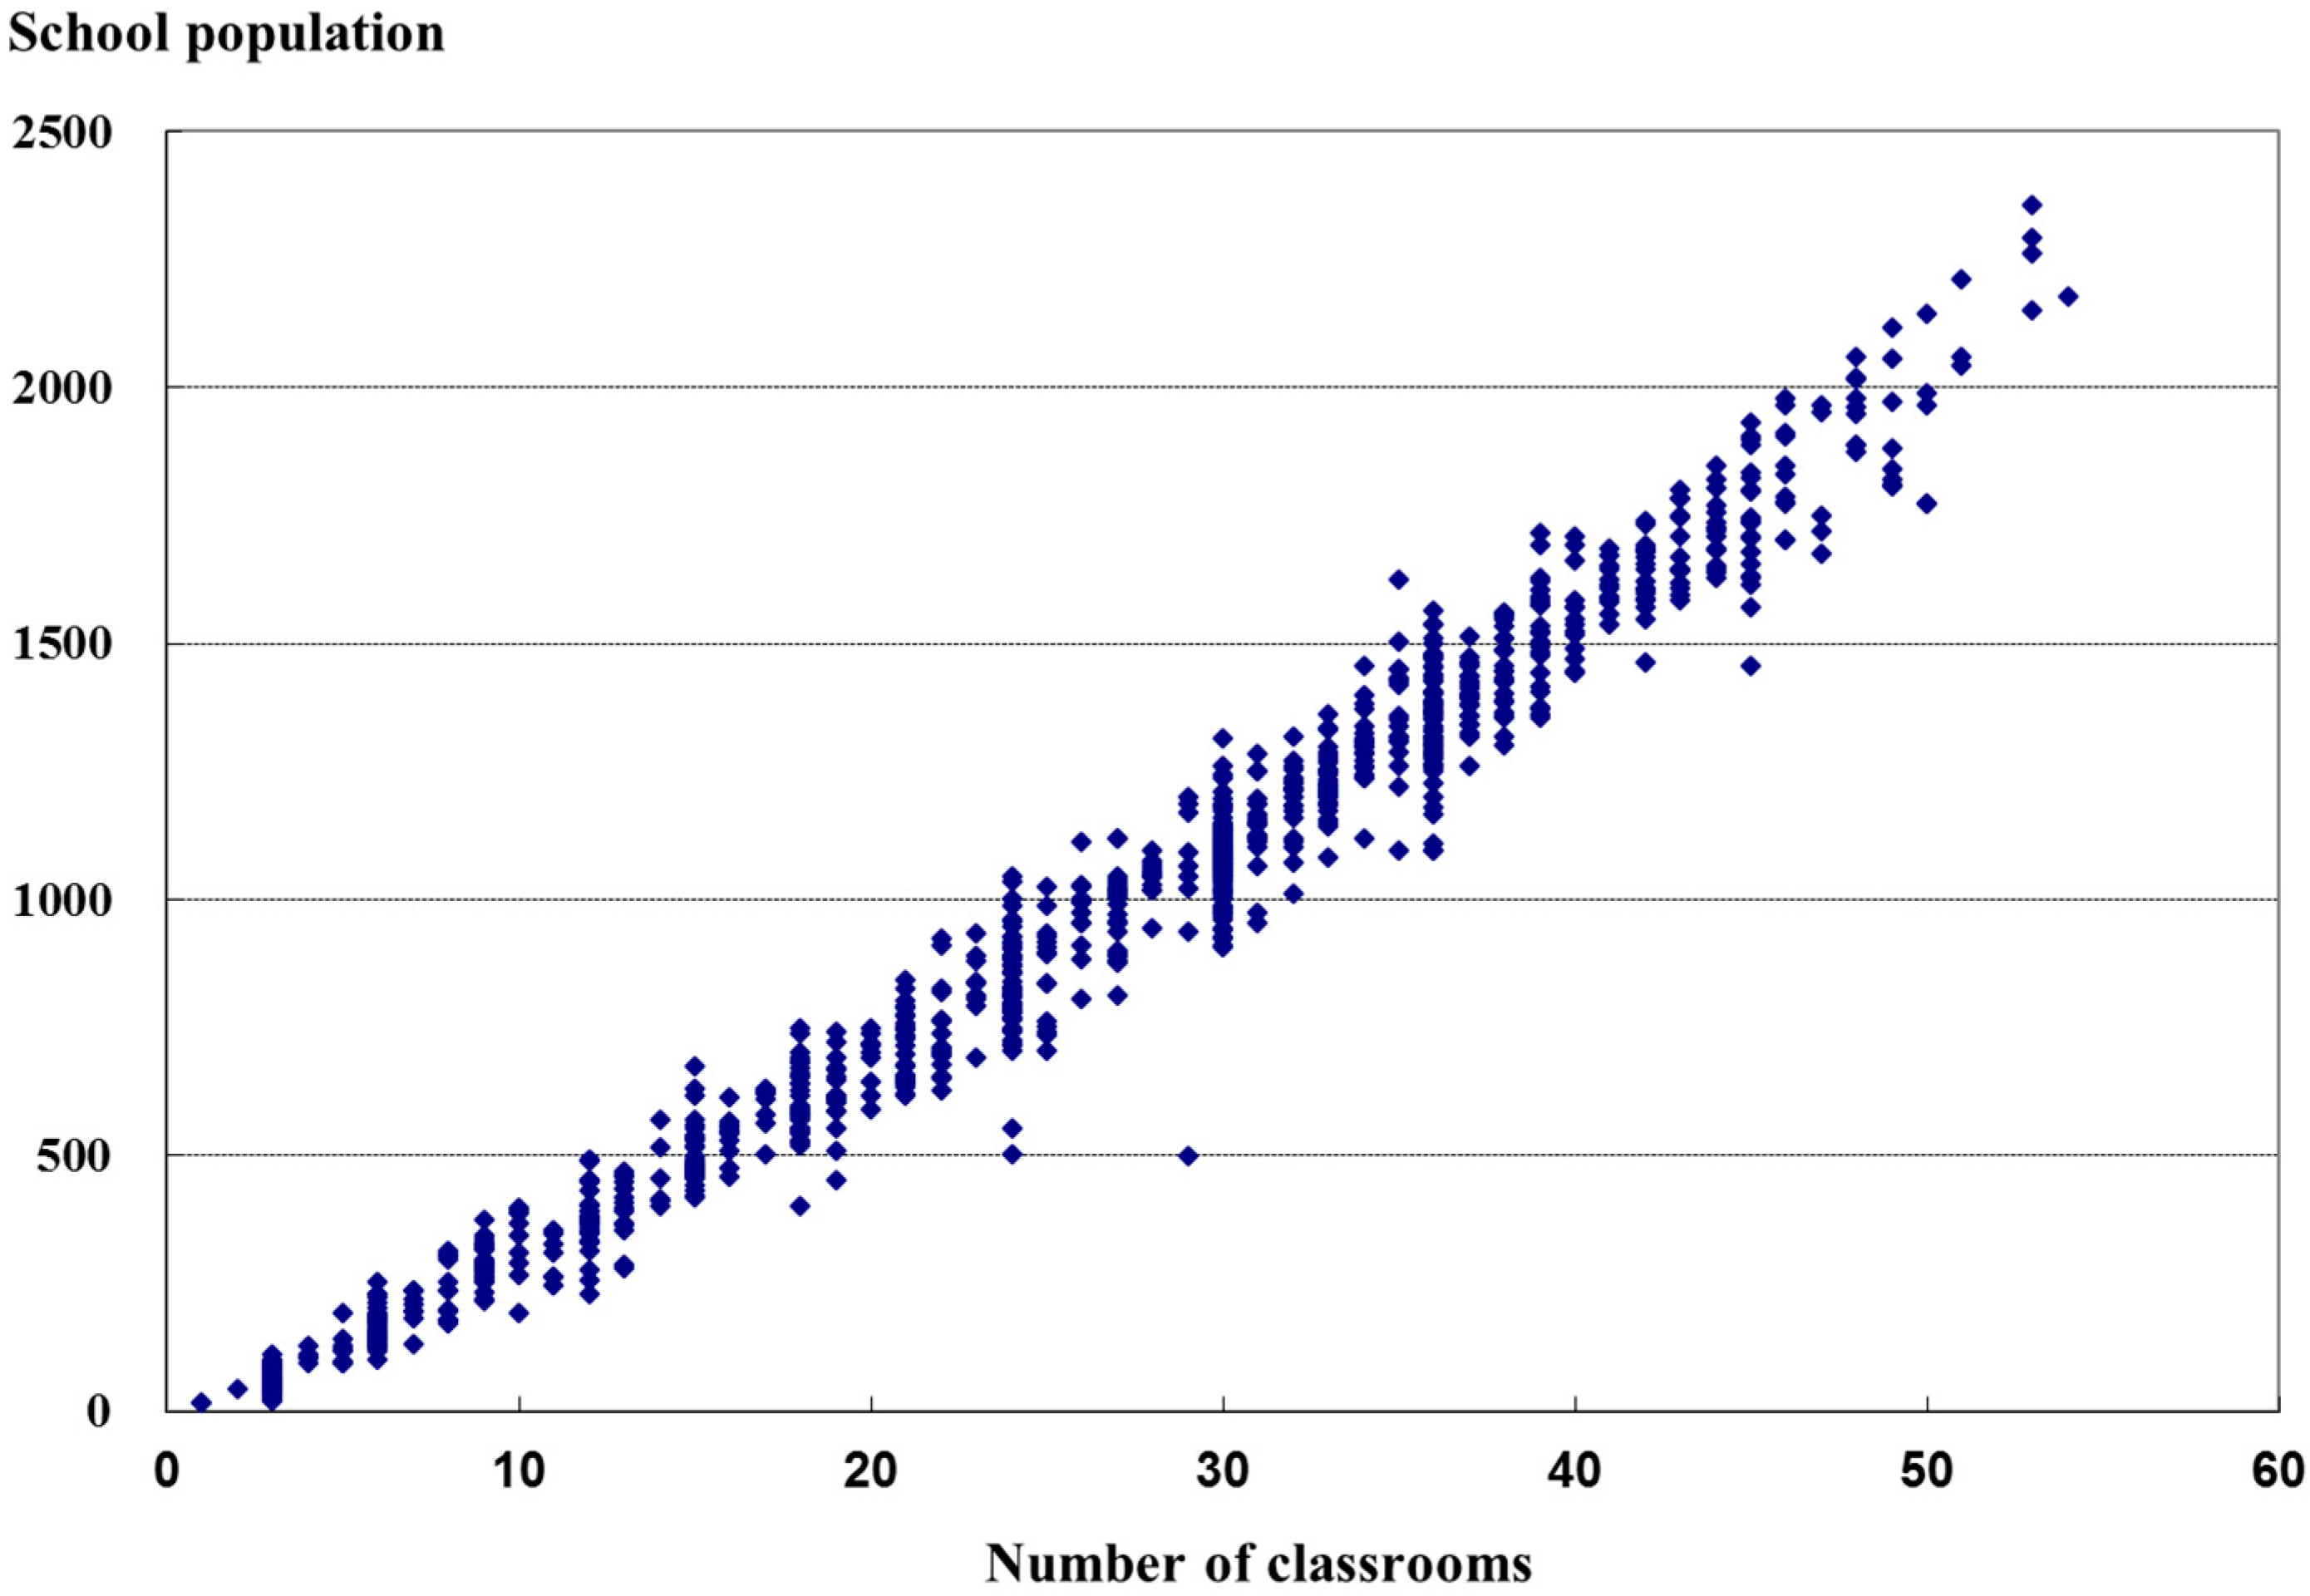
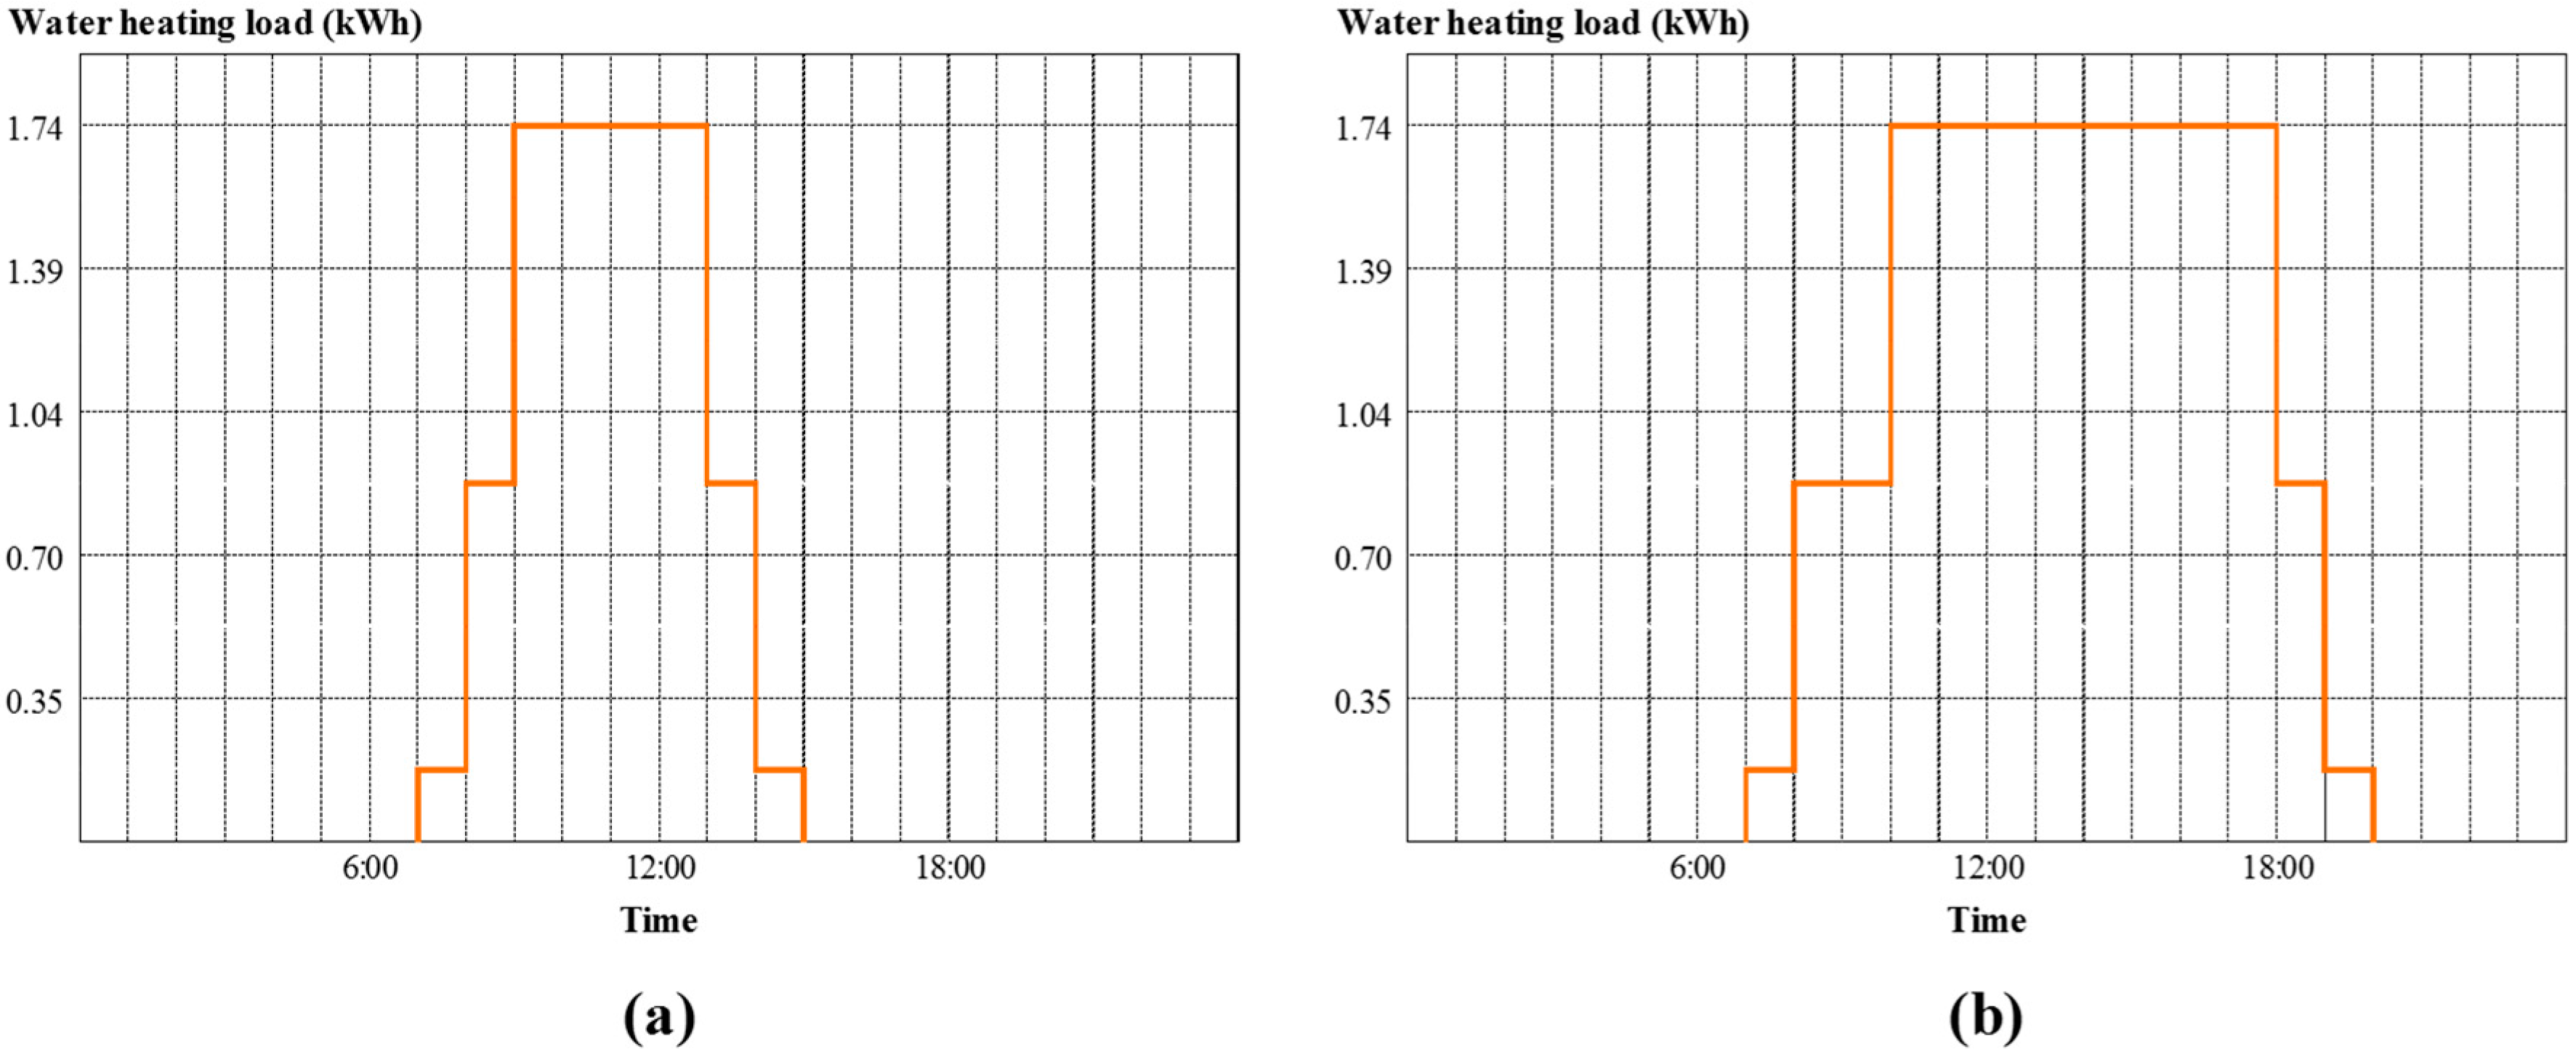
The water-heating load for schools can be separated into two categories: one required for cooking, washing, and cleaning the cafeteria and the other for use in bathrooms. The cafeteria is responsible for over 90% of the hot water use. The hot-water load in the cafeteria proportionally increases with the number of people in the building. If the number of people can be estimated and the daily hot water consumption of each user can be set, the total amount of hot water needed for all the users can be calculated. This can also be obtained from a statistical survey.
Figure 4 shows the number of students and faculty according to the number of classrooms in Korea.
The survey on school facilities [
19] revealed that high schools provide meals either for lunch only or for both lunch and dinner. This is because some schools require mandatory supplementary education after normal school hours, whereas others leave the decision to the students. Most students and faculty members therefore ask for lunch but not always for dinner. Schools with mandatory supplementary education prepare dinner for all students; other schools with no mandatory education provide dinner to only those students that choose to remain. In most schools, the boilers in the cafeterias are used from 7:00 a.m. to 7:00 p.m. On the basis of the survey data, the water heating load can be calculated by the water heating profile, which is shown in
Figure 5. The hot water requirement per classroom is 8.34 kWh/day at 50 °C, and a classroom has about 29 students.
These representative thermal loads per unit classroom will be used in optimization procedures at different energy demand scales. From this approach, the total load profile for a target school can be easily calculated by simply setting the number of classrooms.
4. Calculation of Component Models for Optimization Process
The performance evaluation of a solar water heating system (SWHS) is complex as the system efficiency changes with solar irradiance and climate conditions such as outdoor air temperatures, wind speed, and relative humidity. In this study, a simple calculation module for SWHSs was required for fast performance evaluation as it will be used in the design phase. Evacuated tube solar collectors commonly used in schools in Korea were selected.
Energy collected by the collectors can be calculated by the following equation [
21]:
where
FR(τα) and
FRUL are performance factors, and these values can be obtained from thermodynamic experimental results of the tested collector. Typically, the evacuated tube solar collector has 0.58 and 0.7 W/m
2·°C for
FR(τα) and
FRUL, respectively. These values agree with those of the Fournelle evacuated tubes [
22].
With the collectors, solar radiation is partially reflected from the glass. When the incidence angle increases, reflection increases. In the initial phase of performance evaluation, there is no need for detailed modeling of this phenomenon. The average reflection from the collectors is about 5% of the total incident irradiance [
23]. Therefore,
FR(τα) was multiplied by 0.95.
High-temperature water circulates through pipes and tanks in the system. Therefore, if adequate insulation is not provided, heat transfer to the environment will increase. Such heat loss is considered by Equation (2). The energy supplied from the collector (
Qdld) equals the collected energy (
Qcoll) subtracted by
flos, the value expressing the loss ratio. In this study,
flos was set as 0.1.
A PV array model proposed by Evans [
24] was used that considers the module temperature and orientation. In the on-grid case, a direct algorithm based on average efficiency is used. The average efficiency (
ηp) is a function of the average module temperature (
Tc) as shown in Equations (3) and (4).
where
ηr,
NOCT (nominal operating cell temperature), and
βp are set from the catalog information of the selected PV module. In this study,
ηr was 0.13,
βp was 0.004, and
Tc was 25 °C.
The energy generated by the PV array (
Ep) can be simply calculated as Equation (5).
This value is reduced by the PV system efficiency (
ηsys) related to power conditioning, array, inverter, and grid, all of which account for system operation loss.
S is the area of a PV module, 8.7 m
2, and
ηsys is 0.89.
When the GHP system is operated by a cooling cycle, the total amount of energy transmitted to the ground equals the heat extracted from the load side plus the energy input by the heat pump. During heating, the energy extracted from the ground plus the power consumed in the system are supplied to indoor space. The EHP has the same process, except that the heat source or sink is outdoor air. The coefficient of performance (
COP) of both systems can be expressed as Equation (7), where
Q is the heat transfer rate on the load side for both heating and cooling.
The power consumed by the GHP system includes the power of compressor and circulation pump. The COP changes with inlet fluid temperature for both GHP and EHP. For simplicity, the COP values were fixed as constants obtained from annual average values measured by a heat pump company.
The initial purpose of optimization is to identify the optimal combinations of REHS components under given budgets and numbers of classrooms. To obtain feasible results of cost-benefit evaluation for various combinations of REHS, a thermal load model and energy system models were used as mentioned earlier.
Energy cost assessments were carried out for various cases, each of which was made by several combinations of REHS components under a given budget and demand scale (number of classrooms). The optimal combination of REHS components was selected by the criterion of the lowest energy running cost (i.e., cost of gas for the boiler and electricity from the grid). Here, only the running cost was taken into account as the capital cost was fixed by the budget for all the combinations. This iterative assessment module was implemented using a MATLAB-based program.
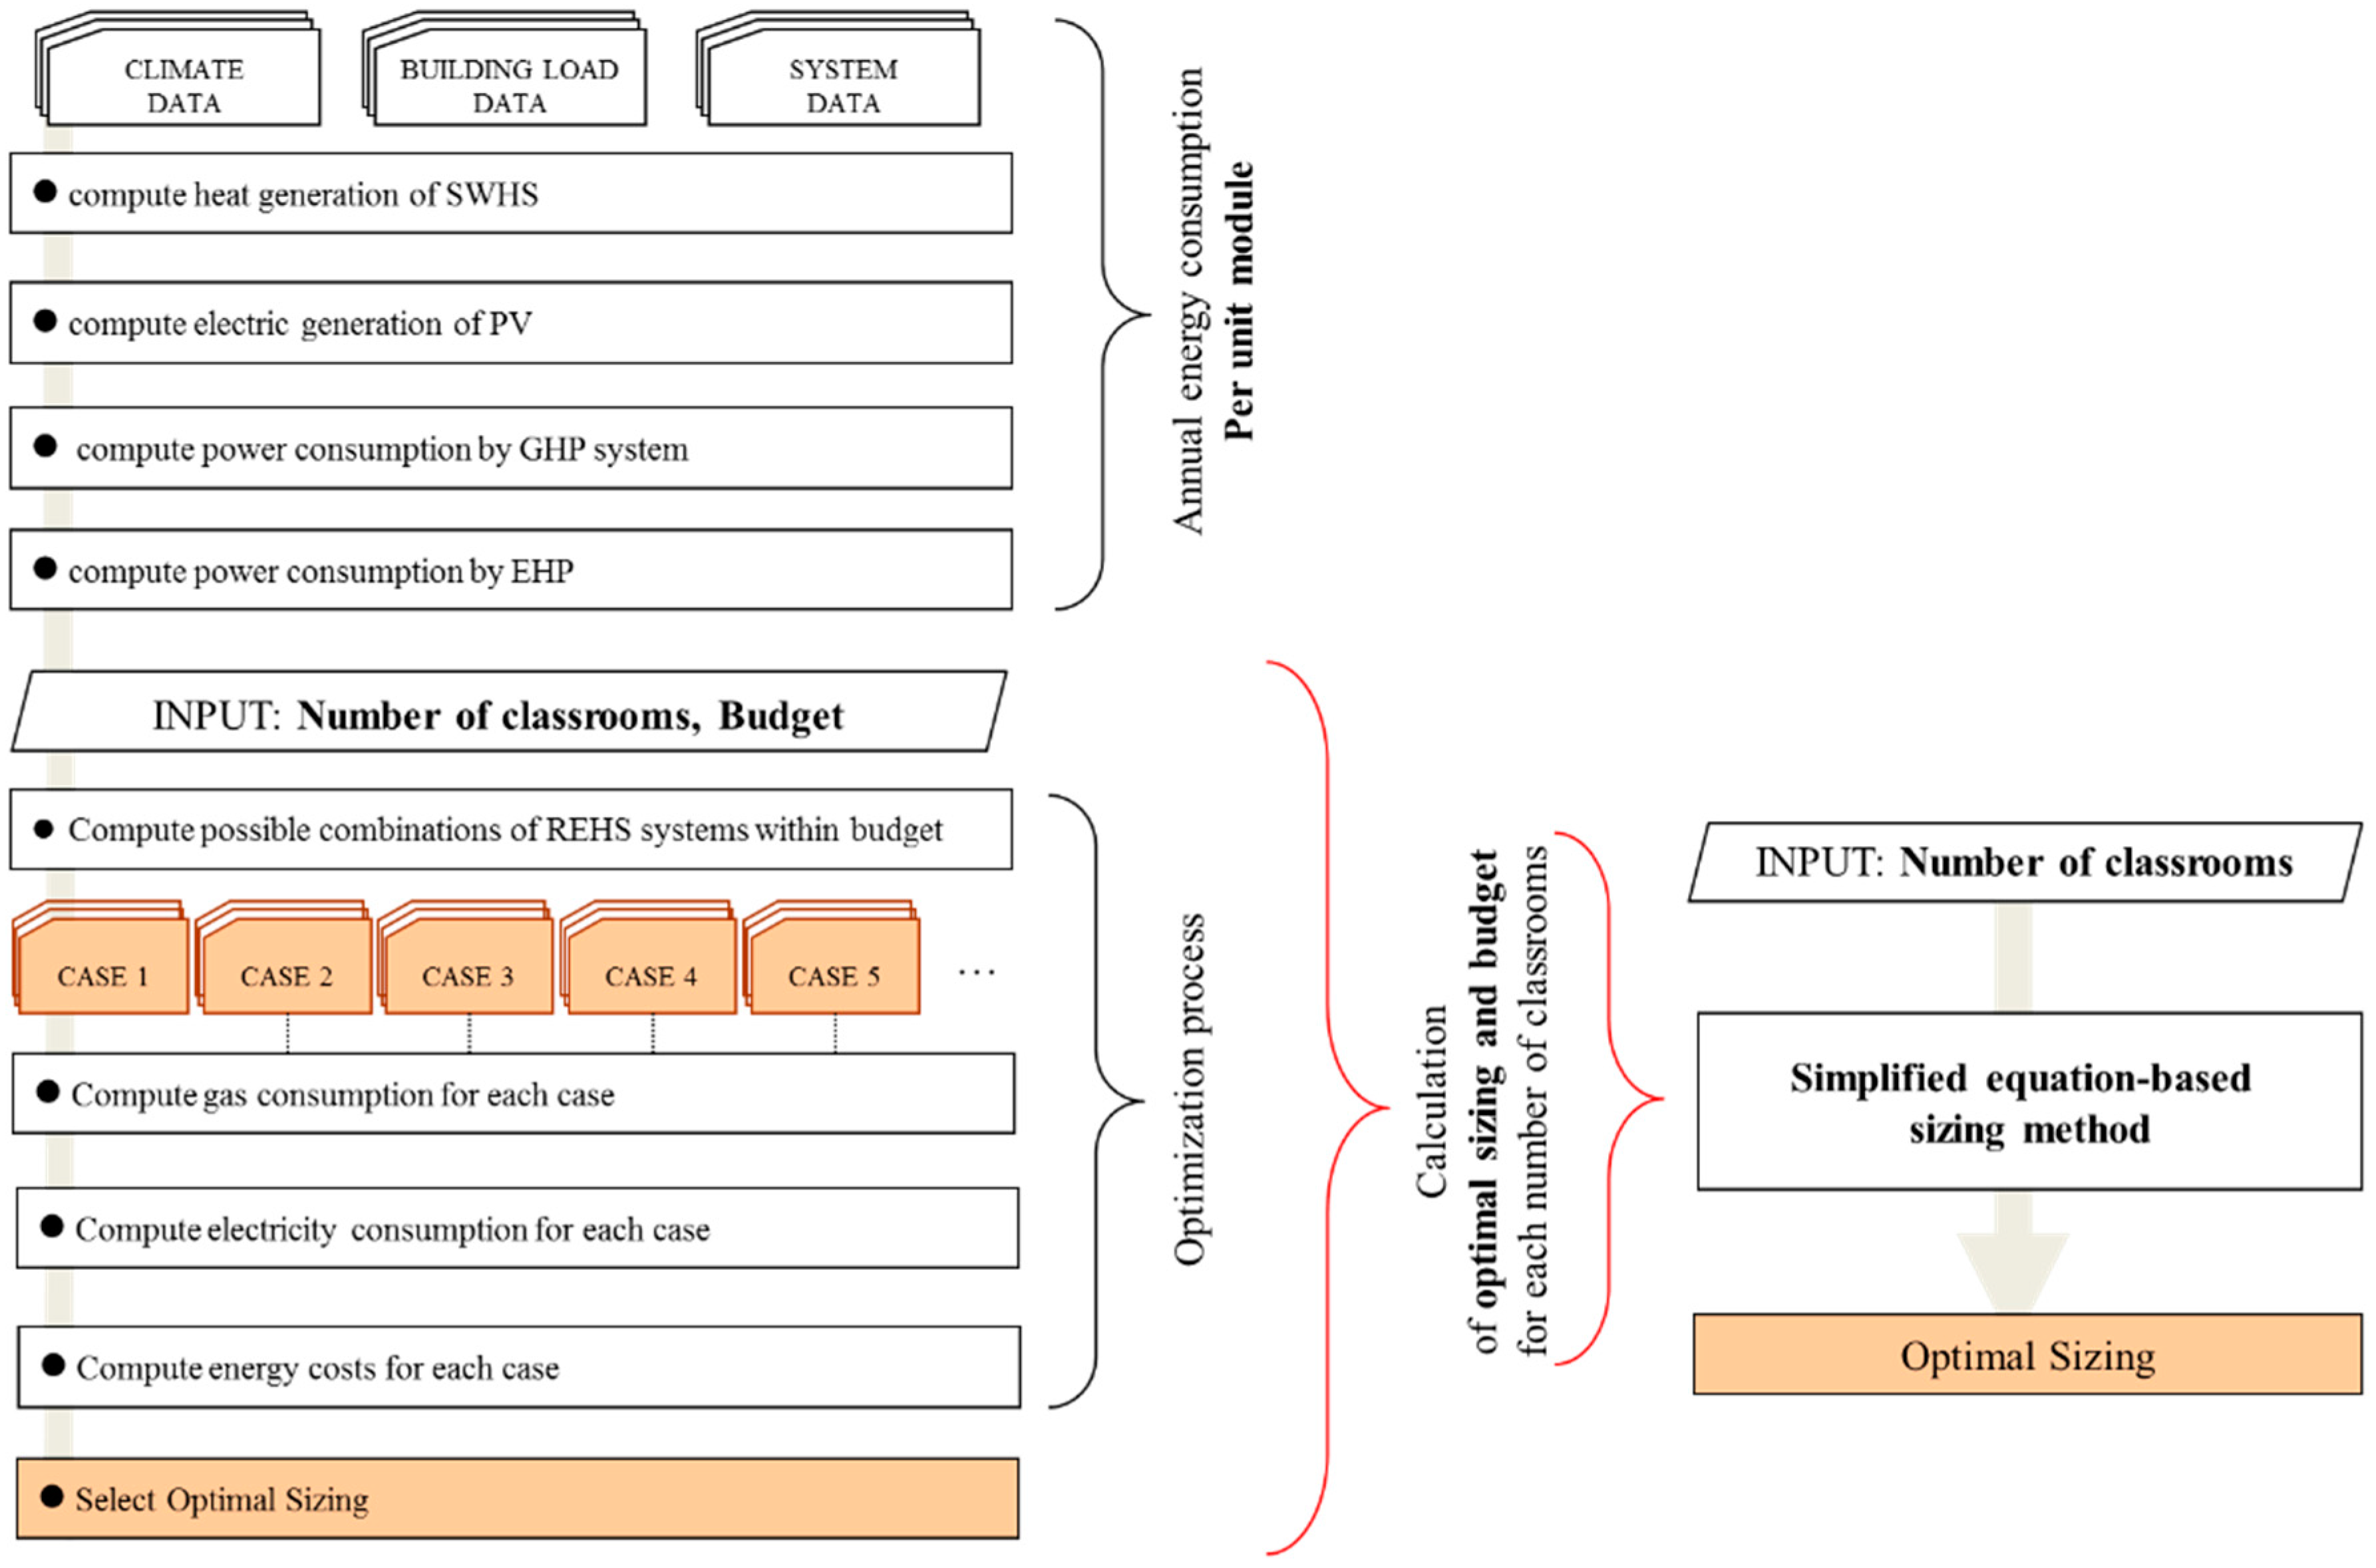
The initial optimization process is summarized in
Figure 6a. This process requires a large amount of computational time as a large number of simulations for possible REHS combinations have to be run. Therefore, in the following section, a simplified method that calculates the optimal sizing of the REHS components is proposed (
Figure 6b).
5. Simplified Sizing Method
5.1. Definition of Unit Components
The unit components for the calculation of the REHS were defined as a 2 m2 module for SWHS, 1 kWp for PV, and 11 kW for GHP. This selection was based on the exiting installation cases. For example, an 11 kW heat pump typically covers a single classroom and a multi-type heat pump with a capacity of 55 kW is generally installed for five classrooms in Korea. In Korea, where weather conditions are almost similar over the whole country, the unit components represent some amount of energy. An annual useful energy gain by SWHS with 2 m2 is 1278 kWh, with 52.8% collector efficiency. Power generation from a 1 kWp photovoltaic system of a single crystal silica material with 13% efficiency was shown to be 1136.42 kWh. This represents approximately 10.8% system efficiency. These were calculated from Equations (1)–(6).
The installation costs of each of the renewable energy sources applied in this study are posted annually by the Korean Energy Management Corporation (KEMCO), as listed in
Table 1. The data for the year 2010 were used in this study.
Electricity charge is composed of the basic rate and the power rate.
Table 2 gives the electricity charge for educational buildings. The monthly electricity charge is calculated by peak load (kW) × basic rate + consumption (kWh) × power rate. These rates are only applicable to educational facilities because the price level is much cheaper than other buildings. Survey results showed that in all schools, high tension rates were applied.
Gas charges used in this study are given in
Table 3. Gas charges change on an irregular basis and differ from region to region. Even if the fees in the Seoul region are used as a reference, different companies manage different city zones and the fees differ according to companies. Therefore, the average value was applied in this study and the heat generation from gas was assumed to be 10,550 kcal/Nm³. Gas charges were separated into those for cooking and for heating/cooling.
5.2. Optimal Sizing Calculation Based on Budget and Number of Classrooms
The initial optimization process in
Figure 6 can be used for developing a simplified sizing method. To study optimal sizing patterns, the number of classrooms and the budgets range from 10 to 40 and from 0.1 to 0.5 million dollars, respectively. Thus, the total number of cases simulated within these ranges was more than 5000. For each case, a number of simulations were run, as there are several possible combinations for an REHS.
Figure 7,
Figure 8 and
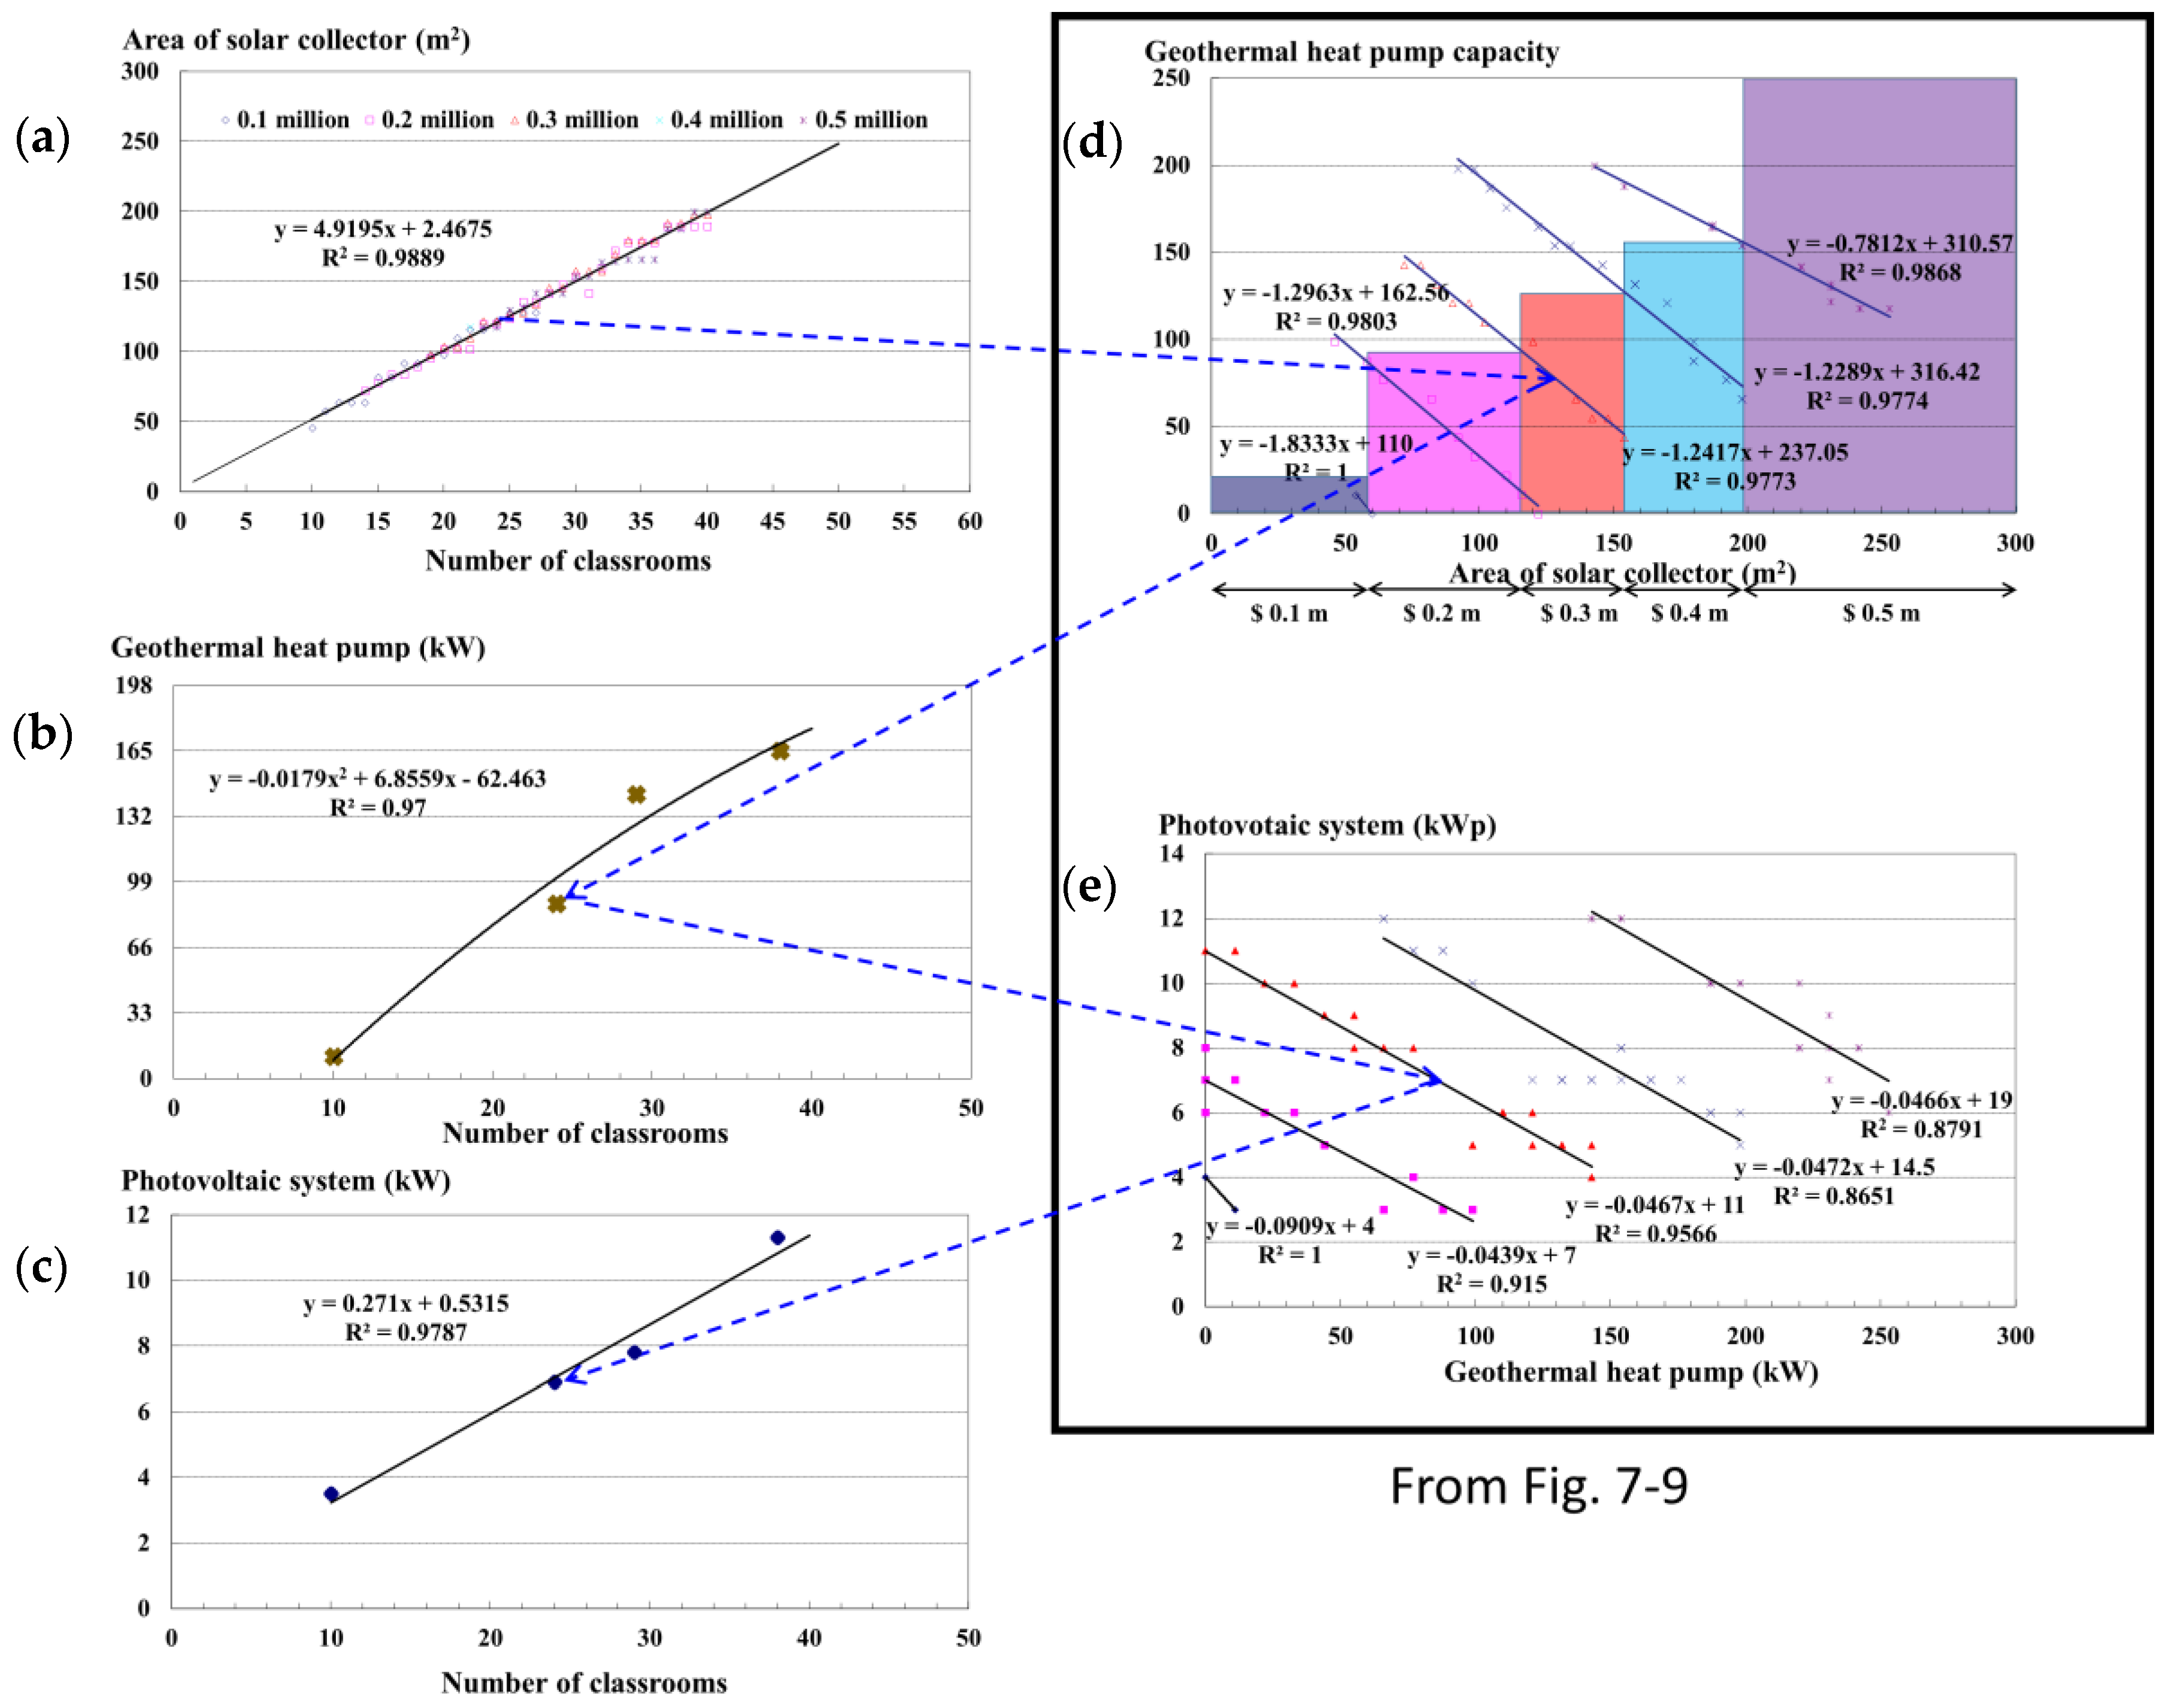
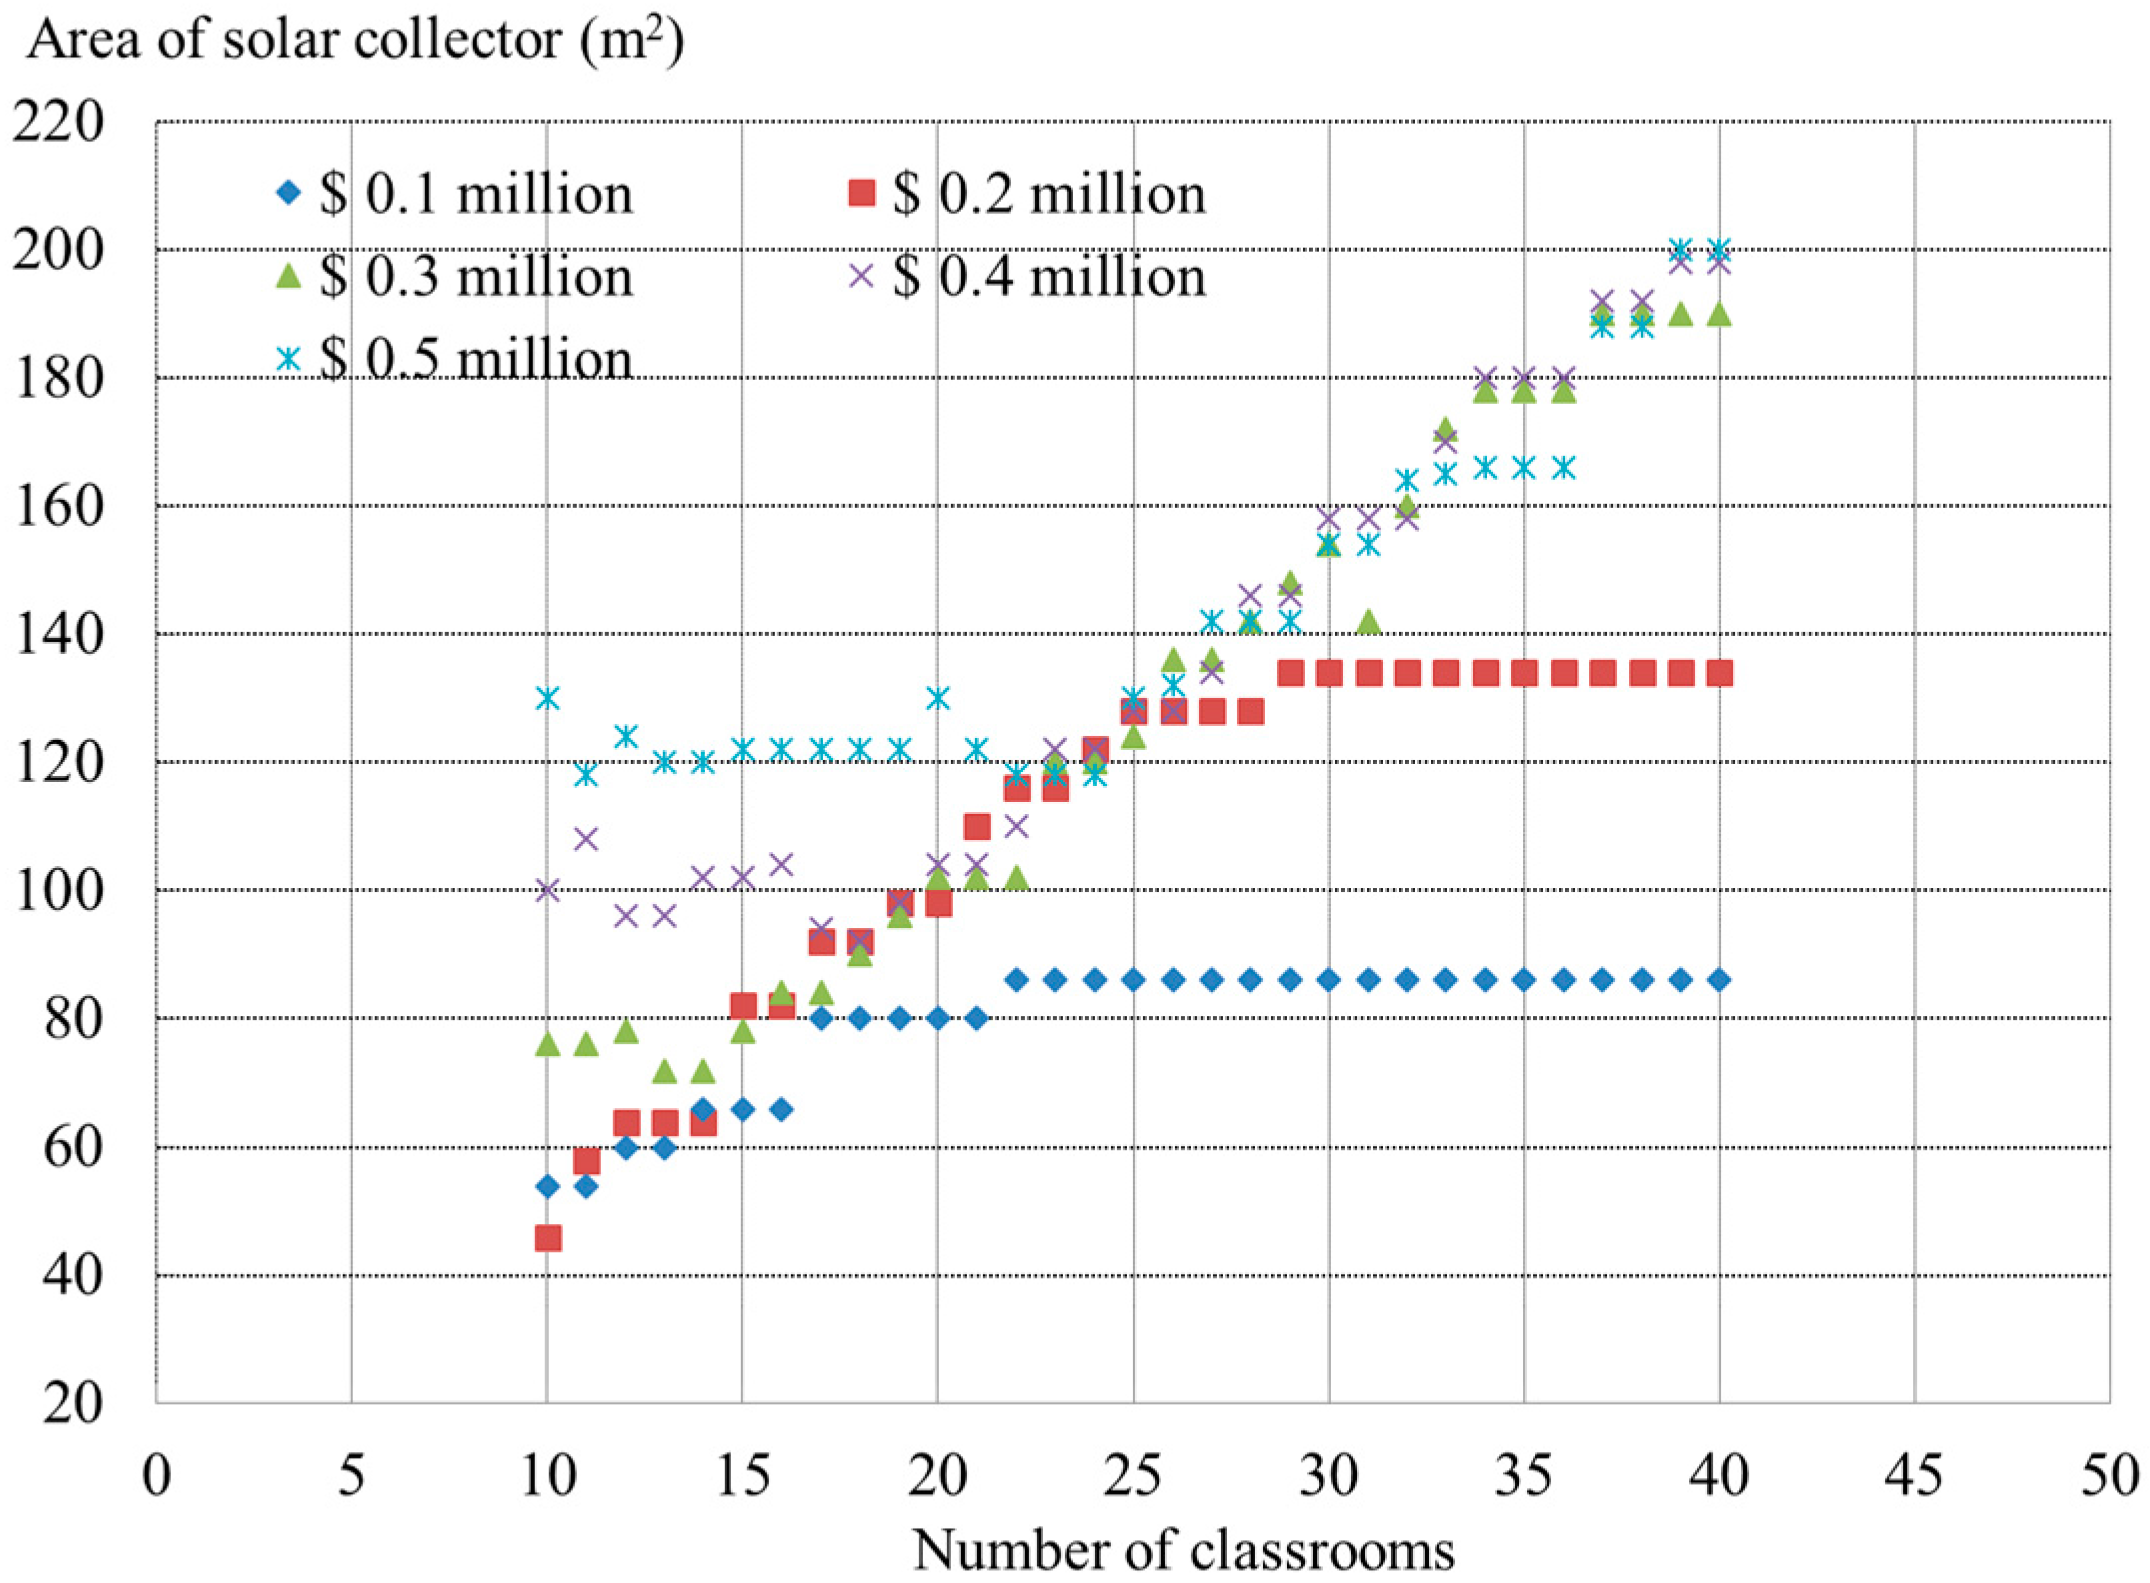
Figure 9 show capacities of each component of REHS calculated using the initial optimization process. Since the three figures were obtained in a single process, they are related to one another. Above all,
Figure 7 shows the optimal areas for solar collectors of the SWHS. With a sufficient budget, the optimal collector area increases with the number of classrooms. However, if the budget is inadequate (see the $0.1 million case in the figure), the possible area is limited by the budget. On the other hand, an excessive budget can result in unnecessary installation of solar collectors. For instance, the $0.5 million case for 10 to 20 classrooms shows 100% covering by SWHS without gas consumption. Here, in fact, further reduction in gas consumption is very small but the generation of excess heat is important. From the results, it is supposed that an optimal budget exists for each of the number of classrooms.
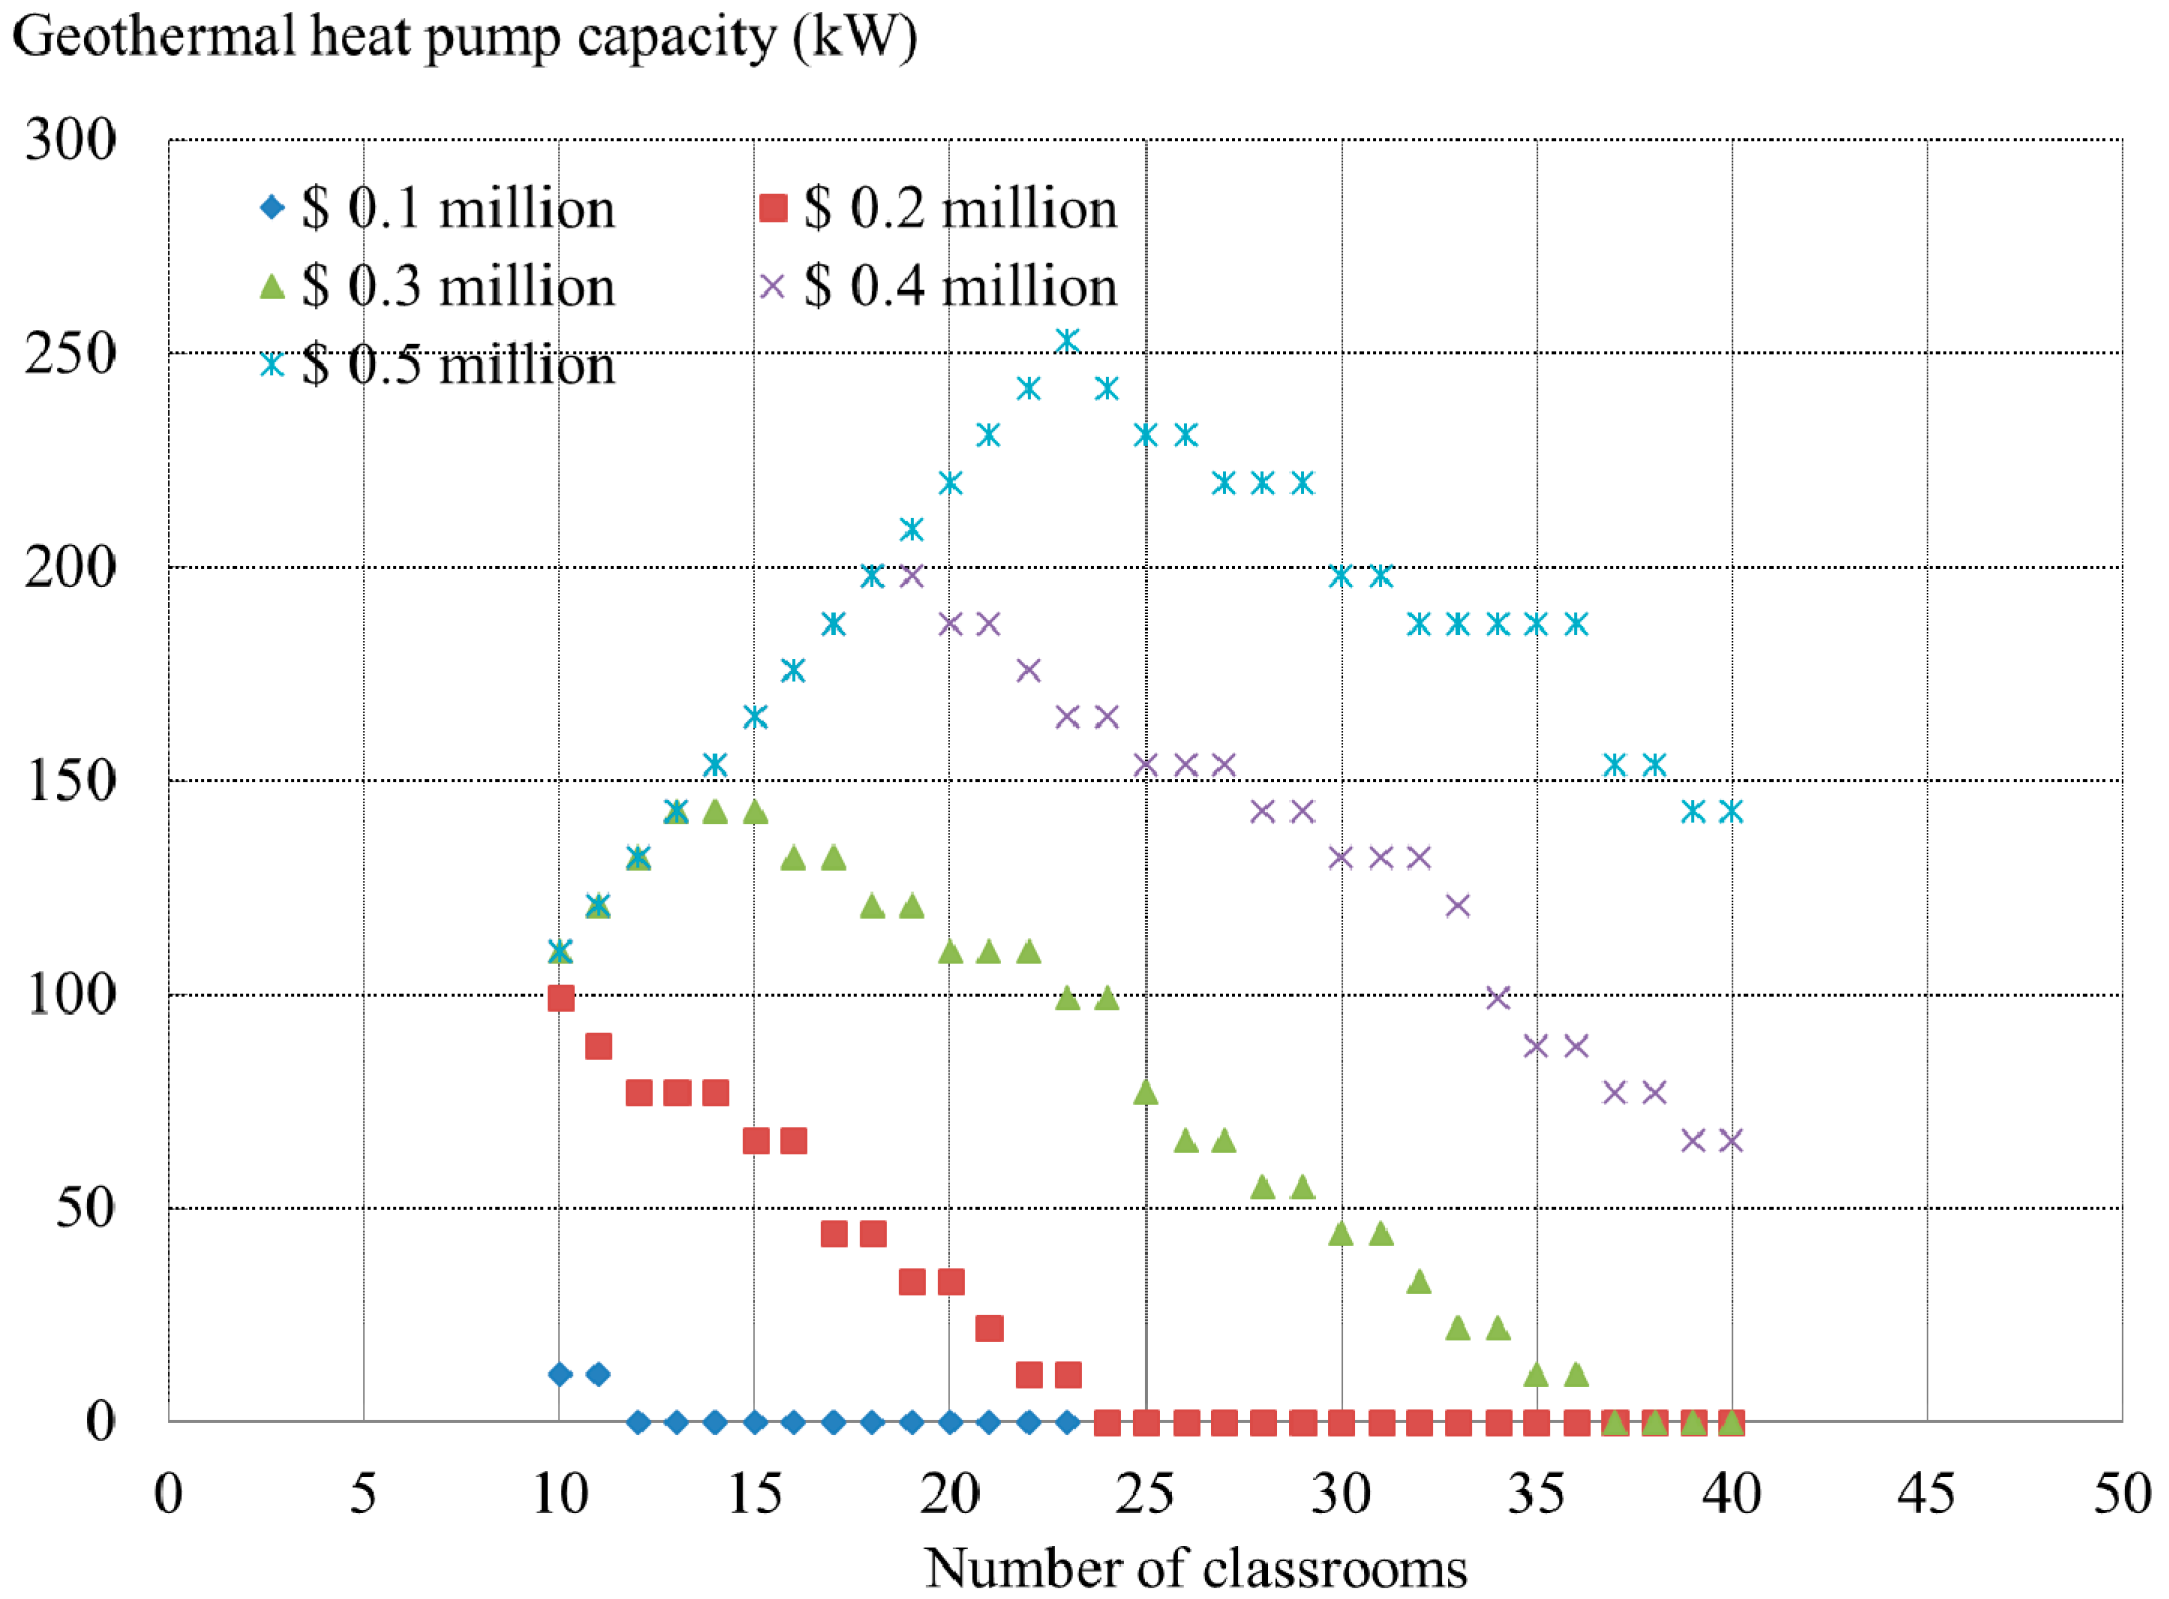
The optimal sizing of the GHP system is shown in
Figure 8. The pattern is different from the solar collector case. For each budget, the system capacity decreases as the number of classrooms increases. When the number of classrooms and the consequent load increases, an investment in other RE systems is preferred instead of further GHP installation. This is because the gas rate is more expensive than the electricity rate for education facilities in Korea. Thus, an investment that reduces gas boiler operations is a better solution for reducing running costs.
In addition, similar to the solar collector cases, in cases of excess budgets, for example, the $0.5 million case for 10–23 classrooms, the points must be removed because the budget is far more than an optimal investment.
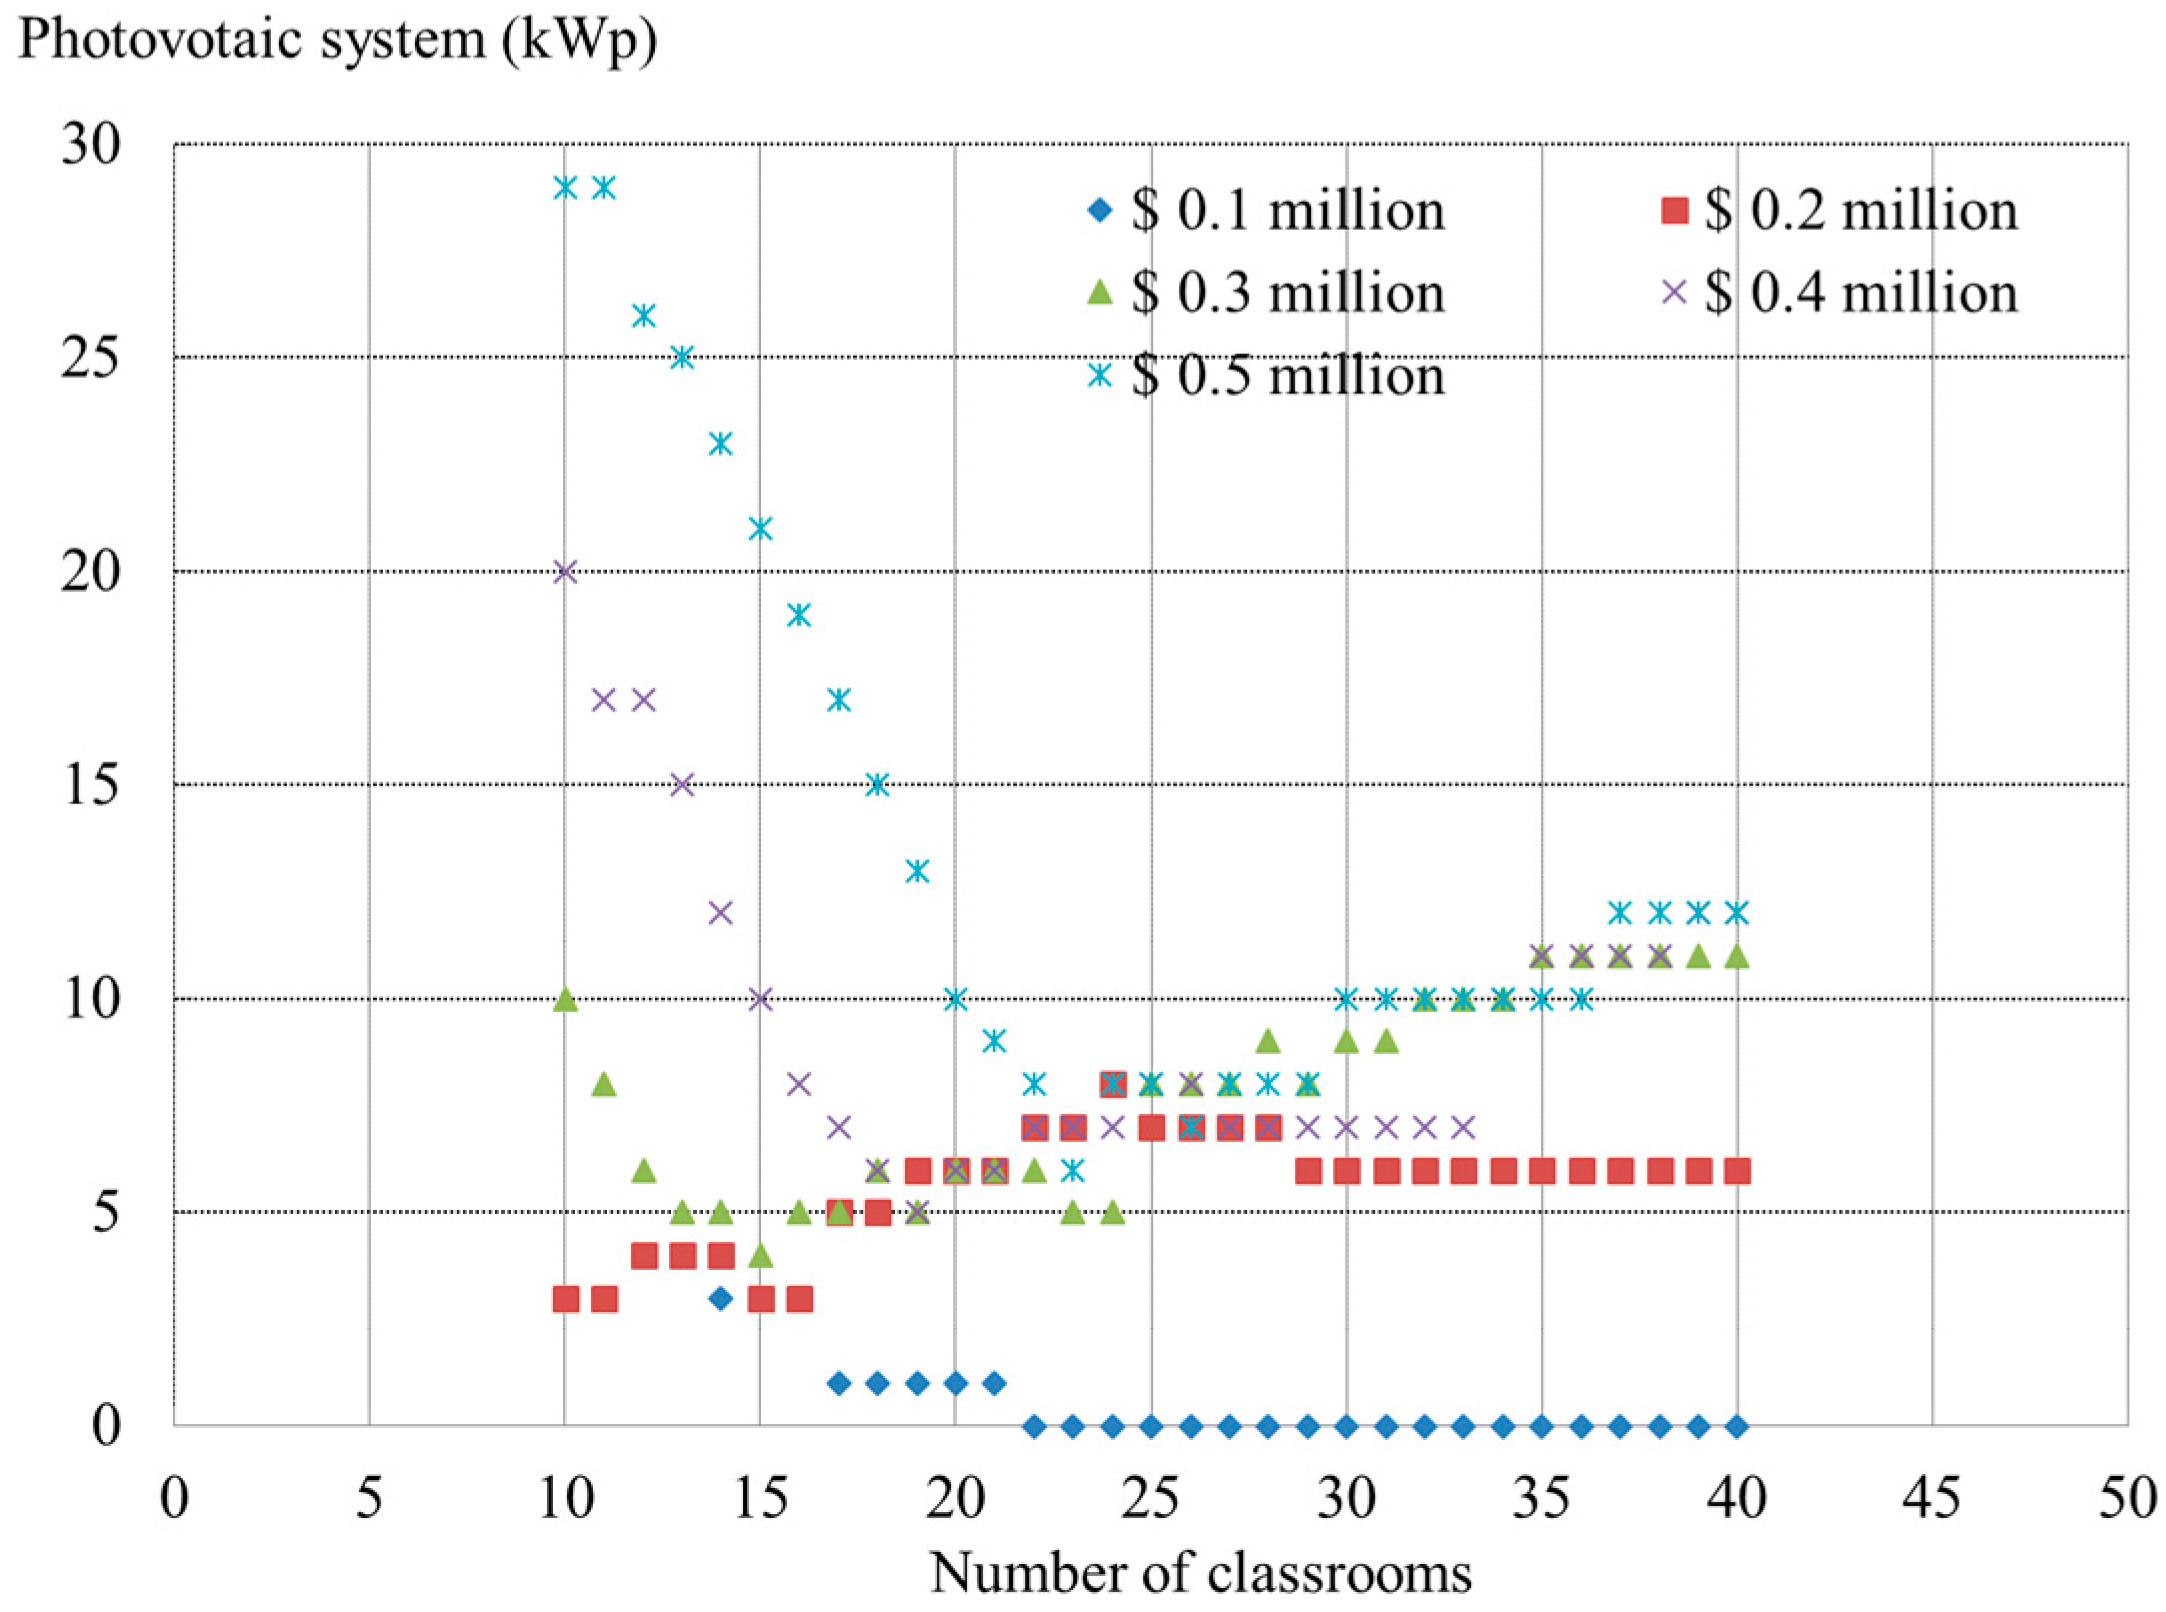
Finally,
Figure 9 shows the PV cases. Results are very similar to the solar collector case, but a reduction in gas consumption is always a high priority. For example, in the $0.1 million case, when the budget is limited, the capacities of solar collectors increase continually while the PV capacities decrease. Similarly, an excess budget leads to an odd pattern. Here, the excess budget is used to generate electricity (e.g., see the $0.5 million case for 10–20 classrooms).
5.3. Proposed Simplified Method
Excluding the excess- and insufficient-budget cases in
Figure 7, the optimal capacities of solar collectors for SWHS corresponding to the number of classrooms can be plotted as
Figure 10a, which is the same as
Figure 7 excluding odd points. Using a regression function, Equation (8) is deduced for SWHS optimization. Here,
X represents the number of classrooms. Using only the number of classrooms, the SWHS system can be sized without considering the budget in this equation. The capital cost (or budget) of the SWHS can be calculated a posteriori.
The sizing of SWHS is chosen as a starting point for deriving other equations for simple sizing.
Figure 9 shows the process using two additional graphs.
Figure 10d,e are obtained from
Figure 7,
Figure 8 and
Figure 9 by simply superimposing the SWHS, GHP, and PV sizing results via the number of classrooms. Therefore,
Figure 10d indicates optimal results of SWHS and GHP for every budget, and
Figure 10e represents those of GHP and PV cases. Similarly, the odd points are omitted in the figures. Each linear regression line represents the initial budget case with which the initial optimal sizing process was run.
The optimal capacity equations of SWHS and GHP in
Figure 10d show that the SWHS sizing case is inversely proportional to the GHP sizing. In the same way, the PV sizing case is also inversely proportional to the GHP sizing. To derive the other simplified sizing equations, we select four points in the SWHS regression line (
Figure 10a). Each is successively projected into
Figure 10d,e. For example, the SWHS sizing point for 24 classrooms is selected, and a corresponding GHP sizing point is selected in
Figure 10d. In
Figure 10d, the five blocks represent the optimal budget ranges for selecting the appropriate one among the proposed regression equations. The third block from the left indicates that the optimal budget is in the range of $0.3 million. Therefore, the corresponding regression line must be used for obtaining an optimal sizing value for GHP. This selection is logical as the lower-budget line has no values and the higher-budget line seems to represent an oversized case for the range. Following the same procedure for the other three points, another regression curve is obtained as
Figure 10c. The equation is a quadratic function and is given by Equation (9), where
X indicates the number of classrooms.
To obtain the simplified equation for PV system sizing, the four points are re-projected into
Figure 10e (see the arrow for a sample point). Because the case of 24 classrooms was based on the $0.3 million budget in the previous selection for GHP, the point falls into the third regression equation in
Figure 10e. By the same process, we get four points as shown in
Figure 10c. The final simplified sizing equation for the PV system is as follows:
As seen in this procedure, each case with a certain number of classrooms is related to an optimal budget for the three RE subsystems of REHS. Therefore, when the number of classrooms is presented, Equations (7)–(9) can be used to calculate optimal sizing and corresponding capital costs. This is also summarized in the right portion of
Figure 6.
5.4. Verification of the Proposed Simplified Equations
Results from the equations and the initial optimization process are compared. By using the simplified equations, we calculate optimal sizes of the sub-systems for cases with a different number of classrooms.
Table 4 presents the sizing results obtained by the proposed equations. From these capacities calculated for each number of classrooms, the required capital costs are simply obtained, as given in
Table 1. As expected, with an increase in the number of classrooms, the sizes of the systems and the corresponding capital costs also increase. The equations can promptly calculate the sizes, but the sizing results are given in decimals. Designers and engineers may freely convert these values into unit-size-based ones.
To verify the results, the capital costs in
Table 4 and the corresponding numbers of classrooms are inputted to the initial optimization process (see
Figure 6a). The results are presented in
Table 5. The first two columns represent the input values to the initial optimization process. The new sizing results are obtained using the initial optimization process. As designed, the capacities of sub-systems are expressed on a unit-size basis (i.e., SWHS: 2 m
2, PV: 1 kWp, and GHP: 11 kW). Therefore, the sizes are not exactly the same as the ones obtained by the simplified equations. When interpreting sizes in
Table 4 on unit basis, the values in
Table 4 may match the ones in
Table 5. However, without such an interpretation, both values are very close, and the total capital costs are very similar for both approaches, showing less than 2% error for all cases.
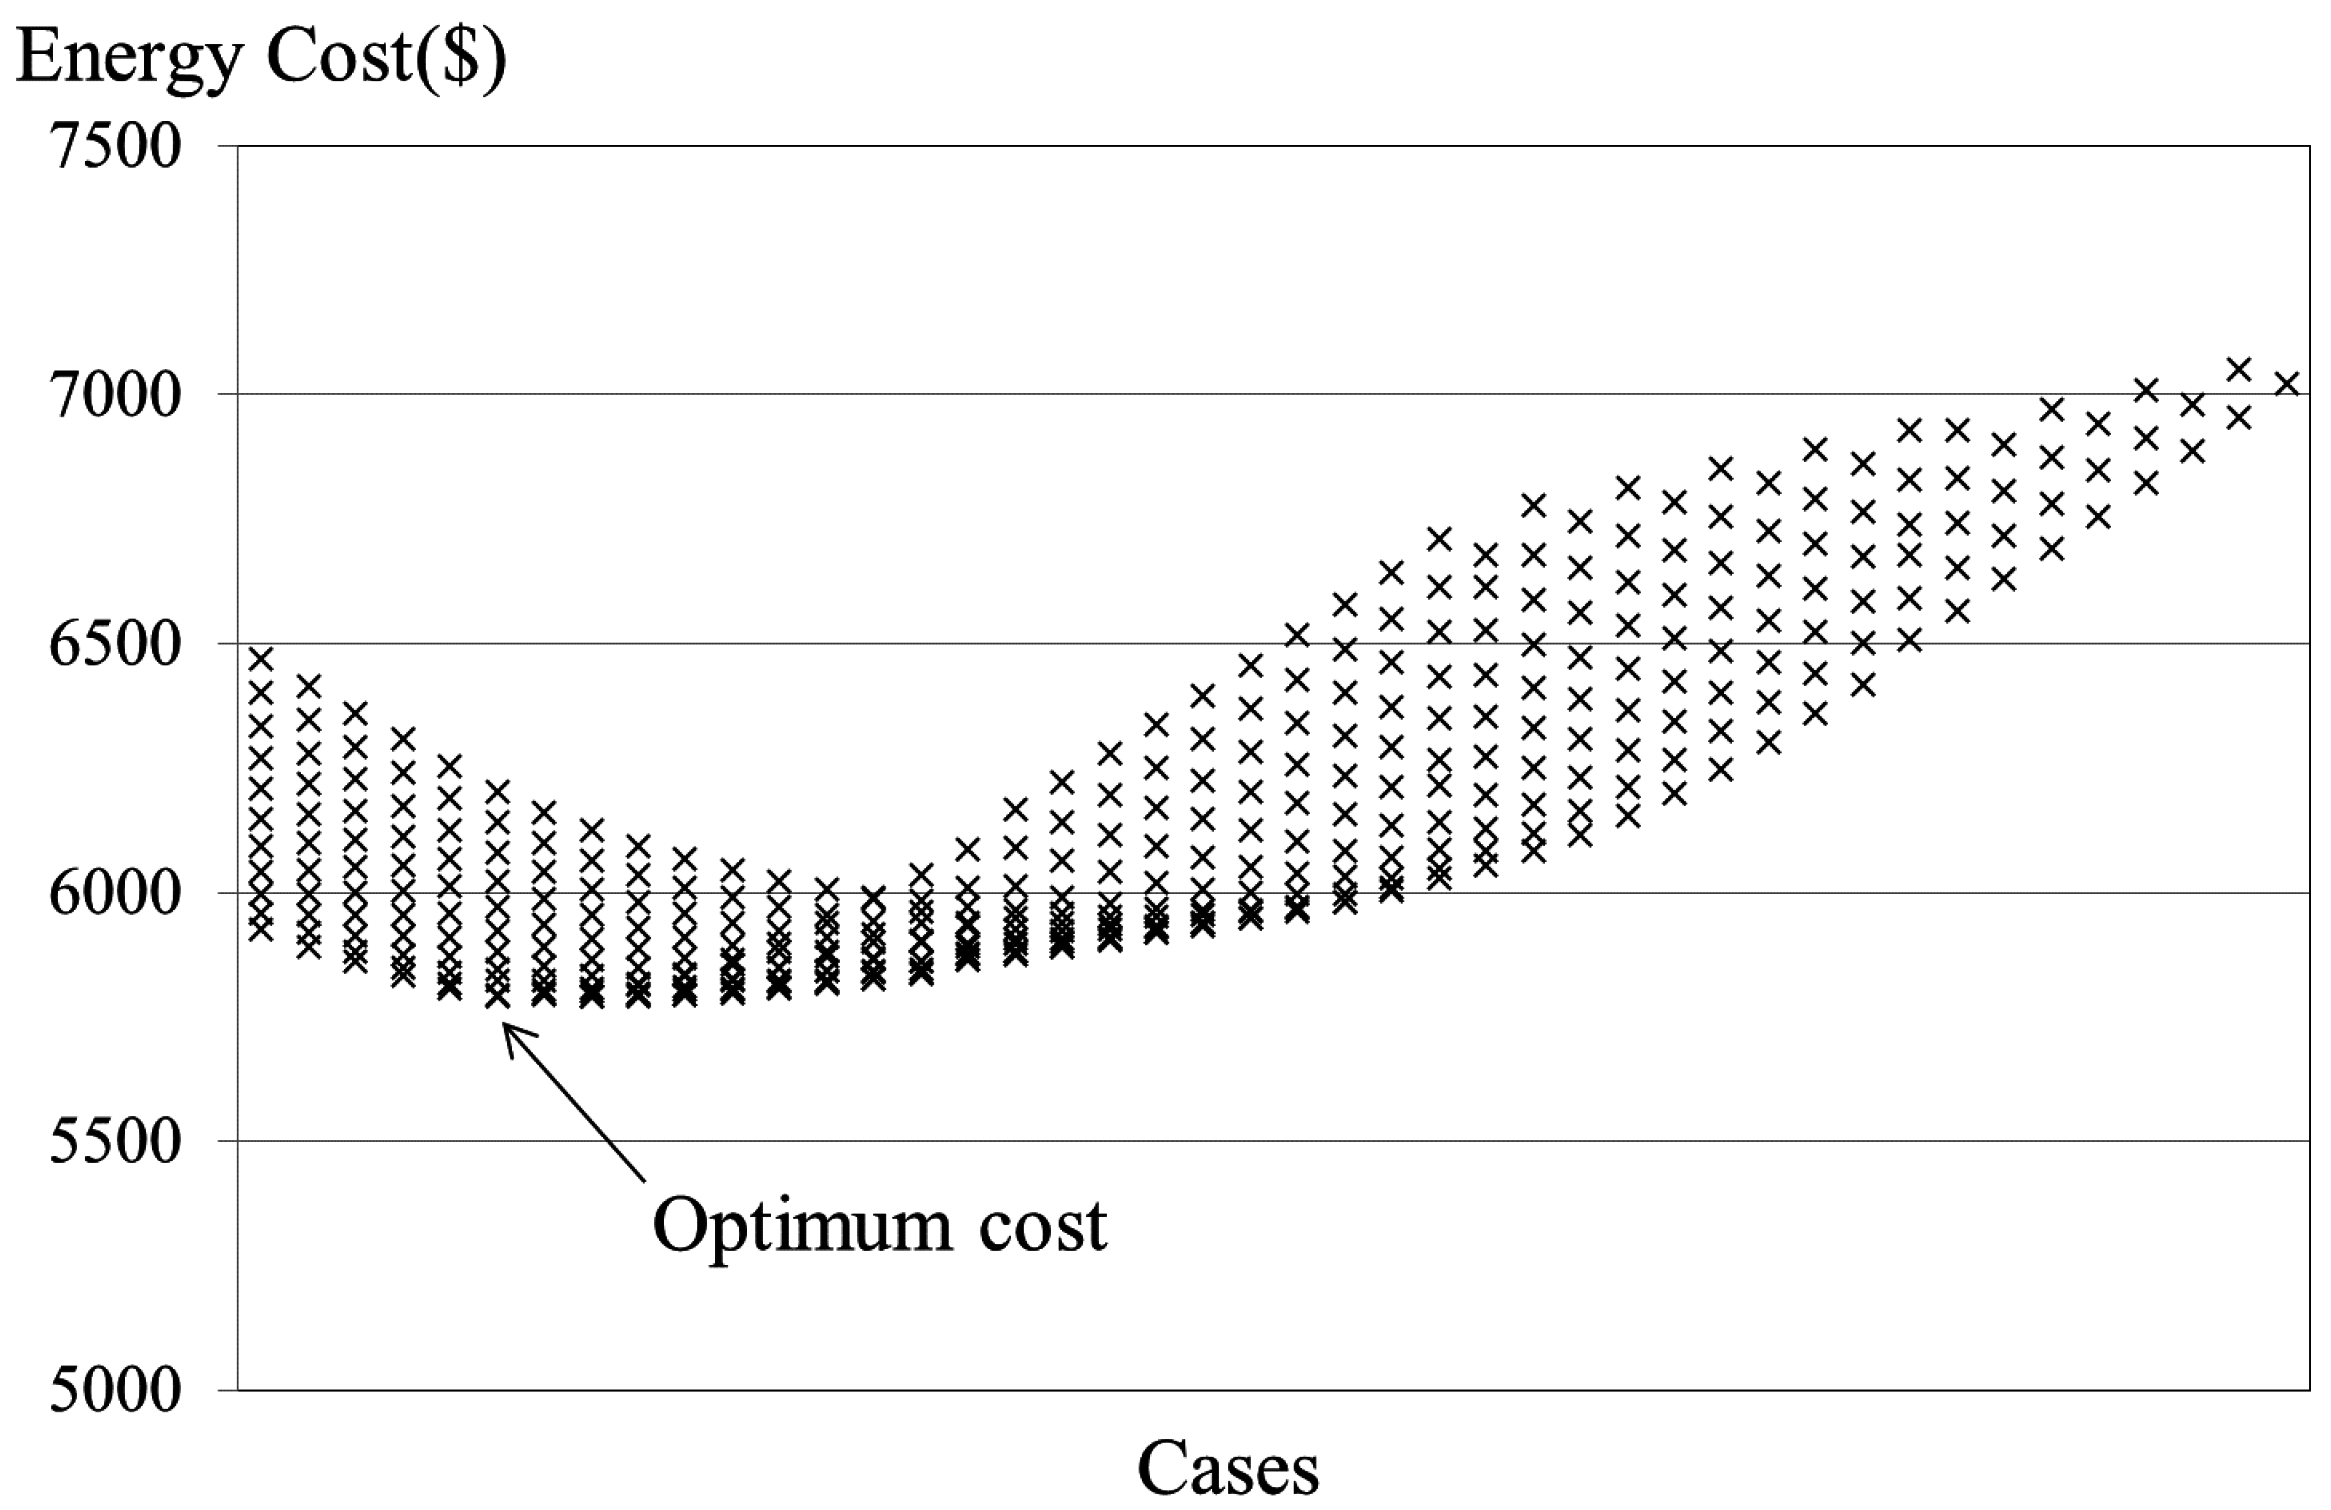
The equations are simple to use, useful in a very early design stage, and calculations using these are very fast. Results can be obtained from a single calculation, whereas the initial optimization process requires several iterations to get the optimal combination of REHS in a given budget as shown in
Figure 11. This result is for the 25-classroom case to obtain a lowest operation cost ($5790). The REHS-selecting combination is 124 m
2 (SWHS)-7 kWp (PV)-99 kW (GHP). Using the proposed equations, a very similar combination can be directly calculated: 125.5 m
2 (SWHS)-7.3 kWp (PV)-97.7 kW (GHP). These results show that the proposed simplified method is suitable for calculating optimal sizing.
This figure also shows that the REHS sized by the proposed simplified method results in the lowest operation cost under the given REHS budget. All the possible combinations of the REHS were investigated for the figure. Consequently, there may be no need to run intensive inter-comparison simulations with an existing optimization tool.
Furthermore, as mentioned in our literature review, the well-known Merit can size component systems of the REHS using the building load and renewable energy share among the total annual energy consumption as inputs. However, in this paper, our inputs are the load and capital cost for renewable energy systems since the cost share among the total construction cost is mandated in Korea. Other tools for detailed optimization require elaborated engineering work to describe the system configuration, and the optimization process is time-consuming.
Beyond this validation of the optimization process, the calculation methods proposed for component units of the REHS are validated using TRNSYS. Given the same inputs and parameters, results of energy production by solar collectors and PV are acceptably similar showing only 3.21% and 3.18% errors. For energy consumption by GHP, 4.24% error is found between TRNSYS and the proposed method.
6. Conclusions
A renewable energy hybrid system (REHS) applicable to schools in Korea has been recently populated as a new national regulation mandating renewable energy utilization. The REHS combines the common renewable-energy sources, such as geothermal heat pumps, solar collectors for water heating, and photovoltaic systems with conventional energy systems (i.e., boilers and air-source heat pumps). Therefore, determining a proper budget and optimized system capacities for the REHS is important. A simple tool for this would be useful in the early design stage.
In this study, specifications for schools in load patterns, energy prices, and building typology were considered, and a methodology to obtain a simple optimization method from these factors was devised.
As the weather and the building typology are almost identical across the country, modularized unit loads for a single classroom were specified by several annual simulations using average values obtained from national statistical data. Several combinations of the REHS are possible for a select number of classrooms. Simple models for each component of the REHS were selected for annual simulations and for simplicity.
An initial optimization process was developed to calculate an optimal combination of the REHS when the number of classrooms and the budget are provided. This process requires several iterative calculations to obtain the optimal combination using the lowest-energy-cost criterion. From the results, an optimized budget for each number of classrooms can be found. Simplified sizing equations are proposed using regression analysis, and the equations are only a function of the number of classrooms. The optimal capital costs are easily calculated from the system sizes.
A verification test was carried out using the initial optimization process. The sizing results and corresponding capital costs calculated by the simplified sizing equations are then inputted into the initial optimization process to see whether both sizing results are similar. Results show that the simplified sizing equations predict a similar sizing as compared with the initial optimization process, showing similar capital costs within a 2% error. However, the results cannot account for predefined unit sizes. The selection for unit-size-based design from these results can be achieved by users.
The proposed simplified sizing method is simple to use and thus useful in a very early design stage. However, the use of presented models is limited to school projects in Korea. If necessary, the development methodology proposed in this work is applicable for cases of other buildings and systems.


