Article

Short-Term Success versus Long-Term Failure: A Simulation-Based Approach for Understanding the Potential of Zambia’s Fertilizer Subsidy Program in Enhancing Maize Availability

Department of Geography, University of Bergen, Fosswinckelsgate 6, Bergen NO-5020, Norway
Sustainability 2016, 8(10), 1036; https://doi.org/10.3390/su8101036
Submission received: 20 July 2016 / Revised: 14 September 2016 / Accepted: 26 September 2016 / Published: 19 October 2016
(This article belongs to the Section Sustainable Agriculture)

Abstract

:
In Sub-Saharan Africa, food-related policies such as fertilizer subsidy programs (FSPs) have undergone a revival and triggered a controversy about their impact. In this article I applied a simulation-based approach to examine the FSPs’ short- and long-term potential for increasing maize availability in Zambia. The study revealed that FSPs are an effective policy measure to enhance maize availability in the short-term. However, in the long-term, the food system becomes dependent on the government’s annual expenses. The dependency occurs because FSPs fail to build up adequate stock levels of soil organic matter (SOM), which is an important source of resilience and productivity, and thus represents a long-term leverage point in Zambia’s maize production system. For this reason, alternative policies that combine increasing productivity and building up SOM stock levels were analyzed. They were found to be a viable means for enhancing long-term maize availability. The study concludes that gradually reducing investments in FSPs while simultaneously promoting farming practices that build up SOM stock levels is a promising strategy to enhance maize availability sustainably.

1. Introduction

In Sub-Saharan Africa (SSA) food-related policies have undergone a revival due to rising concerns about food security and lagging economic development. In this context many countries have re-introduced fertilizer subsidy programs (FSPs) since the mid-1990s. Examples include Malawi (re-introduced fertilizer subsidies in 1998), Nigeria (in 1999), Zambia (in 2000), Tanzania (in 2003), Kenya (in 2006) and Ghana (in 2008) [1]. FSP goals are manifold and include increasing fertilizer use, improving soil fertility, improving food security, alleviating poverty, and fostering economic growth.
The impacts of the re-introduction of FSPs have been analyzed with a focus on economic aspects [2]. Although FSPs contribute to increasing fertilizer use, which translates into higher food production, they have numerous shortcomings [3]. The most commonly recognized pitfalls include low yield response to fertilizer application, crowding out of private fertilizer sale activities, poor targeting towards farm households in need, low cost effectiveness, inflexibility to adjust fertilizer composition to regional conditions and implementation problems such as late fertilizer deliveries [4,5,6]. Despite this, governments in SSA spend considerable amounts of their state budgets on FSPs. In 2011, ten countries in the region spent approximately USD 1 billion on input subsidy programs, which accounted for almost one-third of their public agricultural expenditure [2]. Zambia is an exemplary case where FSPs have been increasingly applied and remain popular [7]. Given the broad goals and the high costs of FSPs, the success of the expenditure is crucial not just for governments but primarily for the food security status of the population.
To develop agricultural sectors in SSA, there exists wide agreement that higher use rates of inorganic fertilizers are necessary to increase agricultural productivity and food production (e.g., [3,8]). However, the question of how to achieve the higher fertilizer use rates has been controversially debated. Some have stressed the importance of FSPs and aim to overcome implementation challenges (e.g., [9]), while others have recommended downsizing expenditures on FSPs and allocating the savings to other well-known growth promoters such as infrastructure development [4,10]. Thus, the FSP debate is polarized.
A blind spot in the debate is that “the critical relationship between soil conditions and fertilizer response has been largely overlooked to date in the economics literature on fertilizer promotion policy” [2]. In SSA, soil fertility depletion causes soils to lose the ability to provide food [11]. Within soils, soil organic matter (SOM) is a crucial component for plant production because it influences the soil’s physical, chemical and biological properties [12] and, in turn, low SOM levels lead to low agricultural productivity and low fertilizer efficiency in SSA countries, such as Zambia [13]. Despite these facts, only few articles to date mention the importance of SOM in the FSP debate (e.g., [3,14,15]). These articles point out that fertilizer application helps to increase SOM levels but without closely investigating or specifying the interactions between FSPs, productivity, SOM, and food production. However, the understanding of these interactions is vital for designing sustainable, long-term oriented policy interventions. Consequentially, policymakers face a knowledge gap that requires broad approaches, including tools that go beyond statistical analyses and that take into account dynamic effects [15].
Accordingly, I used a simulation-based approach appropriate to analyze the complex long-term interactions between FSPs, SOM, maize production, and maize availability in this study [16]. In contrast to previous approaches, I do not report new data, demonstrate the existence of a new variable, or specify the strength of a link between existing variables. Instead, the main contribution of my work is to provide new insights from links and theories that are already well established in the literature. More specifically, my contribution to the FSP debate arises from two activities. First, I conducted an in-depth theory and literature review to integrate relevant concepts into a food production system framework using causal loop diagramming [17]. Second, I developed and analyzed a mathematical bio-economic simulation model for the specific case of Zambia, from which I derived new knowledge-based insights.
This article extends the FSP debate in several ways. First, it provides a feedback-based framework of food production systems. The visual integration of theories and variables into one framework makes the structural properties of the interaction between FSPs, SOM, maize production, and maize availability explicit. Second, the quantitative simulation model allows for analyses of the complex interplay of the system’s structure and its trajectory over time. The study finds that FSPs are a viable means to enhance many target variables in the short-term, such as fertilizer use, maize yield, maize production, and maize availability. However, in the long term, FSPs fail to increase SOM levels adequately, which represent a systemic leverage point and important source of resilience. Thus, the long-term success of FSPs depends on sustained government expenditures. Promoting farming practices that build up SOM stock levels are a promising alternative to FSPs for sustainably enhancing maize availability. Third, the study demonstrates the usefulness of a feedback-based simulation approach for policy evaluation and provides a stepping-stone for further FSP research focusing on broader perspectives.
The article is organized as follows. First, I introduce to the method and the study case, Zambia. Thereafter, I develop the modeling framework, specify it into a mathematical simulation model, and then validate, calibrate, and analyze the model. Finally, the article ends with discussion and conclusions.

2. Method and Study Case

2.1. Simulation Approach

A simulation model was developed to investigate the dynamic interaction between FSPs, SOM, maize production, and maize availability in Zambia. The simulation-based approach focuses on a high level of aggregation and allows the identification of leverage points, strategic areas of action and fundamental mechanisms of a complex system. However, the systemic integration on an aggregated level comes at the cost of some abstraction and thus the inability to represent phenomena on a detailed level. The dynamic complexity of a system arises though the non-linear interaction of feedback loops and the accumulation processes involved. To capture this dynamic complexity, a two-step approach was applied.
As a first step, an in-depth literature review was conducted to develop a modeling framework applying the causal loop diagramming method [17] to represent the system’s structure and feedback mechanisms. With this method, structural assumptions about causal relations are made explicit by visually linking cause-and-effect variables through arrows directed towards the effect. Positive and negative signs at the arrowhead show the polarity of the causality. A plus sign (+) indicates that a change in the cause variable leads to an equally directed change in the effect variable. A minus symbol (–) indicates that a change in the cause variable leads to a reverse-directed change in the effect variable. Feedback mechanisms, which are also referred to as feedback loops, consist of such cause-and-effect relationships, which build a circular chain of causation. Feedback loops show either a reinforcing or balancing mode of behavior. The former self-reinforces whichever behavior is present, and the latter adjusts the current behavior towards a goal. A framework based on causal loop diagramming is a qualitative statement about a system’s structure, and in my study, the framework served as a base for developing the quantitative simulation model.
In a second step, the modeling framework was specified into a formal, mathematical simulation model. Technically, the model consisted of non-linear difference equations that were numerically integrated. The model presented in this article was calibrated for the specific case of Zambia using time series and validation procedures, following Barlas [18]. Once the model was robust, it served as a “virtual playground” in which to test different policy experiments. The applied two-step approach is useful for evaluating sustainability programs [19] due to its long-term perspective that captures feedback dynamics [16].

2.2. Zambia’s Fertilizer Subsidy Program

As in other SSA countries, maize is the staple crop of Zambia’s rapidly growing population. Since the mid-1980s, it has accounted for 55% of the population’s total calorific intake on average [20]. Most of the maize consumed in Zambia is produced domestically by resource-poor smallholder farmers working within a low-input and rain-fed farming system. The soil fertility levels are low, resulting in low yield returns relative to fertilizer use [21]. Accordingly, food availability remains chronically below the required level.
To increase maize availability, Zambia has a long tradition of FSPs in its maize sector. Agricultural policies in the period from independence in 1964 to 1990 were characterized by a nationwide network of input supply and collection centers operating under a parastatal organization [22]. After an intermediate period of economic liberalization during the early 1990s, with little state involvement in the agricultural sector, the government of Zambia reintroduced a fertilizer credit program in 1997 that turned into a large-scale input-subsidies program in 2002 [4]. Since the re-introduction of the subsidized fertilizers in 1997, there has been an increasing trend in consumption from ca. 20,000 tons in 1997 to ca. 200,000 tons in 2014 [7].
Despite the increasing popularity of Zambia’s FSPs, little research exists to help policymakers understand the short-term and long-term impacts of the program on SOM and the interactions between the program, SOM, maize production, and maize availability. As already mentioned, such an understanding is crucial for the design of policy instruments with sustained benefits.

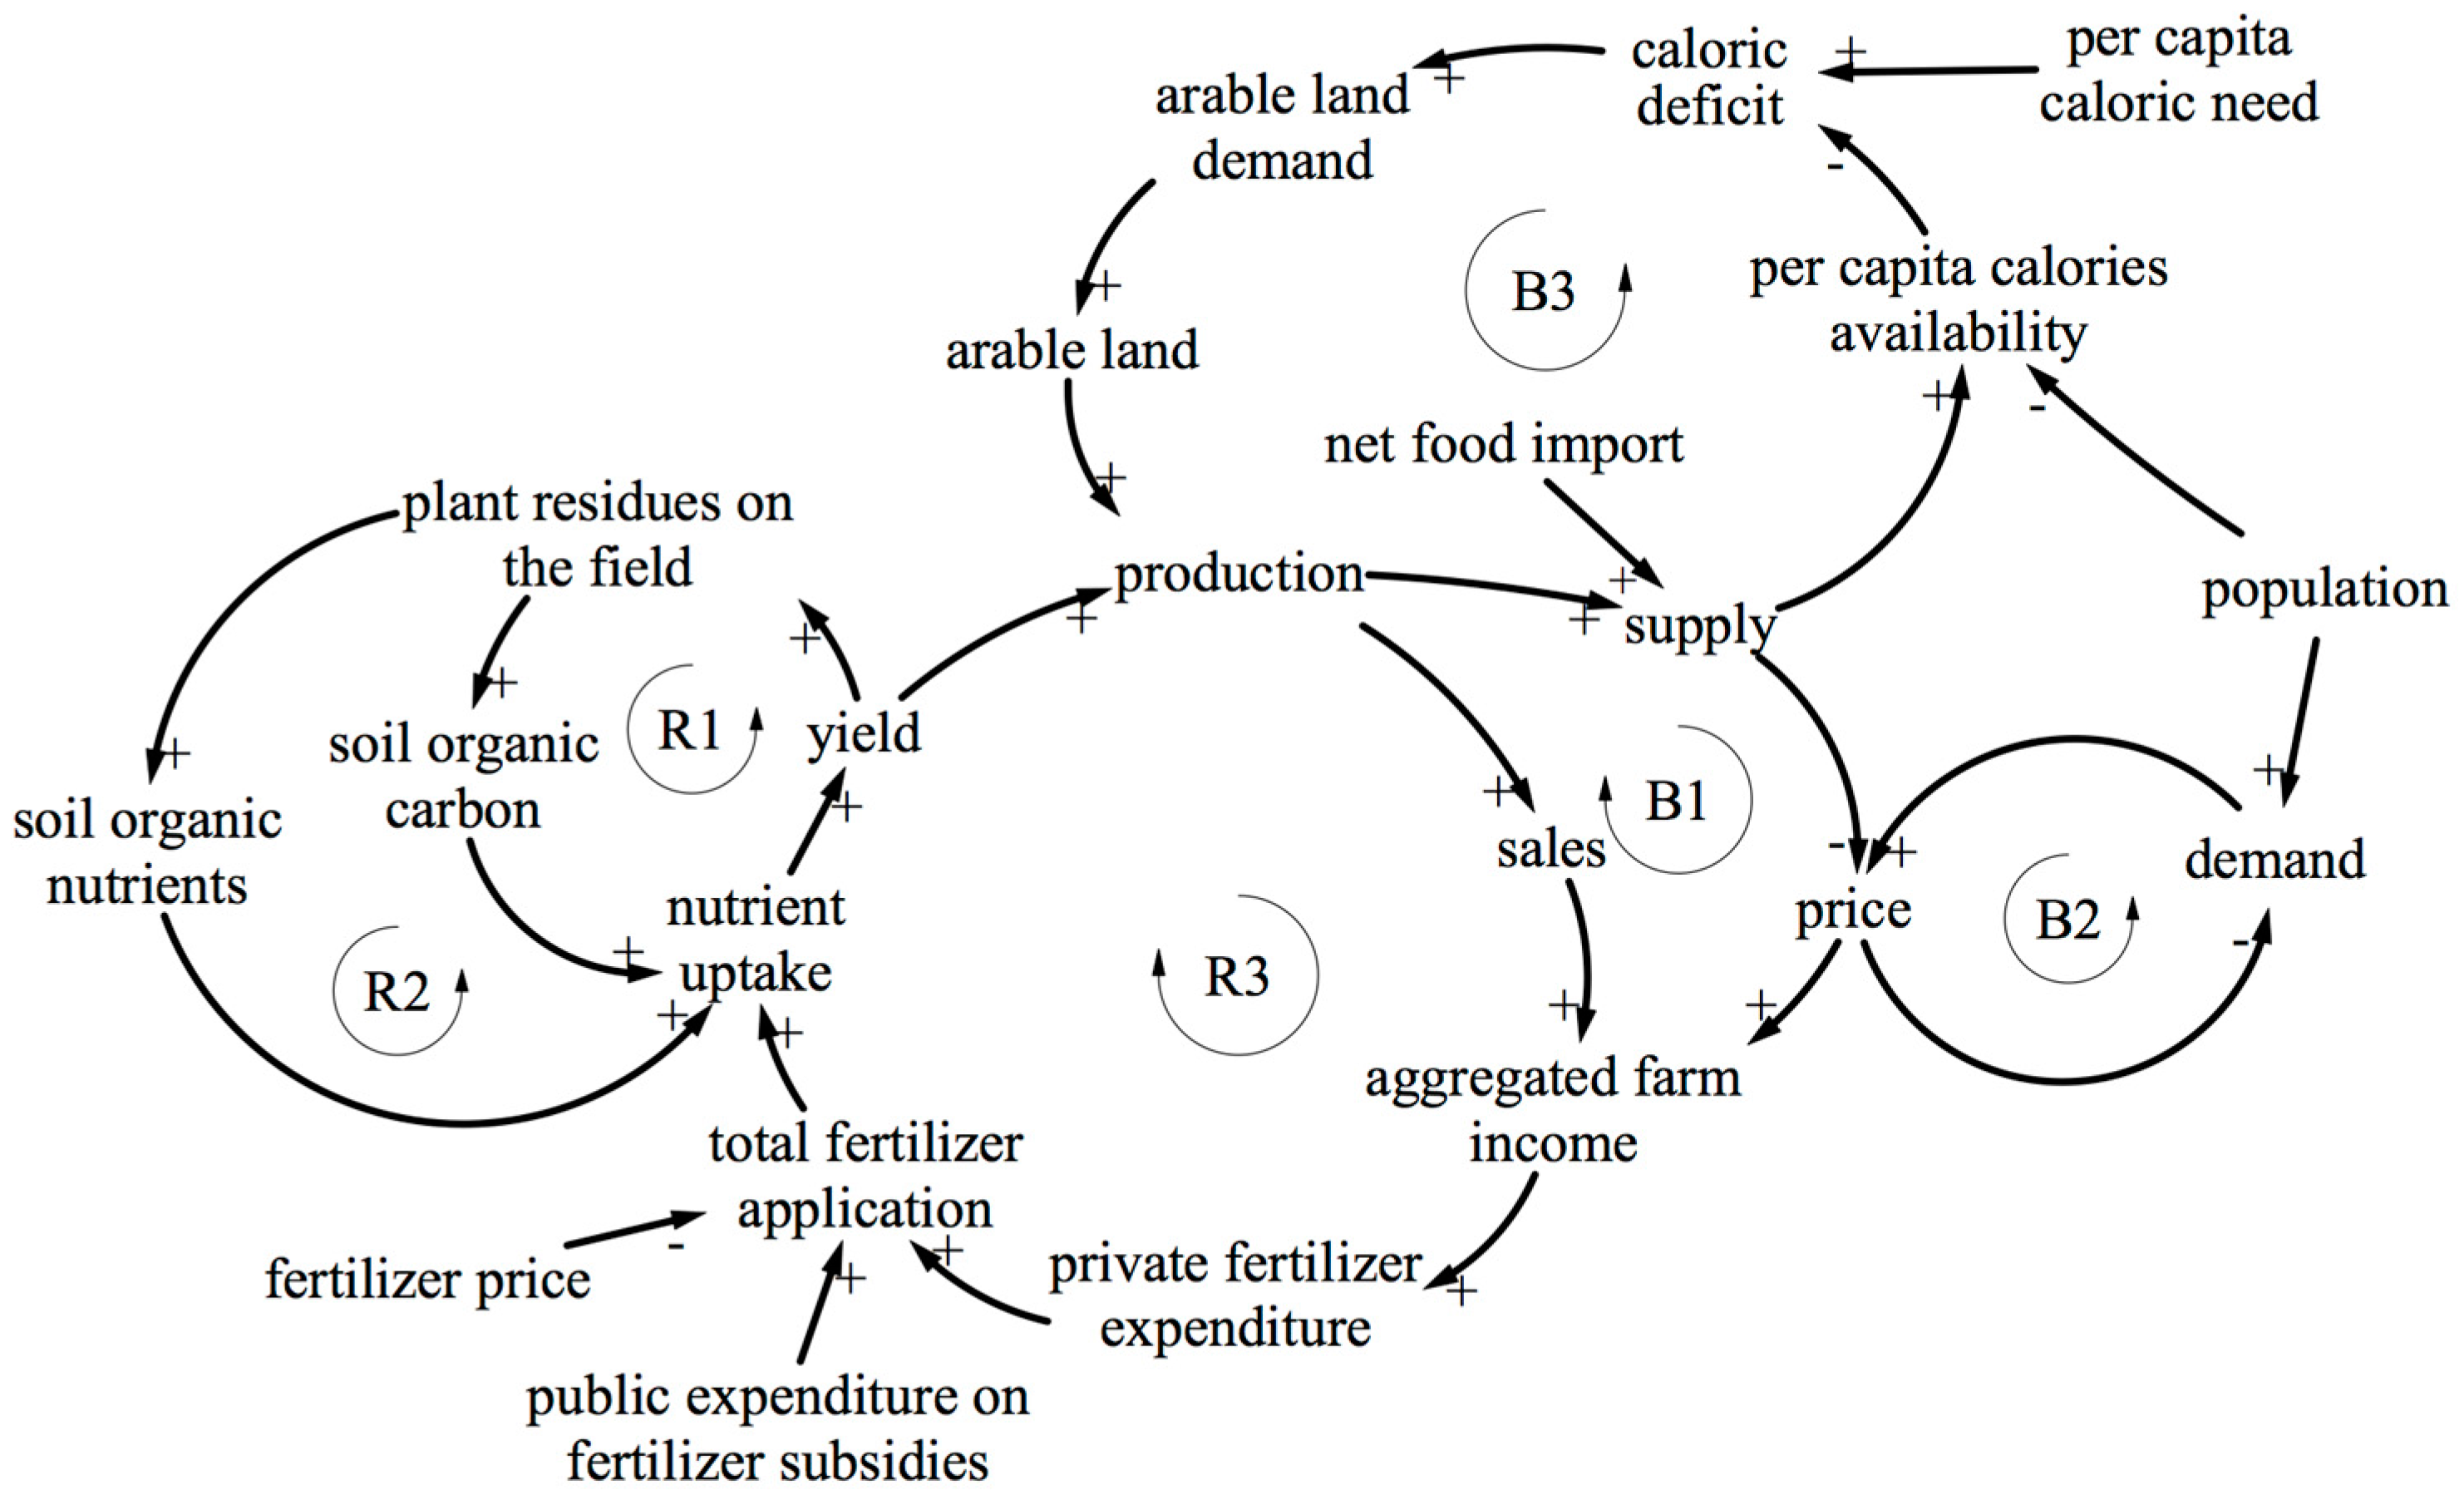
3. Modeling Framework

In this section I describe a framework based on an in-depth literature review of relevant fields that include production theory (e.g., [23]), soil dynamics (e.g., [24]), plant nutrition (e.g., [25]), farmers’ allocation decisions (e.g., [26,27]), and commodity markets (e.g., [28]). In this theory integration I focus on plant production, since animal-based food products play a subordinate role in Zambian diet.

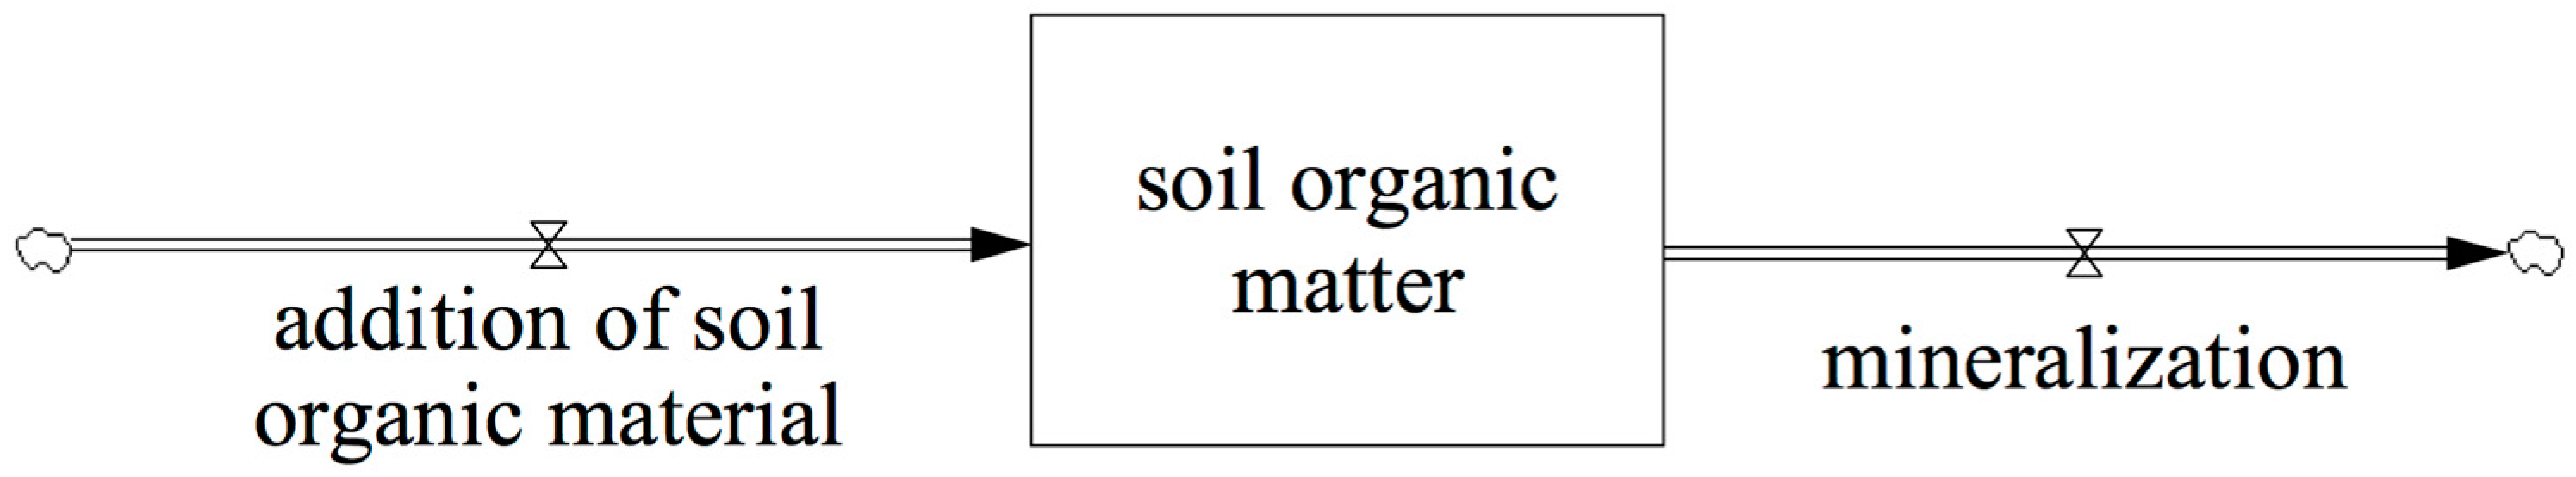
3.1. Fertilizer, Yield, and Soil Dynamics

A core part of the framework represents the interaction between fertilizer, yields, and soil dynamics. I summarize the vast literature of these fields by representing the long-term dynamics on a country level. The first set of relations is captured in the lower part of Figure 1, which shows total fertilizer application as negatively influenced by fertilizer prices and positively influenced by private fertilizer expenditure and public expenditure on fertilizer subsidies. The negative arrow polarity expresses that total fertilizer application decreases with increasing fertilizer prices. Similarly, the positive arrow polarity expresses that total fertilizer application increases (decreases) with increasing (decreasing) public expenditure on fertilizer subsidy and private fertilizer expenditure. The links between total expenditure, price, and quantity of fertilizer are well founded in microeconomic theory (e.g., [26]).
SOM is conceptually split into two elementary components—carbon and nutrients—according to their different roles in the growth process. Figure 1 shows that total fertilizer application, soil organic carbon, and soil organic nutrients positively influence yield through the intermediate variable nutrient uptake. Whereas the links between soil organic nutrients, total fertilizer applications, and yields have a strong theoretical and empirical foundation (e.g., [8,21,25]), the links between soil organic carbon, nutrient uptake and yields exist, yet many mechanisms with respect to SOM still need to be researched [29].
The remaining links on the left side of Figure 1 represent SOM dynamics and reflect the assumption that plant residues partly remain on the field as by-products of the harvested yields. These plant residues increase two SOM stocks: soil organic nutrients and soil organic carbon. This assumption is well founded, both theoretically and empirically (e.g., [24]). While above-ground plant residues are burned or partly removed from the field and serve purposes such as feeding animals and building construction, below-ground biomass stays entirely within the field boundaries.
The links between yield and soil organic nutrients/soil organic carbon complete the first two feedback loops captured in the modeling framework: the reinforcing soil organic carbon loop (R1) and the reinforcing soil organic nutrients loop (R2). These two loops are self-reinforcing in nature and can either accumulate or deplete soil organic carbon/nutrients, depending on their current states. For example, an increase in soil organic carbon will lead to higher nutrient uptake rates and subsequently higher yields. In turn, higher yields will leave higher amounts of biomass on the field, which will add more organic carbon to the soil. Like the individual links that create the feedback loops, the feedback mechanisms as a whole are grounded in literature (e.g., [30]).

3.2. Supply and Demand Dynamics

Another section of the framework represents agricultural markets. Micro-economic theory in general and agricultural economics in particular assumes that market mechanisms equilibrate supplied and demanded quantities through price setting [26,27]. Unlike these standard approaches, the dynamic approach allows for disequilibrium through the accumulation of inventory stocks, which are implicitly incorporated in the market supply [28].
Domestic supply thus equals the sum of the domestic production and net food imports (food imports minus food exports), where domestic production equals the multiplication of average yields and arable land (the area on which food is produced). The links between these variables have positive polarity (Figure 1). Aggregated domestic food demand depends on the development of population, income, and food prices [27] (p. 302). The link between population and food demand has positive polarity whereas the link between prices and demand is negative (see the right-hand side of Figure 1). The effect of income on food demand is implicitly assumed to be constant and therefore omitted because population growth is the main driver of food demand in fast growing societies [27]. Food supply and demand affect food prices in reverse directions [26]. The link between food supply and prices has negative polarity, indicating that higher quantities of supplies lead to lower prices. By contrast, the link between food demand and prices is positive because higher demand leads to higher prices. Higher prices lead to higher farm incomes [26] and therefore the link between food prices and aggregated farm income is assumed to be positive. In turn, a higher income leads to higher expenditure on goods [26], and therefore the link between aggregated farm income and private fertilizer expenditure is assumed to be positive.
The additional variables and links create two feedback processes: the balancing supply feedback loop (B1) and the balancing demand feedback loop (B2). Both feedback loops not only consist of well-documented individual links but also appear as a whole in dynamic commodity market literature (e.g., [17,28]). Both balancing feedback loops cause prices to adjust until the market reaches equilibrium when the supplied quantity equals the demand quantity.

3.3. Self-Consumption and Land Dynamics

Many Zambian farmers produce food partly for subsistence [31] and sell the rest. Aggregated farm income therefore depends on food prices and the quantities sold by farmers. This mechanism is captured in the center of Figure 1 by the positive link between sales and aggregated farm income. The sales, in turn, are assumed to be positively influenced by the proportion of the production quantity that is sold. The introduction of sales to the framework in Figure 1 completes another feedback loop: the reinforcing sales loop (R3). This feedback mechanism self-reinforces the current trajectory of aggregated farm income. However, aggregated farm income is also part of the balancing supply loop that may counteract the reinforcing sales loop (R3).
Allocation of land is another crucial mechanism in food production systems. Land plays a central role in determining production in the analyses of the dynamic interactions between FSPs, SOM, and food production. Although land allocation has various determinants [32], de Vries [33] found that the root of land use change has its origins in the quest for food, fodder, and fibers. To capture this mechanism, I have introduced the variable caloric deficit in the upper part of Figure 1. Caloric deficit is the difference between the calories physically needed and the calories available from food supplies. The deficit increases if the per capita calories available decrease. An increasing food deficit is assumed to have an increasing effect on arable land through the intermediate variable arable land demand. These links create another feedback mechanism: the balancing land adjustment loop (B3). Similar to the balancing supply loop (B1), the balancing land adjustment loop (B3) works to equilibrate supply and demand by adjusting the arable land stock to its desired level. However, whereas the balancing supply loop (B1) operates in the short term, the balancing land adjustment loop (B3) works in the long term (cf. the capacity loop discussed by Meadows [28]).

3.4. Summary

Figure 1 represents a summary of the analyzed framework. Each link and feedback process presented above has been derived from the literature. The novelty of this study arises from the integration of these mechanisms and the analysis of their dynamic interaction. Undoubtedly, the framework could be more complex than the one presented in Figure 1. However, I focused on capturing the structural complexity by integrating just the core elements of food production systems for analyzing the interaction between FSPs, SOM, food production, and food availability. Thus, the framework is as large as needed and as small as possible to represent central mechanisms. Further research could build on this structure by incorporating additional theories and mechanisms.

4. Model Specification

The framework presented above has been specified into a mathematical model for analyzing the dynamic interaction between FSPs, SOM, maize production and maize availability. Key equations are presented in this section. It should be noted that the full model includes additional mechanisms that are needed for completeness. Because they are not of central importance for determining the overall model behavior, they have not been mentioned in the descriptions above and below. Different sectors of Zambia’s food production system are represented in the model according to their importance in terms of caloric contribution of available food: the interactions in the maize sector are fully represented, the interactions in other plant production sectors are partly integrated, and animal production is summarized for completeness. The full model was specified using Vensim software [34] and is available under Supplementary Materials.

4.1. Fertilizer, Yield and Soil Dynamics

The mathematical representation of fertilizer use, maize yield and soil dynamics focuses on the most crucial yield-limiting factors, which are nitrogen and water in Zambia [12,35]. Total fertilizer application is a major source of nitrogen and depends on public and private expenditure. Thus, mathematically, total fertilizer application can be defined as
T F A = ( F S + P F E ) F P
where TFA is the total fertilizer application, FS denotes public expenditure on fertilizer subsidies, PFE represents private fertilizer expenditure and FP is the average fertilizer price. Another source of nitrogen for plant growth is bound up in the SOM stocks. The change of elements in SOM stocks can be formulated using a first order differential equation [24]:
d E d t = I ( y ) E t m i n
where E is the amount of organic element per hectare and I(y) represents inputs of the organic element expressed as a function of maize yield y using the formulation in the IPCC guidelines [36]. The last term of Equation (2) represents the mineralization of the organic nutrients with tmin being the average mineralization time [24]. The two elements E represented in the model are nitrogen (N) and carbon (C). N is included for its crucial role in determining yields and C is included to represent SOM.
Subsequently, nutrient uptake by plants is expressed as
x 1 = ( T F A A L + N t m i n ) × f ( C )
where x1 denotes the nitrogen uptake by plants and AL represents arable land. Within the first brackets, available nitrogen is calculated as the sum of nitrogen fertilizer application per hectare and mineralized organic nitrogen. The actual nitrogen uptake is a fraction of the term in the first brackets determined by a linear function of C.
Thus, maize yield is obtained by using a Mitscherlich-Baule production function [25]:
y = A × ( 1 10 c 1 × x 1 ) × ( 1 10 c 2 × x 2 )
where y is the average maize yield, A the yield plateau representing a potential yield under perfect factor availability, c1 and c2 are context-specific constants and x1 and x2 represent factor uptakes (x1 nitrogen and x2 water).

4.2. Supply and Demand Dynamics

Supply results from domestic production and net imported food quantity, and is expressed as
S = P r o d + N e t I m p = ( A L × y ) + ( I m p E x p )
where S is the supplied quantity, Prod represents the domestic production, and NetImp is the net food imports, comprising imports (Imp) and exports (Exp). Demand depends on the population’s physical needs, people’s preference for a product, and the food price:
D = D r e f + g ( P o p ) + h ( P )
where D refers to the demanded quantity. Dref represents a reference demand quantity that is adjusted for population (Pop) development and prices (P). In turn, the price is determined by adjusting a reference price to disequilibria in supply and demand. Mathematically, price is calculated as follows
P = ( S D ) ε × P r e f
where P denotes the price, Pref is an equilibrium reference price, and ε a sensitivity parameter determining the strength of the price adjustment in the case of an imbalance in supply and demand.

4.3. Land Dynamics

The driver of land use change is average per capita calories availability, which is mathematically conceptualized as
P C C A = ( S N F P ) × k c a l M P o p
where PCCA denotes per capita calorie availability, NFP is plants produced for non-food purposes such as fodder or fiber, kcalM is a multiplier to express food quantities in kilocalories and Pop denotes the country’s total population. The relative difference between the caloric need and PCCA determines, among other variables, the land conversion rate:
d A L d t = min ( P C C N P C C A P C C A × A L ,   m C R ) C R O L
where PCCN is the per capita calorie need, mCR denotes a maximal conversion rate and CROL represents the conversion of AL into other land which is used for settlements and roads. The min-function enforces the choice of the smaller argument between what is desired (first argument in the brackets) and what is maximally possible (second argument in the brackets).
Private fertilizer expenditures are assumed to be a share of income:
P F E = I n c × S h F = ( P × S a l e s ) × S h F
where PFE is the private fertilizer expenditure, ShF the share of aggregate farm income that is spent on fertilizer purchases, and Inc is the aggregate farm income. The latter consists of P multiplied by the quantity sold (Sales).

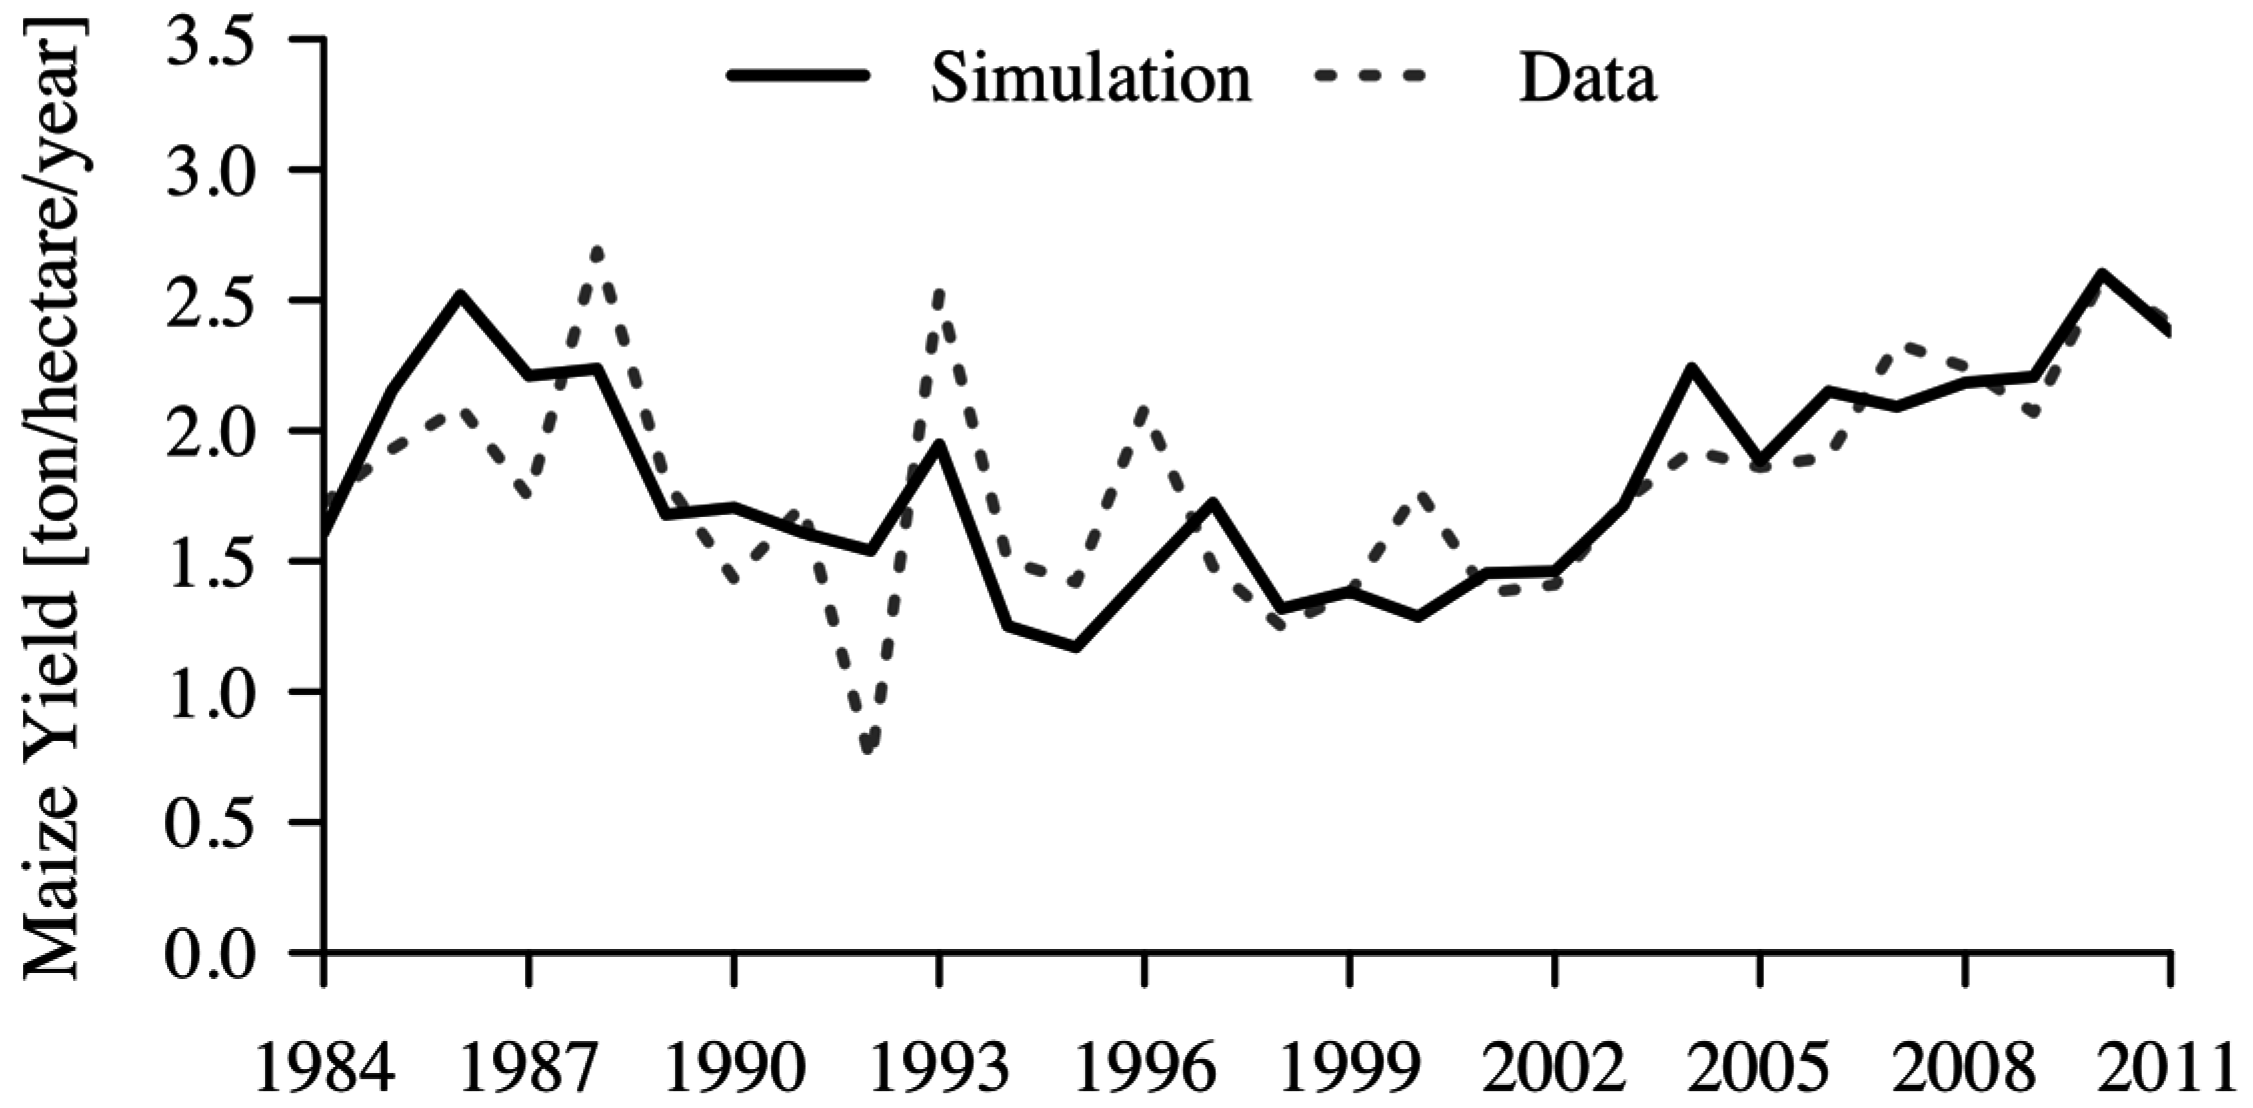
5. Calibration, Validation and Past Trajectories
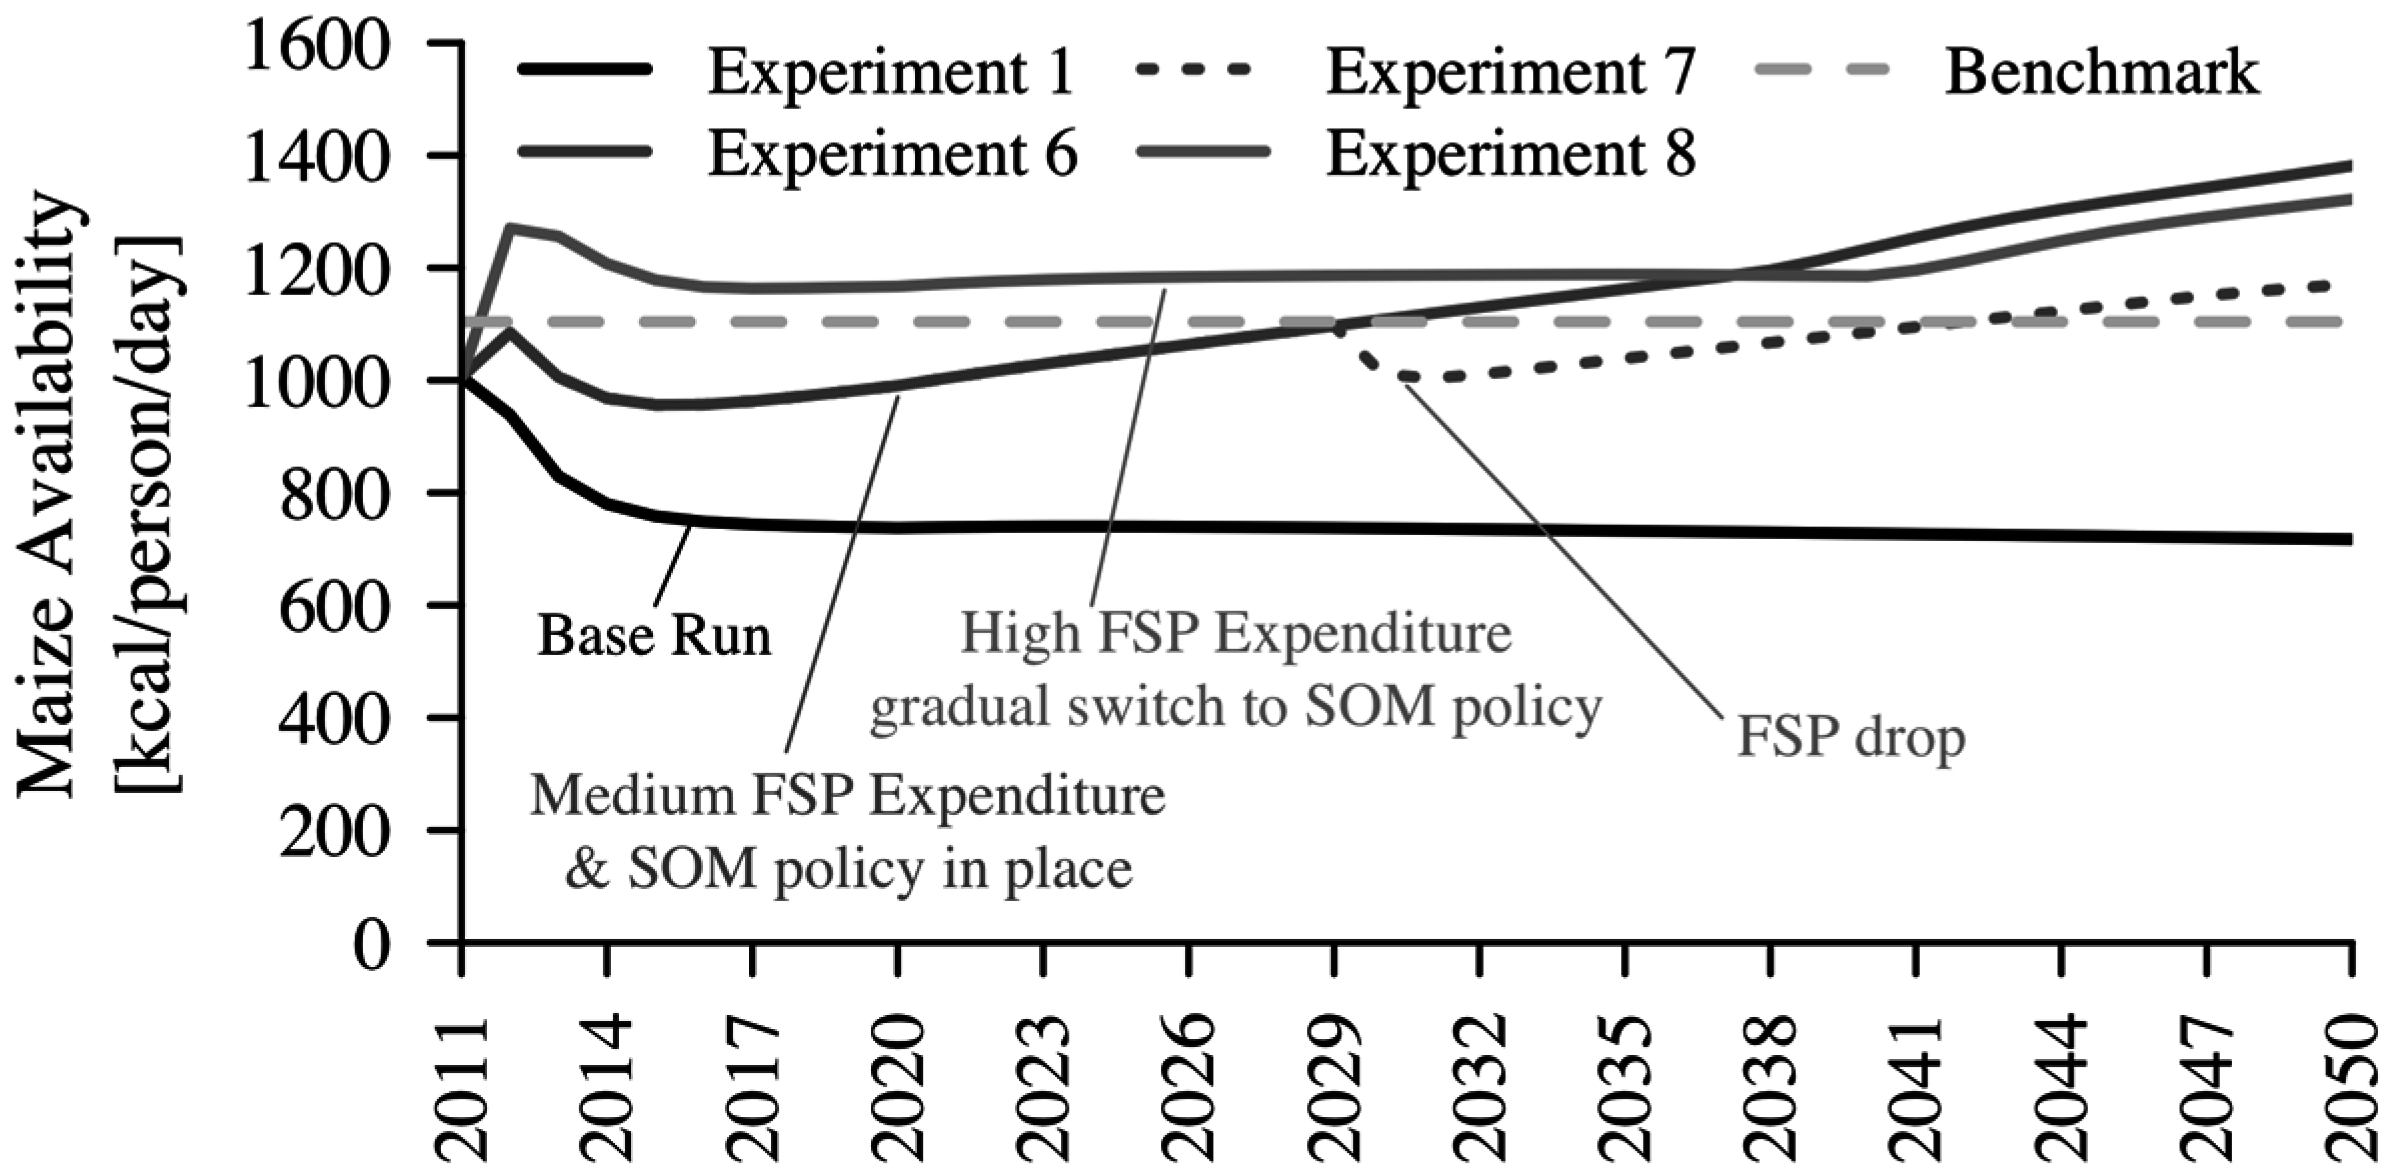
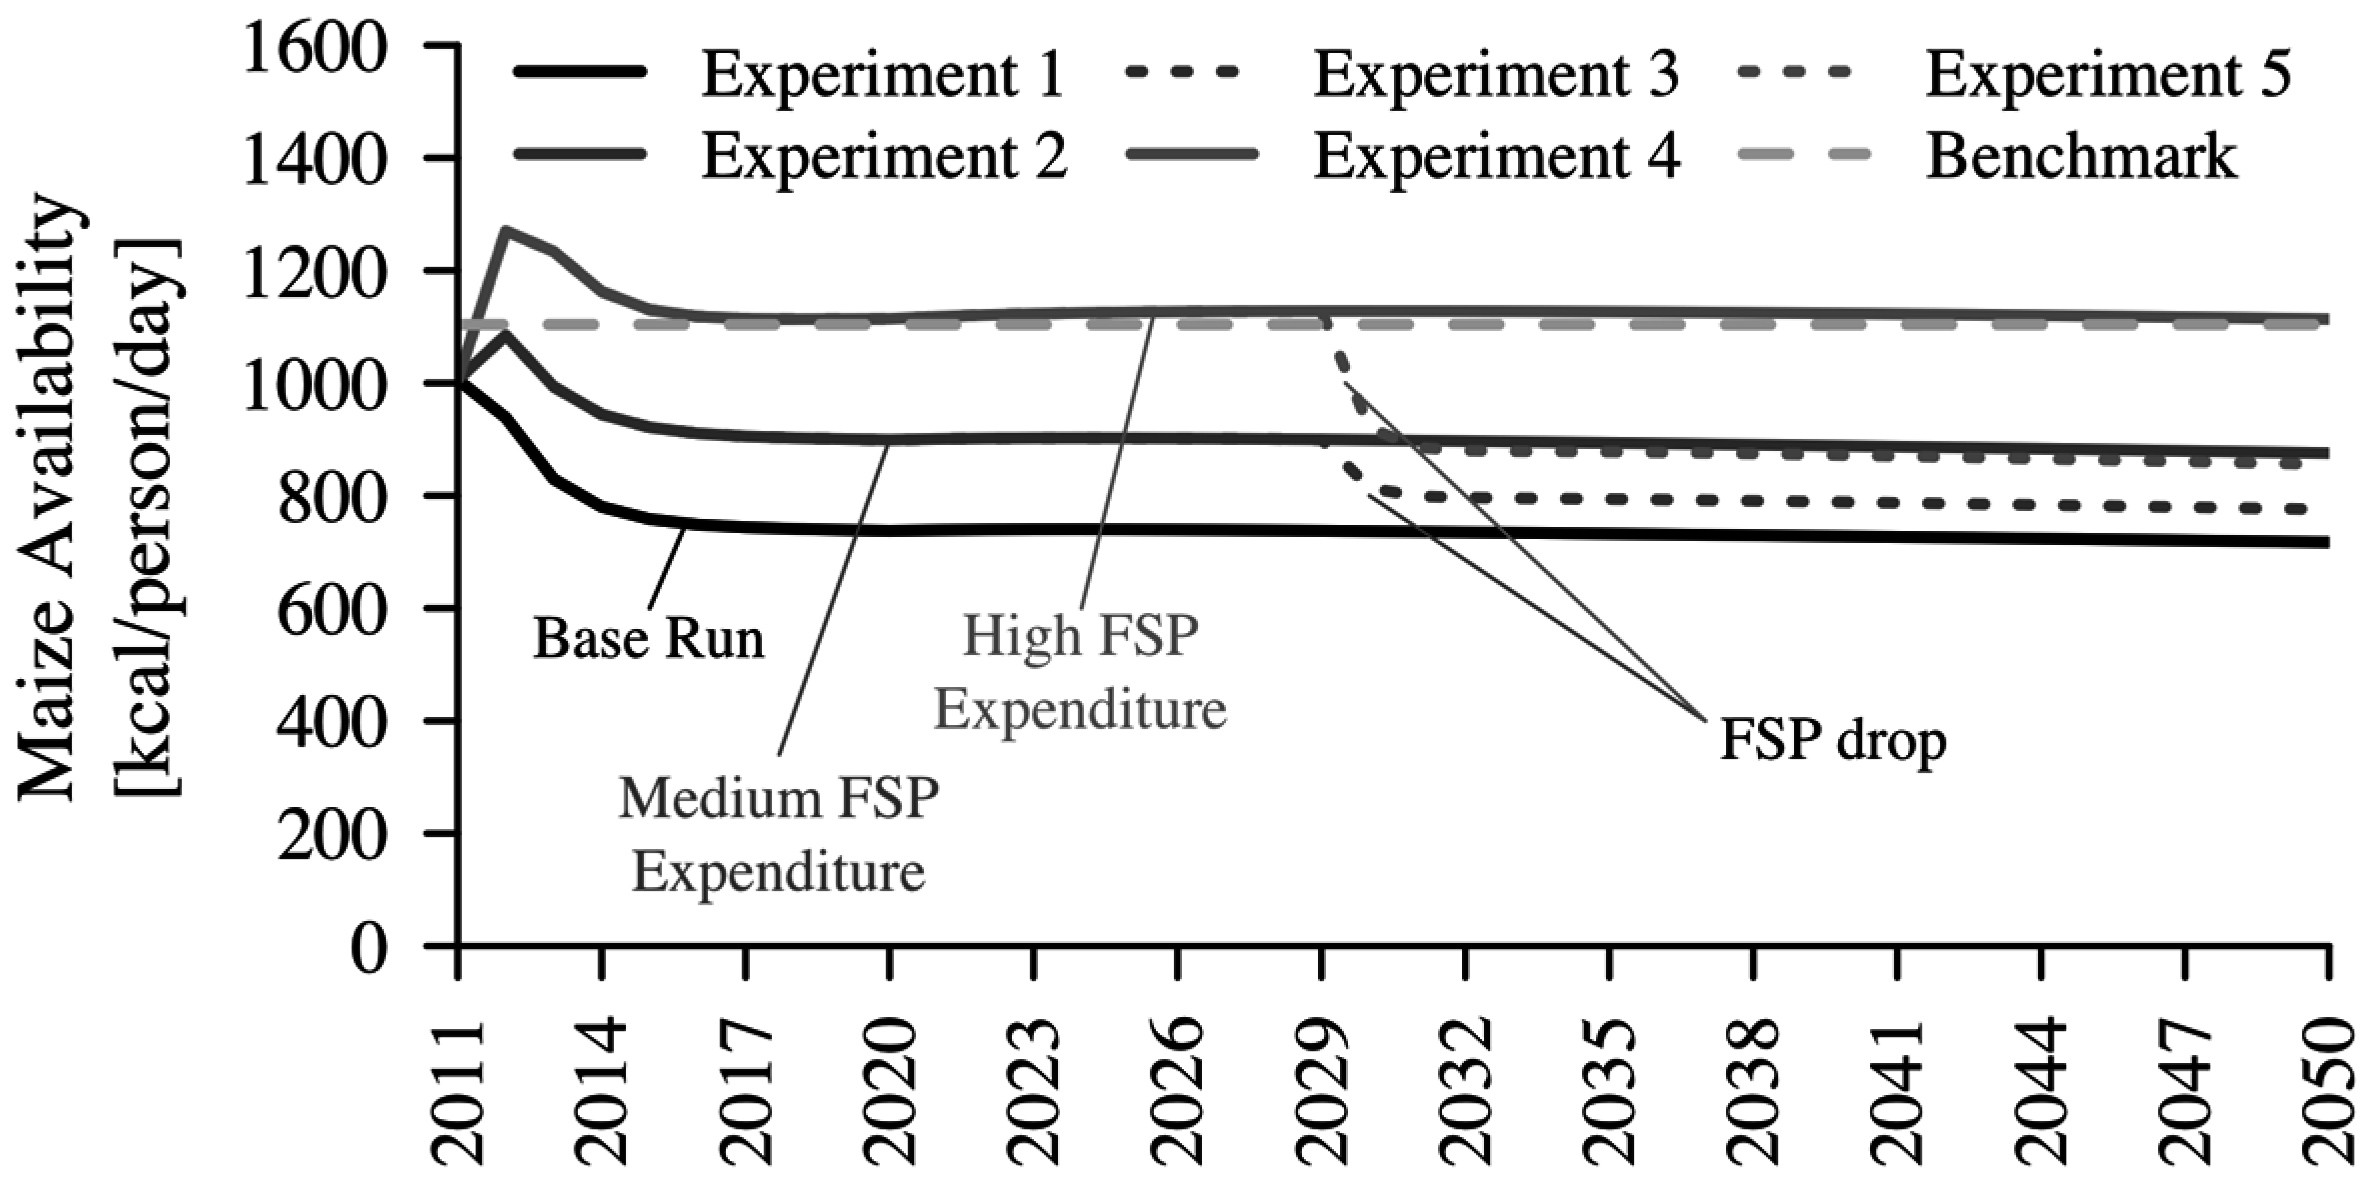
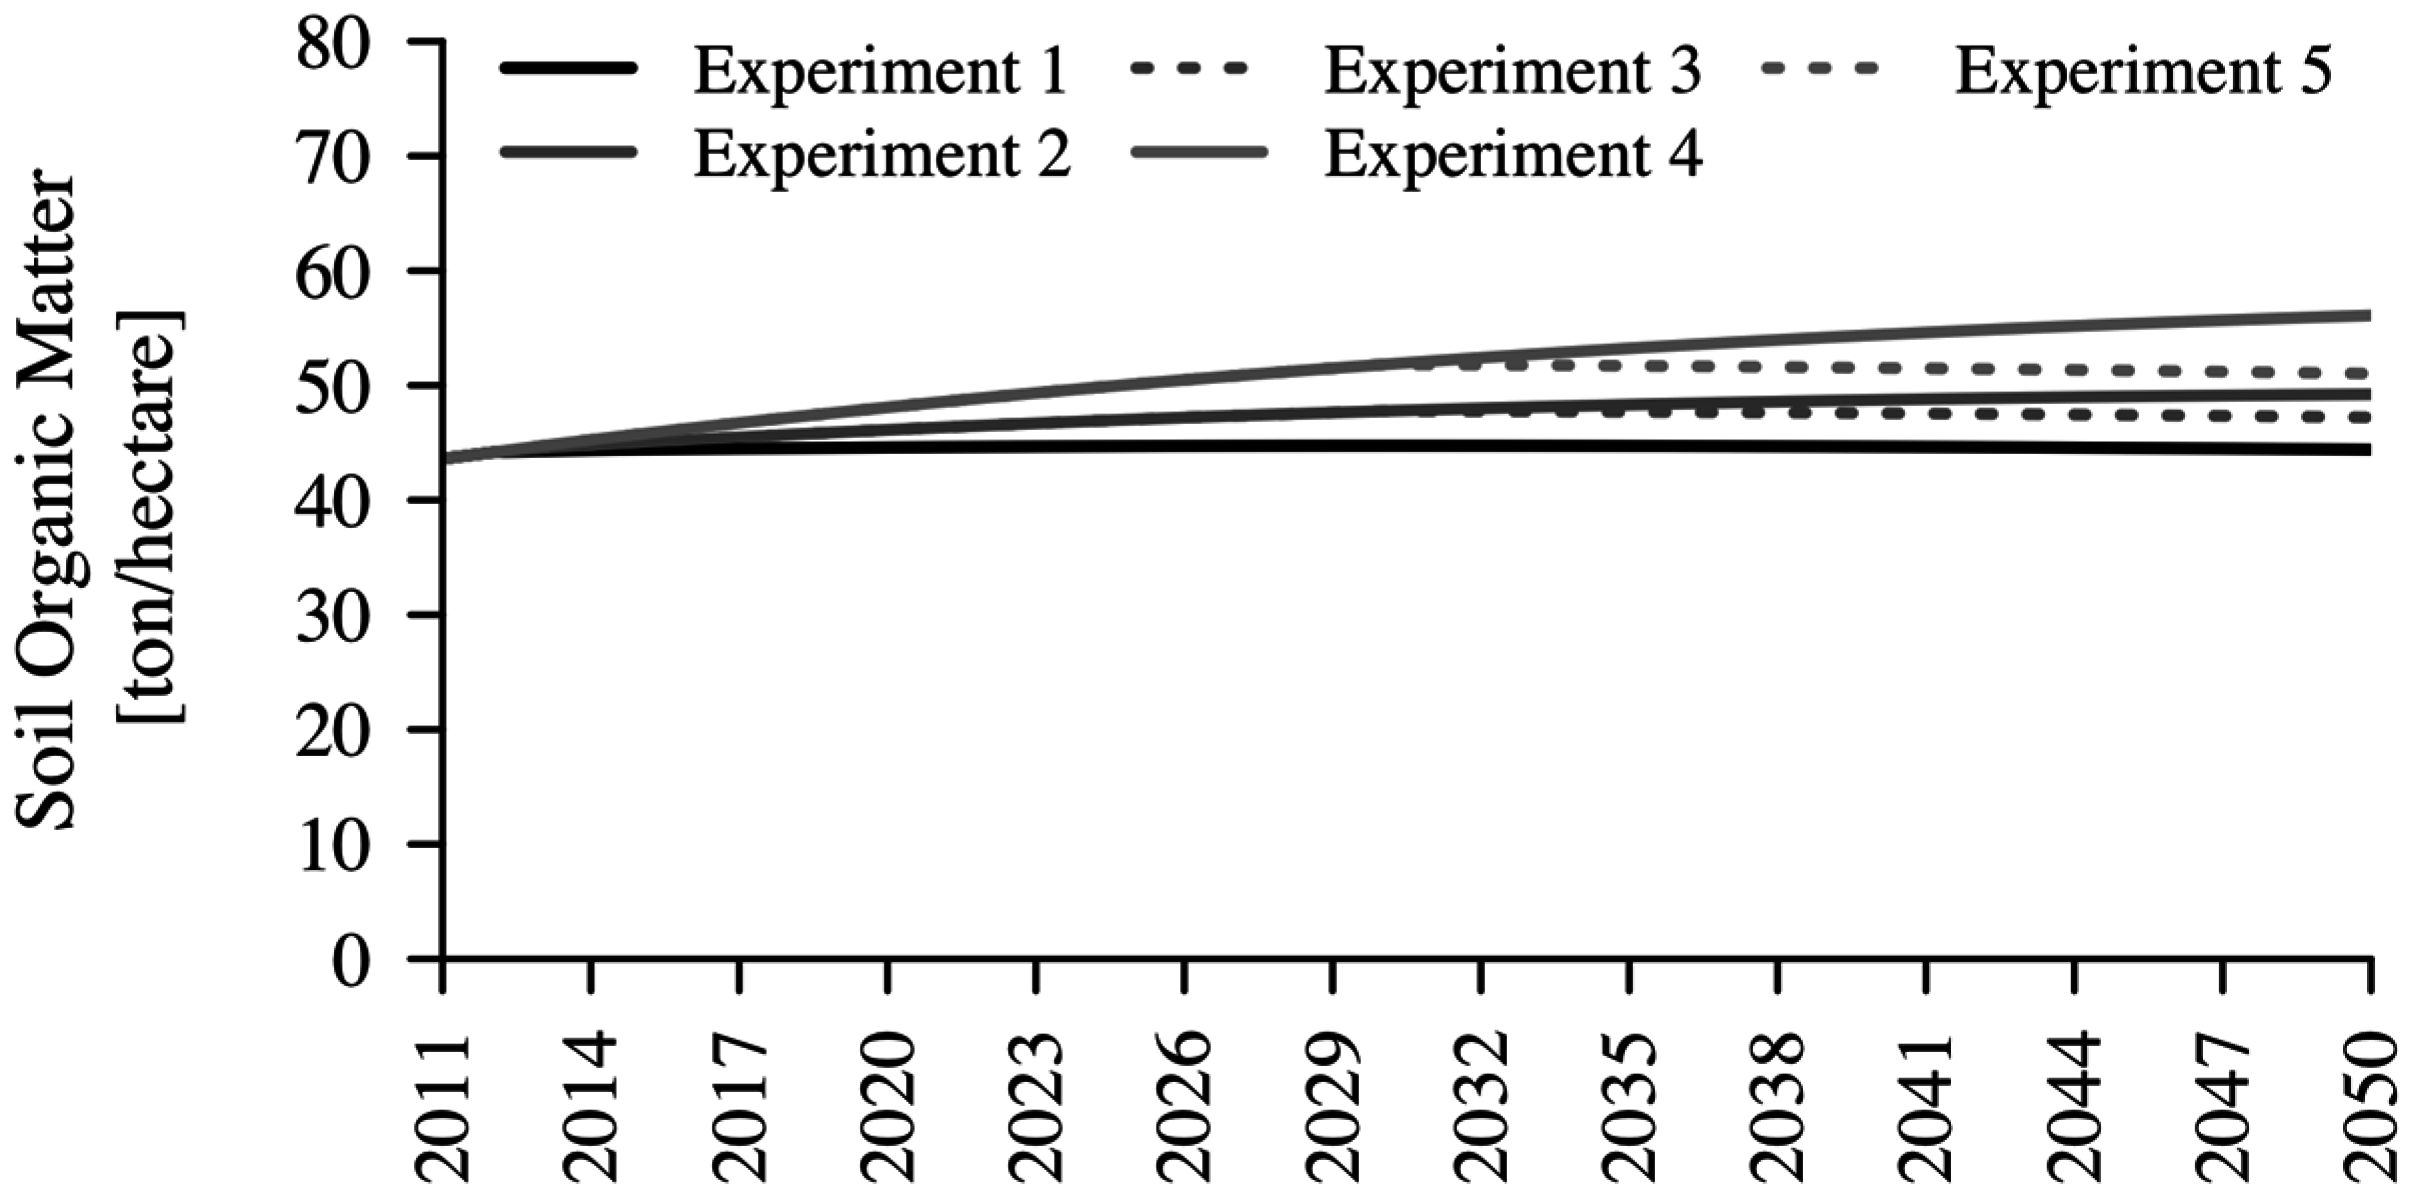
The above-described simulation model runs from 1984 to 2050. To capture long-term phenomena, the simulation model needs anchoring in a long-term reference period. Thus, the model was calibrated for Zambia using continuous annual data for 28 reference years. The reference period is 1984–2011, corresponding to the time when the data quality of central variables started to be reliable [22], and when reporting of major uniform data sources ceased (Table 1). Further time series were used as exogenous model inputs for the past and their prescription served as scenarios for the future in cases where parameters could not be assumed constant over the analysis period. Constant parameters were obtained through triangulation procedures, including a literature review, data analysis, and indirect optimization. An overview of the key constants is presented in Table 2.
The model was validated through structural and behavioral tests [18]. This article seeks to understand observed dynamics based on the underlying system structure. It is crucial in this context that the structure is a valid representation of the real processes that significantly contribute to creating the dynamic behavior. Structural validation was achieved through logical, theoretical, empirical, sensitivity, and boundary tests, which were continuously applied throughout the whole modeling process. The high number and the long, qualitative and repetitive nature of these tests meant it was not possible to present the results in an article such as this one. I therefore merely state that the model was found to be structurally robust, in part due to the theory integration described above, which is the result of extensive structure test procedures. Behavioral validity tests mainly focus on an adequate representation of general behavior patterns and to a much lesser extent on a precise match between model output and real data (in contrast to other modeling approaches, where this point-to-point match is crucial). Behavioral validity was achieved through structure-oriented behavior and behavior pattern tests. Figure 2 shows a comparison of historical data and the simulated trajectory of maize yield. The variable maize yield is suited for behavior and calibration tests because it is endogenously calculated, it is part of many feedback loops, and the data quality is reliable. Short-term variations in maize yield are subject to various factors [51], of which only the two main factors, nitrogen and precipitation, are captured in this model. Hence, the model does not control for all of the short-term variations. Instead, it focuses on and adequately represents the long-term trend of empirical maize yield trajectories, which is confirmed by the results of the Theil statistics (Table 3). Theil statistics decompose the overall root mean square percentage error (RMSPE) into three types of errors: bias error (UM), unequal variation between data and simulation error (US), and unequal co-variation error (UC). The error here (as presented in Table 3) is unsystematic because it concentrates in UC and the study focuses on long-term trends [52].
The past behavior in Figure 2 can be split into three phases. In the 1980s low fertilizer prices and partly high FSP expenditures supported the reinforcing sales loop (R3) in providing high maize yields and high maize availability. Through the reinforcing soil organic carbon loop (R1), SOM stocks increased (at low levels) and reinforced the high yields. The 1990s and early 2000s were characterized by high fertilizer prices, relatively low FSP expenditures, and an increasing area allocated to maize, resulting in lower applications of fertilizer per hectare and therefore lower yields. Consequently, SOM stagnated. Thus, the feedback loops that helped to increase maize yield in the 1980s were weak in the 1990s. Additionally, the growing population increased and through the balancing demand loop (B2) also the maize demand and maize prices increased. Consequently per capita maize availability dropped during the 1990s. As a reaction to the low maize availability, the 2000s were characterized by a further increase in maize area and increased FSP expenditures. In addition, fertilizer prices decreased again. These mechanisms strengthened the balancing land adjustment loop (B3), as well as the R1 and R3 loops, resulting in higher maize yields and production. However, per capita maize availability remained low during the 2000s because the population grew fast and maize production could not keep pace with the population increase.
Thus, a combination of endogenous mechanisms and exogenous variable trajectories accounts for the past behavior of Zambia’s maize production system. In the following section I provide an in-depth analysis of possible future maize production system outcomes under different FSP expenditure scenarios. For the following analysis I assume that the environment of the food production system remains sufficiently stable for the endogenous dynamics of the system not to be overruled by external influences.

6. Model Analysis

The model has been intensively analyzed to test the range of behavioral outcomes under varying parameter and policy assumptions. In this section I present a few experiments to highlight the most interesting outcomes. The model analysis runs from 2011 to 2050, which is long enough to study long-term social and environmental processes in the food production system. Although the analysis is projected into the future, it is not my intention to make point predictions. Instead, I aim to understand the fundamental mechanisms and behavior patterns of the food production system in response to the FSPs.
Simulating the future requires scenario assumptions about the value of exogenous parameters. If the values of a parameter fluctuated around a mean in the past, I calculated the average parameter value of the calibration period and applied it to the future (e.g., fertilizer price). However, this procedure is not reasonable for certain parameters because they show an increasing or decreasing past trend that will most likely extrapolate into the future. For example, population represents a major driving force in the food production system and the population is expected to grow continuously over the simulation period. I therefore applied an exogenous population scenario based on UN estimates [37], which project that the Zambian population will increase from 13.6 million people in 2011 to 44.2 million people in 2050. Further details about the scenarios of other variables are available in the fully specified Vensim model in the Supplementary Materials.
In the remaining part of this section I present eight simulation experiments for varying FSP expenditure patterns and evaluate the system’s outcome using the variable maize availability. Maize availability is suitable for this purpose because it is a major food system outcome, FSPs specifically aim at improving it, and when expressed on per capita basis maize availability allows for the growing population to be taken into account. A summary of the experiments’ setting is presented in Table 4.

6.1. Analysis of Mechanisms

Experiment 1 (base run without FSP expenditure) provides a useful introduction into the analysis (Figure 3). The growing population creates an increasing demand for maize, and the balancing supply loop (B1) and the balancing land adjustment loop (B3) try to adjust maize supply to the new levels of demand. However, low farm endowment and the missing FSPs hinder both loops from fully balancing supply and demand. Hence, maize availability first decreases and then stays around 725 kcal per person per day, which is insufficient compared to the estimated requirement of 1100 kcal per person per day.
Whereas experiment 1 without FSP expenditure results in low maize availability, experiments 2 and 4 test the impact of increasing levels of FSP expenditure. Simulation results suggest that FSPs strengthen both the reinforcing sales loop (R3) and balancing supply loop (B1) and thus the ability of the system to balance maize supply and demand. Through the sustained external subsidy input, maize production and maize availability experience an enduring increase, and if FSP expenditures are high enough maize availability will even reach the desired levels (in experiment 4). However, the success of FSPs in terms of maize availability has a downside, as experiments 3 and 5 reveal. Both experiments start with levels of FSP expenditure that are identical to those in the previous experiments 2 and 4. The only difference is that FSP is completely abandoned in the year 2030 in experiments 3 and 5. As a reaction to the FSP withdrawal, maize availability quickly and enduringly drops, but still settles above the level of no-subsidy experiment 1. Thus, a first insight is that FSPs constitute an instrument capable for maize availability steerage. However, the immediate drop in maize availability after the FSPs’ removal shows that the steerage potential is limited to the short-term.
The immediate response of maize availability to changes in the subsidy level happens because the reinforcing sales loop (R3) and balancing supply loop (B1) do not include major time delays. However, these two feedback loops are insufficient to understand why maize availability in experiments 3 and 5 (in which FSPs are initially applied and later dropped) settles above the no-subsidy case in experiment 1. Instead, soil dynamics play a central role, as shown in Figure 4. During the period of subsidy application, SOM stocks are built up though higher yields and biomass production. In addition, the reinforcing soil organic carbon and nitrogen loops (R1 and R2 loops) reinforce an upward behavior and accumulate SOM until external mechanisms stabilize the stock levels (R3 and B1 loops). If the subsidy program is abandoned, the inert SOM stock stays above the level of the no-subsidy case in experiment 1. Experiments 3 and 5 therefore result in higher long-term maize yields, production levels, and availability compared to experiment 1. Thus, a second key finding is that the FSP has a slow, positive impact on SOM, although the increase in SOM is moderate.
Having understood the crucial role of SOM stocks, I tested the impact of a new policy that directly addresses SOM accumulation (through incorporation of additional plant residues to the soil). Simulation results suggest that the policy, in addition to FSPs, has a beneficial impact on maize availability in the long run (experiment 6 in Figure 5). Because the new policy directly strengthens the reinforcing soil loops (R1 and R2) and allows a gradual SOM accumulation over time, maize availability steadily increases. The beneficial trend even endures on a lower level if FSPs are removed (as in experiment 7). Thus, a third key finding is that policies directly targeting SOM stocks are beneficial for long-term maize availability and enhance the system’s resilience to changes in FSP expenditure level because the increasing trend will endure even if FSPs are completely removed. In this sense, building up SOM stocks is a more sustainable policy than FSPs.
Given the short-term benefits of the FSPs and the delayed effect of SOM policies, experiment 8 combines the two approaches (Figure 5). In experiment 8, fertilizer subsidies are initially high and then continuously reduced before they completely expire in year 2040. Simulation results suggest that the combination and sequencing of the two instruments is a viable strategy to enhance maize availability and simultaneously abandon the subsidy program.

6.2. Analysis of Key Variables

The long-term impacts of the different policy assumptions on target variables are summarized in Table 5 and confirm the analysis of the above-described mechanisms. FSPs increase fertilizer use if applied enduringly. However, after FSP removal the increasing effect on fertilizer use is very little. FSPs also have an increasing effect on SOM stocks, but, policies directly targeted at SOM stocks show a higher effect, even if FSPs are removed. Subsequently, and due to the important role of SOM, also production variables, such as maize yield, maize production, and maize availability, are highest under a policy that directly addresses SOM. To a lesser extent, also FSPs have the potential to increase the values of these production indicators if they (the FSPs) are applied enduringly. However, the production indicators dropped in experiments in which FSPs were removed.

7. Discussion and Conclusions

In this article, I have integrated relevant theories into a simulation model to investigate both the short-term and long-term impacts of Zambia’s fertilizer subsidy program (FSP) on the country’s maize production system. The analysis of policy scenarios suggests that FSPs are a viable means to enhance short-term fertilizer use, productivity, maize production, and maize availability. However, the program’s long-term enhancement effect on maize availability will be limited once FSPs have been removed, because it fails to adequately build up soil organic matter (SOM) levels. SOM is a long-term leverage point and an important source of resilience in the maize production system. Alternative policies that add organic material to the soil directly target this leverage point and are more suitable than FSPs for enhancing long-term maize availability. These findings contribute in manifold ways to the current debate about FSPs in Zambia.
The findings that FSPs are effective for increasing fertilizer use and boosting maize production in the short term coincide with other studies’ findings (e.g., [4,53]). However, the short-term orientation of FSPs makes the maize production system in general and maize availability in particular vulnerable to changes in the government’s FSP expenditure and changes in fertilizer prices. This restricts the policy’s sustainability and indicates the need for alternative policies that strengthen the system’s resilience.
In common with Jayne and Rashid [2], my study finds that unfavorable and inert soil properties are a core factor for explaining why FSPs lack long-term efficiency. However, based on the integration of relevant theories and the specification of causal links, the findings here relativize the widespread agreement that a substantial increase in inorganic fertilizer use is necessary to improve soil fertility [3,8]. Although I have found some increase in SOM levels under FSPs, other policies directly targeting SOM have shown a much higher impact on relevant organic nutrient stocks and thus increased the system’s sustainability and resilience to changes in FSP expenditures. However, building up SOM stocks takes considerable time and the maize production system reacts to such policies in the long-term. Therefore, the two policy approaches are complementary, which has implications for policy formulation.
To reduce the maize production system’s dependence on FSP expenditure and to reduce other, aforementioned drawbacks, abandoning FSPs seems a reasonable strategy. To avoid drastic drops in maize availability, I suggest combining and sequencing the two policy approaches: while building up a long-term strategy for increasing SOM stocks, FSPs could gradually be phased out. Abrupt changes in maize availability are avoided by such a gradual transition, which might increase the political feasibility of abandoning FSPs. The study design enables an understanding of dynamic mechanisms on a broader level, but its capability to advise on a detailed implementation level is limited. Hence, other research addressing the implementation issues of SOM policies, such as by Place et al. [54] or by Vanlauwee [55] might complement the present study. Further research should also closely investigate costs, benefits and opportunity costs of such a gradual policy change. Special attention should be devoted to the state budget through the initial phase of transition when FSP expenditures are still high and simultaneous investments in extension services to implement soil policies are required.
Managing soils is generally complex [11]. Increasing SOM levels is a stock management problem and includes accumulation processes, which are subject to misperception [56]. Making the SOM accumulation processes explicit by visualization is a possible means to increase understandability of soil management. Based on the simulation approach taken in this article, Figure 6 translates Equation (2) into a visual representation where SOM is displayed by a rectangle that symbolizes a reservoir in which SOM accumulates. The forces that add and withdraw SOM from the reservoir—the addition of organic material to the soil and mineralization—are represented by arrows that symbolize the flows into and out of the SOM stock. Because the mineralization magnitude depends on the SOM stock level (Equation (2)), the mineralization process tends to bring the SOM level to a long-term dynamic equilibrium, depending on the inflow [29]. Thus in practice, SOM stock levels are manageable through the inflow, which can be controlled through the application of organic material from various sources, such as plant residues, compost, and manure. SOM stock levels only increase if the inflow (addition of organic material to the soil) is larger than the outflow (mineralization). Because both processes work simultaneously, SOM accumulation advances slowly, and output results such as higher yields may occur only in the long term. However, such output results are sustainable in the sense that once SOM has accumulated it does not degenerate quickly, due to the long mineralization time (Equation (2), Table 2). In addition to the these output results, higher SOM levels increase the maize production system’s resilience towards rainfall variation, which is a crucial property with regard to climate change.
This study has taken an approach that goes beyond mere statistical analysis to add a new perspective on the FSP debate, as suggested by Jayne and Rashid [2] and Crawford et al. [15]. I have integrated existing theories and made their connections explicit by formulating a fully specified simulation model. The results indicate the potential of such an approach. By structuring existing knowledge in a broader and dynamic context, conventional assumptions can be challenged and refined in a “virtual playground”. While this study has focused on the core production processes, future work could build on this by adding additional mechanisms. For example, poverty could be represented in more detail because its reduction is an underachieved goal of FSPs. Overall, this study has demonstrated the usefulness of feedback-based simulation tools and can be a stepping-stone for future work that aims to evaluate the sustainability of FSPs and other policies from a broader perspective.

Supplementary Materials

The following materials are available online at www.mdpi.com/2071-1050/8/10/1036/s1, Model M1: A folder with the Vensim model file, the data set needed for simulation, and the eight experiments. A detailed description and conceptual foundation of each variable is available in the comment field of the variables within the model file.

Acknowledgments

I warmly thank Birgit Kopainsky, Progress Nyanga, and Natalia Brzezina for their valuable support and comments. Work on this article was supported by the Research Council of Norway through the project “Simulation based tools for linking knowledge with action to improve and maintain food security in Africa” (contract number 217931/F10). The views and conclusions expressed in this article are those of the author alone and do not necessarily reflect the views of the Research Council of Norway.

Conflicts of Interest

The author declares no conflict of interest. The founding research council had no role in the design of the study, in the collection, analyses, or interpretation of data, in writing the manuscript, or in the decision to publish the results.

References

  1. Banful, A.B. Old problems in the new solutions? Politically motivated allocation of program benefits and the “new” fertilizer subsidies. World Dev. 2011, 39, 1166–1176. [Google Scholar] [CrossRef]
  2. Jayne, T.S.; Rashid, S. Input subsidy programs in Sub-Saharan Africa: A synthesis of recent evidence. Agric. Econ. 2013, 44, 547–562. [Google Scholar] [CrossRef]
  3. Morris, M.; Kelly, V.A.; Kopicki, R.J.; Byerlee, D. Fertilizer Use in African Agriculture: Lessons Learned and Good Practice Guidelines; The World Bank: Washington, DC, USA, 2007. [Google Scholar]
  4. Mason, N.M.; Jayne, T.S.; Mofya-Mukuka, R. Zambia’s input subsidy programs. Agric. Econ. 2013, 44, 613–628. [Google Scholar] [CrossRef]
  5. Jayne, T.S.; Mather, D.; Mason, N.; Ricker-Gilbert, J. How do fertilizer subsidy programs affect total fertilizer use in Sub-Saharan Africa? Crowding out, diversion, and benefit/cost assessments. Agric. Econ. 2013, 44, 687–703. [Google Scholar] [CrossRef]
  6. Dorward, A.; Chirwa, E. The Malawi agricultural input subsidy program: 2005/06 to 2008/09. Int. J. Agric. Sustain. 2011, 9, 232–247. [Google Scholar] [CrossRef]
  7. Mason, N.M.; Tembo, S.T. Is FISP Reducing Poverty among Smallholder Farm Households in Zambia? Indaba Agricultural Policy Research Institute: Lusaka, Zambia, 2015. [Google Scholar]
  8. Druilhe, Z.; Barreiro-Hurlé, J. Fertilizer Subsidies in Sub-Saharan Africa; Food and Agriculture Organization (FAO) Agricultural Development Economics Division: Rome, Italy, 2012. [Google Scholar]
  9. Denning, G.; Kabambe, P.; Sanchez, P.; Malik, A.; Flor, R.; Harawa, R.; Nkhoma, P.; Zamba, C.; Banda, C.; Magombo, C.; et al. Input subsidies to improve smallholder maize productivity in Malawi: Toward an African green revolution. PLoS Biol. 2009, 7, 2–10. [Google Scholar] [CrossRef] [PubMed]
  10. Jayne, T.S.; Govereh, J.; Wanzala, M.; Demeke, M. Fertilizer market development: A comparative analysis of Ethiopia, Kenya, and Zambia. Food Policy 2003, 28, 293–316. [Google Scholar] [CrossRef]
  11. Tully, K.; Sullivan, C.; Weil, R.; Sanchez, P. The state of soil degradation in Sub-Saharan Africa: Baselines, trajectories, and solutions. Sustainability 2015, 7, 6523. [Google Scholar] [CrossRef]
  12. Shitumbanuma, V.; Chikuta, F. Nutrient Status of the Major Agricultural Soils of the Eastern Province of Zambia; The International Institute of Tropical Agriculture: Lusaka, Zambia, 2013. [Google Scholar]
  13. Kumwenda, J.D.T.; Waddington, S.R.; Snapp, S.S.; Jones, R.B.; Blackie, M.J. Soil fertility management in southern Africa. In Africa’s Emerging Maize Revolutaion; Byerlee, D., Eicher, C.E., Eds.; Lynne Rienner Publishers Inc.: Boulder, CO, USA, 1997. [Google Scholar]
  14. Crawford, E.W.; Kelly, V.; Jayne, T.S.; Howard, J. Input use and market development in Sub-Saharan Africa: An overview. Food Policy 2003, 28, 277–292. [Google Scholar] [CrossRef]
  15. Crawford, E.W.; Jayne, T.S.; Kelly, V.A. Alternative Approaches for Promoting Fertilizer Use in Africa; The World Bank: Washington, DC, USA, 2006. [Google Scholar]
  16. Stave, K. Participatory system dynamics modeling for sustainable environmental management: Observations from four cases. Sustainability 2010, 2, 2762. [Google Scholar] [CrossRef]
  17. Sterman, J.D. Business Dynamics; McGraw-Hill Inc.: New York City, NY, USA, 2000. [Google Scholar]
  18. Barlas, Y. Formal aspects of model validity and validation in system dynamics. Syst. Dyn. Rev. 1996, 12, 183–210. [Google Scholar] [CrossRef]
  19. Flynn, H.; Breger, D.; Belden, A.; Bier, A.; Laurent, C.; Andrews, N.; Rickerson, W. System dynamics modeling of the Massachusetts SREC market. Sustainability 2010, 2, 2746. [Google Scholar] [CrossRef]
  20. Food and Agriculture Organization. Food balance sheet. Available online: http://faostat.fao.org/site/368/default.aspx#ancor (accessed on 15 April 2015).
  21. Tembo, S.; Sitko, N. Technical Compendium: Descriptive Agricultural Statistics and Analysis for Zambia; Indaba Agriculture Policy Research Institute: Lusaka, Zambia, 2013. [Google Scholar]
  22. Wood, A.P.; Kean, S.A.; Milimo, J.T.; Warren, D.M. The Dynamics of Agricultural Policy and Reform in Zambia; Iowa State University Press: Ames, IO, USA, 1990. [Google Scholar]
  23. Heady, E.O.; Dillon, J.L. Agricultural Production Functions; Iowa State University Press: Ames, IO, USA, 1961. [Google Scholar]
  24. Scheffer, F.; Schachtschabel, P. Lehrbuch der Bodenkunde, 16th Auflage ed.; Spektrum Akademischer Verlag, Springer: Heidelberg, Germany, 2010. [Google Scholar]
  25. Schilling, G. Pflanzenernährung und Düngung; Eugen Ulmer Verlag: Stuttgart, Germany, 2000. [Google Scholar]
  26. Varian, H.R. Grundzüge der Mikroökonomik; Oldenbourg Wissenschaftsverlag GmbH: Munich, Germany, 2007. [Google Scholar]
  27. Henrichsmeyer, W.; Witzke, H.P. Agrarpolitik Band 1 Agrarökonomische Grundlagen; Eugen Ulmer GmbH & Co.: Stuttgart, Germany, 1991. [Google Scholar]
  28. Meadows, D.L. Dynamics of Commodity Production Cycles; Wright-Allen Press: Cambridge, MA, USA, 1970. [Google Scholar]
  29. Johnston, A.E.; Poulton, P.R.; Coleman, K. Soil organic matter: Its importance in sustainable agriculture and carbon dioxide fluxes. Adv. Agron. 2009, 101, 1–57. [Google Scholar]
  30. Oberholzer, H.R.; Leifeld, J.; Mayer, J. Changes in soil carbon and crop yield over 60 years in the Zurich organic fertilization experiment, following land-use change from grassland to cropland. J. Plant Nutr. Soil Sci. 2014, 177, 696–704. [Google Scholar] [CrossRef]
  31. Chapoto, A.; Haggblade, S.; Hichaambwa, M.; Kabwe, S.; Longabaugh, S.; Sitko, N.; Tschirley, D. Agricultural Transformation in Zambia: Alternative Institutional Models for Accelerating Agricultural Productivity Growth and Commercialization; Indaba Agricultural Policy Research Institute: Lusaka, Zambia, 2012. [Google Scholar]
  32. Lambin, E.F.; Turner, B.L.; Geist, H.J.; Agbola, S.B.; Angelsen, A.; Bruce, J.W.; Coomes, O.T.; Dirzo, R.; Fischer, G.; Folke, C.; et al. The causes of land-use and land-cover change: Moving beyond the myths. Glob. Environ. Chang. 2001, 11, 261–269. [Google Scholar] [CrossRef]
  33. De Vries, B. Sustainability Science; Cambridge University Press: Cambridge, UK, 2012. [Google Scholar]
  34. Ventana. Vensim; Ventana Systems, Inc.: Harvard, MA, USA, 2013. [Google Scholar]
  35. Burke, W.J.; Jayne, T.S.; Chapoto, A. Factors Contributing to Zambia’s 2010 Maize Bumper Harvest; Indaba Agricultural Policy Research Institute: Lusaka, Zambia, 2010. [Google Scholar]
  36. International Panel on Climate Change. IPCC Guidelines for National Greenhouse Gas Inventories; International Panel on Climate Change: Geneva, Switzerland, 2006; Chapter 11. [Google Scholar]
  37. Food and Agriculture Organization. Population Estimates and Projections. Available online: http://faostat.fao.org/site/550/default.aspx#ancor (accessed on 20 November 2014).
  38. Food and Agriculture Organization. Production Series. Available online: http://faostat.fao.org/site/567/default.aspx#ancor (accessed on 11 November 2014).
  39. Food and Agriculture Organization. Resource Series. Available online: http://faostat.fao.org/site/674/default.aspx (accessed on 20 November 2014).
  40. Kumar, S.K. Design, Income distribution, and consumption effects of maize pricing policies in Zambia. In Food Subsidies in Developing Countries; Johns Hopkins University Press: Baltimore, MD, USA, 1988; pp. 289–300. [Google Scholar]
  41. Mason, N.M.; Myers, R.J. The effects of the food reserve agency on maize market prices in Zambia. Agric. Econ. 2013, 44, 203–216. [Google Scholar] [CrossRef]
  42. Ministry of Agriculture and Cooperatives. Provincial Prices from 1994 to 2012; Ministry of Agriculture and Cooperatives: Lusaka, Zambia, 2014.
  43. Howard, J.A.; Chitalu, G.M.; Kalonge, S.M. The Impact of Investments in Maize Research and Dissemination in Zambia Part One: Main Report; Michigan State University: East Lansing, MI, USA, 1993. [Google Scholar]
  44. Zulu, B.; Nijhoff, J.J.; Jayne, T.S.; Negassa, A. Is the Glass Half Empty or Half Full? An Analysis of Agricultural Production Trends in Zambia; Zambia Food Security Research Project: Lusaka, Zambia, 2000. [Google Scholar]
  45. Chiwele, D.; Fowler, M.; Humphrey, E.; Hurrell, A.; Willis, J. Agriculture Case Study. Evaluation of Budget Support in Zambia; Oxford Policy Management: Oxford, UK, 2010. [Google Scholar]
  46. Government of the Republic of Zambia. Estimates of Revenue and Expenditure (including Capital and Constitutional and Statutory Expenditure); Government of the Republic of Zambia: Lusaka, Zambia, 2014.
  47. Zambia Meteorological Department. Monthly Precipitation Data; Zambia Meteorological Department: Lusaka, Zambia, 2014.
  48. Food and Agriculture Organization. Emission Series. Available online: http://faostat.fao.org/site/704/default.aspx (accessed on 11 November 2014).
  49. International Fertilizer Development Center. Zambia Fertilizer Assessment; International Fertilizer Development Center: Muscle Shoals, AL, USA, 2013. [Google Scholar]
  50. Central Statistical Office. Crop Forecast Survey; Central Statistical Office: Lusaka, Zambia, 2014.
  51. Xu, Z.; Guan, Z.; Jayne, T.S.; Black, R. Factors influencing the profitability of fertilizer use on maize in Zambia. Agric. Econ. 2009, 40, 437–446. [Google Scholar] [CrossRef]
  52. Sterman, J.D. Appropriate summary statistics for evaluating the historical fit of system dynamics models. Dynamica 1984, 10, 51–66. [Google Scholar]
  53. Lunduka, R.; Ricker-Gilbert, J.; Fisher, M. What are the farm-level impacts of Malawi’s farm input subsidy program? A critical review. Agric. Econ. 2013, 44, 563–579. [Google Scholar] [CrossRef]
  54. Place, F.; Barrett, C.B.; Freeman, H.A.; Ramisch, J.J.; Vanlauwe, B. Prospects for integrated soil fertility management using organic and inorganic inputs: Evidence from smallholder African agricultural systems. Food Policy 2003, 28, 365–378. [Google Scholar] [CrossRef]
  55. Vanlauwe, B.; Giller, K.E. Popular myths around soil fertility management in Sub-Saharan Africa. Agric. Ecosyst. Environ. 2006, 116, 34–46. [Google Scholar] [CrossRef]
  56. Sterman, J.D. Does formal system dynamics training improve people’s understanding of accumulation? Syst. Dyn. Rev. 2010, 26, 316–334. [Google Scholar] [CrossRef] [Green Version]
Figure 1. Modeling framework for the Zambian plant production system. Notes: The arrows indicate causal relationships directed towards the arrowheads; a plus sign (+) denotes a positive polarity, indicating that the effect variable develops in the same direction as the cause variable. Similarly, a minus symbol (−) denotes a negative polarity, indicating that the effect variable changes in the reverse direction of the cause variable; A circular chain of causal relationships builds a feedback loop that is labeled with its polarity R (indicating self-reinforcing behavior) or B (indicating balancing behavior); the following feedback loops are represented: R1: reinforcing soil organic carbon loop; R2: reinforcing soil organic nutrients loop; R3: reinforcing sales loop; B1: balancing supply loop; B2: balancing demand loop; B3: balancing land adjustment loop; note that these feedback loops represent the fundamental processes of the framework. The complete simulation model used for the analysis contains additional mechanisms for operationalization and is available under Supplementary Materials.
Sustainability 08 01036 g001
Figure 2. Simulated trajectories of Zambia’s maize yield compared to historical data (1984–2011).
Sustainability 08 01036 g002
Figure 3. Simulation results of maize availability for five experiments under varying fertilizer subsidy program (FSP) scenarios for the period 2011–2050.
Sustainability 08 01036 g003
Figure 4. Simulation results of soil organic matter for five experiments for the period 2011–2050.
Sustainability 08 01036 g004
Figure 5. Simulation results of maize availability in four experiments under varying fertilizer subsidy program (FSP) and soil organic matter (SOM) accumulation policies for the period 2011–2050.
Sustainability 08 01036 g005
Figure 6. Visual representation of the soil organic matter (SOM) stock accumulation process. The box indicates a stock that accumulates over time and the arrows represent flows that change the stock level over time.
Sustainability 08 01036 g006
Table 1. Data series used in the simulation process.
Data SeriesUsageSources
PopulationModel input & scenario[37]
Maize yieldCalibration[38]
Maize productionCalibration[38]
Arable landCalibration[38]
Maize tradeModel input & scenario[20]
Land useCalibration[39]
Maize pricesCalibration[22,40,41,42]
Fertilizer useCalibration[39]
Fertilizer pricesModel input & scenarioEstimated from [42]
Fertilizer subsidiesModel input & scenario[22,43,44,45,46]
PrecipitationModel input & scenario[47]
Manure applicationModel input & scenario[48]
Soil organic matterCalibrationQualitative, [49]
Maize salesCalibration[22,50]
Table 2. Parameter values for key constants in the model.
ConstantValue
c1 (yield coefficient of nitrogen)4.03 (ha·year/ton)
c2 (yield coefficient of water)0.004 (year/mm)
ε (price sensitivity to supply-demand imbalances)−0.86
Pref (reference producer maize price)55 (ZMK/kg)
tmin (mineralization time of SOM)31 (year)
PCCN (per capita calories need)2200 (kcal/person/day)
Plant residues removed from field70 (%)
Seed requirement0.03 (ton/ha/year)
Demand sensitivity to consumer price−0.1
Table 3. Theil statistics to compare simulated trajectories with data for maize yields.
RMSPEU(M)U(S)U(C)R2
0.2540.0000.0140.9860.521
Table 4. Policy assumptions of the simulation experiments.
EXPNFSPEFSPDSOMPDescription
E10ConstantNoBase run: no policy in place
E21.9810ConstantNoMedium FSPE 1; Extrapolation of the status quo
E31.9810Drop in 2030NoMedium FSPE; FSP removed in 2030
E44.5010ConstantNoHigh FSPE
E54.5010Drop in 2030NoHigh FSPE; FSP removed in 2030
E61.9810ConstantYesMedium FSPE & addition of SOM
E71.9810Drop in 2030YesMedium FSPE, addition of SOM; FSP removed in 2030
E84.5010Linear fallYesHigh FSPE, addition of SOM; FSP gradually removed
Notes: EXPN = experiment number; FSPE = fertilizer subsidy program expenditures (ZMK/year); FSPD = fertilizer subsidy program expenditure development; SOMP = Soil organic matter policy in place; FSP = fertilize subsidy program; SOM = soil organic matter; 1 Average FSP expenditure in the period 1984–2011.
Table 5. Simulation values of key variables in 2050 for the different experiments.
EXPN Fertilizer UseSoil Organic MatterMaize YieldMaize ProductionMaize Availability
E1Value28,916441.53.8717
E2Value44,061491.94.6876
Change to E1+52%+11%+21%+22%+22%
E3Value30412471.74.1776
Change to E1+5%+6%+8%+8%+8%
E4Value65617562.45.91114
Change to E1+127%+26%+53%+55%+55%
E5Value32468511.84.5856
Change to E1+12%+15%+19%+19%+19%
E6Value47255692.76.41382
Change to E1+63%+56%+78%+69%+93%
E7Value40545662.56.21171
Change to E1+40%+49%+62%+63%+63%
E8Value37833712.76.31322
Change to E1+31%+60%+74%+68%+84%
Notes: EXPN = experiment number; fertilizer use in tons nitrogen/year; soil organic matter in tons/ha; maize yield in tons/ha/year; maize production in million tons/year; and maize availability in kcal/person/day.

