1. Introduction
There is an imperative demand for low-cost, energy-efficient housing in the Republic of Macedonia. Macedonia is not rich in energy resources and the annual energy import represents 10% of total energy consumption. Energy consumption in the domestic sector was 30% of the total energy consumption in the country (data 2010). The main part of this consumption goes to heating. In order to reduce energy consumption and costs, as well as to improve the indoor environment, constructors have started to implement energy efficiency measures in buildings. They aim for efficient structural design, reduction in the use of high energy building materials such as glass, steel etc. and transportation energy, as well as the use of low energy building materials.
The lack of national regulations on energy performance of buildings has been an obstacle for the improvement of buildings in Republic of Macedonia for many years, together with education for the certification of energy controllers. However, national regulations were delivered in July 2013 and this will enable improvement in the energy performance of buildings in the long term.
The assessment of materials for thermal insulation of the building envelope has the most significant contribution to the reduction of building energy consumption in general. The adequate placement and location of insulation has a positive influence on unsteady heat transfer in the external walls and roofs. The results of the analysis of Kontoleon & Bikas [
1] showed that the placement of three equal layers of insulation is the optimal solution for external walls and roofs. Usually, the best performances can be obtained if the insulation layer is near the entrance point of the heat flux. Due to this fact, the internal insulation layer is more appropriate for climate regions with dominant heating, while the insulation layer on the external side of the wall is better for climate zones with dominant cooling. Some practical experience of Papadopoulos [
2] reports that the best performance of the building envelope is achieved with an external layer of insulation material on the building.
The application of new, alternative and improved materials and systems has an important impact on the performance of buildings. The establishment of a correlation between theoretical and practical analysis for determination of the preventive solutions for building performance in exploitation is especially important. The deficit of analytical and experimental determined data for parameters, which point to the efficiency of the measures for façade insulation, is probably a key factor for their insufficient and inadequate application in construction. Furthermore, regulation, according to which the necessary steps for construction of an energy efficient building should be defined, is relatively new in many countries, including Macedonia.
The
U-values, which are usually calculated with appropriate software, are based on a simplified calculation, using a database of technical data for the commonly used building materials and systems. In-situ measurements associated with England housing confirm findings in some works that the measured
U-values of solid walls are significantly below the calculated ones [
3]. Often, in a case of non-standard structures, or when analysing new, unexplored building elements or systems, the need for more precise determination of the thermal transmittance may appear, due to the limitations of the software of the material of choice. When historical buildings have to be measured, difficulties appear due to the unknown internal wall structures, which make the calculation imprecise. In that case, in-situ measurements are the most favourable. The study of Baker [
4] found that different software codes for calculation of the
U-value tended to over-estimate the
U-values of the traditional building elements in historical Scottish buildings. The measurement of non-homogeneous walls is especially important, because the numerical calculation of their
U-value is not precise, due to the unknown thickness of the different layers and materials. The new research of Li et al. [
5] also confirms that heat flux measurements are difficult to undertake in occupied properties and possible sources of error could lead to under-predictions of the
U-value.
A practical comparison of two useful tools for determination of the thermal transmittance has been made in this paper: using software calculation and by in-situ measurements under real conditions on a building in the exploitation phase. The U-values are commonly calculated or well known for the types of walls which are often used. Nevertheless, the fact that the measured and analysed façade walls were constructed with the system Fragmat NZ-1, which is a relatively new product on the Macedonian market, leads to the conclusion that its thermal performances are not well-known. This system has specific geometrical properties that differ from the most usually performed façades in Macedonia. This research provides basic information on the thermal transmittance of the system.
2. Description of a New Façade Wall FRAGMAT NZ-1
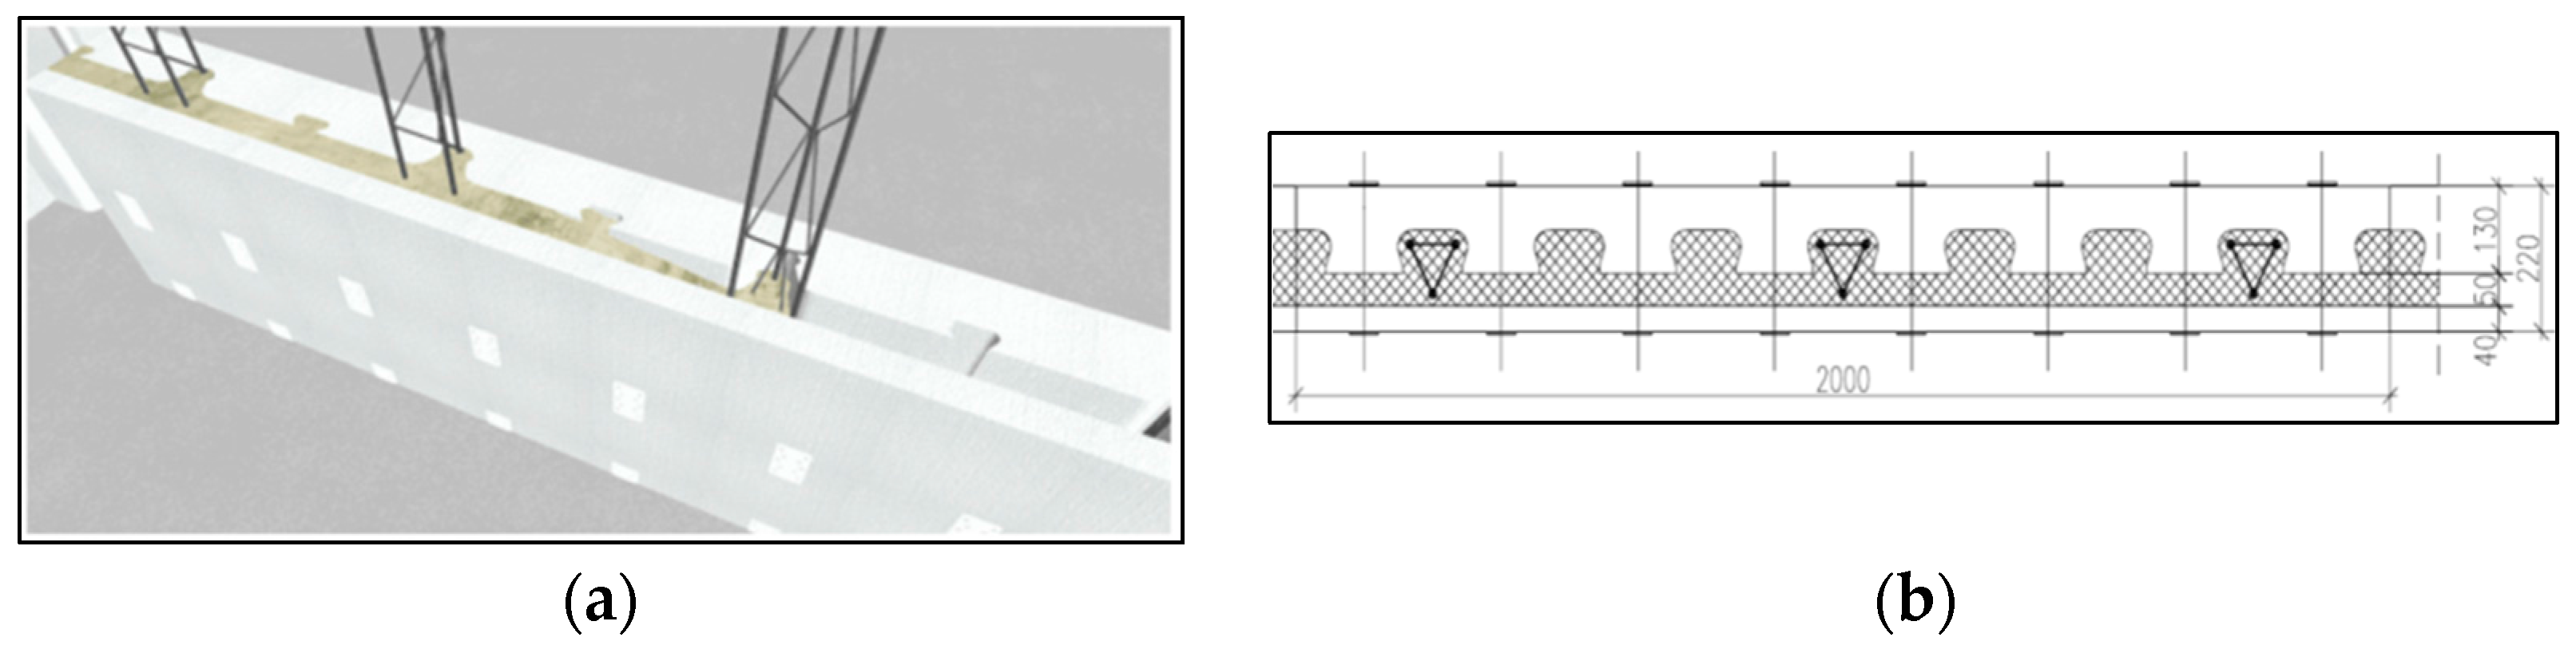
The system Fragmat NZ-1 presents a complete three-layer structure for construction of façade walls and building envelopes, presented in
Figure 1. Functionally, it is an innovative and relatively new method for construction of the building envelope, significantly different from the widely accepted ceramic-block wall. It consists of two layers of expanded polystyrene and a mid-layer of concrete, reinforced with trusses [
6]. The integrated thermal insulation simultaneously presents a formwork for the concrete layer, which on the other hand, provides the mechanical strength of the wall. The total width of the system is 220 mm. The internal layer is a flat slab of EPS with thickness of 40 mm and density of 25 kg/m
3. The external layer is 130 mm thick and has a socket of 75 mm at each 250 mm, providing a connection with the internal concrete column, strengthened with reinforcement trusses,
Figure 1. The external layer has a density of 17 kg/m
3. One of the advantages of this system is that it does not need any formwork for placement of the concrete, and therefore the expenses for its construction are much lower than for the traditional reinforced concrete walls.
3. Thermal Transmittance
The thermal transmittance, or the
U-value, of a building element is defined in IS0 7345 as the “Heat flow rate in the steady state divided by area and by the temperature difference between the surroundings on each side of a system” [
7].
The thermal transmittance represents an indicator of the thermal performances of the building elements. Calculation of the U-values is necessary for validating the energy efficiency of the building, according to the actual rules for construction of new buildings, as well as for repair and reconstruction of existing buildings in order to improve their energy efficiency.
In principle, the
U-value can be obtained by measuring the heat flow rate through an element with a heat flow meter or a calorimeter, as well as the temperatures on both sides of the element under steady state conditions. However, since steady state conditions are never encountered on a site in practice, such a simple measurement is not possible. Nevertheless, there are several ways of overcoming this difficulty:
Imposing steady-state conditions by the use of a hot and a cold box. This method is commonly used in the laboratory (IS0 8990), but is cumbersome in the field;
Assuming that the mean values of the heat flow rate and temperatures over a sufficiently long period of time give a good estimate of the steady state. This method is valid if the thermal properties of the materials and the thermal transmittances are constant over the range of temperature fluctuations occurring during the test, and if the change of amount of heat stored in the element is negligible when compared to the amount of heat going through the element. This method is widely used but may lead to long periods of measurement and may give erroneous results in certain cases;
Using a dynamic theory to take into account the fluctuations of the heat flow rate and temperatures in the analysis of the recorded data.
According to the new adopted Macedonian Rulebook on the energy performance of buildings, there is a limitation of the
U-value. The maximum allowed
U-values are prescribed, depending on the considered building in the structure [
8]. The façade walls analysed in this paper belong to the first category, and the maximal
U-value equals to 0.35 W/m
2K.
Analytical calculation of the U-value. The analytical software calculation of the thermal transmittance is performed with the simple software “Ucalc”, with an approximate thickness of the external layer of the insulating material, due to the improper geometrical form of the layer of extruded polystyrene. The obtained value of such a simplified calculation is U = 0.22 W/m2K. This value, according to the standards, is used as a point of reference for comparison of the final measured results on a real building.
4. Measurement of the Heat Flux of the Wall
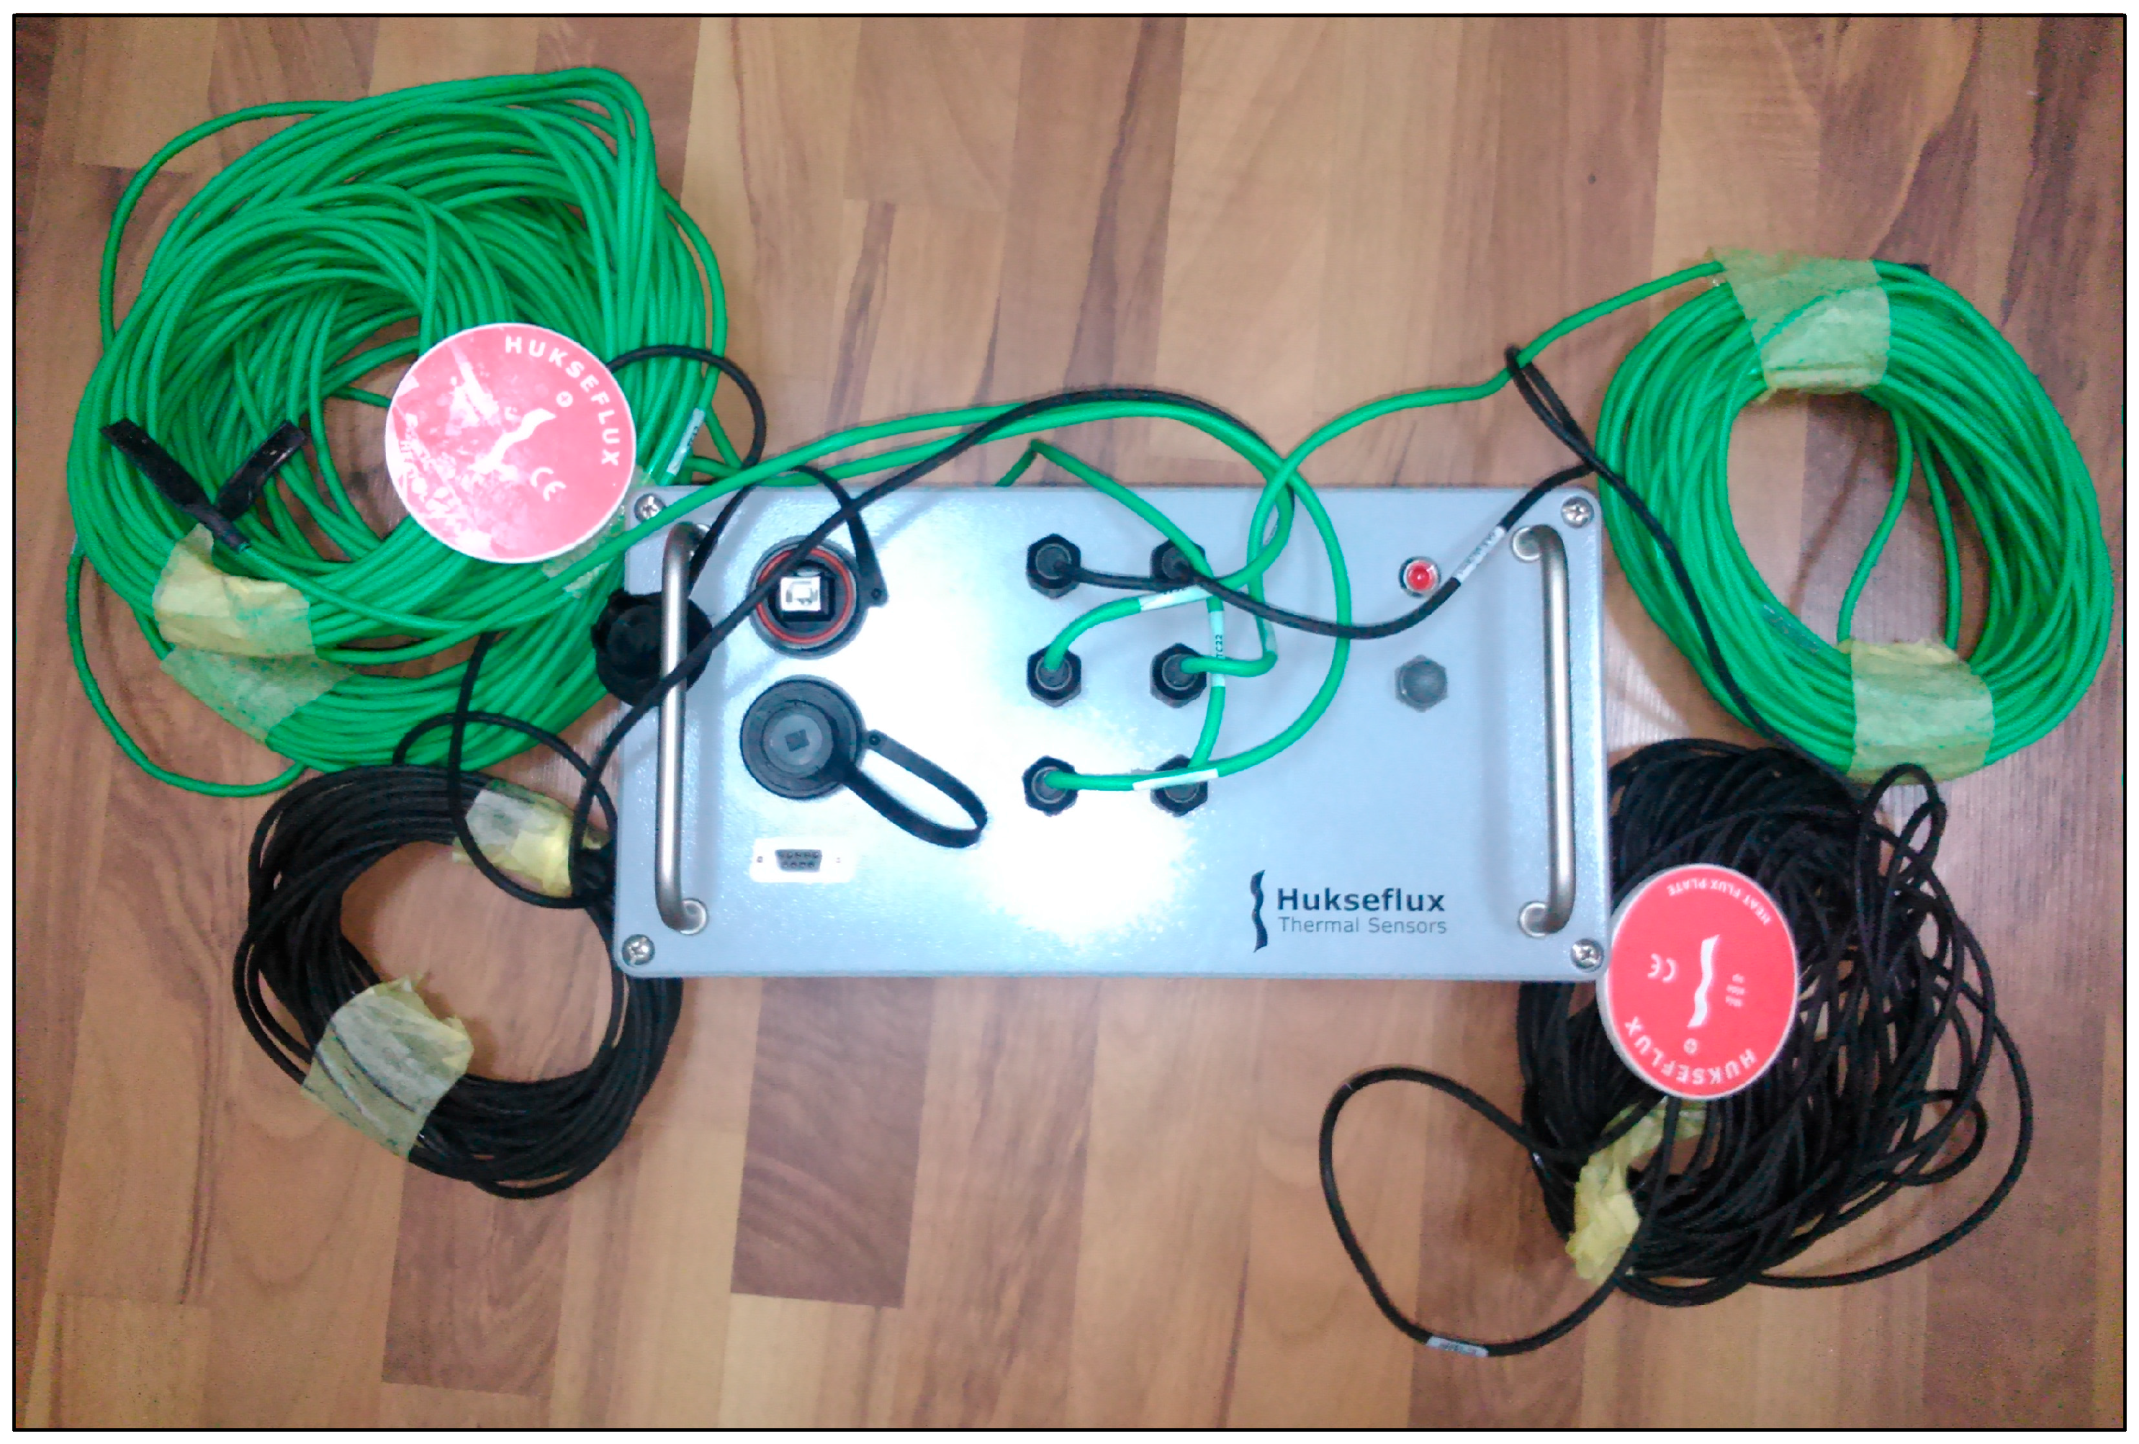
4.1. Description of the Measurement Instrument TRSYS01-HFM
TRSYS01-HFM (heat flow meter) is a measurement system for analysis of thermal resistance and thermal transmittance of building elements by in-situ measurement [
9]. It can be used for measurements according to ISO 9869 [
10], and ASTM C1155 and C1046 standards [
11]. In its usual standard configuration, the system is equipped with two heat flux sensors, as well as with two pairs of matched thermocouples for differential temperature measurements,
Figure 2.
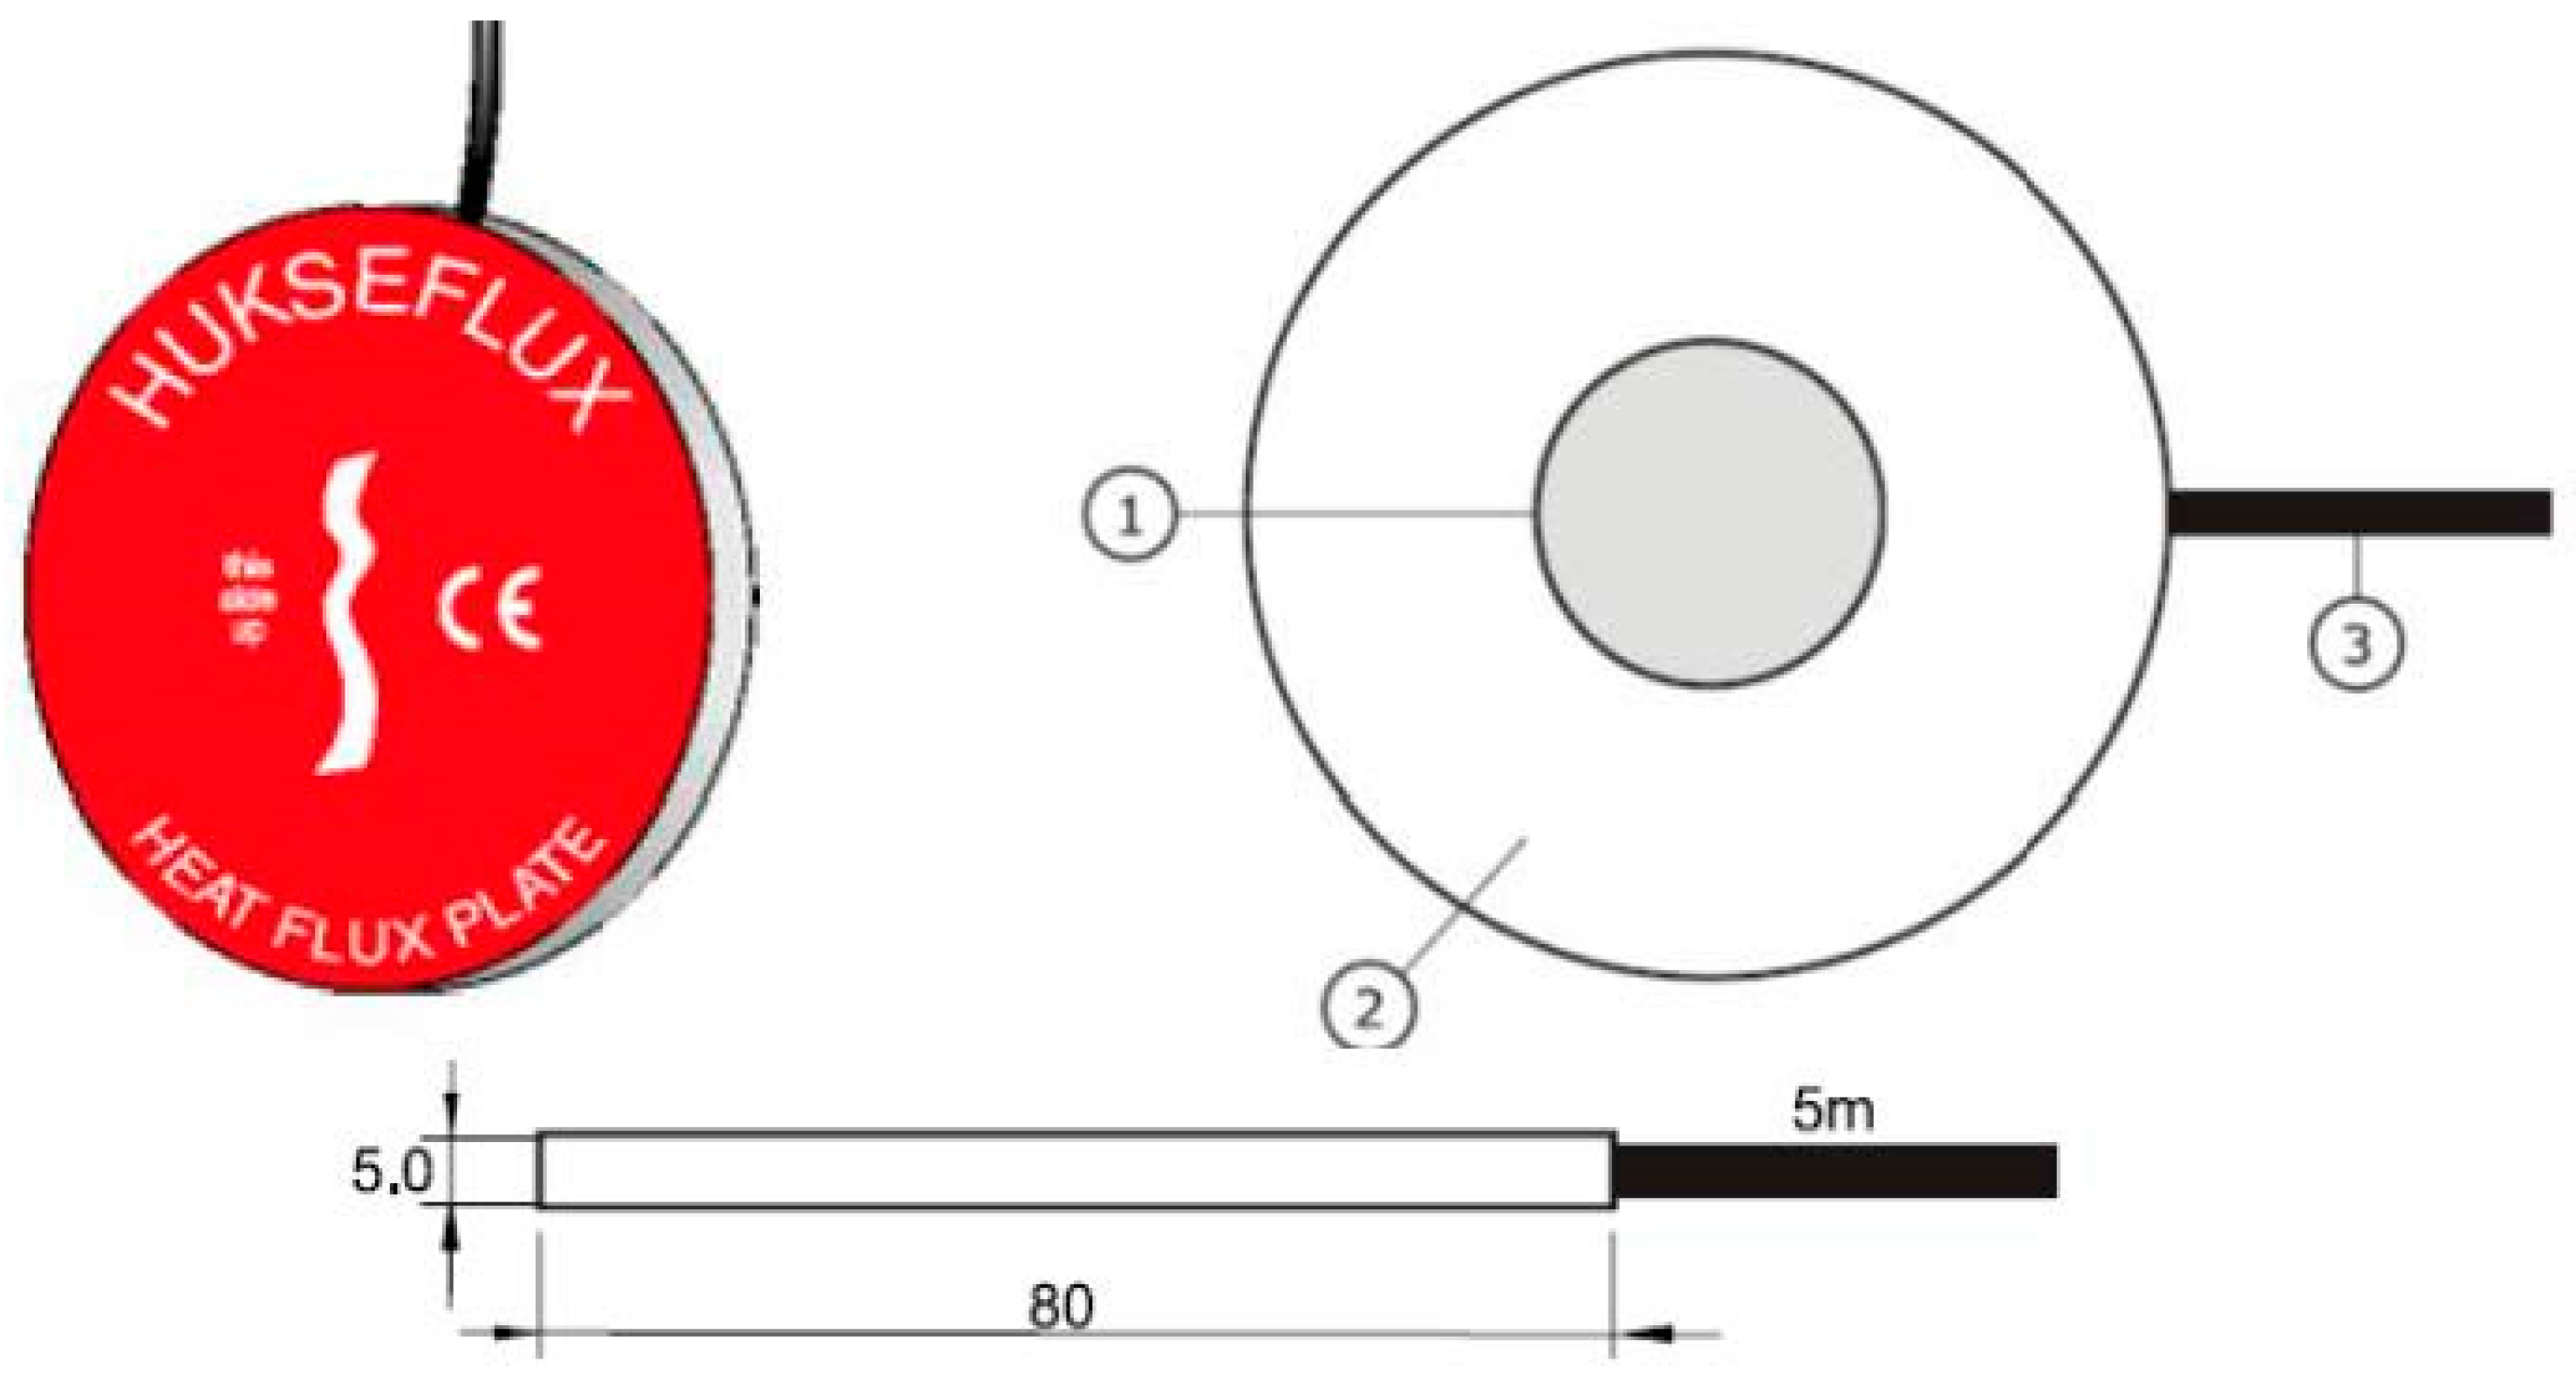
Temperature sensors, presented in
Figure 3, are transducers giving an electrical signal which is a monotonic function of their temperature. A minimum of two temperature sensors are used, one on each side of the tested structural element.
During the measurements, the following recommendations should be followed:
location with exposure to direct solar radiation should be avoided as much as possible;
the more heat flux, the better; strongly cooled or strongly heated rooms are ideal measurement locations;
the location of installation should preferably be a large wall section which is relatively homogeneous;
areas with local thermal bridges should be avoided.
4.2. Data Acquisition
The electrical data from the heat flow meter (HFM) and the temperature sensors have been recorded continuously or at fixed intervals over a period of complete days. The maximum time period between two records and the minimum test duration depends on: the nature of the element (heavy, light, inside or outside insulation); indoor and outdoor temperatures (average and fluctuations, before and during measurement); and the method used for analysis. Due to the standard recommendations, the minimum test duration is 72 h (3 days) if the temperature is stable around the HFM, otherwise this duration may be more than 7 days.
4.3. Analysis of the Data
Two methods may be used for analysis of the data in accordance with this International Standard ISO 9869: the so-called average method, which is simple, or the dynamic method, which is more sophisticated, but which gives quality criteria of the measurement and may shorten the test duration for medium to heavy elements submitted to variable indoor and outdoor temperatures [
10]. The average method assumes that the conductance or transmittance can be obtained by dividing the mean density of the heat flow rate by the mean temperature difference, the average being taken over a sufficiently long period of time.
For “
j” individual measurements, the resistance of the heat flow can be obtained by the following expression:
where
Tsi—internal surface temperature, measured in (°C),
Tse—external surface temperature of the wall, measured in (°C),
q—heat flux density, i.e., heat flux on unit area, measured in (W/m2).
The conductance
is presented by the expression:
The thermal transmittance (
U-value) is calculated according the following relation:
where
Ti is internal ambient temperature, while
Te is external ambient temperature.
After the calculation of the above-mentioned values after each measurement, the convergence of the results to an asymptote value should be analysed.
Finally, the
U-value of the measured wall must include
rint and
rext—the standard values for the external and internal surface resistance on the wall, respectively:
Their values are rint = 0.13 (m2K/W) and rext = 0.04 (m2K/W).
The output data of the measurement can be obtained and read with corresponding software LoggerNet 4.1 and they can be used as datasheet for further analysis. The expected accuracy of the obtained results is ±5%.
5. Analysis of the Results
The measurements for this research were performed using the equipment for measuring the thermal transmittance. The measurements were performed on the walls of three different buildings, built of the façade system Fragmat NZ-1. The heat flux meter has to be placed in direct contact with the wall surface. Greater deviations in the temperature field should be avoided, and therefore connection with the smooth and flat part of the wall is recommended. Any incorrect placement of the sensors can deliver changes in the heat flow, which is one of the key factors for precise analysis. The temperature sensors should be mounted near the placed flux meters, in order to register the contact temperature.
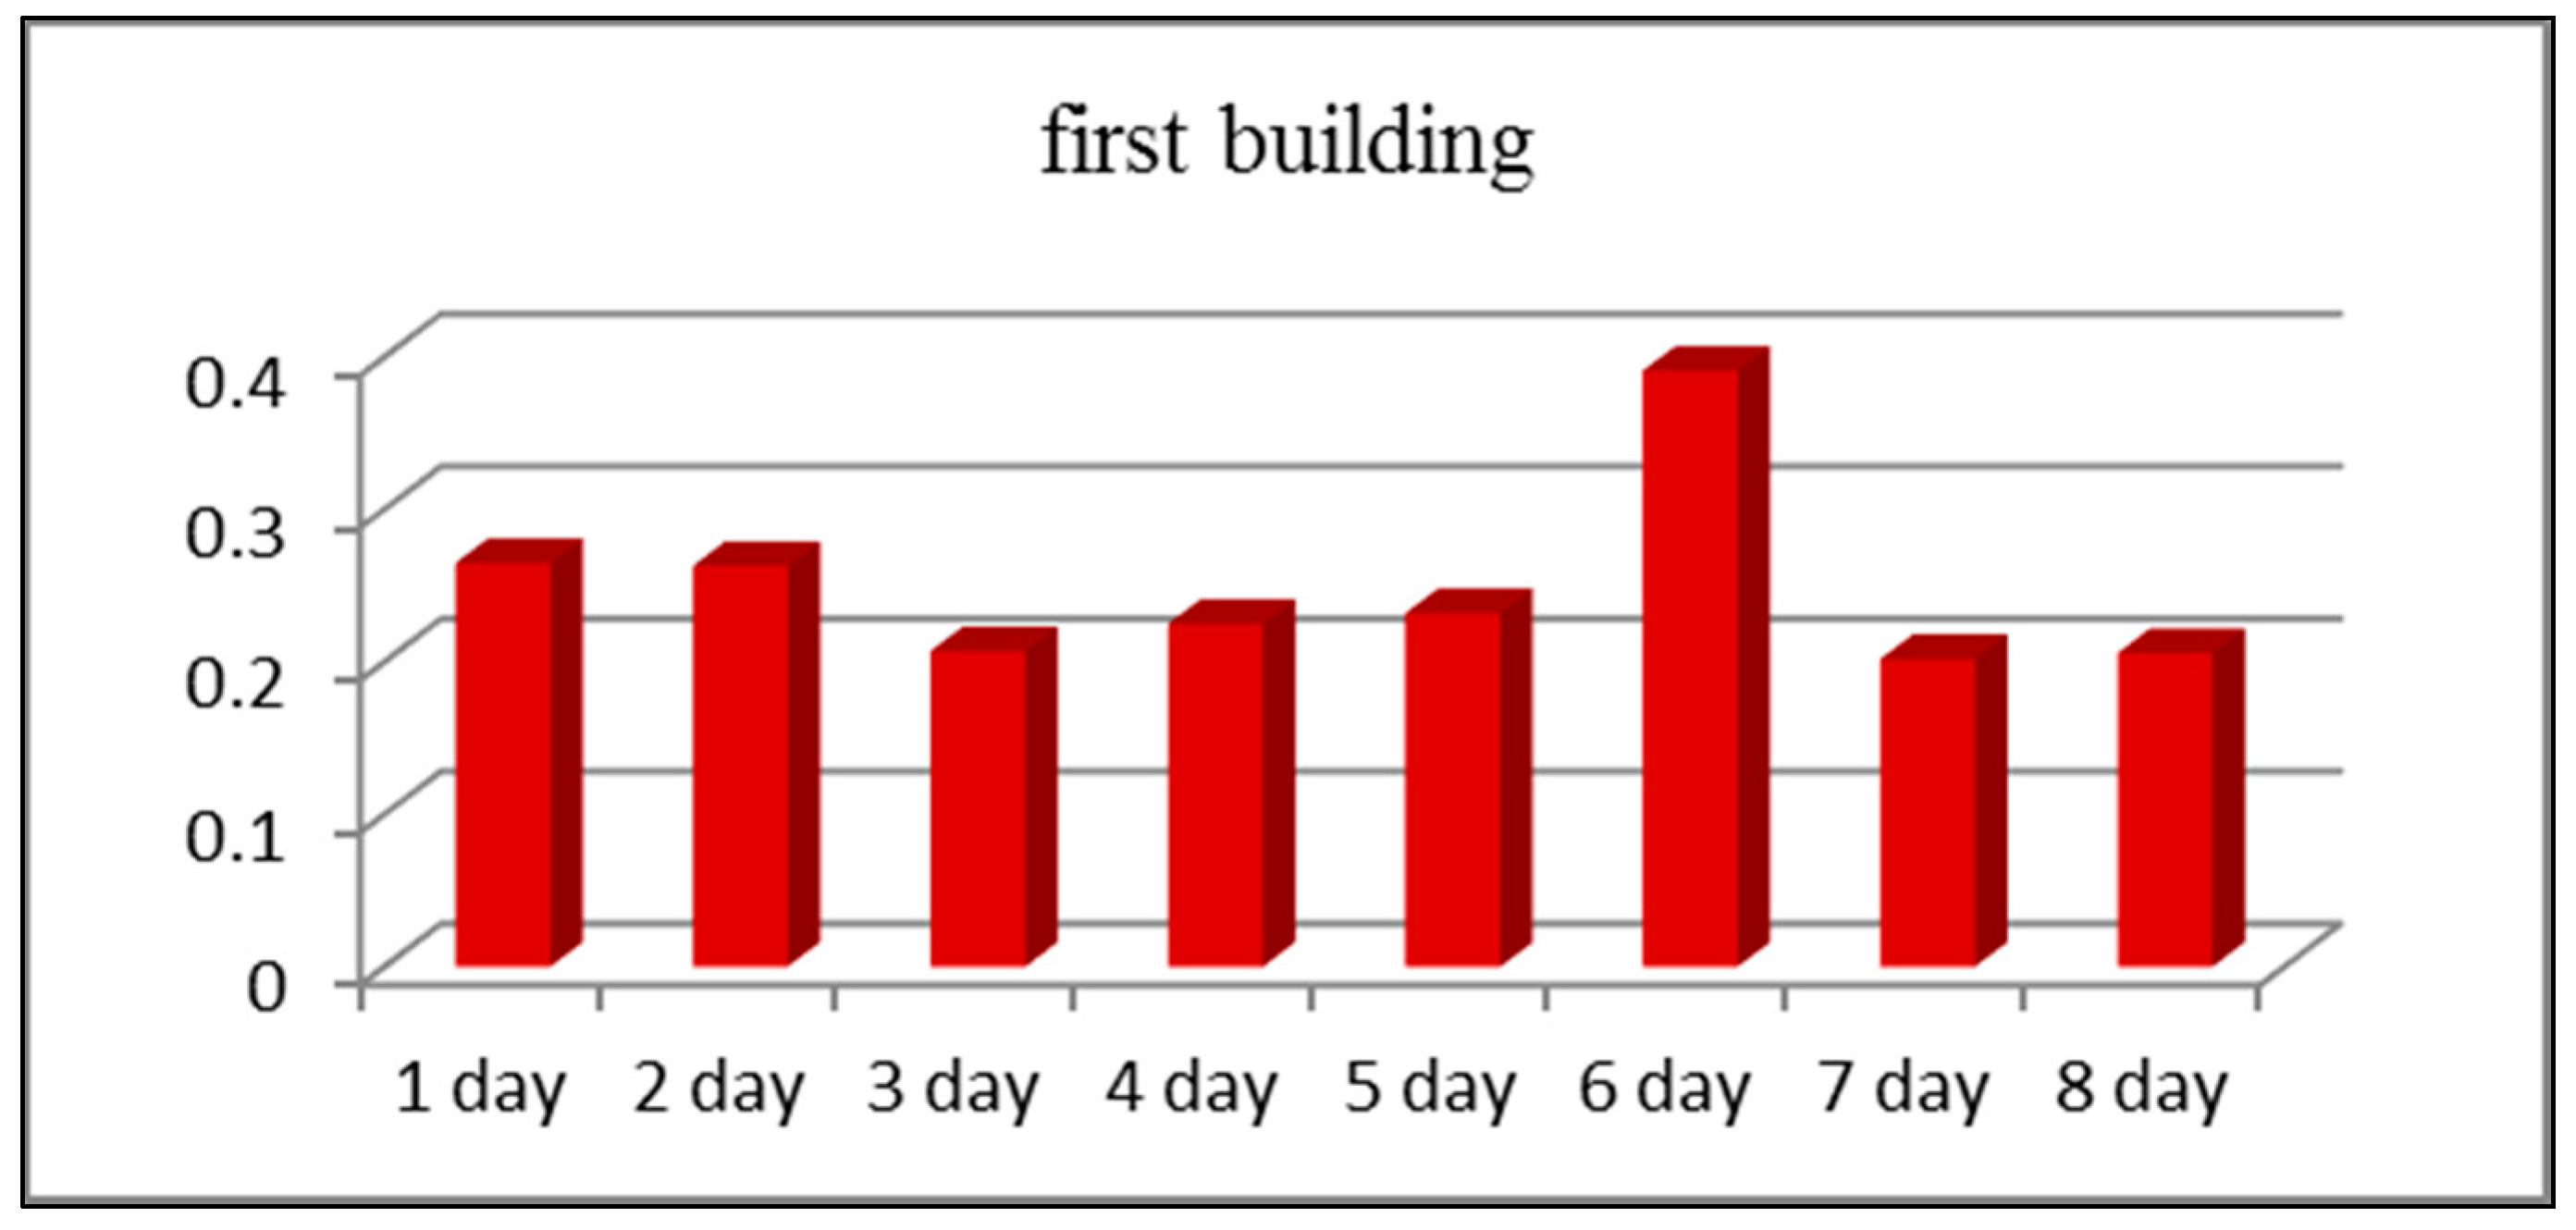
5.1. The First Building
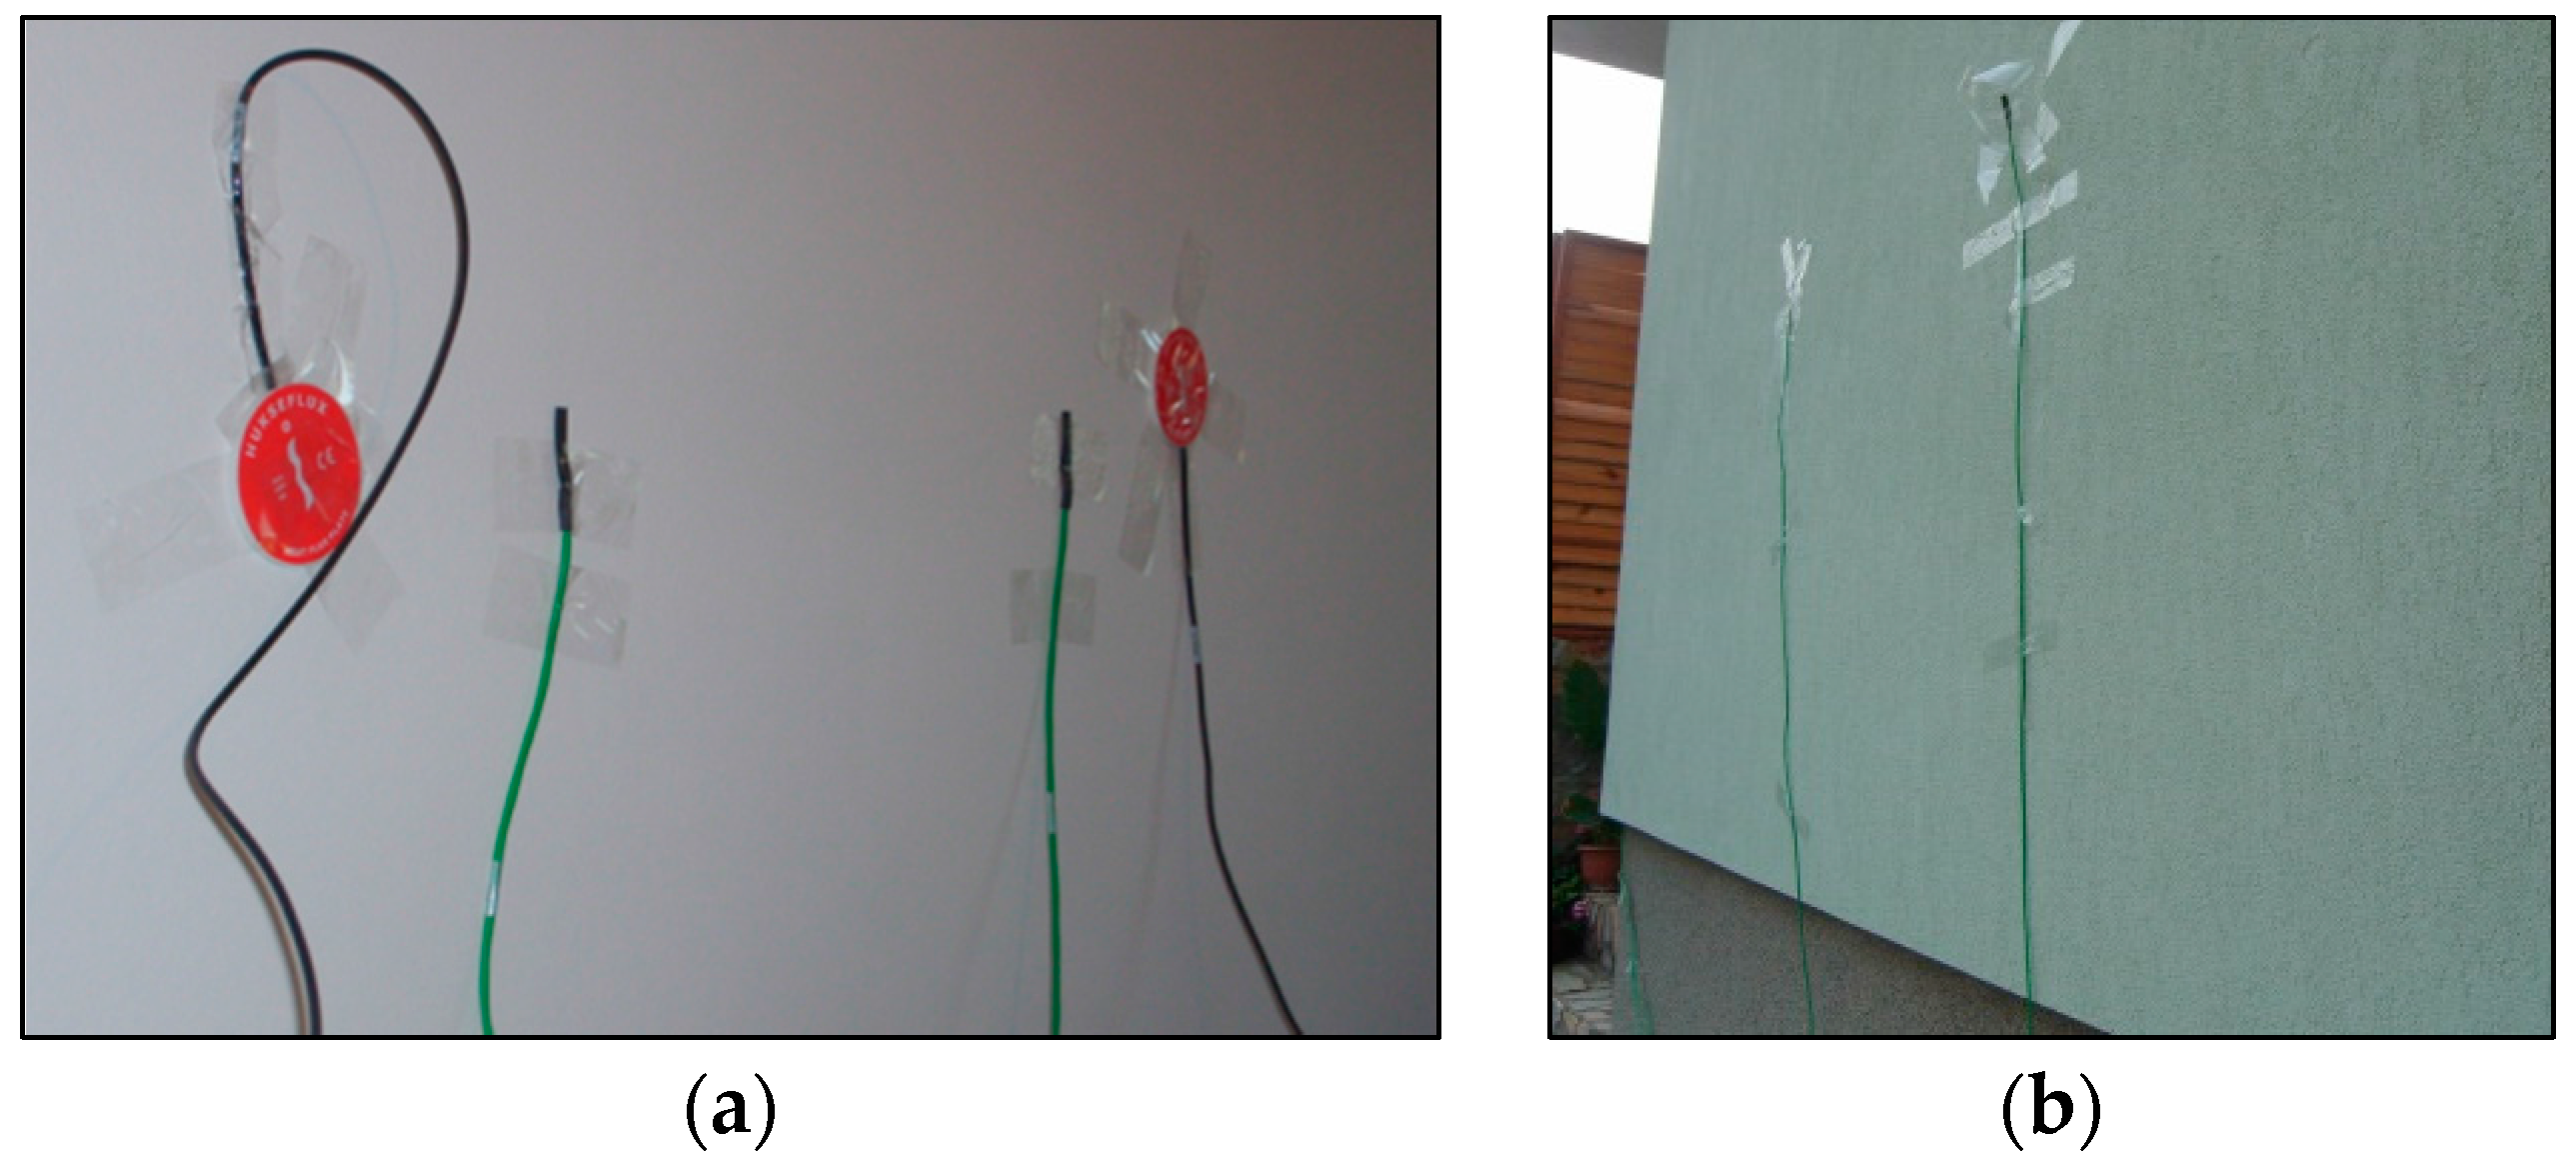
The building is a reinforced-concrete skeleton system, consisting of ground floor and first floor, with façade walls of system Fragmat-NZ1, and inbuilt appropriate insulation in the floor and the roof structures. The measurements for the first building were performed over 8 days, on a façade wall on the ground floor, with a north-east disposition. The sixth day was characterized by rainy and windy weather.
Temperatures during the measurement period do not develop significant oscillations, excluding the night-day temperature difference, typical for the summer period in Macedonia.
Figure 4a,b represents photographs of the sensors placed on the internal and external part of the wall during the measurement.
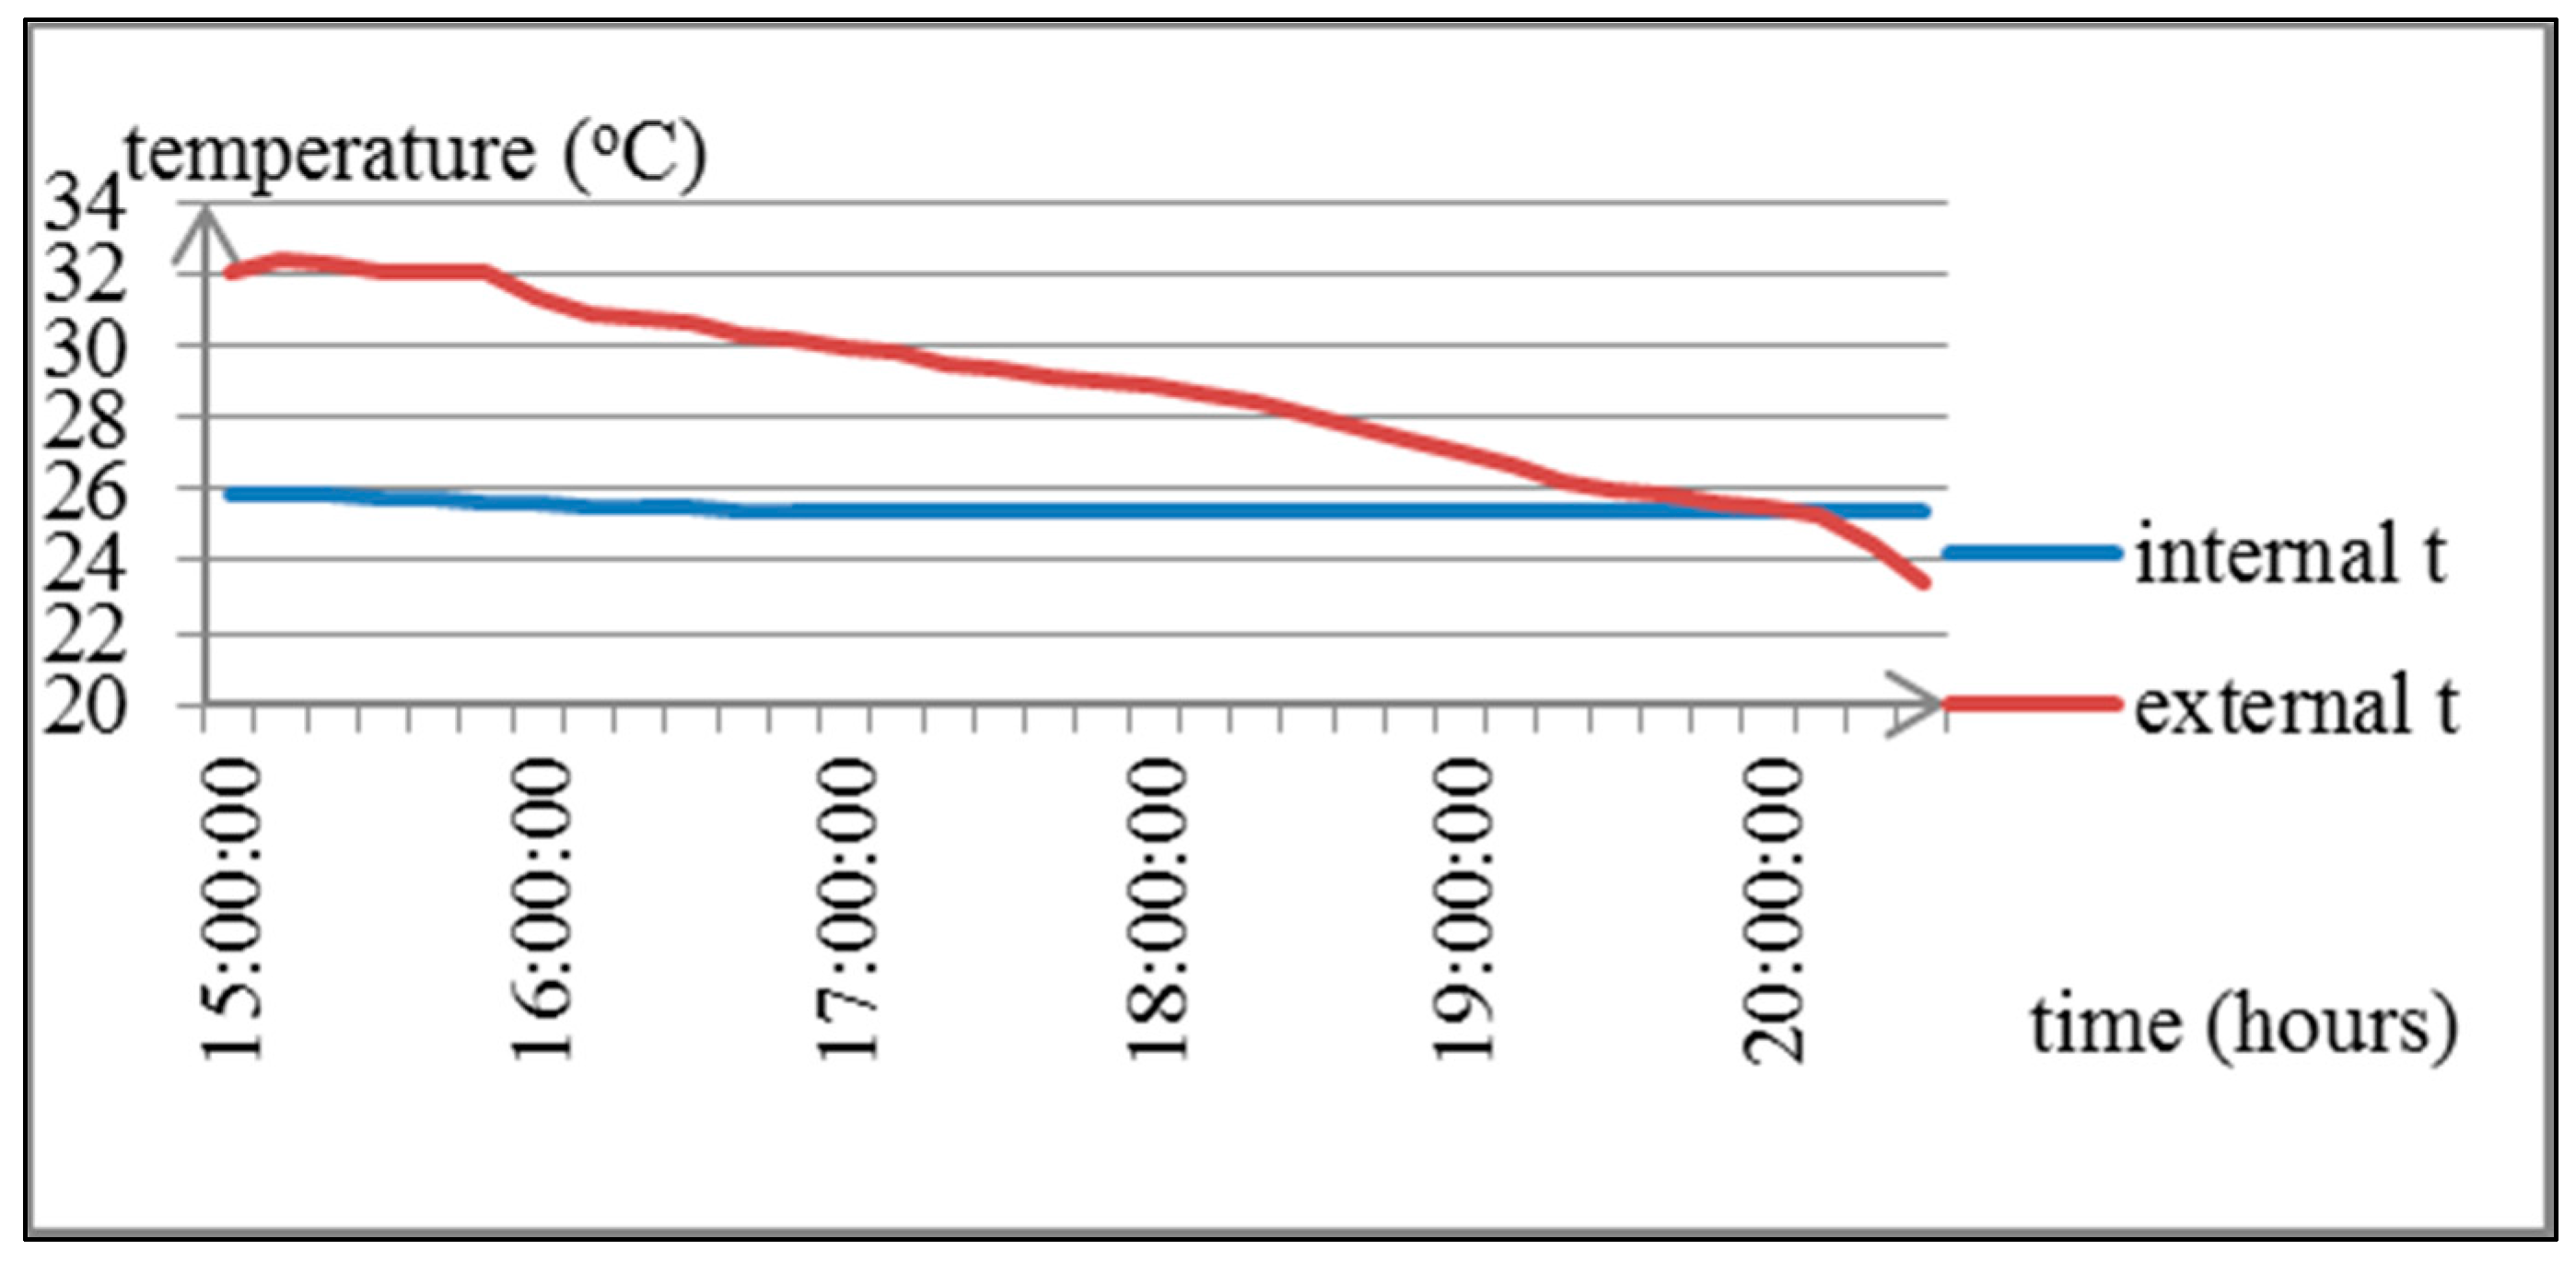
According to the significant changes of the external temperature during a day-night period, the calculation of the U-value was restricted to time intervals with a heat flux in one direction. The most reliable measurements were after a 15 h period when no direct solar radiation on the façade wall was experienced. The condition that beneficially affects the preciseness of the results is the stabile internal temperature, which does not vary more than 1 °C in the analysed time period of a few hours.
The contact external and internal temperatures on the measured location are represented in
Figure 5.
Measurements for this building have been performed for a sufficiently long period of time (8 days), having data at every 10 min. All obtained values per day are added and then divided by the number of daily tests.
Figure 6 represents the averaged
U-value of the wall per each day.
The average value of the U-coefficient, calculated according to the measured values from all the days, is 0.227 (W/m2K). The result obtained on the sixth day is excluded from the calculation, because of the rainy weather and the increased humidity, which initiate an unreal increase in the U-value (U = 0.391 W/m2K).
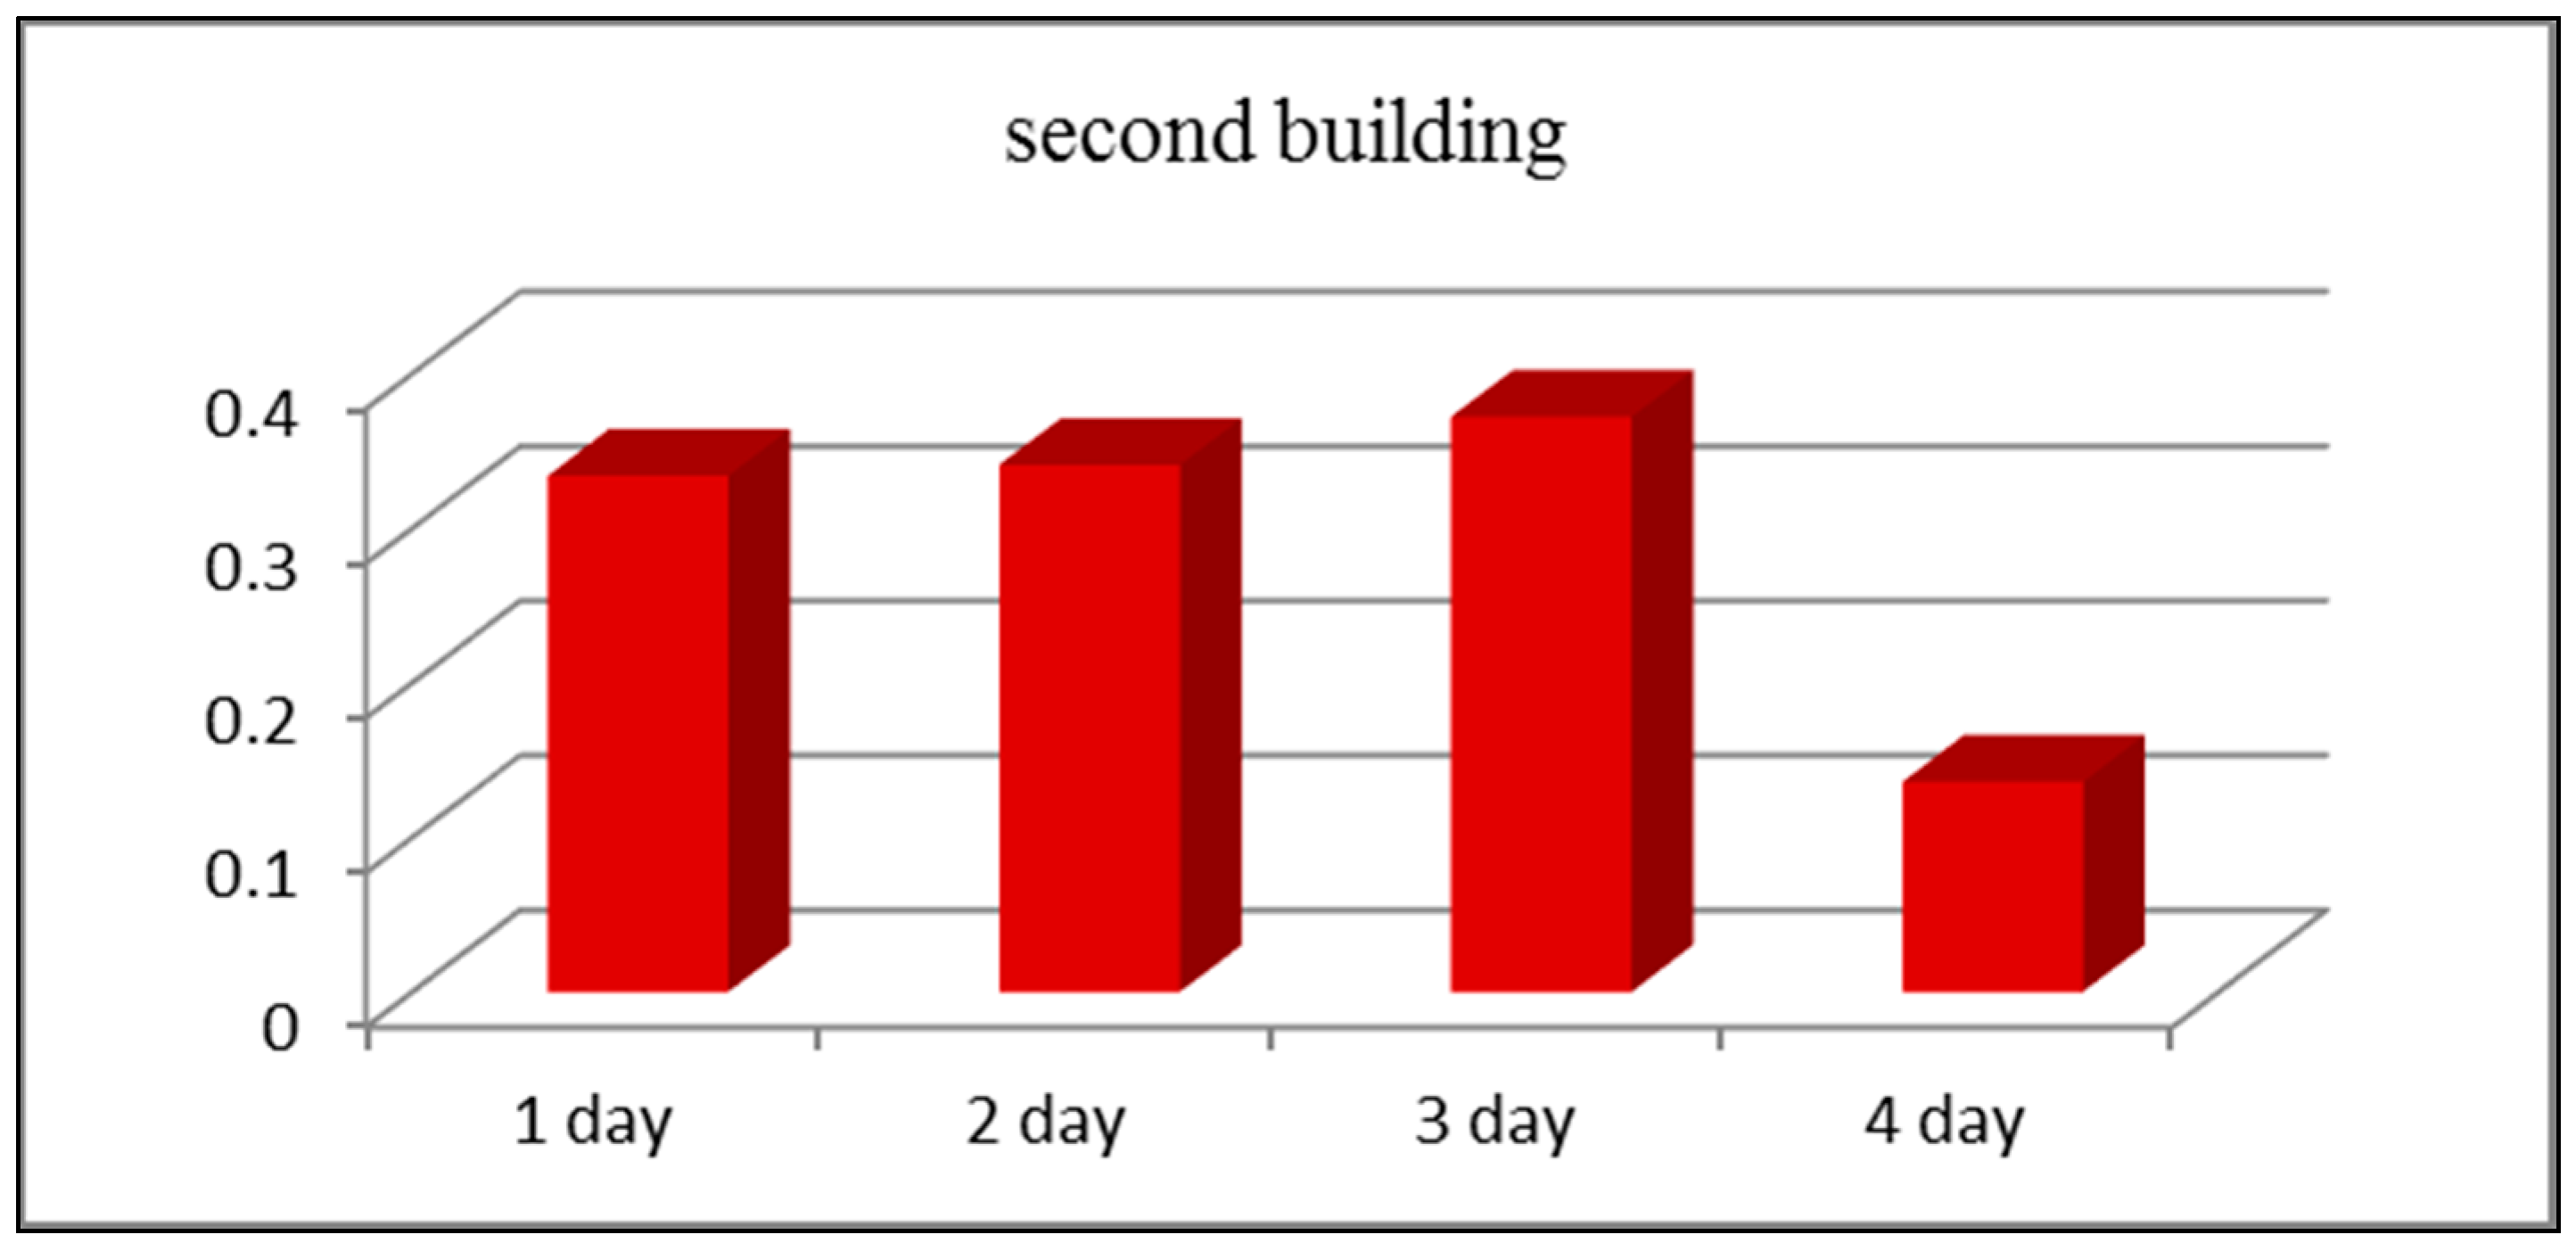
5.2. The Second Building
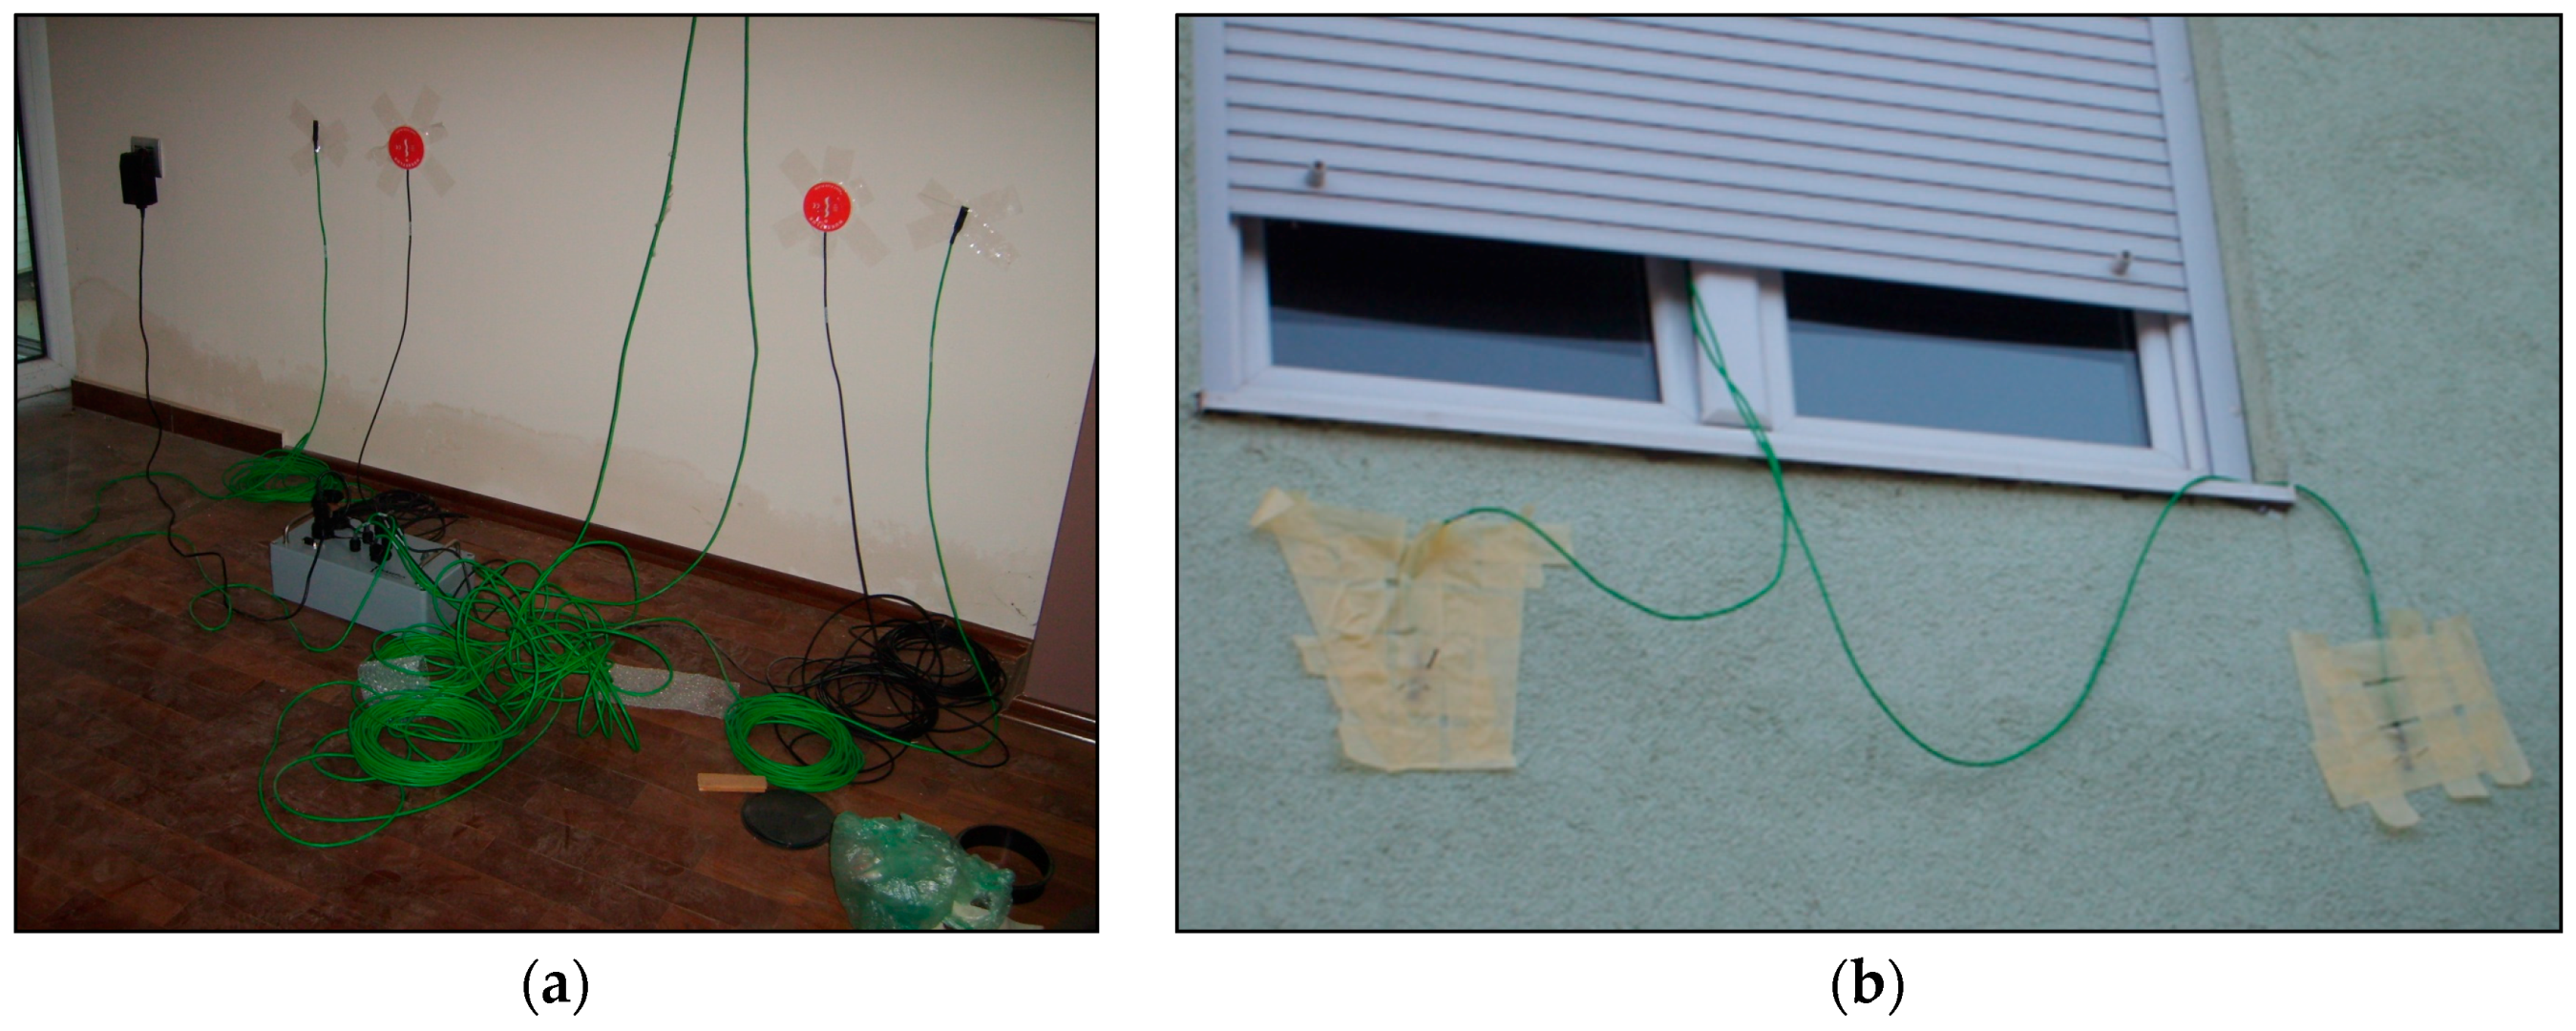
The second building is a reinforced-concrete skeleton system, consisting of ground floor and three floors, with façade walls of system Fragmat-NZ1. The measurements for the second building were performed over 4 days. Mounting of the sensors on the external side of the wall was very difficult due to the high ground floor and the garage under it. Therefore, they were mounted on the parapet under the windows as a unique solution. Locations of the installed sensors are presented in
Figure 7.
The averaged
U-value of this wall per each day is presented in
Figure 8.
The obtained average value of the thermal transmittance is
U = 0.349 (W/m
2K). This result significantly deviates from the expected value, calculated analytically and obtained during the measurement of the first building. The unfavourable position of the instrument on the wall could be the cause of this result. As presented in
Figure 6, due to the limited space and impossibility of mounting the sensors on the external façade, they were located in the only feasible position, i.e., the parapet under the windows on the north-east façade of the building. The window is close to the measurement location; therefore the possibility of a thermal bridge existence is very large, which influenced the higher
U-value. Another possible factor is the unknown position of the instrument from the point of view of the cross section’s geometry of the wall. If the thickness of the polystyrene is smaller than that of the concrete layer, then the obtained higher conductivity is due to the inferior insulating characteristics of the concrete.
5.3. The Third Building
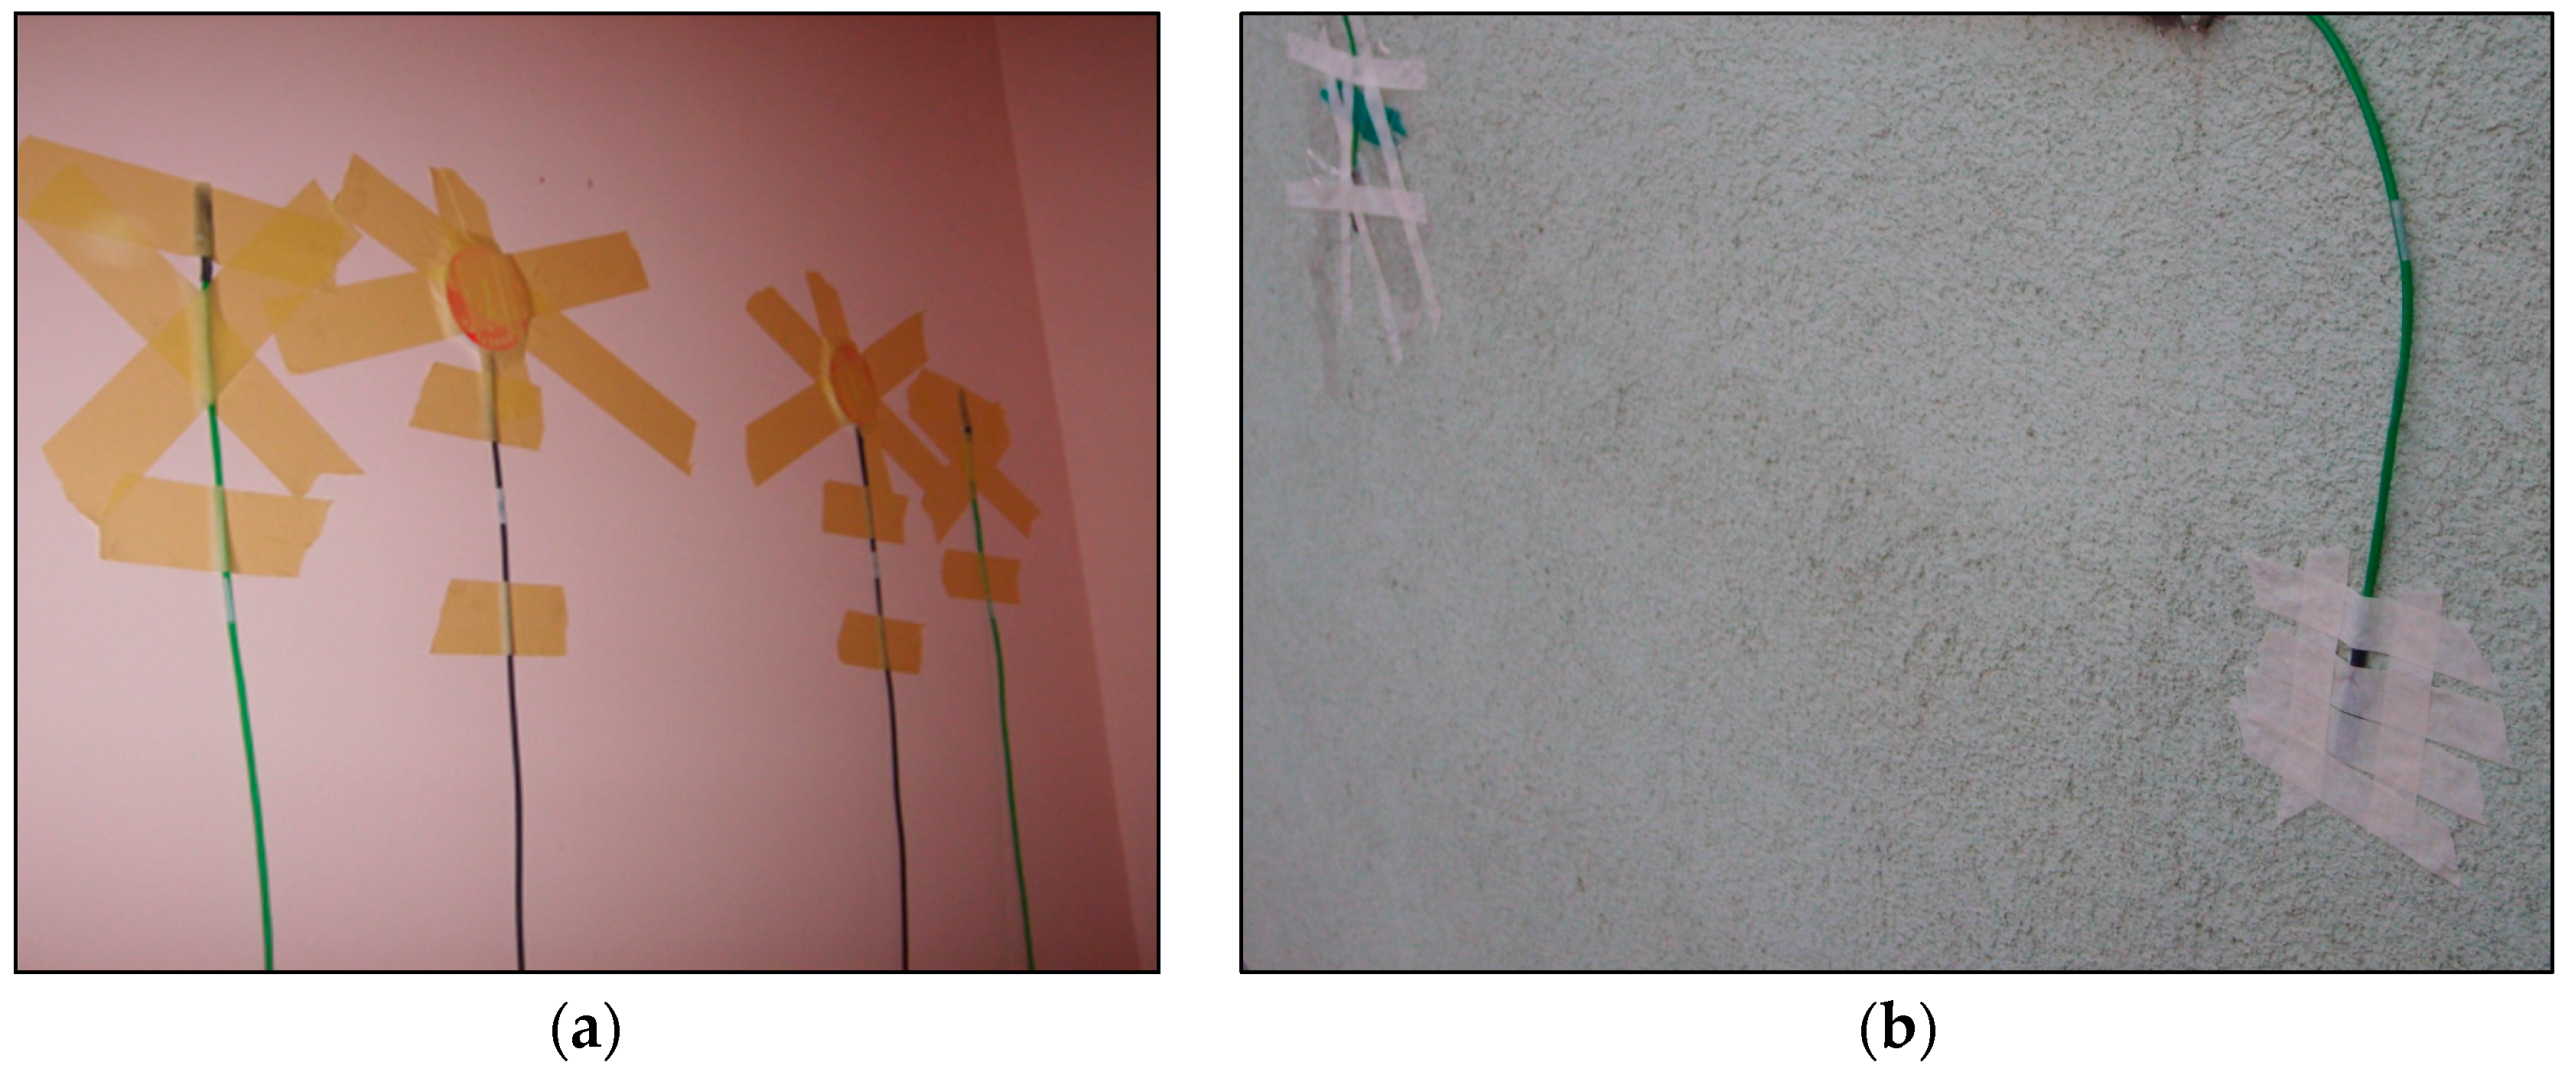
The measurements for the third building were performed over 4 days. Due to the south-west orientation of the measured façade wall, the data registered during the night between 21:00 and 03:00 are considered as optimal values, in order to avoid the direct solar radiation during the afternoon hours, even though the walls were shielded.
Figure 9 represents photographs of the sensors placed on both sides of the wall.
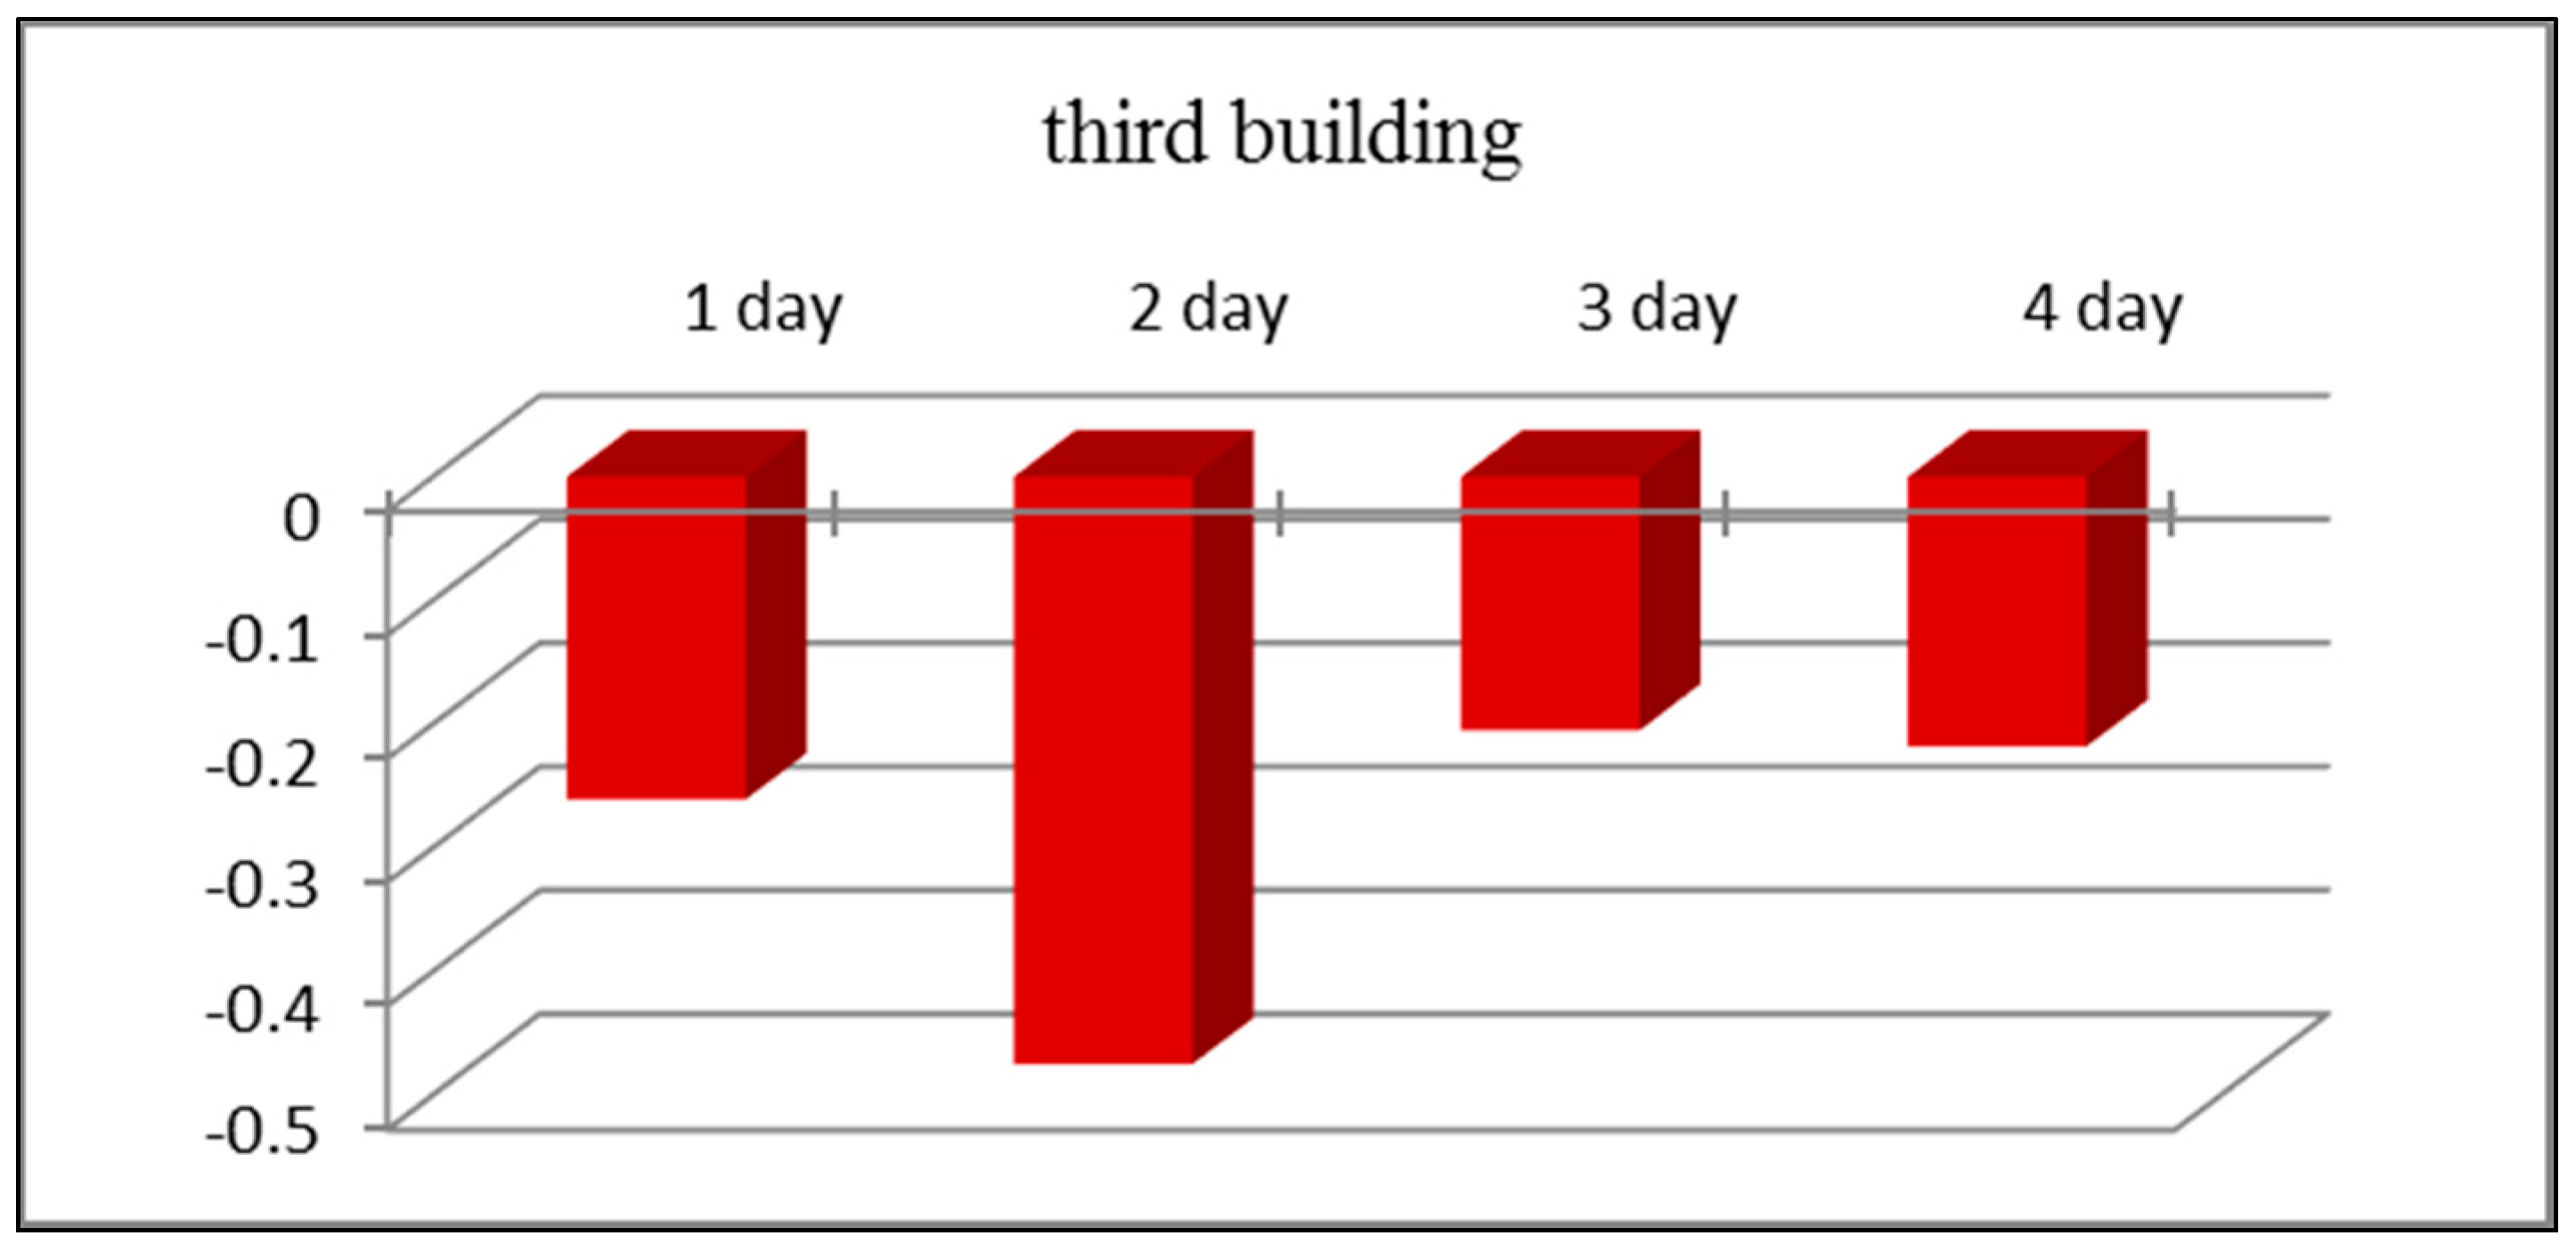
Similarly as in previous cases, averaged
U-values are given by day in
Figure 10. The obtained average value for the thermal transmittance of this building wall is
U = −0.228 (W/m
2K). In this case, the result of the measurement on the second day is not taken into account due to the rather high external temperature and the insufficient difference between the internal and external temperature.
The final conclusion of the measurement of the three different buildings is that the analytically calculated thermal transmittance is approximately the same with the regular measurements, and for this façade system is U = 0.22 (W/m2K).
6. Discussion and Conclusions
The testing of the thermal transmittance is applicable for: determination of the real insulated condition of a building, analysis of the repaired condition, determination of the heat transfer of the walls with unknown composition, as well as for determination of the heat transfer of new building systems.
The results of the analysis show that in-situ measuring is a useful tool in the validation of the accuracy of analytically calculated values, since it was difficult to gain precise results from the analytical calculations only, especially when the wall layers are of non-uniform thickness.
This paper deals with the analysis of the new façade walls of the system Fragmat-NZ, in terms of defining their thermal transmittance, as well as with finding an adequate method for its calculation, due to the specific geometry. The direct in-situ measurement is recommended for a precise result.
The final result of determination of the U-coefficient is influenced by many factors. Primarily, the type of analysed wall should be determined: massive or lightweight construction. That pre-condition defines the duration of the measurement necessary for obtaining accurate results. In this case, the structure does not require a long time interval; therefore the testing time is reduced to the minimum, according to the standards. Due to the significant day-night temperature variations, the heat flux registers high oscillations. For that reason, the representative data for this measurement are day-light periods when the heat flux stabilises, even though for walls with a great ability of thermal accumulation, this kind of result will not be accurate.
A small variation in the internal temperature has a significant influence on the result. In this case, this condition was satisfied, because the rooms chosen for measurement had low (or no) people occupancy. Therefore, changes in the internal temperature caused by an exterior factor were not detected.
The variation in the air humidity also has an unfavourable influence on the final result and should not be taken into consideration. The weather on the sixth day of measurements of the first building was rainy and humid and caused an increase in the thermal transmittance of the wall, which was unreal compared to the other values.
The choice of an adequate location for installation of the sensors plays a key role in the obtaining of relevant results. Therefore, the sensors should be installed on a wall without direct solar radiation; the contact surface should be as smooth as possible; location with a variation of the thermal conductivity should be avoided, as well as location with potential thermal bridges. This condition was not fulfilled for the measurement of the second building, due to the space limit and impossibility of installation of the external sensors. The results are not reliable. Nevertheless, this is proof that the adequate installation and location of the sensors play a huge role.
For further investigations of the thermal transmittance of these façade walls, they should be measured in laboratory conditions. This will avoid the effects of the environment, and will enable determination of the influence of the sensor’s location.
In general, for this type of measurement, a standardization of the measurement procedure for Macedonian local climate conditions, which are affected by huge temperature differences during the daytime, is recommended. Furthermore, an improvement of the U-value calculating software performance is recommended, in a manner that it would be able to compute more complicated elements, due to the fact that most of the software programs work with homogenous layers with uniform thickness and uniform λ-coefficient.

