1. Introduction
Buildings in Europe account for 40% of total primary energy consumption and 36% of greenhouse gas emissions. Recent studies confirm this assumption considering the fact that in the Italian municipalities approximately 37% of the emissions are due to housing [
1]. Moreover, in most EU countries new constructions range around only 1% per year of the total building stock, so that the impact of energy regulations is limited and therefore insufficient when not applied to the existing buildings [
2]. Retrofit programs have the capacity to significantly contribute to the policy commitment of reducing energy demand and delivering an 80% CO
2 emission reduction by 2050. However, despite the amount and quality of available technologies, components and materials, there is still a lack of an accepted and consolidated methodology for refurbishing the existing housing stock. Each intervention is considered specific and subject to a wide range of variables. When choosing among a range of proposed retrofitting measures, decision makers must take into account environmental, energetic, financial, legislative and social factors in order to reach the best possible compromise able to satisfy the final occupants’ needs and requirements. In a period of evident lack of public resources as well as of consequent public expenditure contraction, it is important for the management of a wide, often obsolete and expensive to maintain building stock to define a possible intervention policy in view of implementing both technically and economically feasible solutions. In addition, the European Directive 2010/31 stresses that energy retrofitting should aim “to achieve cost-optimal levels” [
3]. This context calls for approaches and tools that help the decision-making process.
This absence of decision making policies has not been yet successfully tackled by the several studies done in the recent years. Those studies adopted multivariate methods and multi-criteria techniques for performing complex analyses and for selecting the most suitable refurbishment actions. Wang and Holmberg [
4] proposed an approach useful for designing and assessing energy demand retrofitting scenarios based on representative archetypes, energy models and LCCA (Life Cycle Cost Analysis)-based cost-effectiveness estimations. The methodology is quite effective but it is limited to the Swedish residential building stock, which is defined by a limited number of housing types, being made by just four final archetypes, very similar to one another apart from their ages and construction materials. Mauro et al. [
5] proposed a novel methodology that foresees a robust cost-optimizing analysis of energy retrofit solutions for one building category through a simulation-based large-scale uncertainty/sensitivity analysis. The new idea is to consider a representative building sample rather than a reference building in order to facilitate the analysis of a building stock rather than of single buildings. However, this novel approach needs a detailed energy dynamic simulation by means of Energy Plus and MATLAB, which are tools still devoted more to academic and scientific research than professional working procedures. Jaggs and Palmer [
6] presented a methodology developed within the European project EPIQR aimed at assisting apartment building owners who were interested in refurbishing and retrofitting (upgrading) their building property. The EPIQR methodology considers a few more elements than the previous ones, such as indoor environmental quality by means of questionnaires distributed to residents, but the procedure is strongly “customized”, i.e., limited to single apartments and difficult to scale-up. The same difficulties are met for the multi criteria-based approaches proposed by Flourentzou and Roulet [
7] within TOBUS project for the evaluation of retrofitting scenarios. Mata et al. [
8] developed a model, called Energy, Carbon and Cost Assessment for Building Stocks (ECCABS), based on one-zone hourly heat balances in order to calculate the energy demand for buildings representative of a building stock, and then extending the results to the entire stock through the adoption of weighting factors. The model is applied to the Swedish housing stock, which is quite homogeneous over the whole country, and it makes use of detailed and time-consuming calculation with dynamic software, even if some approximations have been included, such as the one-zone calculation. Geyer and Schlueter [
9] proposed a classification of buildings not based on type/age but on the effect of energy efficiency measures, in order to apply the ensuing algorithmic clustering for the derivation of strategies to the building stock. Notwithstanding the fact that the approach is innovative and may have clear effects on energy strategic retrofit development, the actions on existing buildings usually combine energy, structural and constructive interventions in a global approach so that building age and typology do have a crucial importance on the overall intervention. Kaklauskas et al. [
10] have developed a multivariate design method and multiple criteria analysis for building refurbishment. They determined the significance, priority and utility degree of compared building refurbishment alternatives and selected the most recommendable variant. The method refers to possible choices between different alternatives that consider single building elements, while the mutual influence from an energy point of view is not fully considered. Ma et al. [
11] tried to provide a systematic approach to the proper selection and identification of the best retrofit options for existing buildings. By means of a wide literature review, they summarize their findings from previous studies in order to provide building practitioners and researchers with a general and abstract basis useful for planning retrofitting actions.
It is now well established that the leading role of public bodies, or of those who manage public administration, is fundamental in order to plan interventions and to consider and put forward solutions with a wide impact on the territory, in terms of employment, microeconomic viability but also environmental advantages on a macro and micro scale. “Public administrations are called upon to take on a pivoting role in the energy efficiency sector of existing buildings” due also to their high visibility in public life [
12], as explicitly mentioned in the European Directive 2006/32 [
13]. However, inertia of building energy retrofit policy at the municipal level has been reported, due to some bottlenecks that often make the transition to energy efficiency difficult for communities. The most common barriers for municipalities and local authorities are lack of knowledge, management, expertise, and of awareness and commitment [
2,
14]. In order to exploit the local potential possibilities, administrations should necessarily make those practice quite common, by rendering the energy retrofitting planning process smoother and more effective than previously, and by reducing barriers while providing the municipalities with the necessary means.
Besides, one must consider that, even if retrofits do not generate the same profit margin as construction projects do, they are a safer investment in the present downturn, where there is so little private investment [
15]. In fact, “Market forces will need to be complemented by public funds, a pragmatic, predictable, long-term and supportive regulatory environment and a fundamental behaviour change among sector stakeholders” [
16]. Nevertheless, the available procedural tools are still inadequate, because not only energy efficiency is to be considered but even the users’ needs. In fact, in order to meet the new energy standards, while saving costs, fuel and reducing the consequent greenhouse gases (with measurable effects concerning air pollution and urban heat island), energy retrofitting of existing buildings can provide better comfort conditions in living spaces. Then, the improved building envelope diminishes heat losses for transmission and ventilation, and guarantees a more uniform temperature distribution, as well as smaller inner radiant asymmetry, lower air leakage and so better general thermal comfort conditions. The use of materials with higher technical performance and a renewed attention to the building windows can bring forth direct benefits also from an acoustic, visual and indoor air quality point of view. Flexible heating systems, easily controllable by users, can lead to a psychological feeling of excellent indoor microclimate, and an improvement of users’ satisfaction. Furthermore, in the new global economy, the so-called “green retrofitting”, which consists of passive systems technologies and use of eco-compatible, recycled or recyclable materials, has emerged as a key instrument in addressing environmental issues [
12].
2. Aim of the Research
In this complex framework, the purpose of the study is to present an operational and flexible approach to optimizing the retrofitting process in terms of energy efficiency, cost-effectiveness and users’ comfort through the analysis of the existing building stock.
The first potential users of the proposed methodology are the public bodies, such as social housing companies, that manage buildings on a regional scale. For this reason, in contrast to the approaches previously mentioned, the methodology must be simple and effective; able to adapt to several building typologies with different ages and in different climatic contexts; and it must be based on the calculation procedures commonly used in day-to-day practice. Following this procedure, results should be easily scaled-up so that to obtain possible usable economic scenarios. Moreover, an integrated approach should be considered, where both energy and constructive issues are faced simultaneously and result in a comprehensive retrofitting of the building. The approach should not neglect economic constraints, as these have been particularly pressing in the last 10 years due to the still ongoing crisis.
In particular, the paper refers to the building stock of ITEA S.p.A. (ITEA hereinafter), a stock company directed and coordinated by the Autonomous Province of Trento, Italy. ITEA’s tasks regard the construction, refurbishment, acquisition and management of buildings for social housing, and it also involves the annexes (such as shopping areas, schools, kindergartens, theatres, gyms, and so on). Up to now, the company has been managing more than 16,000 apartments (corresponding to some 645 buildings, see
Table 1) located across the territory of the province of Trento.
The work hereafter illustrated is the last part of a broader research started in 2011 and funded by ITEA, aimed at defining tools for the public administration in order to better manage existing buildings. Besides, the tool enables the administration to choose suitable intervention strategies, to plan strategic priorities while quantifying related expenditure.
The first phase consisted in the setting up of a novel methodology for a simple and fast definition of the actual thermal characteristics of the buildings by means of on-site surveys (see [
17] for further information). The second step applied the methodology to a selected group of buildings in order to stress the pros and cons of the existing and more complex methodologies. The third step hereafter described, which began in 2014, aims to conduct a technological-economic analysis of feasible measures to be applied to the existing housing stock managed by the company, in order to improve their energy efficiency in terms of total energy demand, from both renewable and non-energy sources. The purpose therefore is to develop a long-term plan of retrofitting interventions, based on the feasible improvement options identified during the previous analysis steps. This way, costs and benefits can be estimated according to their impact on administrative costs for assets management. Costs and benefits depend on the type of measures selected, which resulted from the retrofit alternatives. This agenda for systematic housing retrofit can induce radical changes in the energy performance of the existing ITEA housing stock.
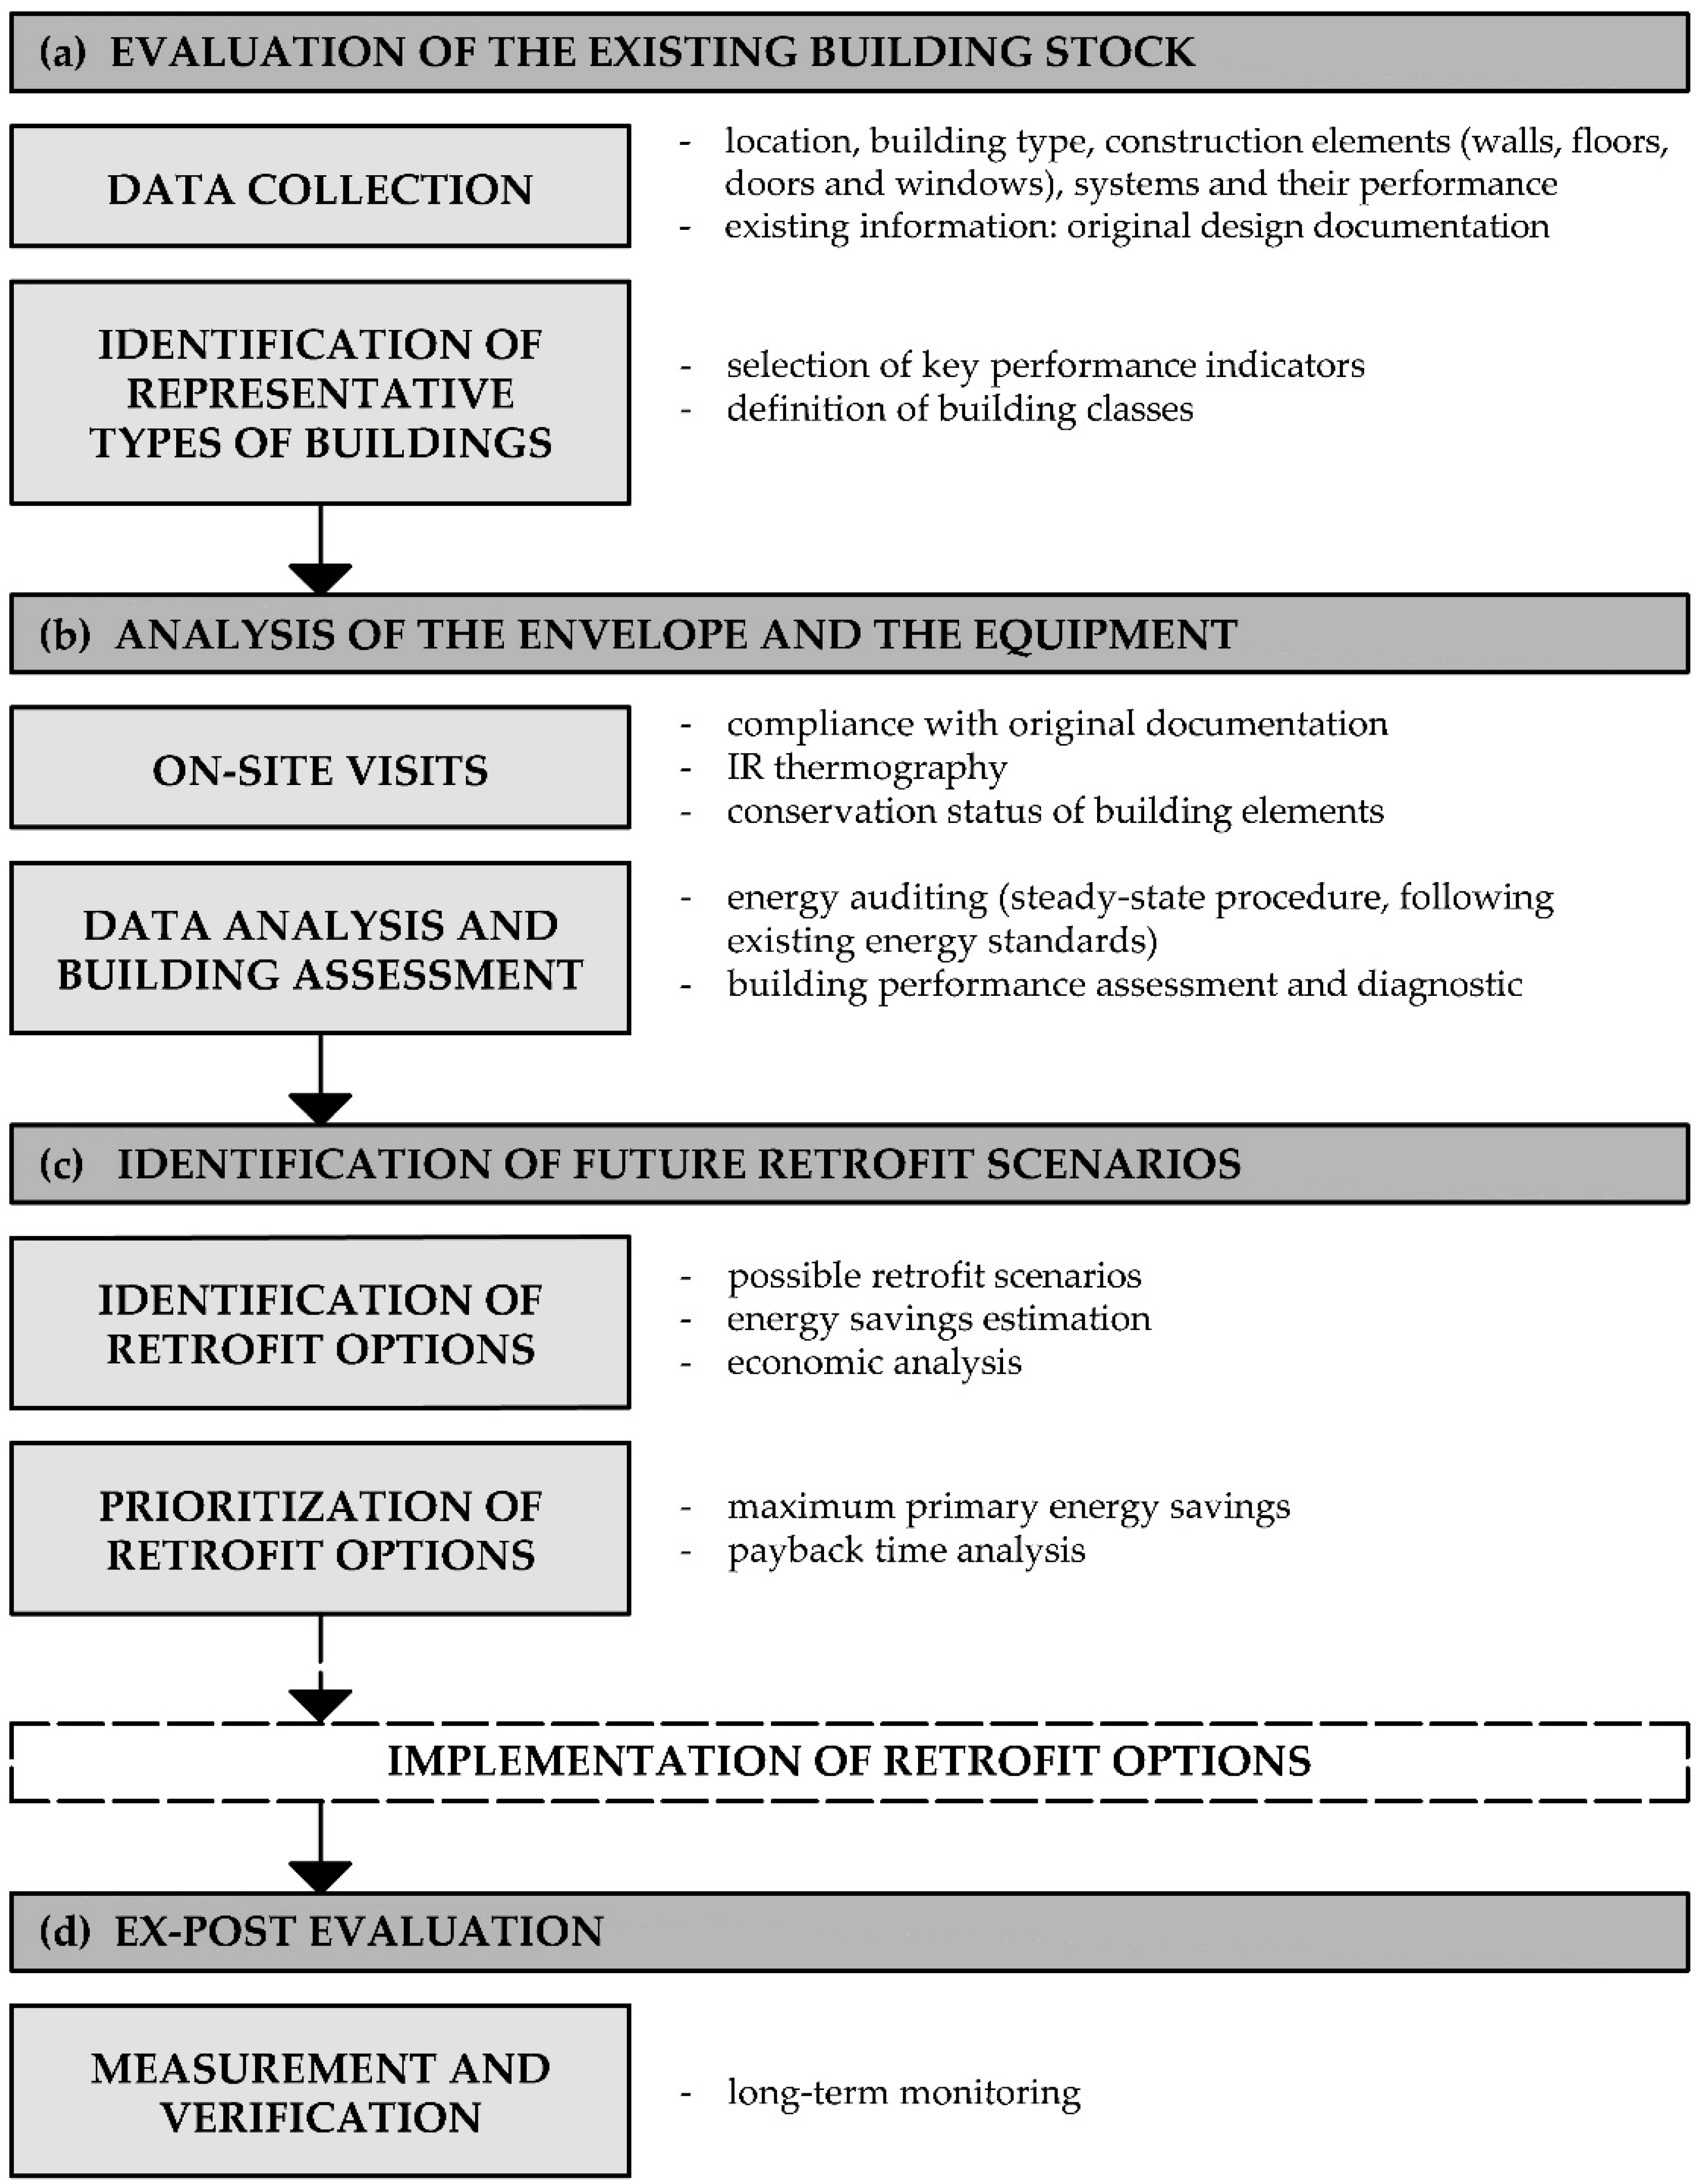
3. Methodology
The wide stock managed by ITEA consists of buildings both built by the company and acquired from third parties. All the buildings are located in the Trentino region, which is varied, with a climate that could be defined transitional between continental and alpine. Therefore, it becomes rather complex to define a univocal methodological analysis of the existing asset. On this basis, an overall systematic analysis has been carried out, according to the procedure briefly described below and outlined in the flowchart in
Figure 1:
Evaluation of the existing building stock by assessing its energy efficiency. This phase consists of collecting all the data related to the buildings and of identifying representative building typologies in terms of age, dimension, typology, construction system and location within the Trentino region.
Analysis of the envelope and the equipment referred to a sample of buildings, one for each type identified, through on-site visits and data analysis, in order to benchmark building energy consumption by using selected indicators that correlate energy performance class with building type and their components.
Definition of feasible retrofit scenarios, based on the identification of intervention option classes, suitable for each building type, aimed at energy enhancement. Particular attention is paid to the cost-efficiency of measures. Costs and paybacks related to each type of option are estimated, defining the achievable energy performance class. A tool to set up appropriate medium and long-term intervention plans is then proposed.
Ex-post evaluation of undertaken retrofit measures, aimed at verifying the actual achievement of the objectives planned in the diagnostic stage, through at least one year of monitoring of the examined buildings energy demand.
4. Definition of Building Classes
The ITEA building stock is the product of the construction activity carried out by the company over the years and of additions obtained from various suppressed public and private entities. As a result, ITEA manages buildings that are for the most part older than 30 years.
Table 1 shows a first classification of the company properties with respect to the age of the housing stock. Five classes have been identified. Almost 50% of the buildings were built right after the Second World War, when the territory was to be quickly reconstructed in order to accommodate so many displaced families. This way, the buildings were built before the enforcement of the first Energy Saving Law 373/76 [
18] that concerned heating energy consumption savings and energy efficiency improvements. Nearly one third of the existing assets were built between 1981 and 1991, which is the year of the enactment of the Italian law regarding the rational use of energy, energy saving and development of renewable sources [
19].
Therefore, except for those cases where envelope enhancing measures have already been undertaken, most ITEA buildings are quite old and highly energy-intensive (this is in line with findings by the Building Performance Institute Europe reported in [
20] and by Dall’O et al. [
1]).
In order to achieve a systematic and complete picture of the building classes in terms of energy efficiency, a judgmental sampling approach has been used. In particular, previous typological studies on the existing building stock in the region have been taken as the basis both for the following data check and for on-site surveys on a limited number of buildings. In the judgmental sampling approach, the outlined sample is defined directly by experts, i.e., the ITEA technicians, who choose a suitable and limited number of classes where each building typology (mainly considering the building shape and systems) is represented. Finally, the age of the building stock, which has great influence on their energy performance, must be considered as well.
So, the following characteristics have been considered (a similar procedure can be found in [
1,
4,
21]):
Floor number: high (above 8)–medium (between 4 and 7)–low (between 1 and 3).
Building type: terraced houses, tower buildings, block buildings, apartment buildings.
Position: isolated, aggregated.
Structural components (envelope): non-insulated walls, externally-insulated walls, layered walls with insulation in the cavity, prefab concrete panels.
Year of construction (with the age categories as indicated in
Table 1).
Site location: valley floor (0–250 m), medium altitude (250–750 m), mountain (above 750 m), taking into account also the different municipalities total Degree Days.
Clearly, not all the typologies resulting from these characteristic combinations are present in the Trentino Region. Therefore, a second analysis has been done together with the ITEA technicians with a view to reducing the number of typologies to the ones really existing in the region. In the end, a breakdown choice into homologous groups, up to a total of 25 groups, has been applied to the building stock managed by ITEA with the characteristics thus identified. For each group, a representative building has been chosen as a case study to which the proposed methodology is applied.
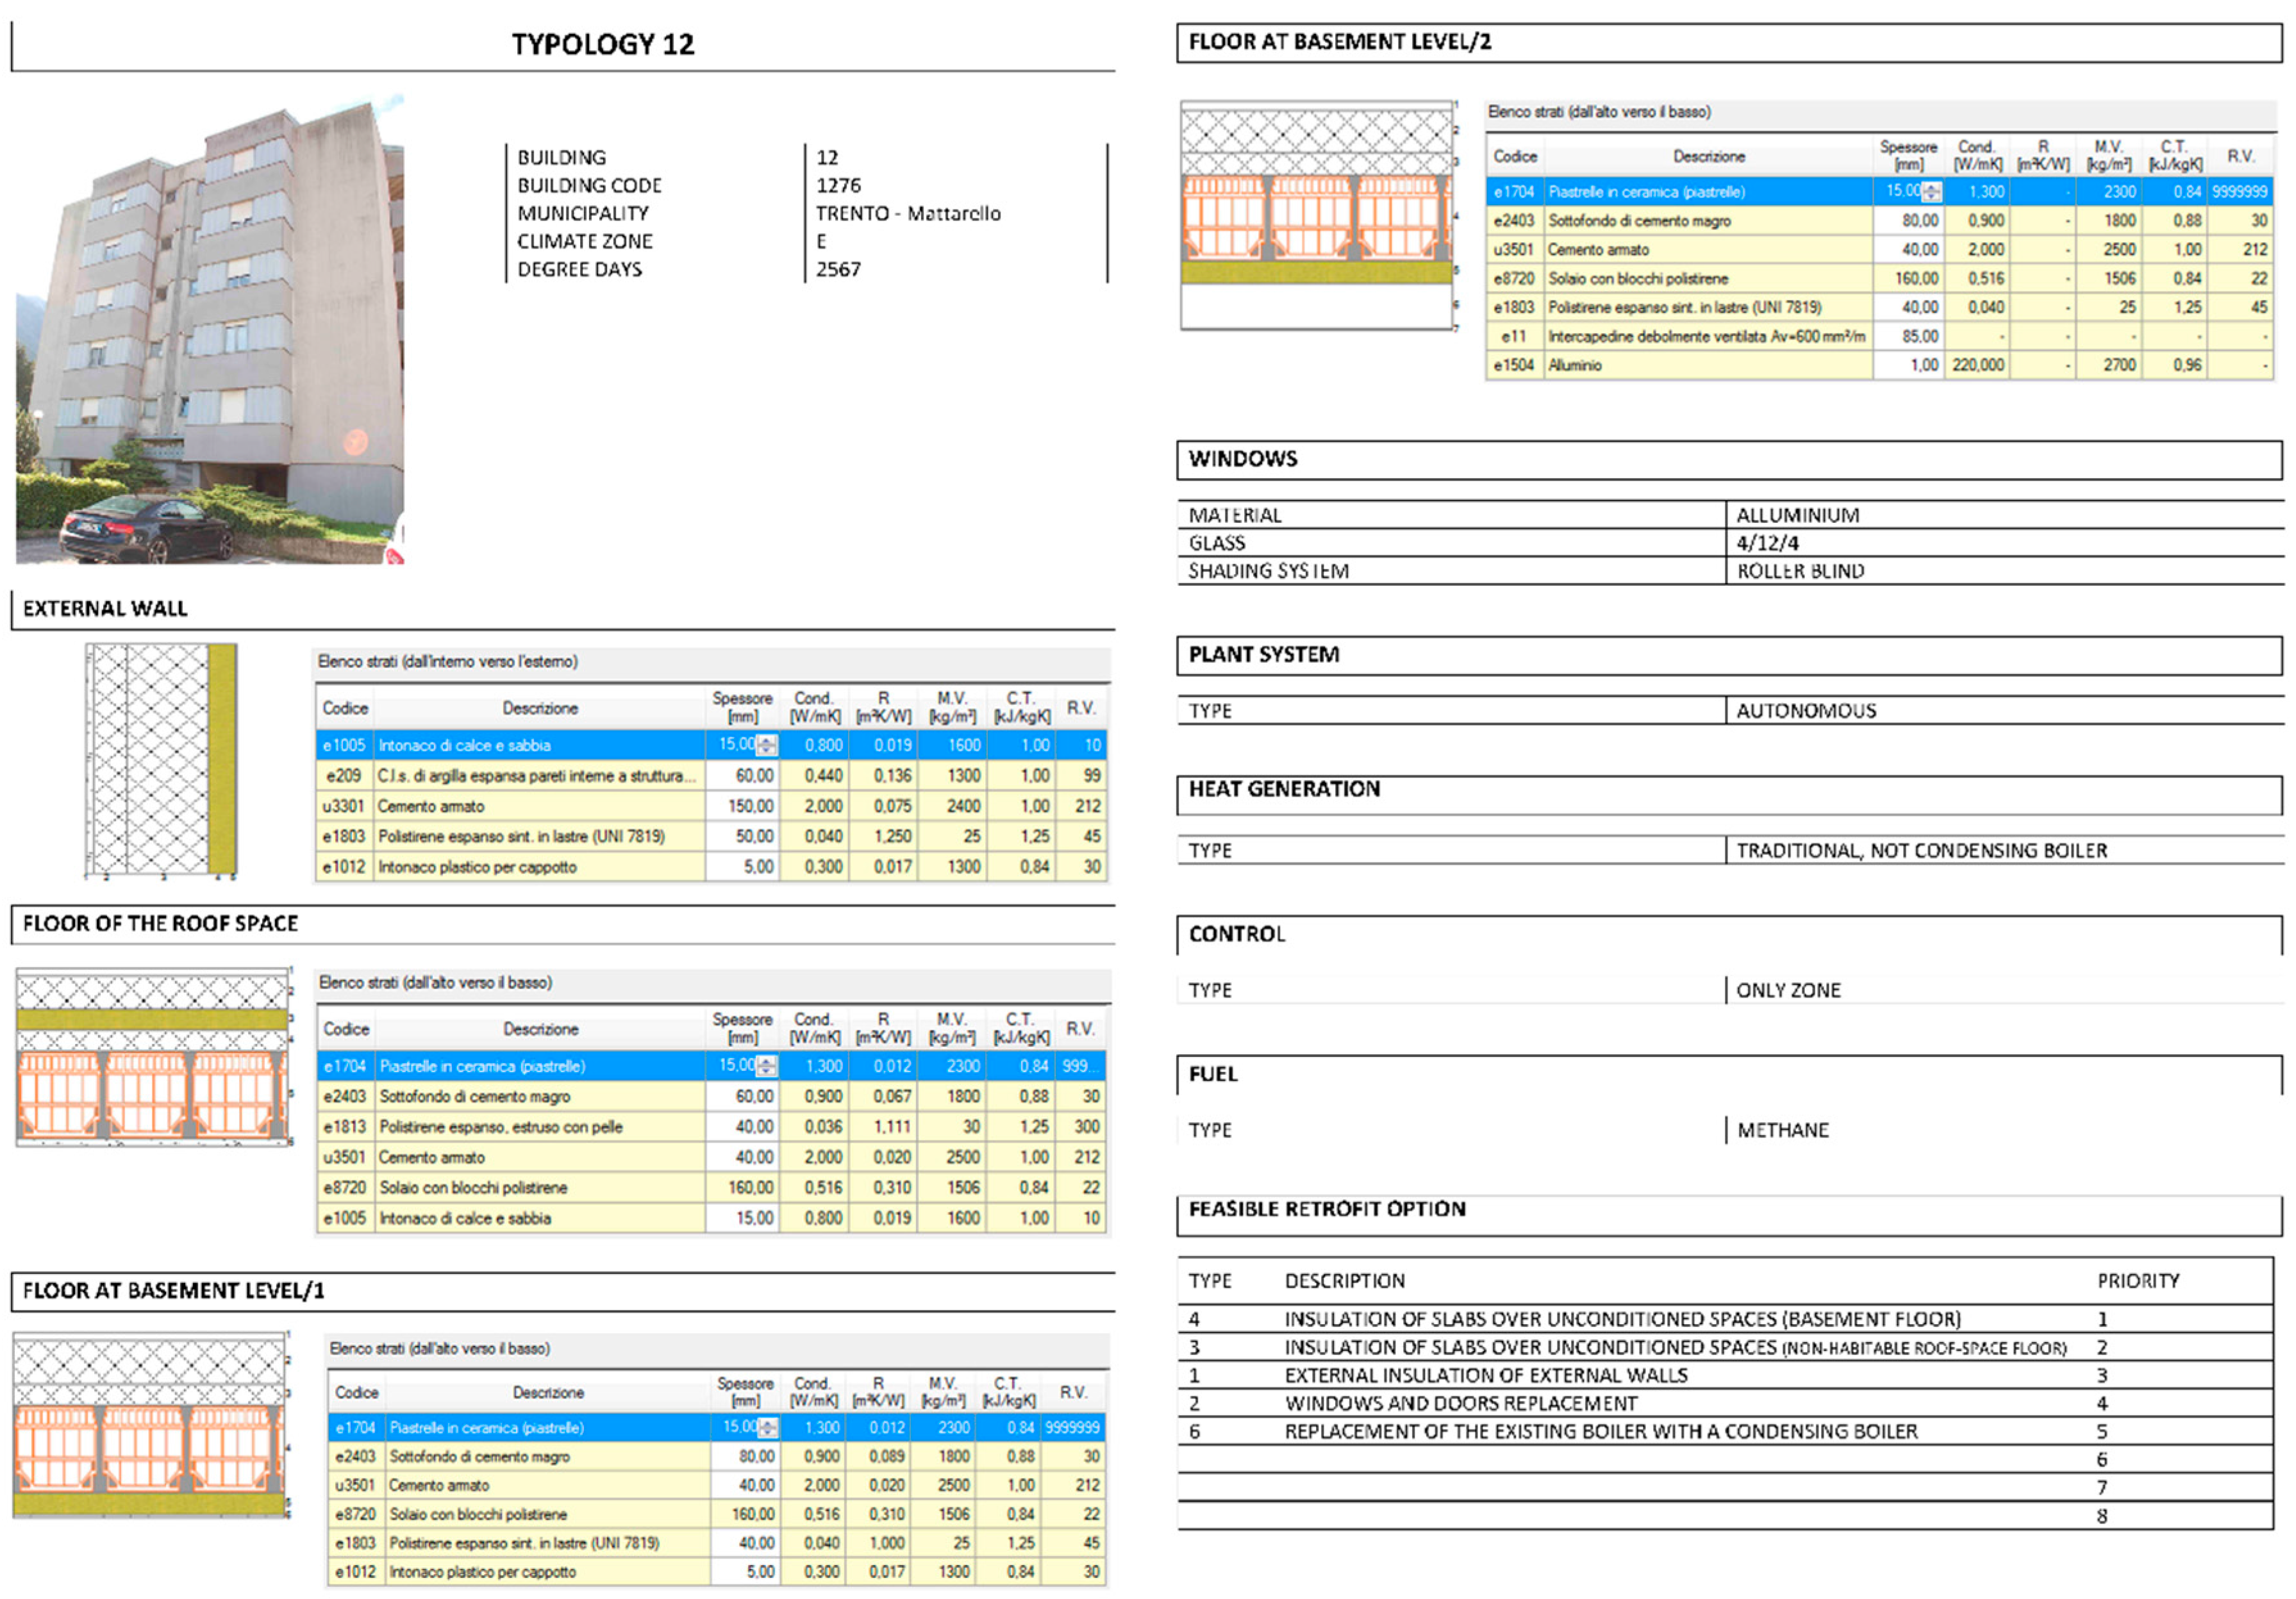
Worksheets have been completed (see example at
Figure 2). Each one includes the following data:
- (1)
Building image and identification code number;
- (2)
Components cross-section and technical data: external wall, floor slab of the roof-space, floor slab (heated volume enclosing elements);
- (3)
Windows typology;
- (4)
Main heating system;
- (5)
Heat generator;
- (6)
Heat regulation system;
- (7)
Heating fuels.
5. Analysis of the Building and Its Equipment and Energy Classification
The analysis of the envelope components and systems of the 25 selected buildings has been conducted in three consecutive phases:
Firstly, for each building, the original design documentation (architectural and structural project) has been collected so as to have a first indication of the building elements and systems and of the designed energy performances, before proceeding with the on-site audit. A matrix has been drawn where all the collected information is summarized, with regard to location, building type and construction type, geometric data (heated surface and volume), envelope components and materials, windows (material, frame, shading devices), thermal and electrical systems features and consumption data (when a centralized remote reading system is present).
Secondly, site visits have been conducted to verify the compliance of the documentary theoretical data with the actual appearance of the buildings. Geometrical surveying of significant parts of the buildings has been carried out at random, and the exposure and presence of shading elements have been verified. In addition, structural materials have been verified and window and door performance have been confirmed with specific measuring devices. The actual conditions of the mechanical systems have been evaluated, from the power unit to the heating appliances (presence of thermostatic valves or other thermal input local control devices, thermostats type etc.). Annual heating and electric energy consumption values have been collected, by randomly surveying the behaviour of the apartment occupants.
Thirdly, the building envelope thermal performance has been evaluated by measuring walls thermal transmittance with infrared thermography methodology developed by the researcher in an earlier work [
17]. This procedure, apart from giving a numerical value of the wall transmittance, helped verify the building deterioration and the presence of thermal bridges or air leakages, by the use of indoor thermography. Results from quantitative IR thermography has been used to calibrate the energy model of each sample building to keep the model as close as possible to the real conditions. Therefore, discrepancies between theoretical energy analysis and collected energy consumption have been minimized, because the differences of the results were always within a maximum error range of ±15%. Thus, the data coming from analysis in the following steps can be considered feasible.
Once the actual assets of the buildings sample were verified, steady state numerical modelling was conducted according to UNI/TS 11300:2008 part 1 and 2 [
22,
23] and UNI/TS 11300-4:2012 [
24] based on EN Standards, by means of a commercial software tool. Opaque and transparent building envelope components have been considered, including elements dividing housing units. Different units have been modelled individually, and they have been univocally defined by different thermal zones allowing the opportunity to compare performance in terms of exposure and use. This objective methodology allowed the choice of the most disadvantaged buildings for choosing the best retrofit actions. A steady-state analysis has been preferred to a dynamic one as the latter is more demanding and time-consuming and requires a larger amount of data input (including the TRY—Test Reference Year which is often not available; see Pernigotto et al. [
25]). Such input is often difficult to achieve—for example, a precise occupant schedule (Hoes et al. [
26]). In addition, in winter when thermal capacity loses importance, a faster and simpler steady-state method provides good results in terms of deviation from the real values of energy consumption, as pointed out by Prada et al. [
27]. It is well-known that the dynamic procedures are quite sophisticated techniques, which cannot be properly applied on rather old buildings, whose real materials and systems data are unknown or different from those declared in the design documents. Another important issue is that the research methodology is aimed at being useful to the funding body and replicable for further applications by technicians in a simple and fast way.
For each building, the energy demand has been evaluated for the production of sanitary water, heating and electricity demand, in kWh/yr. Those values have then been compared to the others monitored, and have achieved a good agreement. Therefore, energy key performance indicators have been evaluated in terms of power, grouped by elements (opaque elements, transparent elements, thermal bridges) and by exposure, with the purpose of separating the impact of each component on building heat losses and of giving an early indication of the feasible enhancing measures for energy retrofitting.
Thus, the actual effective conditions of the building sample has been confirmed and theoretical energy performance has been determined, with calibrated and corrected input data taking into account the real degradation, use and maintenance state of the buildings.
6. Evaluation of Feasible Retrofit Options
A simple and interactive tool, based on Excel worksheets, has been developed, able to simulate possible retrofit scenarios and show costs and investment-return time for each solution, based on energy simulation performed according to existing standards as previously specified.
To test the tool’s potential and to obtain early indication of the future technical-economic planning strategies, some retrofit options for the 25 buildings have been identified, following the on-site visit. In this way, the main shortcomings of the buildings in terms of energy performance have been surveyed and the possible solutions have been proposed. An economic analysis has been performed that determined the best cost-effective technologies among those usually applied by ITEA (local suppliers in respect of materials and labour, timing and category of intervention).
Consequently, the feasible measures have been subdivided into two types, that is, interventions for the building envelope and on heat generation and regulation systems. The former include:
external insulation with a 10 cm thick layer of polyurethane (λ = 0.031 W/mK);
windows and doors replacement (total replacement with Uw = 1.1 W/m2K or glass replacement only, with a 4-12-4-12-4 and Ug = 0.70 W/m2K triple-pane glass);
insulation of slabs over non-conditioned spaces (c1: non-habitable roof-space slab, and c2: ground floor slab) with an 8 cm thick layer of polyurethane (λ = 0.036 W/mK).
The latter include:
- d.
installation of thermostatic valves on radiators with independent remote control system. (It should be noted that the Italian legislative Decree that enforced the European directive 2012/27/EU requires radiators to be equipped with thermostatic radiator valves, taking effect at the end of 2016, in multi-apartment buildings supplied by district or common central heating);
- e.
replacement of the existing boiler with a condensing boiler (e1, independent or centralized) or with a biomass boiler (e2, the latter technology is feasible only in building provided with a diesel heating system);
- f.
installation of roof solar thermal panels, where feasible (a measure proposed only in buildings supplied by common central heating).
For each of the 25 selected buildings, feasible retrofit measures have been analysed individually or combined with others, defining for each scenario energy performance indexes and the parameters specified above (the achievable total energy demand, the reachable energy performance class, and the investment costs).
Potential overall savings in terms of future management costs and payback time are estimated after considering both the amount of fuel saved and its average cost (see
Table 2). The annual inflation rate (equal to 0.2% for 2014) and the amount of required fuel have been duly considered in order to define the capitalization rate of initial investment, according to an opportunity-cost approach that evaluates the benefits that could have been achieved by taking actions alternative to those considered. In this case, the expected return has been determined by using the returns rate on long-term (30 years) government bonds (average value: 3.0%).
Table 3 shows the length of the period of return on investments (payback time), expressed in years, for the 25 buildings for each considered retrofit option a-f as above described. Boxes are left blank if measures are considered not feasible in practice.
Table 3 illustrates that the interventions with longer average payback time (being 30 years the acceptance limit, values underlined) are:
external insulation system (column a), with only 10 cases below the acceptable limit (keeping in mind that 4 buildings, 12-15-22-23, have already an adequate thermal insulation). The main factor influencing total cost is scaffolding, which is particularly costly for medium/large buildings and represents up to one third of the total cost;
window and door replacement (column b), with no cases below acceptance limit, which indicates that the measure is not viable when applied alone without external insulation;
insulation of the ground floor slab (column c2), with 10 cases below the acceptance limit;
installation of condensing boiler (column e1), with 10 cases, out of the 20 considered, below the acceptance limit regarding buildings with centralized system.
Overall, payback time is acceptable (below 30 years) on investments related to insulating of the non-habitable roof-spaces (column c1), with only 8 cases exceeding it, due to the presence of an existing envelope with good thermal performance.
Low payback time is also achieved with:
- e.
installation of thermostatic valves on radiators, a minor and low-cost measure in terms of materials and skilled labour (column d);
- f.
replacement of the existing boiler with a biomass boiler (column e2), which is very beneficial since the unit cost of energy production with wood pellets is about 0.05 €/kWh;
- g.
installation of solar panels, mostly for water heating (column f).
In addition to the period of return on investments, the achievable effective energy savings should be considered, referring to the total (renewable and non-renewable) primary energy. A good energy saving (20.4%) can be obtained with biomass boiler and with thermostatic valves (15.5%), which have very fast payback time and therefore which are the most promising options, as the application of thermostatic valves is a fast and low-cost procedure.
By retrofitting the building envelope fabric with external insulation, greater benefits are achieved in terms of primary energy demand (with an average value of 23.5%) since it reduces heat losses through walls, which are poorly performing elements with a large surface. This percentage is very similar to that obtained by Dall’O et al. [
1] who write that “just considering the envelope retrofitting it is possible to reduce energy used by residential sector up to 24.8% in 2020”.
The tool has also indicated that other measures have a low impact on energy savings; therefore, it is not appropriate to consider them individually.
Nevertheless, whenever it has been decided to set up a management plan for building retrofits, joint and multiple solutions should be applied in order to minimize the impact on fixed operational costs. For this purpose, the following possible combinations have been considered:
- g.
external insulation with window and door replacement;
- h.
the same as solution g, plus insulation of the non-habitable roof-space slab;
- i.
the same as solution h, plus thermostatic valves replacement;
- j.
the same as solution i plus biomass boiler.
The results are shown in
Table 4 where the average, minimum and maximum value of heating energy demand are highlighted.
Shifting from g to j, the percentage variation of heating energy demand increases, showing that the intervention is more appropriate for preserving the environment with a reduced use of energy sources. Considering that thermal energy from renewables is more or less 7% of the total thermal energy produced in Italy (data of 2011), CO2 emissions can be reduced up to 55%.
The number of payback years usually increases for intervention g and h (from 3 to 8 years, depending on the building class analysed), while in the majority of cases for intervention i and/or j the investment in retrofitting measures becomes more attractive, even if the initial cost is higher.
7. Retrofit Measures Costs and Generalizations
Table 5 illustrates the estimated total costs and the specific cost per square meter for the different scenarios a-f (as described in the previous
Section 6) and for each selected building based on the price list for public works, currently used in the Province of Trento (n is the number of the building, S is the total floor area, V is the total volume, Walls is the opaque area of the envelope, Windows is the glazed area of the envelope).
As stated by Dinar and Mendelsohn [
28], “scaling up the model results to a regional level is, as in most scaling exercises, not an easy task and one that always increases the uncertainty of the evaluation”. However, “One of the key questions in value transfer and scaling up is the choice of the unit of transfer” [
29], which must be common throughout the study. The unit of transfer considered in this work is the overall cost of the interventions for each building category. Specific costs, which vary from about 200 €/m
2 to 300 €/m
2, show that the proposed solutions are comparable in terms of economic feasibility.
To obtain the global costs to be met in the short–medium term for the overall building assets, retrofit options should also be prioritized in terms of building energy performance class enhancement.
Theoretically, considering the intervention in the whole examined asset, the highest costs are related to measures involving retrofitting of building fabric and envelope (external insulation or windows replacement) at an expenditure of approximately €2,500,000 each. The total amount, when all actions are considered, stands at €7,000,000.
To intervene over the next 5 years across 30% of the buildings managed by the company and considering 25 buildings sample as representative of the different types until year 2000, the cost for the energy retrofitting of 189 buildings (that is, 567 buildings divided by three; please refer to
Table 1) should amount to €53,000,000, equivalent to €5,300,000 per year. The last part of the research, still going on, regards the compiling of an inventory of ITEA building stock based on the representative building types previously defined. This way, it will be possible to scale-up the retrofit simulation and to have a clearer picture of the costs and period, with a better definition of the numbers previously presented.
Following this research project, in December 2015, ITEA received a financial contribution of €2,100,000 from the Province of Trento to be able to undertake the necessary energy retrofitting actions of 406 apartments (corresponding to 46 buildings). Other money came from the private sector. The ten years’ total investment cost amounts to €7,357,998, of which €5,257,998 is from private capital. With the elaboration of this intervention plan, it has been possible, for ITEA and for the private investors, to conjugate two very important aspects: to collect data from a specific calculation regarding costs, achievable savings and payback time and to execute retrofitting works at the same time as other necessary actions on buildings envelope, by optimizing costs, especially as regards scaffoldings. Furthermore, a potential energy performance contractor of ITEA may benefit from various types of local or national contributions and from fiscal benefits, which contribute to further reducing investment payback.
In fact, considering the sole payback time, without taking into account environmental and user comfort advantages, energy retrofitting interventions are not economical, especially for old and large buildings. Nevertheless, some funding possibilities already exist, as shown below:
- (1)
Tax benefits, linked to the intervention quality and effectiveness, that allow partial recovery of the costs (from 50 to 65%) in a limited period of time (usually 10 years);
- (2)
Soft loans received as public contributions (0.50% per year) for a maximum of 6 years (15 for public bodies), repayable by semi-annual instalments (the so-called “Kyoto Fund”);
- (3)
ESCo, Energy Service Company, that covers the costs of the interventions that will be repaid by part of the savings as agreed upon with the owners. The Company can gain money only if the interventions are profitable, so it is encouraged to act in the most efficient way possible.
8. Discussion
One should necessary consider a high number of reference cases, representative of the entire building stock, in order to give quantitative data on the energy performance and of the building retrofitting costs at a regional scale. Standard EN 15603:2008 [
30] states that “If the building has a known typology, the thermal transmittance of the envelope components can be taken from building typology prepared at national level”, which implies that the energy performance of a building can be considered similar to the performances of those with the same typology. This hypothesis is assumed by Cetiner and Edis [
31], who proposed a method to evaluate the building performance “based on selecting the most comparable building type predefined in the database by considering the characteristics of a particular building that will be evaluated”. The higher the accuracy of the samples, by the number of reference buildings compared with the variants identified, the higher the accuracy of the results. Considering a random selection, they analysed ten buildings as representative of a neighbourhood of Istanbul (Turkey) (even if thirty is considered the minimum number in order to have a normal distribution, in practical application of the central limit theorem [
32]). On the other hand, Wang and Holberg [
4] considered 4 classes for more than 2 million detached and semidetached houses in Sweden, while Nik et al. [
21] modelled 153 buildings out of the 1400 chosen as representative of all the Swedish buildings. Pombo et al. [
33] state that “The difficulty in defining a building model that represents the total building stock is well known due to the complexity and heterogeneity of the existing stock”, and they selected just one multi-family house as representative of the typology of the Spanish housing stock. As defined above in
Section 4, we decided to apply a statistical approach called judgmental sampling that allows us to outline the best classification for a heterogeneous building stock. Hence, the authors’ assumption to make an accurate selection of 25 buildings as representative of the 645 buildings of the ITEA housing stock can be considered feasible.
As previously stated, the evaluation of the energy performance of the building in real operating conditions is important in order to have reliable data. Out of the several methods, the authors developed, within the previous phase of the research here presented, a novel method based on infrared thermography that can assess the thermal transmittance, U-value, of the building envelope [
17], in a faster and cheaper way with accuracy similar to the others’. This methodology enables two trained technicians to carry out the survey of a medium-size building (4 floors and 24 apartments) in about 60 min plus 45 to 60 min for geometrical and systems verification, and 2–3 h of deskwork. The usefulness of the methodology is mostly seen in the possibility to calibrate the model input and to use energy data closer to reality. Therefore, the economic evaluation and the choice of the best retrofitting options are far more accurate.
As a good starting point to reduce the number of on-site visits, basic information about the building size, types, materials and building elements is generally available in the original project documentation stored in municipalities as well as in regional and State archives. When this basic information is not available, a more accurate and complete survey of the building is necessary.
As previously stated, the maximum difference allowed and accepted between theoretical and actual energy consumption is ±15%. Also, the theoretical consumption is generally lower, up to 50%, than the actual one (Majcen at al. [
34]). But “However, the alternatives to simulation methods (as used in some countries), such as energy labels calculated on the basis of the actual energy consumption of the former occupant or based solely on insulation values, are not expected to produce more accurate results” [
34]. Therefore, it appears that until now there has been no alternative but to reduce to a minimum the discrepancies between actual conditions and theoretical calculations, by using the latter as the last option. In fact, they are based on common methodologies and assumptions, defined by international standards; therefore, the comparison of results and the percentage variation can give us a clear and more indicative ranking of the considered choices.
Finally, some considerations regarding the transferability of the tool are here illustrated. The methodology here presented proposes a new approach to the definition of a general plan of retrofitting intervention that takes into account not only economic but also energy and environmental aspects, based on a novel methodology used to assess the actual building conditions [
17]. The four steps of the methodology (
Figure 1) are general so that they can be applied to different geographic and cultural situations, as well as to different scales. The evaluation of the existing building stock can be made through the judgmental sampling approach, as here proposed, or through previous studies about the building typology of the region. The number of classes to be considered depends on the objective of the research and, finally, on the experts that make the choice itself (for example, the technician of the local housing body, of the municipality, of the chambers of builders, of the regional administration in charge for financial contributions and so on). Of course, the more classes there are, the more building samples there are to be analysed, and the higher the costs.
Trained technicians that follow international standards can perform the analysis of the buildings and its equipment. The evaluation on site of the thermal transmittance of the building envelope with infrared thermography, whose pros and cons have been above summed up, proved to be an important tool to draw a clear picture of the real condition of the envelope and to appropriately calibrate the energy model. The latter can be easily performed by means of commercial software that follows national (or local, if feasible) standards and guidelines. The definition of future retrofit scenarios depends furthermore on the objective of the study, i.e., the specific interest of the client. Again, it is important to identify a board of stakeholders or experts that has the duty to define, together with the technician, the main guidelines for future choices (use of natural materials, passive or active technology, basic or smart equipment and so on). The technician proposes suitable solution available on the market, with respect to the budget constraints and the environmental needs.
In addition, the tool based on Excel worksheets can easily be changed or implemented with the new solutions, in view of new scenarios. Moreover, the simulation of investment return can be performed by simply changing the expected payback time and local inflation rate.
9. Conclusions and Future Developments
This paper illustrates the feasibility of a simple and effective tool that is useful for the management of a social housing company building stock. The tool singles out meaningful building classes, applies the results to the whole stock and offers plans and analyses to possible intervention scenarios. Technical solutions have been considered, along with their costs and payback periods, in order to define interventions and budget commitments for long-term projects. The future prospective users of the tool are other public bodies (municipalities, for example), property owners and organizations interested in developing strategies and policies for the retrofitting of urban districts or larger groups of buildings. Private companies or building manager associations can get useful information that enables them to offer flat owners long-term plans for investment in the building’s energy savings. Municipalities can use the tool in order to both enhance the building energy performance and to save maintenance money. The municipal responsibility concerning energy efficiency, environment and climate calls for many fields of expertise, such as planning, heritage, building permissions and regulations and technical requirements. Moreover, it involves different levels of society, from the political to the user levels. In this respect, the decision support tool could work as a cross-sectoral knowledge platform for dialogue to work towards optimized and more transparent decision processes, thus overcoming the inadequacy of communication between the experts representing the municipality, the property owners and the consultant with expertise in the fields of architecture and energy. In this scenario, the ultimate beneficiaries of the process are the final users of the buildings, because energy-efficient retrofitted buildings provide better health and comfort and increase values and sales prices.
It is well-known that public tax policies and incentives are quite necessary for driving the market towards those energy retrofitting actions, which, though they have little economic appeal, are truly important for environment and comfort. These policies could help the building sector in a period of deep crisis facilitating the birth and growth of new companies such as the ESCos.
Furthermore, proper management of the building stock is based on continuous maintenance operations, whose costs go up considerably as the building age. Thus, in the medium–long term, it is often more convenient to choose expensive works that are effective both from a structural point of view and of energy.
In addition to defining a long-term plan of retrofitting interventions through managed and organized suitable strategies, the proposed tool is going to be used by ITEA to take concrete action towards a more accurate and sustainable buildings management. This action is required by its public role and the resulting responsibility towards the people and the territory. Moreover, the economic value of the buildings will be increased. Apart from the tangible monetary energy savings, ITEA shall have the option to revise the rents downwards up to a certain amount, on condition that tenants participate in energetic spending of not yet retrofitted buildings. In this way, tenants will be directly involved in generating a shared responsibility towards the environment and ITEA itself, and efforts will be capitalized by sharing the expenses, allowing to program further retrofitting plans.
A possible future development of this research should take into consideration the green retrofitting approach, looking not only at the energy aspects (envelope and systems) but also at the use of renewable energy sources, passive systems and the LCA of building materials and elements. Since occupants have a large impact on both energy consumption and the indoor environment [
26], it is equally important to define possible policies for their inclusion in order to improve and guide their behaviour towards more sustainable and environmentally friendly building strategies.


