
The Non-Linear Effect of Chinese Financial Developments on Energy Supply Structures

 ,
,  , ,
, , 
Abstract
:1. Introduction
2. Literature Review
2.1. The Evolvement of Financial Development Indicators
2.2. Why Does Non-Linear Analysis Matter in the Energy Supply Model?
3. Data, Variables, and Model Introduction
3.1. Data and Variables
3.2. PSTR Model Specification
4. Empirical Analysis
4.1. Unit Root Test
4.2. Nonlinearity Test and Transition Regime Determination
4.3. PSTR Model Estimation
5. Discussion
5.1. The Time-Varying Elasticity Analysis of the LCSR Specification
5.2. The Time-Varying Elasticity Analysis of the LTPG Specification
6. Conclusions and Recommendations
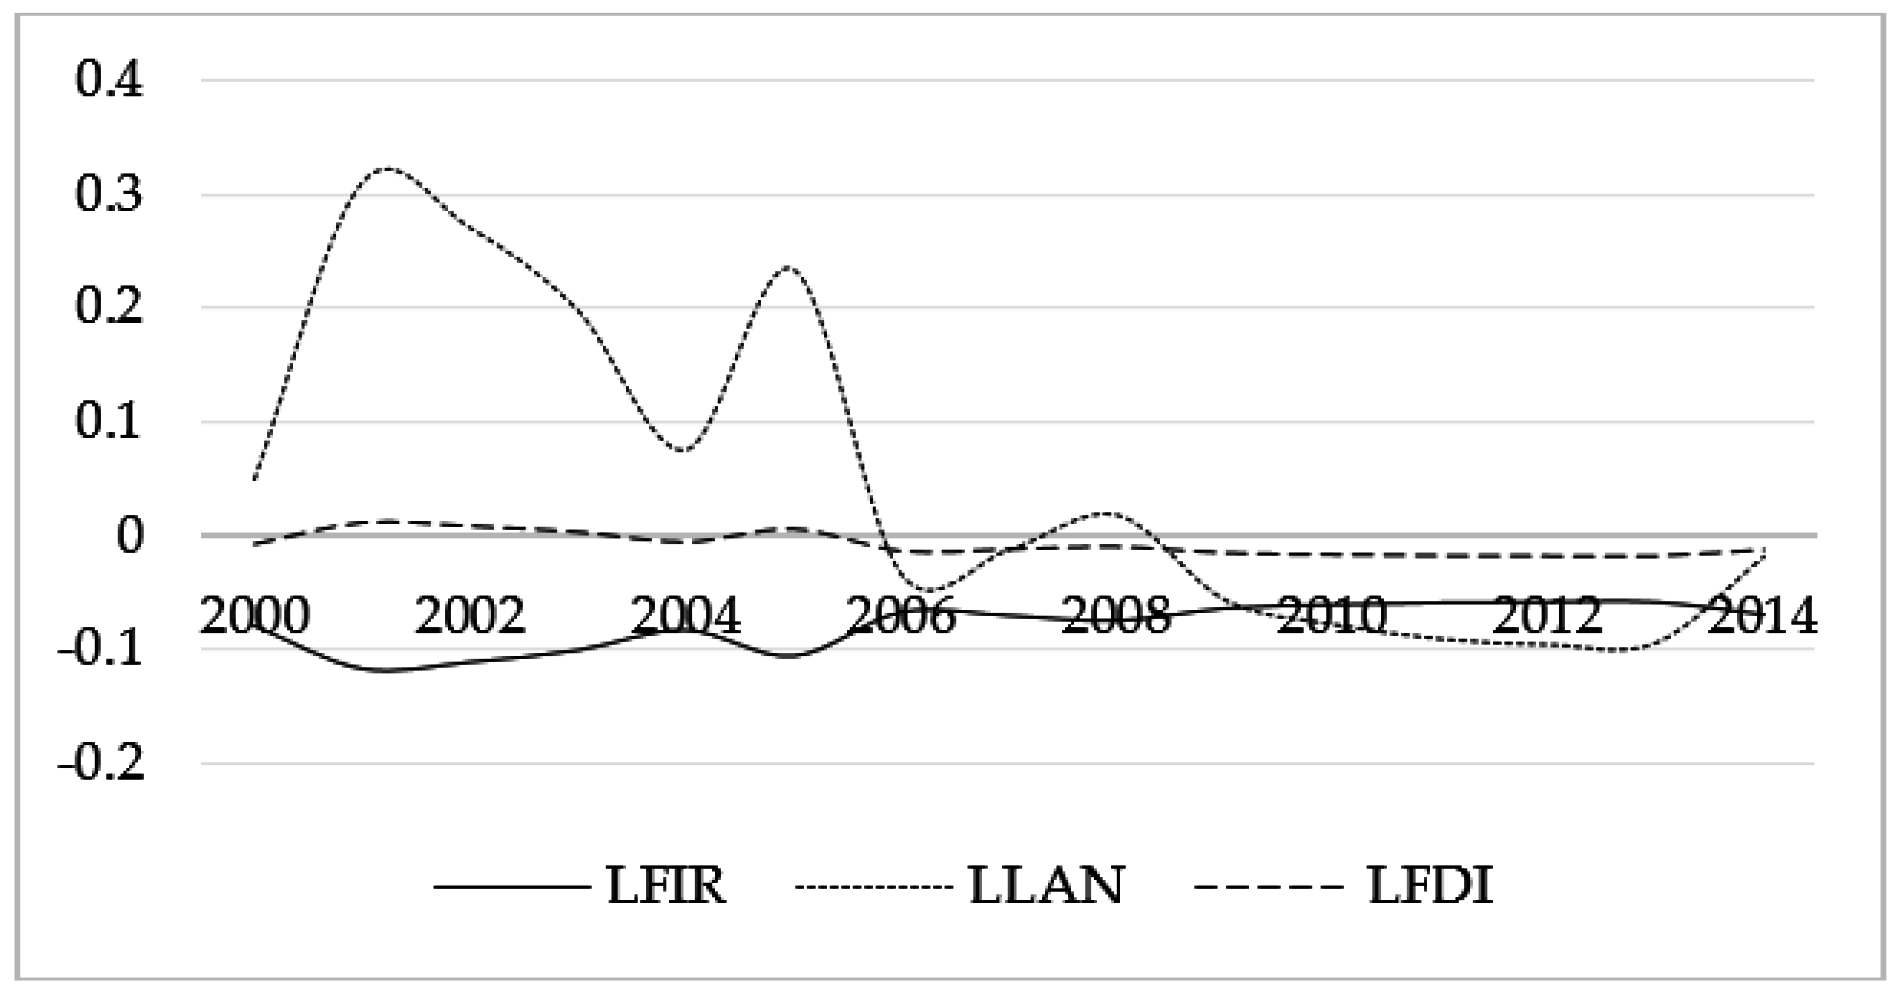
- (1)
- Improving the ratio of the financial industry to GDP is helpful for hindering the overproduction of thermal power generation by 0.066%~0.117%. However, it is not helpful for the decrease of the ratio of coal production in high financial development regions such as Ningxia. Therefore, the financial sector can play a useful role in resolving the coal overcapacity. As is emphasized by numerous experts, finances play a dominant role in the process of supply-side reform, so the local government should make great effort to develop the financial industry in the future, which will be very helpful in reducing the coal overcapacity.
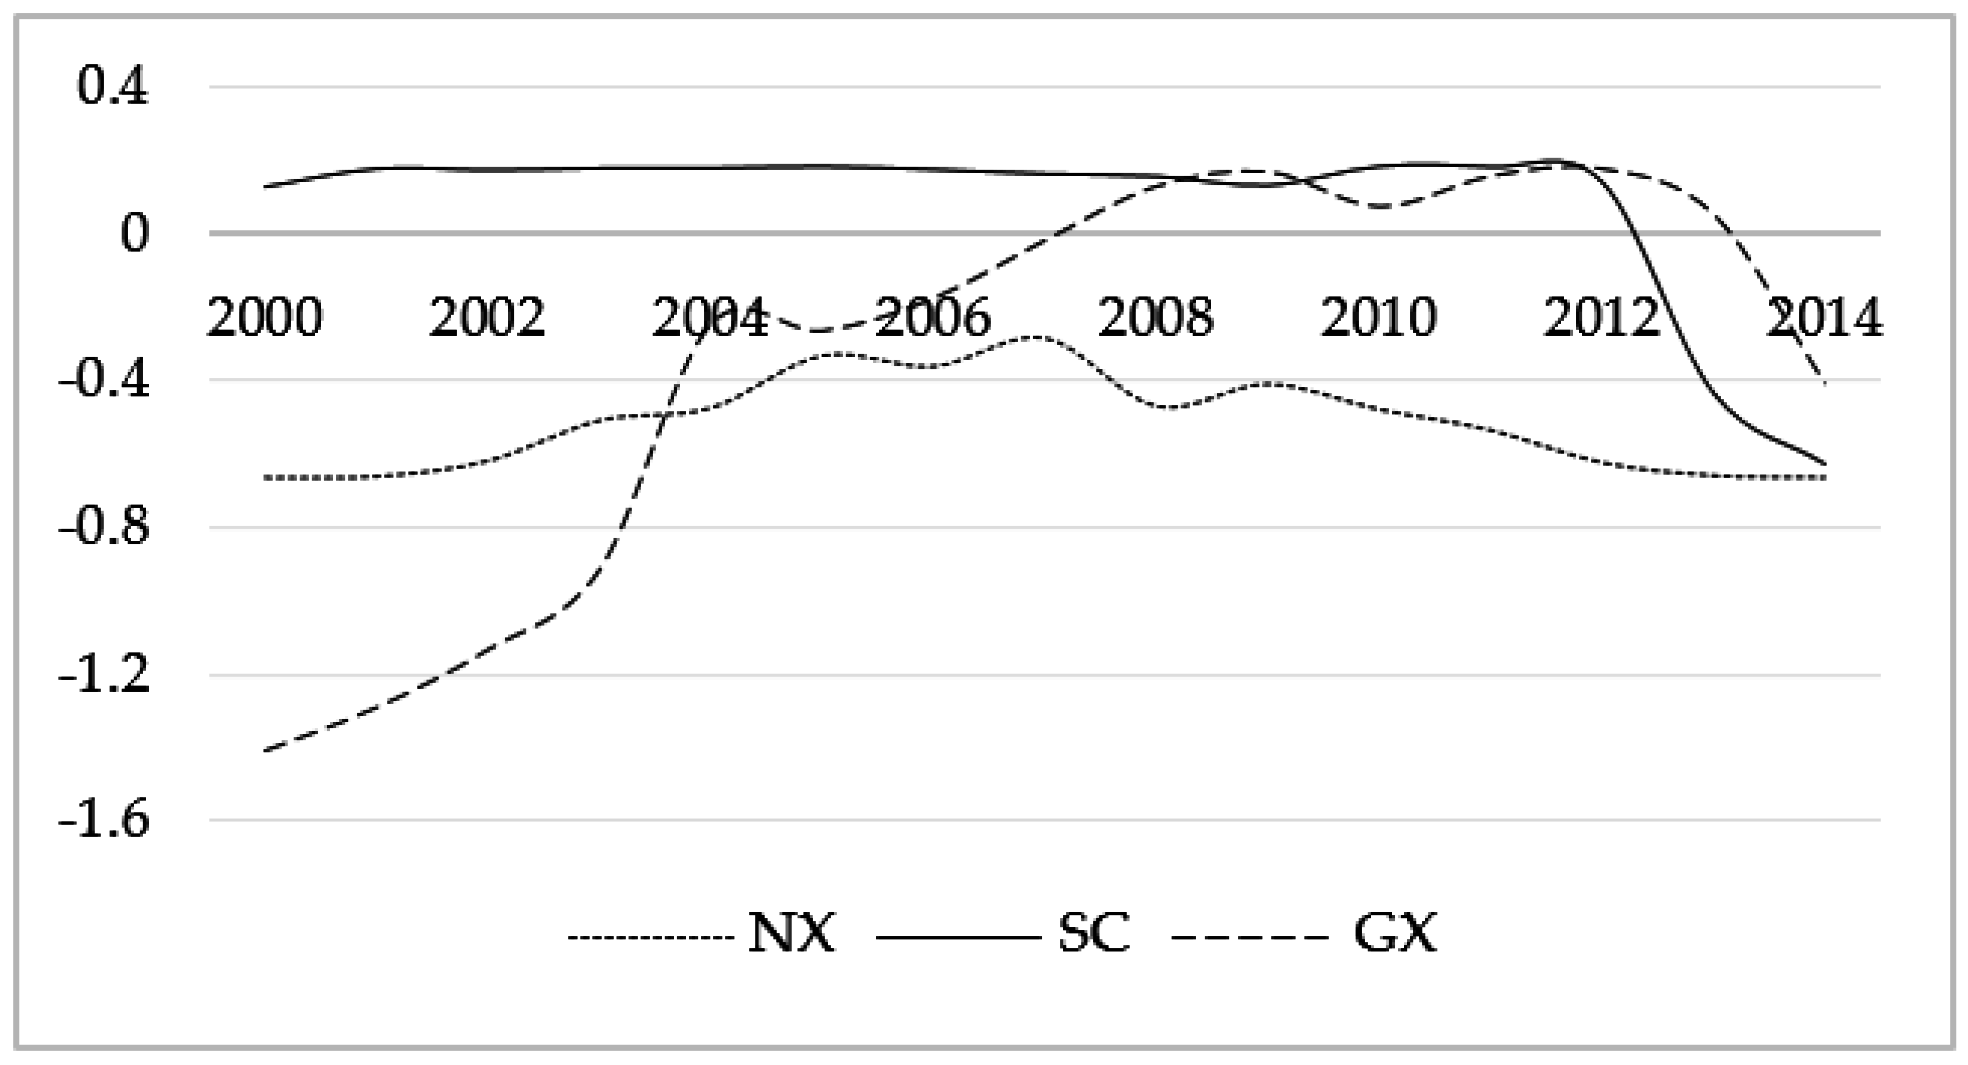
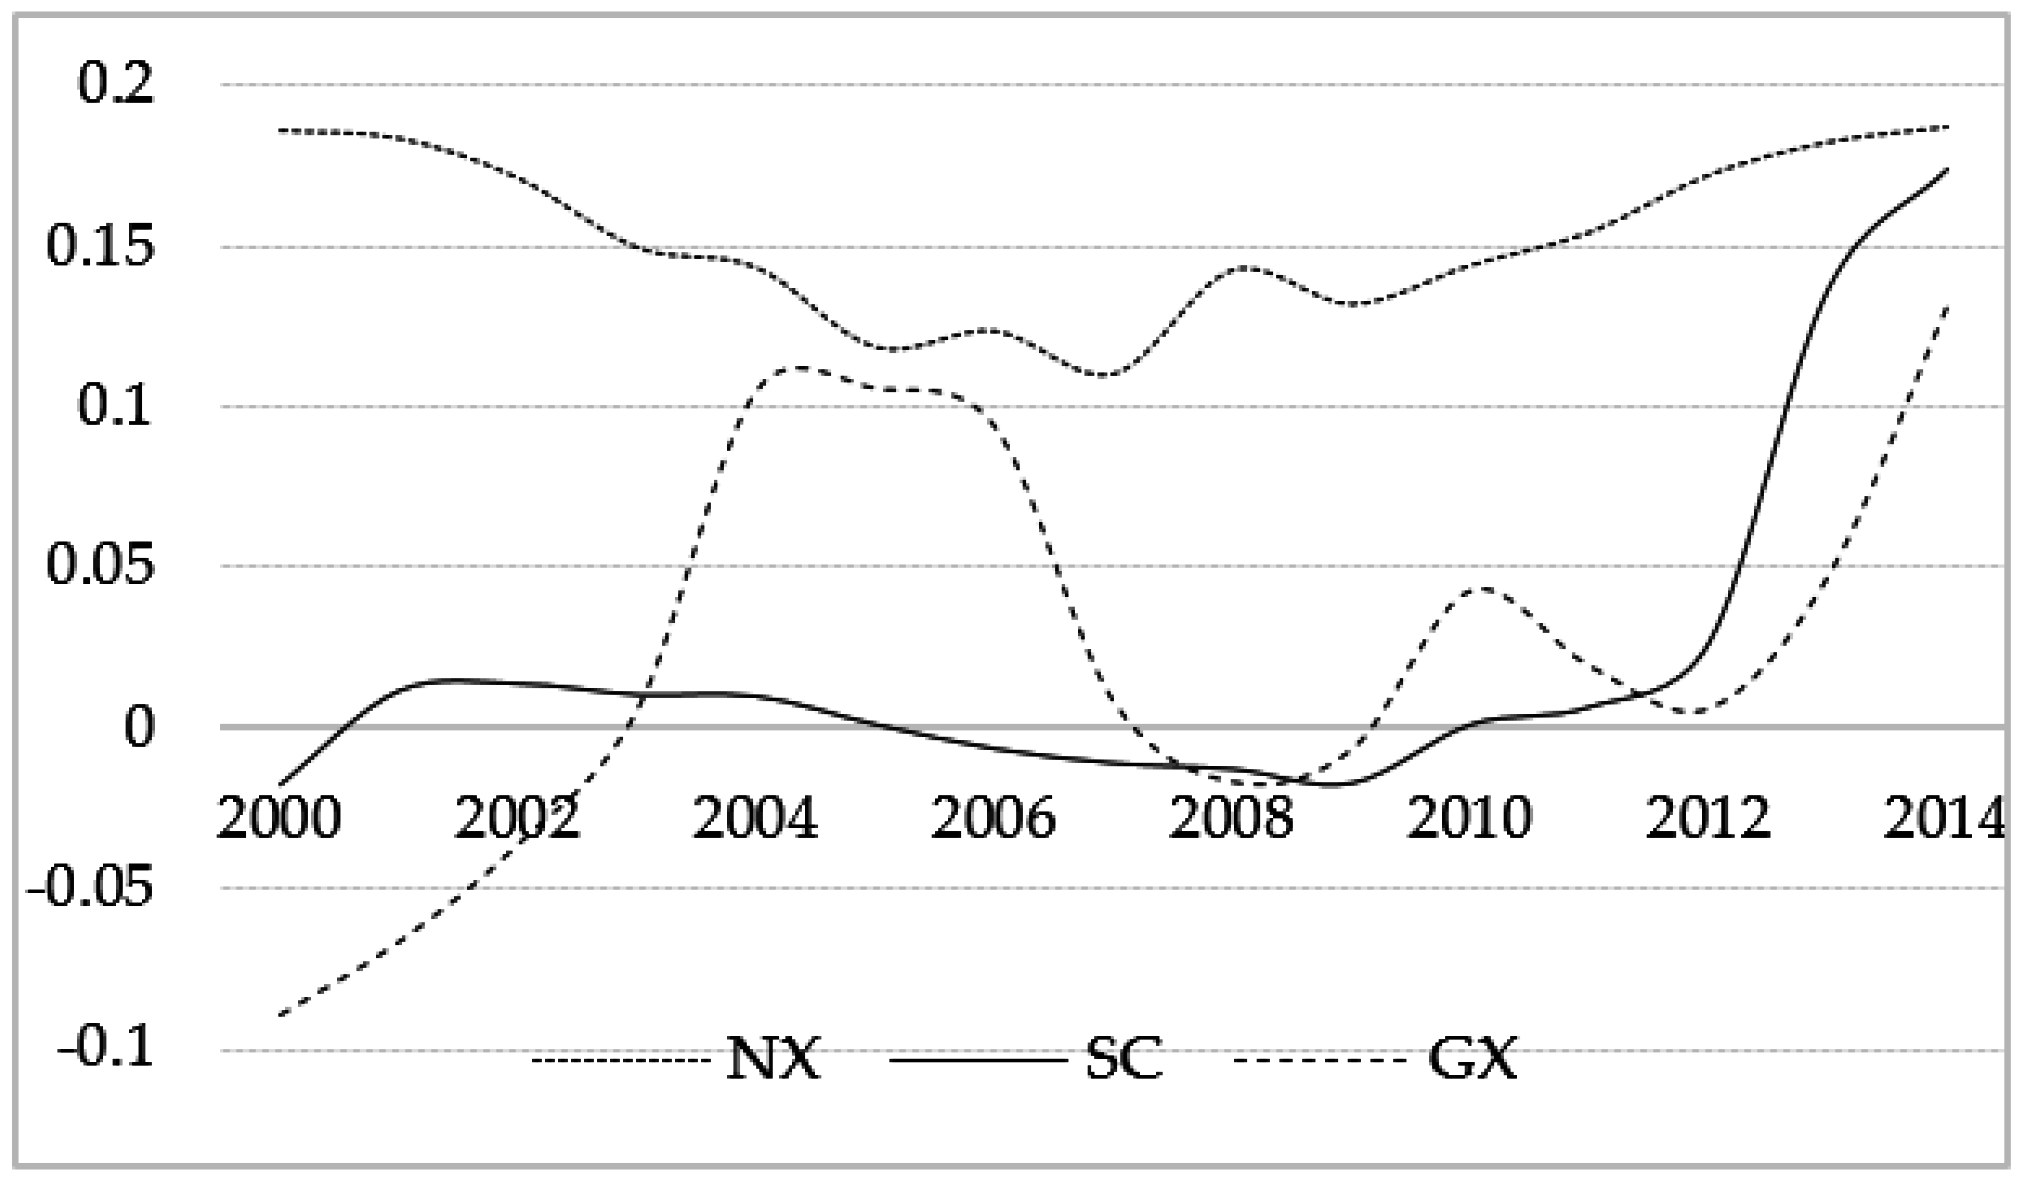
- (2)
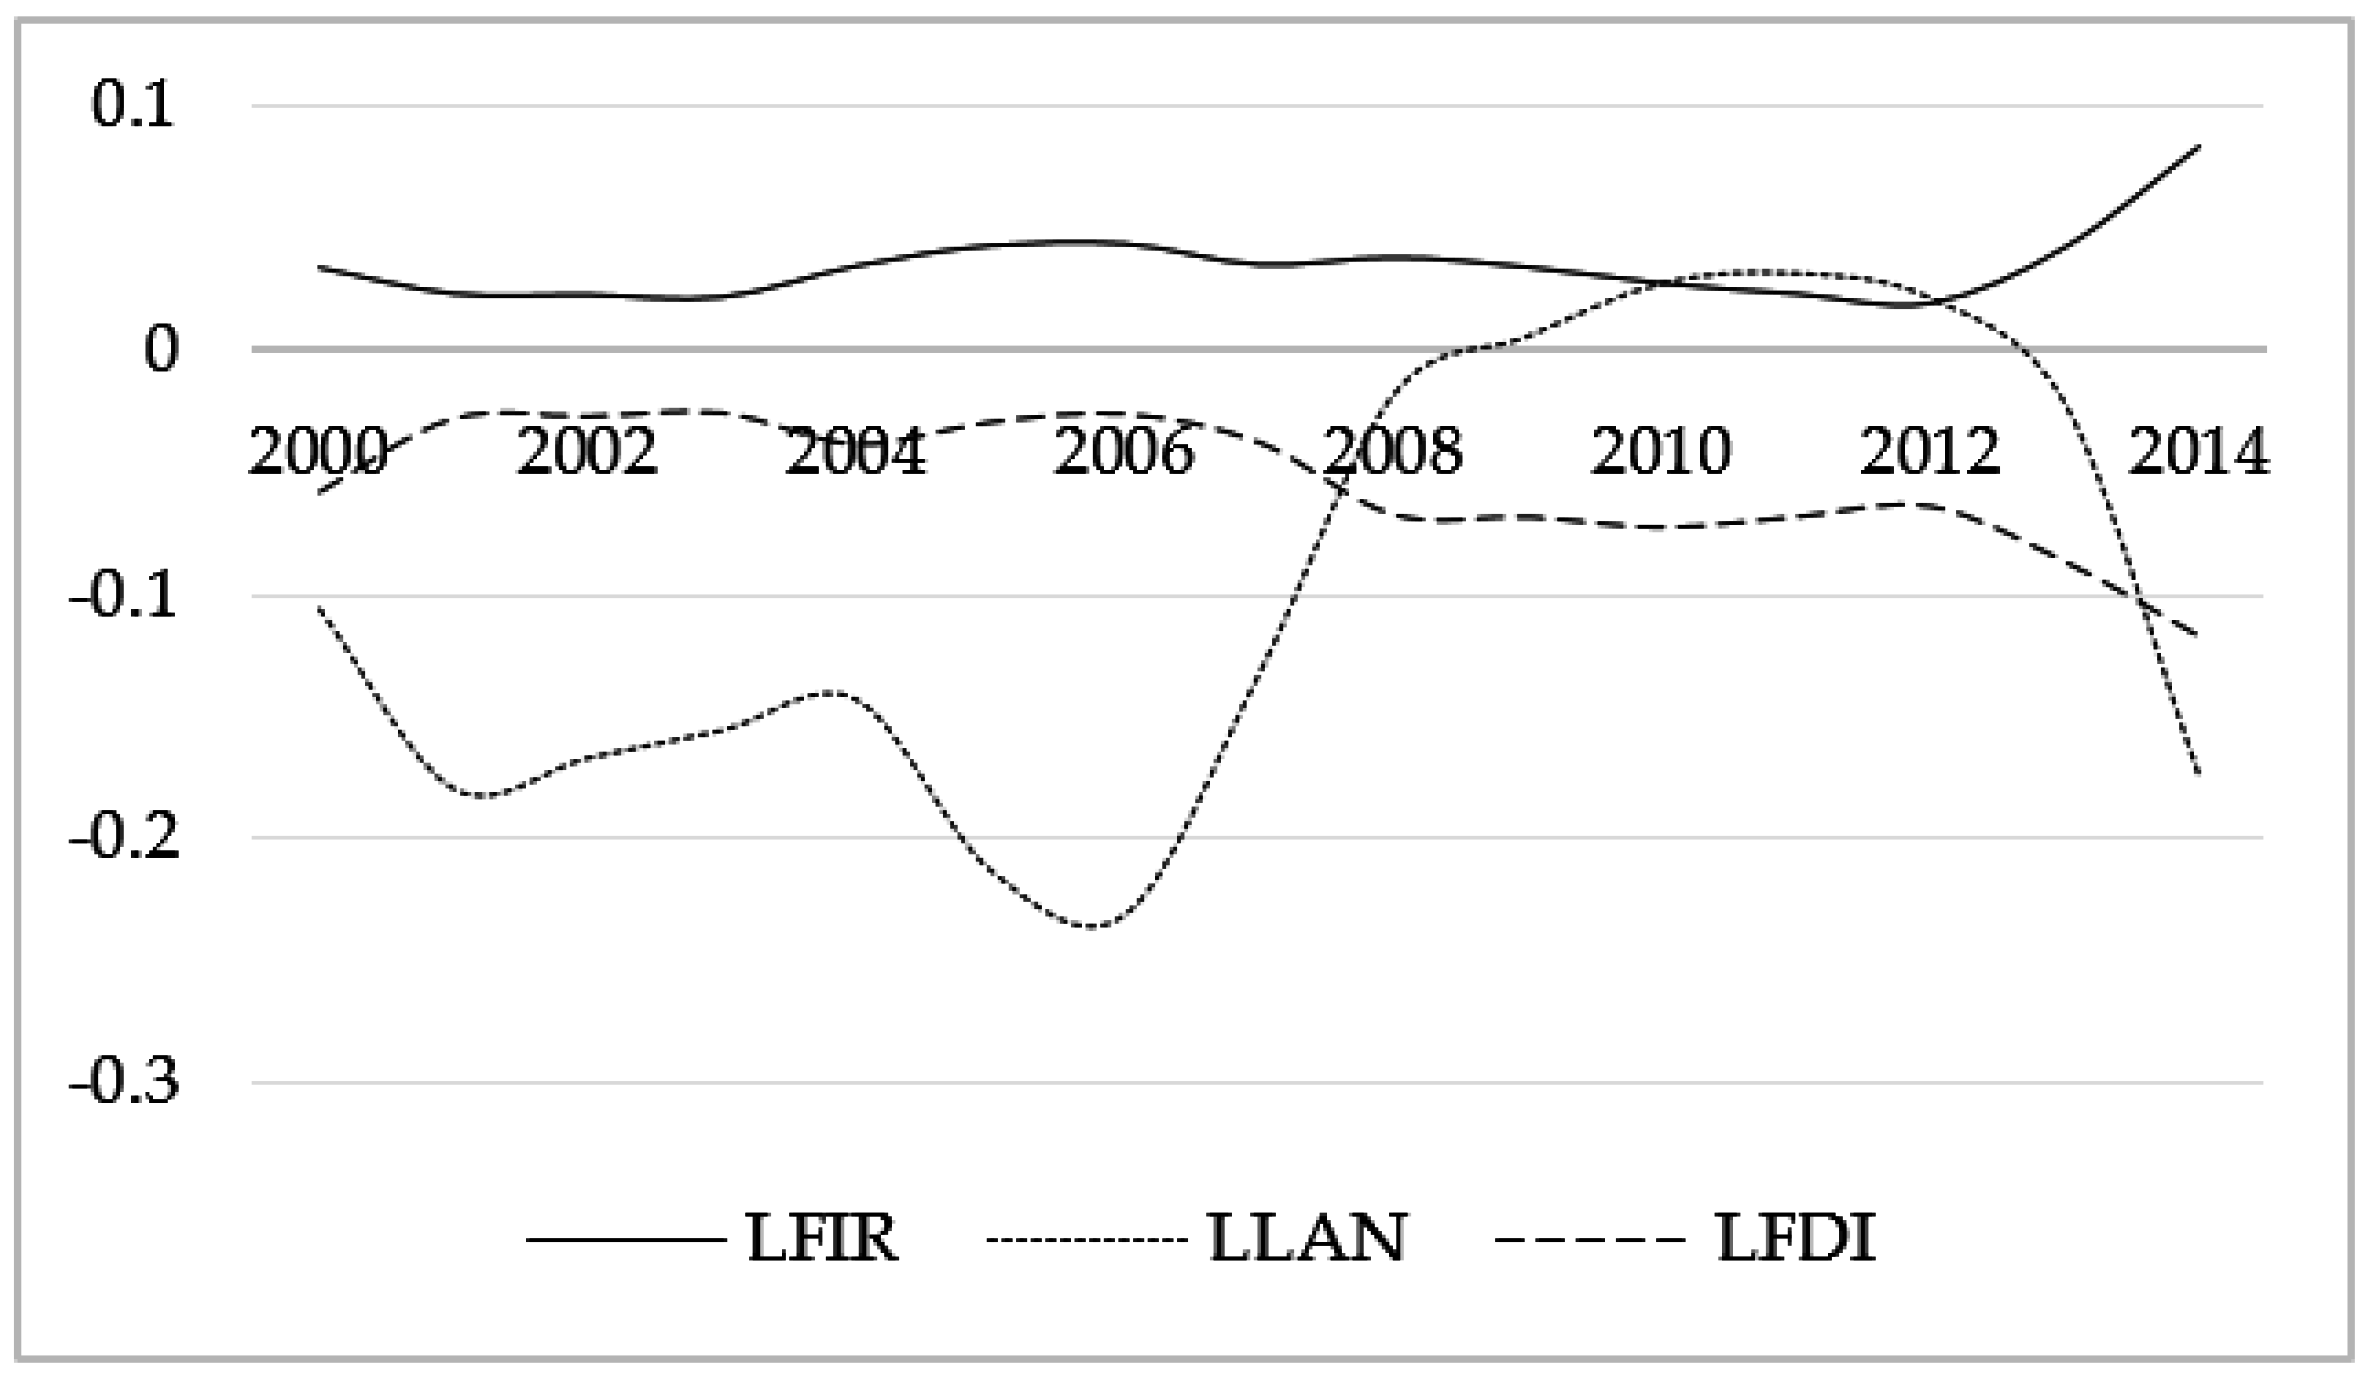
- The impact of loans in financial institution/GDP on the ratio of coal supply is negative in high financial development regions such as Ningxia. In middle financial development region like Sichuan, the influence is mainly negative. In Guangxi, with the development of the financial industry, the impact is first positive and then negative. The impact on thermal power generation is also first positive and then negative with the increase of investment in the coal industry. Therefore, for the region with developed finances, the bank lending more money to energy enterprises is beneficial for resolving the problems of coal overcapacity, but in low financial development regions, banks should not give credit to debased businesses. For the local government, more investment in the coal industry will result in a decrease of thermal power generation.
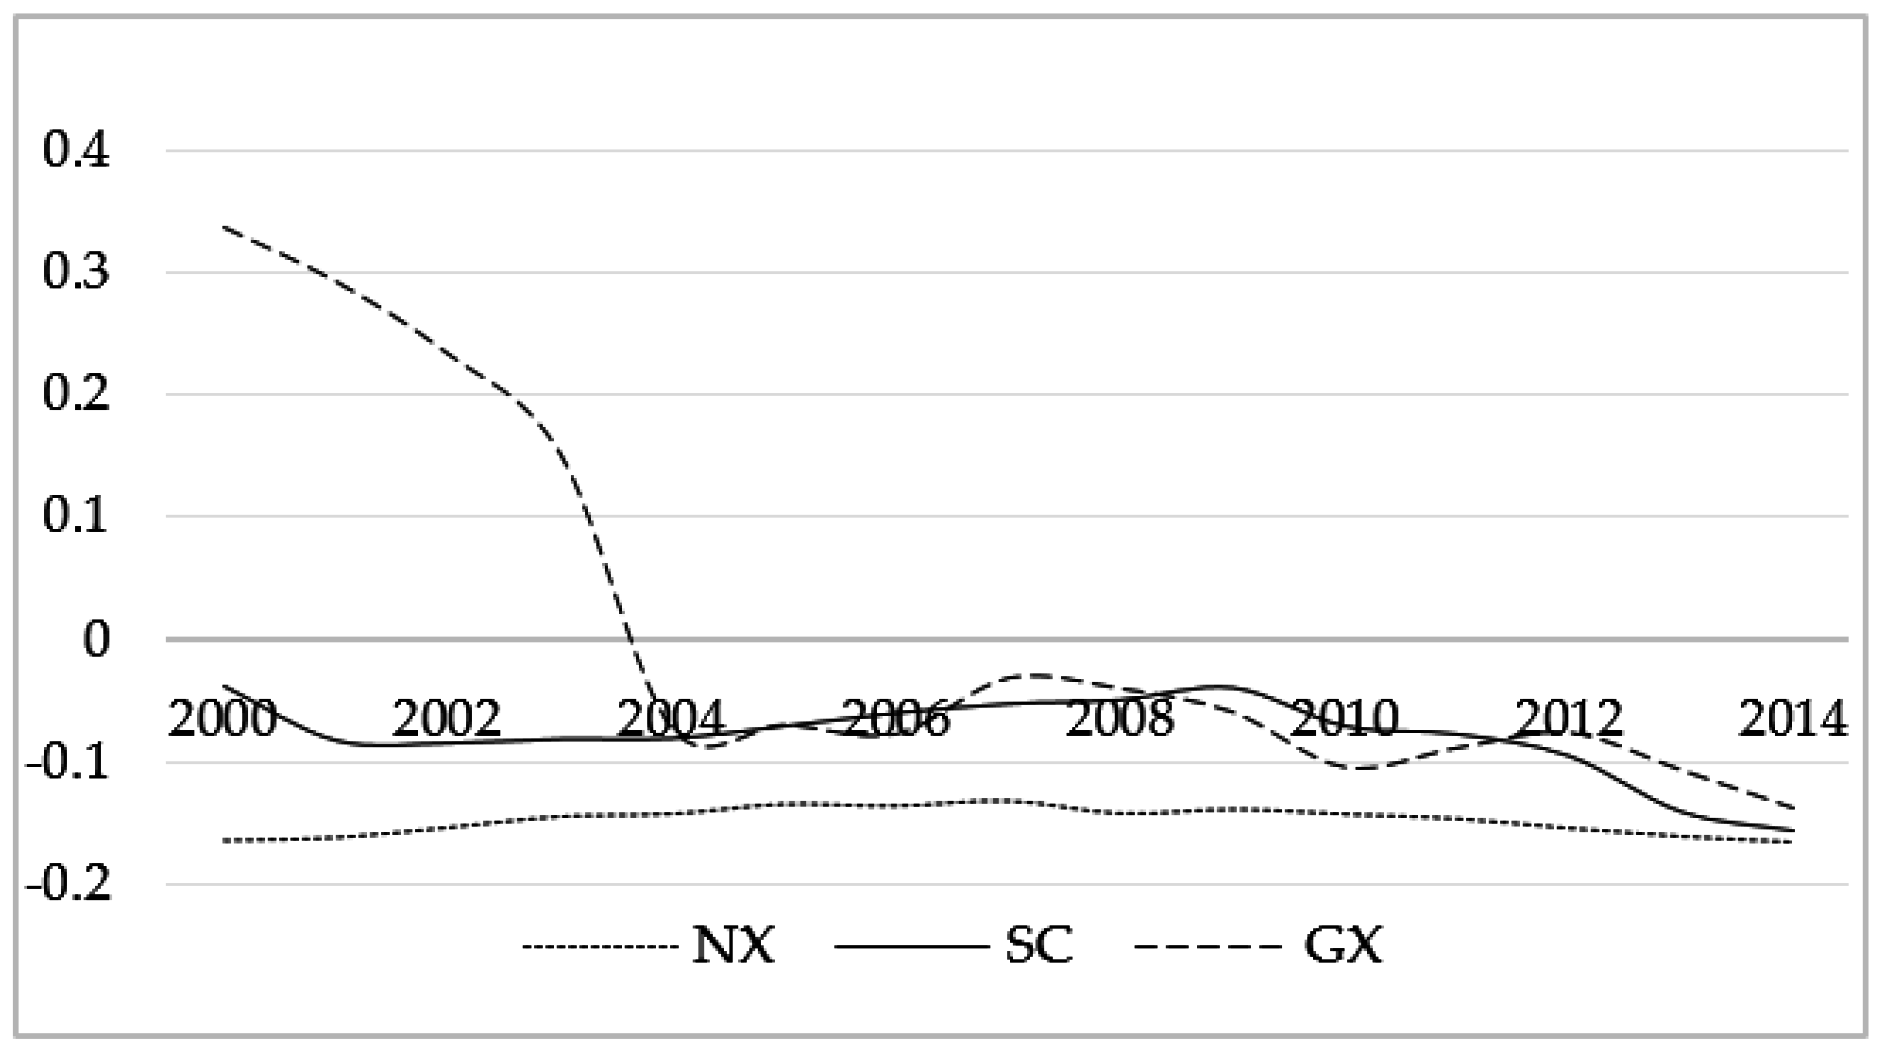
- (3)
- The impact of foreign direct investment/GDP on the ratio of coal supply remained negative, ranging from−0.2 to −0.1. However, its influence on thermal power generation is negligible. In the past few decades, some local governments have been actively introducing FDI to promote economic development, such that local energy businesses can learn about advanced technology and management skills and improve energy efficiency. Meanwhile, they can also optimize their energy supply structure.
Acknowledgments
Author Contributions
Conflicts of Interest
References
- National Bureau of Statistics of China (NBSC). China Statistical Yearbook 2016; China Statistics Press: Beijing, China, 2016.
- National Bureau of Statistics of China (NBSC). China Statistical Yearbook 2015; China Statistics Press: Beijing, China, 2015.
- The People’s Bank of China; National Development and Reform Commission; Ministry of Industry and Information; Ministry of Finance; Ministry of Commerce; China Banking Regulatory Commission; China Securities Regulatory Commission; China Insurance Regulatory Commission. Opinions on Financial Support for Industrial Steady Growth, Restructuring and Increasing Benefits [EB//OL]. Available online: http://www.pbc.gov.cn/goutongjiaoliu/113456/113469/3017867/index.html (accessed on 16 February 2016).
- Levine, R. Finance and Growth: Theory and Evidence; NBER Working Paper, No. 10766; Elsevier: Amsterdam, The Netherlands, 2004. [Google Scholar]
- Goldsmith, R.W. Financial Structure and Development; Yale University Press: New Haven, CT, USA, 1969. [Google Scholar]
- King, R.G.; Levine, R. Finance, entrepreneurship and growth: Theory and evidence. J. Monet. Econ. 1993, 32, 513–542. [Google Scholar] [CrossRef]
- Levine, R.; Zervos, S. Stock markets, banks, and economic growth. Am. Econ. Rev. 1998, 88, 537–558. [Google Scholar]
- Levine, R.; Zervos, S. Capital control liberalization and stock market development. World Dev. 1998, 26, 1169–1183. [Google Scholar] [CrossRef]
- Sadorsky, P. The impact of financial development on energy consumption in emerging economies. Energy Policy 2010, 38, 2528–2535. [Google Scholar] [CrossRef]
- Sadorsky, P. Financial development and energy consumption in Central and Eastern European frontier economies. Energy Policy 2011, 39, 999–1006. [Google Scholar] [CrossRef]
- Islam, F.; Shahbaz, M.; Ahmed, A.U.; Alam, M.M. Financial development and energy consumption nexus in Malaysia: A multivariate time series analysis. Econ. Model. 2013, 30, 435–441. [Google Scholar] [CrossRef]
- Zeren, F.; Koc, M. The nexus between energy consumption and financial development with asymmetric causality test: New evidence from newly industrialized countries. Int. J. Energy Econ. Policy 2014, 4, 83–91. [Google Scholar]
- Furuoka, F. Financial development and energy consumption: Evidence from a heterogeneous panel of Asian countries. Renew. Sustain. Energy Rev. 2015, 52, 430–444. [Google Scholar] [CrossRef]
- Lau, E.; Tan, C.C. Econometric analysis of the causality between energy supply and GDP: The case of Malaysia. Energy Procedia 2014, 61, 203–206. [Google Scholar] [CrossRef]
- Wang, B.Z.; Huang, J.Y. Relationship between energy supply, energy consumption and economic growth: Emprical study based on data on Shanxi province from 1978 to 2008. Technol. Econ. 2010, 2, 74–80. (In Chinese) [Google Scholar]
- Deidda, L.; Fattouh, B. Non-linearity between finance and growth. Econo. Lett. 2002, 74, 339–345. [Google Scholar] [CrossRef]
- Jude, E.C. Financial development and growth: A panel smooth regression approach. J. Econ. Dev. 2010, 35, 15–33. [Google Scholar]
- Doumbia, D. Financial development and economic growth in 43 advanced and developing economies over the period 1975–2009: Evidence of non-linearity. Appl. Econom. Int. Dev. 2016, 16, 13–22. [Google Scholar]
- Chang, S.C. Effects of financial developments and income on energy consumption. Int. Rev. Econ. Financ. 2015, 35, 28–44. [Google Scholar] [CrossRef]
- Lee, C.C.; Chiu, Y.B. Electricity demand elasticities and temperature: Evidence from panel smooth transition regression with instrumental variable approach. Energy Econ. 2011, 33, 896–902. [Google Scholar] [CrossRef]
- Lee, C.C.; Chiu, Y.B. Modeling OECD energy demand: An international panel smooth transition error-correction model. Int. Rev. Econ. Financ. 2013, 25, 372–383. [Google Scholar] [CrossRef]
- Tamazian, A.; Chousa, J.P.; Vadlamannati, K.C. Does higher economic and financial development lead to environmental degradation: Evidence from BRIC countries? Energy Policy 2009, 37, 246–253. [Google Scholar] [CrossRef]
- Zhang, Y.J. The impact of financial development on carbon emissions: An empirical analysis in China. Energy Policy 2011, 39, 2197–2203. [Google Scholar] [CrossRef]
- González, A.; Teräsvirta, T.; Dijk, D. Panel Smooth Transition Regression Models; University of Technology Sydney: Sydney, Australia, 2005. [Google Scholar]
- Aslanidis, N.; Xepapadeas, A. Regime switching and the shape of the emission—Income relationship. Econ. Model. 2008, 25, 731–739. [Google Scholar] [CrossRef]
- National Bureau of Statistics of China. Available online: http://data.stats.gov.cn/easyquery.htm?cn=C01 (accessed on 10 October 2016). (In Chinese)
- The People’s Bank of China. Available online: http://www.pbc.gov.cn/rmyh/105223/105413/index.html (accessed on 10 October 2016). (In Chinese)
- Wind Economic Database. Available online: http://www.wind.com.cn/en/edb.html (accessed on 10 October 2016). (In Chinese)
- Batten, J.A.; Vo, X.V. An analysis of the relationship between foreign direct investment and economic growth. Appl. Econ. 2009, 41, 1621–1641. [Google Scholar] [CrossRef]
- Doytch, N.; Narayan, S. Does FDI influence renewable energy consumption? An analysis of sectoral FDI impact on renewable and non-renewable industrial energy consumption. Energy Econ. 2016, 54, 291–301. [Google Scholar] [CrossRef]
- Yuan, Y.J.; Guo, L.L.; Sun, J. Structure, technology, management and energy efficiency—Stochastic frontier approach based on provincial panel data during 2000–2010. China Ind. Econ. 2012, 7, 18–30. (In Chinese) [Google Scholar]
- Beck, T.; Démirguc-Kunt, A.; Levine, R. Financial Institutions and Markets across Countries and over Time-Data and Analysis; World Bank Group Publication: Washington, DC, USA, 2009. [Google Scholar]
- Sun, P.Y.; Wang, Y.N.; Cen, Y. Does financial development affect energy consumption structure? Exploring the global evidences. Nankai Econ. Stud. 2011, 2, 28–41. (In Chinese) [Google Scholar]
- Shen, M.; Shen, L.; Zhang, Y. The stability of Shaanxi’s energy supply system and its influencing factors. Econ. Geogr. 2015, 35, 39–46. (In Chinese) [Google Scholar]
- Granger, C.W.J.; Terasvirta, T. Modelling Non-Linear Economic Relationships; Oxford University Press: Oxford, UK, 1993. [Google Scholar]
- Teräsvirta, T. Specification, estimation, and evaluation of smooth transition autoregressive models. J. Am. Stat. Assoc. 1994, 89, 208–218. [Google Scholar]
- Van Dijk, D.; Teräsvirta, T.; Franses, P. Smooth transition autoregressive models: A survey of recent developments. Econom. Rev. 2002, 21, 1–47. [Google Scholar] [CrossRef]
- Davies, R.B. Hypothesis testing when a nuisance parameter is present only under the alternative. Biometrika 1977, 64, 247–254. [Google Scholar] [CrossRef]
- Colletaz, G.; Hurlin, C. Threshold Effects of the Public Capital Productivity: An International Panel Smooth Transition Approach; University of Orléans: Orléans, France, 2008. [Google Scholar]
- Fouquau, J.; Hurlin, C.; Rabaud, I. The Feldstein–Horioka puzzle: A panel smooth transition regression approach. Econ. Model. 2008, 25, 284–299. [Google Scholar] [CrossRef]
- Mielnik, O.; Goldemberg, J. Foreign direct investment and decoupling between energy and gross domestic product in developing countries. Energy Policy 2002, 30, 87–89. [Google Scholar] [CrossRef]


| Variables | Statistics | p-Value | Stable or Not |
|---|---|---|---|
| LCSR | −3.2504 | 0.0006 | Stable |
| LTPG | −7.42329 | 0.0000 | Stable |
| LFIR | −2.5808 | 0.0049 | Stable |
| LLAN | −5.9363 | 0.0000 | Stable |
| LFDI | −4.3104 | 0.0000 | Stable |
| LCIR | −3.52612 | 0.0002 | Stable |
| LCSR Specification | ||||||||
| Model 1 | Model 2 | Model 3 | Model 4 | |||||
| Transition Variables | LFIRit-1 | LLANit-1 | LFDIit-1 | LCIRit-1 | ||||
| Number of Location Parameters | m = 1 | m = 2 | m = 1 | m = 2 | m = 1 | m = 2 | m = 1 | m = 2 |
| H0: = 0 vs. H1: = 1 | 25.195 *** (0.000) | 16.771 *** (0.000) | 6.264 *** (0.000) | 4.963 *** (0.000) | 14.575 *** (0.000) | 7.969 *** (0.000) | 5.740 *** (0.000) | 7.934 *** (0.000) |
| H0: = 1 vs. H1: = 2 | 3.207 ** (0.014) | 5.921 *** (0.000) | 5.336 *** (0.000) | 3.701 *** (0.000) | 1.097 (0.359) | 1.404 (0.196) | 3.157 ** (0.015) | 0.310 (0.962) |
| H0: = 2 vs. H1: = 3 | 5.912 *** (0.000) | 3.474 *** (0.001) | 2.561 *** (0.039) | 1.941 ** (0.055) | - | - | 0.697 (0.595) | - |
| H0: = 3 vs. H1: = 4 | 0.385 (0.819) | 0.479 (0.870) | - | - | - | - | - | - |
| LTPG Specification | ||||||||
| Model 1 | Model 2 | Model 3 | Model 4 | |||||
| Transition Variables | LFIRit-1 | LLANit-1 | LFDIit-1 | LCIRit-1 | ||||
| Number of Location Parameters | m = 1 | m = 2 | m = 1 | m = 2 | m = 1 | m = 2 | m = 1 | m = 2 |
| H0: = 0 vs. H1: = 1 | 2.188 * (0.071) | 4.466 *** (0.000) | 2.584 ** (0.038) | 4.544 *** (0.000) | 4.817 *** (0.001) | 3.728 *** (0.000) | 10.395 *** (0.000) | 8.591 *** (0.000) |
| H0: = 1 vs. H1: = 2 | - | 1.404 (0.196) | - | 1.513 (0.154) | 0.670 (0.614) | 0.732 (0.664) | 1.521 (0.197) | 1.311 (0.239) |
| Specification | LCSR | LTPG | ||
|---|---|---|---|---|
| Number of Location Parameter | m = 1 | m = 2 | m = 1 | m = 2 |
| Transition Variables | LFIRit-1 | LFIRit-1 | LCIRit-1 | LCIRit-1 |
| () | 3 | 3 | 1 | 1 |
| AIC | −4.275 | −4.264 | −4.672 | −4.666 |
| BIC | −3.969 | −3.917 | −4.533 | −4.513 |
| Transition Variables | LFIRit-1 (3, 1) | |||
|---|---|---|---|---|
| Liner Part | Nonlinear Part | |||
| Regimes | Regime 1 | Regime 2 | Regime 3 | Regime 4 |
| LFIR () | −0.135 * (−1.803) | −0.266 *** (−3.056) | 0.151 ** (2.221) | 0.445 *** (2.836) |
| LLAN () | −1.644 *** (−6.170) | −0.136 (−0.545) | −1.154 *** (−3.702) | 2.297 *** (4.542) |
| LFDI () | 0.425 *** (4.096) | 0.268 *** (3.914) | −0.008 (−0.133) | −0.863 *** (−4.595) |
| LCIR () | −0.266 *** (−4.854) | 0.112 ** (2.286) | −0.009 (−0.317) | 0.254 ** (2.539) |
| Location parameter | −3.677; −3.014; −3.989 | |||
| Slope parameter | 13.027; 9.97; 2.90 | |||
| Transition Variables | LCIRit-1 (1,1) | |
|---|---|---|
| Liner Part | Nonlinear Part | |
| Regimes | Regime 1 | Regime 2 |
| LFIR () | −0.344 *** (−2.797) | 0.293 ** (2.351) |
| LLAN () | 1.833 *** (4.466) | −1.964 *** (−4.650) |
| LFDI () | 0.122 ** (1.976) | −0.142 ** (−2.330) |
| LCIR () | 0.073 (1.118) | −0.085 (−1.240) |
| Location parameter | −4.724 | |
| Slop parameter | 1.840 | |
| Time-Varying Elasticity between LTPG and Financial Development Indexes | Results Explanation |
|---|---|
 | The influence of LFIR on LTPG in all provinces was negative all the time. Guangxi: In 2001–2004, the elastic coefficient was in the low regime (−0.25, −0.21), and then shifted to the high regime (−0.153, −0.062). Hubei: In 2000–2004, it was in the low regime (−0.35, −0.23), and then shifted to the high regime (−0.18,−0.055). Jiangsu: In 2014 it was in the low regime (–0.245); in other years it was in the high regime (−0.162, −0.058). Qinghai: In 2000–2002 and 2004, it was in the low regime (−0.344, −0.172). In other years, it was in the high regime, and the elastic coefficients were stabilized between −0.086 and −0.055. |
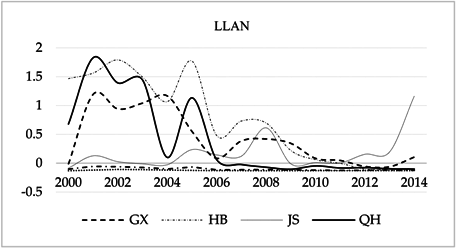 | Guangxi: Except for 2000, 2012, and 2013, the elastic coefficients were positive; in the other years they were negative. The absolute values of the elastic coefficients had a decreasing tendency before and after the turning point between the low and high regime. Hubei: The variation tendency of elastic coefficients was similar to Guangxi. In 2012–2014, the influence effect changed to be negative, and was stabilized around −0.1. Jiangsu: The elastic coefficient in 2014 was in the low regime (1.167); in other years it fluctuated around 0.1. Qinghai: The elastic coefficients in 2000–2005 were positive (0.1~1.44), but in 2006–2014 changed to be negative (−0.1~−0.023). |
 | Guangxi: Generally, the absolute values of elastic coefficients showed a declining tendency, and they changed to be negative after 2010, between −0.015 and −0.003. Heilongjiang: The elastic coefficients in 2000–2009 were positive, between 0.04 and 0.12, but changed to be negative after 2010, between −0.019 and −0.007. Qinghai: In the low regime (2000–2002, 2004), the elastic coefficients were positive, between 0.038 and 0.12. The elastic coefficients in the high regime were negative, fluctuating slightly between −0.019 and −0.004. |
© 2016 by the authors; licensee MDPI, Basel, Switzerland. This article is an open access article distributed under the terms and conditions of the Creative Commons Attribution (CC-BY) license (http://creativecommons.org/licenses/by/4.0/).
Share and Cite
Chai, J.; Xing, L.; Lu, Q.; Liang, T.; Lai, K.K.; Wang, S. The Non-Linear Effect of Chinese Financial Developments on Energy Supply Structures. Sustainability 2016, 8, 1021. https://doi.org/10.3390/su8101021
Chai J, Xing L, Lu Q, Liang T, Lai KK, Wang S. The Non-Linear Effect of Chinese Financial Developments on Energy Supply Structures. Sustainability. 2016; 8(10):1021. https://doi.org/10.3390/su8101021
Chicago/Turabian StyleChai, Jian, Limin Xing, Quanying Lu, Ting Liang, Kin Keung Lai, and Shouyang Wang. 2016. "The Non-Linear Effect of Chinese Financial Developments on Energy Supply Structures" Sustainability 8, no. 10: 1021. https://doi.org/10.3390/su8101021
APA StyleChai, J., Xing, L., Lu, Q., Liang, T., Lai, K. K., & Wang, S. (2016). The Non-Linear Effect of Chinese Financial Developments on Energy Supply Structures. Sustainability, 8(10), 1021. https://doi.org/10.3390/su8101021