Article

Water Table Control for Increasing Yield and Saving Water in Cranberry Production

Department of Soil and Agri-Food Engineering, Université Laval, 2425 rue de l'Agriculture, Québec, QC G1V 0A6, Canada
*
Author to whom correspondence should be addressed.
Sustainability 2015, 7(8), 10602-10619; https://doi.org/10.3390/su70810602
Submission received: 20 June 2015 / Revised: 22 July 2015 / Accepted: 29 July 2015 / Published: 7 August 2015
(This article belongs to the Special Issue Sustainable Irrigation and Drainage)

Abstract

:
Water table control has been successfully tested to improve the sustainability of water management in cranberry production. In the province of Québec (Canada), three sites were investigated to determine the optimum water table depth below soil surface (WTD) using three criteria: (1) increasing yield without decreasing fruit quality; (2) minimizing the amount of water needed by the sprinkler system; and (3) avoiding hypoxic stresses in the rhizosphere. Our results show that the final yield, the berry sugar content, the total number of berries, the number of berries per upright, and the fruit set were maximized when the WTD was 60 cm. Sprinkler water savings of 77% were obtained where the WTD was shallower than 66 cm. In order to avoid hypoxic conditions due to poor drainage, the water level in the canals surrounding the beds should be lowered to 80 cm when a rainfall or a frost protection irrigation is anticipated. All sides of a block of beds must be surrounded by canals to ensure a uniform WTD and to avoid lateral hydraulic gradients that could cause peripheral seepage losses.

1. Introduction

More than 98% of cranberries (Vaccinium macrocarpon Aiton) are produced in North America [1]. The beginnings of cranberry cultivation go back to the early years of the 19th century in the state of Massachusetts, USA [2]. Massachusetts was the world leader in cranberry production until the 1990s, when the state of Wisconsin, USA, became the largest cranberry producing area. In 2014, the province of Québec, Canada, was the second most important cranberry producer with 110,000 tons for a cultivated area of 3450 ha. The Québec average yield (2005–2014) has increased by 66% from the previous decade (1995–2004) [3]. A part of this increase could be due to a better understanding of hydrological processes and application of related recommendation to water management in cranberry beds.
Health benefits related to antioxidant components, such as anthocyanin, have led to an increase in the demand for cranberry over the last few years. Despite its high sugar content, the high concentration in titratable acidity causes the bitter taste of cranberry. The most important yield components related to final yield are the number of marketable berries per area, the number of fruiting uprights per area, the number of marketable berries per upright, and the fruit set [4]. Flower buds are formed during the summer of the previous year while berries formed in early July grow until harvest in October.
Recent developments in wireless communication technology have allowed online soil moisture and air temperature monitoring and real-time irrigation management. For maximizing yield, yield components, and water productivity, there is evidence that the pump should be turned on when soil water tension (SWT) at 10 cm depth in the root zone reaches 7.5 kPa [4,5,6]. Cranberry evapotranspiration ranges between 0.5–4.0 mm day−1 in Washington [7] whereas the maximum value was found to be 5.0 mm day−1 in Wisconsin [8].
Recent work demonstrates that cranberry is a species sensitive to hypoxic conditions in the rhizosphere. When the SWT is lower than 3.0 kPa, gas exchange and plant productivity are reduced [6,9]. For evacuating the excess of water in the soil profile after rainfall, subsurface drainage systems are used. Plastic pipes, 10 cm in diameter, are buried with outlets in canals surrounding the beds. This drainage system allows the WTD to be controlled by adjusting the water level between the reservoir and the drain tubes. Actual drainage systems in cranberry farms have the potential to be used as water table control system, meeting the crop water requirements during the season. It is in fact a combination of drainage and subirrigation [10]. Controlling the WTD could considerably reduce the energy and water needed by sprinkler irrigation in cranberry production [11]. When upward water fluxes from the water table are sufficient to support plant transpiration and soil evaporation, the use of sprinkler irrigation is reduced. However, attention should be given in order to avoid waterlogging caused by a too shallow water table and to ensuring fast drainage, even more so with global warming and the potential for increased rainfall intensities [12]. Another risk of maintaining shallow water tables is to increase soil salinity; however, experiments have shown that even applying three times the recommended potassium fertilizer amount does not cause plant stress due to salinity [13].
Water table control has been tested for different crops and regions around the world and identified as the best water management practice for reducing the environmental impact and maintaining or enhancing crop yield [14,15]. Determining the optimal WTD is then of first importance for using water table control. For early rooting and vegetative growth, growth rate was greatest and rooting depth shallowest with rooted cuttings grown in a greenhouse under WTD at 13 cm compared to 39 and 57 cm [16], and similar results were obtained with WTD at 6 cm in comparison with 35 cm [17]. For established beds, based on the soil moisture-WTD relationships, crop water requirements could be supplied through capillary rise with a WTD at 30–50 cm [18], or 40–60 cm [6], and a very high risk of water stress for the crop could result from a WTD at 80 cm [6]. Maintaining a WTD at an average of 60 cm led the photosynthesis rate and the number of buds produced to be maximized compared to treatments with WTD ranging from 8–35 cm, explained by a lack of oxygen in the root zone in the shallowest WTD treatments [8]. With no sprinkler irrigation in addition to capillary rise, higher fruit yields resulted from a 30–38 cm WTD in three out of five years when compared to 38–46 cm and in four out of five years when compared to 46–54 cm [19]. Consequently, it appears that maintaining an optimal WTD combined with sprinklers would maximize established bed cranberry yields, minimize the use of sprinkler irrigation, and meet the drainage requirements.
The objective of this work was to determine the optimal WTD using three criteria: (1) maximizing yield without affecting the fruit quality; (2) minimizing the use of sprinkler irrigation by avoiding SWT above 7.5 kPa; and (3) ensuring fast drawdown of the water table to 40 cm deep (SWT = 3.0 kPa in the root zone) after rainfall and frost irrigation events. Soil water characteristics were initially used to approximate the optimal WTD which was then verified during a two-year field experiment.

2. Experimental Section
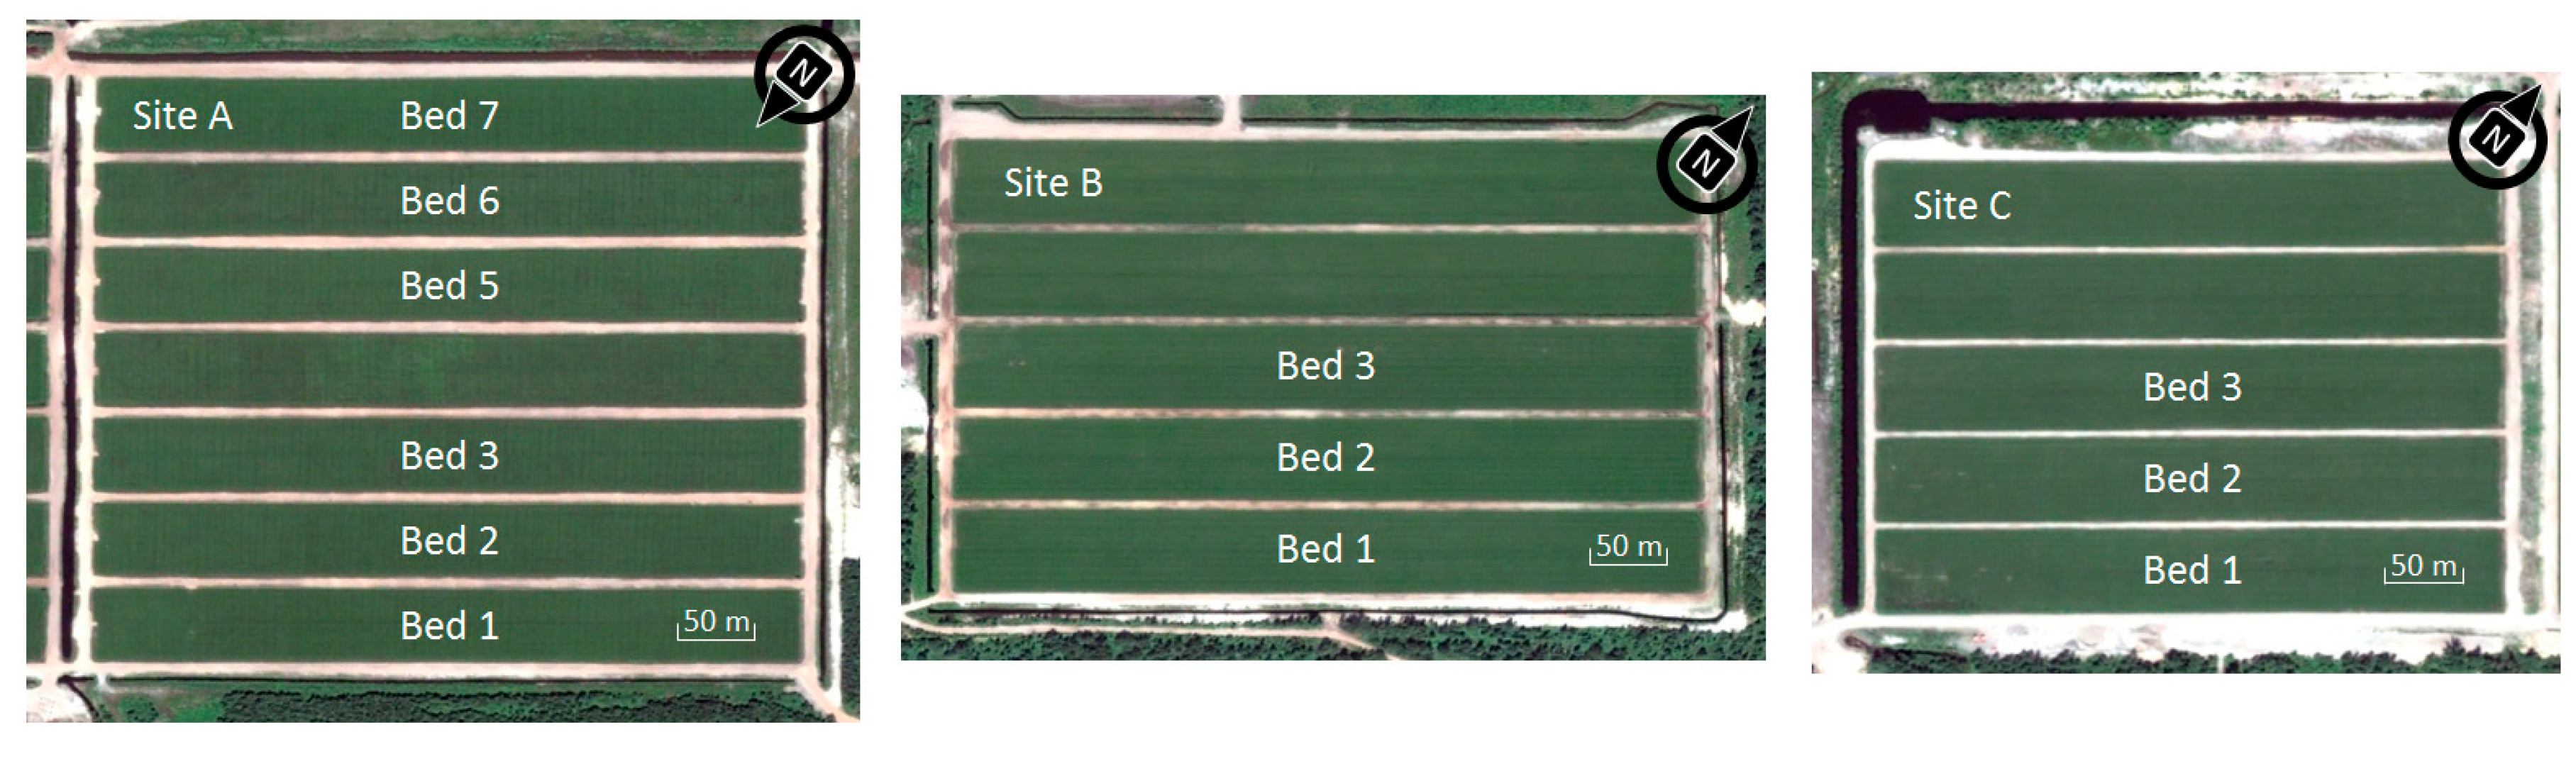
Experiments were conducted in 2013–2014 on both conventional and organic cranberry production farms in Québec. One section of beds was used at the conventional farm as Site A and two separated sections of beds were used as Site B and C at the organic farm. Detailed characteristics of each site are given in Table 1 and in Figure 1. All beds were isolated from one another by a 5-m wide dike. The four sides of Site A were surrounded by canals. Bed 4 was not used because it was not the same cultivar. For site B, only three sides were surrounded by canals, and the fourth side consisted in a cranberry bed one meter lower than the experimental beds. One side of Site C consisted in a cranberry bed on the same level than the experimental beds whereas the three other sides are surrounded by canals, but the one canal on the southeast side is only 60-m long. The experimental beds were all on the same level at each site.
Figure 1. The experimental sites.
Sustainability 07 10602 g001
Monthly climatic data, from a public weather station located 8 km away from Site A and 5 km away from sites B and C are given in Table 2. Air temperature and growing degree days (GDD) for both years of the experiment were similar to long term averages. The April to September average air temperature was 14.2 °C in 2013, 14.4 °C in 2014, and 13.9 °C for the 1981–2010 period while the total GDD was 1757 in 2013, 1768 in 2014, and 1715 for the 1981–2010 period. The total rainfall during the growing season of 2013 (666 mm) was similar to that of the long term (660 mm), but was 15% less in 2014 (563 mm). July was drier than the average for both years with approximately 34% less rainfall than the normal for that month.
Table 1. Characteristics of the experimental sites.
CharacteristicSite ASite BSite C
General information
Location46°16′ N–71°57′ W46°17′ N–71°59′ W46°16′ N–72°01′ W
ProductionConventionalOrganicOrganic
Bed properties
Number of beds633
Dimensions of one bed (m × m)457 × 46479 × 52404 × 52
Subsurface Drainage
Spacing (m)11.415.215.2
Depth (m)0.80.80.8
Slope (%)0.070.130.15
Sprinklers system
Sprinkler spacing (m)181515
Irrigation line spacing (m)151818
Table 2. Monthly climatic data at the experimental site in St-Louis-de-Blandford, Québec, Canada and long term averages from a public weather station located 8 km away from Site A and 5 km away from sites B and C.
AprilMayJuneJulyAugustSeptember
Air Temperature (°C)
20134.513.515.420.518.013.4
20143.912.318.219.818.413.7
Ave 1981–20104.311.416.719.318.113.6
GDD z
201352255312472408258
201430229376460409264
Ave 1981–201048203353443407261
Rainfall (mm)
20133815312687144118
2014123591068613356
Ave 1981–201066106127130119112
Note: z: Growing Degree Days (5 °C based).
Soil texture at the three sites is representative of the cranberry soils with 100% sand. Weight fractions were 5%: very fine sand, 54%: fine sand, 36%: medium sand, and 5%: coarse sand. The soil water retention and the hydraulic conductivity curves of the soil in the rhizosphere are shown in Figure 2. Saturated hydraulic conductivity is about 150 mm h−1 and saturated and residual volumetric water content are 0.34 and 0.05, respectively (mean values of all three sites). When SWT is below 2.0 kPa (WTD < 30 cm), soil is mostly saturated and this situation could result in hypoxic conditions in the rhizosphere. The hysteresis effect is an important consideration in these soils. When SWT is above 8 kPa (WTD > 90 cm), upward fluxes are negligible which would increase the need for sprinkler irrigation. Hence, from these soil water characteristics, it appears that the optimal WTD should be in the range of 30–90 cm for both sufficient upward flux and adequate drainage, and consequently WTD treatments were chosen to cover that range.
Figure 2. (a) Volumetric soil water content and (b) hydraulic conductivity in relation with soil water tension. The curves represent the average of all three sites.
Sustainability 07 10602 g002
At Site A, the weir at the outlet of the surrounding canals was adjusted 70 cm deeper than the beds’ soil surface during the growing season. Since this block of beds is located at the bottom part of the farm, drainage water continuously flowed from the upstream beds, ensuring the water level to be constant with the weir setting. In order to maintain shallower WTDs, 5 cm inside diameter plastic pipes were installed between the reservoir and the drainage inlet to maintain the WTD at 50 cm in Bed 2, 3, and 6. A float valve was installed on each drain tube inlet to stop water flowing when the equilibrium was reached. Therefore, at Site A, the targeted WTD was 70 cm in beds 1, 5, and 7, and 50 cm for beds 2, 3, and 6. The only form of energy used for adding water to drain tubes was gravity. At Site B, the weir at the outlet of the surrounding canals was adjusted to a depth of 60 cm from the soil surface of the beds. Since these beds are located at the upper position in the farm, water was pumped into the canals when the water level in the canals was 70 cm deeper than the beds soil surface. At Site C, the weir at the outlet of the surrounding canals was adjusted to a depth of 50 cm from the soil surface of the beds and only gravity was used to move water from the reservoirs to the drain tubes.
For investigating the uniformity of the WTD, a total of 133 observation wells have been installed in 2013 and 242 in 2014. Readings were taken once a week with a dipper-T water level indicator from Heron Instruments Inc. (Dundas, Ontario, Canada) and recorded manually. The wells were made from PVC pipes (10 cm outside diameter) cut in 150 cm sections. Holes and diagonal saw cuts were made in each pipe to let the water enter. The bottom of the pipe was sealed with a PVC cap and adhesive. Boreholes were mechanically augured and wells closely fitted inside each borehole. The upper pipe opening was protected with a PVC cap with no adhesive. Wells were distributed to uniformly cover the beds. The WTD data were mapped with the Thin Plates Splines (TPS) method which had been found to be the best spatial interpolator for soil and yield parameters in cranberry fields [11].
At the three sites, sprinkler irrigation was used to complement water table control when the upward fluxes from the water table were not sufficient to meet evapotranspiration. At Site A, Beds 2, 3, and 6 were managed separately from Beds 1, 5, and 7. Only one irrigation zone was set in 2013 at Site B, but due to drier conditions in Bed 3, it was managed separately from Beds 1 and 2 in 2014. Each bed was equipped with two wireless HXM-80 tensiometers from Hortau (Lévis, QC, Canada), installed at a depth of 10 cm below the soil surface. Readings were taken at 15 min intervals and sent, via a wireless communication system, to the Irrolis website (www.hortau.com, Lévis, Canada) for processing. Irrigation was initiated when the average SWT value in a given irrigation zone reached the threshold value of 7.5 kPa, unless at that time the rainfall probability exceeded 80%. In that case, irrigation was postponed until the rainfall probability dropped below 80%. Standard farming practices (fertilization, pesticide application, pollination, etc.) have been done according to the growers calendars.
Crop yield was evaluated by harvesting berries from four 1075 cm2 rings around each observation well. The distance between any two rings was at least 3 m. Yield values were also interpolated and mapped with the TPS method [11]. Mean berry weight was calculated as the weight of 100 marketable berries taken randomly within each ring. The number of berries per ring was calculated as the total weight of the berries divided by the mean berry weight. Berries were counted and weighed on-site. In three 182 cm2 rings per bed, the number of fruiting uprights, the number of marketable and non-marketable berries, and aborted flowers per upright were counted. Fruit set was then computed as the number of berries divided by the sum of berries and aborted flowers. Parameters of fruit quality were evaluated on two samples per bed. In order to use the same berries, each berry was cut in three equal parts for testing total soluble solids (TSS), total anthocyanin (TAcy), and titratable acidity (TA). Berries were crushed to obtain a juice sample for measuring TSS (as Brix) with a HI-96811 temperature-compensating refractometer from Hanna Instruments (Woonsocket, Rhode Island, USA). The TAcy (mg/100 g FW of berries) was determined by the accelerated solvent extraction method [20] using a Genesys 6 spectrophotometer from Thermo Fisher Scientific Inc (Rochester, NY, USA) while TA was measured from titration of NaOH 0.1 N to a pH 8.20 end point and expressed as g/L of tartaric acid. As an evaluation of the taste perception, the ratio of TSS on TA was computed. In addition to linear regressions, the boundary line approach was used to establish the optimum WTD as this method has been suggested for data where the field environmental conditions cannot be controlled, but may have a strong influence on variability [21].

3. Results and Discussion

3.1. First Criterion: Increasing Yield without Decreasing Fruit Quality

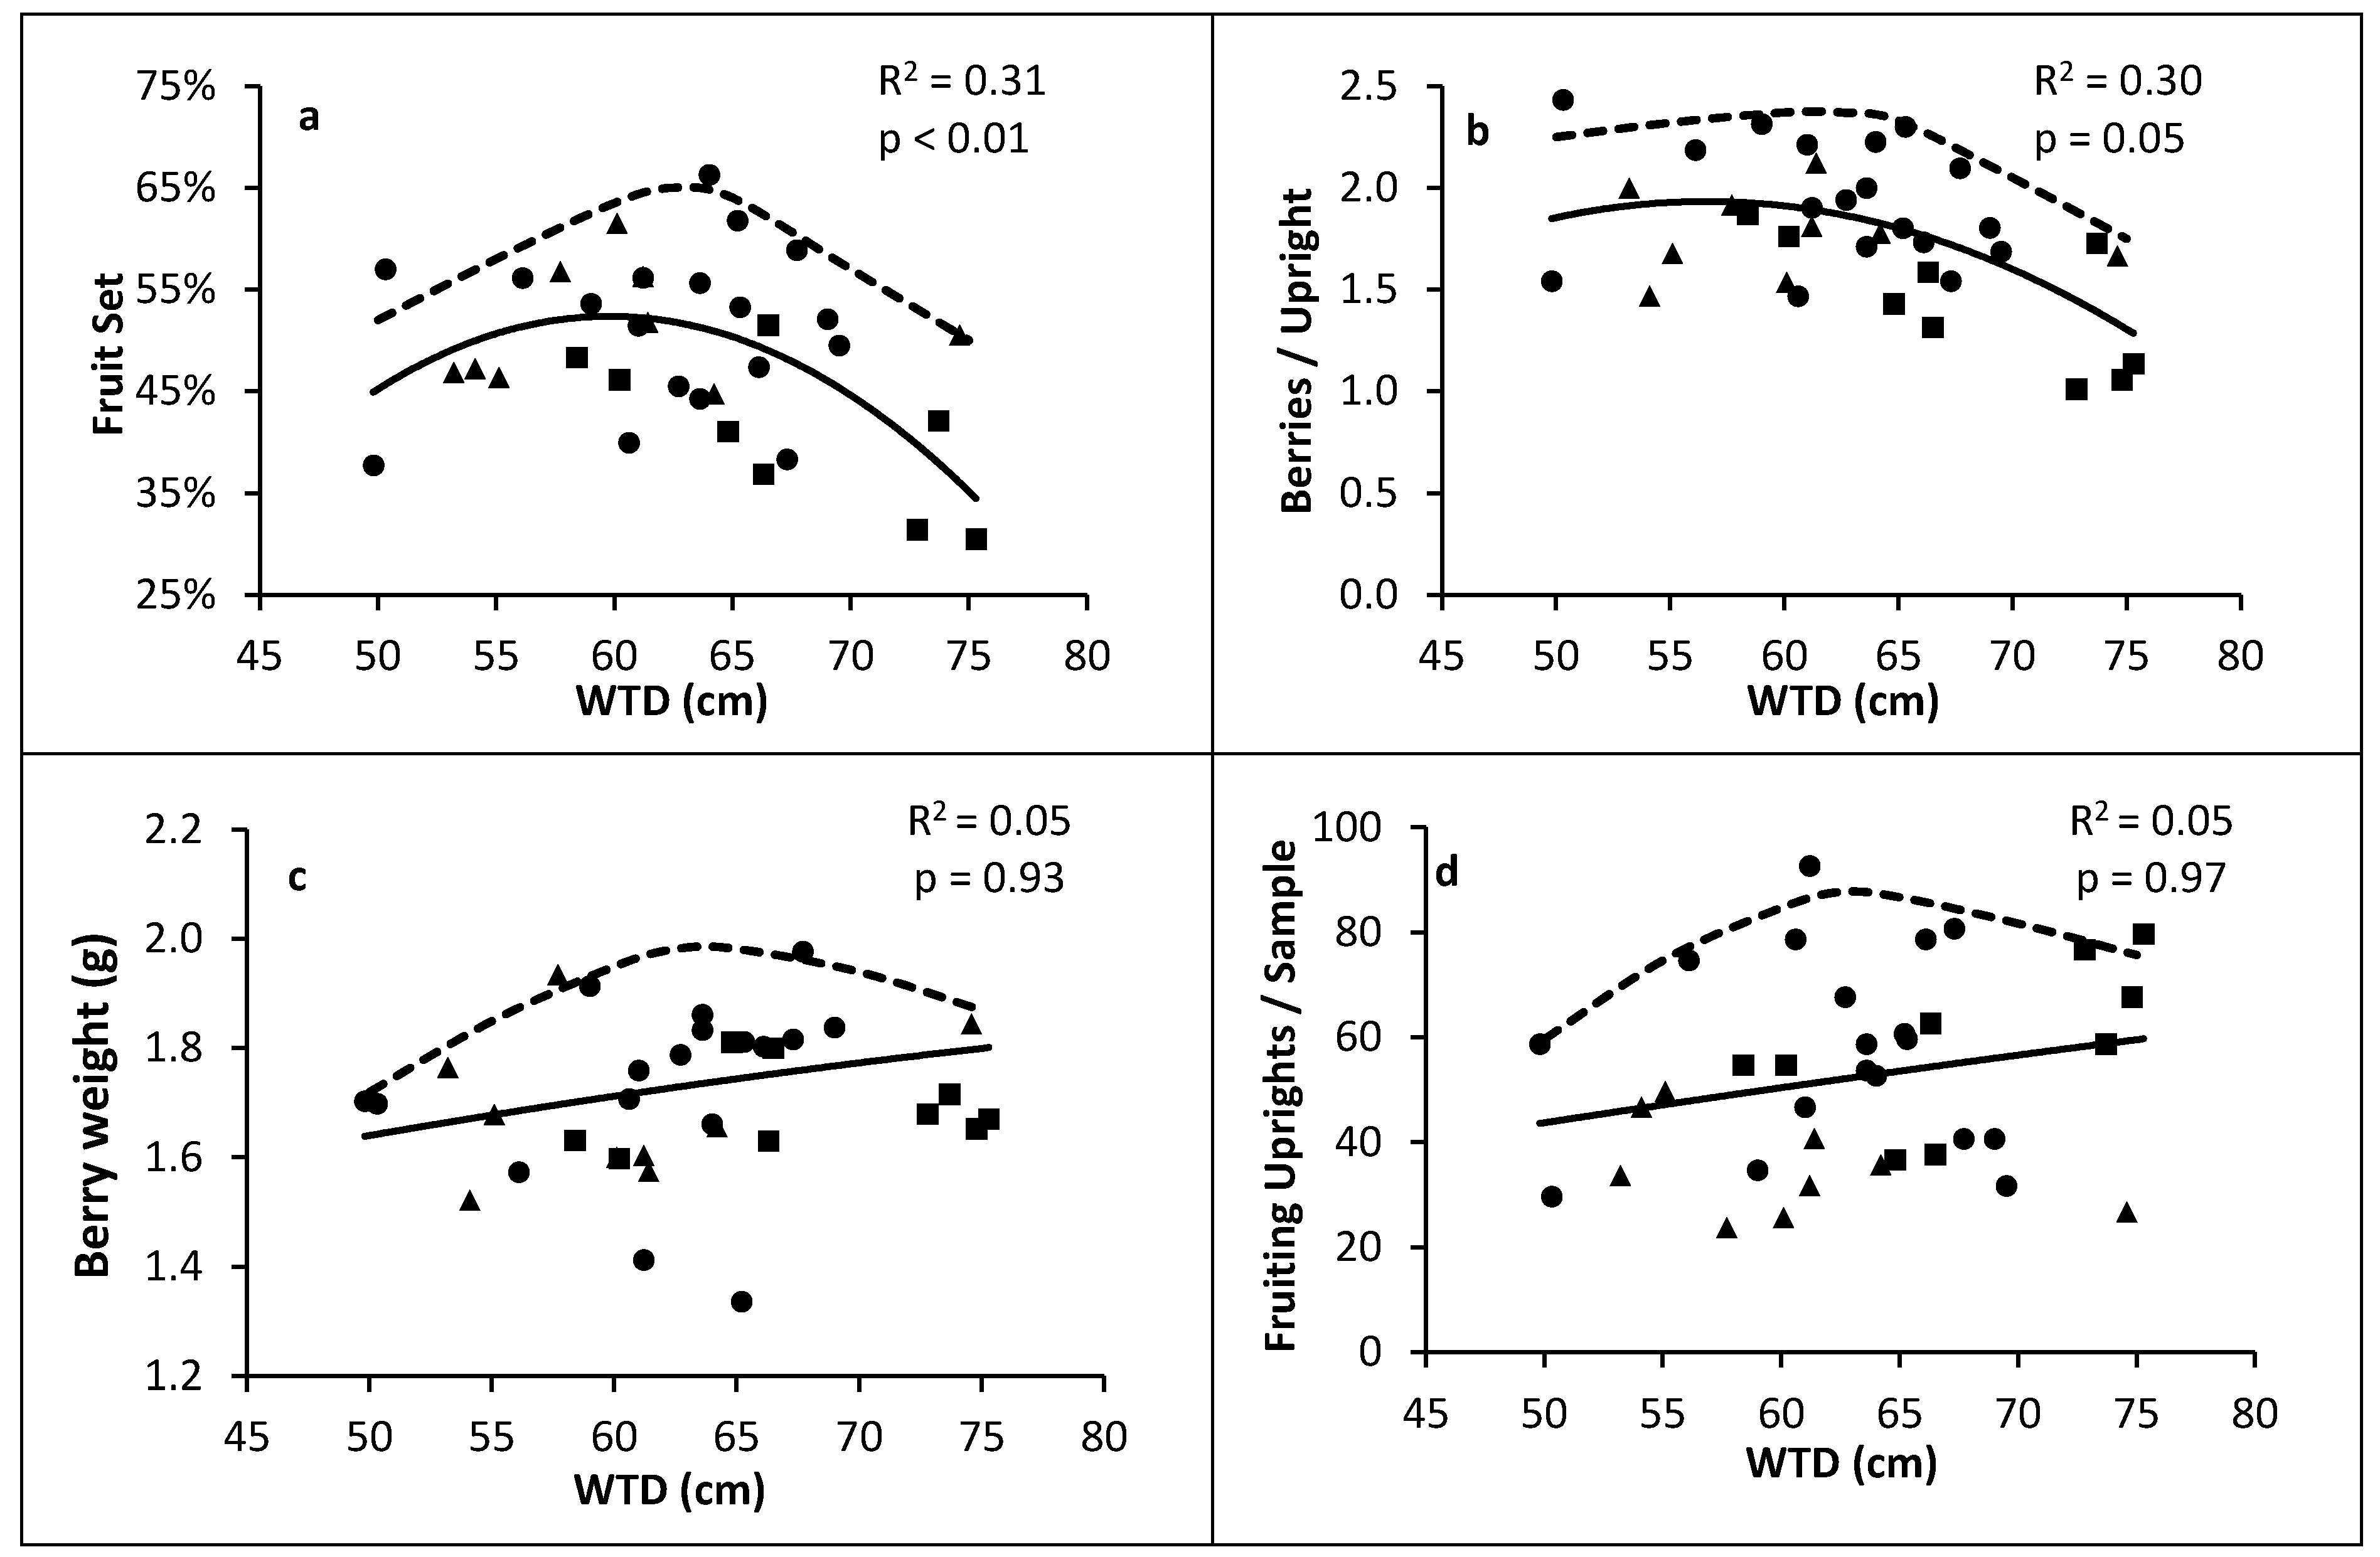
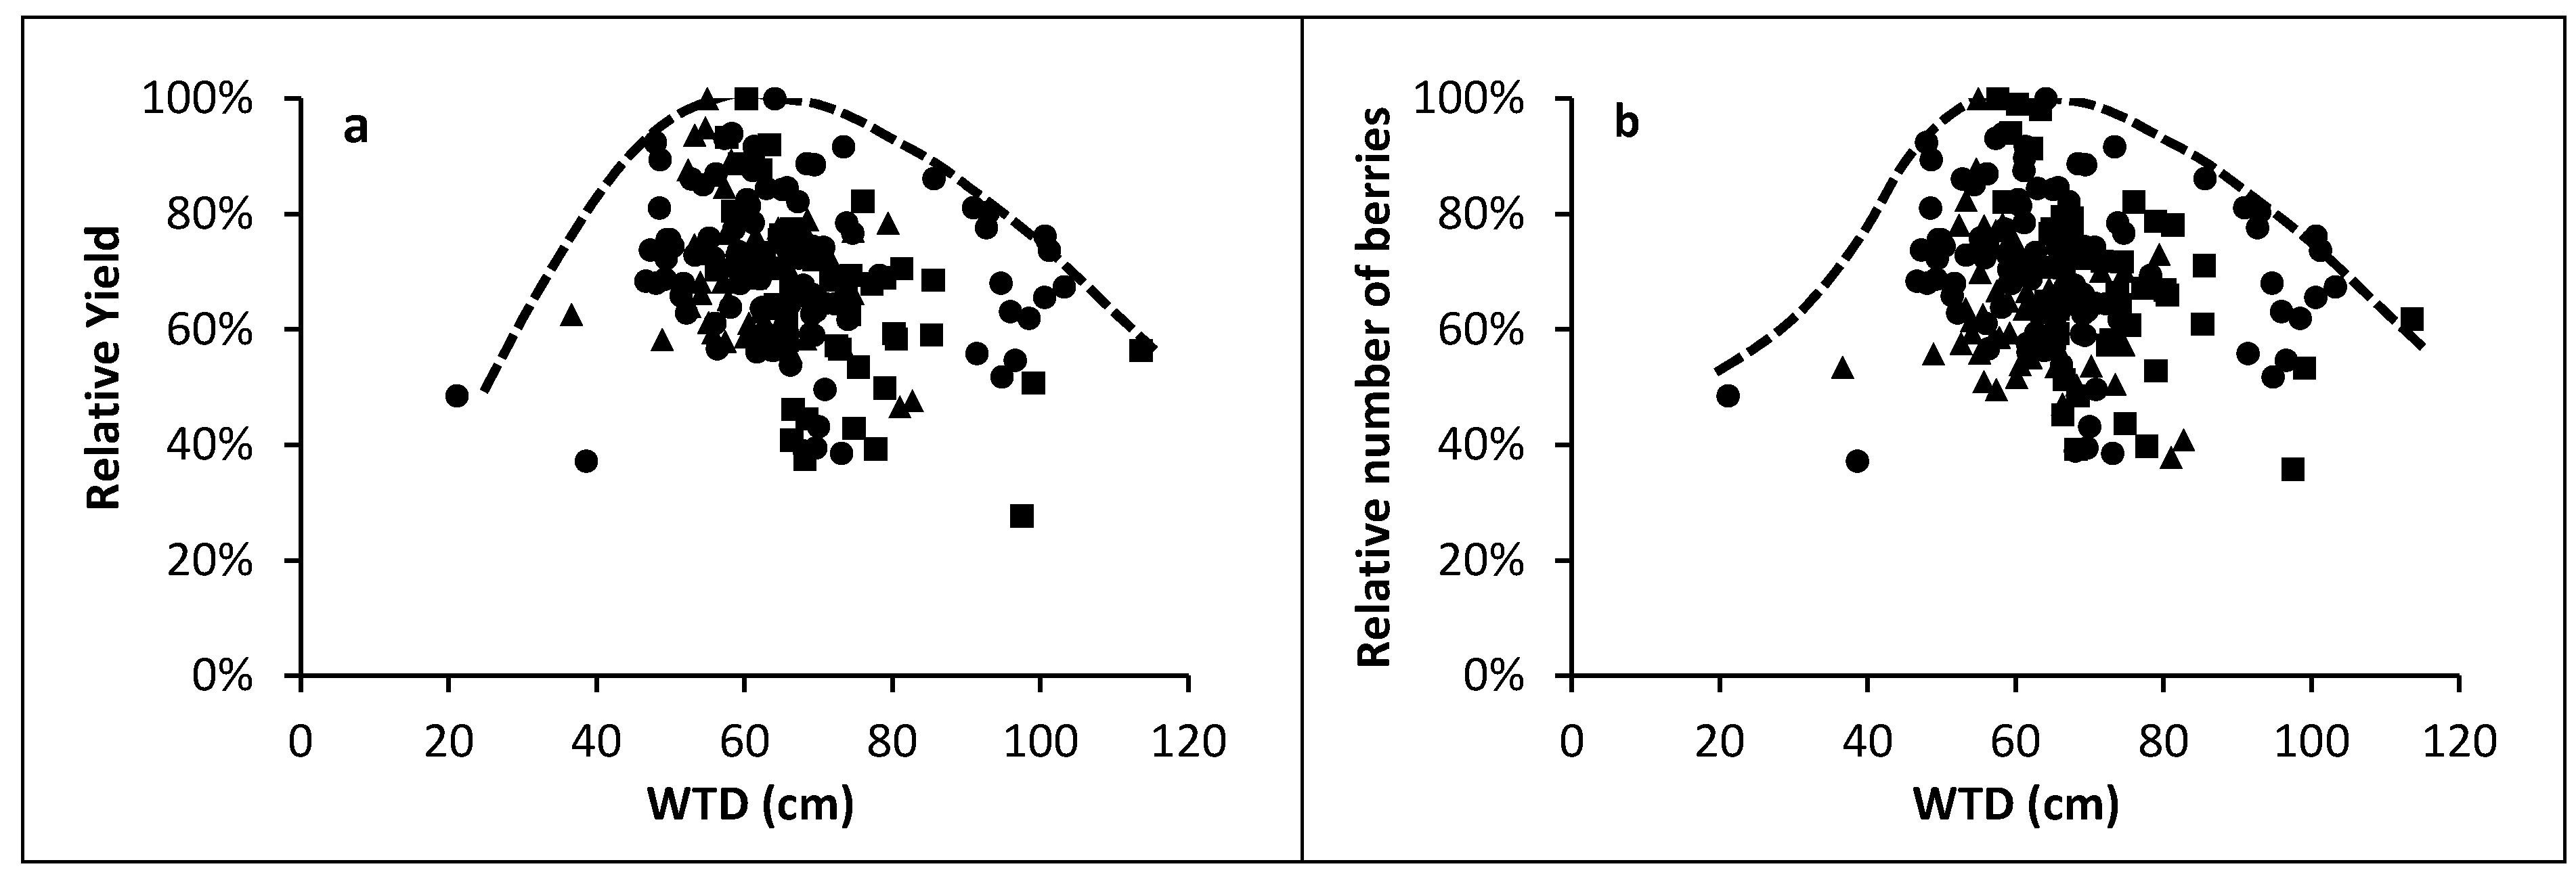
3.1.1. Relationship between Yield and WTD

The maximum yield and the highest number of berries were observed when WTD was approximately 60 cm (Figure 3). Hypoxic stress could be more damaging than water stress since for each WTD step of 10 cm, the yield increased by 15% between 25 and 60 cm and decreased by 8% between 60 and 120 cm. Those results are consistent with recent studies under controlled conditions where plant activity was maximized when WTD was approximately 60 cm, but reduced in the range of 30–50 cm due to soil aeration limitation [6,9]. However, our findings differ from older studies where the authors concluded that WTD should be maintained between 30–50 cm based on soil water characteristics only [18] or between 30–38 cm when yield were considered, but without the use of sprinkler irrigation [19]. Improving water management by using sprinkler irrigation, with a threshold of 7.5 kPa, in addition to WTD control could explain the deeper optimal water table found in our study compared to previous studies. Moreover, deeper WTD promotes faster drainage and will be discussed in Section 3.3.
Figure 3. Boundary line approach [21] of (a) yield and (b) number of berries in relation with the averaged water table depth (WTD) during the growing season of 2014 at Site A(•), Site B (▪), and Site C (▲). Each value represents the average yield of four 1075 cm2 rings harvested around each observation well relatively to the maximum yield at each site.
Sustainability 07 10602 g003

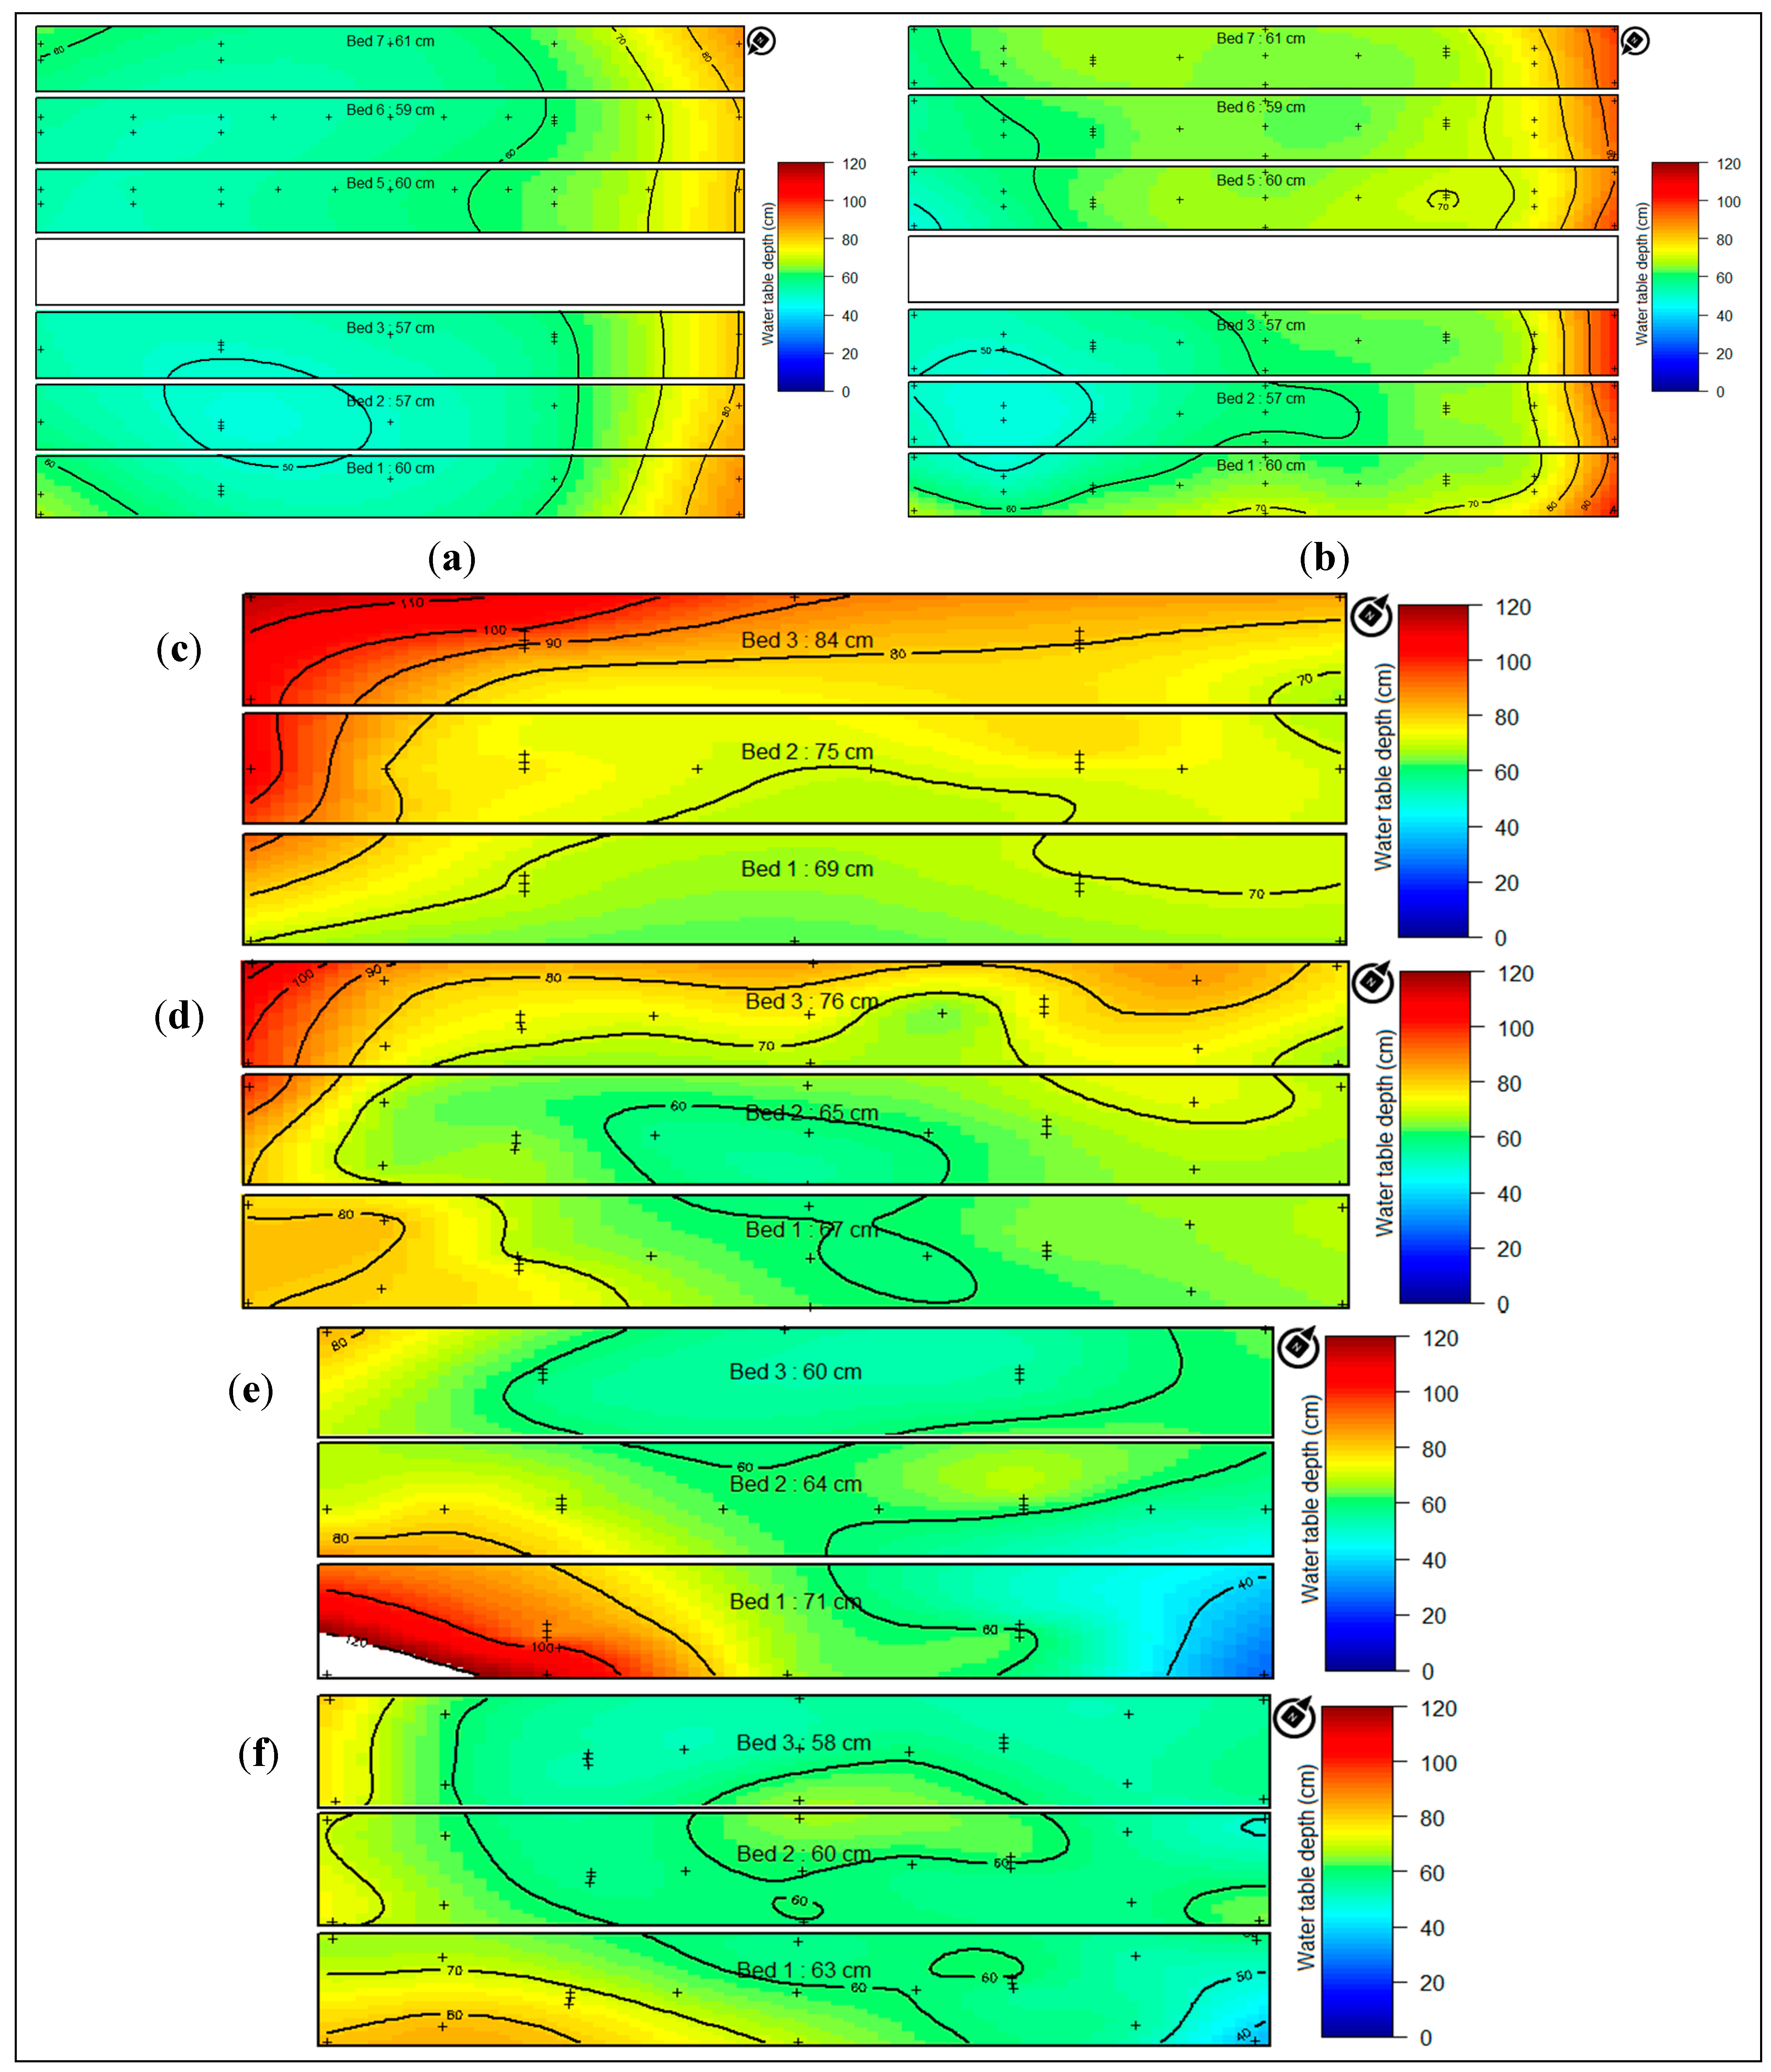
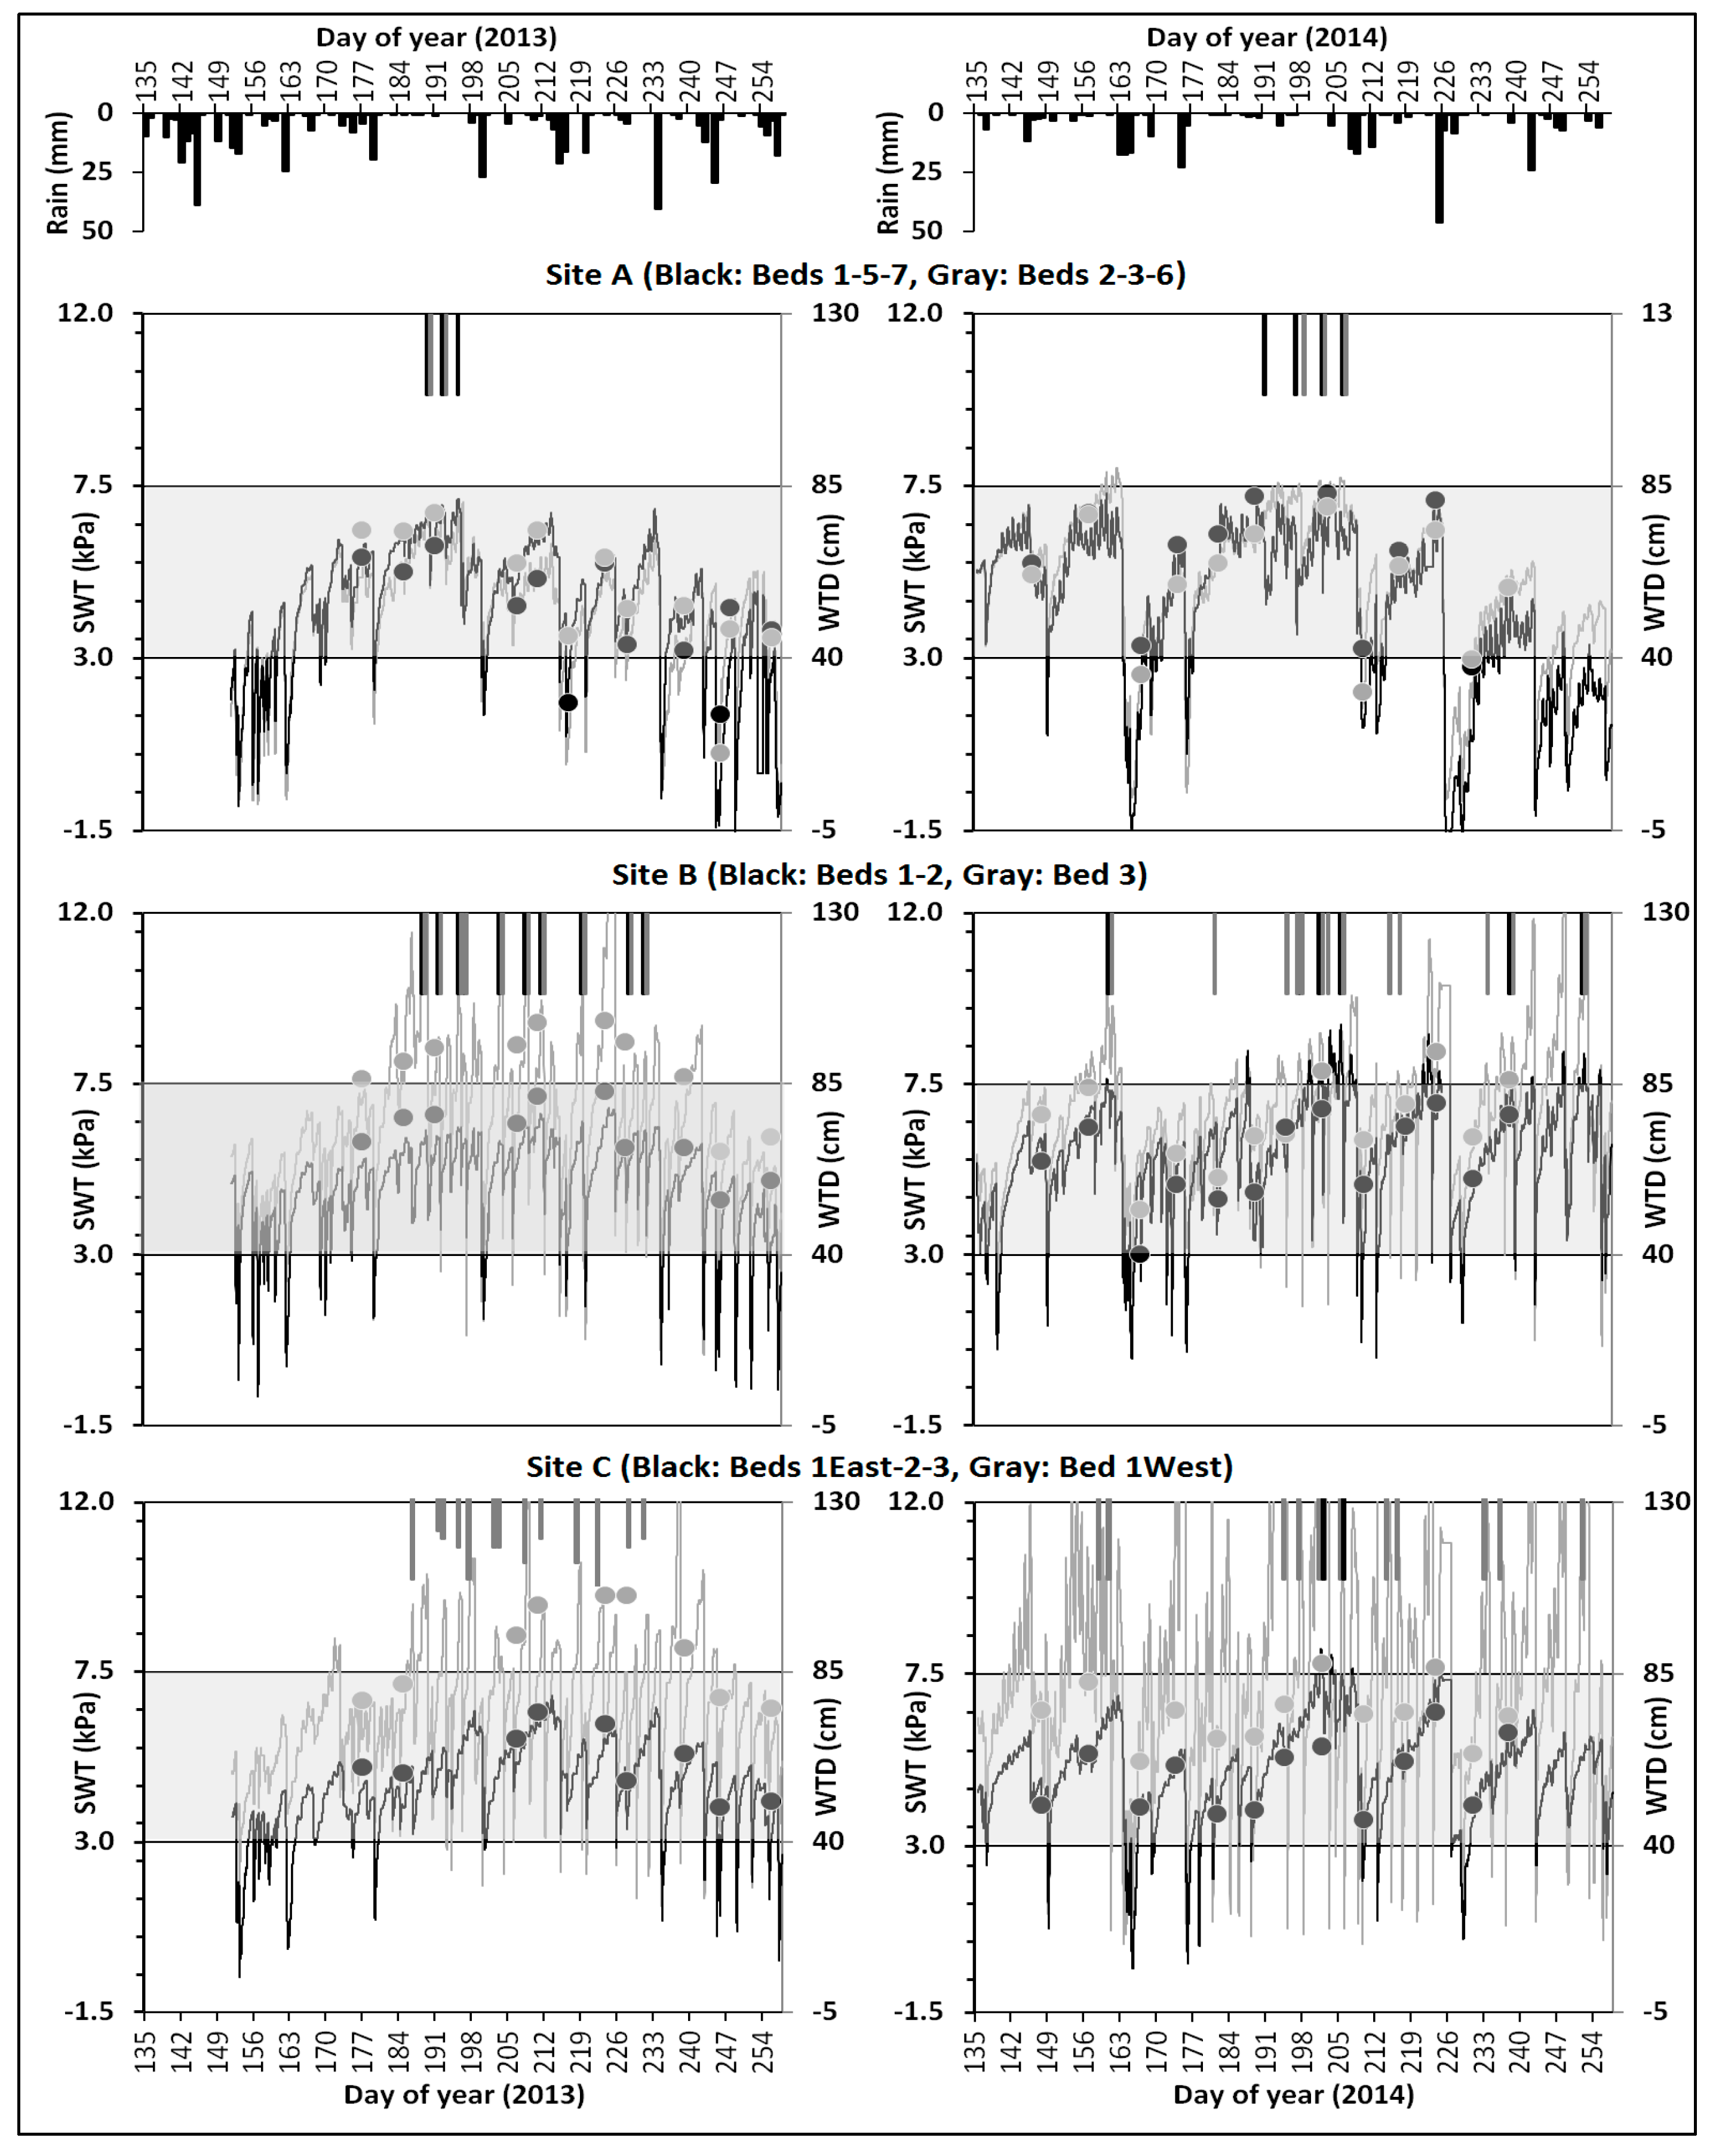
3.1.2. Mapping the WTD

The averaged observed WTD at Site A was 60 ± 12 cm in 2013 (Figure 4a) and 64 ± 13 cm in 2014 (Figure 4b). The root square mean error (RSME) of the map was 4 cm for the 2013 values and 2 cm for the 2014 values. The WTD was close to 50 cm where water was added at the northeast end of Bed 2 and Bed 3. Although there is a 2 m deep canal at the southwest end of the block and that the water level in that canal was 70 cm below the soil surface, the WTD dropped from 70 to 100 cm deep within 70 m of the canal. There is another block of beds located 1 m lower downstream (on the right side in Figure 4a) and this suggests that the soil below the ditch is not impermeable, which would result in a hydraulic gradient and seepage losses between the two blocks of beds. The average WTD measured in the observation wells at Site B are shown in Figure 4c for 2013 and in Figure 4d for 2014. The RSME is less than 1 cm for both maps. For both years, the WTD in Bed 1 and Bed 2 were in the desired range of the 50–70 cm, but the WTD in Bed 3 was deeper. There was a gradient in the WTD transverse to the width of the bed caused by Bed 4 (not shown) which soil surface was 1 m lower than that of Bed 3. Water added in the drain tubes of Bed 3 was probably lost to Bed 4 by lateral seepage. The average WTD for Site C was 69 ± 21 cm in 2013 (Figure 4e) and 60 ± 8 cm in 2014 (Figure 4f). The RSME of the maps is less than 1 cm for both the 2013 and 2014 values. For both years, the WTD was deeper in the southwest part of the beds due to an adjacent block of beds 1 meter lower downstream, as found in Site A. In 2013 (Figure 4e), the white zone means that the WTD was deeper than the depth of the observation wells (120 cm).
Figure 4. Filled contour of weekly average water table depth for the three sites between June and September in 2013 and 2014. Crosses represent observation wells. (a) Site A-2013; (b) Site A-2014; (c) Site B-2013; (d) Site B-2014; (e) Site C-2013; (f) Site C-2014.
Sustainability 07 10602 g004

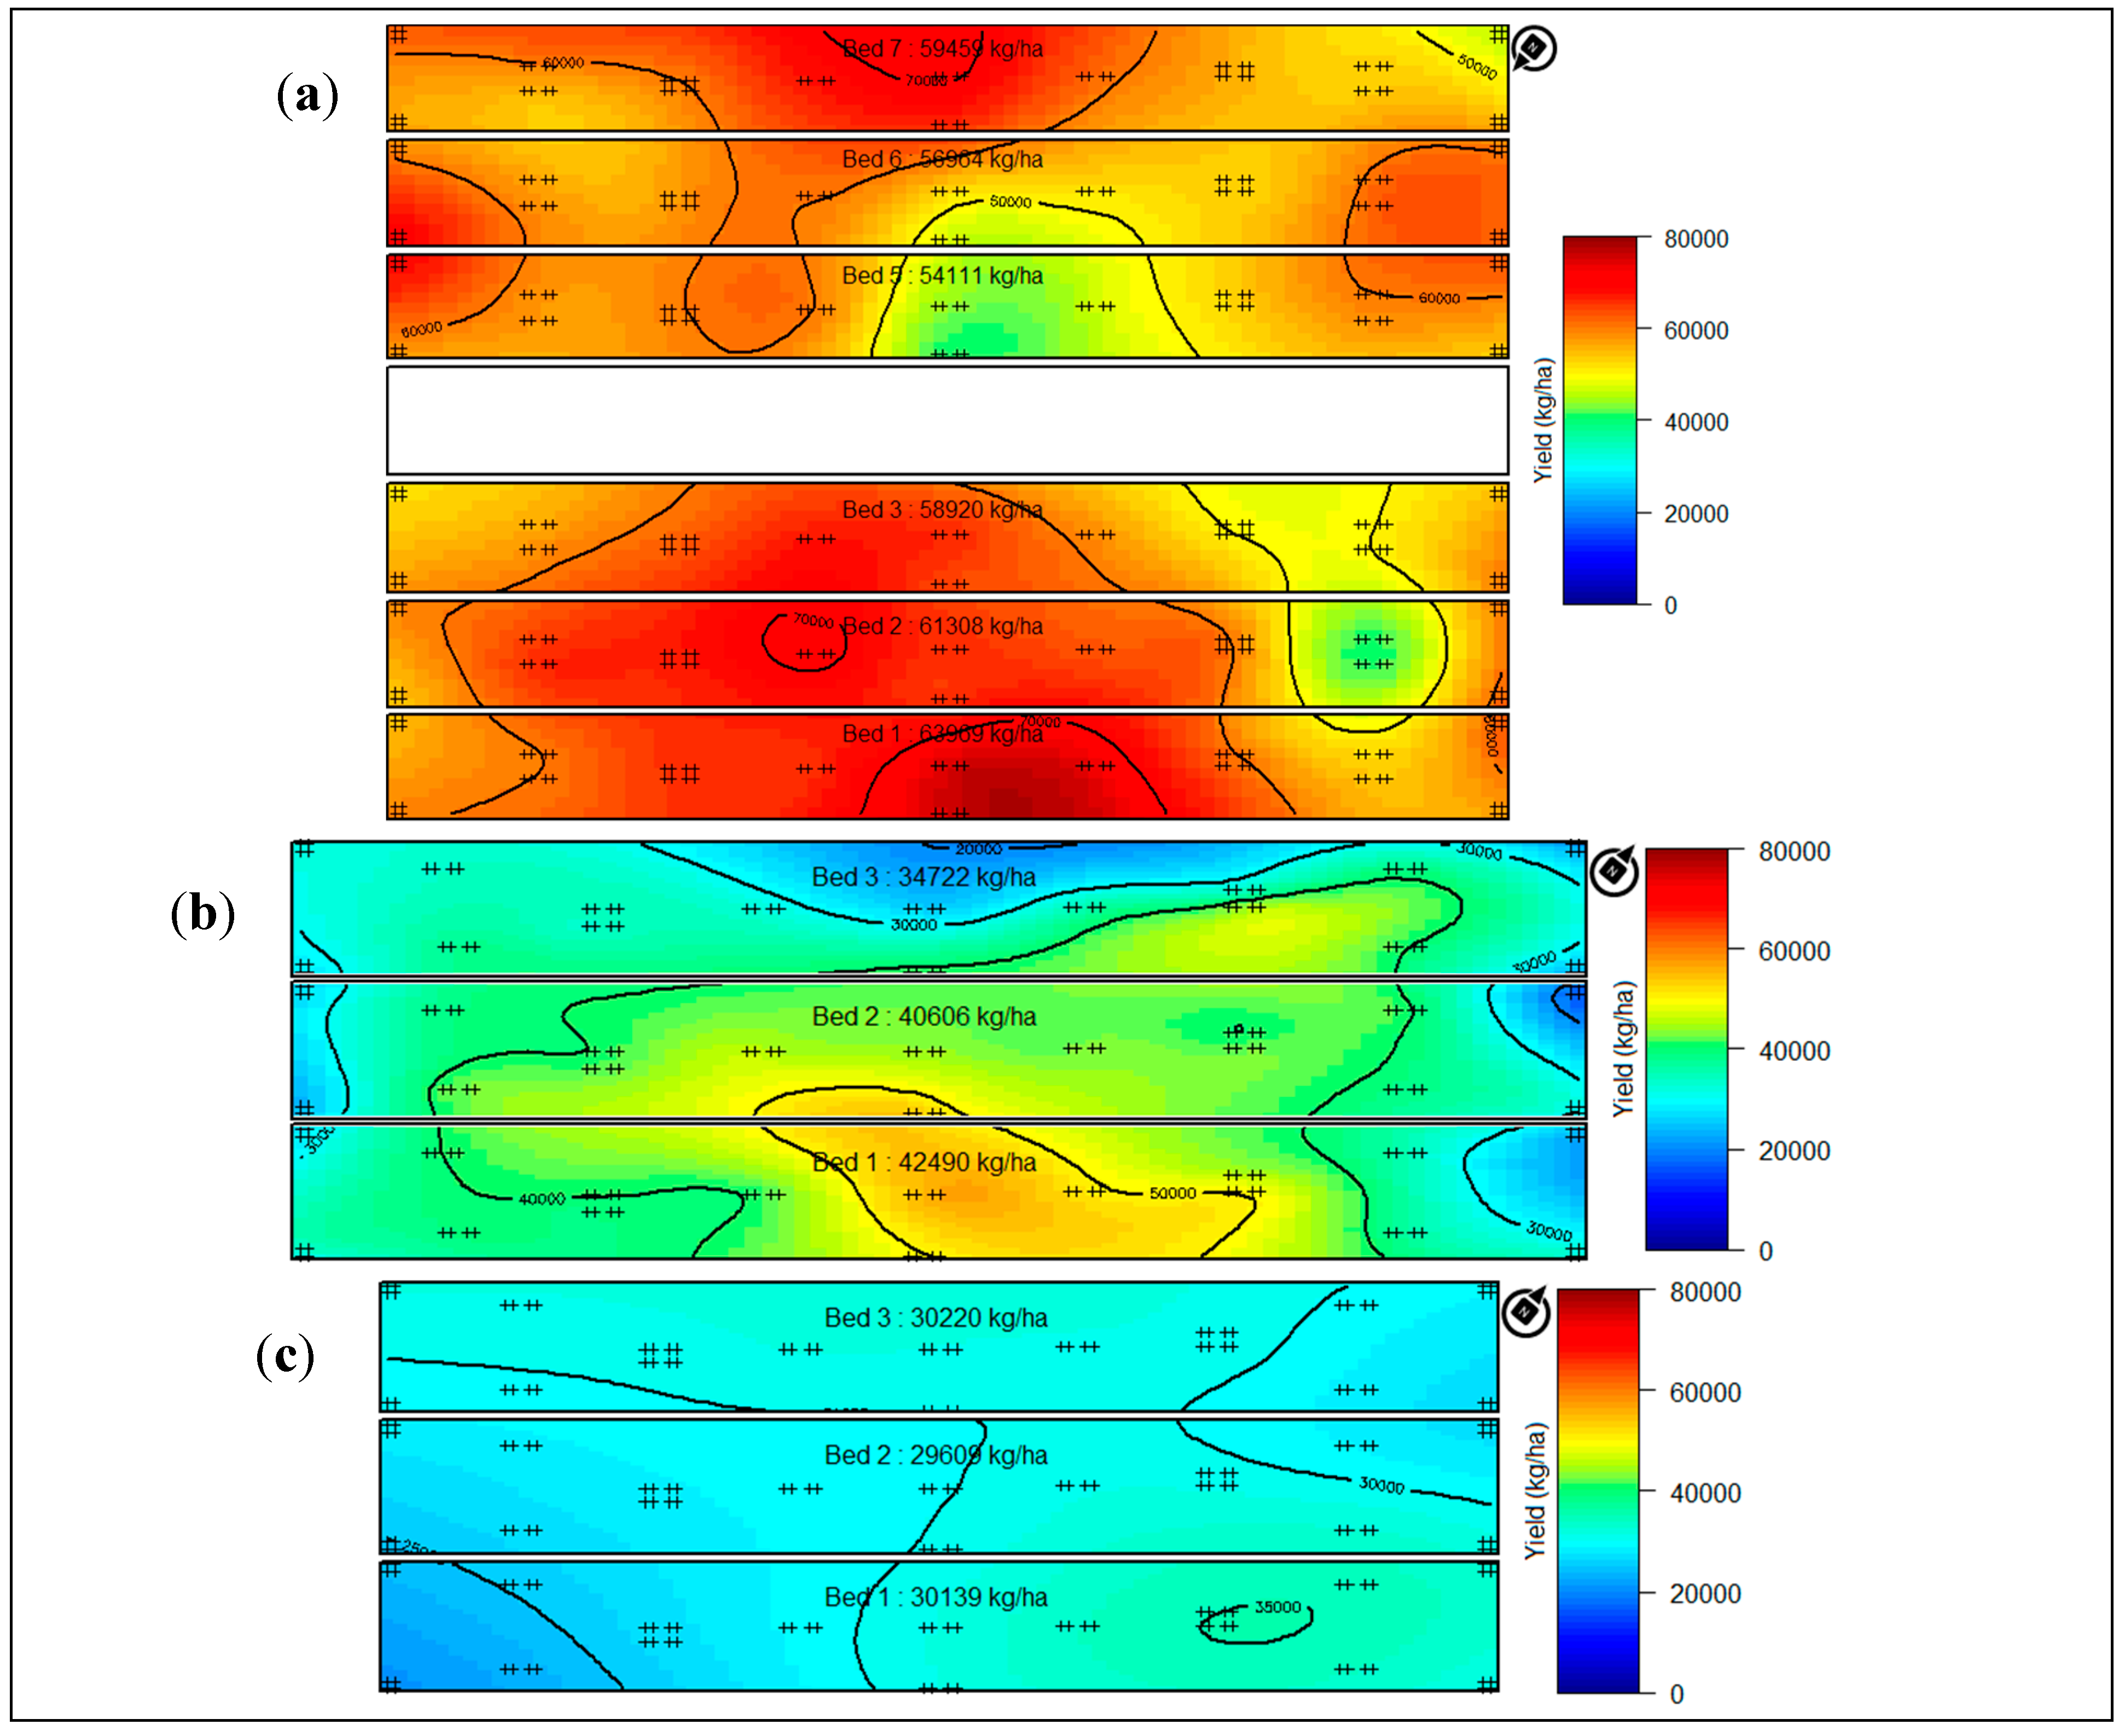
3.1.3. Mapping the Yield

The average yield at Site A was 59,164 kg ha−1 and the RMSE of the model is 10,614 kg ha−1 (Figure 5a). Only two spots in the beds yielded less than 50,000 kg ha−1 and this is because they were planted with a different cultivar yielding smaller berries (Figure 5a). Indeed, the number of berries in those spots was similar to the number of berries in the rest of the beds. Prior to the water table control experiment, the five-year average yield at this site was 39254 ± 6700 kg ha−1 with sprinkler irrigation used as the only water management system, i.e., with the water table uncontrolled. The average yield at Site B was 39,273 kg ha−1 with a RSME of 5229 kg ha−1 (Figure 5b). Site C yielded an average of 29,989 kg ha−1 (Figure 5c) with a RSME of 6876 kg ha−1. The yield was uniform except in the south corner of Bed 1 where it was approximately 10,000–15,000 kg ha−1 lower. In this region, a unusual two-day episode of heat stress (air temperature >28 °C) when plants were breaking dormancy in May 2013 coupled to a very deep water table (>150 cm) resulted in plants reaching the permanent wilting point. In 2013, there was no fruit produced in this area of the bed. Before this high mortality event, the water level in the canal in the south part of the corner was not controlled and mostly empty. The bottom of the canal was approximately 2 m deeper than the soil surface in Bed 1. Some excavation work was carried out in the spring of 2014 to connect that canal to the canal at the northwest end of the block of beds to maintain water level at the required depth in the canal. Following that modification, WTD in that corner was 70 cm shallower than in 2013, and the yield returned to normal.
Such trials suggest that top yields could be achieved for this production with this irrigation method. Indeed, the average yield at Site A was 79% higher than the 2014 Québec average conventional production yield [3]. Recent studies in Québec have already reported yield samples as high as 66,000 kg ha−1 [22] although it was established 25 years ago that the potential for cranberry production would be approximately 57,000 kg ha−1 with all factors being optimum [2]. At Site A, 57% of the samples harvested exceeded that potential threshold, 28% were greater than 70,000 kg ha−1, 6% of the samples were greater than 80,000 kg ha−1 and the highest yield was 95,231 kg ha−1, pushing the cranberry potential much higher than previously established. The yield at Site B was 62% greater than the 2014 Québec organic cranberry production average yield. The maximum yield in one sample was 63,456 kg ha−1 and even with organic production, 3% of the samples yielded more than the 57,000 kg ha−1 established cranberry potential. Before the water control experiment, the four-year average yield for this site was 22,785 ± 8202 kg ha−1 with sprinkler irrigation as the main water management system, i.e., with the water table uncontrolled. Based on these results, it can be clearly stated that water table control can be a powerful tool to increase the yield in cranberry production.
Three possible causes can be identified to explain the exceptionally high yields at the experimental sites. The first reason is that water supply in the root zone is steadier with subirrigation compared to sprinkler irrigation. The second reason is that fertilizers are generally available to the roots for a longer period of time with subirrigation by reducing leaching. With frequent sprinkling, fertilizers are leached with soil solution below the root zone. The third reason is that leaves are kept drier when water table control is used instead of sprinkler irrigation, allowing better conditions for the plants to fix carbon by photosynthesis. Resource limitation has long been pointed out as a potential yield limitation factor in cranberries. Greater energy reserves stocked as carbohydrates could allow more berries to be set from flowers and then increase final yield [23,24,25].
Figure 5. Crop yield at the three sites in 2014. Crosses represent samples location. (a) Site A; (b) Site B; (c) Site C.
Sustainability 07 10602 g005

3.1.4. Yield Components

The yield component most significantly affected by the WTD was fruit set (Figure 6a), where the maximum was found at a WTD of 60 cm. At that value, the maximum fruit set on the regression curve was 52%, but when WTD was 15 cm deeper, fruit set was reduced to 35% (Figure 6a), leading to a decline in the total number of berries (Figure 3b). When the water table was deeper than 60 cm, significantly fewer berries per upright were also found (Figure 6b). On the regression curve, a maximum of 1.90 berries/upright corresponded to a WTD of 60 cm, but this value was reduced to 1.28 when WTD was only 15 cm deeper. This lower number of berries was not compensated by other components since berry weight (Figure 6c) and the number of fruiting uprights per sample (Figure 6d) were not significantly affected by WTD (p >0.05). The average number of fruiting uprights was 53 ± 18 per sample ring and the average of berry weight was 1.73 ± 0.18 g. Multiplying these two averages by the number of berries per upright gives a predicted yield increase of 30,563 kg ha−1 when the WTD is raised from 75 to 60 cm; and this even when sprinkler irrigation is used as a complementary source of water. Maintaining the WTD at the optimum value is thus important for increasing final yield.
The high values of the yield components can explain the high yield found in our experiment. Water limitation was also previously associated with a significant reduction of the number of berries per upright and fruit set leading to a significant reduction of final yield [4]. When root water uptake is less than the potential evapotranspiration, which is caused by insufficient water fluxes, cranberries transpiration is affected and photosynthesis is reduced [6]. Upward fluxes are negligible when the WTD is deeper than 90 cm (Figure 2b). Cranberry yield limitation is often explained by the low success of flowers to produce berries caused by a limited accumulation of carbohydrates [23,24,25]. Since water availability has been identified to limit carbon fixation [6], controlling the water table at a depth deeper than the optimum probably resulted in lower plant energy reserves available to set fruits. The optimum seasonal averaged WTD has been found to be 60 cm and attention should be paid to avoid water tables deeper than 75 cm.
Insufficient water fluxes from water tables that were too deep also negatively affected the yield components in other crops in Québec. Subirrigation treatment produced significantly more maize cobs and grain yields were twice as high as the nonirrigated treatment [26]. Also in maize, when the water table was deeper than the optimum, the number of ears per square meter, the number of grains per square meter, the number of grains per row and the grain weight were reduced [27]. Pods and seed number per plant were lower for the 100 cm WTD than for the 40–80 cm WTD in soybean grown on a sandy loam [28].
Figure 6. Yield components in relation with the averaged water table depth (WTD) during the growing season at Site A (•), Site B (▪), and Site C (▲). (a) Percentage of fruit set per flower; (b) Number of berries per fruiting upright; (c) Berry weight (d) Number of fruiting uprights per ring of 182 cm2. (Solid line: Regression line; Dashed line: Boundary line approach [21]). The R2 and p values are for the regression lines.
Sustainability 07 10602 g006

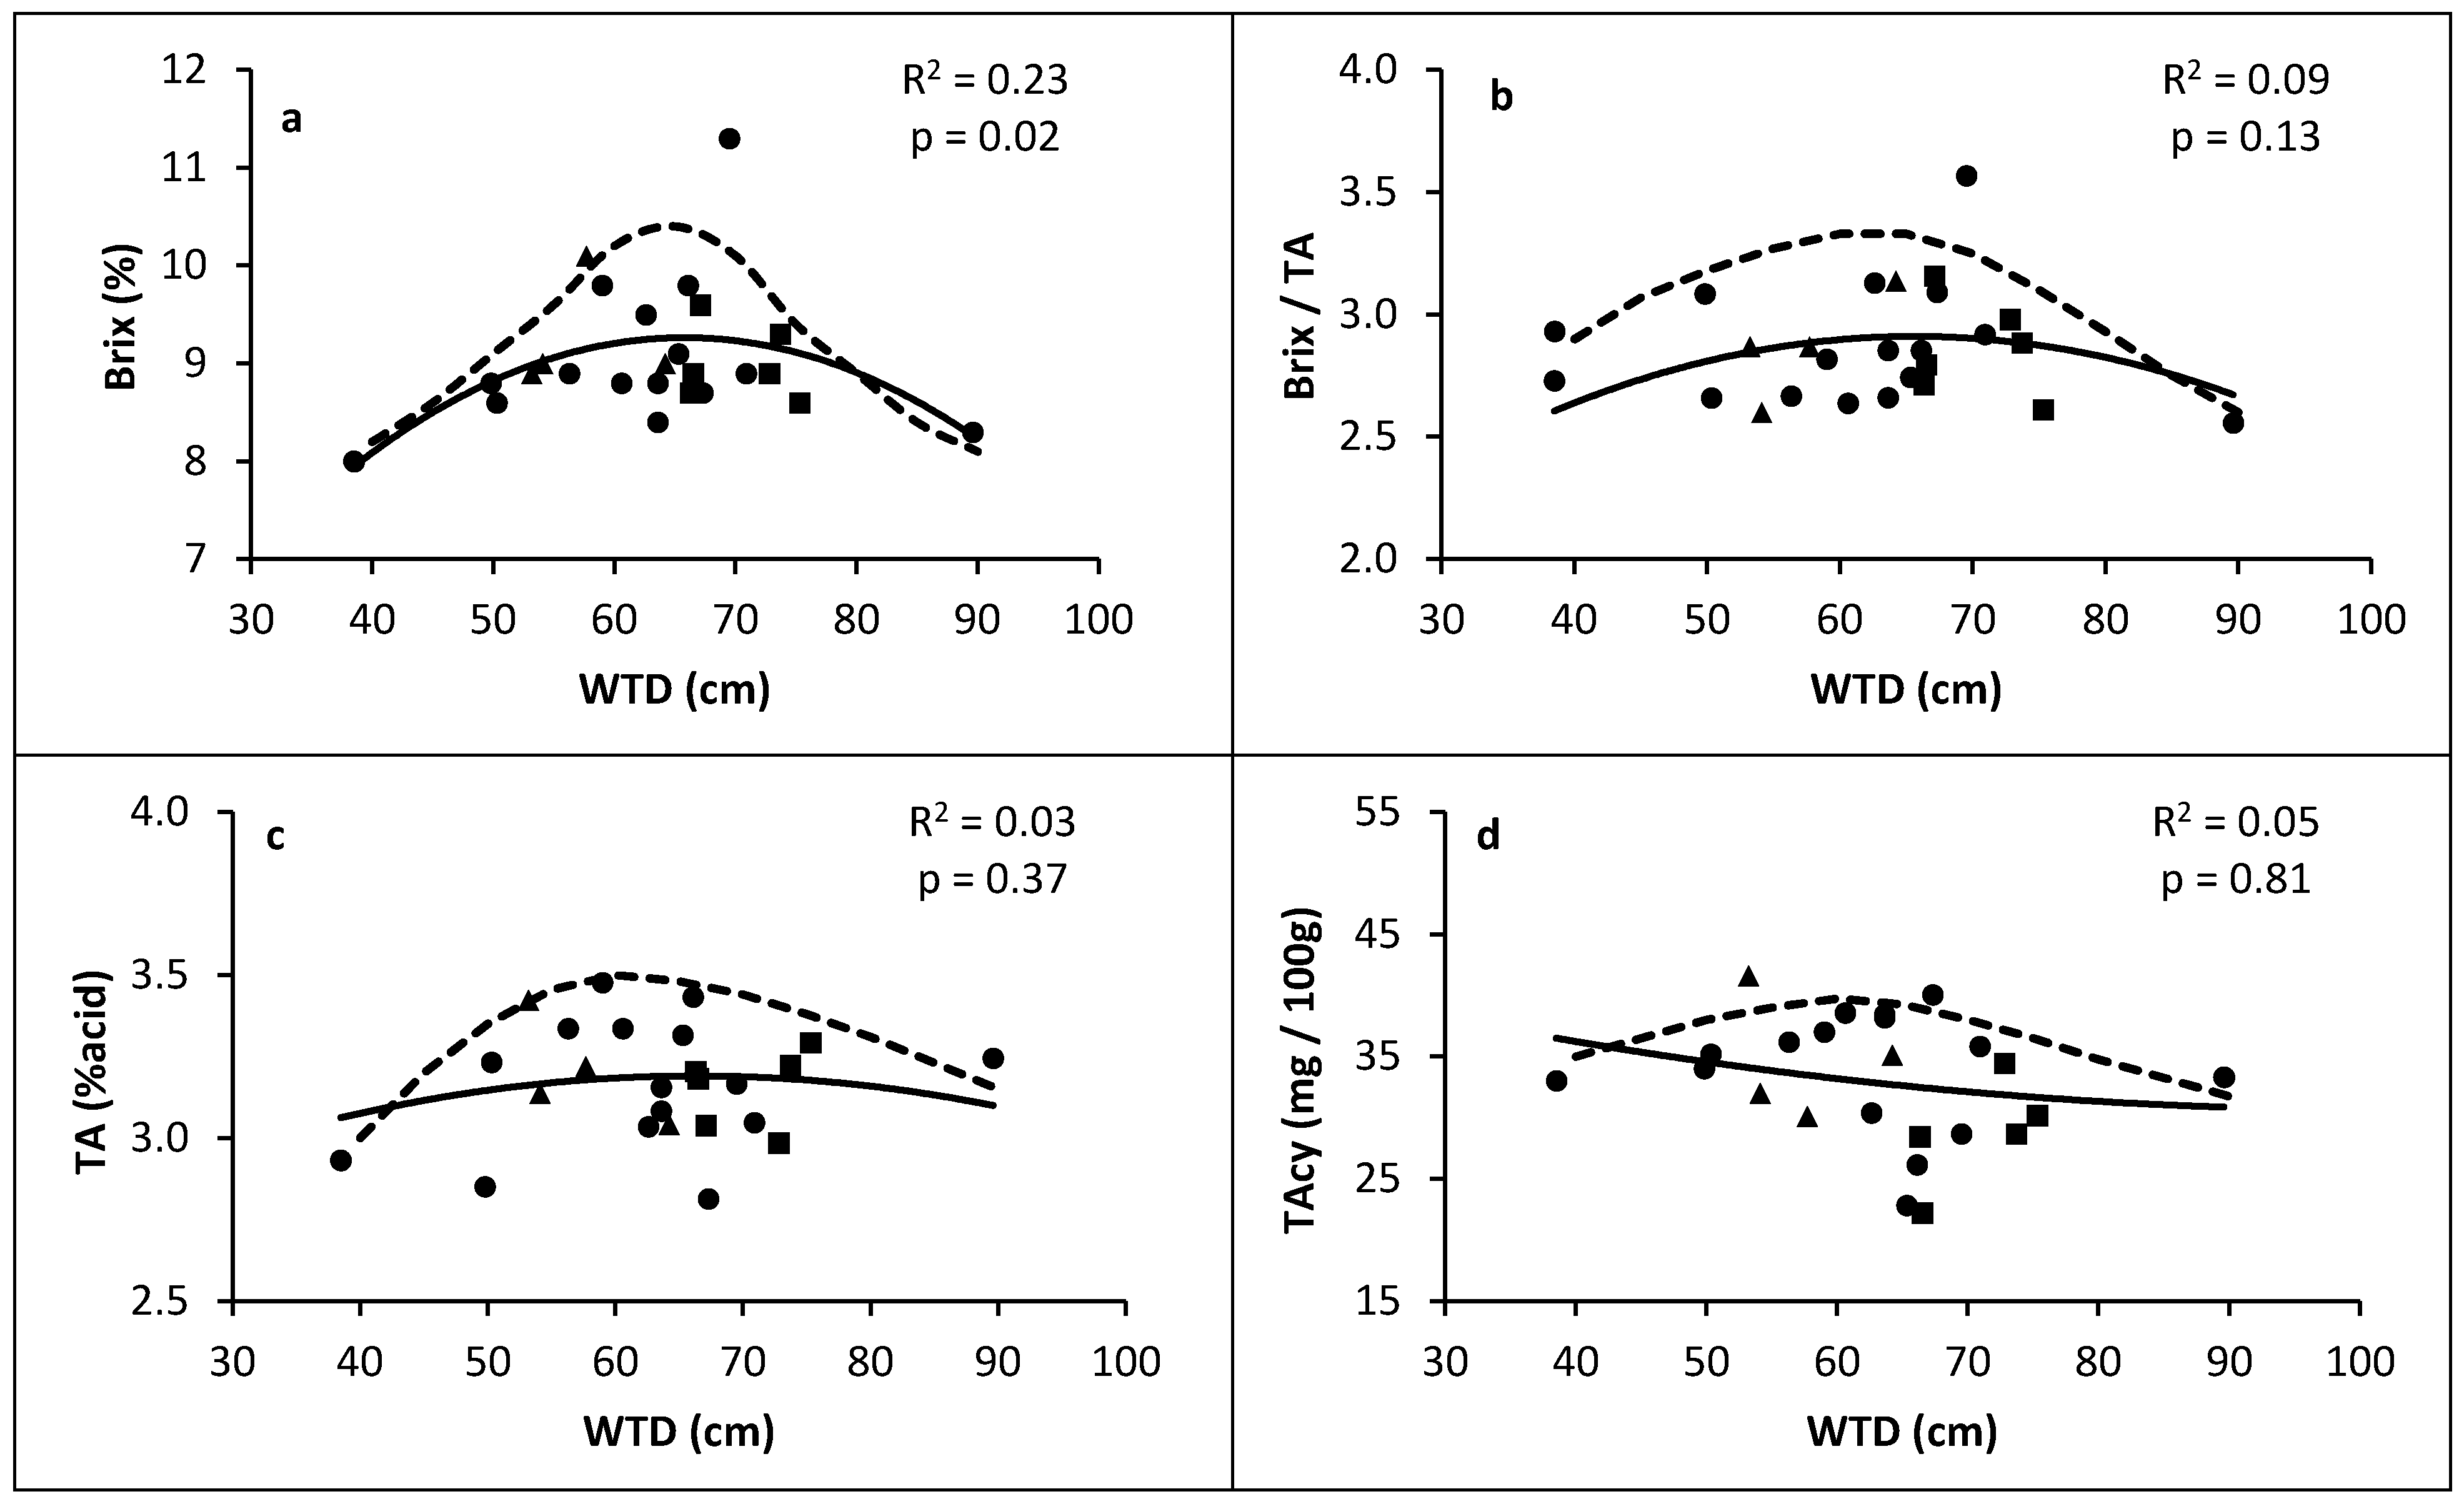
3.1.5. Fruit Quality Parameters

The quality parameters of the berries in relation with WTD are shown in Figure 7. The relationship between TSS and WTD was significant (p < 0.05) and the maximum was found when the average WTD during the growing season was between 60–70 cm (Figure 7a). Although the relationships between the ratio of TSS to TA (Figure 7b), TA (Figure 7c), and TAcy (Figure 7d) with WTD were not significant (p > 0.05), the maximum of those parameters were found between 60–70 cm with the boundary lines approach. Water stresses also affected yield quality in other crops, but the effect was contradictory depending on the geographical area, crops and studies. In Florida, sugar yield from sugarcane plants was significantly lower when the WTD was 75 cm in comparison with 45 cm [29]. Deficit irrigation increased TSS and TAcy in grapevines in Chile [30] and in U.S.A. [31], as is generally known to do, but another study concluded to the contrary in Italy [32]. Based on the first criteria, the average WTD should be 60 cm for increasing crop yield without negatively affecting yield quality.
Figure 7. Yield quality parameters in relation with the averaged water table depth (WTD) during the growing season at Site A (•), Site B (▪), and Site C (▲). (a): Total soluble solids (TSS); (b) Titratable Acidity (TA); (c) Ratio of TSS on TA; (d) Total Anthocyanin (TAcy). (Solid line: Regression line; Dashed line: Boundary line approach [21]). The R2 and p values are for the regression lines.
Sustainability 07 10602 g007

3.2. Second Criteria: Minimal Use of Sprinkler Irrigation

Irrigation was started when the average SWT in individual irrigation zone reached 7.5 kPa. Since the tensiometers were installed in the rhizosphere at 10 cm depth, a SWT of 7.5 kPa means a WTD of 85 cm at the equilibrium and in a uniform soil profile. Seasonal sprinkler irrigation requirements were between 0 and 48 mm when the WTD was between 52 and 65 cm whereas they were between 72 and 168 mm when the WTD was between 66 and 90 cm (Table 3). Maintaining the WTD shallower than 65 cm saved considerable amount of sprinkler irrigation water in comparison with a deeper WTD. Similar results were obtained by numerical modeling studies [11]. Without considering upward flux from the water table, it has been established that cranberry needs approximately 300 mm of water from sprinkler irrigation [33,34]. Controlling the WTD has then been successful for reducing water needs. The contribution of groundwater in meeting the crop water requirements was 100% in wheat and 80% in sunflowers and the relation was also a function of the WTD [35].
Table 3. Irrigation water applied at each site for 2013–2014 and weekly averaged water table depth (WTD).
SiteBeds20132014
Irrigation (mm)WTD (cm)Irrigation (mm)WTD (cm)
A1–5–73652 ± 154865 ± 16
2–3–62458 ± 183660 ± 16
B1–212072 ± 97266 ± 12
312089 ± 1216875 ± 12
C1 West10290 ± 1214475 ± 8
1 East–2–3061 ± 92458 ± 9
When the soil is drier than 7.5 kPa and sprinkler irrigation has not yet been turned on, the SWT is rapidly increasing during daytime and starts to fall when the evapotranspiration demand decreases during nighttime. Such changes in SWT were observed in Bed 3 at Site B and in Bed 1 West at Site 3 when the WTD and SWT were outside the hydric comfort zone (Figure 8). More frequent sprinkler irrigations could have avoided this situation. When the water table is deeper than 90 cm, the upward flux is negligible and the roots need to provide more energy for an active water uptake as the change in soil water content is low for each additional kPa of SWT (Figure 2a).
Mostly no rain was recorded from day of year (DOY) 179 to 198 in 2013 and from DOY 177 to DOY 207 in 2014. This represented the flowering and fruit set periods, the most sensitive cranberries development stages to water stress [4]. With no rain for several consecutive days, the water table control system was unable to keep the water table at the desired depth; this led to a lowering of the water table where the upward flux was insufficient to meet the evapotranspiration demand. Sprinklers were turned on only during these dry periods at Site A for both years. At Site C, except for Bed 1 West, no irrigation was needed in 2013 and two irrigations were needed in 2014. Since no modification was done to the laterals drain depth or spacing, optimization of those parameters in the design of future beds could be effective to completely avoid the sprinkler irrigation even during the driest periods of the growing season.
At Site B in 2013, sprinkler irrigation was applied when the average of the six tensiometers reached 7.5 kPa. However, SWT in Bed 3 was always higher than in Beds 1 and 2 (Figure 8) due to a deeper water table, by 12 cm on average, than in Beds 1 and 2 (Figure 4c); this was likely caused by the problem of water leaks from the drains of Bed 3 to Bed 4, as previously explained. Sprinklers were turned on when SWT was lower than 7.5 kPa in Beds 1 and 2, resulting in water being unnecessarily applied in those beds, but higher than 7.5 kPa in Bed 3, leading to water stress. To avoid that situation, two irrigation zones were created in 2014 and Beds 1 and 2 received 57% less water than Bed 3. Our results are similar to numerical simulations that concluded that irrigation can be reduced by 75% when beds are divided in irrigation zones accounting for the spatial variability of soil hydraulic properties [11]. Based on the second criteria, the average WTD should be less than 66 cm for minimizing sprinklers irrigation use.
Figure 8. Soil Water Tension (SWT; solid lines) and manual readings of Water Table Depth (WTD; circles) at each site for 2013 and 2014. The vertical bars in the upper part of each graph represent irrigation events of 12 mm. The gray area indicates the hydric comfort zone (3.0–7.5 kPa).
Sustainability 07 10602 g008

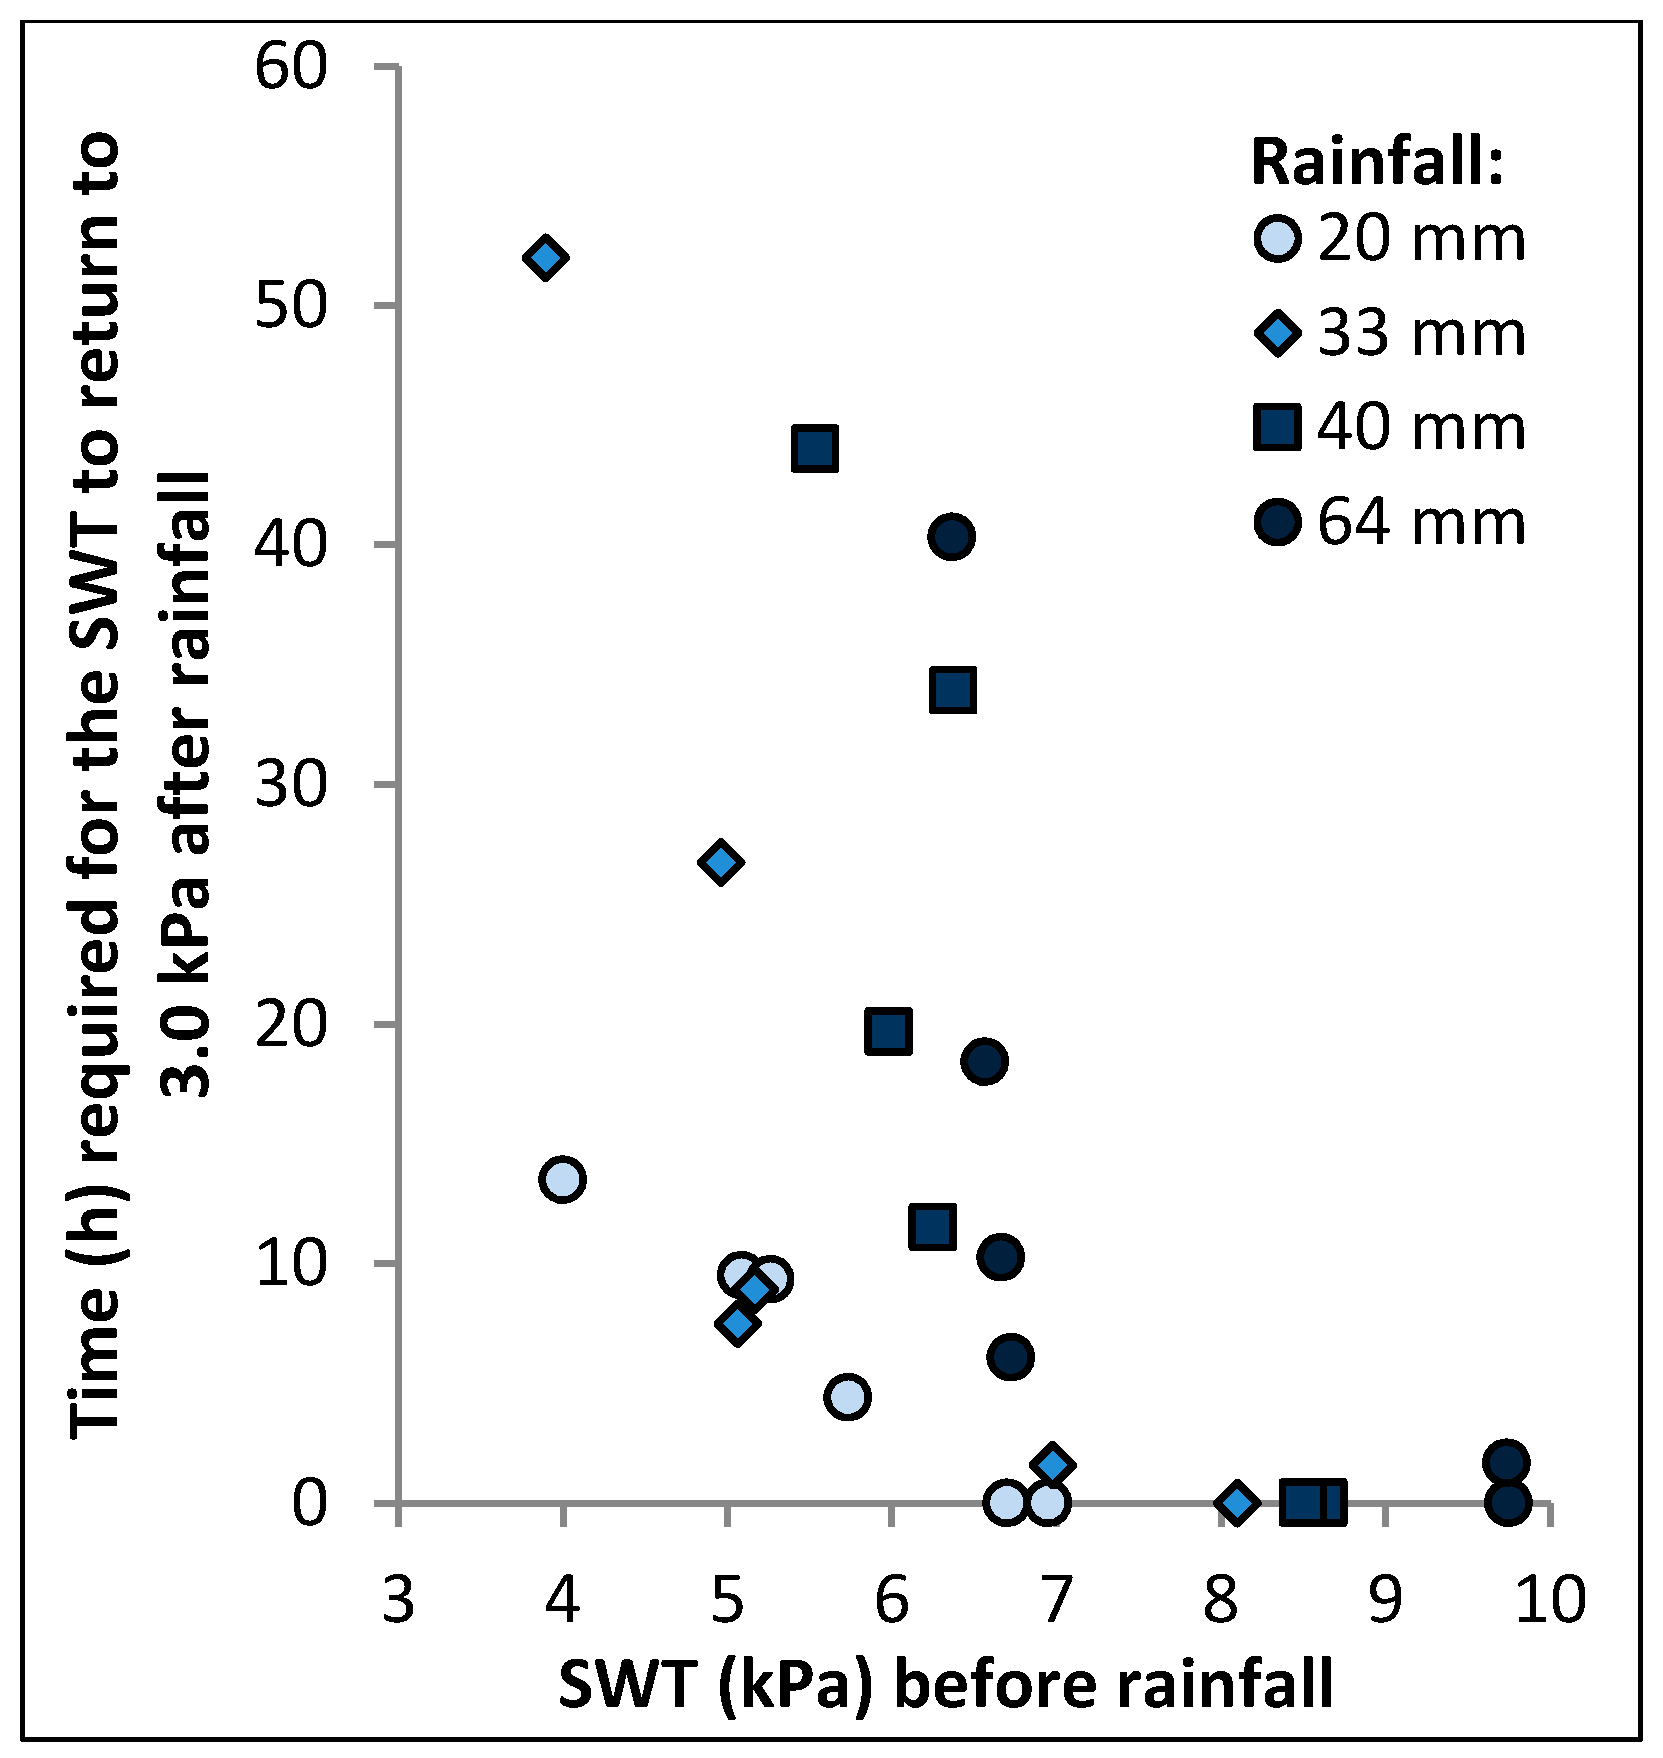
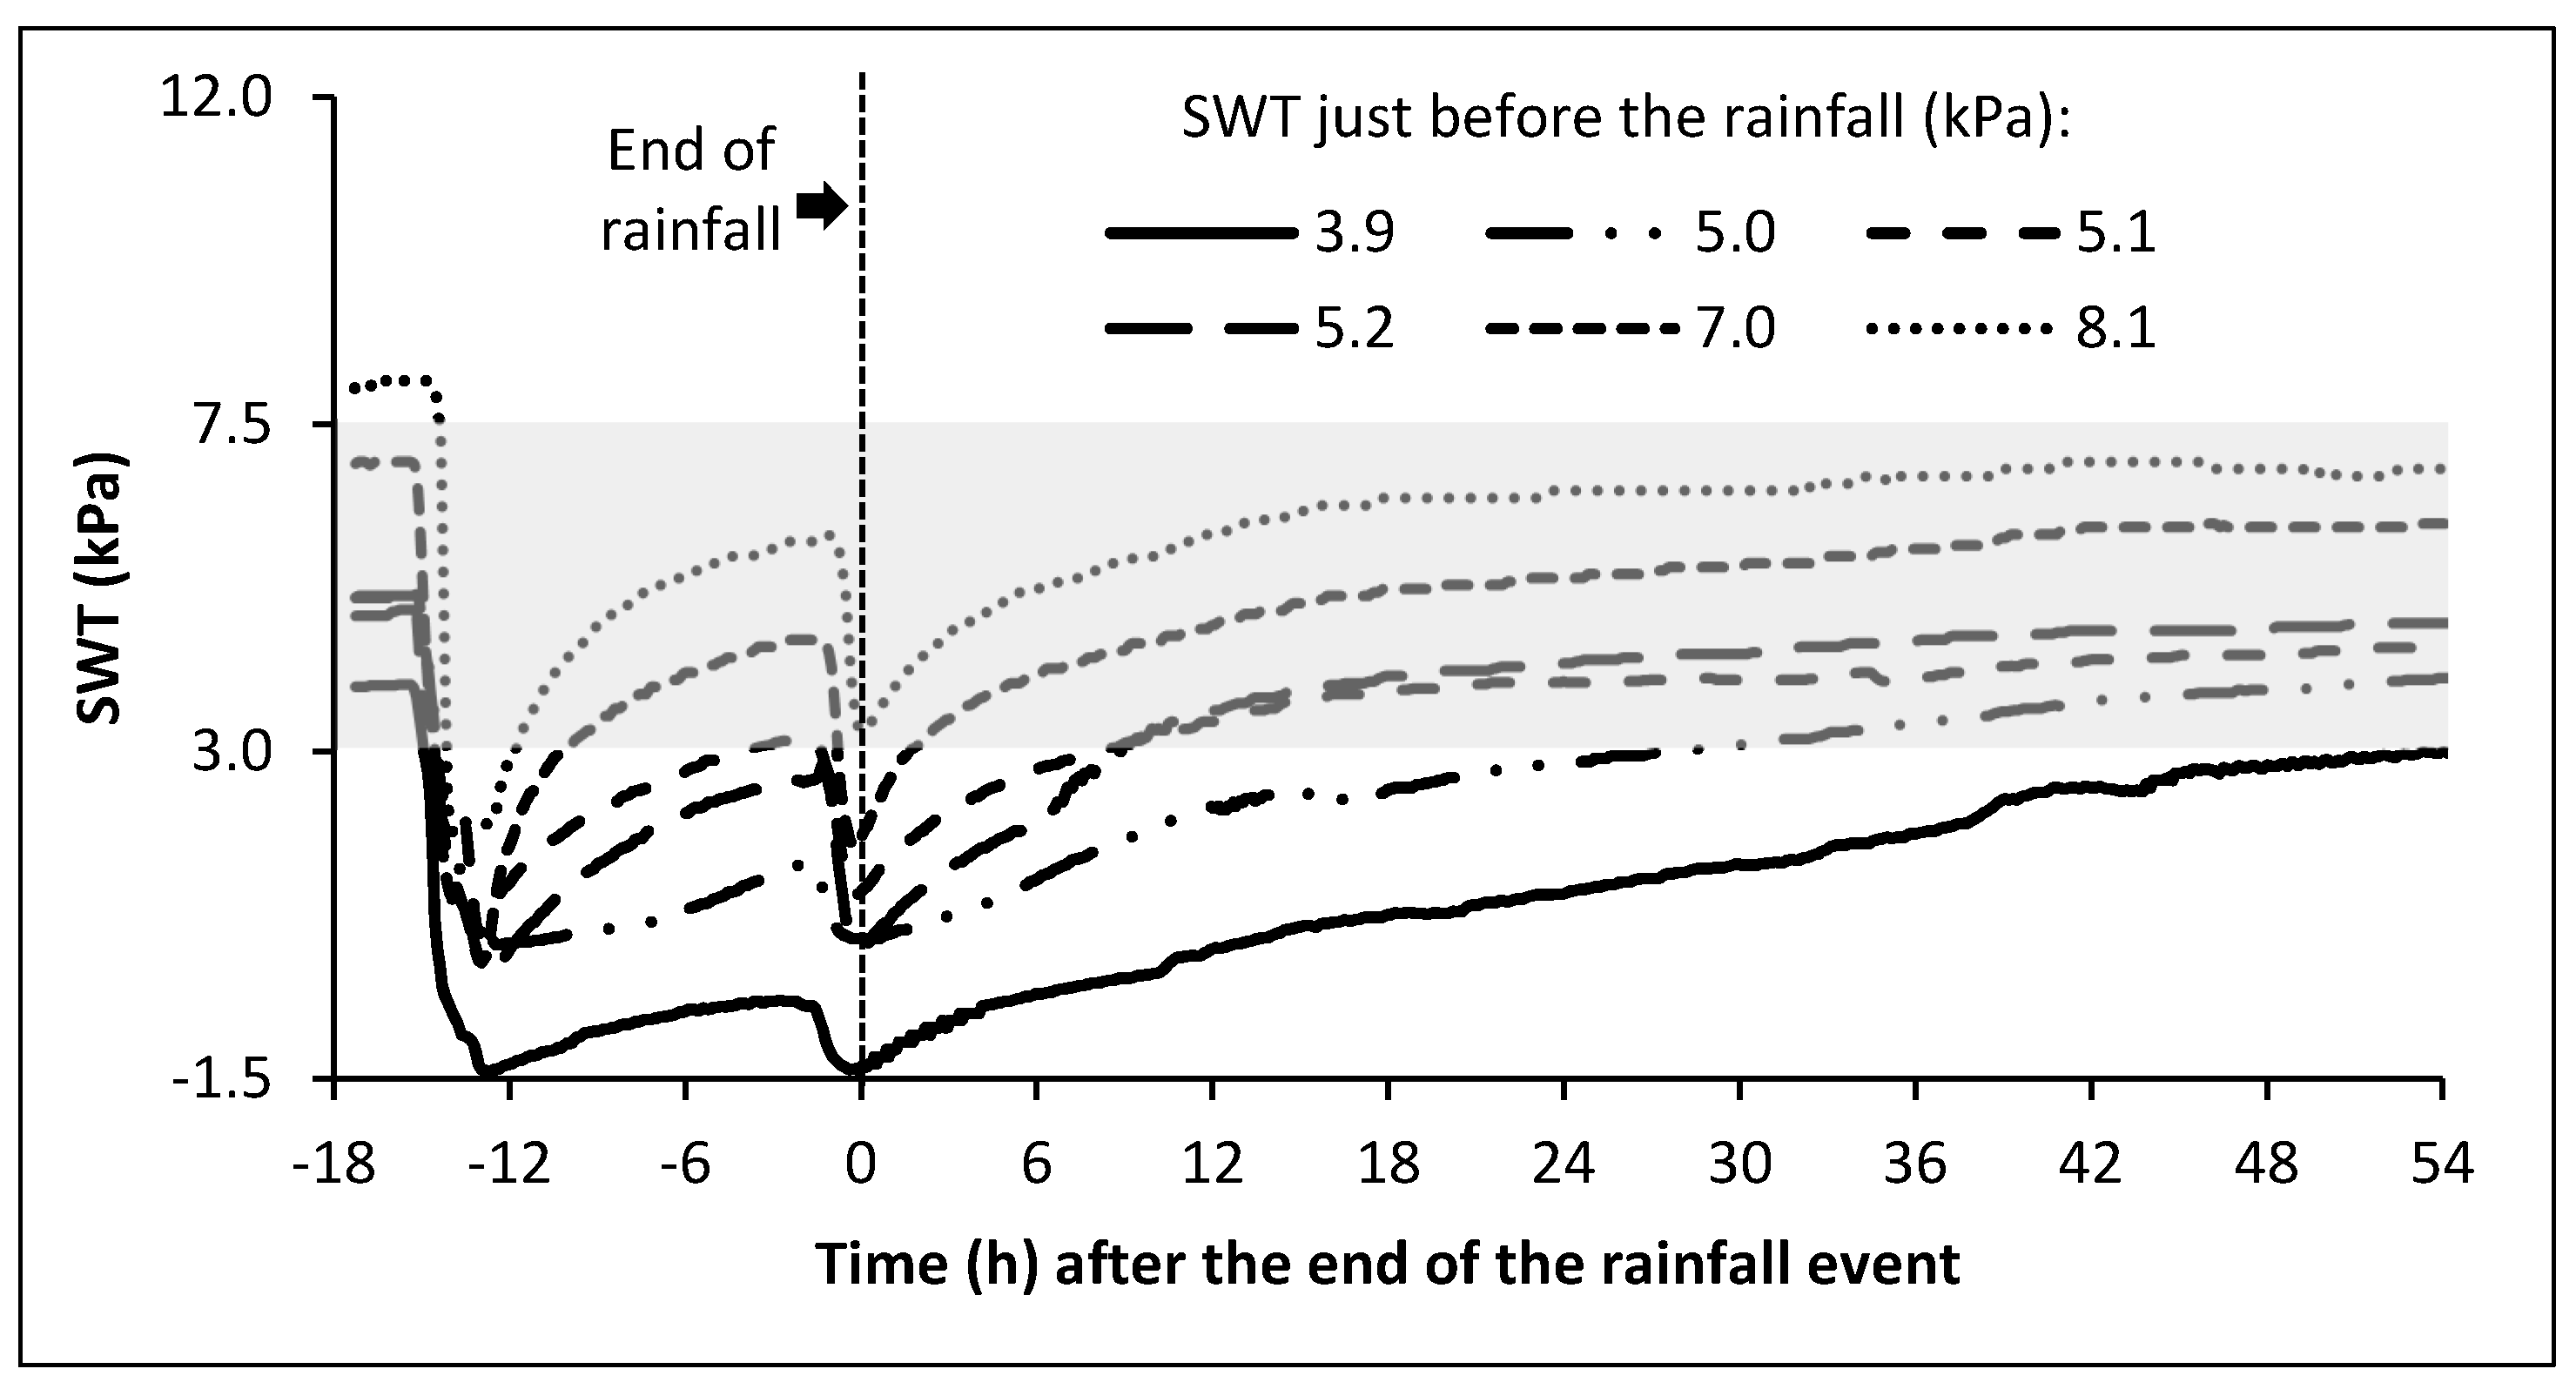
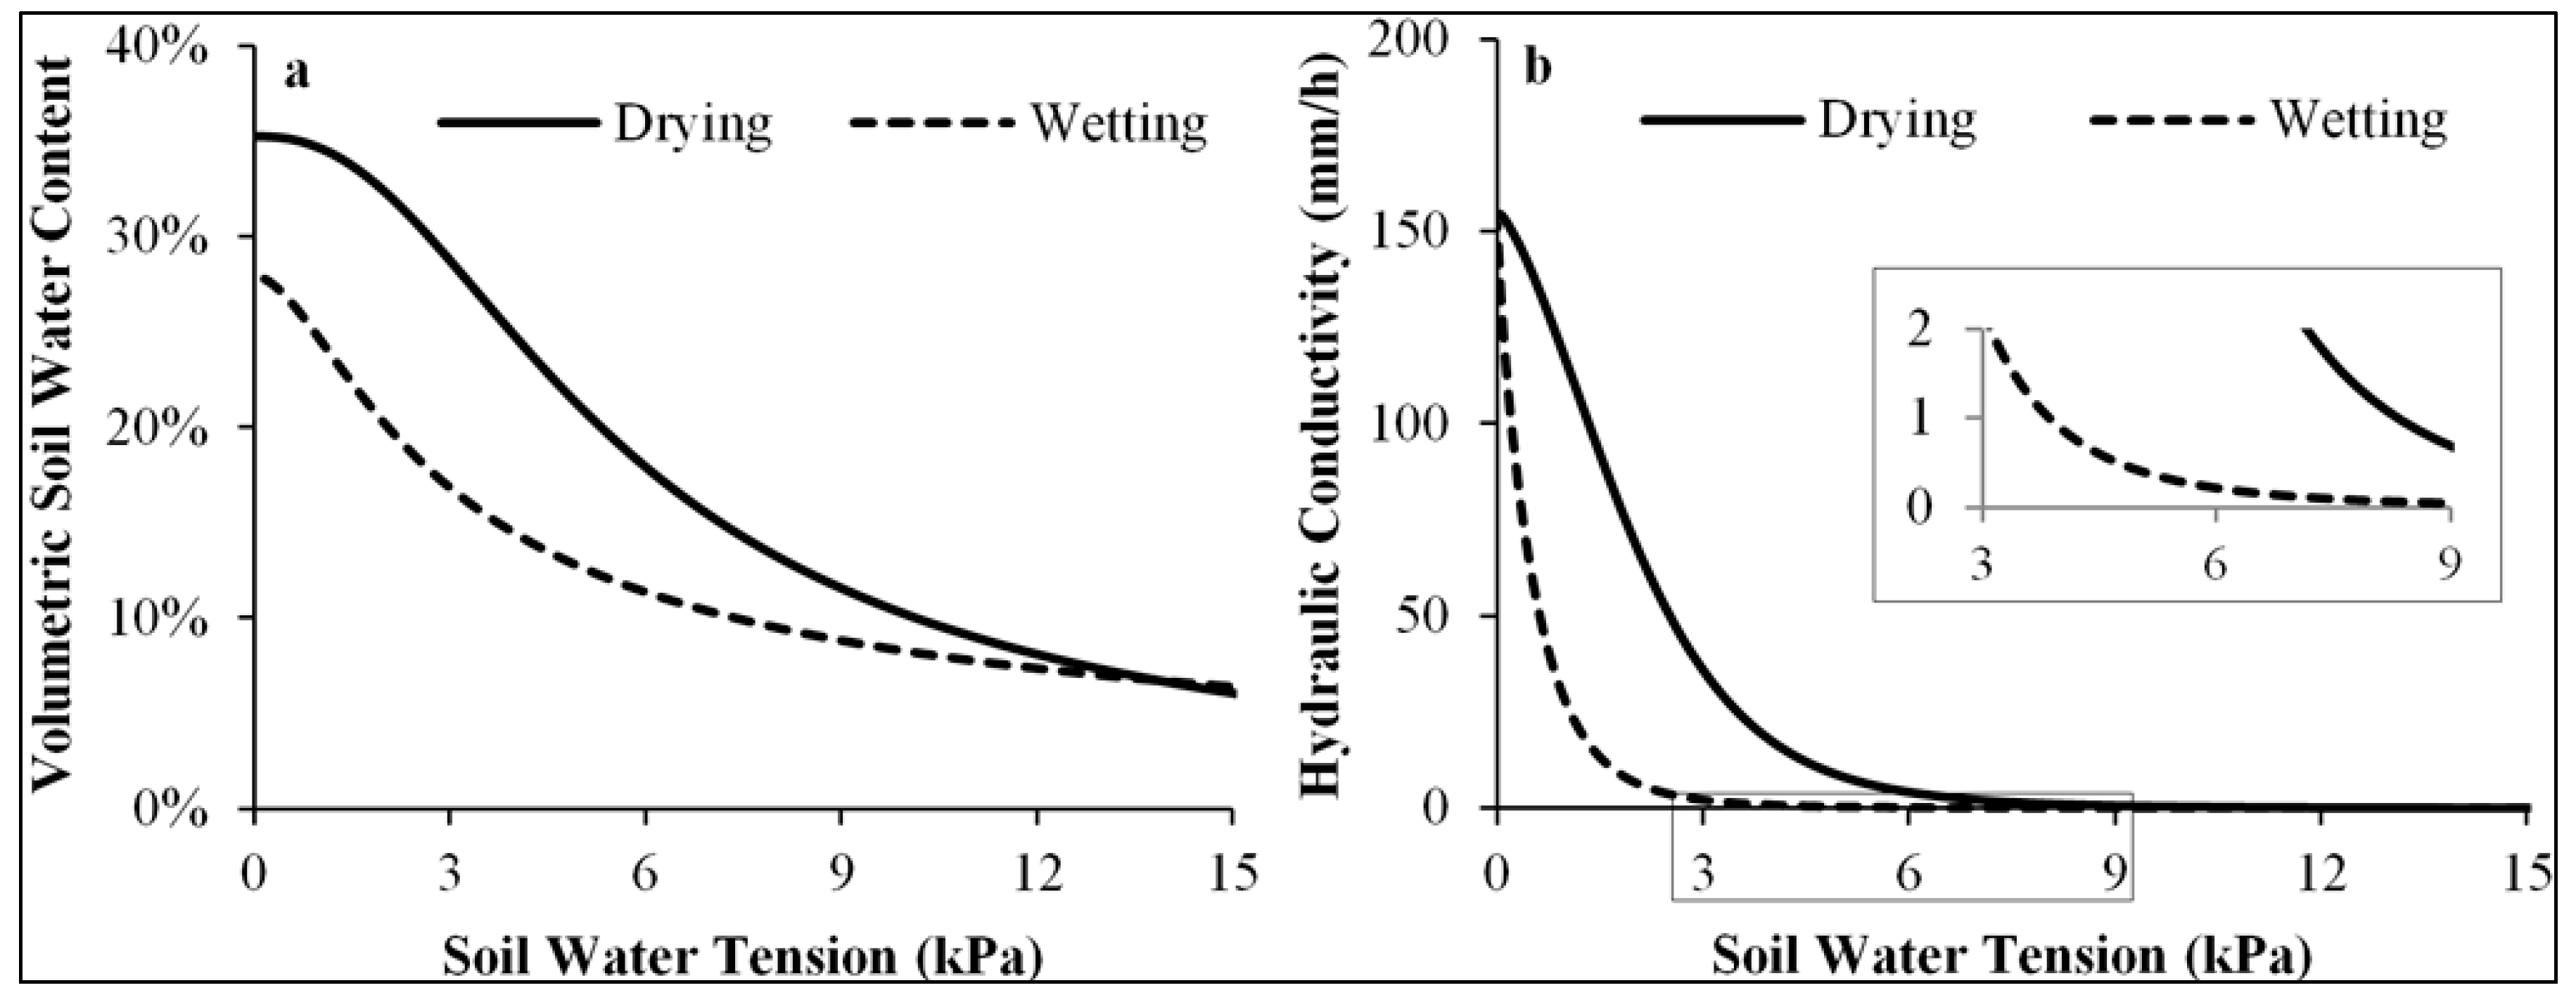
3.3. Third Criteria: Fast drainage

When the SWT just before a rainfall was higher than 7.0 kPa (WTD >80 cm), the time after the rainfall required to return to a value of 3.0 kPa (WTD = 40 cm) was close to zero (Figure 9). Drainage was then fully efficient with no risk of hypoxic conditions in the root zone. When SWT was less than 7.0 kPa (WTD < 80) just before a rainfall, the time required to drain was almost linearly related to SWT for each individual rainfall event. The drier the soil before a rainfall, the quicker the drainage.
Figure 9. Time required for the soil water tension (SWT) to return to a value of 3.0 kPa (WTD = 40 cm) after a major rainfall event as a function of the SWT just before the rainfall event.
Sustainability 07 10602 g009
For the particular rainfall event of 33 mm, when SWT was higher than 7.0 kPa, less than 2 h were required to return to 3.0 kPa (Figure 10). However, 52 h were necessary to drain back to 3.0 kPa when SWT was 3.9 kPa just before the rainfall; considering that this rainfall event occurred in two phases, the SWT remained under 3.0 kPa for 65 consecutive hours. Hypoxic stress in the root zone resulting from slow drainage can be harmful to the plants and reduce their productivity.
Since 40 mm of water are applied to protect the vines in a frost protection night, low values of SWT before protection could result in extended period of hypoxic conditions, especially when frost occurred on consecutive nights. Based on the third criteria, the water level in the canals should be lowered to 80 cm below the beds surface when a rainfall or a frost is anticipated to avoid hypoxic stress associated with SWT less than 3.0 kPa.
Figure 10. Soil water tension (SWT) for a rainfall of 33 mm for different values of SWT just before the rainfall.
Sustainability 07 10602 g010

4. Conclusions

Sustainability in cranberry production can be enhanced by improving the performance of water management. Water table control has the potential for increasing yield without decreasing quality, minimizing the amount of water needed by the sprinkler system, and avoiding hypoxic stresses in the rhizosphere. This study was conducted to determine the optimal water table depth (WTD) in cranberry production when using water table control with sprinkler irrigation as additional irrigation. Our results show that the final yield, the berry sugar content, the total number of berries, the number of berries per upright, and the fruit set were maximized when the WTD was 60 cm. Sprinkler water savings of 77% were obtained where the WTD was shallower than 66 cm. In order to avoid hypoxic conditions due to poor drainage, the water level in the canals surrounding the beds should be lowered to 80 cm when a rainfall or a frost protection irrigation is anticipated. All sides of a block of beds must be surrounded by canals to ensure a uniform WTD and to avoid lateral hydraulic gradients that could cause peripheral seepage losses. Further studies are needed to determine the optimal water table control design (drain depth and drain spacing) to enhance maintaining an optimal WTD and improve the drainage efficiency.

Acknowledgments

The authors of this paper acknowledge the financial contribution of the Natural Sciences and Engineering Research Council of Canada, Fonds de Recherche Nature et Technologies du Québec, Nature Canneberge, Canneberges Bieler, Transport Gaston Nadeau, Hortau and the Scientific Research and Experimental Development Tax Incentive Program of the Canada Revenue Agency and Revenu Québec. We thank Jonathan Lafond, Benjamin Parys, and all the undergraduate students who helped collecting the data.

Author Contributions

Vincent Pelletier, Jacques Gallichand, Steeve Pepin and Jean Caron conceived and designed the experiment. Silvio Gumiere helped with programming the code for the interpolating maps. Vincent Pelletier led the writing of this paper, and Jacques Gallichand, Silvio Gumiere, Steeve Pepin and Jean Caron revised the paper.

Conflicts of Interest

The authors declare no conflict of interest.

References

  1. Faostat-Cranberries–Production of top 5 producers. Available online: http://faostat3.fao.org/browse/Q/QC/E (accessed on 21 May 2015).
  2. Eck, P. The American Cranberry; Rutgers University Press: New Brunswick, NJ, USA, 1990. [Google Scholar]
  3. Statistiques-Association des producteurs de canneberges. Available online: http://www.notrecanneberge.com/Industrie/Infos/statistiques.html (accessed on 21 May 2015).
  4. Pelletier, V.; Gallichand, J.; Caron, J.; Jutras, S.; Marchand, S. Critical irrigation threshold and cranberry yield components. Agric. Water Manag. 2015, 148, 106–112. [Google Scholar]
  5. Pelletier, V.; Gallichand, J.; Caron, J. Effects of soil water potential threshold for irrigation on cranberry yield and water productivity. Trans. Am. Soc. Agric. Biol. Eng. 2013, 56, 1325–1332. [Google Scholar]
  6. Caron, J.; Pepin, S.; Bonin, S. Determination of irrigation set points for cranberries from soil and plant-based measurements. Can. J. Soil Sci. 2015. accepted. [Google Scholar]
  7. Hattendorf, M.J.; Davenport, J.R. Cranberry evapotranspiration. Hort Sci. 1996, 31, 334–337. [Google Scholar]
  8. Bland, W.L.; Loew, J.T.; Norman, J.M. Evaporation from cranberry. Agric. For. Meteorol. 1996, 81, 1–12. [Google Scholar]
  9. Laurent, T. Réponse de la canneberge (Vaccinium macrocarpon Ait.) à l’aération du sol. Master’s Thesis, Université Laval, Québec, QC, Canada, 2014. [Google Scholar]
  10. Elmi, A.; Madramootoo, C.; Handyside, P.; Dodds, G. Water requirements and subirrigation technology design criteria for cranberry production in Quebec, Canada. Can. Biosyst. Eng. 2010, 52, 1–8. [Google Scholar]
  11. Gumiere, S.J.; Lafond, J.A.; Hallema, D.W.; Périard, Y.; Caron, J.; Gallichand, J. Mapping soil hydraulic conductivity and matric potential for water management of cranberry: Characterisation and spatial interpolation methods. Biosyst. Eng. 2014, 128, 29–40. [Google Scholar]
  12. Mailhot, A.; Kingumbi, A.; Talbot, G.; Poulin, A. Future changes in intensity and seasonal pattern of occurrence of daily and multi-daily annual maximum precipitation over Canada. J. Hydrol. 2010, 388, 173–185. [Google Scholar]
  13. Samson, M.-E.; Caron, J.; Fortin, J. Impacts of low water potential on soil salinity and its effects on cranberry development. In Proceedings of North American Cranberry Researchers and Extension Workers Conference, Quebec City, QC, Canada, 25–28 August 2013.
  14. Madramootoo, C.A.; Helwig, T.G.; Dodds, G.T. Managing water tables to improve drainage water quality in Quebec, Canada. Trans. Am. Soc. Eng. 2001, 44, 1511–1519. [Google Scholar]
  15. Evans, R.O.; Gilliam, J.W.; Skaggs, R.W. Controlled Drainage Management Guidelines for Improving Drainage Water Quality. Available online: http://www.bae.ncsu.edu/programs/extension/evans/ag443.html (accessed on 21 May 2015).
  16. Baumann, D.L.; Workmaster, B.A.; Kosola, K.R. ‘Ben Lear’ and ‘Stevens’ cranberry root and shoot growth response to soil water potential. HortScience 2005, 40, 795–798. [Google Scholar]
  17. Hall, I.V. Cranberry growth as related to water levels in the soils. Can. J. Plant Sci. 1971, 51, 237–238. [Google Scholar]
  18. Handyside, P. Water Table Management for Cranberry Production on Sandy Soil and Peat Soils in Québec. Master’s Thesis, McGill University, Montréal, QC, Canada, 2003. [Google Scholar]
  19. Eck, P. Cranberry growth and production in relation to water table depth. J. Am. Soc. Hortic. Sci. 1976, 101, 544–546. [Google Scholar]
  20. Fuleki, T.; Francis, F.J. Quantitative methods for anthocyanin: Extraction and determination of total anthocyanin in cranberries. J. Food Sci. 1968, 33, 72–77. [Google Scholar]
  21. Webb, R.A. Use of the boundary line in the analysis of biological data. J. Hortic. Sci. 1972, 47, 309–319. [Google Scholar]
  22. Marchand, S.; Parent, S.-E.; Deland, J.-P.; Parent, L.-E. Nutrient signature of Quebec (Canada) cranberry (Vaccinium macrocarpon Ait.). Rev. Bras. Frutic. 2013, 35, 292–304. [Google Scholar]
  23. Brown, A.O.; McNeil, J.N. Fruit production in cranberry (Ericaceae: Vaccinium macrocarpon): A bet-hedging strategy tooptimize reproductive effort. Am. J. Bot. 2006, 93, 910–916. [Google Scholar]
  24. Birrenkott, B.A.; Henson, C.A.; Stang, E.J. Carbohydrate levels and the development of fruit in cranberry. J. Am. Soc. Hortic. Sci. 1991, 116, 174–178. [Google Scholar]
  25. Hagidimitriou, M.; Roper, T.R. Seasonal changes in non-structural carbohydrates in cranberry. J. Am. Soc. Hortic. Sci. 1994, 119, 1029–1033. [Google Scholar]
  26. Nemon, N.A.; von Hoyningen Huene, B.; Gallichand, J.; Broughton, R.S. Subsurface irrigation and drainage on sandy soil in Southern Quebec. Can. Agric. Eng. 1987, 29, 137–142. [Google Scholar]
  27. Nosetto, M.D.; Jobbágy, E.G.; Jackson, R.G.; Sznaider, G.A. Reciprocal influence of crops and shallow ground water in sandy landscapes of the Inland Pampas. Fields Crop Res. 2009, 113, 138–148. [Google Scholar]
  28. Madramootoo, C.A.; Dodds, G.T.; Papadopoulos, A. Agronomic and environmental benefits of water-table management. J. Irrig. Drain. Eng. 1993, 119, 1052–1065. [Google Scholar]
  29. Pitts, D.J.; Tsai, Y.J.; Myhre, D.L.; Anderson, D.L.; Shih, S.F. Influence of water table depth on sugarcane grown in sandy soils in Florida. Trans. Am. Soc. Eng. 1993, 36, 777–782. [Google Scholar]
  30. Acevedo-Opazo, C.; Ortega-Farias, S.; Fuentes, S. Effects of grapevine (Vitis vinifera L.) water status on water consumption, vegetative growth and grape quality: An irrigation scheduling application to achieve regulated deficit irrigation. Agric. Water. Manag. 2010, 97, 956–964. [Google Scholar]
  31. Song, J.; Shellie, K.C.; Wang, H.; Qian, M.C. Influence of deficit irrigation and kaolin particle film on grape composition and volatile compounds in Merlot grape (Vitis vinifera L.). Food Chem. 2012, 134, 841–850. [Google Scholar]
  32. Lanari, V.; Palliotti, A.; Sabbatini, P.; Stanley Howell, G. Optimizing deficit irrigation strategies to manage vine performance and fruit composition of field-grown ‘Sangiovese’ (Vitis vinifera L.) grapevines. Sci. Hortic. 2014, 179, 239–247. [Google Scholar]
  33. Binet, M.; Asselin, R.; Laperrière, L.; Painchaud, J. Bulletin d’information sur la production écologique de la canneberge; Groupe HBA Experts-Conseils: Saint-Hyacinthe, QC, Canada, 1997; p. 40. (In French) [Google Scholar]
  34. Sandler, H.A.; DeMoranville, C.J.; Lampinen, B. Cranberry irrigation management. Available online: http://www.umass.edu/cranberry/downloads/Irrigation.pdf (accessed on 21 May 2015).
  35. Kahlown, M.A.; Ashraf, M.; Zia-ul-Haq. Effect of shallow groundwater table on crop water requirements and crop yields. Agric. Water Manag. 2005, 76, 24–35. [Google Scholar] [CrossRef]

