
Assessment of Environmental Sustainability in Health Care Organizations

Abstract
:1. Introduction
- Group I: General, no risk.
- Group II: Sanitary, assimilated to urban.
- Group III: Sanitary, potentially infectious.
- Group IV: Bodies and human remains.
- Group V: Dangerous chemical waste.
- Group VI: Cytotoxic with carcinogenic, mutagenic and teratogenic risk.
- Group VII: Radioactive.
- Eco-Management and Audit Scheme (EMAS) or Regulation (EC) N° 761/2001, which is applied officially in member countries of the European Union.
- Standard ISO 14001:2004. Applied internationally.
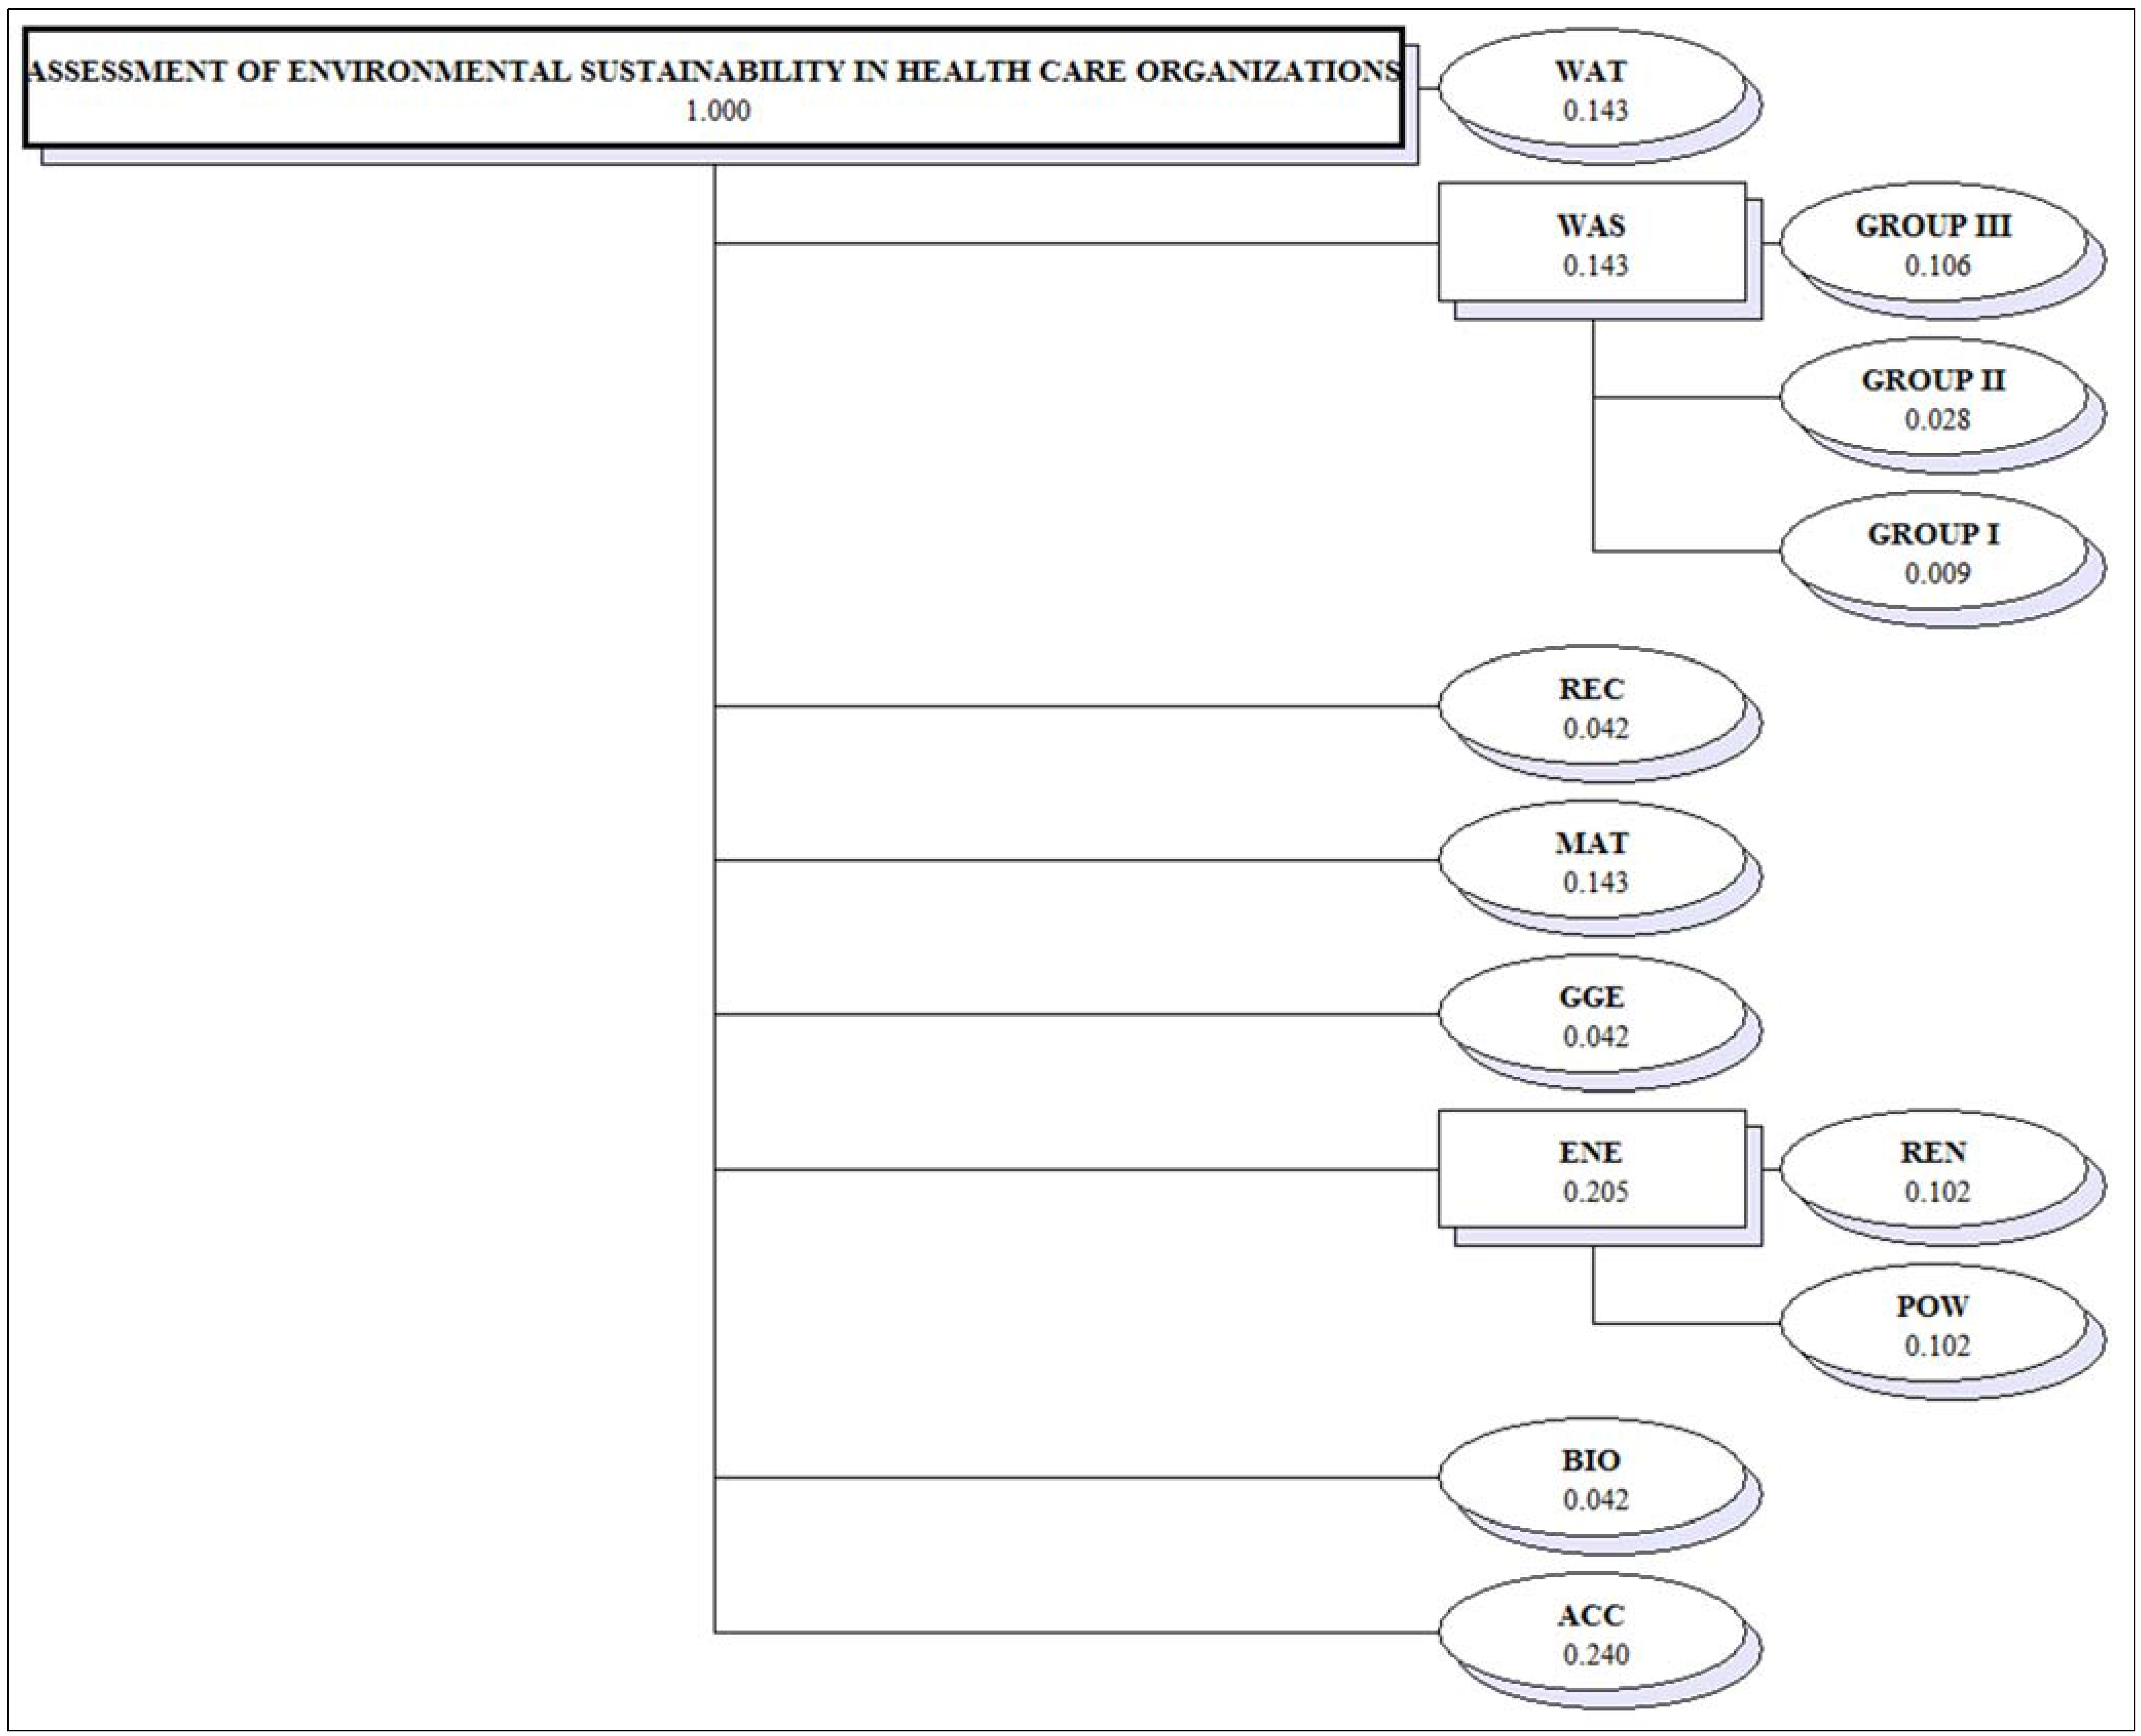
2. Multi-Criteria Model for the Assessment of Environmental Sustainability in Health Care Organizations
2.1. Structuring
- Comparability: The indicators should be comparable and reflect developments in the environmental behaviour of the HCO.
- Balance between problematic (bad) and promising (good) aspects.
- Continuity: The indicators are based on the same criteria and applied to comparable time periods.
- Currency: The indicators should be able to be measured with sufficient frequency that appropriate measure can be taken.
- Clarity: The indicators should be clear and comprehensible.
- Water consumption (WAT) (m3) [39,40,41,42,43,44,45,46,47,48,49]. Water is a natural resource essential for human activity and socio-economic development, and so control of its consumption is vital, especially in countries with water shortages due to the characteristics of their climate. For HCO it is recommended that consumption be less than the previous year.
- Energy efficiency (ENE) [45,49]. Two areas are assessed:
- (a)
- Annual consumption (MW/h) of electricity, refrigerating energy, thermal energy and natural gas (POW) [39,40,41,42,43,44,45,46,47,48]. The generation and consumption of energy from fossil fuels is a main driver of climate change and contributes to other problems of atmospheric pollution (acidification and ozone pollution of the troposphere, air quality, etc.). It is also responsible for the consumption of a large amount of resources. The improvement of insulation, introduction of new, more efficient lighting systems, optimization of natural light conditions in offices, natural ventilation, etc. can bring about a significant decrease in consumption.
- (b)
- Waste production (WAS) [39,40,41,44,46]. The annual production of waste is assessed. This is divided into subcriteria:
- (a)
- (b)
- Group II waste (GROUP II) (103 kg) [39,40,41,48,49]. This is non-specific sanitary waste derived from healthcare activity and which may come from non-contagious patients (not included in group III), and which are bound by additional handling requirements in the centre, while their handling outside the hospital is assimilated to group I waste (for example material from treatments, plaster, fungible fabrics, clothes, etc.).
- (c)
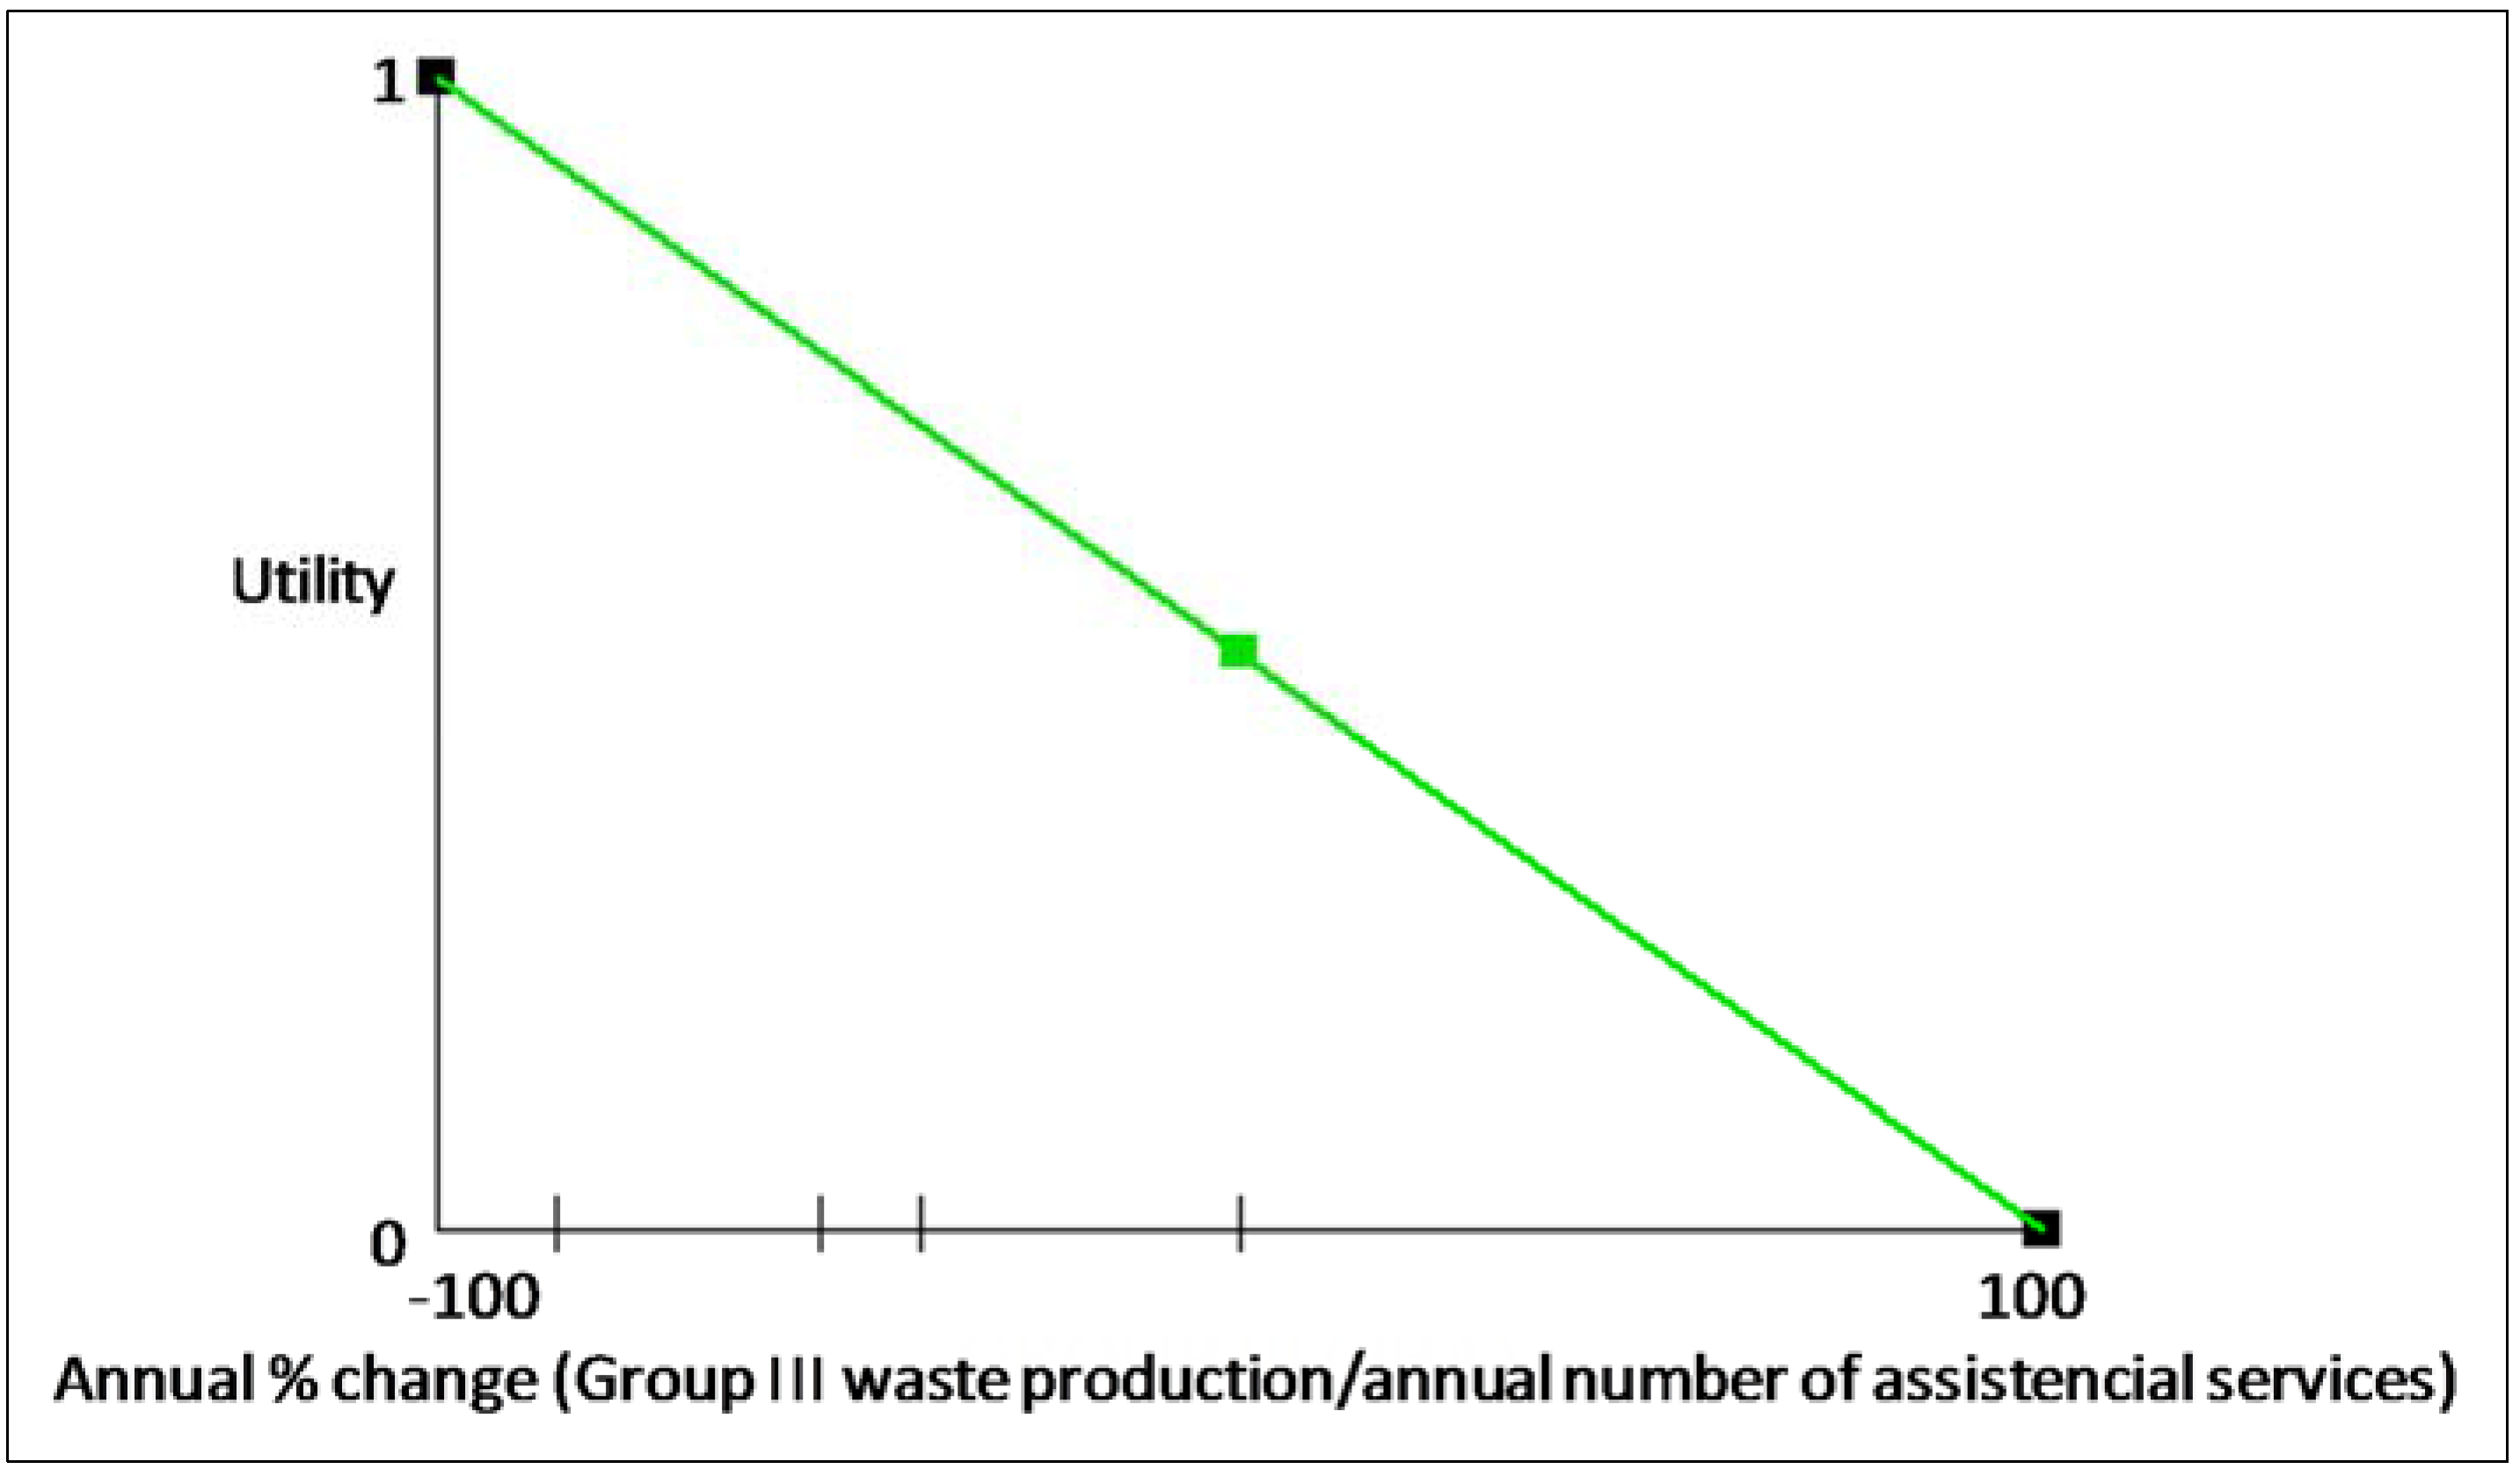
- Group III waste (GROUP III) (103 kg) [39,40,41,48,49]. This is specific sanitary waste to which special prevention measures must be applied in handling, collection, storage, transport and destruction, as they may represent a risk to staff and the public. This includes infectious sanitary waste from both humans and animals; it therefore includes pointed and sharp-edged material, blood, blood products, cultures, anatomical remains in formaldehyde, etc. It also includes other dangerous waste including industrial oils, batteries, non-halogenated solvents, contaminated containers, liquids used in radiology, out-of-date or rejected medicines, chemical waste and cytostatic waste (cytostatics are medicines which include a series of chemical substances used in radiotherapy, chemotherapy, immunotherapy, hormone therapy or associated with surgery).
- Environmental accidents (ACC) [39,40,41,49]. The existence of serious environmental accidents is assessed, such as for example the entry of uncontrolled contaminants in the sewage system, spillage of dangerous substances on the floor, leaks or spills of natural gas or petrol, mixture of dangerous substances or loss or disappearance of dangerous waste, spillage or acetylene or refrigerating gas, outbreaks of legionnaires’ disease, radiological emissions, leaks of ethylene oxide, fires, floods, etc.
- Biodiversity (BIO) [39,40,41,48,49]. The impact of an HCO on its surroundings is evaluated, that is, adaptation to the rural or forest environment, conservation of species on the endangered species lists of the International Union for Conservation of Nature (IUCN) or species listed in the national inventory of endemic or endangered species of the Spanish Ministry of Agriculture, Food and Environment, and actions carried out for the continuous improvement of the environmental impact of the organization on its surroundings are also assessed.

| Level of Performance | Scale Levels |
|---|---|
| L1 (highest level of performance) | There is complete protection of endangered species from the IUCN lists of endemic or endangered species listed by the Spanish Ministry of Agriculture, Food and Environment, or there are no species in these categories in the area affected by the activity of the HCO. The facilities of the HCO are being gradually adapted, in accordance with the ecosystem, to the rural or landscaped environment about it, or the HCO is in an urban environment. Action for continuous improvement of the environmental impact of the HCO is performed periodically (regeneration of autochthonous vegetation in areas next to the facilities, removal of invasive species, etc.). |
| L2 | There is complete protection of endangered species from the IUCN lists of endemic or endangered species listed by the Spanish Ministry of Agriculture, Food and Environment, or there are no species in these categories in the area affected by the activity of the HCO. The facilities of the HCO are being gradually adapted, in accordance with the ecosystem, to the rural or forest environment about it, or the HCO is in an urban environment. Actions to improve the environmental impact of the HCO on the environment are carried out. |
| L3 | There is complete protection of endangered species from the IUCN lists of endemic or endangered species listed by the Spanish Ministry of Agriculture, Food and Environment, or there are no species in these categories in the area affected by the activity of the HCO. There is no gradual ecosystemic adaptation of the facilities of the HCO to the rural or landscaped environment. Actions to improve the environmental impact of the HCO are carried out. |
| L4 | There is protection of endangered species from the IUCN lists of endemic or endangered species listed by the Spanish Ministry of Agriculture, Food and Environment, or there are no species in these categories in the area affected by the activity of the HCO. There is no gradual ecosystemic adaptation of the facilities of the HCO to the rural or landscaped environment. There is no action to improve the environmental impact of the organization. |
| L5 (lowest level of performance) | There is no protection of endangered species from the IUCN lists of endemic or endangered species listed by the Spanish Ministry of Agriculture, Food and Environment. There is no gradual ecosystemic adaptation of the facilities of the HCO to the rural or landscaped environment. There is no action to improve the environmental impact of the organization. |
2.2. Weighting
| Linguistic Scale | Fuzzy Number | Triangular Fuzzy Numbers | Triangular Fuzzy Reciprocal Numbers |
|---|---|---|---|
| Equally important | |||
| Judgement values between equally and moderately | |||
| Moderately more important | |||
| Judgement values between moderately and strongly | |||
| Strongly more important | |||
| Judgement values between strongly and very strongly | |||
| Very strongly more important | |||
| Judgement values between very strongly and extremely | |||
| Extremely more important |
| ACC | ENE | WAS | WAT | MAT | GGE | REC | BIO | |
|---|---|---|---|---|---|---|---|---|
| ACC | (1, 1, 1) | (1, 1, 1) | (1, 2, 3) | (1, 2, 3) | (1, 2, 3) | (2, 3, 4) | (2, 3, 4) | (2, 3, 4) |
| ENE | (1, 1, 1) | (1, 1, 1) | (1, 2, 3) | (1, 2, 3) | (1, 2, 3) | (1, 2, 3) | (1, 2, 3) | (1, 2, 3) |
| WAS | (1/3, 1/2, 1) | (1/3, 1/2, 1) | (1, 1, 1) | (1, 1, 1) | (1, 1, 1) | (1, 2, 3) | (1, 2, 3) | (1, 2, 3) |
| WAT | (1/3, 1/2, 1) | (1/3, 1/2, 1) | (1, 1, 1) | (1, 1, 1) | (1, 1, 1) | (1, 2, 3) | (1, 2, 3) | (1, 2, 3) |
| MAT | (1/3, 1/2, 1) | (1/3, 1/2, 1) | (1, 1, 1) | (1, 1, 1) | (1, 1, 1) | (1, 2, 3) | (1, 2, 3) | (1, 2, 3) |
| GCE | (1/4, 1/3, 1/2) | (1/3, 1/2, 1) | (1/3, 1/2, 1) | (1/3, 1/2, 1) | (1/3, 1/2, 1) | (1, 1, 1) | (1, 1, 1) | (1, 1, 1) |
| REC | (1/4, 1/3, 1/2) | (1/3, 1/2, 1) | (1/3, 1/2, 1) | (1/3, 1/2, 1) | (1/3, 1/2, 1) | (1, 1, 1) | (1, 1, 1) | (1, 1, 1) |
| BIO | (1/4, 1/3, 1/2) | (1/3, 1/2, 1) | (1/3, 1/2, 1) | (1/3, 1/2, 1) | (1/3, 1/2, 1) | (1, 1, 1) | (1, 1, 1) | (1, 1, 1) |
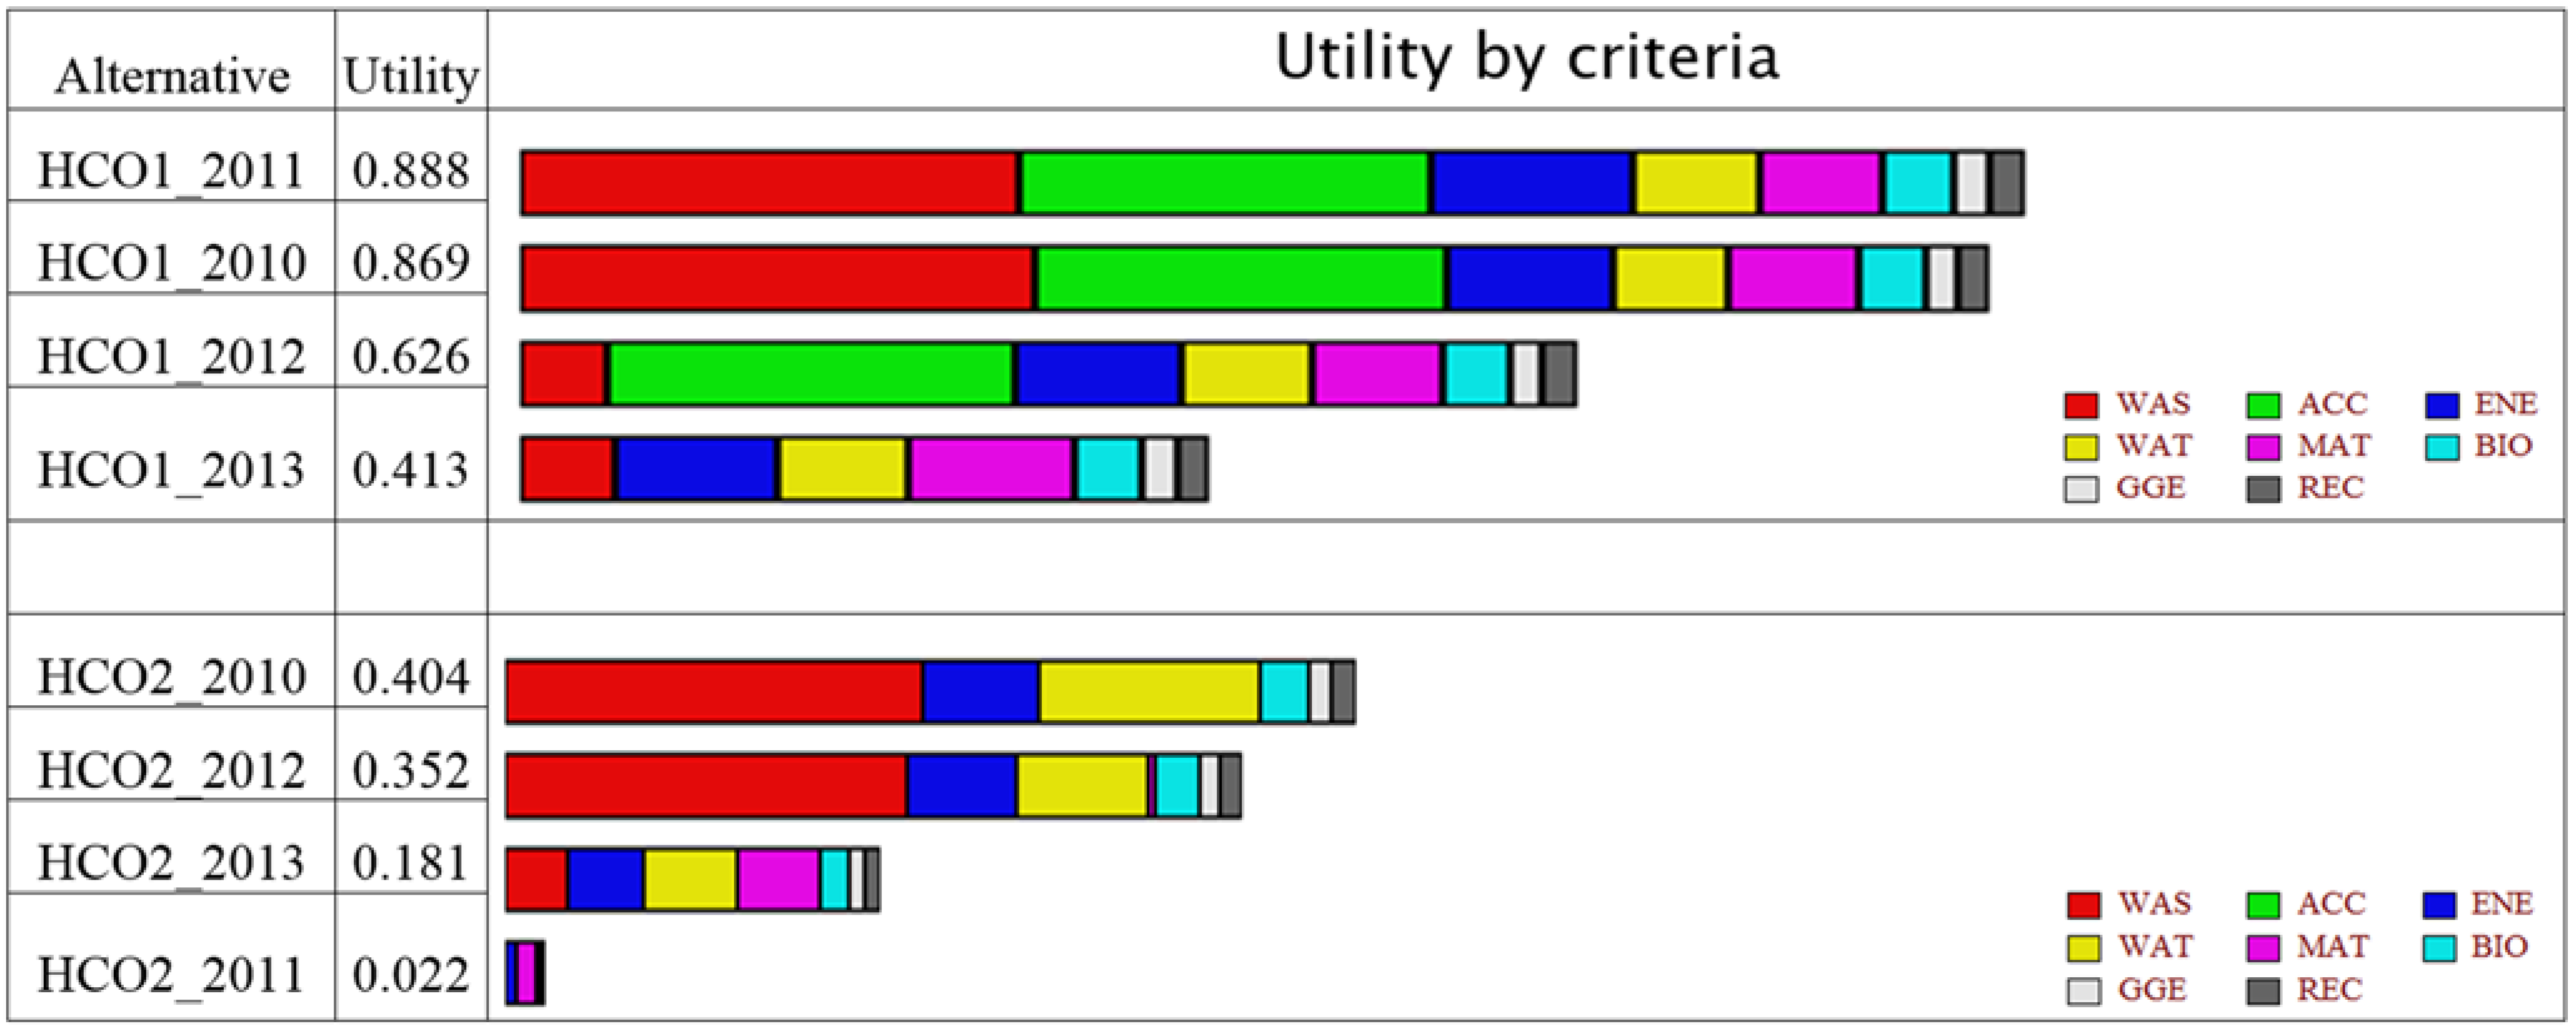
3. Results

4. Conclusions
Acknowledgments
Conflicts of Interest
References
- Comunidad de Madrid. Guía Para la Implantación de Sistemas de Gestión Medioambiental en Centros Hospitalarios; Dirección General de Promoción y Disciplina Ambiental: Madrid, Spain, 2005. (In Spanish) [Google Scholar]
- Hsu, C.W.; Hu, A.H. Green supply chain management in the electronic industry. Int. J. Environ. Sci. Technol. 2008, 5, 205–216. [Google Scholar] [CrossRef]
- Lamelas, M.T.; Marinoni, O.; Hoppe, A.; de la Riva, J. Suitability analysis for sand and gravel extraction site location in the context of a sustainable development in the surroundings of Zaragoza (Spain). Environ. Geol. 2008, 55, 1673–1686. [Google Scholar] [CrossRef]
- Tseng, M.L.; Lin, Y.H.; Chiu, A.S.F. Fuzzy AHP-based study of cleaner production implementation in Taiwan PWB manufacturer. J. Clean. Prod. 2009, 17, 1249–1256. [Google Scholar] [CrossRef]
- Liang, Z.H.; Yang, K.; Sun, Y.W.; Yuan, J.H.; Zhang, H.W.; Zhang, Z.Z. Decision support for choice optimal power generation projects: Fuzzy comprehensive evaluation model based on the electricity market. Energy Policy 2006, 34, 3359–3364. [Google Scholar] [CrossRef]
- Pilavachi, P.A.; Chatzipanagi, A.I.; Spyropoulou, A.I. Evaluation of hydrogen production methods using the analytic hierarchy process. Int. J. Hydrog. Energy 2009, 34, 5294–5303. [Google Scholar] [CrossRef]
- Tzeng, G.H.; Lin, C.W.; Opricovic, S. Multi-criteria analysis of alternative-fuel buses for public transportation. Energy Policy 2005, 33, 1373–1383. [Google Scholar] [CrossRef]
- Van Calker, K.J.; Berentsen, P.B.M.; Romero, C.; Giesen, G.W.J.; Huirne, R.B.M. Development and application of a multi-attribute sustainability function for Dutch dairy farming systems. Ecol. Econ. 2006, 57, 640–658. [Google Scholar] [CrossRef]
- Aragonés-Beltrán, P.; Mendoza-Roca, J.A.; Bes-Piá, A.; García-Melón, M.; Parra-Ruiz, E. Application of multicriteria decision analysis to jar-test results for chemicals selection in the physical-chemical treatment of textile wastewater. J. Hazard. Mater. 2009, 164, 288–295. [Google Scholar] [CrossRef] [PubMed]
- Vintró, C.; Sanmiquel, L.; Freijo, M. Environmental sustainability in the mining sector: Evidence from Catalan companies. J. Clean. Prod. 2014, 84, 155–163. [Google Scholar] [CrossRef] [Green Version]
- Word Health Organization. Desechos de las Actividades de Atención Sanitaria. Available online: http://www.who.int/mediacentre/factsheets/fs253/es/ (accessed on 8 July 2014). (In Spanish)
- Morales, M.; García, S.; Llopis, A. Análisis de los sistemas de gestión medioambiental en la red hospitalaria del sistema nacional de salud: Estado actual. In Proceedings of the Spanish Congress of Environment, Madrid, Spain, 26–30 November 2012. (In Spanish)
- Huang, I.B.; Keisler, J.; Linkov, I. Multi-criteria decision analysis in environmental sciences: Ten years of applications and trends. Sci. Total Environ. 2011, 409, 3578–3594. [Google Scholar] [CrossRef] [PubMed]
- Munda, G.; Nijkamp, P.; Rietveld, P. Qualitative multicriteria evaluation for environmental management. Ecol. Econ. 1994, 10, 97–112. [Google Scholar] [CrossRef]
- Munda, G. Measuring sustainability: A multi-criterion framework. Environ. Dev. Sustain. 2005, 2, 117–134. [Google Scholar] [CrossRef]
- Egilmez, G.; Gumus, S.; Kucukvar, M. Enviromental sustainability benchmarking of the U.S. and Canada metropoles: An expert judgment-based multi-criteria decision making approach. Cities 2015, 42, 31–41. [Google Scholar] [CrossRef]
- Carnero, M.C. Model for Sustainability in Health Care Organizations. In Encyclopedia of Business Analytics and Optimization, 1st ed.; Wang, J., Ed.; IGI Global: Hershey, PA, USA, 2014; Volume 3, pp. 437–456. [Google Scholar]
- Isaai, M.T.; Kanani, A.; Tootoonchi, M.; Afzali, H.R. Intelligent timetable evaluation using fuzzy AHP. Expert Syst. Appl. 2011, 38, 3718–3723. [Google Scholar] [CrossRef]
- SeongKon, L.; Gento, M.; SangKon, L.; JongWook, K. Prioritizing the weights of hydrogen energy technologies in the sector of the hydrogen economy by using a fuzzy AHP approach. Int. J. Hydrog. Energy 2011, 36, 1897–1902. [Google Scholar]
- Bozbura, F.T.; Beskese, A.; Kahraman, C. Prioritization of human capital measurement indicators using fuzzy AHP. Expert Syst. Appl. 2007, 32, 1100–1112. [Google Scholar] [CrossRef]
- Liberatore, M.J.; Nydick, R.L. The analytic hierarchy process in medical and health care decision making: A literature review. Eur. J. Oper. Res. 2003, 189, 194–207. [Google Scholar] [CrossRef]
- Gumus, A.T. Evaluation of hazardous waste transportation firms by using a two step fuzzy AHP and TOPSIS methodology. Expert Syst. Appl. 2009, 36, 4067–4074. [Google Scholar] [CrossRef]
- Heo, E.; Kim, J.; Boo, K.J. Analysis of the assessment factors for renewable energy dissemination program evaluation using fuzzy AHP. Renew. Sustain. Energy Rev. 2010, 14, 2214–2220. [Google Scholar] [CrossRef]
- Kaya, T.; Kahraman, C. An integrated fuzzy AHP–ELECTRE methodology for environmental impact assessment. Expert Syst. Appl. 2011, 38, 8553–8562. [Google Scholar] [CrossRef]
- Reza, B.; Sadiq, R.; Hewage, K. Sustainability assessment of flooring systems in the city of Tehran: An AHP-based life cycle analysis. Constr. Build. Mater. 2011, 25, 2053–2066. [Google Scholar] [CrossRef]
- Chan, H.K.; Wang, X.; Raffoni, A. An integrated approach for green design: Life-cycle, fuzzy AHP and environmental management accounting. Procedia Soc. Behav. Sci. 2012, 57, 236–242. [Google Scholar] [CrossRef]
- Boran, F.E.; Boran, K.; Menlik, T. The evaluation of renewable energy technologies for electricity generation in Turkey using intuitionistic fuzzy TOPSIS. Energy Sources Part B 2012, 7, 81–90. [Google Scholar] [CrossRef]
- Wang, X.; Chan, H.K.; Yee, R.W.Y.; Diaz-Rainey, I. A two-stage fuzzy AHP model for risk assessment of implementing green initiatives in the fashion supply chain. Int. J. Prod. Econ. 2012, 135, 595–606. [Google Scholar] [CrossRef]
- Larimian, T.; Zarabadi, Z.S.S.; Sadeghi, A. Developing a fuzzy AHP model to evaluate environmental sustainability from the perspective of Secured by Design scheme—A case study. Sustain. Cities Soc. 2013, 7, 25–36. [Google Scholar] [CrossRef]
- Vinodh, S.; Prasanna, M.; Prakash, N.H. Integrated fuzzy AHP-TOPSIS for selecting the best plastic recycling method: A case study. Appl. Math. Model. 2014, 38, 4662–4672. [Google Scholar] [CrossRef]
- Pourebrahim, S.; Hadipour, M.; Mokhtar, M.B.; Taghavi, S. Application of VIKOR and fuzzy AHP for conservation priority assessment in coastal areas: Case of Khuzestan district, Iran. Ocean Coast. Manag. 2014, 98, 20–26. [Google Scholar] [CrossRef]
- Simane, B.; Zaitchik, B.F. The Sustainability of Community-Based Adaptation Projects in the Blue Nile Highlands of Ethiopia. Sustainability 2014, 6, 4308–4325. [Google Scholar] [CrossRef]
- Markelj, J.; Kuzman, M.K.; Grošelj, P.; Zbašnik-Senegačnik, M. A Simplified Method for Evaluating Building Sustainability in the Early Design Phase for Architects. Sustainability 2014, 6, 8775–8795. [Google Scholar] [CrossRef]
- Matsuura, T.; Sugimura, K.; Miyamoto, A.; Tanaka, N. Knowledge-Based Estimation of Edible Fern Harvesting Sites in Mountainous Communities of Northeastern Japan. Sustainability 2014, 6, 175–192. [Google Scholar] [CrossRef]
- Salvado, M.F.; Azevedo, S.G.; Matias, J.C.O.; Ferreira, L.M. Proposal of a Sustainability Index for the Automotive Industry. Sustainability 2015, 7, 2113–2144. [Google Scholar] [CrossRef]
- Galvez, D.; Rakotondranaivo, A.; Morel, L.; Camargo, M.; Fick, M. Reverse logistics network design for a biogas plant: An approach based on MILP optimization and Analytical Hierarchical Process (AHP). J. Manuf. Syst. 2015. [Google Scholar] [CrossRef]
- Chang, D.Y. Applications of the extent analysis method on fuzzy AHP. Eur. J. Oper. Res. 1996, 95, 649–655. [Google Scholar] [CrossRef]
- Kaufmann, A.; Gupta, M.M. Fuzzy Mathematical Models in Engineering and Management Science, 1st ed.; North Holland: Amsterdam, The Netherlands, 1988. [Google Scholar]
- Hospital Galdakao-Usansolo, Declaración Ambiental. Ejercicio 2010. Available online: http://www.osakidetza.euskadi.net/v19-hgalhome/es (accessed on 16 March 2015). (In Spanish)
- Hospital Galdakao-Usansolo, Declaración Ambiental. Ejercicio 2011. Available online: http://www.hospitalgaldakao-usansolo.com (accessed on 16 March 2015). (In Spanish)
- Hospital Galdakao-Usansolo, Declaración Ambiental. Ejercicio 2012. Available online: http://www.hospitalgaldakao-usansolo.com (accessed on 16 March 2015). (In Spanish)
- García, J.A.; Sierra, S.; Giordani, V.; Gutiérrez, F.J.; Márquez, M.; Casañas, R.; Pachón, L.; Triano, N.; García, M.; Vázquez, I.; et al. Declaración Ambiental EP Hospital Costa del Sol; Consejería de Salud de la Junta de Andalucía: Málaga, Spain, 2010. (In Spanish) [Google Scholar]
- Mata, F.; García, J.A.; Sierra, S.; Giordani, V.; Gutiérrez, F.J.; Márquez, M.; Casañas, R.; Pachón, L.; Triano, N.; Rodríguez, M.; et al. Declaración Ambiental EP Hospital Costa del Sol; Consejería de Salud de la Junta de Andalucía: Málaga, Spain, 2011. (In Spanish) [Google Scholar]
- Rodríguez, E.; Carmona, M.; Soto, J. Memoria sostenibilidad del hospital clínico San Carlos; Hospital Clínico San Carlos: Madrid, Spain, 2005. [Google Scholar]
- Tejedor, J. Declaración Ambiental Enero de 2011-Diciembre de 2011, hm Hospitales. Available online: http://www.hmhospitales.com/grupohm/Paginas/HMHospitales.aspx (accessed on 16 March 2015).
- Hospital Universitario de Cruces. Memoria de Responsabilidad Social Corporativa. Available online: http://www.hospitalcruces.com/memoriaDinamica/Memoria_RSC_HUC_2012v3.pdf (accessed on 16 March 2015).
- Tejedor, J. HM Hospitales. Declaración Ambiental Enero—Diciembre de 2012. Available online: http://www.hmhospitales.com/grupohm/hmhospitales/Documents/Declaración ambiental validada.pdf (accessed on 27 April 2015).
- Consorcio Hospital General Universitario de Valencia. Memoria de sostenibilidad 2007; Consorcio Hospital General Universitario de Valencia: Valencia, Spain, 2007. (In Spanish) [Google Scholar]
- Fundación Hospital Calahorra. Declaración Ambiental DM_2009. Available online: http://fhcalahorra.com/files/doc/declaracion-ambiental.pdf (accessed on 16 March 2015). (In Spanish)
- Arriarán, J.A. RES Guide for European Hospitals. Gorliz Hospital. November 2013. Available online: http://www.res-hospitals.eu (accessed on 17 July 2014).
- Keeney, R.L. Value-focused Thinking: A Path to Creative Decision making; Harvard University Press: Cambridge, MA, USA, 1996. [Google Scholar]
- Bana e Costa, C.A.; Carvalho, R. Assigning priorities for maintenance, repair and refurbishment in managing a municipal housing stock. Eur. J. Oper. Res. 2002, 138, 380–391. [Google Scholar] [CrossRef]
- Keeney, L.; Raiffa, H. Decisions with Multiple Objectives: Preferences and Value Tradeoffs; Wiley: New York, NY, USA, 1976. [Google Scholar]
- Zhu, K.J.; Jing, Y.; Chang, D.Y. A discussion on extent analysis method and applications of fuzzy AHP. Eur. J. Oper. Res. 1999, 116, 450–456. [Google Scholar] [CrossRef]
- Meixner, O. Fuzzy AHP group decision analysis and its application for the evaluation of energy sources. In Proceedings of the 10th International Symposium on the Analytic Hierarchy/Network Process, Pittsburgh, PA, USA, 29 July–1 August 2009; University of Pittsburgh: Pittsburgh, PA, USA, 2009. [Google Scholar]
- Saaty, T.L. The Analytic Hierarchy Process, 1st ed.; McGraw Hill: New York, NY, USA, 1980. [Google Scholar]
- Saaty, T.L. Decision Making with Dependence and Feedback: The Analytic Network Process, 1st ed.; RWS Publications: Pittsburgh, PA, USA, 2001. [Google Scholar]
- Resines, E.; Arriarán, J.A.; Gómez, E.; Altuna, A.; Gárate, S.; Herrero, J.A. Un rayo de luz para la eficiencia energética del hospital. In Proceedings of the VI Spanish Simposium Of Environment Management In Health Care Organizations, La Coruña, Spain, 24–25 January 2013.
- Altuna, A.; Arriarán, J.A.; Gómez, E.; Resines, E.; Gárate, S.; Miñika, M.E. Huella de carbono: Una apuesta firme de lucha contra el cambio climático. In Proceedings of the VI Spanish Simposium of Environment Management in Health Care Organizations, La Coruña, Spain, 24–25 January 2013. (In Spanish)
- León, C.; Gómez, E.; Herrero, J.A.; Acaiturri, M.T.; Altuna, A.; Gárate, S. Gestión de compras en un hospital verde. In Proceedings of the VI Spanish Simposium of Environment Management in Health Care Organizations, La Coruña, Spain, 24–25 January 2013. (In Spanish)
- Llorente, A.; Altuna, A.; Goicuria, A.; Gárate, S.; Resines, E.; León, C. Despliegue del plan de formación medioambiental. In Proceedings of the VI Spanish Simposium of Environment Management in Health Care Organizations, La Coruña, Spain, 24–25 January 2013.
- The RES-Hospitals Project Consortium. Summary Report of the RES-HOSPITALS Project. Available online: http://www.res-hospitals.eu/ (accessed on 17 July 2014).
© 2015 by the authors; licensee MDPI, Basel, Switzerland. This article is an open access article distributed under the terms and conditions of the Creative Commons Attribution license (http://creativecommons.org/licenses/by/4.0/).
Share and Cite
Carnero, M.C. Assessment of Environmental Sustainability in Health Care Organizations. Sustainability 2015, 7, 8270-8291. https://doi.org/10.3390/su7078270
Carnero MC. Assessment of Environmental Sustainability in Health Care Organizations. Sustainability. 2015; 7(7):8270-8291. https://doi.org/10.3390/su7078270
Chicago/Turabian StyleCarnero, María Carmen. 2015. "Assessment of Environmental Sustainability in Health Care Organizations" Sustainability 7, no. 7: 8270-8291. https://doi.org/10.3390/su7078270
APA StyleCarnero, M. C. (2015). Assessment of Environmental Sustainability in Health Care Organizations. Sustainability, 7(7), 8270-8291. https://doi.org/10.3390/su7078270