
Effect of Agricultural Feedstock to Energy Conversion Rate on Bioenergy and GHG Emissions


Abstract
:1. Introduction
2. Literature Review
3. Modeling Background
- Greenhouses emissions arise from related agricultural activities.
- Market responses and welfare implications.
3.1. Multiple Greenhouse Gases Implications
3.2. Market Responses and Welfare Implications
4. Model Structure
4.1. Formulation of Agricultural Sector Model
4.2. Modification of Taiwan Agricultural Sector Model (TASM)
4.3. Scenario Setup
5. Result

| Case 1 | Case 2 | Case 3 | Case 4 | |
|---|---|---|---|---|
| Gasoline price | NT 25/L | NT 25/L | NT 25/L | NT 25/L |
| Coal price | NT 1.7/kg | NT 1.7/kg | NT 1.7/kg | NT 1.7/kg |
| GHG price | NT 150/Ton | NT300/Ton | NT 450/Ton | NT 900/Ton |
| Ethanol Production (Per 1000 Liters) | ||||
| Base conversion rate | 174,575 | 156,000 | 156,000 | 130,000 |
| 90% conversion rate | 156,000 | 152,096 | 144,700 | 130,000 |
| 80% conversion rate | 130,287 | 127,547 | 127,784 | 5200 |
| 70% conversion rate | 127,897 | 106,147 | 103,151 | 5200 |
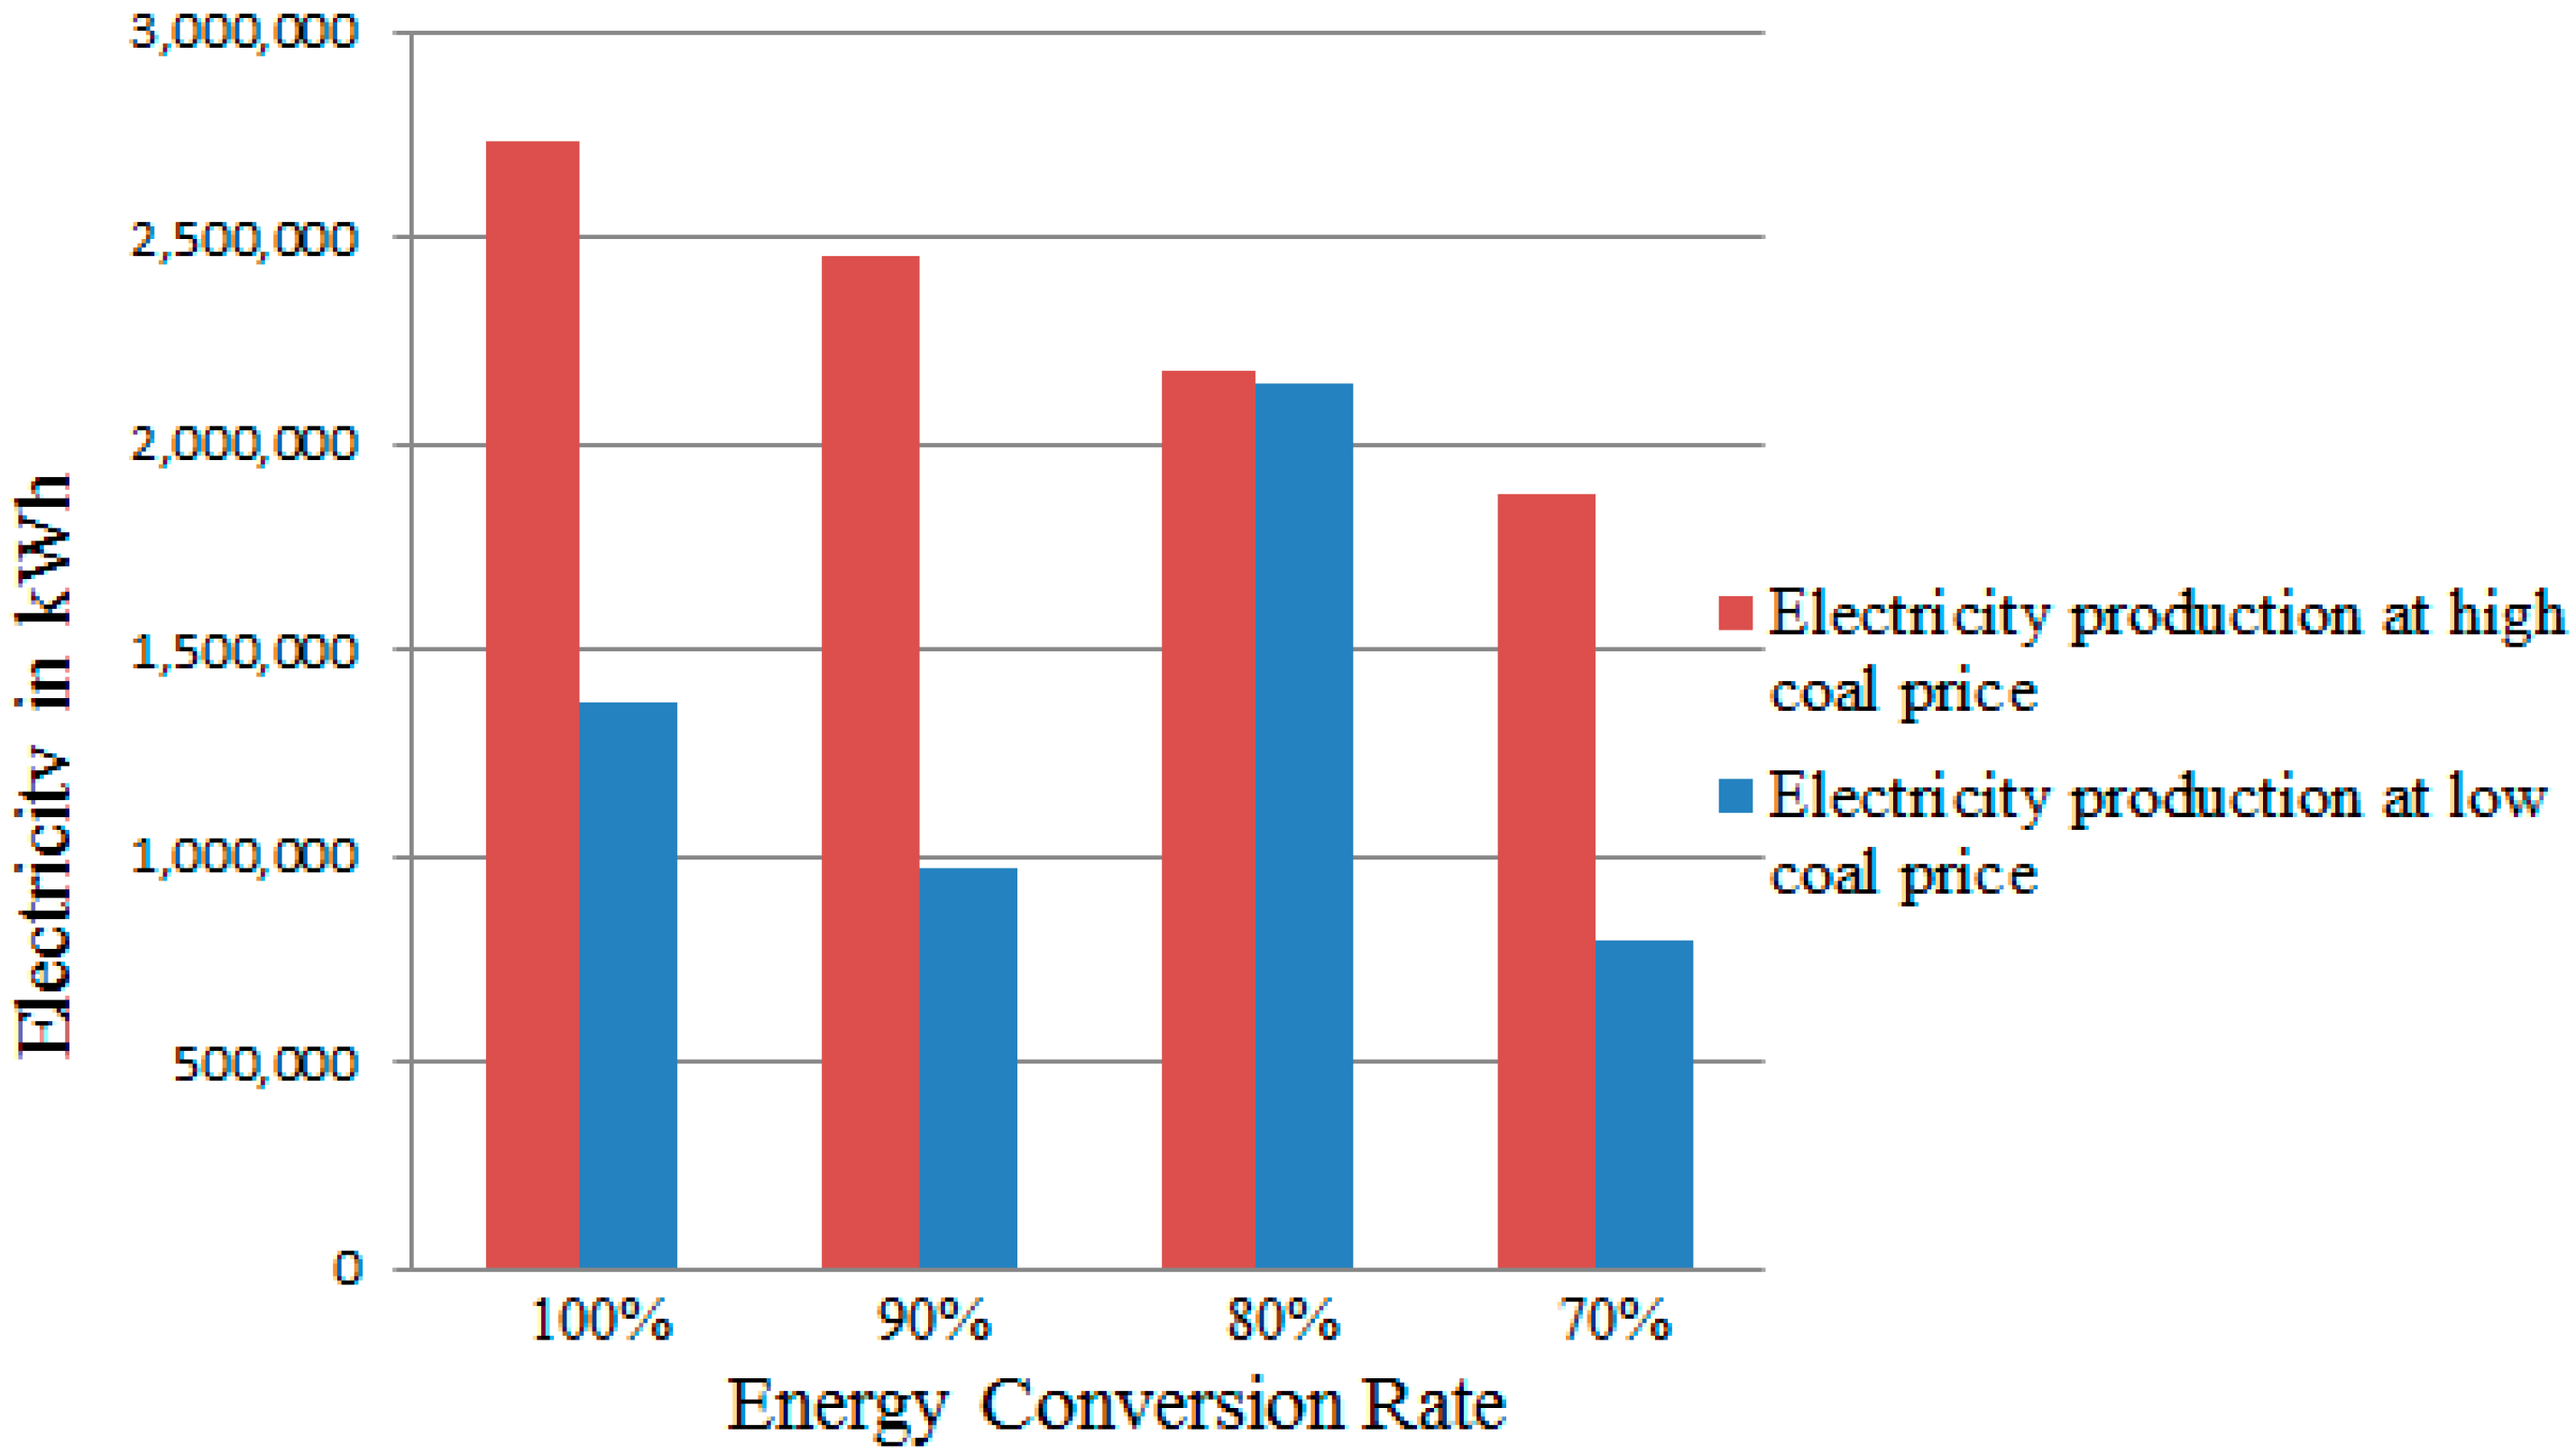
| Gasoline Price | NT 25/L | NT 25/L | NT 25/L | NT 25/L |
|---|---|---|---|---|
| Coal price | NT 1.7/kg | NT 1.7/kg | NT 1.7/kg | NT 1.7/kg |
| GHG price | NT 150/Ton | NT 300/Ton | NT 450/Ton | NT 900/Ton |
| Unit | 1000 kWh | 1000 kWh | 1000 kWh | 1000 kWh |
| Base conversion rate | 773,500 | 997,544 | 1,006,157 | 1,369,776 |
| 90% conversion rate | 773,500 | 773,500 | 77,3500 | 973,125 |
| 80% conversion rate | 773,500 | 773,500 | 773,500 | 2,145,293 |
| 70% conversion rate | 773,500 | 773,500 | 773,500 | 794,237 |

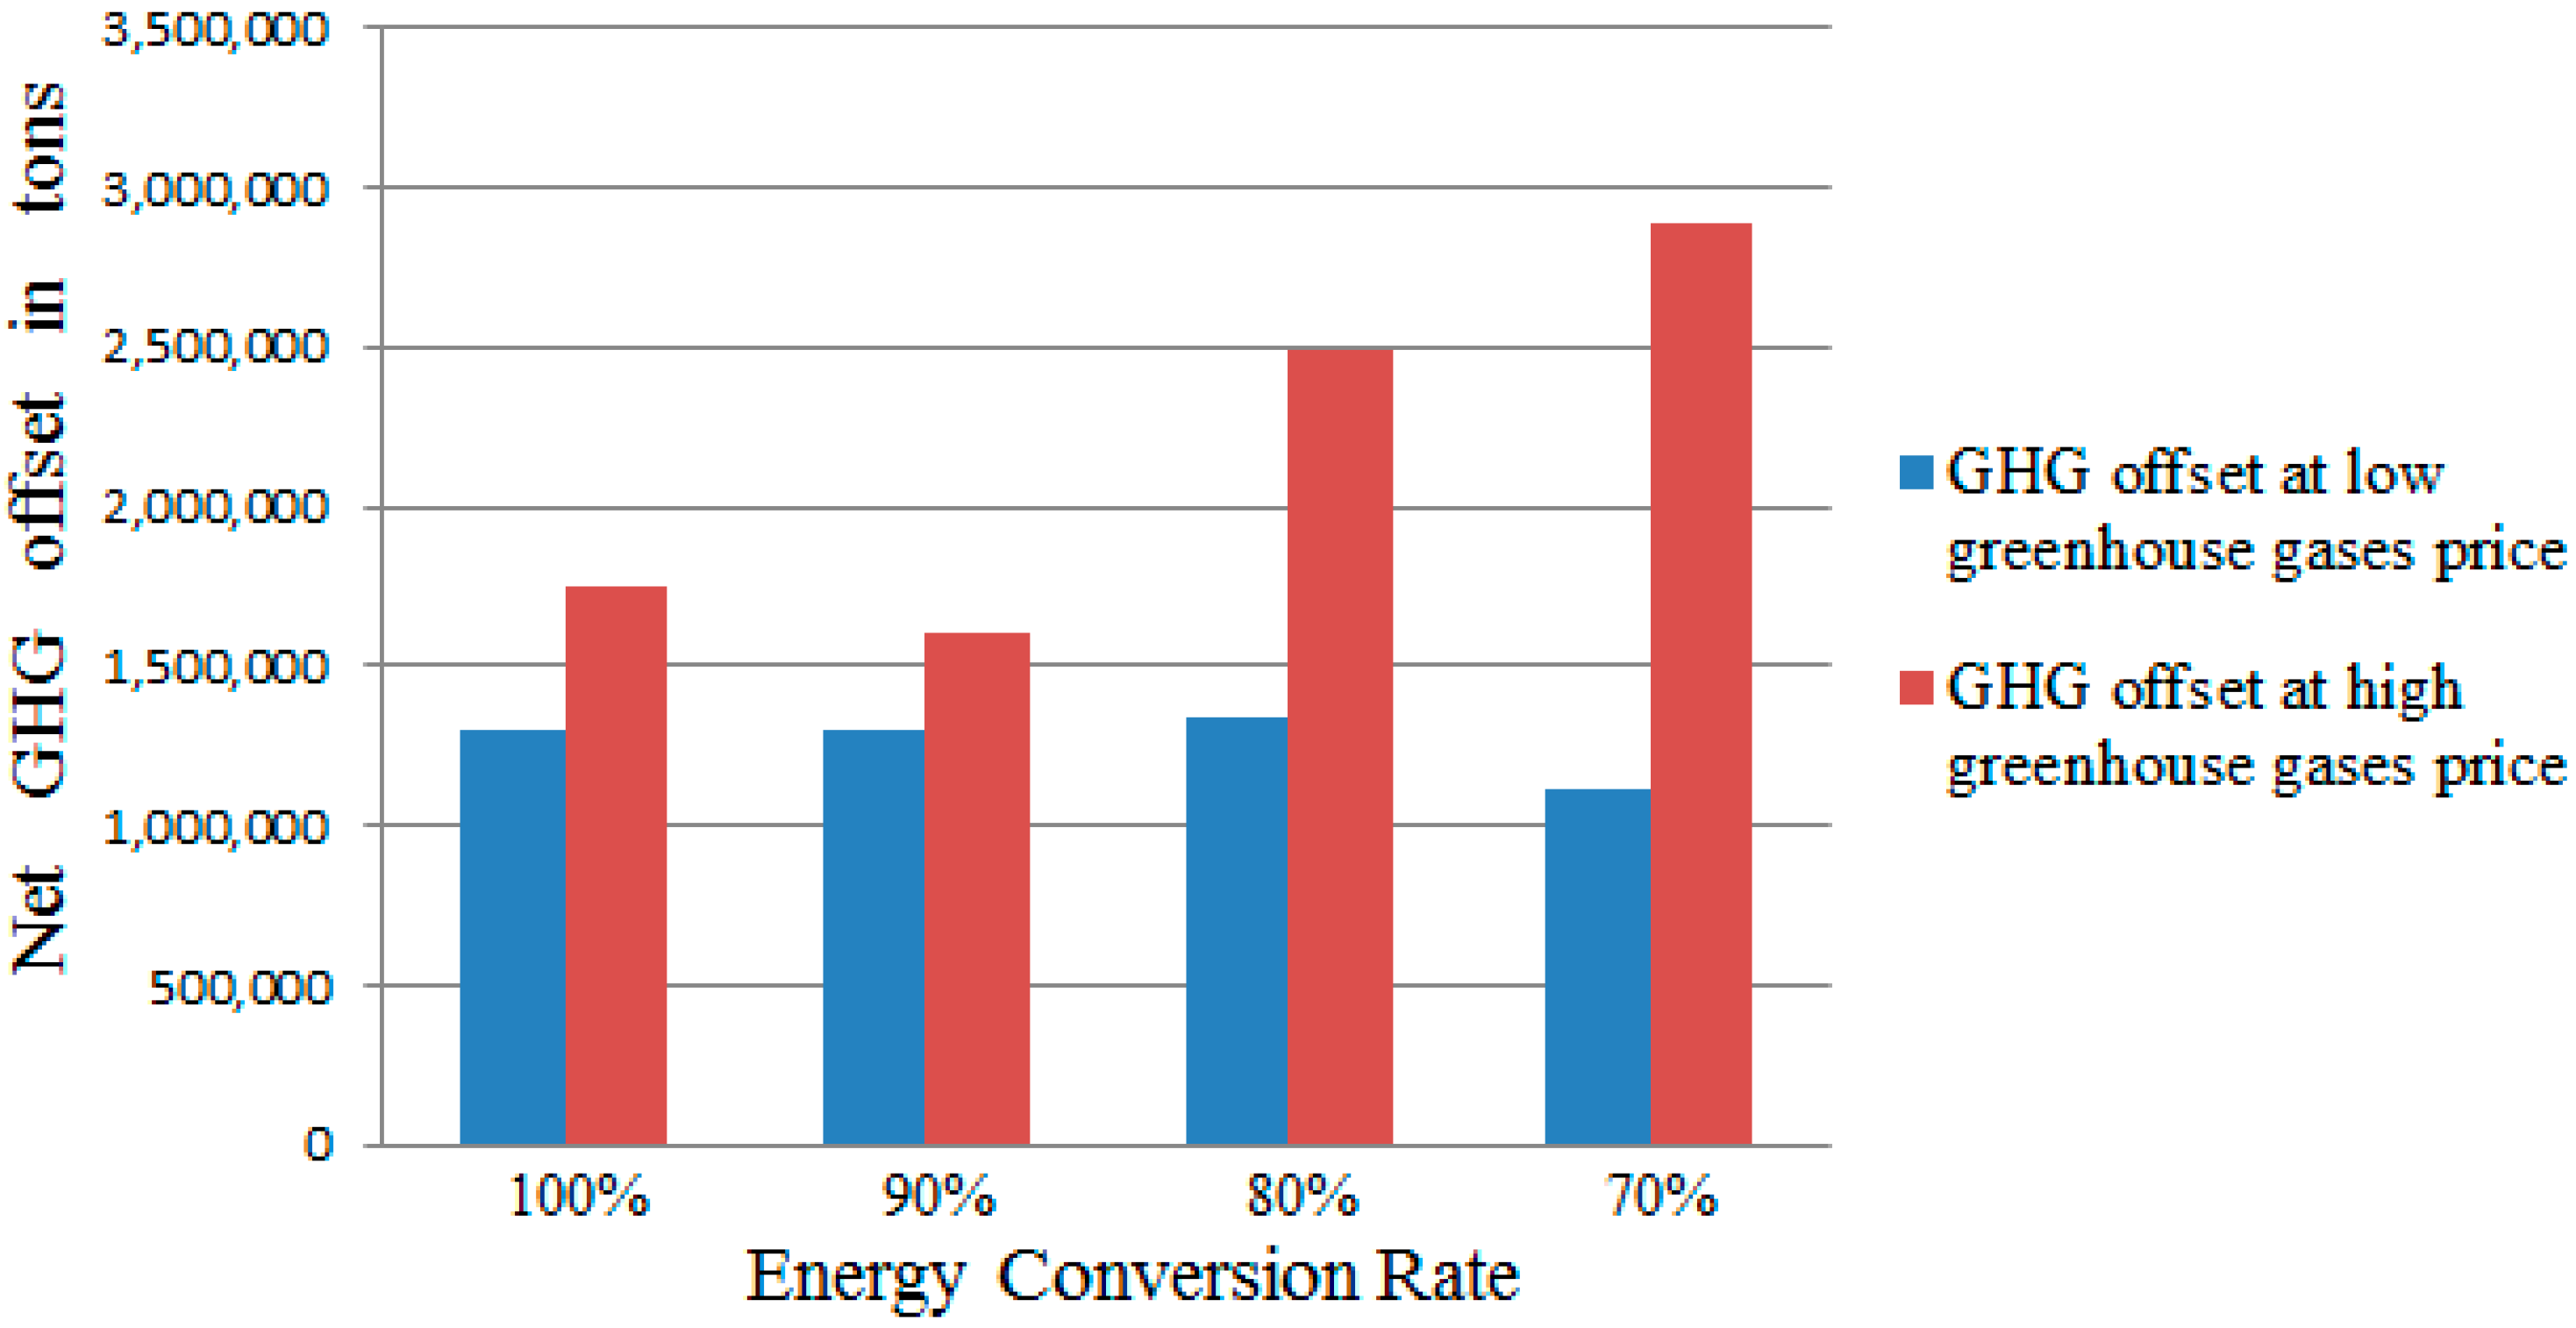
| Gasoline price | NT 25/L | NT 25/L | NT 25/L | NT 25/L |
|---|---|---|---|---|
| Coal price | NT 1.7/kg | NT 1.7/kg | NT 1.7/kg | NT 1.7/kg |
| GHG price | NT 150/Ton | NT 300/Ton | NT 450/Ton | NT 900/Ton |
| Unit | Tons | Tons | Tons | Tons |
| Base conversion rate | 1,298,321 | 1,424,429 | 1,428,195 | 1,748,942 |
| 90% conversion rate | 1,300,278 | 1,345,735 | 1,417,478 | 1,605,944 |
| 80% conversion rate | 1,332,497 | 1,406,502 | 1,408,449 | 2,491,151 |
| 70% conversion rate | 1,112,474 | 1,445,595 | 1,482,385 | 2,891,650 |

6. Concluding Remarks
Acknowledgments
Author Contributions
Conflicts of Interest
References
- McCarl, B.A.; Spreen, T.H. Price endogenous mathematical programming as a tool for sector analysis. Am. J. Agric. Econ. 1980, 62, 87–102. [Google Scholar] [CrossRef]
- McCarl, B.A. Food, biofuel, global agriculture, and environment: Discussion. Rev. Agric. Econ. 2008, 30, 530–532. [Google Scholar] [CrossRef]
- Chen, C.C.; McCarl, B.A.; Chang, C.C.; Tso, C. Evaluation the potential economic impacts of Taiwanese biomass energy production. Biomass Bioenergy 2011, 35, 1693–1701. [Google Scholar] [CrossRef]
- Lehmann, J.; Gaunt, J.; Rondon, M. Biochar sequestration in terrestrial ecosystems—A review. Mitig. Adapt. Strateg. Glob. Chang. 2006, 11, 403–427. [Google Scholar]
- Lehmann, J. A handful of carbon. Nature 2007, 447, 143–144. [Google Scholar] [CrossRef] [PubMed]
- Kung, C.C.; McCarl, B.A.; Cao, X.Y. Economics of pyrolysis based energy production and biochar utilization—A case study in Taiwan. Energy Policy 2013, 60, 317–323. [Google Scholar] [CrossRef]
- McCarl, B.A.; Peacocke, C.; Chrisman, R.; Kung, C.C.; Ronald, D. Economics of biochar production, utilization, and GHG offsets. In Biochar for Environmental Management: Science and Technology; Lehmann, J., Joseph, S., Eds.; Earthscan Publisher: London, UK, 2009; pp. 341–357. [Google Scholar]
- Kung, C.C.; McCarl, B.A.; Cao, X.Y.; Xie, H.L. Bioenergy prospects in Taiwan using set-aside land—An economic evaluation. China Agric. Econ. Rev. 2013, 4, 489–511. [Google Scholar] [CrossRef]
- Fargione, J.; Hill, J.; Tilman, D.; Polasky, S.; Hawthorne, P. Land clearing and the biofuel carbon debt. Science 2008, 319, 1235–1238. [Google Scholar] [CrossRef] [PubMed]
- Deluca, T.H.; MacKenzie, M.D.; Gundale, M.J. Biochar effects on soil nutrient transformations. In Biochar for Environmental Management: Science and Technology; Lehmann, J., Joseph, S., Eds.; Earthscan Publisher: London, UK, 2009; pp. 137–182. [Google Scholar]
- Lehmann, J.; Silva, J.P.; Steiner, C.; Nehls, T.; Zech, W.; Glaser, B. Nutrient availability and leaching in an archaeological Anthrosol and a Ferralsol of the Central Amazon basin: Fertilizer, manure and charcoal amendments. Plant Soil 2003, 249, 343–357. [Google Scholar] [CrossRef]
- Chan, K.Y.; Zwieten, L.; Meszaros, I.; Downie, A.; Joseph, S. Agronomic values of green waste biochar as a soil amendment. Aust. J. Soil Res. 2007, 45, 629–634. [Google Scholar] [CrossRef]
- Nehls, T. Fertility Improvement of Terra Firme Oxisol in Central Amazonia by Charcoal Applications. Master’s Thesis, University of Bayreuth, Bayreuth, Germany, 25 August 2002. [Google Scholar]
- Iswaran, V.; Jauhri, K.S.; Sen, A. Effect of charcoal, coal and peat on the yield ofmoong, soybean and pea. Soil Biol. Biochem. 1980, 12, 191–192. [Google Scholar] [CrossRef]
- Kishimoto, S.; Sugiura, G. Charcoal as a soil conditioner. Int. Achieve Future 1985, 5, 12–23. [Google Scholar]
- Chidumayo, E.N. Phenology and nutrition of miombo woodland trees in Zambia. Trees 1994, 9, 67–72. [Google Scholar] [CrossRef]
- Glaser, B.; Lehmann, J.; Zech, W. Ameliorating physical and chemical properties of highly weathered soils in the tropics with charcoal—A review. Biol. Fertile Soils 2002, 35, 219–230. [Google Scholar] [CrossRef]
- Oguntunde, P.G.; Abiodun, B.J.; Ajayi, A.E.; Giesen, N. Effects of charcoal production on soil physical properties in Ghana. J. Plant Nutr. Soil Sci. 2004, 171, 591–596. [Google Scholar] [CrossRef]
- Steiner, T.; Mosenthin, R.; Zimmermann, B.; Greiner, R.; Roth, S. Distribution of phytaseactivity, total phosphorus and phytatephosphorus in legume seeds, cereals and cereal products as influenced by harvest year and cultivar. Anim. Feed Sci. Technol. 2007, 133, 320–334. [Google Scholar] [CrossRef]
- Major, J.; Lehmann, J.; Rondon, M.; Goodale, C. Fate of soil-applied black carbon: Downward migration, leaching and soil respiration. Glob. Chang. Biol. 2009, 16, 1366–1379. [Google Scholar] [CrossRef]
- Chen, C.C.; McCarl, B.A.; Chang, C.C.; Shu, H.S. Spatial equilibrium modeling with imperfectly competitive markets: An application to rice trade. J. Agric. Econ. 2009, 35, 591–602. [Google Scholar]
- Tso, C.; Su, M. Domestic bio-ethanol sources productivity and energy and economicindicators research. Taiwan J. Agric. Econ. 2009, 30, 47–64. [Google Scholar]
- Bransby, D. Switchgrass Profile; Oak Ridge National Laboratory: Oak Ridge, TN, USA, 2005. [Google Scholar]
- McCarl, B.A.; Schneider, U.A. U.S. Agriculture’s role in a greenhouse gas emission mitigation world: An economic perspective. Rev. Agric. Econ. 2000, 22, 134–159. [Google Scholar] [CrossRef]
- Samuelson, P.A. Spatial price equilibrium and linear programming. Am. Econ. Rev. 1950, 42, 283–303. [Google Scholar]
- Takayama, T.; Judge, G.G. Spatial and Temporal Price Allocation Models; North-Holland Publishing Co.: Amsterdam, The Netherland, 1971. [Google Scholar]
- Duloy, J.; Norton, R. CHAC: A programming model of Mexican agricultural. In Multilevel Planning: Case Studies in Mexico; Goreaux, L., Manne, A., Eds.; North-Holland: Amsterdam, The Netherland, 1973; Volume 2, pp. 291–337. [Google Scholar]
- Tyner, W. The potential of producing energy from agriculture. Am. J. Agric. Econ. 1979, 3, 107–123. [Google Scholar]
- Hamilton, S.A.; McCarl, B.A.; Adams, R.M. The effect of aggregate response assumptions on environmental impact analyses. Am. J. Agric. Econ. 1985, 67, 407–413. [Google Scholar] [CrossRef]
- Adams, D.M.; Callaway, J.M.; Chang, C.C.; McCarl, B.A. The role of agriculture in climate change: A preliminary evaluation. In Global Change: Agriculture, Forestry and Natural Resources; Reilly, J., Ed.; Heath and Company: Washington, DC, USA, 1992; pp. 273–287. [Google Scholar]
- Chang, C.C.; McCarl, B.A.; Mjedle, J.; Richardson, J.W. Sectoral implications of farm program modifications. Am. J. Agric. Econ. 1992, 74, 38–49. [Google Scholar] [CrossRef]
- Adams, D.M.; Hamilton, S.A.; McCarl, B.A. The benefits of air pollution control: The case of the Ozone and US agriculture. Am. J. Agric. Econ. 1986, 68, 886–894. [Google Scholar] [CrossRef]
- Adams, D.M.; Alig, R.J.; McCarl, B.A.; Callaway, J.M.; Winnett, S.M. Minimum cost strategies for sequestering carbon in forests. Land Econ. 1999, 75, 360–374. [Google Scholar] [CrossRef]
- McCarl, B.A.; Keplinger, K.O.; Dillon, C.R.; Williams, R.L. Limiting pumping from the edwards aquifer: An economic investigation of proposals, water markets and springflow guarantees. Water Resour. Res. 1999, 35, 1257–1268. [Google Scholar] [CrossRef]
- Reilly, J.M.; Tubiello, F.; McCarl, B.A.; Abler, D.G.; Darwin, R.; Fuglie, K.; Hollinger, S.E.; Izaurralde, R.C.; Jagtap, S.; Jones, J.W.; et al. US agriculture and climate change: New results. Clim. Chang. 2002, 57, 43–69. [Google Scholar] [CrossRef]
- Adams, D.M.; Callaway, J.M.; Chang, C.C.; McCarl, B.A. Sequestering carbon on agricultural land: Social cost and impacts on timber markets. Contemp. Policy Issues 1993, 11, 76–87. [Google Scholar] [CrossRef]
- Coble, K.H.; Chang, C.C.; McCarl, B.A.; Eddleman, B.R. Assessing economic implications of new technology: The case of cornstarch-based biodegradable plastics. Rev. Agric. Econ. 1992, 14, 33–43. [Google Scholar] [CrossRef]
- Chang, C.C.; Eddleman, B.R.; McCarl, B.A. Potential benefits of rice variety and water management improvements in the Texas gulf coast. J. Agric. Resour. Econ. 1991, 16, 185–193. [Google Scholar]
- Chen, C.C.; Chang, C.C. The impact of weather on crop yield distribution in Taiwan: Some new evidence from panel data models and implications for crop insurance. J. Agric. Econ. 2005, 33, 503–511. [Google Scholar] [CrossRef]
- Chang, C.C. The potential impacts of climate change on Taiwan’s agriculture. Agric. Econ. 2002, 27, 51–64. [Google Scholar] [CrossRef]
© 2015 by the authors; licensee MDPI, Basel, Switzerland. This article is an open access article distributed under the terms and conditions of the Creative Commons Attribution license (http://creativecommons.org/licenses/by/4.0/).
Share and Cite
Kung, C.-C.; Chang, M.-S. Effect of Agricultural Feedstock to Energy Conversion Rate on Bioenergy and GHG Emissions. Sustainability 2015, 7, 5981-5995. https://doi.org/10.3390/su7055981
Kung C-C, Chang M-S. Effect of Agricultural Feedstock to Energy Conversion Rate on Bioenergy and GHG Emissions. Sustainability. 2015; 7(5):5981-5995. https://doi.org/10.3390/su7055981
Chicago/Turabian StyleKung, Chih-Chun, and Meng-Shiuh Chang. 2015. "Effect of Agricultural Feedstock to Energy Conversion Rate on Bioenergy and GHG Emissions" Sustainability 7, no. 5: 5981-5995. https://doi.org/10.3390/su7055981
APA StyleKung, C.-C., & Chang, M.-S. (2015). Effect of Agricultural Feedstock to Energy Conversion Rate on Bioenergy and GHG Emissions. Sustainability, 7(5), 5981-5995. https://doi.org/10.3390/su7055981