
Social Investment, Economic Growth and Labor Market Performance: Case Study—Romania

Abstract
:1. Introduction
2. Description of the Study Area
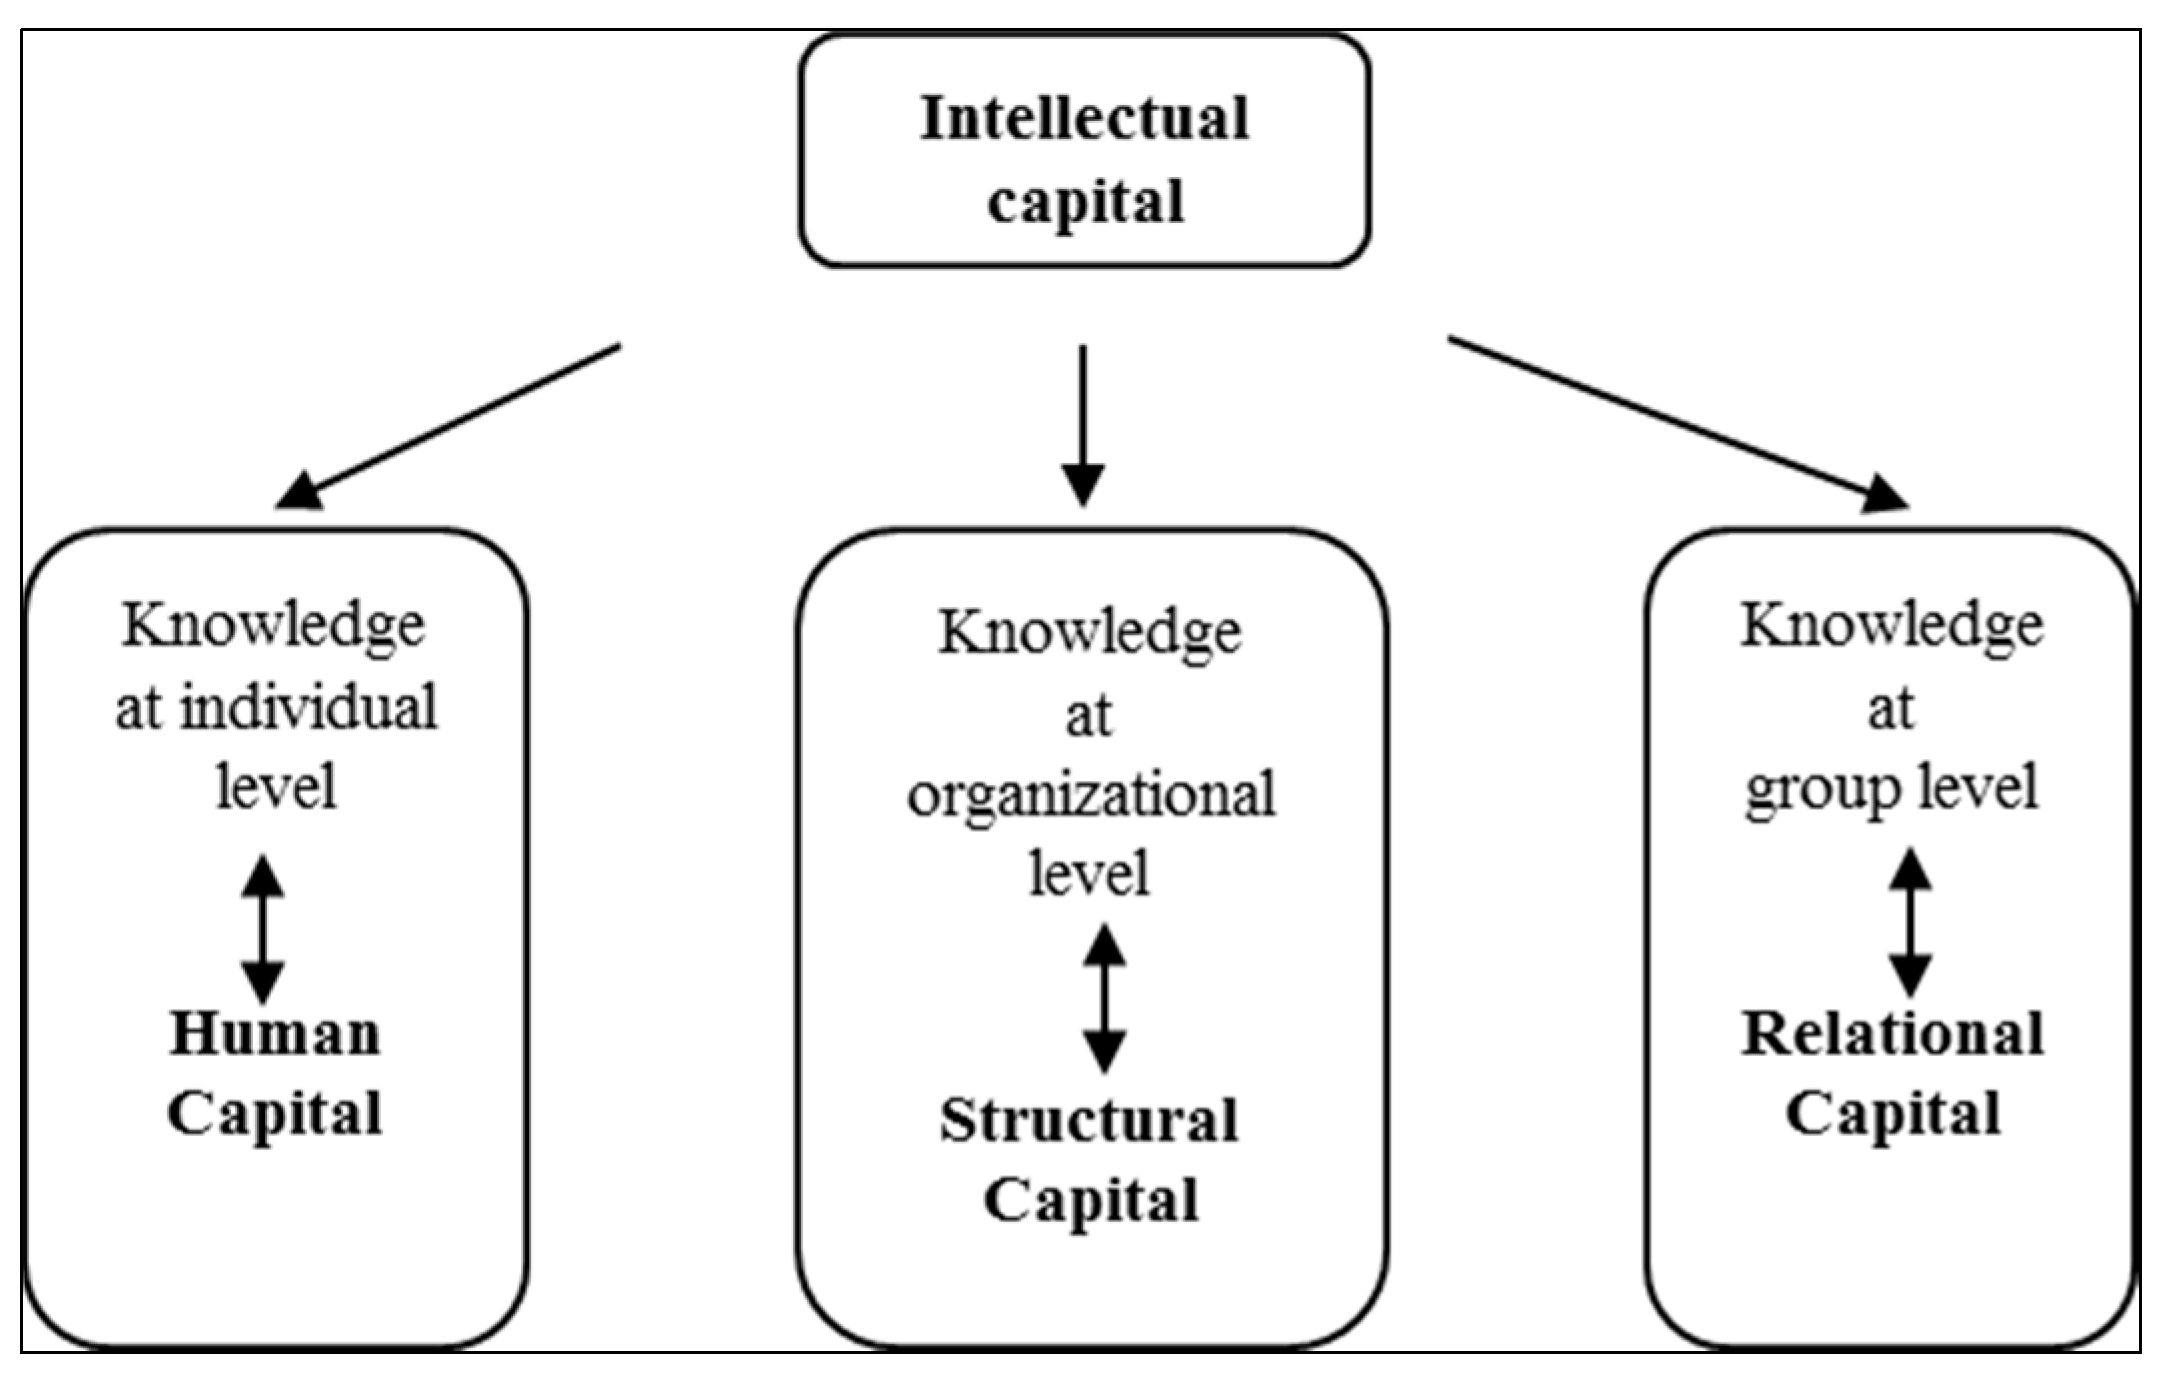
2.1. A Brief Review of Literature
2.2. The Need for Continuously Informing and Education the Population


| At risk of poverty or social exclusion (Persons falling under at least one of the three criteria) | Persons at-risk-of-poverty after social transfers (%) | Persons severely Materially deprived (%) | Persons aged 0–59 living in households with very low work intensity (%) | |||||||
|---|---|---|---|---|---|---|---|---|---|---|
| % of total population | in thousands | |||||||||
| 2008 | 2013 | 2008 | 2013 | 2008 | 2013 | 2008 | 2013 | 2008 | 2013 | |
| EU 28 * | 23.8 | 24.5 | 116,580 | 122,650 | 16.6 | 16.7 | 8.5 | 9.6 | 9.1 | 10.7 |
| Belgium | 20.8 | 20.8 | 2190 | 2290 | 14.7 | 15.1 | 5.6 | 5.1 | 11.7 | 14.0 |
| Bulgaria | 44.8 | 48.0 | 3420 | 3490 | 21.4 | 21.0 | 41.2 | 43.0 | 8.1 | 13.0 |
| Czech Republic | 15.3 | 14.6 | 1570 | 1510 | 9.0 | 8.6 | 6.8 | 6.6 | 7.2 | 6.9 |
| Denmark | 16.3 | 18.9 | 890 | 1060 | 11.8 | 12.3 | 2.0 | 3.8 | 8.5 | 12.9 |
| Germany | 20.1 | 20.3 | 16,350 | 16,210 | 15.2 | 16.1 | 5.5 | 5.4 | 11.7 | 9.9 |
| Estonia | 21.8 | 23.5 | 290 | 310 | 19.5 | 18.6 | 4.9 | 7.6 | 5.3 | 8.4 |
| Ireland | 23.7 | - | 1050 | - | 15.5 | - | 5.5 | - | 13.7 | - |
| Greece | 28.1 | 35.7 | 3050 | 3900 | 20.1 | 23.1 | 11.2 | 20.3 | 7.5 | 18.2 |
| Spain | 24.5 | 27.3 | 11,120 | 12,630 | 20.8 | 20.4 | 3.6 | 6.2 | 6.6 | 15.7 |
| France | 18.5 | 18.1 | 11,150 | 11,230 | 12.5 | 13.7 | 5.4 | 5.1 | 8.8 | 7.9 |
| Croatia | - | 29.9 | - | 1270 | 17.3 | 19.5 | - | 14.7 | - | 14.8 |
| Italy | 25.3 | 28.4 | 15,100 | 17,330 | 18.7 | 19.1 | 7.5 | 12.4 | 9.8 | 11.0 |
| Cyprus | 23.3 | 27.8 | 180 | 240 | 15.9 | 15.3 | 9.1 | 16.1 | 4.5 | 7.9 |
| Latvia | 34.2 | 35.1 | 740 | 700 | 25.9 | 19.4 | 19.3 | 24.0 | 5.4 | 10.0 |
| Lithuania | 27.6 | 30.8 | 930 | 920 | 20.0 | 20.6 | 12.3 | 16.0 | 5.1 | 11.0 |
| Luxembourg | 15.5 | 19.0 | 70 | 100 | 13.4 | 15.9 | 0.7 | 1.8 | 4.7 | 6.6 |
| Hungary | 28.2 | 33.5 | 2790 | 3290 | 12.4 | 14.3 | 17.9 | 26.8 | 12.0 | 12.6 |
| Malta | 20.1 | 24.0 | 80 | 100 | 15.3 | 15.7 | 4.3 | 9.5 | 8.6 | 9.0 |
| The Netherlands | 14.9 | 15.9 | 2430 | 2650 | 10.5 | 10.4 | 1.5 | 2.5 | 8.2 | 9.4 |
| Austria | 20.6 | 18.8 | 1700 | 1570 | 15.2 | 14.4 | 5.9 | 4.2 | 7.4 | 7.8 |
| Poland | 30.5 | 25.8 | 11,490 | 9750 | 16.9 | 17.3 | 17.7 | 11.9 | 8.0 | 7.2 |
| Portugal | 26.0 | 27.4 | 2760 | 2880 | 18.5 | 18.7 | 9.7 | 10.9 | 6.3 | 12.2 |
| Romania | 44.2 | 40.4 | 9420 | 8600 | 23.4 | 22.4 | 32.9 | 28.5 | 8.3 | 6.4 |
| Slovenia | 18.5 | 20.4 | 360 | 410 | 12.3 | 14.5 | 6.7 | 6.7 | 6.7 | 8.0 |
| Slovakia | 20.6 | 19.8 | 1110 | 1070 | 10.9 | 12.8 | 11.8 | 10.2 | 5.2 | 7.6 |
| Finland | 17.4 | 16.0 | 910 | 850 | 13.6 | 11.8 | 3.5 | 2.5 | 7.5 | 9.0 |
| Sweden | 14.9 | 16.4 | 1370 | 1600 | 12.2 | 14.8 | 1.4 | 1.4 | 5.5 | 7.1 |
| UK | 23.2 | 24.8 | 14,070 | 15,590 | 18.7 | 15.9 | 4.5 | 8.3 | 10.4 | 13.2 |
| Iceland | 11.8 | 13.0 | 36 | 40 | 10.1 | 9.3 | 0.8 | 1.9 | 2.6 | 6.2 |
| Norway | 15.0 | 14.1 | 700 | 710 | 11.4 | 10.9 | 2.0 | 1.9 | 6.5 | 6.4 |
| Switzerland | 18.1 | 16.4 | 1330 | 1280 | 15.7 | 14.5 | 2.1 | 1.0 | 3.3 | 4.1 |
3. Investment in People in Times of Crisis, between the Possible and the Probable
- (1)
- Supporting the economic activities that are viable but that have difficulties in accessing funds by facilitating access to capital. The priorities were industries that have been strongly affected, such as the automotive industry, that many governments helped by operating a subsidy plan for the purchase of new automobiles. Other measures included fast depreciation of invested capital Other measures included rapid acceleration of the depreciation rate of invested capital (Czech Republic) or unlocking the state fund for the employers, in order for the latter to cover a fraction of their personnel costs.
- (2)
- Retraining and training programs. Here the measures have varied according to the proposed objectives. France, for example, encouraged professional retraining most, while in Lithuania the employers were encouraged to keep their employees.
- (3)
- Measures meant to reduce the companies’ expenses before the effective dismissal of their employees. Among these—technical unemployment or cuts in the payment of social insurance.
- (4)
- Expansion of the unemployment aid period and the encouragement of part-time activities. Austria, for example expanded the part-time period from one year to two and Germany gave bonuses for reduced working hours.
- (5)
- Targeted measures aimed to support low incomes, such as subsidies for electricity bills. Generally, these tend to focus on the above-mentioned areas, but are applied differently, in accordance with the economic structure, the existing economic situation and the governments’ ability to finance these measures.
4. Measuring Economic Development
- ▪
- Prospective methods are based on the estimated future incomes or, rather, estimated present value of future income flows for an individual with or without consideration for the living costs.
- ▪
- Retrospective methods are based on the costs of human capital “production”; in other words, it considers the sum of education and tuition expenses, or determines the costs of human capital reproduction.
- ▪
- After applying the two methods, the relevant authors recognized their limitations and some of them tried to measure and asses human capital by combining the prospective and retrospective methods in order to improve their respective strengths and play out their weaknesses.
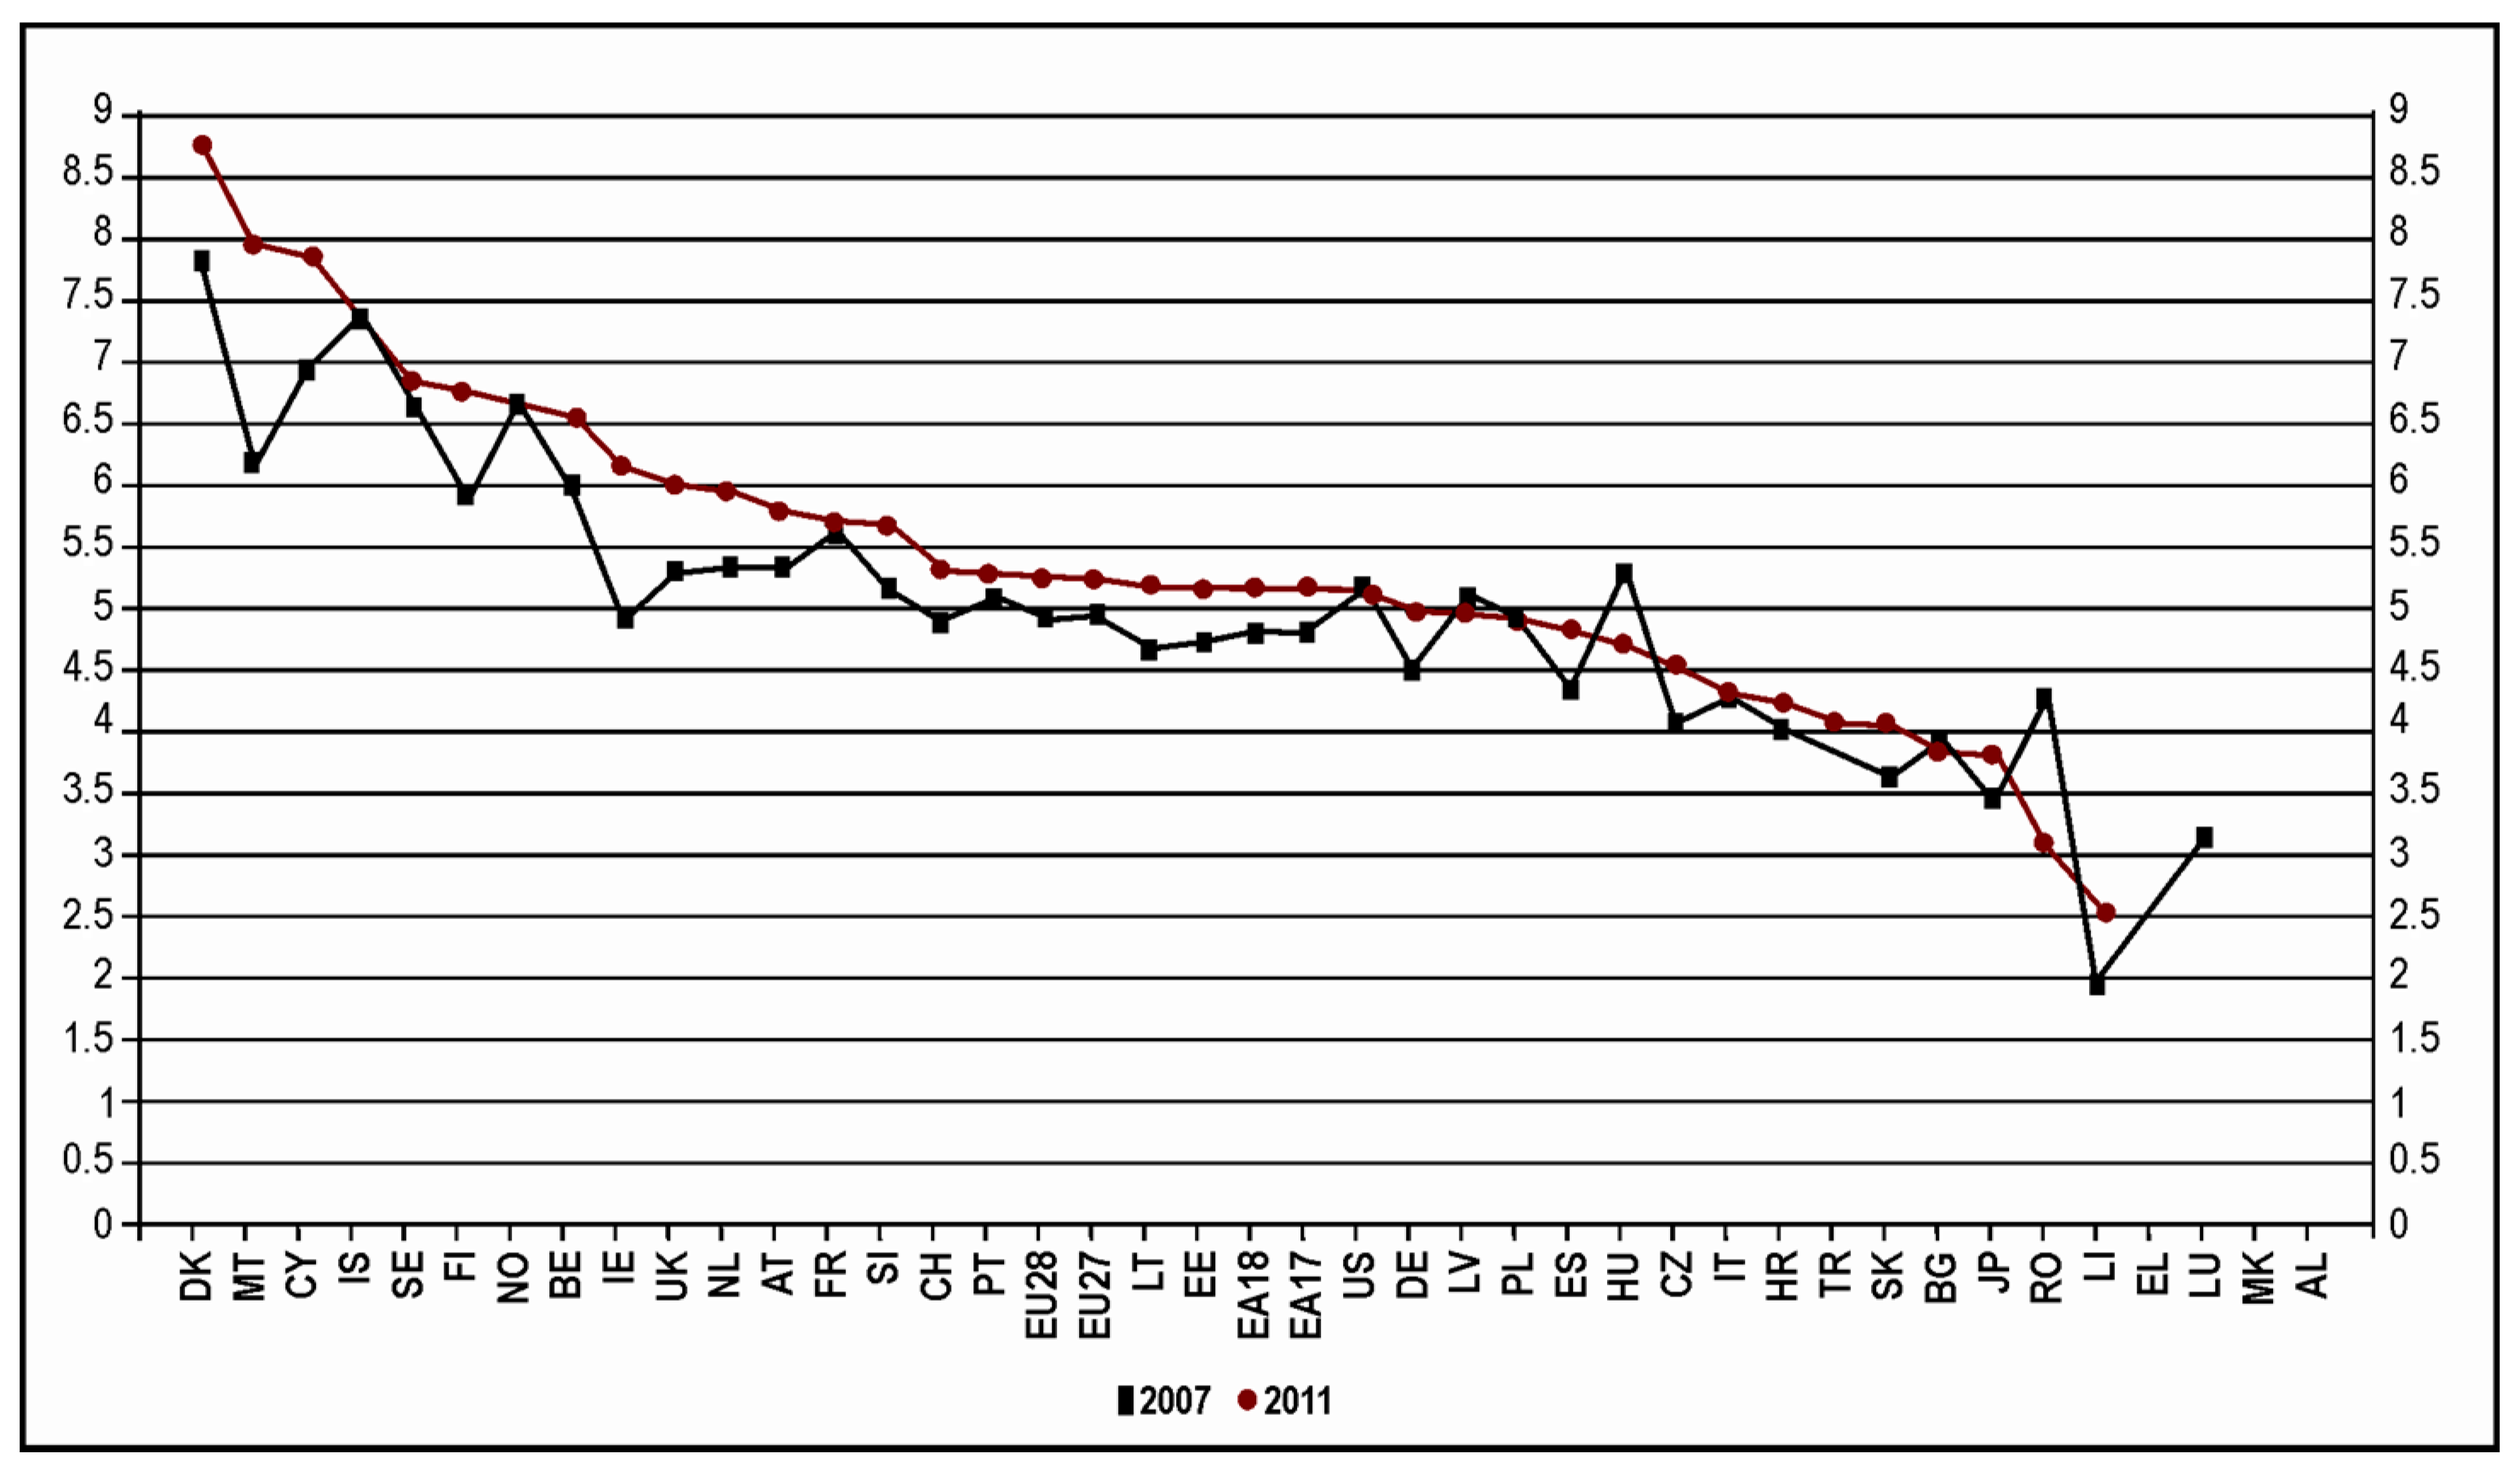
| % of GDP | ||||||||||||||
|---|---|---|---|---|---|---|---|---|---|---|---|---|---|---|
| Geo/time | 1998 | 1999 | 2000 | 2001 | 2002 | 2003 | 2004 | 2005 | 2006 | 2007 | 2008 | 2009 | 2010 | 2011 |
| EU (28 countries) | - | - | - | - | 5 | 5.03 | 4.95 | 4.92 | 4.91 | 4.92 | 5.04 | 5.38 | 5.41 | 5.25 |
| EU (27 countries) | - | 4.86 | 4.91 | 4.99 | 5 | 5.04 | 4.95 | 4.92 | 4.91 | 4.93 | 5.04 | 5.38 | 5.41 | 5.25 |
| Euro area (18 countries) | - | - | - | - | 4.87 | 4.89 | 4.8 | 4.72 | 4.69 | 4.79 | 4.94 | 5.31 | 5.28 | 5.15 |
| Euro area (17 countries) | - | - | - | - | 4.86 | 4.89 | 4.8 | 4.72 | 4.69 | 4.79 | 4.94 | 5.31 | 5.28 | 5.15 |
| Belgium | - | - | - | 5.99 | 6.09 | 6.02 | 5.95 | 5.92 | 5.98 | 6 | 6.43 | 6.57 | 6.58 | 6.55 |
| Bulgaria | 4.28 | 4.02 | 3.88 | 3.7 | 3.94 | 4.09 | 4.4 | 4.25 | 4.04 | 3.88 | 4.44 | 4.58 | 4.1 | 3.82 |
| Czech Republic | 3.95 | 3.97 | 3.83 | 3.93 | 4.15 | 4.32 | 4.2 | 4.08 | 4.42 | 4.05 | 3.92 | 4.36 | 4.25 | 4.51 |
| Denmark | 8.3 | 8.11 | 8.28 | 8.44 | 8.44 | 8.33 | 8.43 | 8.3 | 7.97 | 7.81 | 7.68 | 8.74 | 8.81 | 8.75 |
| Germany | - | 4.51 | 4.45 | 4.51 | 4.72 | 4.74 | 4.62 | 4.57 | 4.43 | 4.49 | 4.57 | 5.06 | 5.08 | 4.98 |
| Estonia | 5.71 | 6.74 | 5.57 | 5.24 | 5.47 | 5.29 | 4.92 | 4.88 | 4.7 | 4.72 | 5.61 | 6.03 | 5.66 | 5.16 |
| Ireland | 4.82 | 3.34 | 4.29 | 4.24 | 4.27 | 4.35 | 4.66 | 4.72 | 4.73 | 4.92 | 5.67 | 6.43 | 6.41 | 6.15 |
| Greece | 3.48 | 3.25 | 3.71 | 3.5 | 3.57 | 3.56 | 3.83 | 4.09 | - | - | - | - | - | - |
| Spain | 4.42 | 4.38 | 4.28 | 4.24 | 4.25 | 4.28 | 4.25 | 4.23 | 4.26 | 4.34 | 4.62 | 5.02 | 4.98 | 4.82 |
| France | 5.95 | 5.81 | 6.04 | 5.95 | 5.9 | 5.92 | 5.8 | 5.67 | 5.61 | 5.62 | 5.62 | 5.9 | 5.86 | 5.68 |
| Croatia | - | - | - | - | 3.71 | 3.93 | 3.87 | 3.98 | 4.04 | 4.02 | 4.32 | 4.42 | 4.31 | 4.21 |
| Italy | 4.65 | 4.47 | 4.52 | 4.83 | 4.6 | 4.72 | 4.56 | 4.41 | 4.67 | 4.27 | 4.56 | 4.7 | 4.5 | 4.29 |
| Cyprus | 5.61 | 5.36 | 5.42 | 5.98 | 6.6 | 7.37 | 6.77 | 6.95 | 7.02 | 6.95 | 7.45 | 7.98 | 7.92 | 7.87 |
| Latvia | 5.85 | 5.77 | 5.64 | 7.22 | 6.6 | 5.58 | 5.12 | 5.14 | 5.13 | 5.07 | 5.71 | 5.59 | 4.96 | 4.96 |
| Lithuania | 5.99 | 6.37 | 5.63 | 5.86 | 5.81 | 5.14 | 5.17 | 4.88 | 4.82 | 4.64 | 4.88 | 5.64 | 5.36 | 5.17 |
| Luxembourg | - | - | - | 3.75 | 3.79 | 3.77 | 3.87 | 3.78 | 3.41 | 3.15 | - | - | - | - |
| Hungary | 4.59 | 4.66 | 4.5 | 5.06 | 5.39 | 5.91 | 5.44 | 5.46 | 5.44 | 5.29 | 5.1 | 5.12 | 4.9 | 4.71 |
| Malta | 4.82 | 4.43 | 4.52 | 4.27 | 4.22 | 4.48 | 4.66 | 6.58 | 6.45 | 6.18 | 5.72 | 5.32 | 6.74 | 7.96 |
| The Netherlands | 4.82 | 4.9 | 4.98 | 5.09 | 5.22 | 5.47 | 5.5 | 5.53 | 5.5 | 5.32 | 5.5 | 5.95 | 5.98 | 5.93 |
| Austria | 5.8 | 5.86 | 5.66 | 5.74 | 5.68 | 5.53 | 5.48 | 5.44 | 5.4 | 5.33 | 5.47 | 5.98 | 5.91 | 5.8 |
| Poland | 5.02 | 4.79 | 4.87 | 5.42 | 5.41 | 5.35 | 5.41 | 547 | 5.25 | 4.91 | 5.08 | 5.09 | 5.17 | 4.94 |
| Portugal | 5.36 | 5.43 | 5.42 | 5.39 | 5.33 | 5.38 | 5.1 | 5.21 | 5.07 | 5.1 | 4.89 | 5.79 | 5.62 | 5.27 |
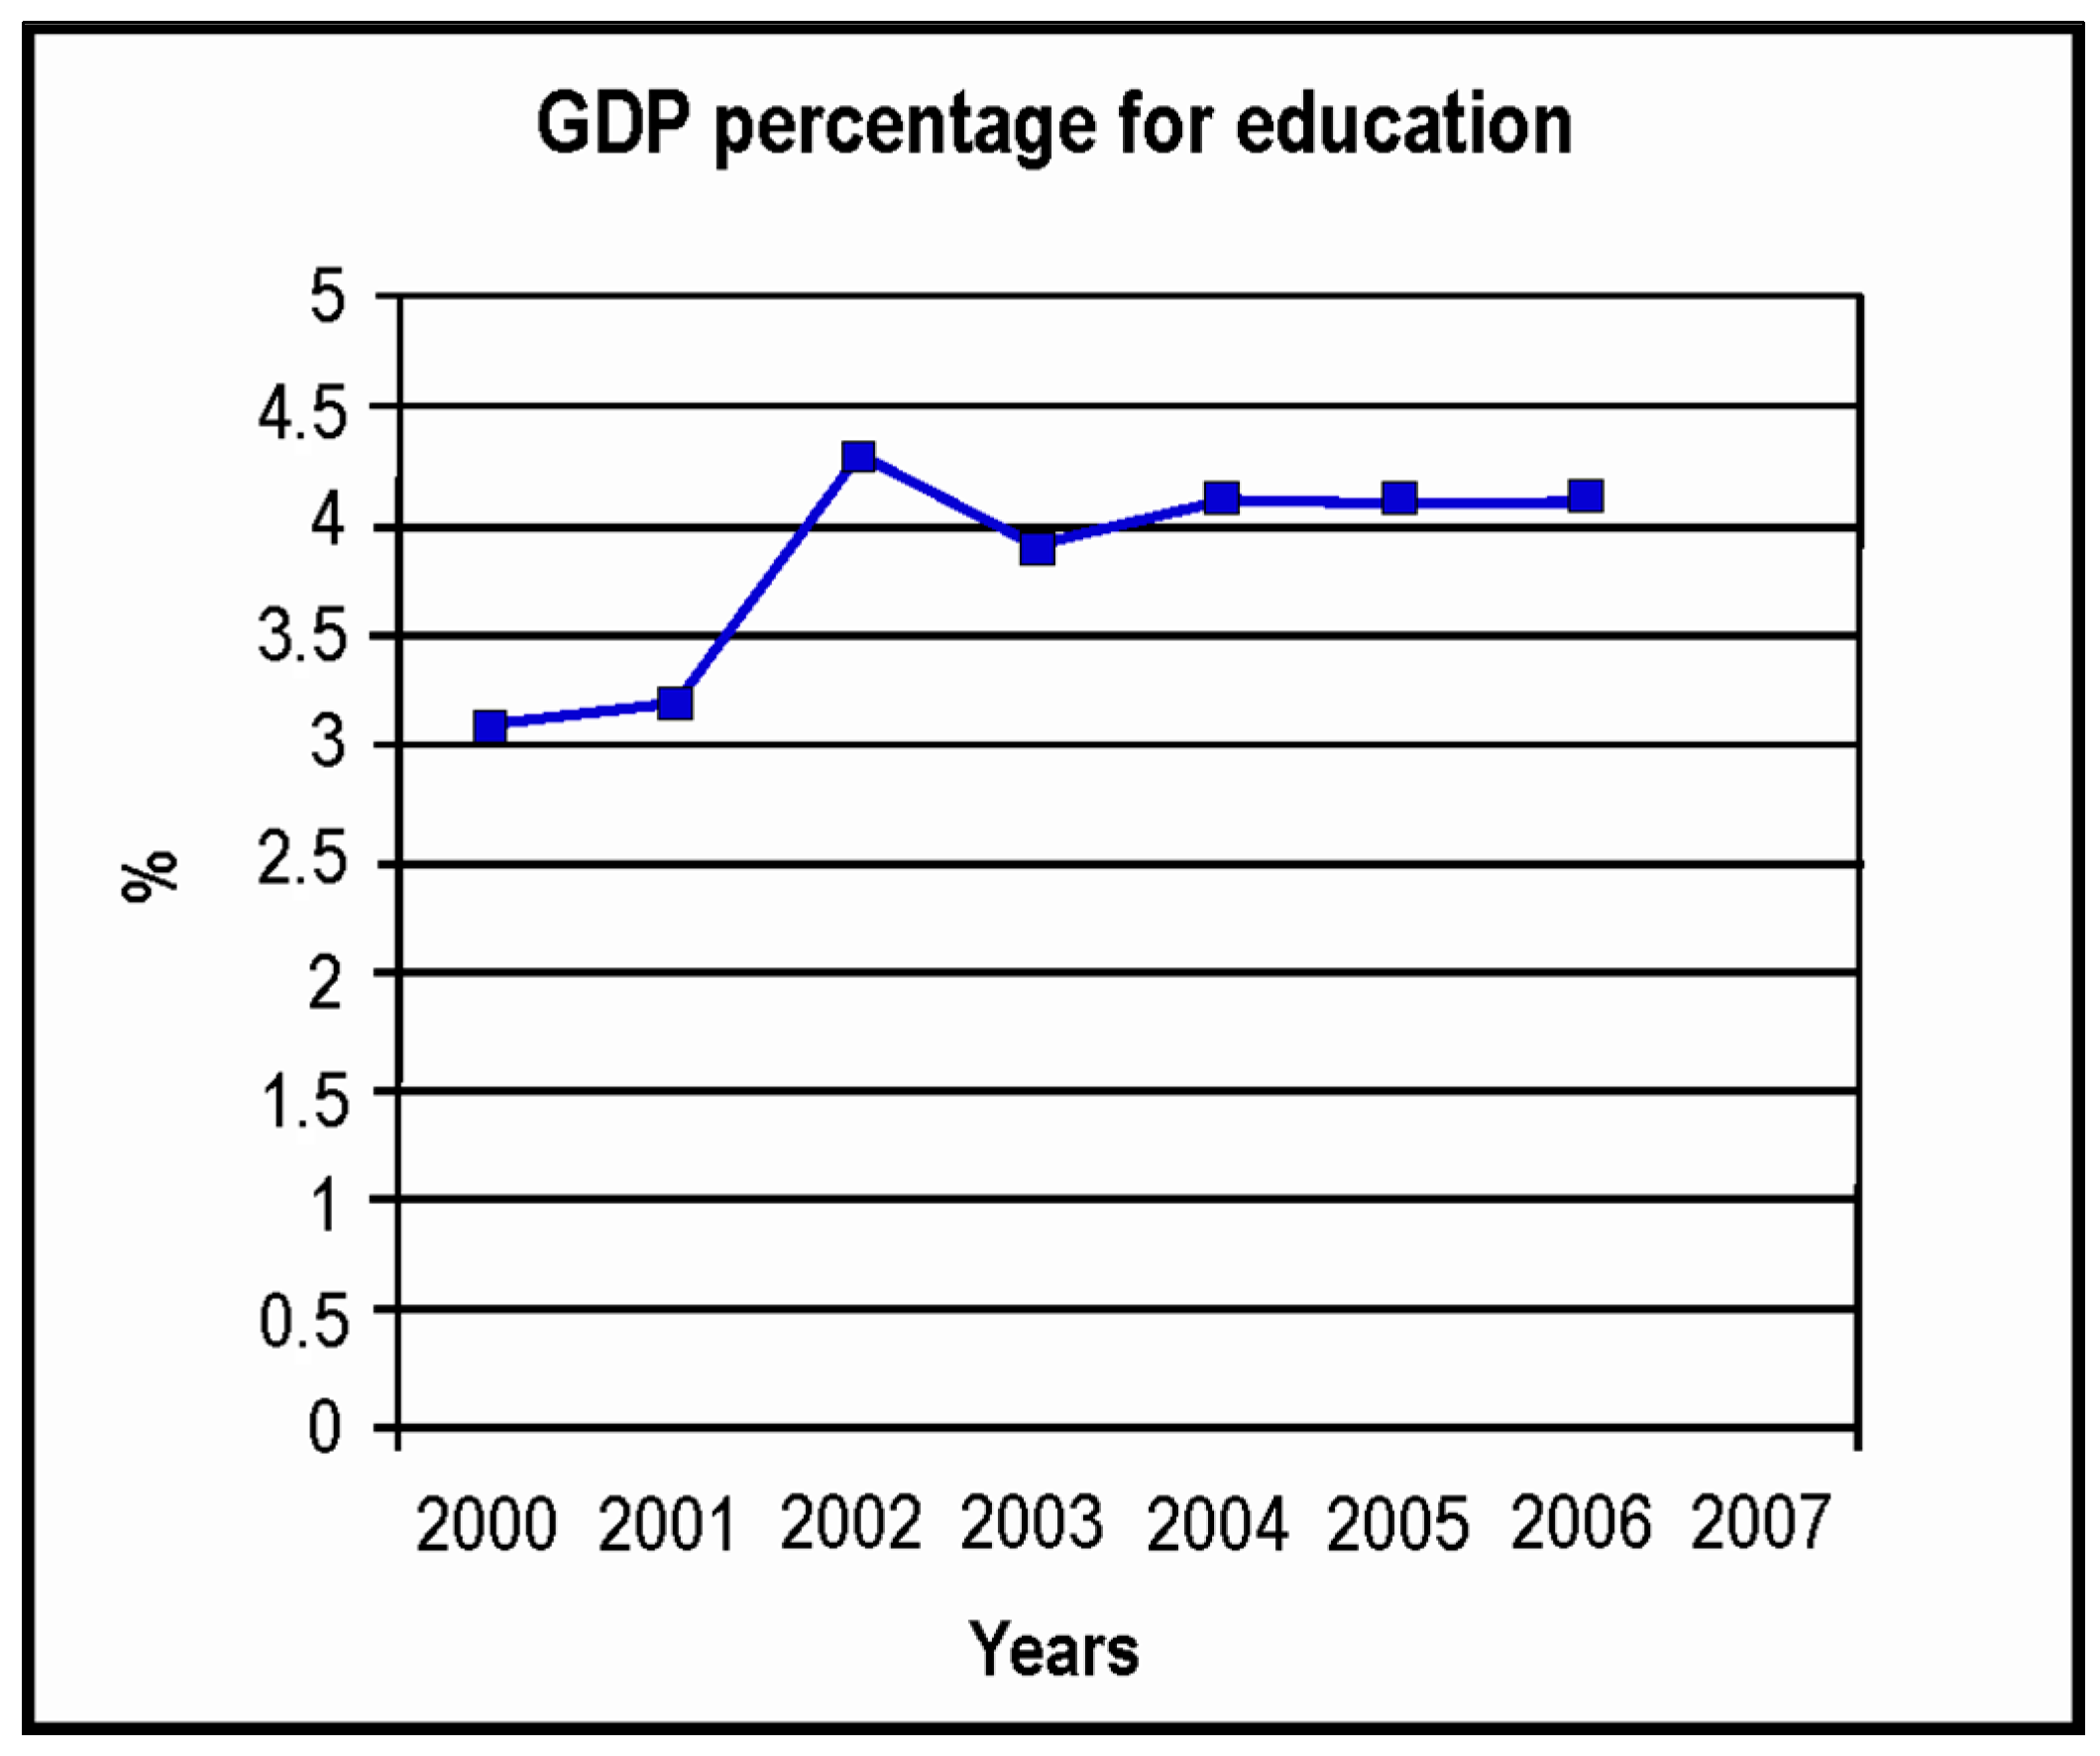
| Romania | - | 3.37 | 2.88 | 3.25 | 3.51 | 3.45 | 3.28 | 3.48 | - | 4.25 | - | 4.24 | 3.53 | 3.07 |
| Slovenia | - | - | - | 5.86 | 5.76 | 5.8 | 5.74 | 5.73 | 5.72 | 5.15 | 5.2 | 5.69 | 5.68 | 5.68 |
| Slovakia | 4.53 | 4.18 | 3.92 | 3.99 | 4.31 | 4.3 | 4.19 | 3.85 | 3.8 | 3.62 | 3.61 | 4.09 | 4.22 | 4.06 |
| Finland | 6.26 | 6.08 | 5.89 | 6.06 | 6.22 | 6.43 | 6.42 | 6.3 | 6.18 | 5.9 | 6.1 | 6.81 | 6.85 | 6.76 |
| Sweden | 7.69 | 7.3 | 7.16 | 7.06 | 7.36 | 7.21 | 7.09 | 6.89 | 6.75 | 6.61 | 6.76 | 7.26 | 6.98 | 6.82 |
| UK | 4.77 | 4.47 | 4.64 | 4.58 | 5.06 | 5.21 | 5.12 | 5.31 | 5.38 | 5.29 | 5.28 | 5.56 | 6.15 | 5.98 |
| Iceland | 5.89 | 5.78 | 5.93 | 6.24 | 6.79 | 7.7 | 7.47 | 7.59 | 7.55 | 7.36 | 7.56 | 7.81 | 7.6 | 7.36 |
| Liechtenstein | - | - | - | - | 2.96 | 2.46 | 2.43 | 2.29 | 2.05 | 1.92 | 2.05 | 2.9 | 2.68 | 2.53 |
| Norway | 7.6 | 7.3 | 6.74 | 7.18 | 7.58 | 7.55 | 7.42 | 6.97 | 6.49 | 6.66 | 6.4 | 7.24 | 6.87 | 6.66 |
| Switzerland | - | - | 5.06 | 5.25 | 5.57 | 5.72 | 5.55 | 5.52 | 5.28 | 4.88 | 4.95 | 5.36 | 5.22 | 5.28 |
| Macedonia | - | - | - | - | 3.35 | 3.3 | - | - | - | - | - | - | - | - |
| Albania | - | - | - | - | - | - | - | - | - | - | - | - | - | - |
| Turkey | 3.26 | 2.96 | 3.48 | 2.71 | 2.82 | 2.96 | 3.12 | - | 2.86 | - | - | - | - | 4.07 |
| USA | 4.94 | 5.23 | 4.94 | 5.55 | 5.32 | 5.43 | 5.14 | 4.91 | 5.24 | 5.13 | 5.26 | 5.3 | 5.32 | 5.13 |
| Japan | 3.59 | 3.6 | 3.82 | 3.58 | 3.6 | 3.64 | 3.59 | 3.48 | 3.46 | 3.45 | 3.46 | 3.61 | 3.85 | 3.78 |
| Defining elements | The CPIB indicator sheet |
|---|---|
| Definition | The percentage of public expenses for education in the GDP in a certain financial year. |
| Unit of measure | % |
| Purpose | Shows the percentage out of the annual financial income that the Government spends for education development. |
| Symbol | CPIB |
| Calculation method | The amount of total public expenses for education divided by the GDP of a certain financial year and multiplied by 100. |
| Calculation formula | CPIBth = TCPth/PIBt × 100 where: CPIBth—percentage of public expenses for education in financial year t, for level of education h; TCPth—total public expenses for education in financial year t; PIBt—Gross Domestic Product for financial year t, for level of education h; h—is a certain educational level, according to the International Standard Classification of Education (ISCED) 97 classification (ISCED 0—preschool, ISCED 1—primary, ISCED 2—secondary, ISCED 3—high school and vocational, ISCED 4—post-high school, ISCED 5–6 tertiary). |
| Required data | The public expenses for education and the Gross Domestic Product for a certain financial year. |
| Data sources | Ministry of Economy and Finance, Ministry of Education and Research |
| Aggregation level | National |
| Other information | Topic 1: Economic development, Sub-topic: Competitiveness; Level 3 |
5. Conclusions and Recommendations
Conflicts of Interest
References
- Koplyay, T.; Lloyd, D.; Mako, C. HR issues evolution along the market lifecycle and the value chain: Case of the hi-tech industry. Hum. Resour. Manag. 2014, 2, 7–33. [Google Scholar]
- Voicu, B. Capitalul uman: Componente, niveluri, structure: Romania in context European. Calit. Vieţii Rev. Polit. Soc. 2004, 15, 137–157. [Google Scholar]
- Roos, G.; Roos, J. Measuring Your Company’s Intellectual Performance. Long Range Plan. 1997, 30, 413–426. [Google Scholar]
- Stewart, T. Intellectual Capital—The New Wealth of Organizations; Nicholas Brealey Publishing House: London, UK, 1999; p. 67. [Google Scholar]
- Sveiby, K.E. Intellectual Capital and Knowledge Management. 2001. Available online: www.sveiby.com/articles/IntellectualCapital.html (accessed on 8 November 2014).
- Tan, H.P.; Plowman, D.; Hancock, P. The evolving research on intellectual capital. J. Intellect. Cap. 2008, 9, 585–608. [Google Scholar]
- Lazar, L. Evaluarea Capitalului Uman—Strategii de Ocupare a Fortei de Munca; Risoprint: Cluj-Napoca, Romania, 2005. (In Romanian) [Google Scholar]
- Popescu, Gh. Evolutia Gandirii Economice; Editura Academiei Romane: București, Romania, 2004; p. 705. (In Romanian) [Google Scholar]
- Nica, E.; Molnar, E.I. Emotional behavior in organizations. J. Self-Gov. Manag. Econ. 2014, 2, 123–128. [Google Scholar]
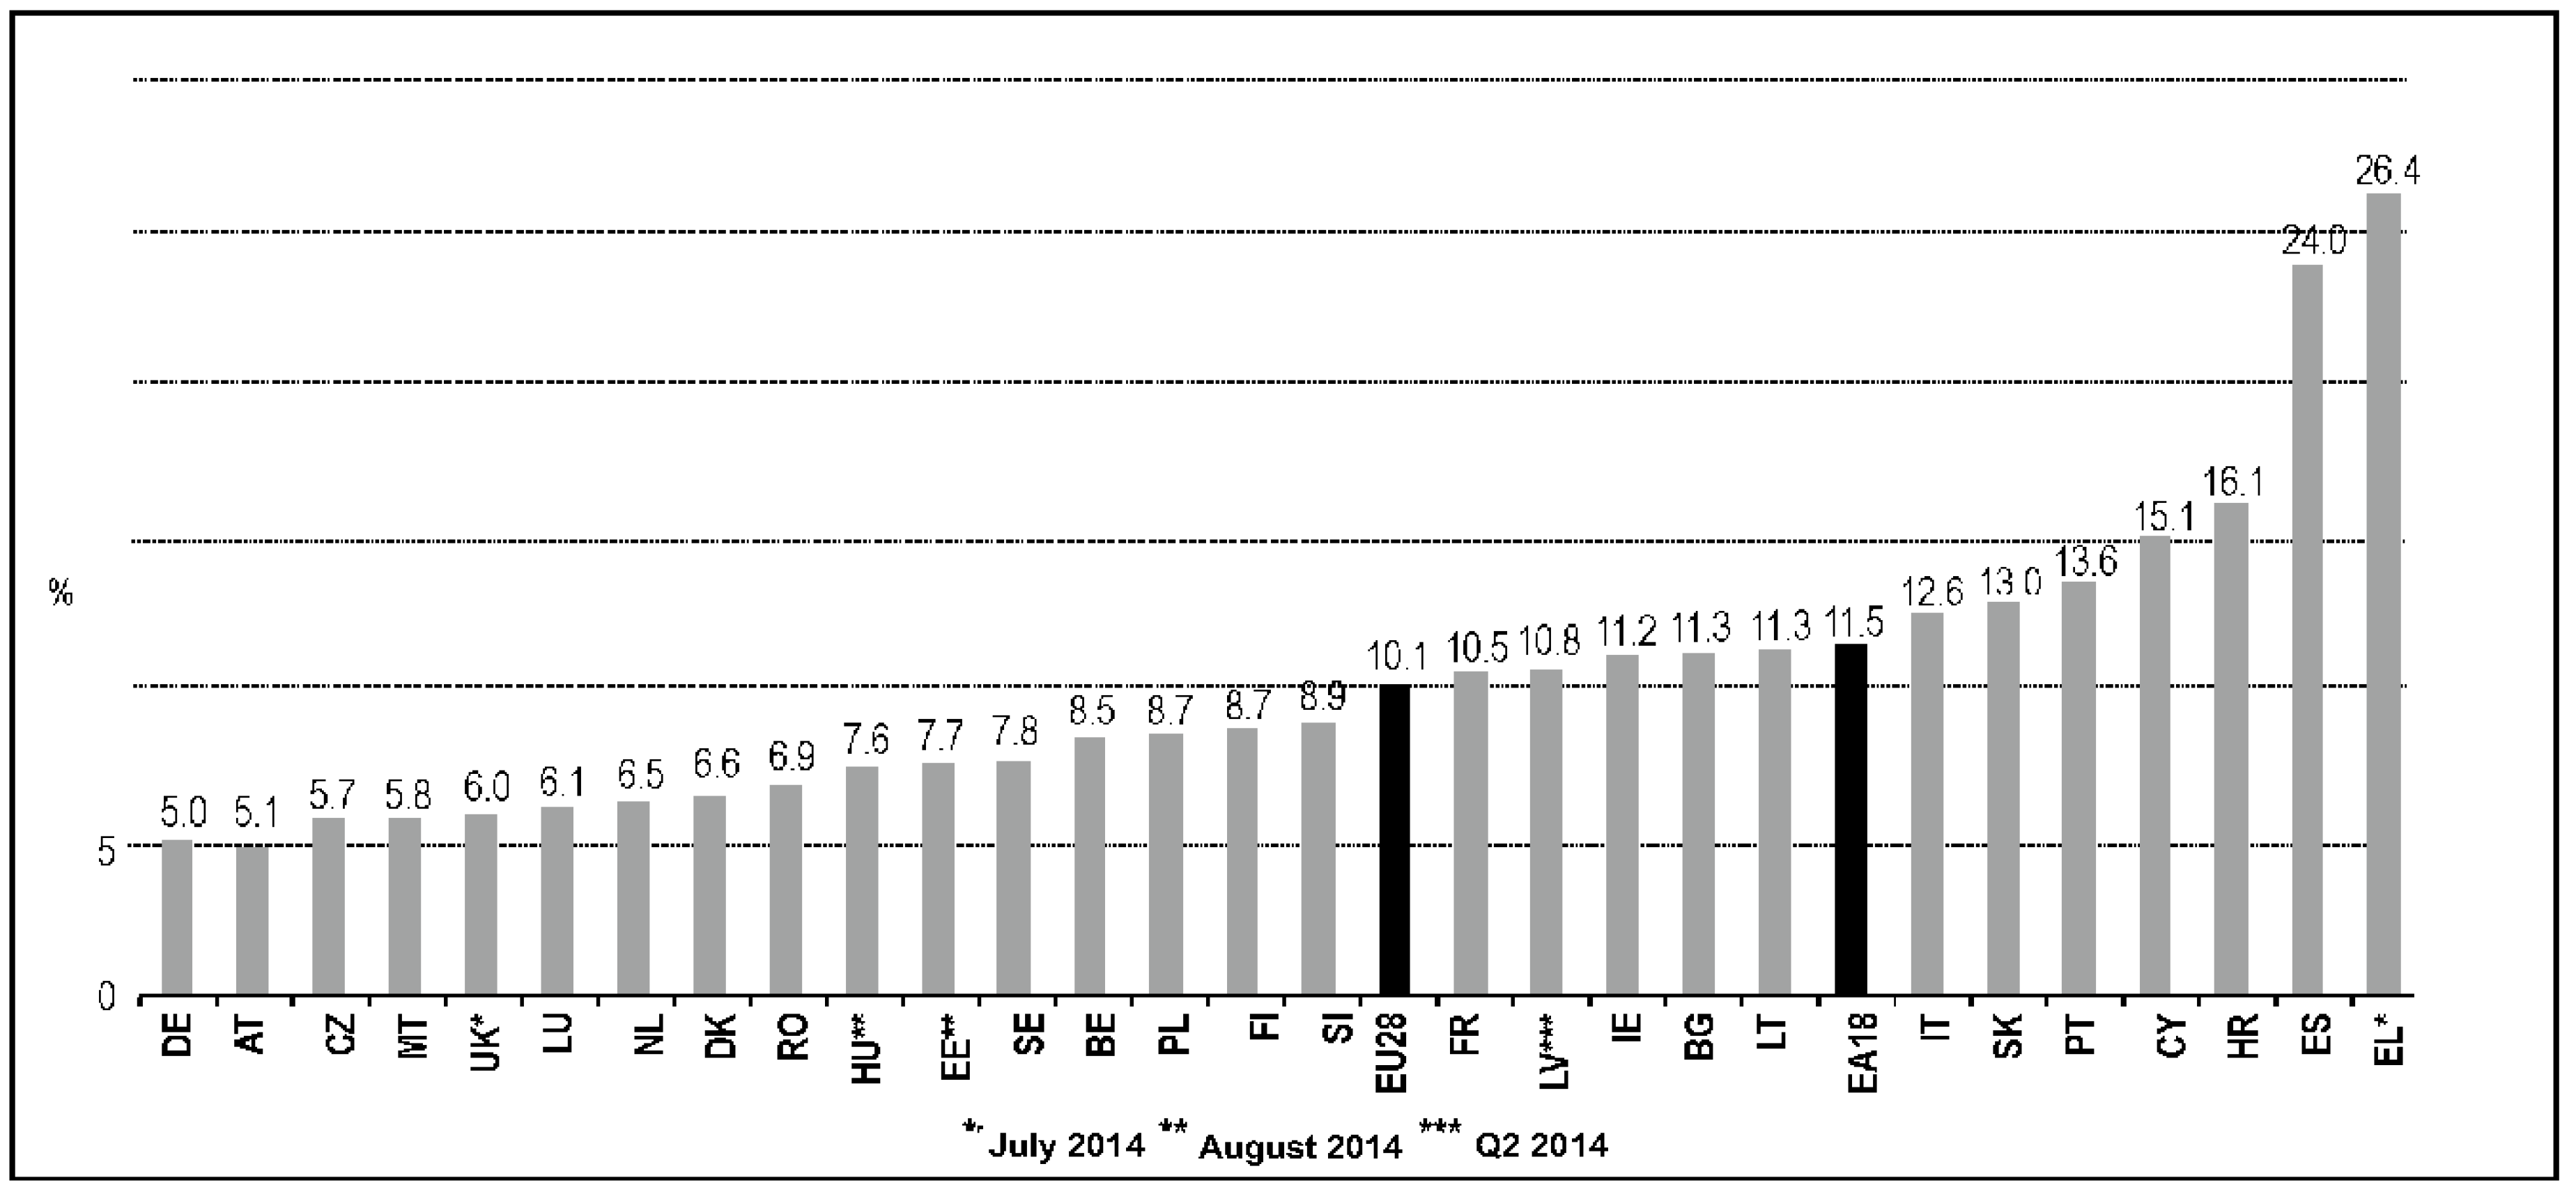
- European Commission. Eurostat. Available online: http://ec.europa.eu/eurostat/statistics-explained/index.php?title=Special%3ASearch&profile=default&search=unemployment+rates+september+2014&fulltext=Search (accessed on 31 October 2014).
- European Commission. At risk of poverty or social exclusion in the EU28—Europa. 4 November 2014. Available online: http://ec.europa.eu/eurostat/documents/2995521/6035076/3-04112014-BP-FR.pdf/62f94e70-e43a-471f-a466-2e84d1029860 (accessed on 7 November 2014).
- European Commission. Europe 2020 strategy. Available online: http://ec.europa.eu/europe2020/pdf/europe2020stocktaking_en.pdf (accessed on 16 October 2014).
- Herr, H.; Ruoff, B. Wage dispersion as key factor for changing personal income distribution. J. Self-Gov. Manag. Econ. 2014, 2, 28–71. [Google Scholar]
- Voinea, L.; Albu, L. Raportul de Avertizare Timpurie privind Piata Muncii. Available online: http://www.bns.ro/wps/wcm/connect/6671933d-828a-4217-ae94-55766c865b1f/Raport+de+avertizare+timpurie+privind+piata+muncii.pdf?MOD=AJPERES&CACHEID=6671933d-828a-4217-ae94-55766c865b1f (accessed on 21 October 2014).
- Popa, D. Masuri Anti-Criza pe Piata Fortei de Munca. Available online: http://economie.hotnews.ro/stiri-finante_banci-7788197-studiu-masuri-anti-criza-piata-fortei-munca-vezi-analiza-masurilor-luate-pana-acum-scenariile-posibile-pentru-viitor.htm (accessed on 17 September 2014).
- Dan, S. Welfare and work: How and how much do TANF cash benefits affect the labor supply of single parents? Psychosoc. Issues Hum. Resour. Manag. 2014, 2, 34–50. [Google Scholar]
- Popescu Ljungholm, D. Transformational leadership behavior in public sector organizations. Contemp. Read. Law Soc. Justice 2014, 6, 76–81. [Google Scholar]
- Lamfalussy, A.; Corbu, I. Criza financiara a creditelor ipotecare americane. In Economie, Integrare, Eficienta; Editura Fundatia Romania de Maine: Bucharest, Romania, 2008; p. 264. (In Romanian) [Google Scholar]
- De Beaufort, V.; Summers, L. Women on boards: Sharing a rigorous vision of the functioning of boards, demanding a new model of corporate governance. J. Res. Gender Stud. 2014, 4, 101–140. [Google Scholar]
- Ryu, S.R.; Duvanova, D.S. Policy responsiveness in post-communist democracies: A study of promise-to-policy congruence. J. Self-Gov. Manag. Econ. 2014, 2, 7–27. [Google Scholar]
- Nica, E. Corporate practices in higher education. Psychosoc. Issues Hum. Resour. Manag. 2014, 2, 51–56. [Google Scholar]
- Le, T.; Gibson, J.; Oxley, L. Cost- and Income-Based Measures of Human Capital. J. Econ. Surv. 2003, 17, 271–307. [Google Scholar] [CrossRef]
- Furnham, A.; Lewis, A. The Economic Mind; St. Martin Press: New York, NY, USA, 1986. [Google Scholar]
- European Commission. GDP and beyond: Measuring progress in a changing world. Available online: http://eur-lex.europa.eu/legal-content/EN/TXT/?uri=CELEX:52009DC0433 (accessed on 30 October 2014).
- National Institute of Statistics. Available online: http://www.insse.ro/cms/ (accessed on 16 September 2014).
- The National Education Law, 1, Art. 8. 2011. Available online: http://www.dreptonline.ro/legislatie/legea_educatiei_nationale_lege_1_2011.php (accessed on 4 August 2014).
- Popescu Ljungholm, D. The performance effects of transformational leadership in public administration. Contemp. Read. Law Soc. Justice 2014, 6, 110–115. [Google Scholar]
- Capannelli, E. Capannelli (BM): România trebuie să investească în educație; 15%–20% din populație nu are o educație la nivel elementar. Available online: http://www.agerpres.ro/economie/2014/10/02/capannelli-bm-romania-trebuie-sa-investeasca-in-educatie-15-20-din-populatie-nu-are-o-educatie-la-nivel-elementar-16-49-03 (accessed on 10 October 2014).
- Figel, J.; Almunia, J. Date Cheie privind Educatia Europeana in Anul 2009. Available online: http://eacea.ec.europa.eu/education/eurydice./documents/key_data_series/105RO.pdf (accessed on 10 August 2014).
- Kanfer, R.; Ackerman, P.L. Aging, Adult Development and Work Motivation. Acad. Manag. Rev. 2004, 29, 440–458. [Google Scholar]
- Landy, F.J.; Becker, W.S. Motivation theory reconsidered. In Work in Organizations; Staw, B.M., Cummings, L.L., Eds.; Jai Press: Greenwich, CT, USA, 1990; pp. 1–38. [Google Scholar]
- Popescu, G.H. The economic implications of ehealth and mhealth technologies. Am. J. Med. Res. 2014, 1, 31–37. [Google Scholar]
- Lazaroiu, G. Besley on Foucault’s discourse of education. Educ. Philos. Theory 2013, 45, 821–832. [Google Scholar] [CrossRef]
- Inglehart, R.F.; Borinskaya, S.; Cotter, A.; Harro, J.; Inglehart, R.C.; Ponarin, E.; Welzel, C. Genetic factors, cultural predispositions, happiness and gender equality. J. Res. Gender Stud. 2014, 4, 32–100. [Google Scholar]
- Boling, R.; Burns, M.; Dick, G. Social networking and small business: An exploratory study. Contemp. Read. Law Soc. Justice 2014, 6, 122–129. [Google Scholar]
- Popescu, G.H. Labor market regulation and the shadow economy. Econ. Manag. Financ. Mark. 2014, 9, 110–115. [Google Scholar]
- Toader, E. The effects of rising healthcare costs on the US economy. Am. J. Med. Res. 2014, 1, 44–50. [Google Scholar]
- Kohn, A. Why incentive plans cannot work. Harvard Bus. Rev. 1993, 7, 54–63. [Google Scholar]
- Locke, E.A.; Latham, G.P. What should we do about motivation theory? Six recommendations for the twenty-first century. Acad. Manag. Rev. 2004, 29, 388–403. [Google Scholar]
- Gaetano, A. “Leftover women”: Postponing marriage and renegotiating womanhood in urban China. J. Res. Gender Stud. 2014, 4, 124–149. [Google Scholar]
- Constantin, V.D. The role of the health workforce in the healthcare system. Am. J. Med. Res. 2014, 1, 38–40. [Google Scholar]
© 2015 by the author; licensee MDPI, Basel, Switzerland. This article is an open access article distributed under the terms and conditions of the Creative Commons Attribution license (http://creativecommons.org/licenses/by/4.0/).
Share and Cite
Ștefănescu-Mihăilă, R.O. Social Investment, Economic Growth and Labor Market Performance: Case Study—Romania. Sustainability 2015, 7, 2961-2979. https://doi.org/10.3390/su7032961
Ștefănescu-Mihăilă RO. Social Investment, Economic Growth and Labor Market Performance: Case Study—Romania. Sustainability. 2015; 7(3):2961-2979. https://doi.org/10.3390/su7032961
Chicago/Turabian StyleȘtefănescu-Mihăilă, Ramona Olivia. 2015. "Social Investment, Economic Growth and Labor Market Performance: Case Study—Romania" Sustainability 7, no. 3: 2961-2979. https://doi.org/10.3390/su7032961
APA StyleȘtefănescu-Mihăilă, R. O. (2015). Social Investment, Economic Growth and Labor Market Performance: Case Study—Romania. Sustainability, 7(3), 2961-2979. https://doi.org/10.3390/su7032961