3.1. Results of the Assessment of the SFS Production
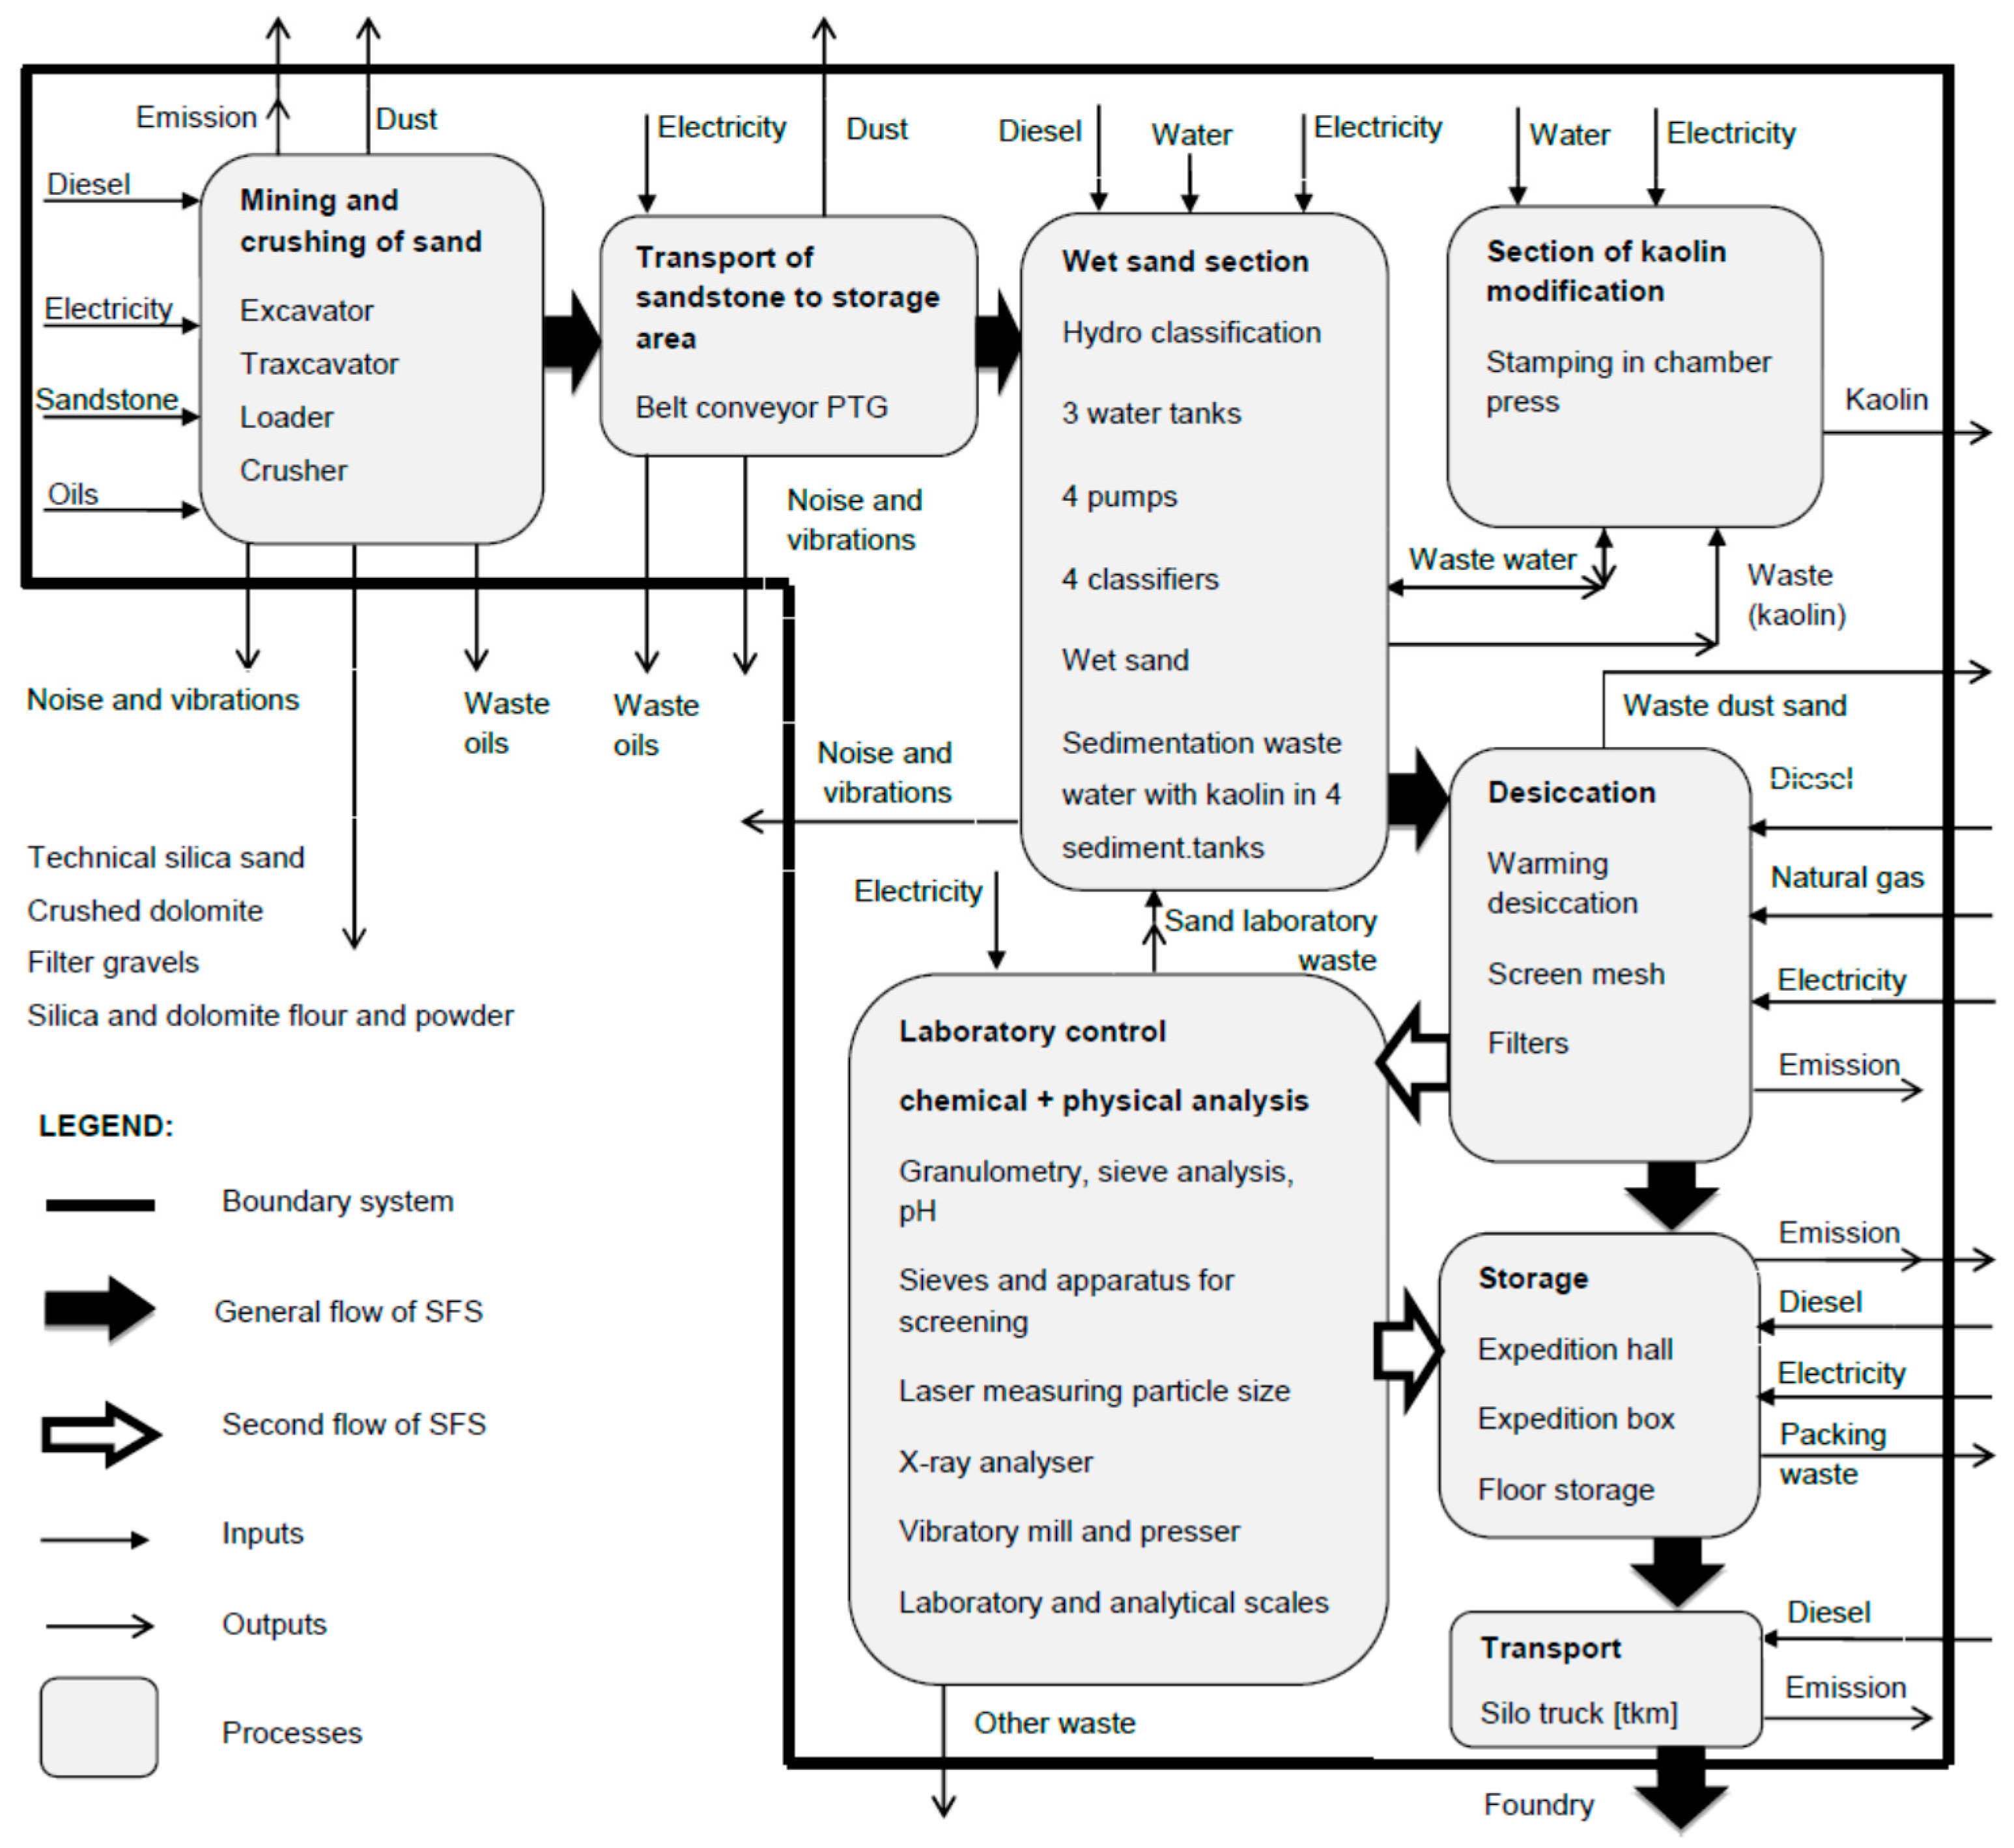
Inputs and outputs (
Figure 1,
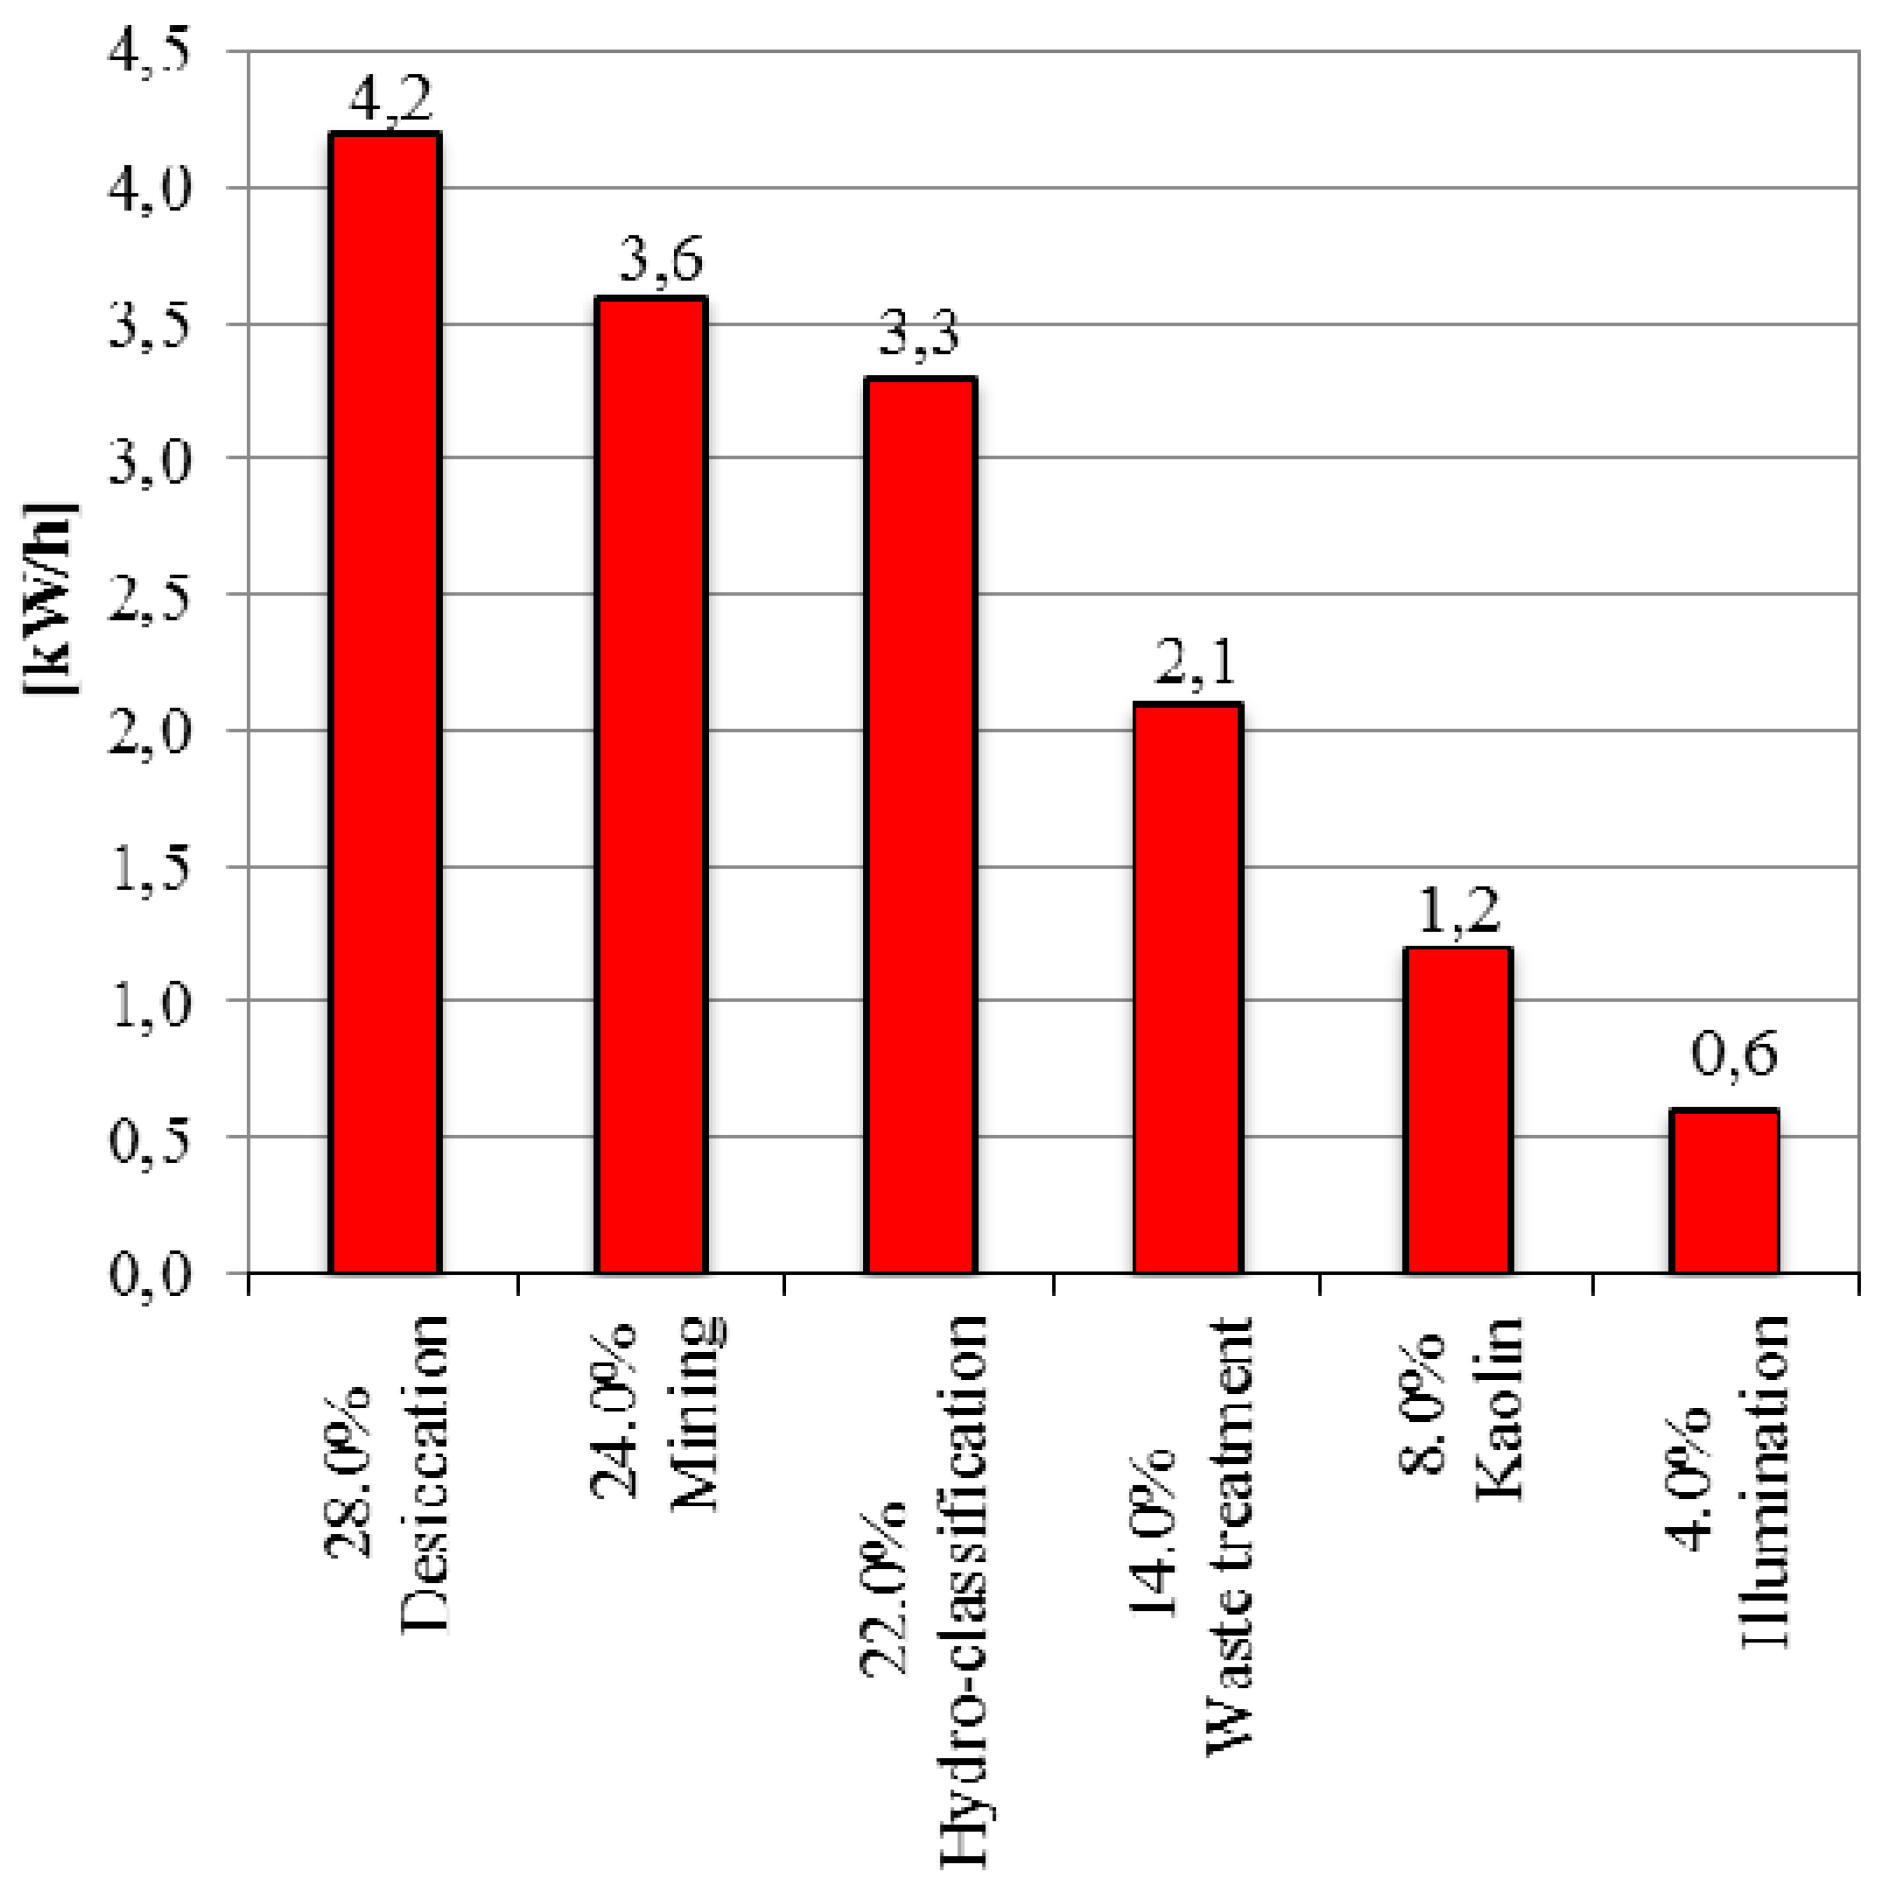
Table 1) are included into the particular negative effects within the frame of selected endpoints (sources, ecosystem quality and human health). Total electricity consumption (
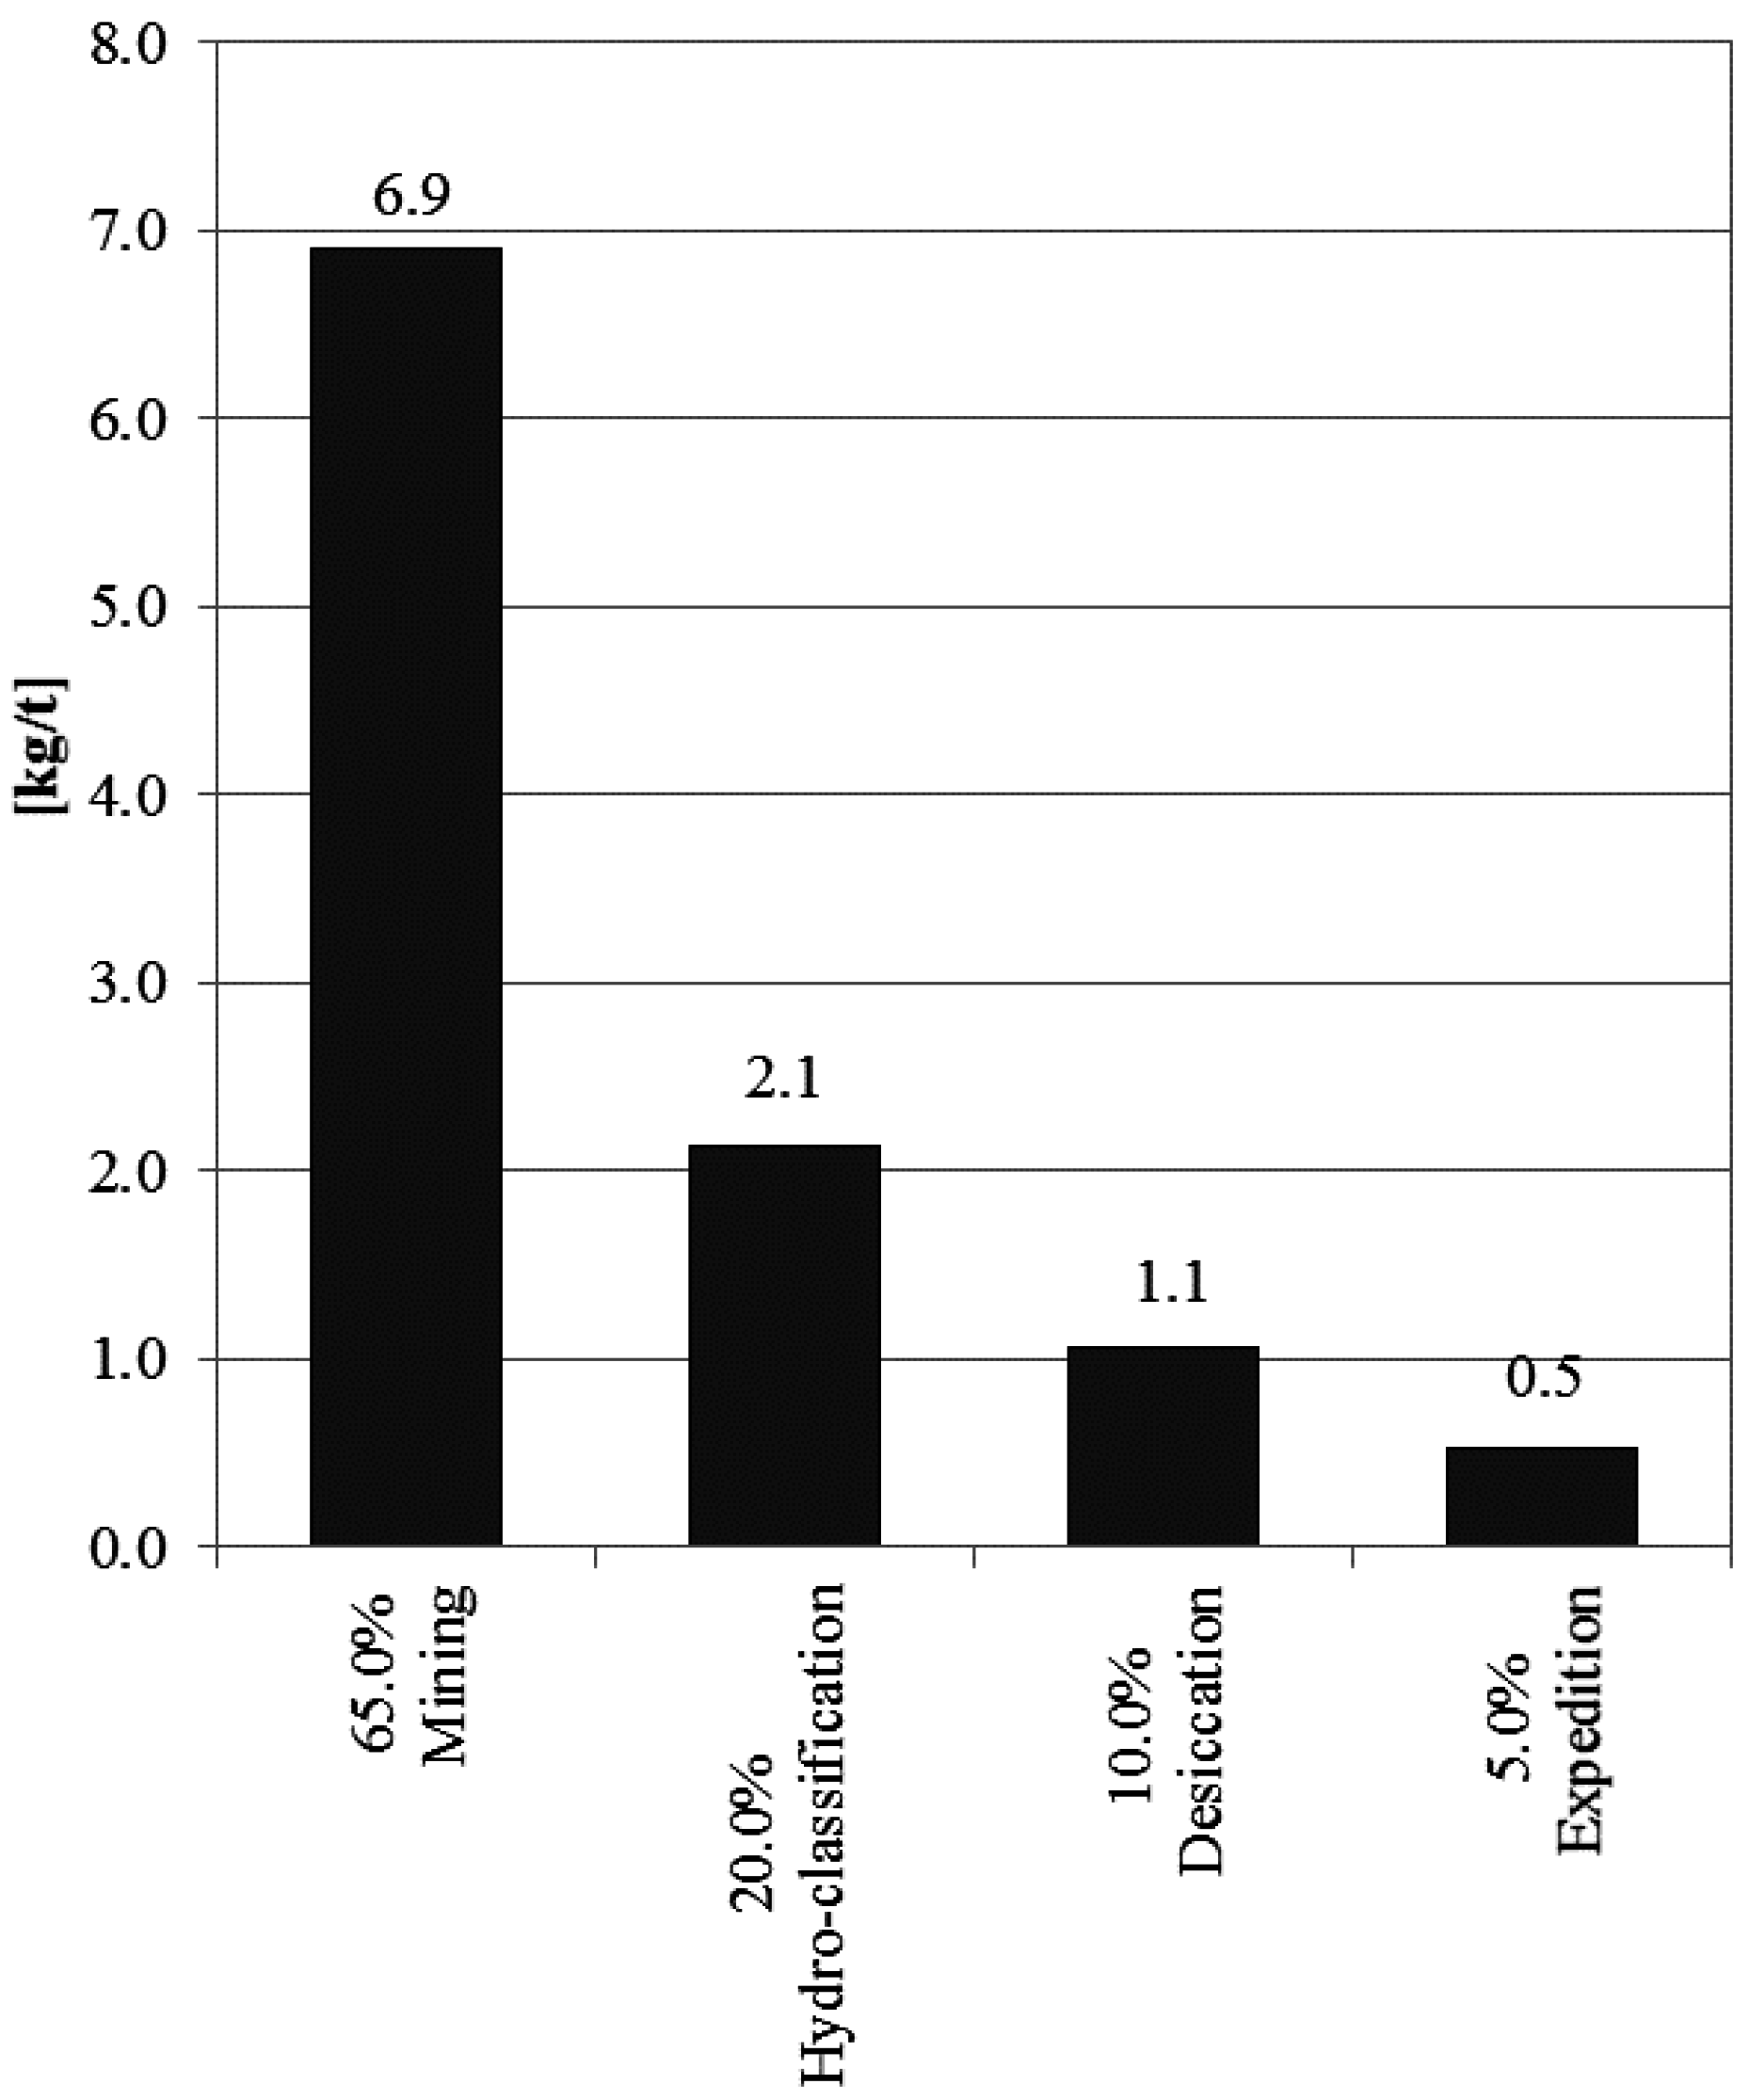
Figure 2) of 15 kWh/t represents the ratios of electricity consumption in particular SFS processes. Diesel consumption (
Figure 3) represents the ratios of diesel consumption in the SFS processes. Other important consumptions are natural gas 11.0 m
3/t, oil 1.11 kg/t, water 0.01 m
3/t and sand 1.03 kg/t (
Table 1).
Figure 2.
Electricity consumption during SFS production.
Figure 2.
Electricity consumption during SFS production.
Figure 3.
Diesel consumption during SFS production.
Figure 3.
Diesel consumption during SFS production.
The results of LCA study of the SFS production (with system boundaries from cradle—to caudal gate—to the transport) are calculated to the percentage ratios in the particular groups of impacts. The adjustment of the databases, included in the software, allows the elaboration of the study and evaluation of the SFS life cycle in the selected and further selectable LCA scope. Whole system remains multivariable and it could be simulated further.
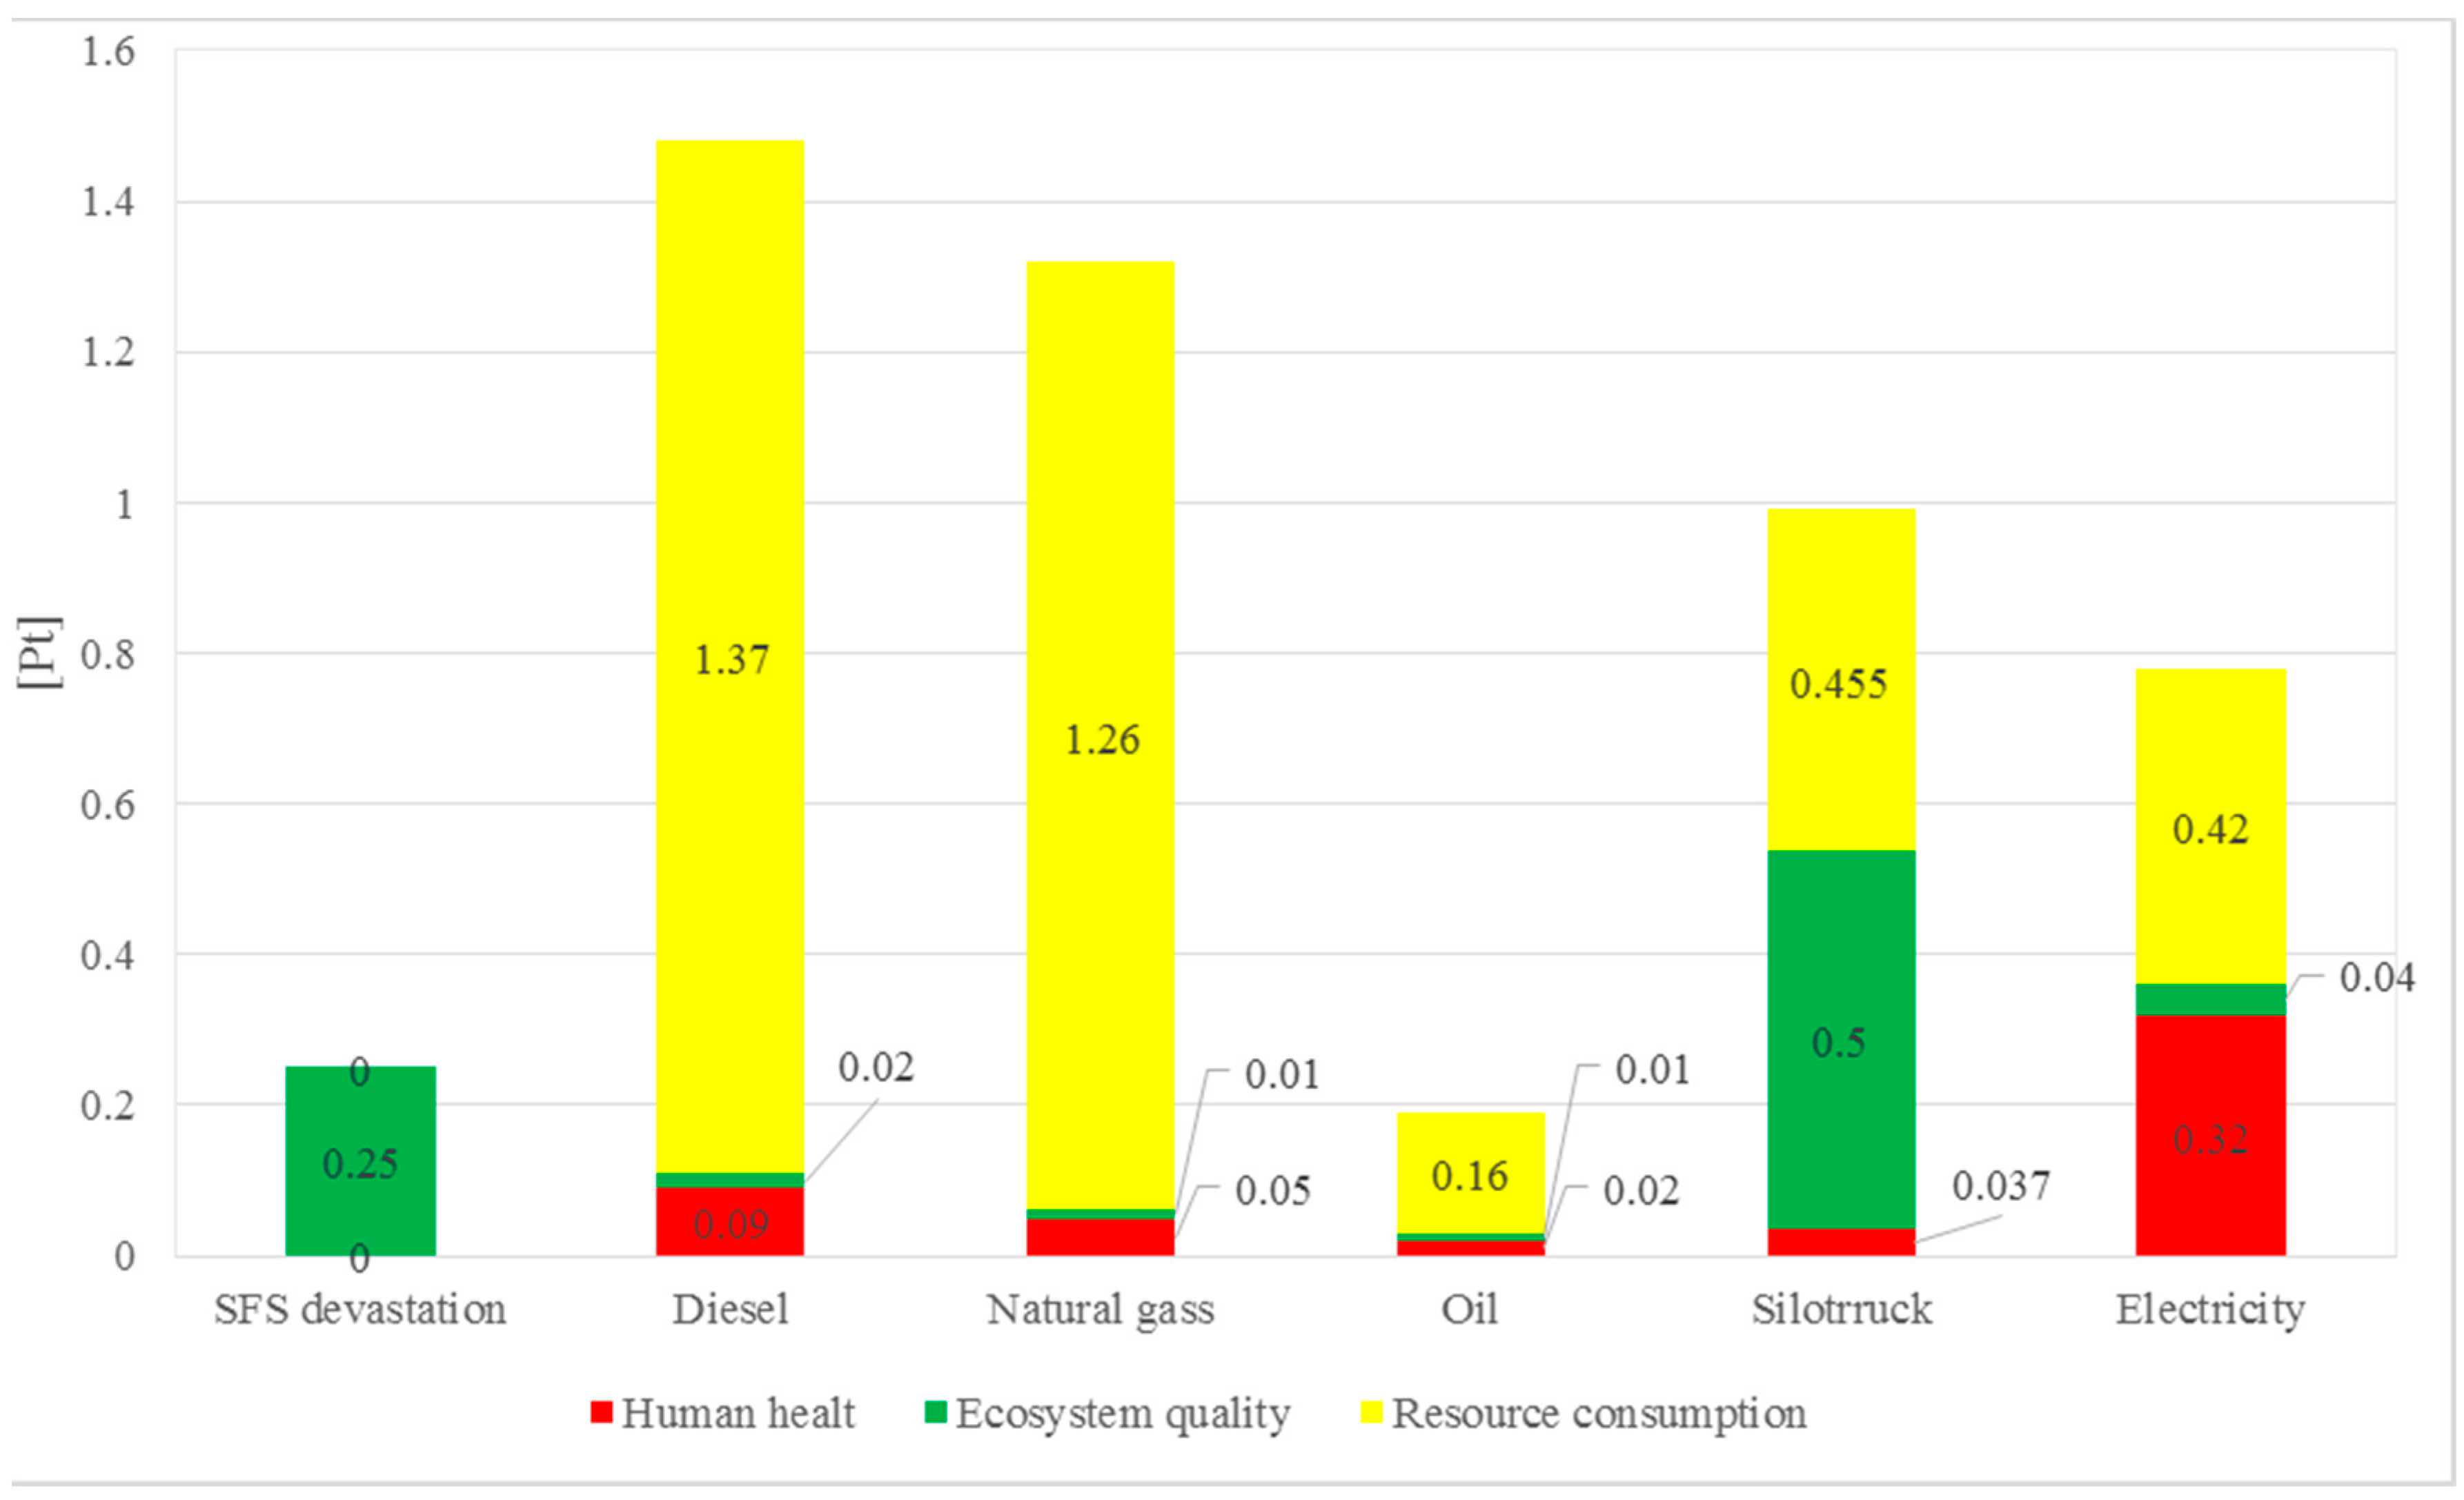
The greatest overall effect on these results has the consumption of diesel 32.4% and natural gas 28.7%, the consumption of electricity 17.2%, transport 12.2%, devastation by the SFS 5.35% and the consumption of oils 4.14% (
Table 4, Total). The highest contribution (65%, 6.9 kg/t) to the diesel consumption is connected with the processes of the SFS exploitation. The percentage impact of the SFS production on the environment received from the LCA study in the endpoint is: natural sources consumption 70.9%, ecosystem quality 18.2% and human health 10.9% (
Table 4, Share).
Table 4.
Results of the assessment of the SFS production in endpoints, Eco-indicator 99.
Table 4.
Results of the assessment of the SFS production in endpoints, Eco-indicator 99.
| Endpoint | Resources | Ecosystem Quality | Human Health | Total Impact |
|---|
| Unit | % | % | % | % |
| SFS devastation | 0 | 5.35 | 0.00 | 5.35 |
| Diesel | 29.80 | 0.54 | 2.06 | 32.40 |
| Natural gas | 27.40 | 0.26 | 1.01 | 28.70 |
| Oil | 3.57 | 0.16 | 0.40 | 4.14 |
| Silo truck | 0.81 | 10.90 | 0.49 | 12.20 |
| Electricity | 9.26 | 0.96 | 6.94 | 17.20 |
| Share | 70.90 | 18.20 | 10.90 | 100.00 |
Concerning unit processes included in mining, the consumption of non-renewable resources was identified to have an important impact.
Table 4 show that the largest contribution to the non-renewable resources consumption, in the center for the sand processing, has diesel at first place (29.8%), natural gas at second place (27.4%) and third place is occupied by electricity (9.26%).
After the mold is uncovered by the excavator, sandstone rock is disrupted by traxcavator TD-40G in a checkboard manner. The material is loaded by the loader to the crusher, from which it is transported by a belt conveyor to other processes. This system is the most profitable in terms of the working distances and the efficiency of mining. Mining processes are interesting with regard to the potential greater amount of the emission produced by the combustion processes of the motors (
Table 2) and by the dustiness of the mechanisms. The emissions, arisen from the dustiness, need to be measured
in situ.
In the mining model, it is important to sensibly adjust the functions such as the amount of consumed electricity in time, the mode of electricity production, the amount of oil waste produced into the soil and water, emissions of dust particles (an assumption of fugitive dust),
etc. The system could be modeled either as an ensemble or in parts. The redistribution of the consumption and production effects in particular processes in the mining model is presented in
Table 5.
Table 5.
Overview of the resources consumption and production of the emission in the mining model.
Table 5.
Overview of the resources consumption and production of the emission in the mining model.
| Mining | Unit | Diesel | Oil | Electricity | Emission | Total |
|---|
| Loader | % | 23.0 | 3.2 | 0.0 | 2.6 | 28.9 |
| Excavator | % | 12.3 | 3.0 | 0.0 | 2.5 | 17.8 |
| Crusher | % | 0 | 0.9 | 4.9 | 0.0 | 5.8 |
| Traxcavator | % | 33.4 | 3.6 | 0.0 | 3.0 | 40.0 |
| Belt conveyor | % | 0 | 0.9 | 6.5 | 0.0 | 7.4 |
| Share | % | 68.8 | 11.7 | 11.4 | 8.0 | 99.9 |
The impact of the SFS devastation, discussed in
Figure 4, is not taken into consideration in this point.
The electricity is another important category with 17.2% of the total impact. The overall electricity consumption in the SFS production is 15 kWh/t. The electricity consumption for particular processes is depicted in
Figure 2. For the evaluation of the impact in endpoints, the Electricity LV Ecoinvent database was used. The database contains information about the transformation of the middle voltage to the low voltage electricity and about the distribution of the low voltage, the loss of electricity and the emissions released into the atmosphere. The impacts were calculated separately for each type of electricity production and the results of electricity production are expressed as an average of four years. Small differences can occur due to rounding. Transport and transformation losses (13.4%) as well as material and construction requirements for transmission and distribution are included (described in System model Energy Carriers) [
31]. Equipment management, automatization and optimization could contribute to the reduction of the impact and to the achievement of energy savings. Other alternative arrangements are discussed in papers by [
34,
35].
Figure 4.
Results of the assessment of the SFS production in endpoints, Eco-indicator 99.
Figure 4.
Results of the assessment of the SFS production in endpoints, Eco-indicator 99.
The low water consumption (0.01 m3/t) is yet another important element identified and it represents a positive aspect in the sand mining process. Water comes from the sandstone mining center and kaolin processes. Hydro classification process works in a closed cycle, in which polluted kaolin water is purified in settling tanks and re-circulated into the production. The seepage water is accumulated in lakes located in the mining area from where it is reused in the production process. Regarding the impact on the environment, the hydro classification process represents the important positive impact of working in the closed cycle. This positive fact is not fully included in this paper. LCA study partially includes the effect of water consumption, diesel and oil consumption by the loader (diesel 2.1 kg/t, oil 0.276 kg/t) and electricity consumption 2.1 kWh/t. Hydroclassification together with all the water related processes is hence important for the sustainable disposal with the non-renewable resources.
The next evaluated unit process in the SFS production is the utilization of kaolin waste material in ceramic industry. Before such utilization kaolin was a waste. Precautions against the waste production allowed the formation of raw material from the waste material. This fact contributes to the decrease of waste production and economization (or more precisely wastage) of raw material resources. Other adjacent products e.g., filter sand, technical sand, quartz silica and dolomite powders, which were waste materials in the past, became the raw material for the next production. This fact was not included in the study. Concerning properties and amount, other waste coming from the SFS production, i.e., common waste, waste from packaging, laboratory waste, etc., is not interesting for this study. Only the negative effect of communal appliances, kaolin (1.2 kWh/t) and water waste treatment (2.1 kWh/t) electricity consumptions are included.
In relation to the aims of this work, the transport of SFS for its next usage is selected by Silo trucks. Emissions from the transport of 1 ton of SFS for 100 km are involved in the database program. The effects on the ecosystem quality, the resource consumption and production of large amounts of emissions in the transport by Silo trucks represent an important impact on the environment (12.2% for 100 tkm). The pump (0.1 tkm), which is installed on the trailer of the Silo truck, has the impact of 0.11%. All information about the operation, production, services, vehicle disposal as well as about the construction, services and disposal of motorways were included into the used Transport, lorry 28 t/CH S, database. The database was also complemented with the data from the Silo truck pump´s consumption. The transport by Silo truck enables the transport of the raw material directly from the particular utility processes. It means that on-site of the SFS utilization the energy needed for the manipulation is lost, there are no particulate pollutants and the storage area is decreased as well. On the other hand, the transport database has been modified by the negative effects on the ecosystem quality, similarly as in the case of the mining process. The reduction of the transport impacts could be proposed according to the works by [
4,
5,
14,
36,
37,
38,
39]. The truck transport has a significant effect on the environment in terms of the transformation of the land by the network of roads, the amount of emissions emitted into the atmosphere or the consumption of non-renewable resources,
etc.


