1. Introduction
Sustainability is a significant factor that is reshaping the design and construction of new facilities due to increasing government regulations and greater environmental awareness of the general public. Incorporating sustainability in construction can result in desirable building attributes such as reduced resource consumption, improvement in environmental performance, and providing a healthier and more productive work environment for employees. With these benefits getting significant recognition in today’s world, numerous federal agencies, institutions, and local governments, are now required to incorporate sustainability into the design and construction of new construction projects [
1]. In North America and some Asian countries, this is largely accomplished through the Leadership in Engineering and Environmental Design (LEED
®) certification program. LEED is a third-party certification program established by the United States Green Building Council (USBGC) (Please note that there are several other green building rating systems and LEED is one of them). LEED is a framework that enables building owners and operators to identify and implement practical and measurable green building design, construction, and operations and maintenance solutions. The intent behind the creation of LEED was to have a common standard of measurement, and promote integrative, whole building design practices [
2]. LEED has now developed into a comprehensive system of interrelated standards covering all aspects of the development and construction process [
2]. LEED has revolutionized the marketplace as the world’s premier benchmark for design, construction, and operation of high-performance green buildings [
3]. Currently, projects with LEED certification can be found in over 140 countries [
3].
LEED is a flexible suite of rating systems that can be applied to various building types at any point in the building’s lifecycle. The LEED standard is continuously updated and improved by the USGBC as the green building industry moves fast, with new technologies and strategies emerging. Previous version, such as LEED 2009, focused on environmental problems and how they can be reduced, whereas latest version, LEED v4 system, asks what a LEED project should accomplish [
3,
4]. Mainly, the categories were modified, to the latest version (LEED v4), to add in issues of human health and to reflect built environment [
4].
The LEED rating system employs a point allocation process which serves as a method for producing a simplified guide for building project teams to identify complex and competing sustainability issues [
4]. This system enables the project teams to make the right green building decisions for their projects through an integrated process, ensuring that building systems work together effectively [
5]. This system allocates points to incentivize project teams to comply with requirements that best address the social, environmental, and economic outcomes identified by USGBC. A weighting process is used to allocate where a credit receives one or more LEED points based on each credit’s relative effectiveness at accomplishing the goals defined for the system. For more information about credit weightings, please refer to LEED v4 Impact Category and Point Allocation Process by Owens and Macken [
4].
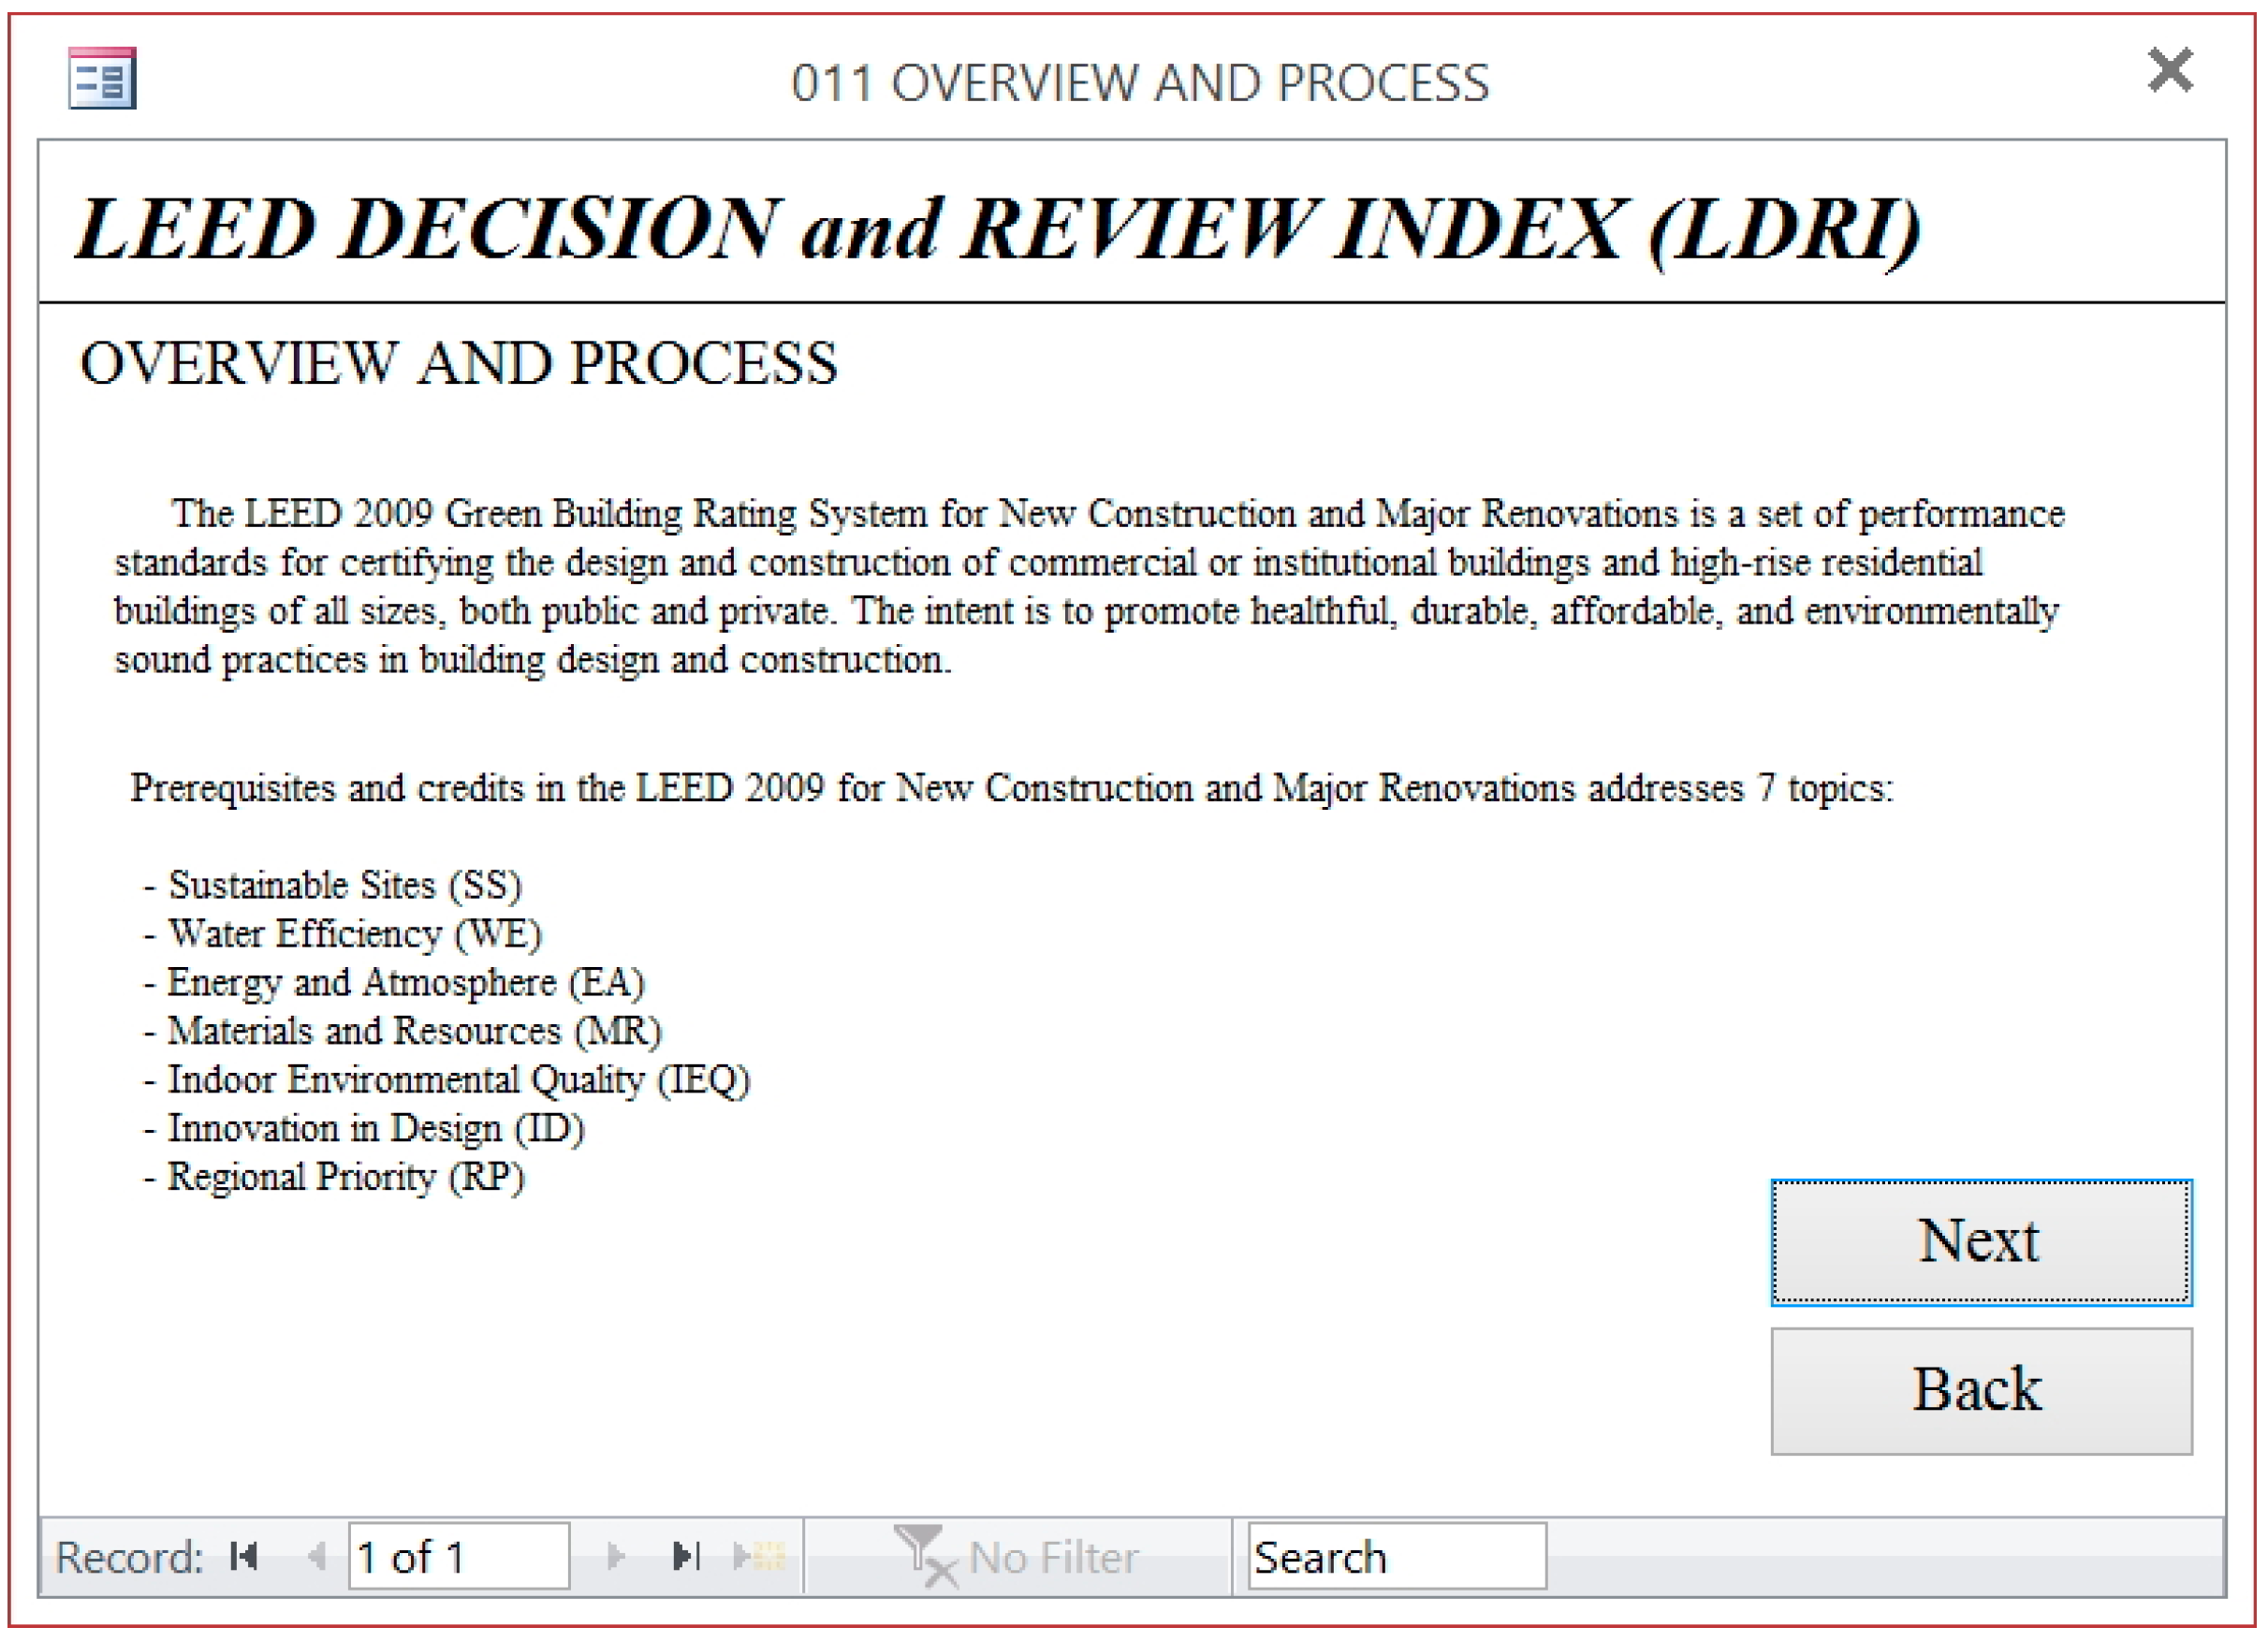
The LEED rating system (version 2009) consists of six categories (sustainable sites, water efficiency, energy and atmosphere, materials and resources, indoor environmental quality, innovation in design). These are derived from the Environmental Protection Agency’s (EPA) Tool for the Reduction and Assessment of Chemical and Other Environmental Impacts (TRACI) categories [
4], comprised of various prerequisites and credits carrying various point values. Prerequisites are required elements; credits are optional elements—strategies that projects can elect to pursue to gain points toward LEED certification [
5]. The categories are intimately linked and must be considered together for an effective integrative process [
5]. Achieving LEED certification requires satisfying all prerequisites and earning a minimum number of points as described in the applicable rating system.
The certification point system consists of 100 base points plus 10 additional points (a total of 110 points) and establishes the following certification levels:
| • Certified | 40–49 points |
| • Silver | 50–59 points |
| • Gold | 60–79 points |
| • Platinum | 80 points and greater |
LEED certification for a building has many benefits, including user health, environmental protection, lower long-term costs, and increasingly more government tax credits. Certification can also mean lower operating costs, increased building value, higher occupancy rates, and higher rents [
2]. Because of these reasons, LEED certification is gaining importance with each passing day. With the government regulations becoming stricter, many owners are voluntarily obtaining LEED certification. One example is a U.S. Department of Defense (DoD) policy on LEED. DoD policy [
6] mandates that new construction projects attain at a minimum, LEED-Silver certification. During the design phase, project teams consisting of the architect/engineer (A/E), contractor, and DoD representative (
i.e., Owner’s Representative) must develop a strategy for attaining LEED certification. Formulating the strategy is an iterative process requiring the owner to establish the project’s requirements and desired features; and the A/E determining the constructability, feasibility, and life cycle cost analysis of various sustainable design alternatives. The owner and the design team ultimately come to a consensus on which preferences and considerations carry a greater weight, or influence, in the final strategy.
Pursuing LEED certification is challenged with a perception that it is an expensive quest. The LEED certification process does have a cost itself. This cost comes in the form of USGBC correspondence, LEED consultants, and the hiring of the required Commissioning Authority (CxA) [
2]. However, Langdon [
7] and Mapp and Nobe [
8] identified that many projects achieved LEED with little or no added cost, and with budgets well within the cost range of non-green buildings with similar programs. Also, Langdon [
7] claimed that the feasibility and potential cost impact of a number of LEED points can be significantly increased or decreased based on the awareness of members of the design and construction teams with sustainable practices, and willingness to commit to them.
In many cases, cost is a significant driver, but it may not always be a dominating influence. If pursuing a particular LEED credit results in a substantial increase in initial cost without considerable payback shown in a life cycle cost analysis, the owner will likely decide against pursuing that credit. Alternatively, if attaining a certain credit is negligible in additional cost, the owner and design team may likely pursue it. However, that may not always be the case. For example, the U.S. Air Force Academy’s recent $40 M Center for Character and Leadership Development construction project was designed to utilize solar power from a photovoltaic array as an alternative energy source. The life cycle cost analysis indicated a marginal return on investment (ROI), but the decision to incorporate the photovoltaic array into the design was still implemented. Another example is the University of Texas’ new Engineering and Education Research Center (EERC). Arguably one of the least expensive points to attain in LEED is Sustainable Sites Credit 4.2: Alternative Transportation—Bicycle Storage and Changing Rooms. While very feasible from a cost perspective, the Dean of the School of Engineering (i.e., Owner’s Rep) made the decision early in the design process that shower facilities were not compatible with the overall design intent of the new EERC. These two examples illustrate that cost may not always drive the strategy in attaining LEED certification or credit choice. The examples also illustrate that the owner and A/E may not agree on every sustainable design initiative.
Every issue and every team member should be brought into the project at the earliest point to achieve the greatest effectiveness in cost and environmental performance. In detail, all project team disciplines gather information and data relevant to the project and establish a viable and realistic LEED credit strategy in an integrative process. The process begins with holding a charrette, a workshop where participants (anyone involved in the project, usually include the owner, architects, engineers, consultants, contractors, landscape architect, commissioning agent,
etc.) combine brainstorming, discussion, and strategy development to create a shared vision, goal set, and understanding of the next steps for the project, organization, and steps towards LEED certification. The outcome of the charrette should include a first draft of the LEED scorecard. This scorecard is a preliminary rating developed by the team to help guide the development process toward LEED certification [
2]. The cycling of research about products and materials and charrette workshops should continue until the project systems are optimized for LEED certification [
3].
Currently, despite having general or best practices for this process, there is no comprehensive, systematic procedure or tool, in the academia or in the industry, for choosing the LEED credits appropriate for a particular project. In the academia, many researchers have developed or proposed the optimization/assessment/selection model for structure or envelope [
9,
10,
11], materials [
12,
13], fenestration [
14], environment [
15], roof assembly typology [
16], zero emission [
17], urban material flows and waste streams [
18] and design [
19,
20] for sustainable buildings. Alarcon
et al. [
21] proposed a decision support tool and an equation for assessing sustainability for industrial buildings. However, the researchers have not been able to find any comprehensive, systematic procedure or tool for choosing the appropriate LEED credits.
In the current practice, project teams go through the LEED categories one by one and there is also no formal procedure for comparison among the various LEED categories. El-adaway and Truax [
22] also confirm that no formal steps have been made towards the certification or documentation of applicable LEED credits by the USGBC. There are many factors that influence the choice of LEED categories and without a formal procedure for comparison of the decision making process, a successful low-cost LEED certified project cannot be achieved. Sometimes, there is also a conflict between the choice of credits among the team members (in particular, between the owner and the A/Es as seen in the two examples presented earlier in this paper). Because of the point variation in individual LEED credits, the costs associated with each credit, and the possible range of differences between the owner and A/E’s sustainable design preferences, arriving at an optimal strategy is challenging. Thus, there is a need to provide the owners and the A/Es a tool to compare between the LEED categories to arrive at the most desired LEED categories for a particular project. The objective of this paper is to develop such tool, named as LEED Decision and Review Index (LDRI) tool, which support the LEED integrative process during the charrette, and develop an optimization model that can be utilized to assist project teams determine which credits to pursue for LEED certification.
2. Research Methodology—LEED Decision and Review Index (LDRI) Tool
This study follows the “Systems Development Life Cycle (SDLC)” approach developed by Turban and McLean [
23]. The SDLC provides a “formal framework for designing and developing systems for the effective and efficient processing of information”. There are eight stages in the approach: (1) Project Initiation; (2) System Analysis and Feasibility Studies; (3) Logical Analysis and Design; (4) Development; (5) Implementation; (6) Operations; (7) Post Audit; and (8) Maintenance. This study executed the first five stages to develop the LDRI tool in its current version. The remaining steps would need to be done by industry to finalize and maintain the tool.
2.1. Stage 1. Project Initiation
The research project first begins with problem identification. As it has been described above, the researchers identified that, in current practice, project teams do not have a systematic procedure for choosing the LEED credits appropriate for a project. As there are many factors influencing the choice of LEED credits and no formal procedure for comparison in the decision making process, a successful low-cost LEED certified project is challenging.
2.2. Stage 2. Systems Analysis and Feasibility Studies
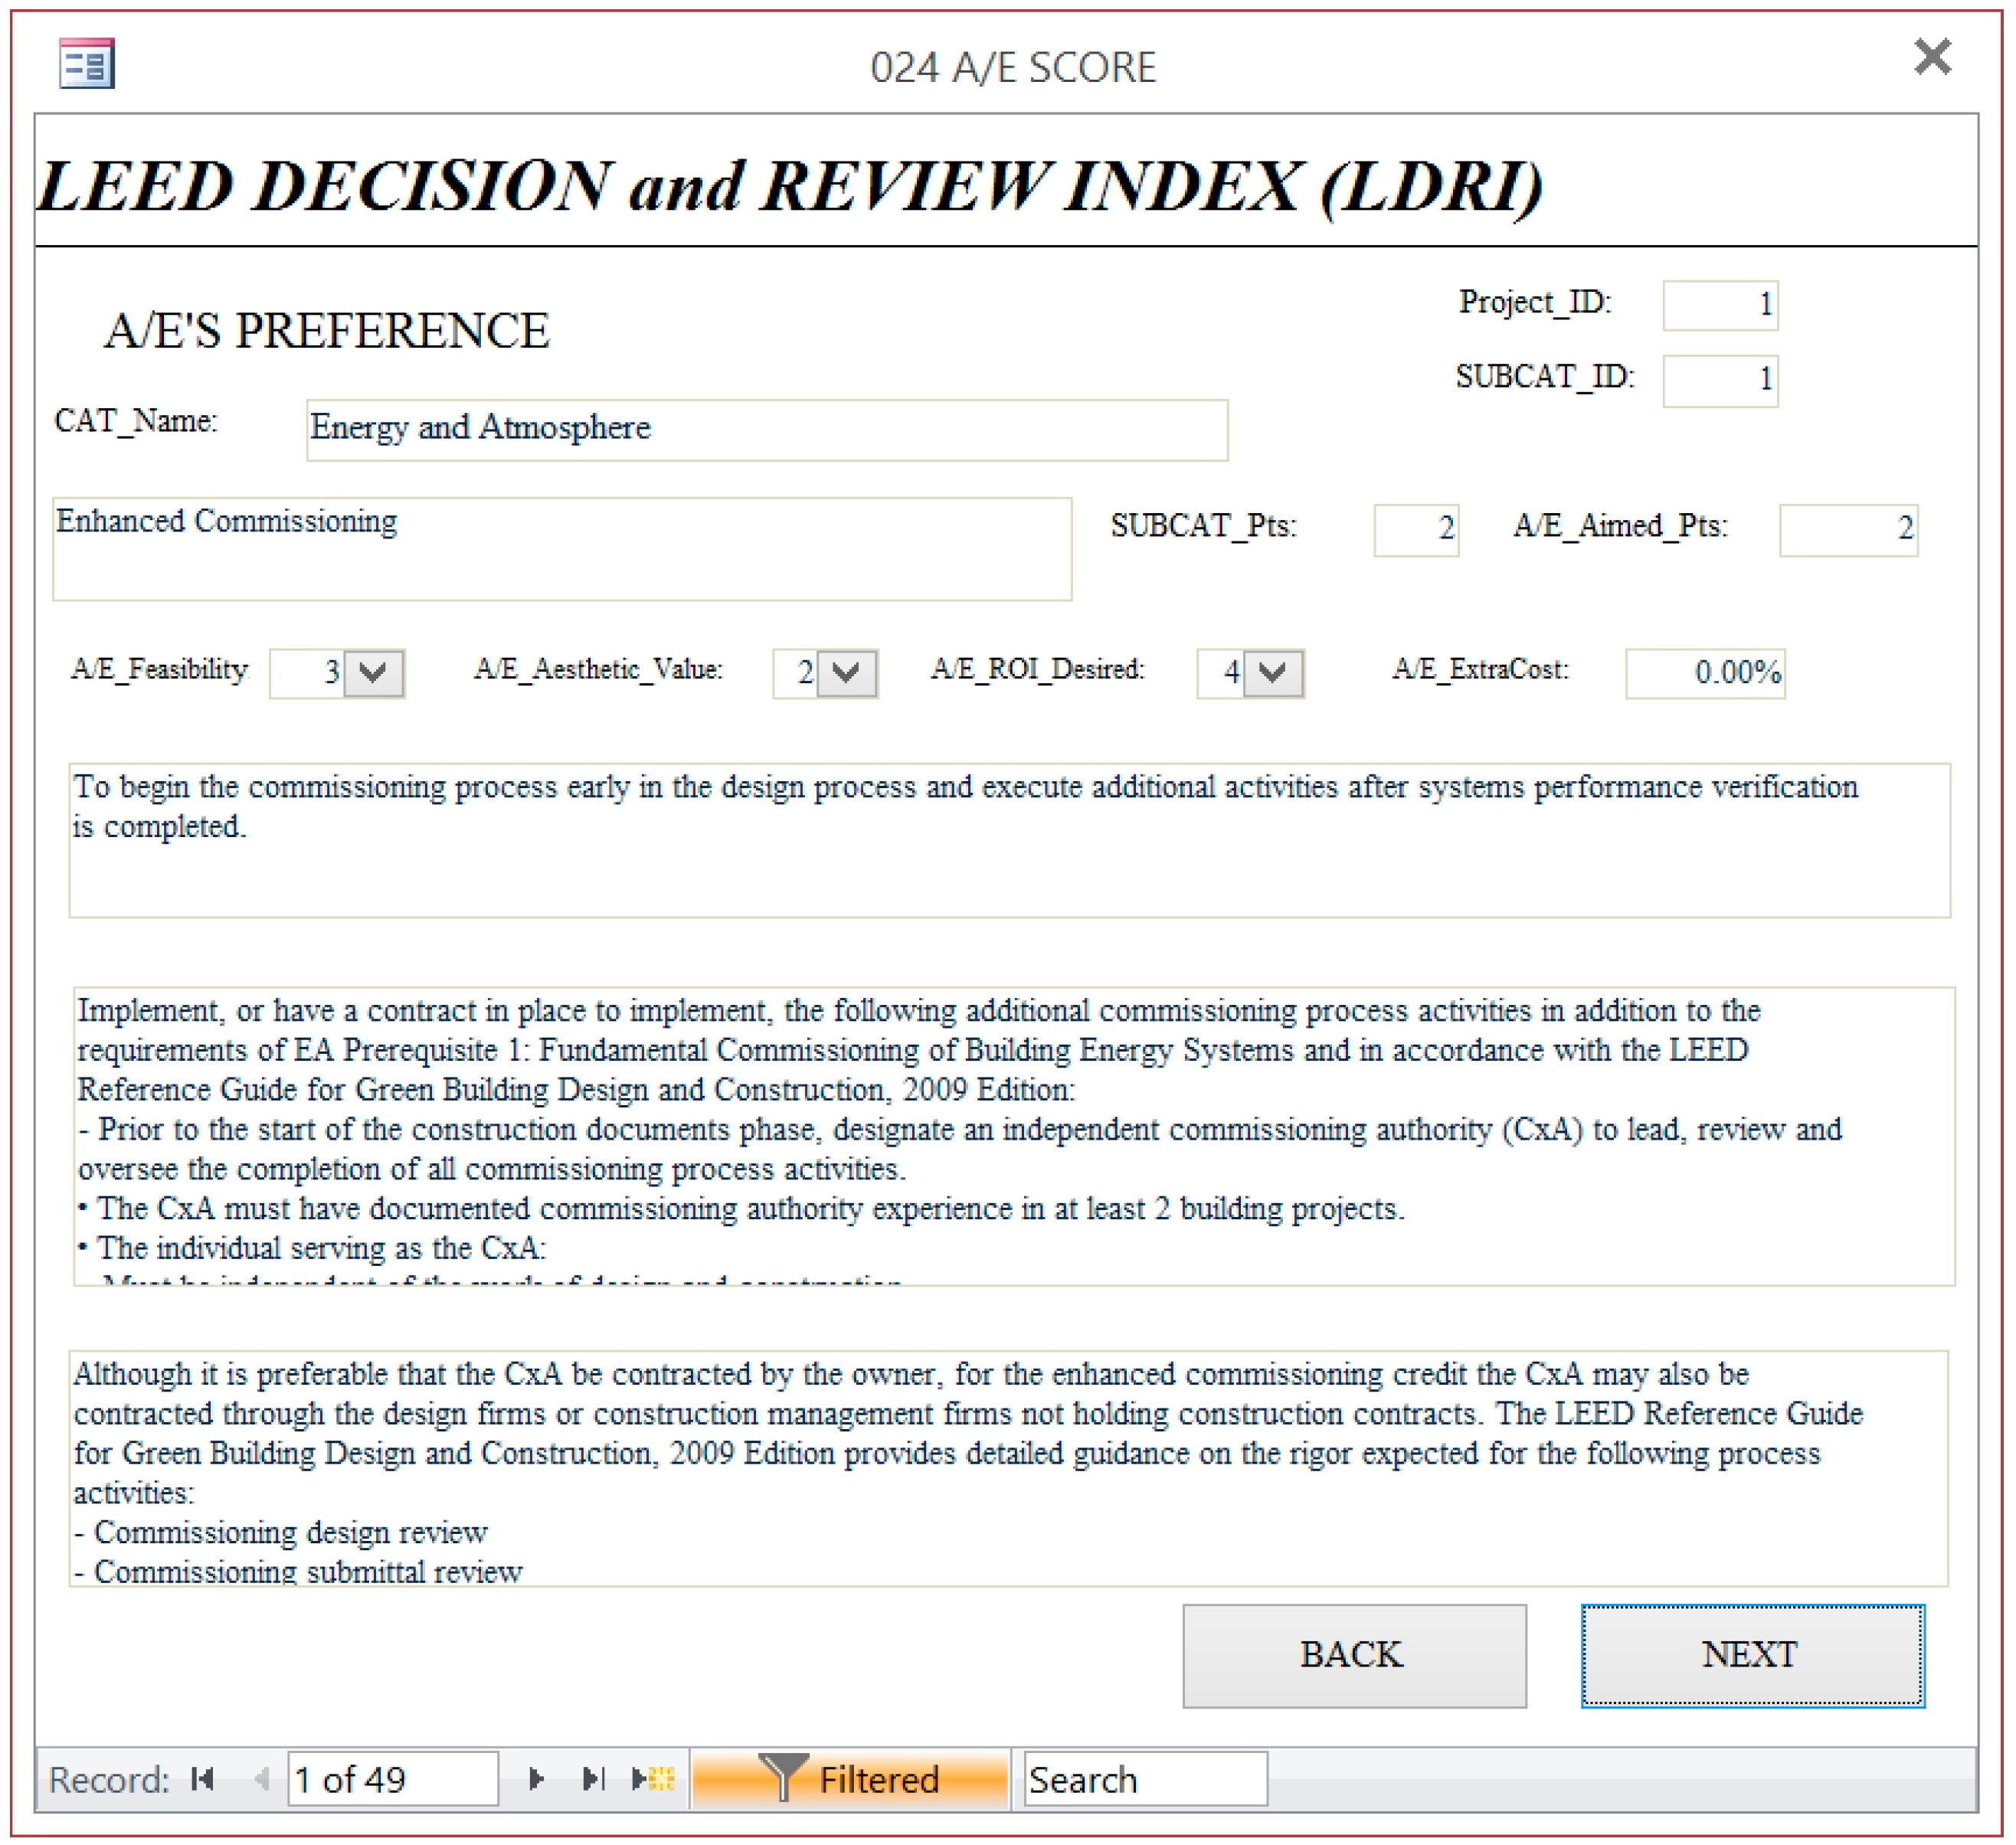
The second stage consists of two phases of analysis—Systems Analysis and Feasibility Study. In the Systems Analysis phase, the researchers developed a thorough understanding of the existing situation that is causing a problem through observation. For two weeks, one researcher visited a midrise office building project which was in the process of LEED certification in Seoul, South Korea. Another researcher visited a campus building which was also pursuing LEED certification in Austin, Texas. During each site visit, the researchers met a project manager and a LEED facilitator, to develop a thorough understanding of the existing situation and reviewed the documentation on the LEED process. As a result, the researchers identified there is a need for a tool which: (1) provides an option to select what drives the project (e.g., the owner’s wish, A/E’s preference, the cost associated with a LEED category, and the points associated with a particular LEED category); and (2) examines a LEED Credit from the owner’s and the A/E’s perspective to check for other potential benefits/risks associated with any LEED credit (e.g., feasibility, effect on the aesthetic value of the building, or ROI).
In the Feasibility Study phase, the researchers addressed the technology, economic, and organizational factors as Turban, McLean [
23] proposed. The summary of the Feasibility Study is as follows.
Technology: A tool that is built on a MS ACCESS platform which is easily available/procurable to minimize any additional cost on developing the necessary infrastructure would be useful. It requires a minimum of Intel Pentium 4 machine running Windows XP or higher with at least 256 MB RAM and 1 GB of free HD space.
Economics: A tool is cheap and easy to develop/procure.
Organizational Factors: A that tool takes into consideration requirements of all members of an organization/project.
2.3. Stage 3. Logical Analysis and Design
This stage considers the design of system from the user’s point of view and further development of an optimization model. In this stage, the researchers first identified information requirements and specified operations such as input, output, processing, and storage. To represent logical processes and data relationships, data flow diagrams and entity-relationship diagrams were used. The data flow of the LDRI tool is shown in
Figure 1.
Figure 1.
Leadership in Engineering and Environmental Design (LEED) Decision and Review Index (LDRI) data flow diagram.
Figure 1.
Leadership in Engineering and Environmental Design (LEED) Decision and Review Index (LDRI) data flow diagram.
As shown in
Figure 1, the LDRI tool collects input data from an owner and a LEED facilitator (A/E and/or consultant) as they are the main source of the data to make a decision. However, it is not intended to collect the data only from the two sources; it is designed for them to lead the data collection and unify the information. The data should be collected from anyone who is involved in the project such as owner, architects, engineers, consultants, contractors, landscape architect, commissioning agent,
etc. to achieve optimal result.
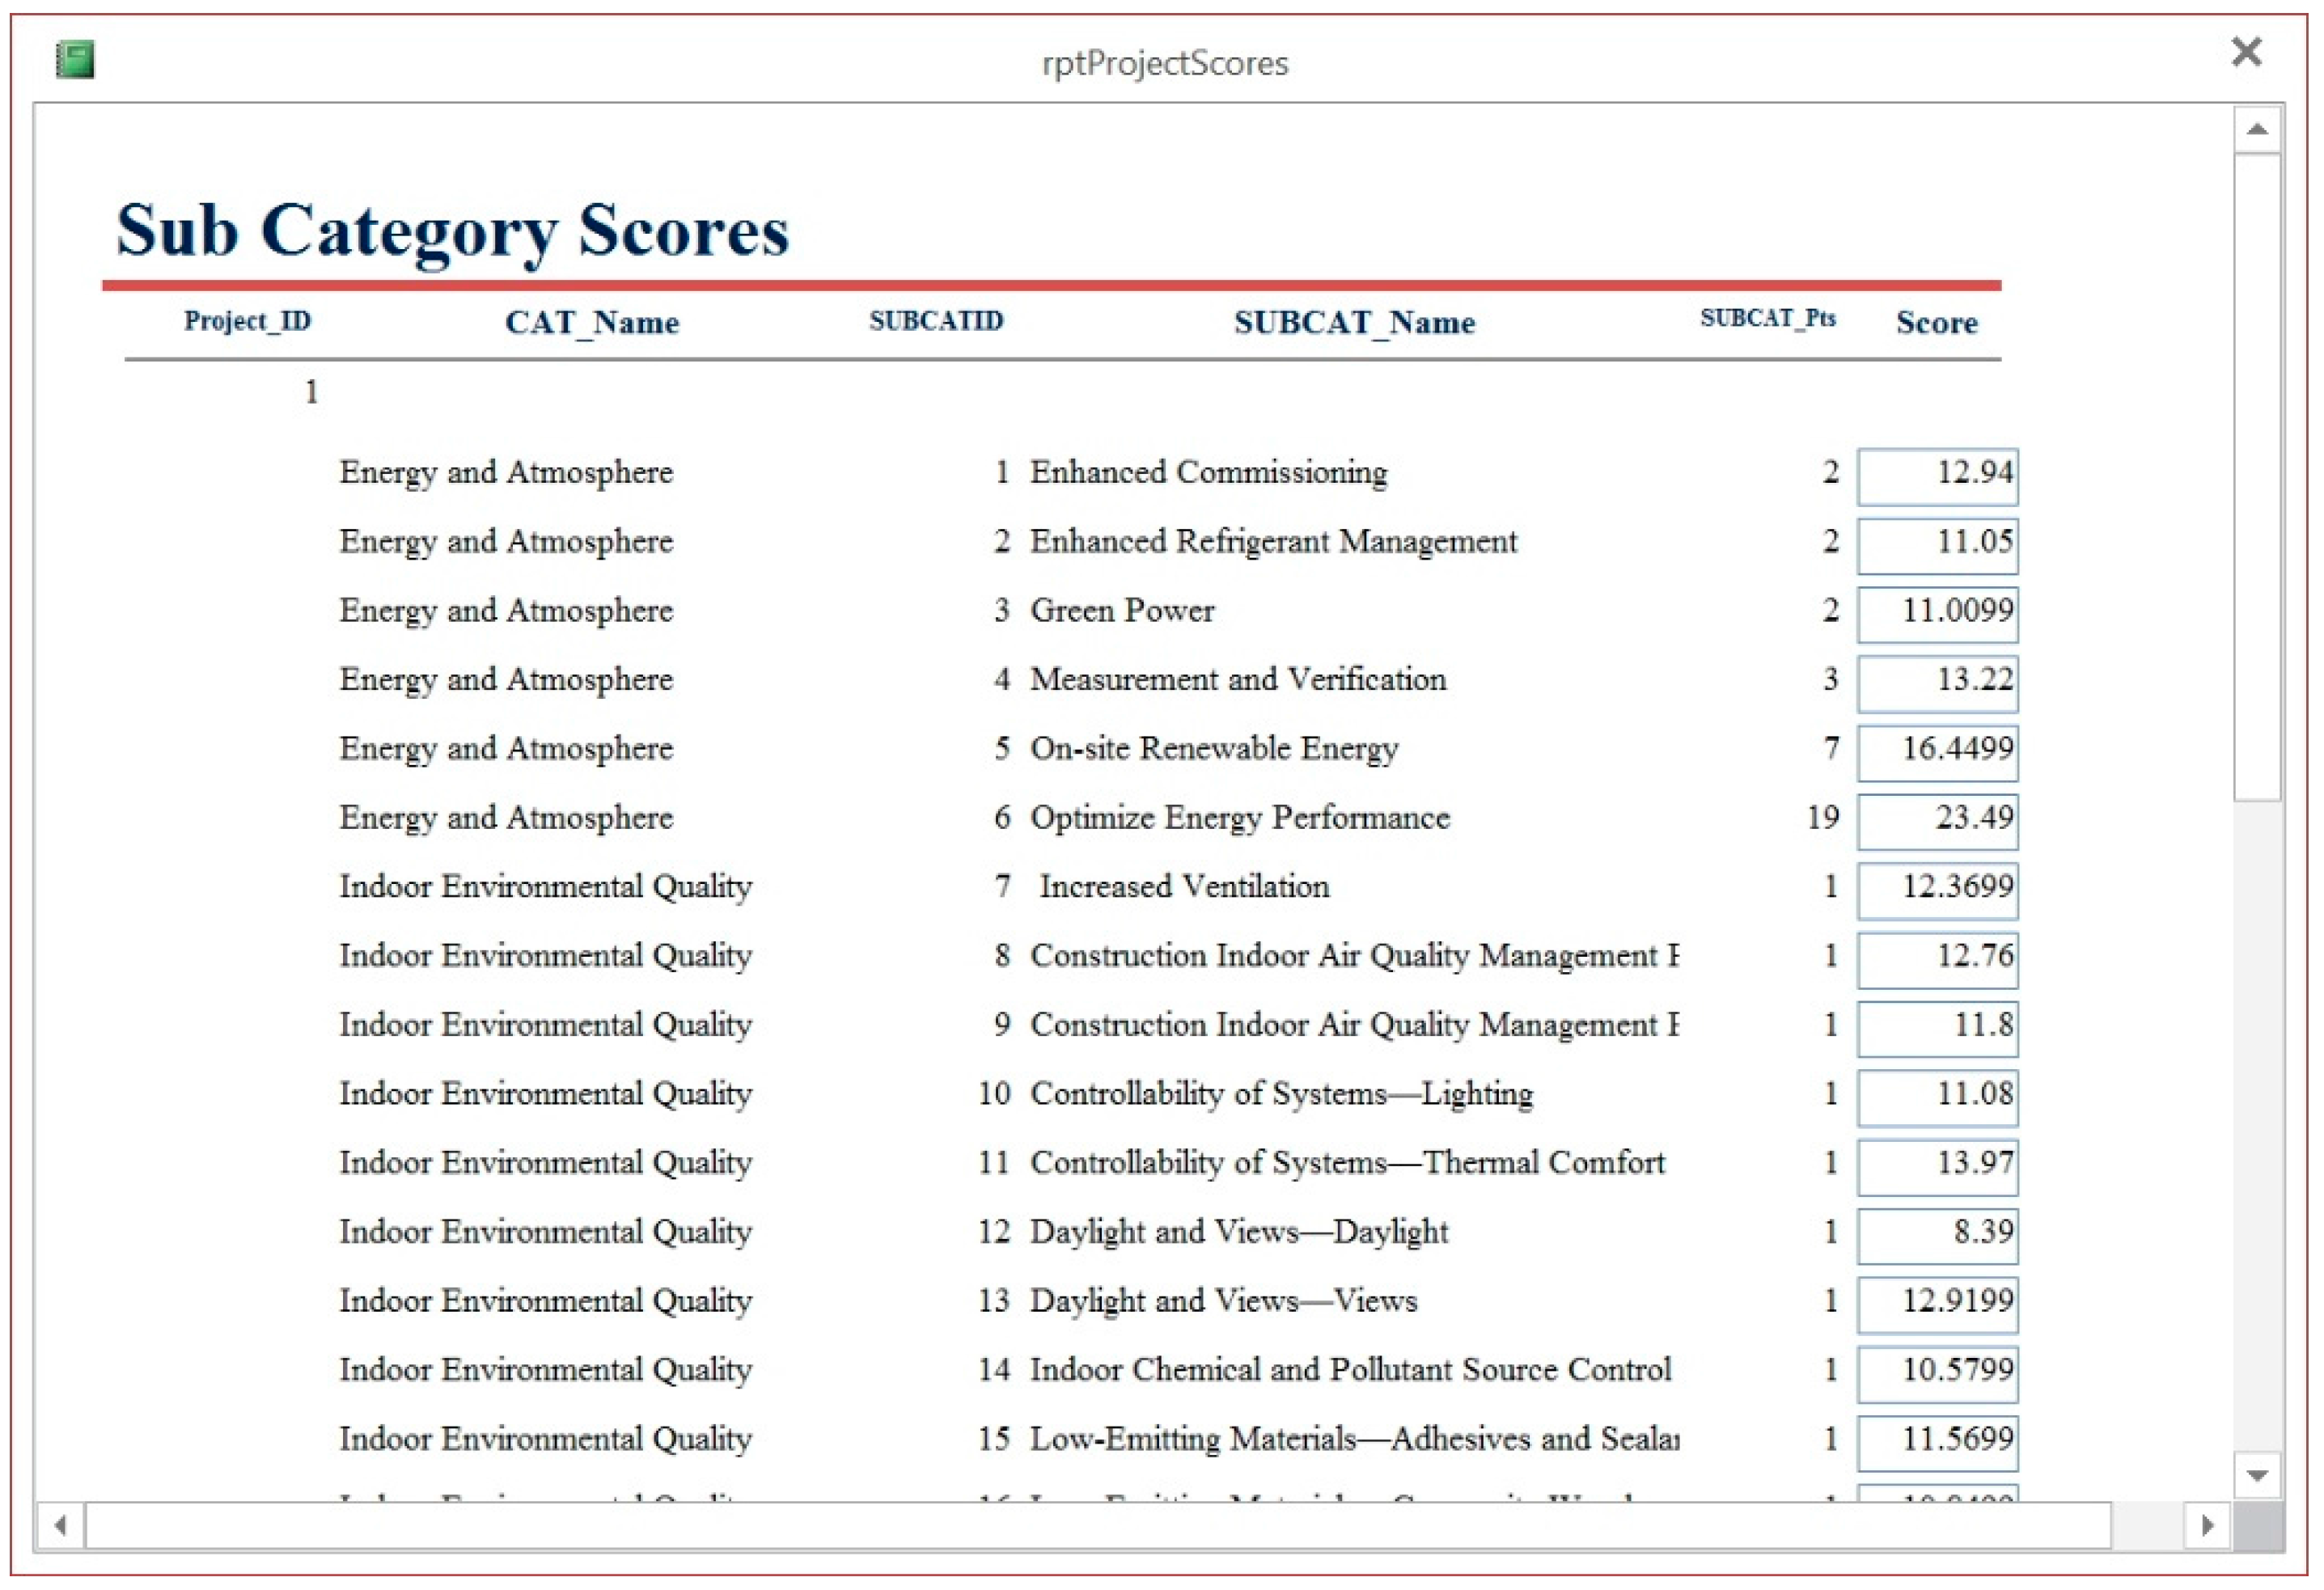
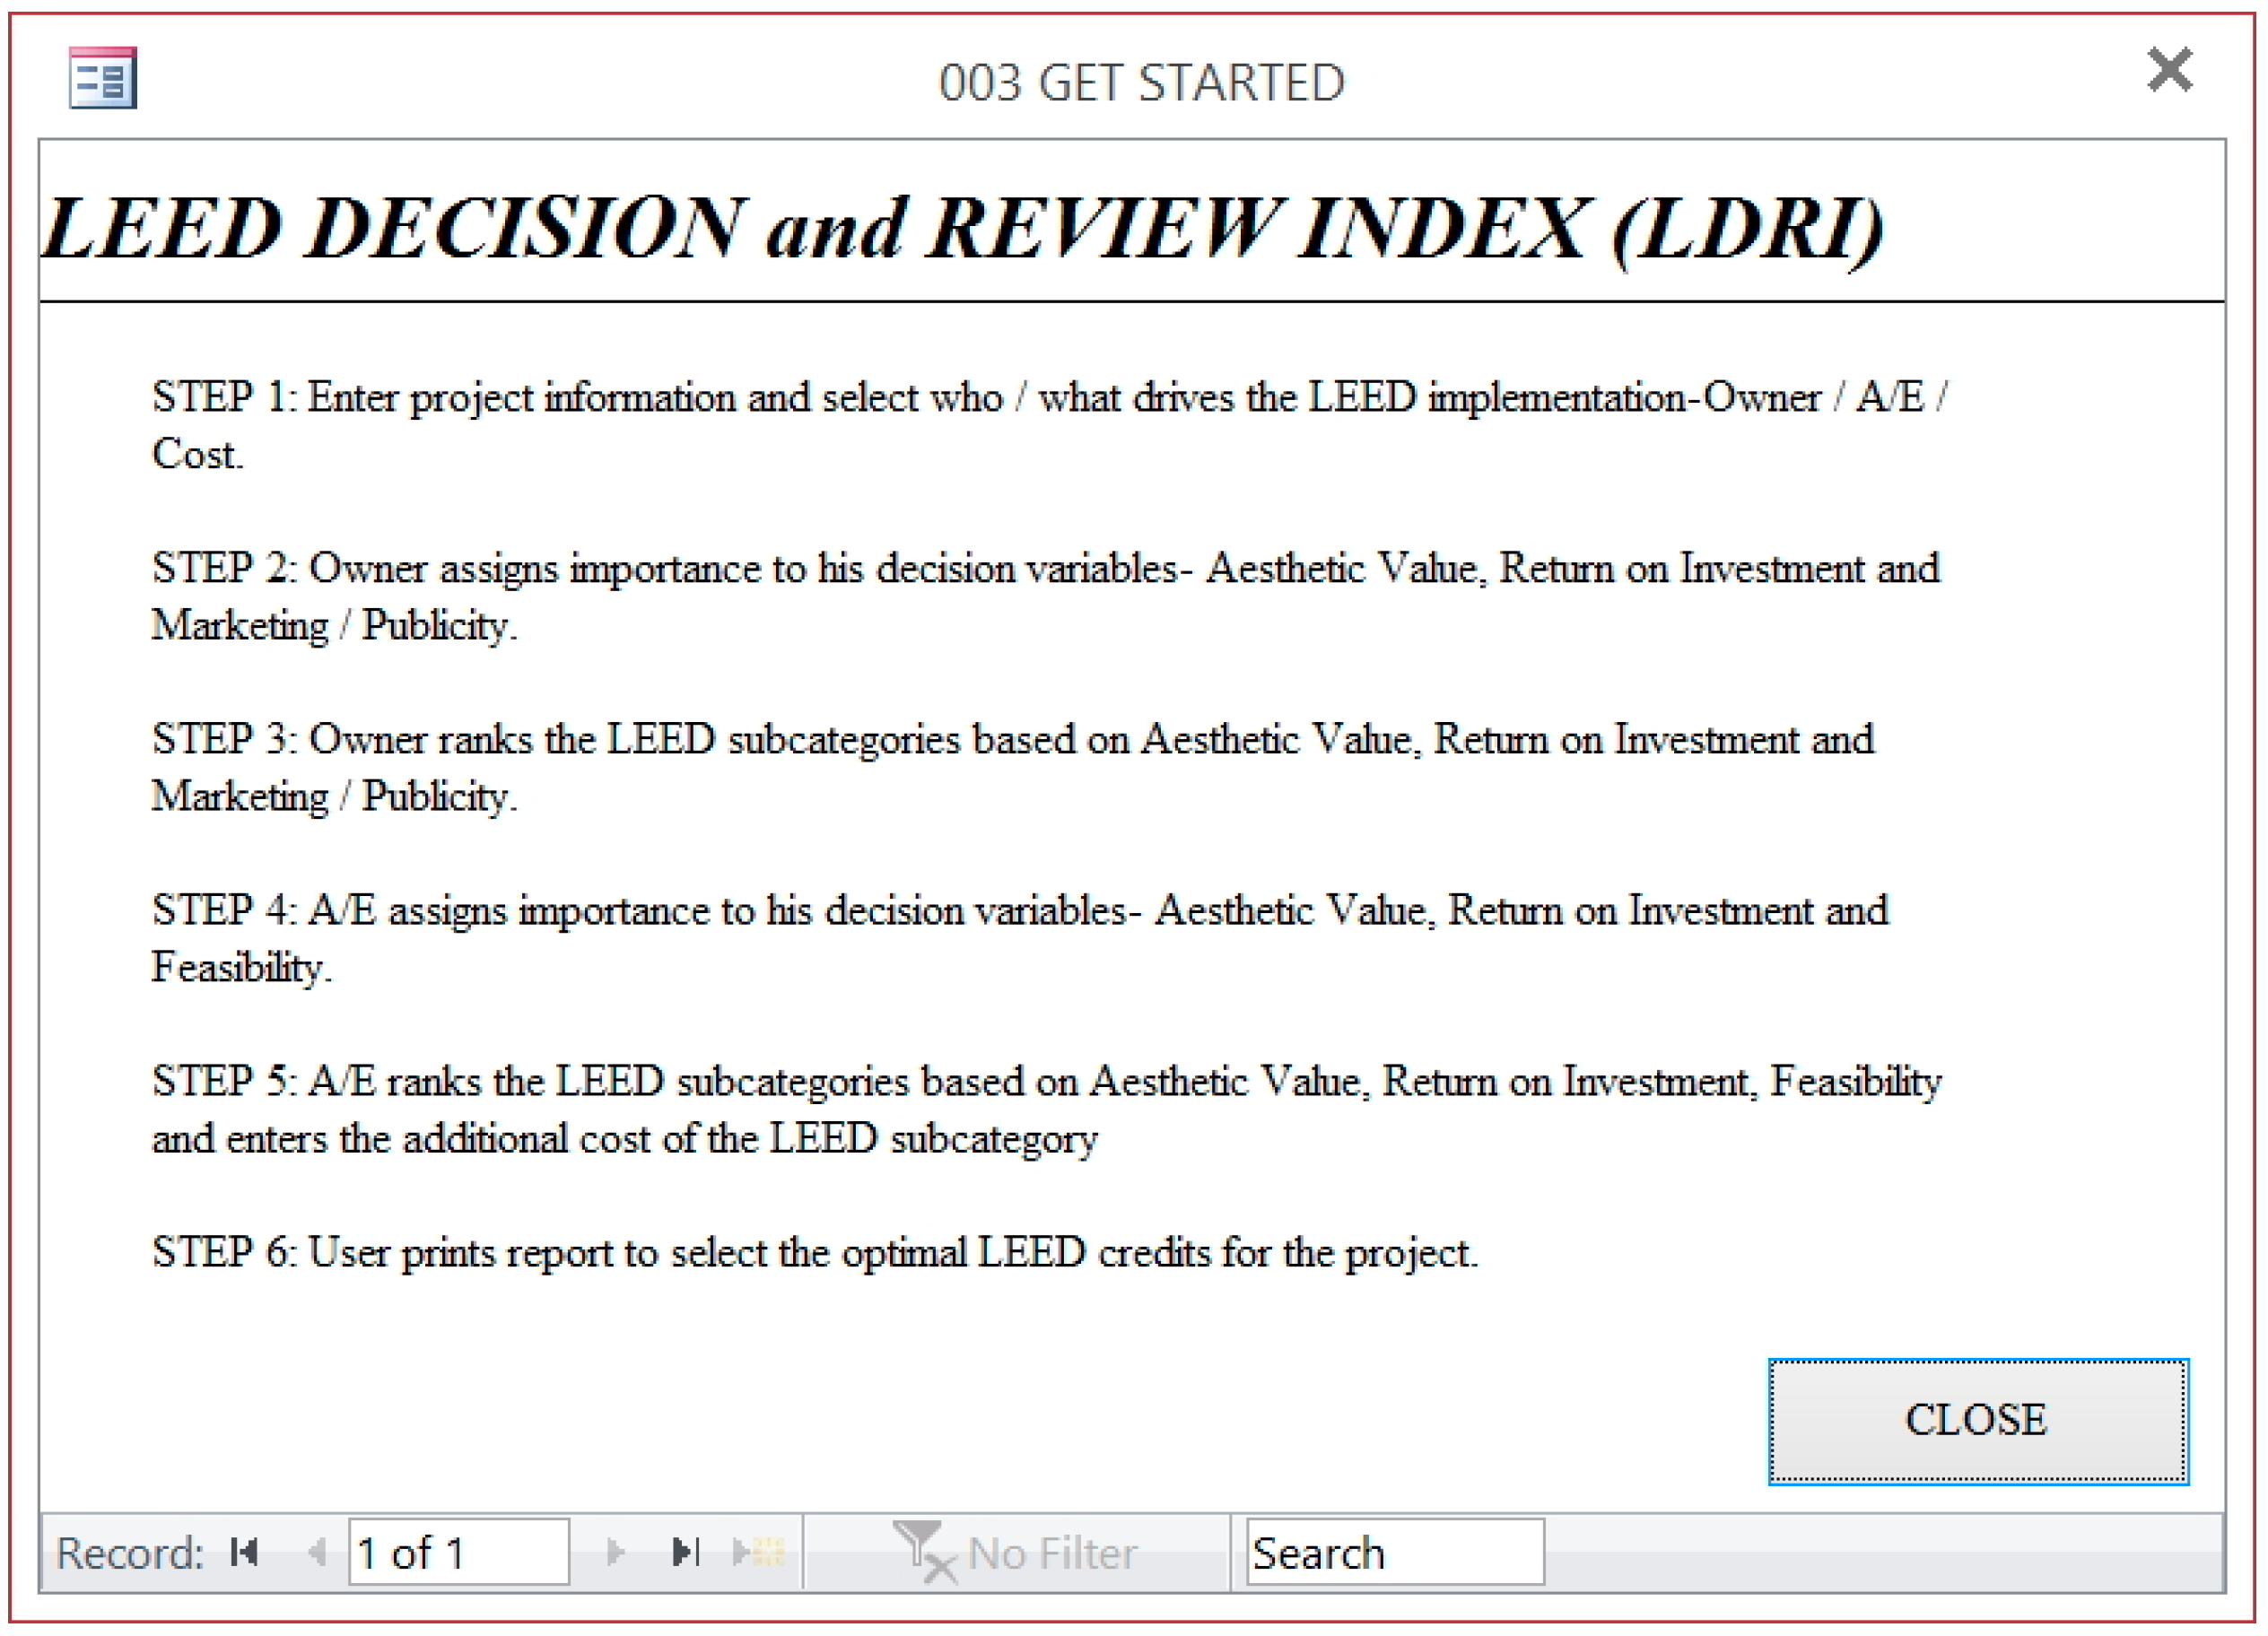
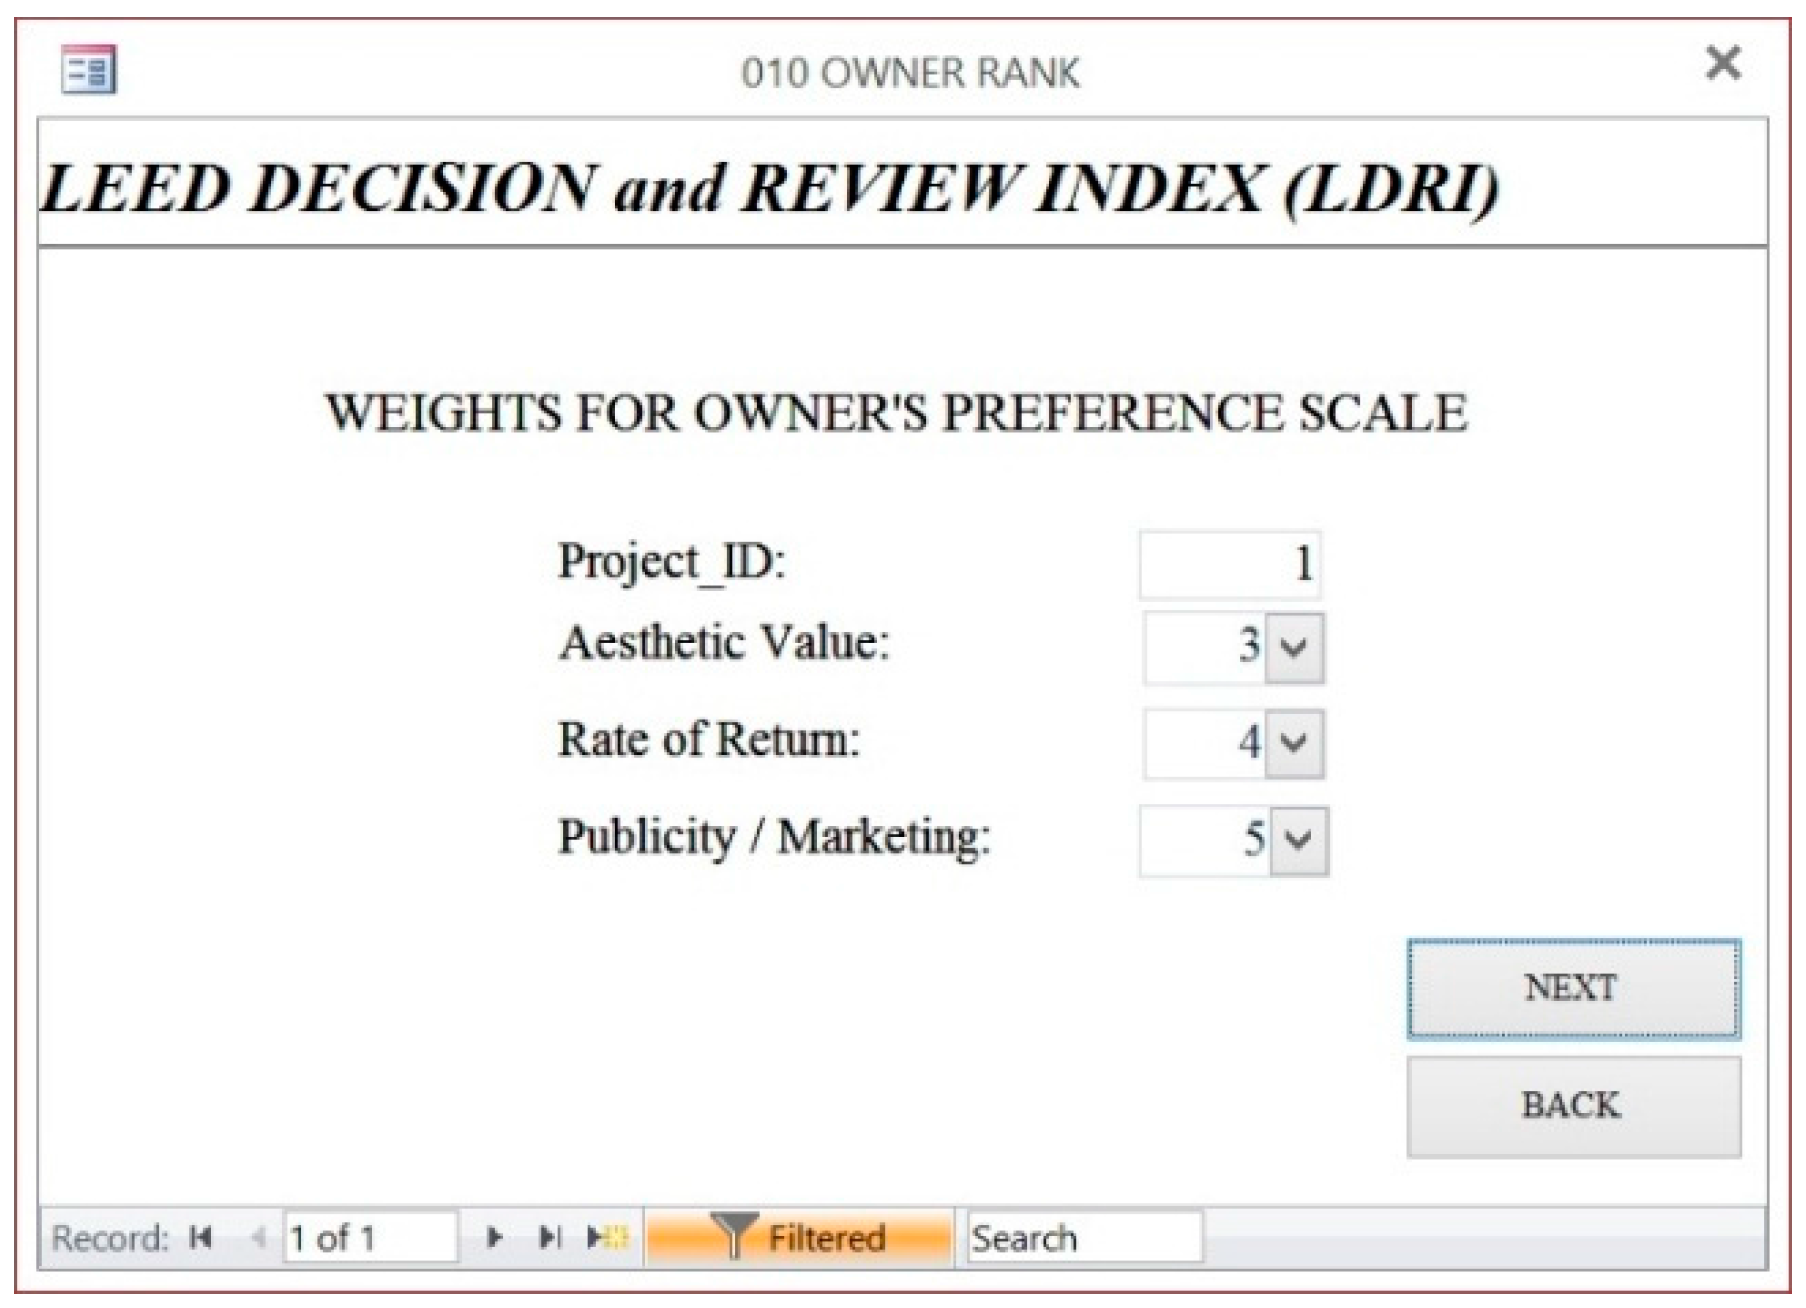
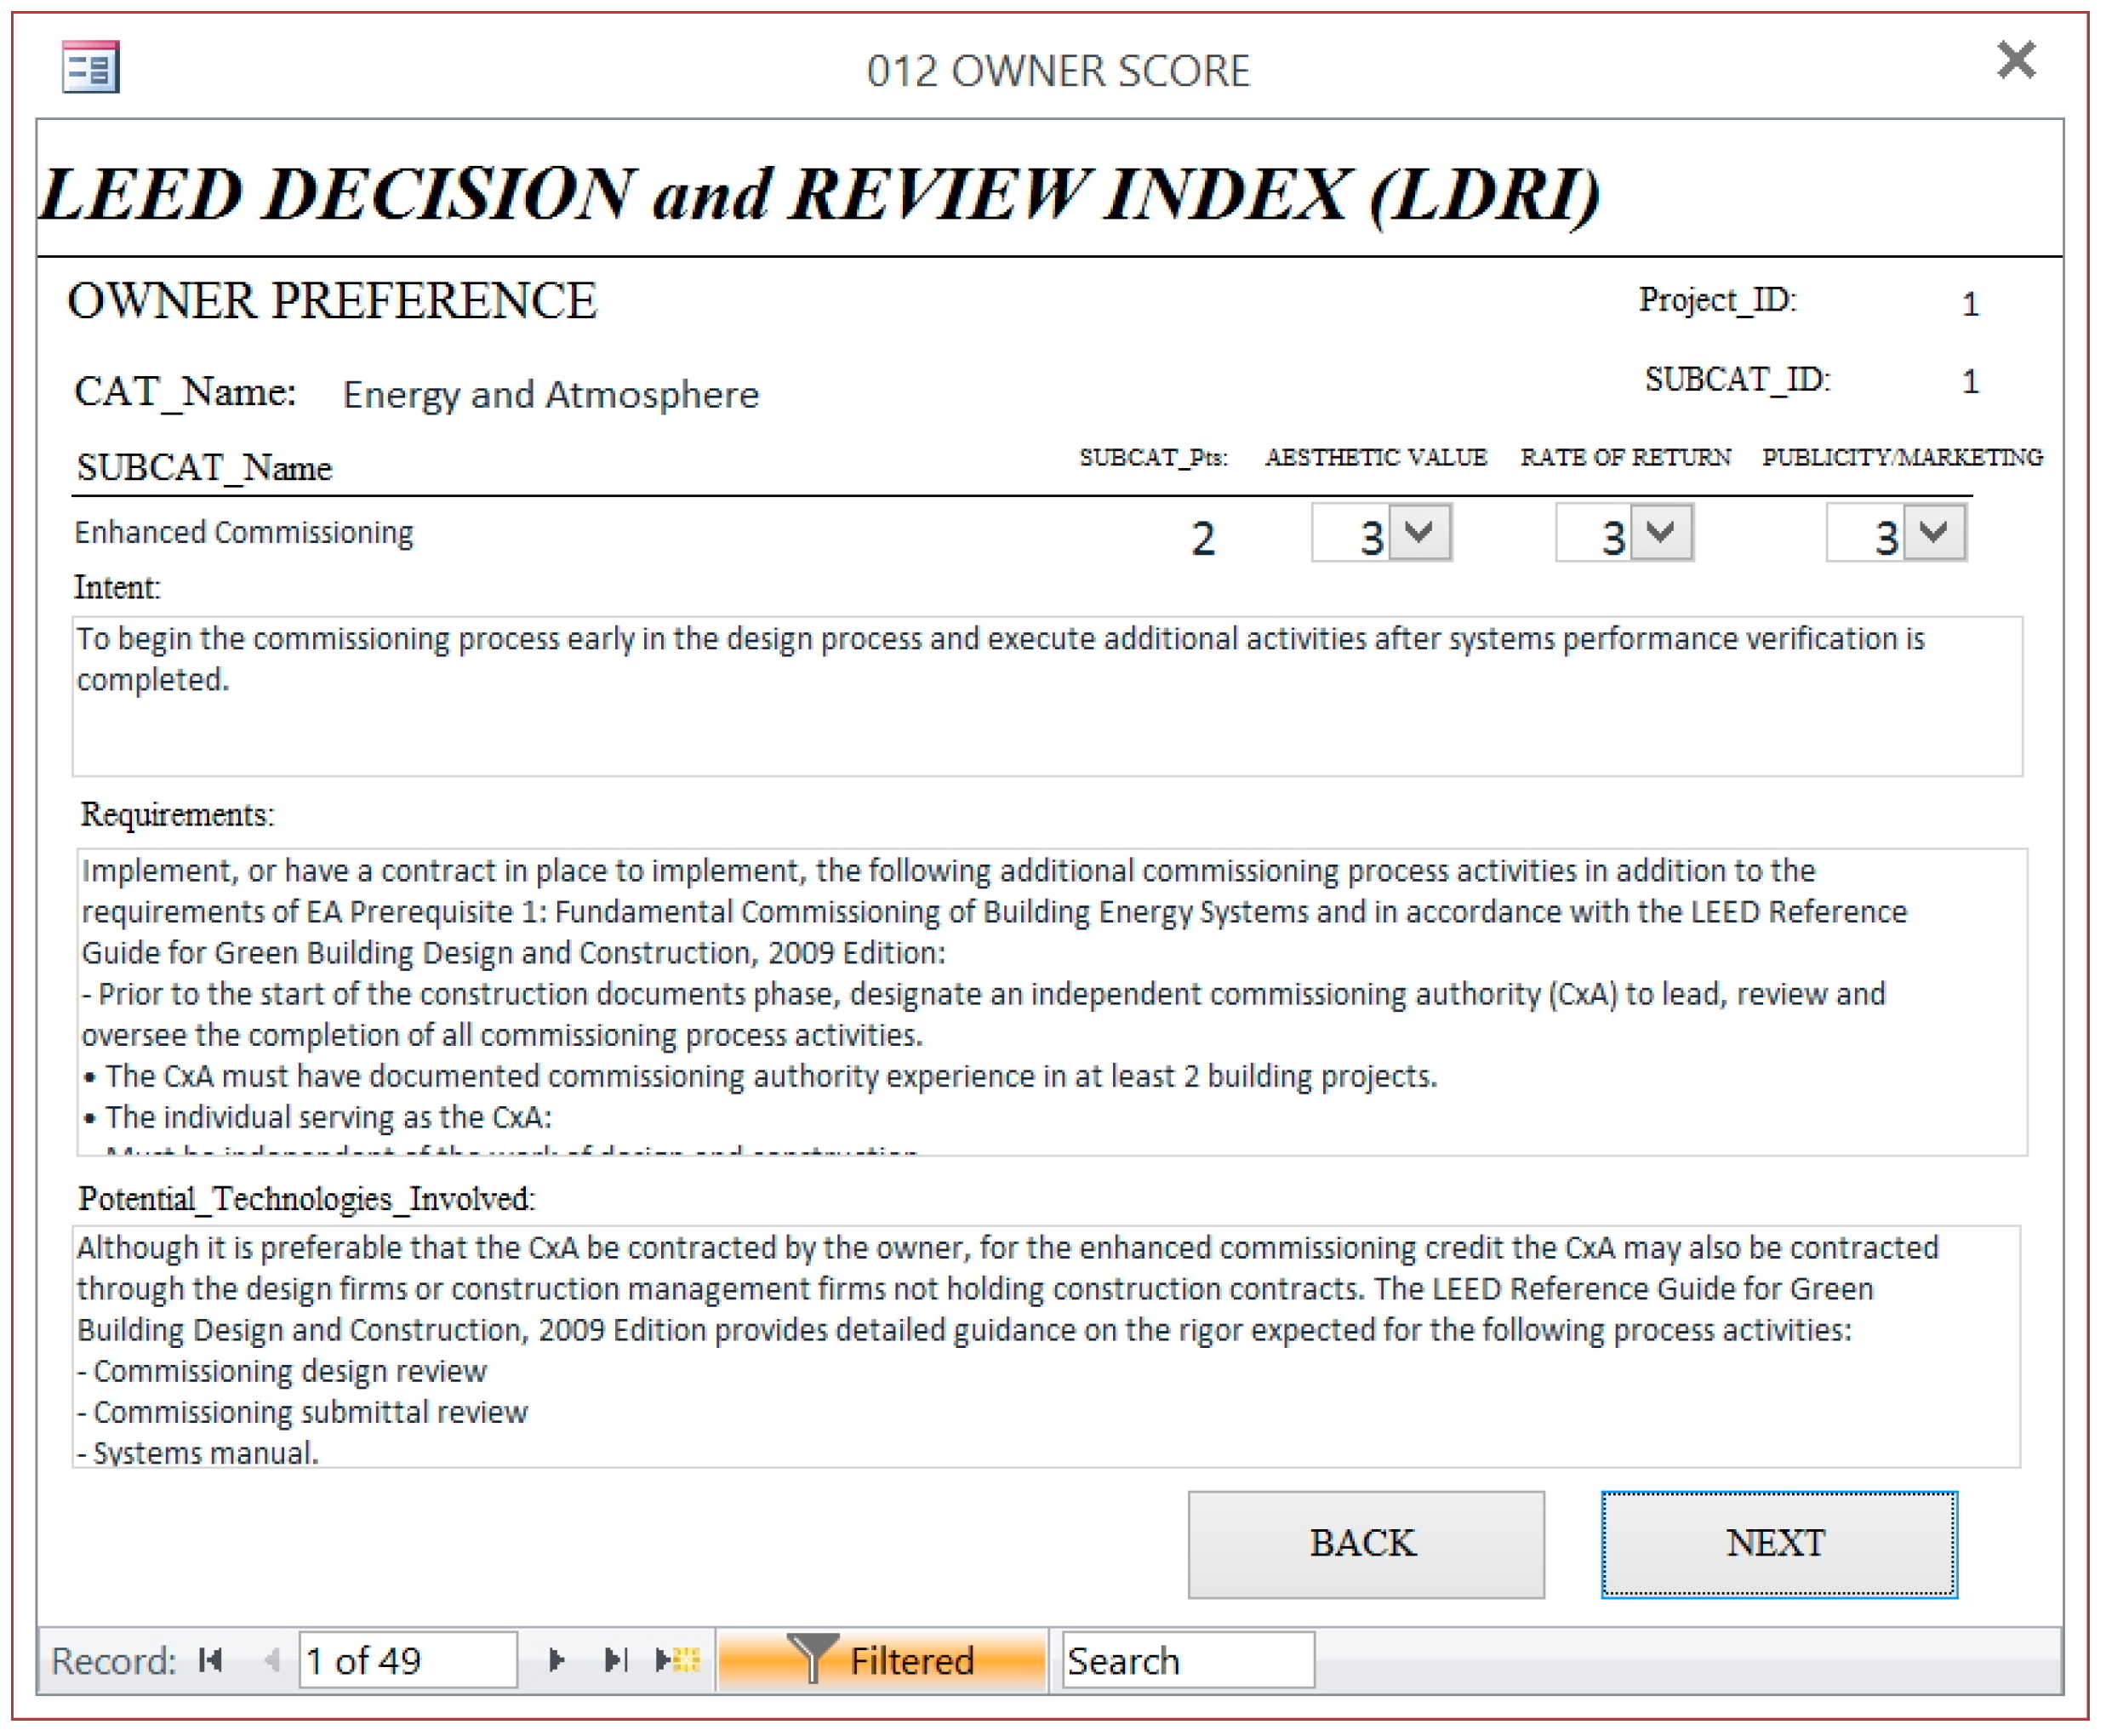
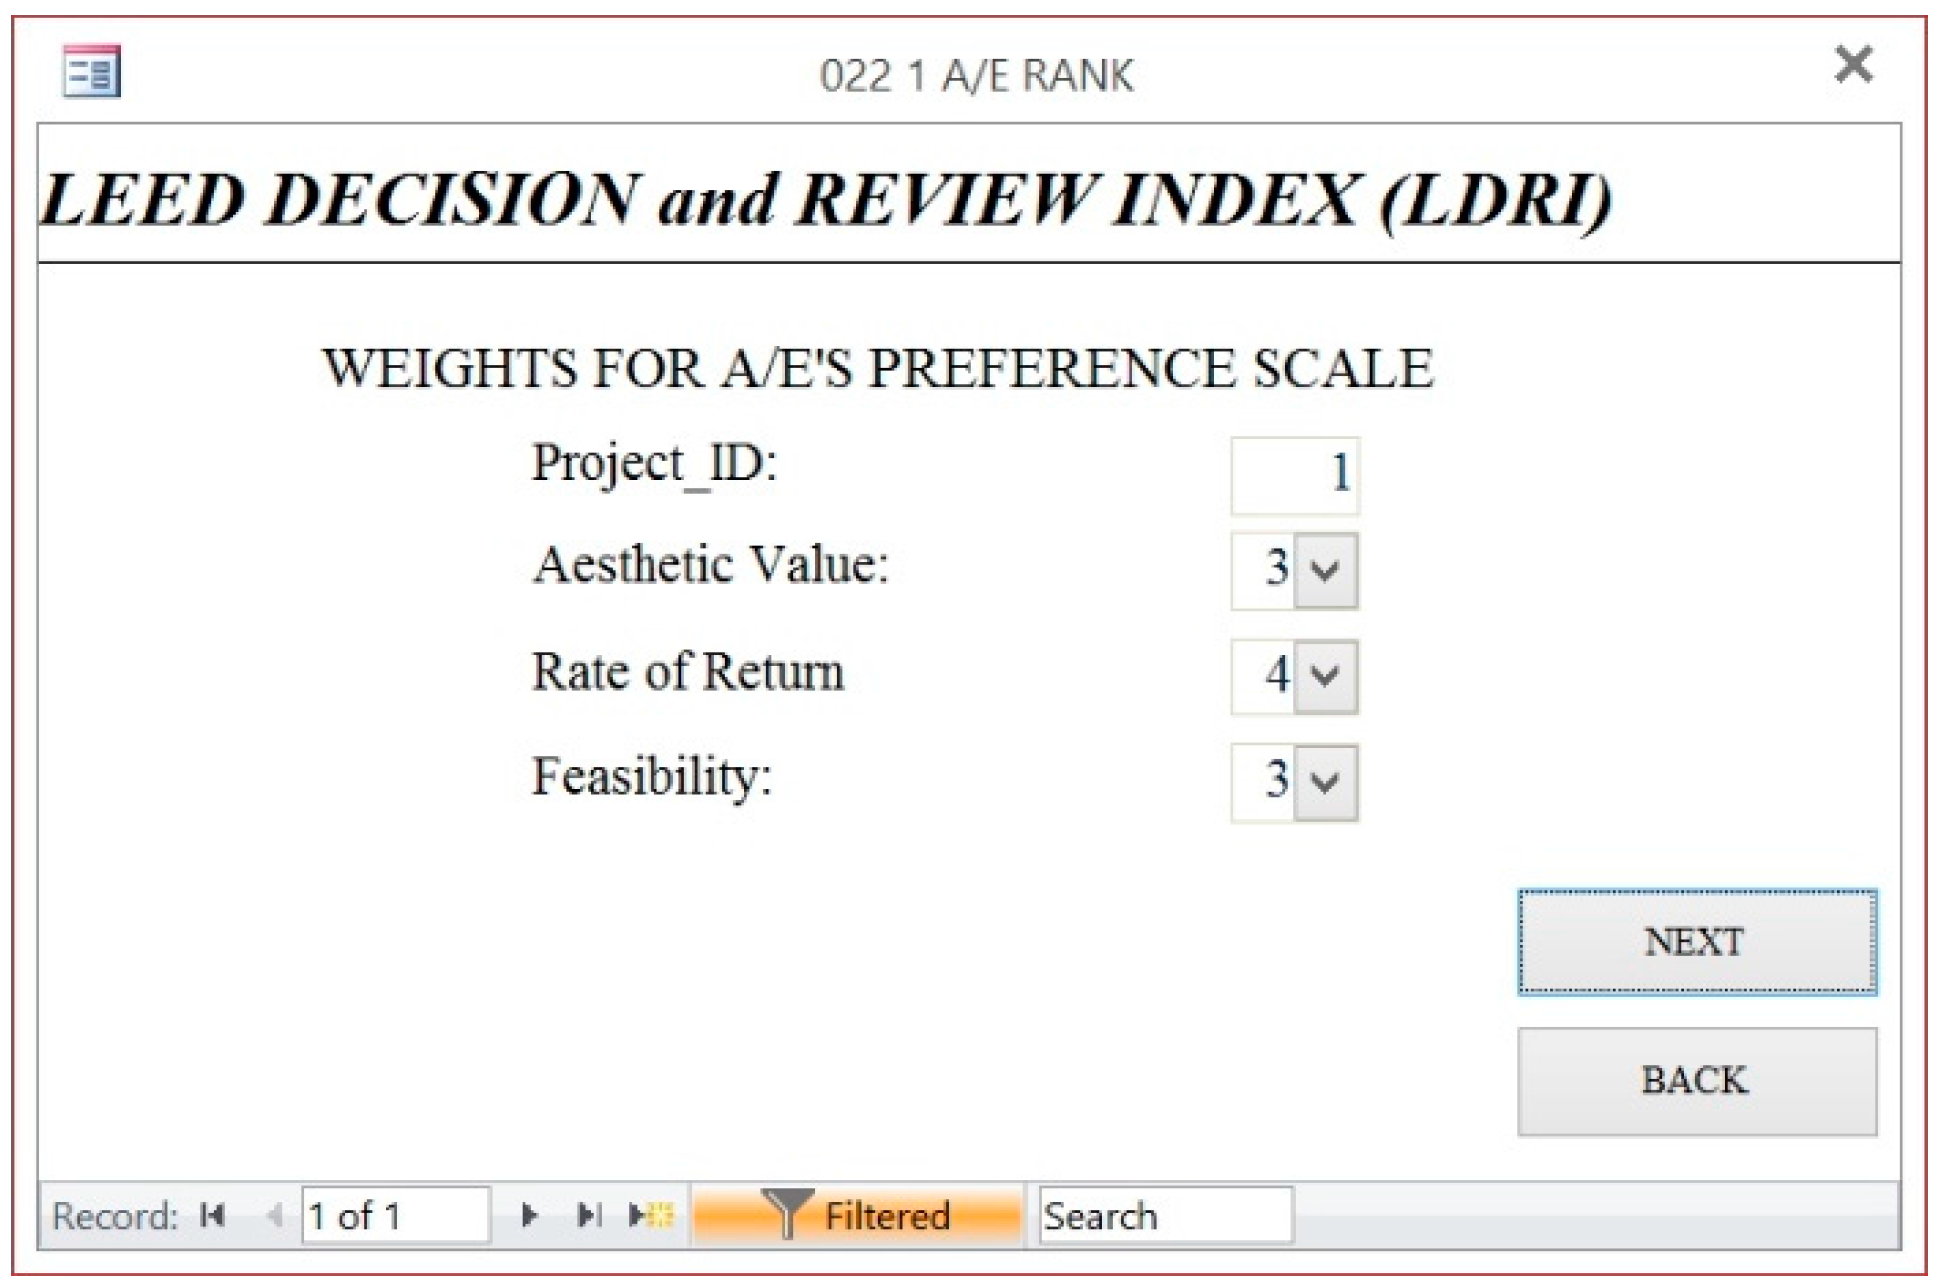
Once the data is collected, it is exported to Microsoft Excel where the LDRI tool performs optimization using SOLVER with an objective function (explained in detail below), the results are imported back to the LDRI tool, and the LDRI tool finally gives the list of most optimal LEED credits in the form of a report as the output. The researchers sought to develop an optimization model that identifies the optimal set of LEED credits that attains the desired LEED certification level according to situation-specific constraints and based on the following pre-determined weighted influence factors: Owner preference, A/E Preference, the cost (percent cost of implementing individual LEED credits to total installed cost), and point values of individual LEED credits. The owner and A/E preferences are entered as integer values based on the following Likert scale:
1—Strongly disagree
2—Moderately disagree
3—Neutral
4—Moderately agree
5—Strongly agree
Many scenarios can be encompassed by including the above mentioned influence factors. For example, an owner could be completely driven by cost and may not want to consider other factors such as architectural compatibility or life cycle costs. In this case, the cost would be the driving variable. In another case, the owner may want to submit to whatever the A/E feels is best for the project in terms of constructability, maintainability, and life cycle cost analysis. In this latter case, the A/E preference becomes the driving factor for selecting the optimal set of LEED credits to pursue. In yet another case, the owner may defer to most of the A/E’s recommended selection of LEED credits to pursue, but may strongly disagree with a few or some of those recommendations. These examples demonstrate the variety of scenarios that can occur with using just these variables. The researchers sought to develop a model that could accommodate this wide range of scenarios.
Through several trial and errors the researchers found an objective function for optimizing the result (the criteria for choosing the objective function, which lead several trail and errors, is described in detail below). For readers’ information, other tested trial objective functions are listed below.
where Pc, Po, Pa, and Pp represent weighted preference coefficients for cost, owner preference, A/E preference, and points preference, respectively. The criteria for choosing the objective function were as follows:
- (1)
All the possible cases should be able to run and get optimal solution based on the user inputs.
- (2)
Objective function should be balanced in the Balance Project (Pc = 0.5, Po = 0.5, Pa = 0.5, and Pp = 0.5).
- (3)
Coefficients (Po, Pa, Pp, and Pc) should have same impact or scale when they are adjusted by user.
- (4)
Cost driven case, i.e., Pc = 0.99, Po = 0, Pa = 0, and Pp = 0.01, should work properly and give reasonably selection for public project.
- (5)
Numerator and denominator should not be zero.
The researchers designed the objective function based on the above mentioned criteria. The detailed explanation of the objective function is as follows;
- (1)
Put to meet criteria 2, 3 and 4.
- (2)
Put to meet criteria 2 and 3.
- (3)
Put and set constraint range ( ) to meet criteria 5.
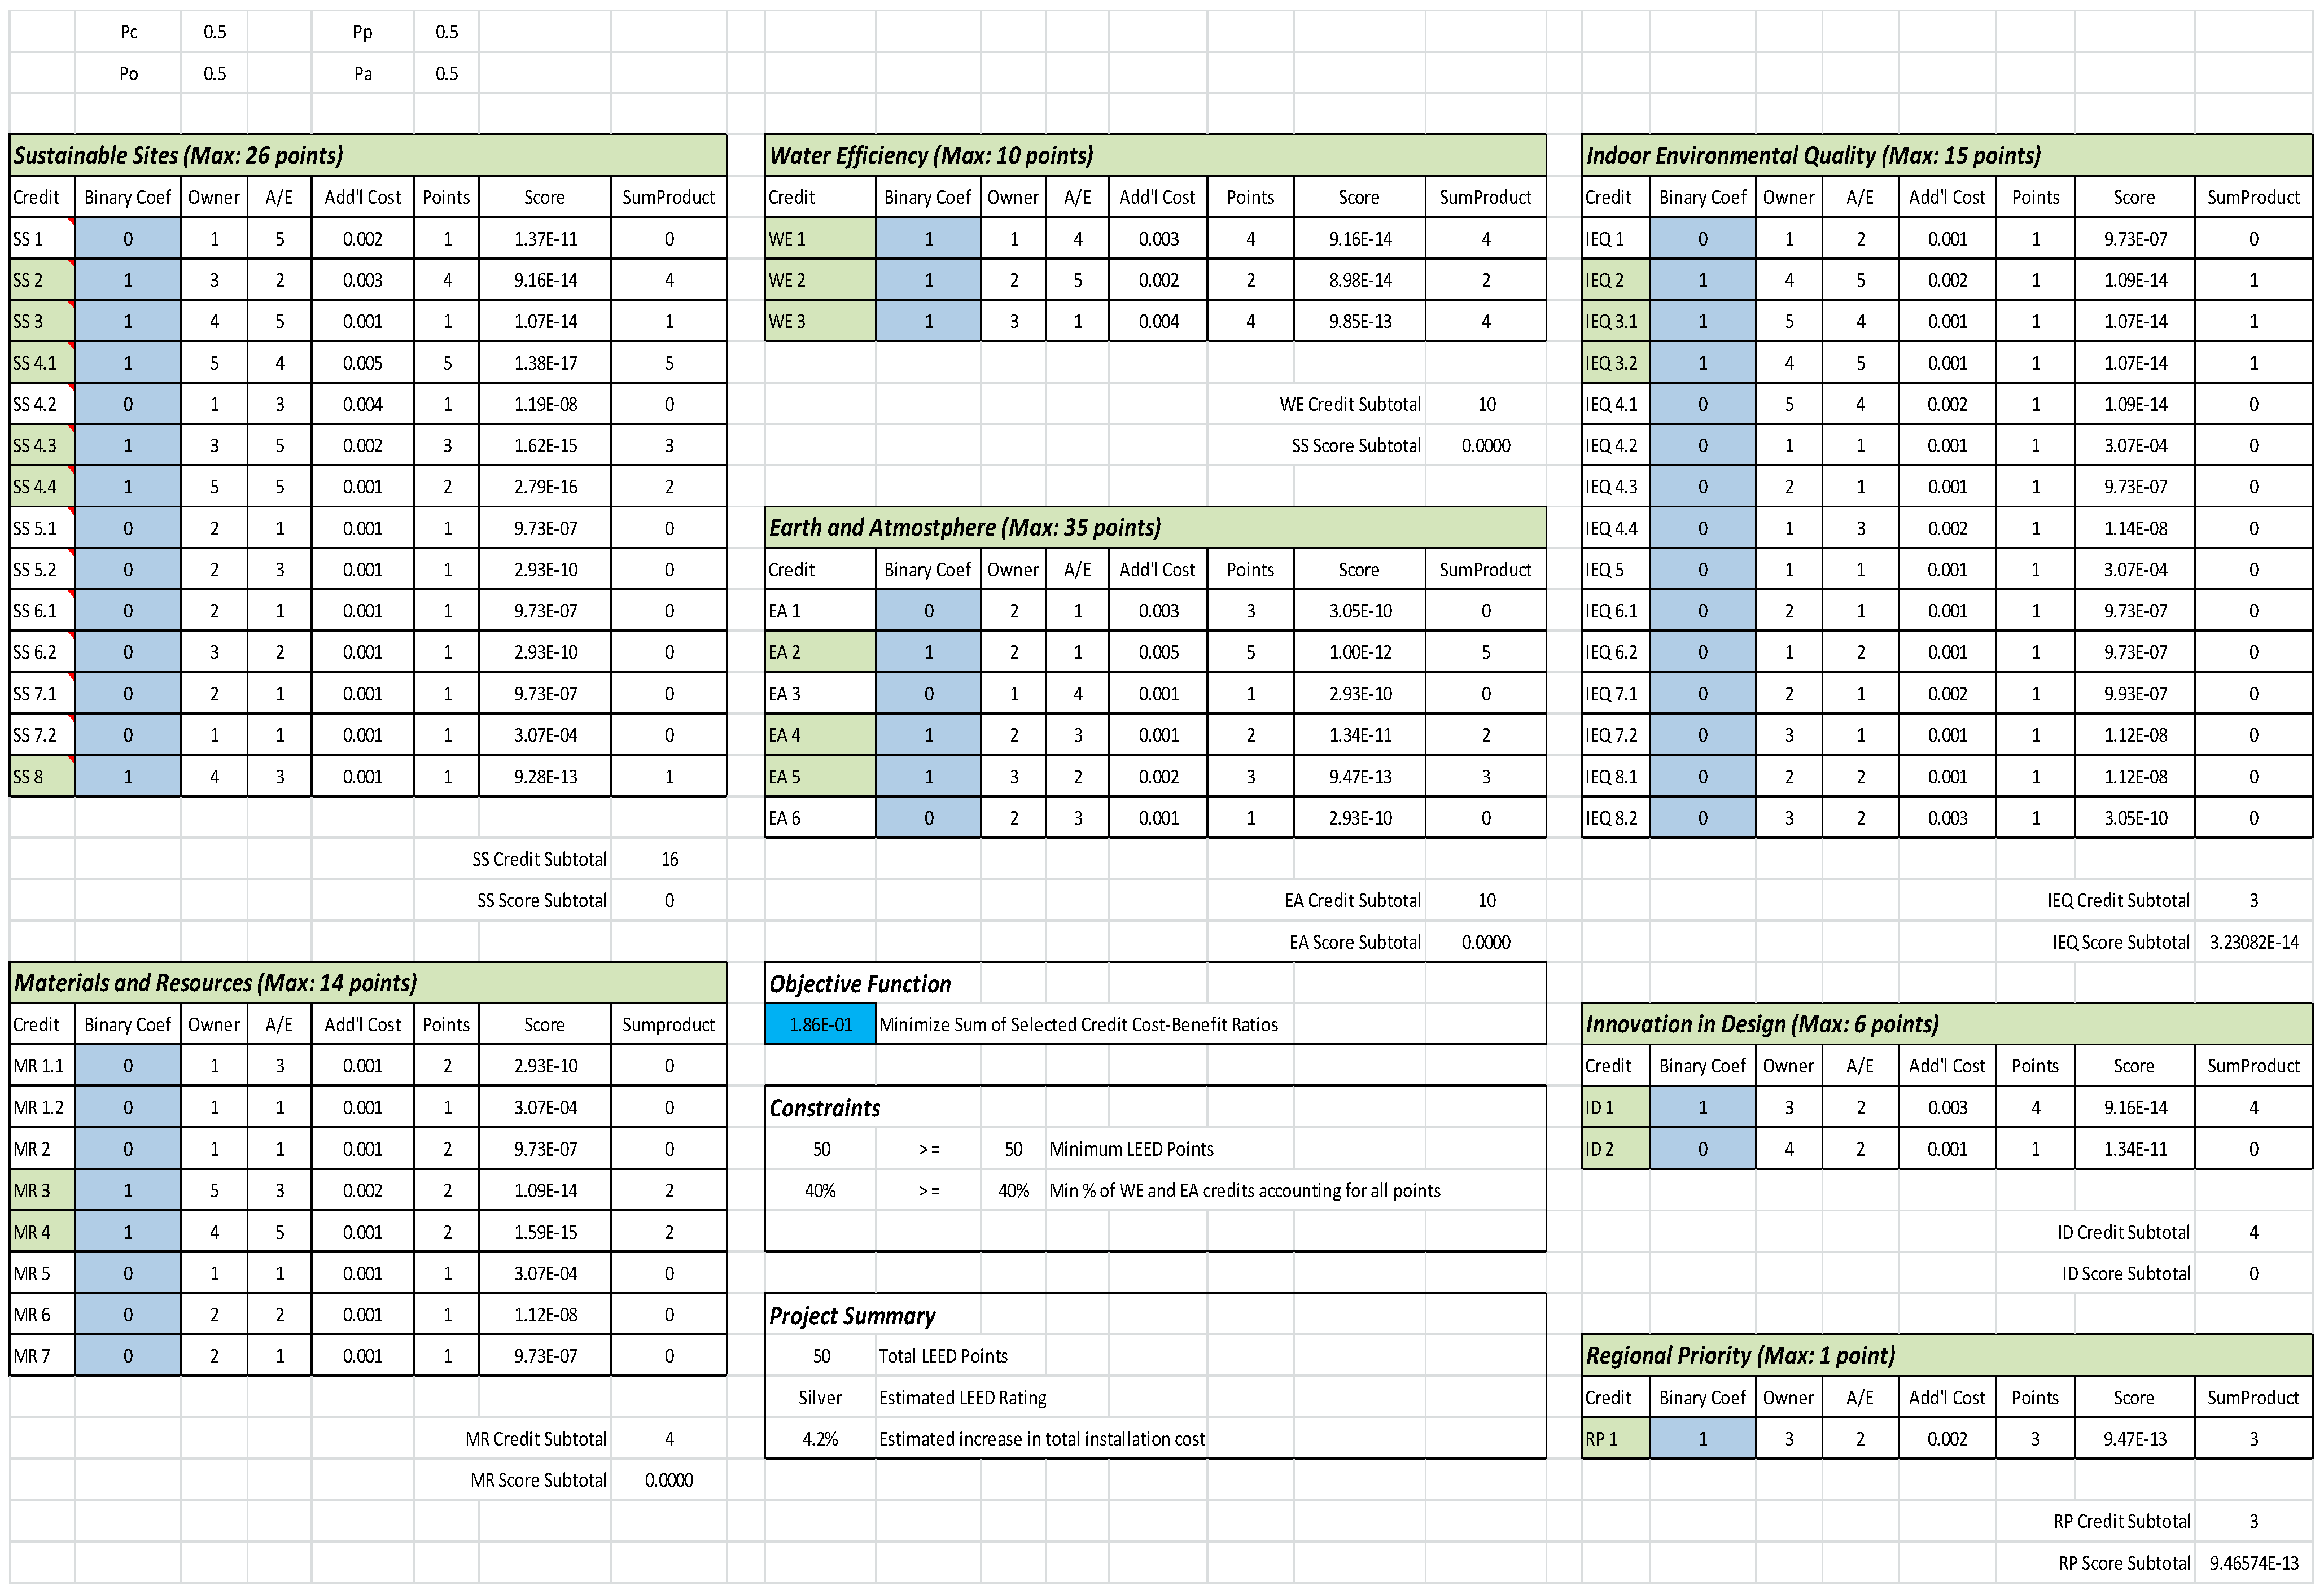
In determining the optimal set of credits subjected to additional constraints placed on the model, the model uses binary coefficients (denoted Xi) as decision variables. The following objective function (Equation (6)) was developed as an optimization model.
where
n = total number of LEED credits evaluated for consideration.
The objective function seeks to minimize the sum of Credit Score. The Credit Score is derived using a cost benefit approach. The credit score contains four input variables: owner preference, A/E preference, cost, and point value associated with implementing the respective credit. The credit score equation is given in Equation (7) below:
where Pc, Po, Pa, and Pp represent weighted preference coefficients for cost, owner preference, A/E preference, and points preference, respectively. The coefficients have the following values:
There are several assumptions in the tool. First, costs for accomplishing LEED prerequisites are not considered in the tool. LEED’s major categories contain prerequisites that projects must comply with before being eligible for the remaining category credits. Prerequisites are required for the project for LEED certification, however, costs for accomplishing LEED prerequisites are not considered in the tool as prerequisites do not earn any points. In other words, the optimization model only focuses on the costs associated with individual LEED credits. The user may calculate the costs related to accomplishing LEED prerequisites separately if the user wants to obtain total costs for LEED certification.
Second, the tool provides the users to select targeted credit. For many LEED credits, criteria are presented for attaining partial points. For example, some LEED credits may be worth 4 points, but a design team may opt for attaining only two of the possible four points. Thus, in the tool, selecting a particular LEED credit indicates the design team will pursue the selected credit’s target value. The user (in particular A/E) may adjust this option if necessary.
Third, the researchers are making the assumption that the owners and the A/Es choice is influenced only by the above mentioned variables. Although the range of factors that this tool considers is limited to just aesthetic value, ROI, and feasibility apart from the cost, more factors can be added in this tool to reflect the growing needs of the owners and the users. However, if that happens, the objective function in this paper also may need adjustment.
Fourth, the tool requires percent total installed cost with attaining a single LEED credit. This approach aligns the General Services Administration (GSA)’s cost study on LEED [
24] and Langdon’s cost study [
7]. The General Services Administration (GSA) is a leader in adopting the LEED. Until 2010, GSA required LEED Silver, they have increased its minimum requirement for new construction and substantial renovation of Federally-owned facilities to LEED Gold [
2]. The GSA performed a LEED cost study in 2004 [
24] based on examining two common GSA facility project types: a new courthouse and an office building modernization. The study includes a section that estimates the percent cost of implementing individual LEED credits to total installed cost. In addition, Langdon [
7] discussed the feasibility of each LEED point and overall likely cost effect for construction, soft, and documentation costs. Examples of cost effect in percent cost format are [
7]:
SS3: Brownfield Redevelopment—The cost of basic remediation of a brownfield site range from $50,000/acre to as much as $2 million/acre;
SS4-3: Alternative Transportation—Low-Emitting and Fuel-Efficient Vehicles—The electric refueling stations typically cost between $5,000 and $20,000 for a two care station;
SS7-2: Heat Island Effect—roof—A high emissivity roof is slightly ($1~$2/SF) more than conventional black roofs; A green roof cost between $10 and $30/SF (green roofs can facilitate achievement of LEED credits for stormwater management and filtration, open space, and natural habitat, as well as contributing to energy efficiency);
WE2: Innovative Wastewater Technologies—$4~$8/SF over the cost of the entire building;
EA Prerequisite 1: Fundamental Commissioning of the Building Energy Systems—Basic commissioning typically costs in the rage of $1.50 ~$3/SF;
EA3: Enhanced Commissioning—Additional commissioning typically costs in the range of $1~$2/SF;
EA5: Measurement and Verification—A good quality reporting system can add $2~$4/SF & The measurement and verification program can range from $50,000 to $200,000;
EA 6: Green Power Strategies—15% to 20% increase in electricity cost for a typical user;
EQ 3-2: Construction IAQ Management Plan—The costs for lush out is in the range of $.25 to $.50/SF, but there is a schedule impact.
These cost studies [
7,
24] align the researchers’ approach of including a “cost/LEED point” variable in the model and provides a methodology that could be used in an actual construction project, which could then in-turn, be incorporated into the model presented in this study.
Regarding cost, the researchers note that as costs are not necessarily cumulative for achieving a credit, the users can add additional constraints to the tool to consider other cases. In many cases, multiple design criteria can be satisfied without any additional cost impact beyond that resulting from the first point [
7]. Having a comprehensive understanding of these factors allows an owner to more accurately determine potential costs, and to make better choices as to which LEED points a particular building should pursue [
7].
2.4. Stage 4. Development
The LDRI tool was developed in this stage. Business rules which describe characteristics of data were the first ones to be rendered. They allow the software designer to understand business processes and to develop appropriate relationship participation rules and constraints [
25]. The researchers described the rules briefly, precisely, and unambiguously to create an accurate tool [
25]. The rules are:
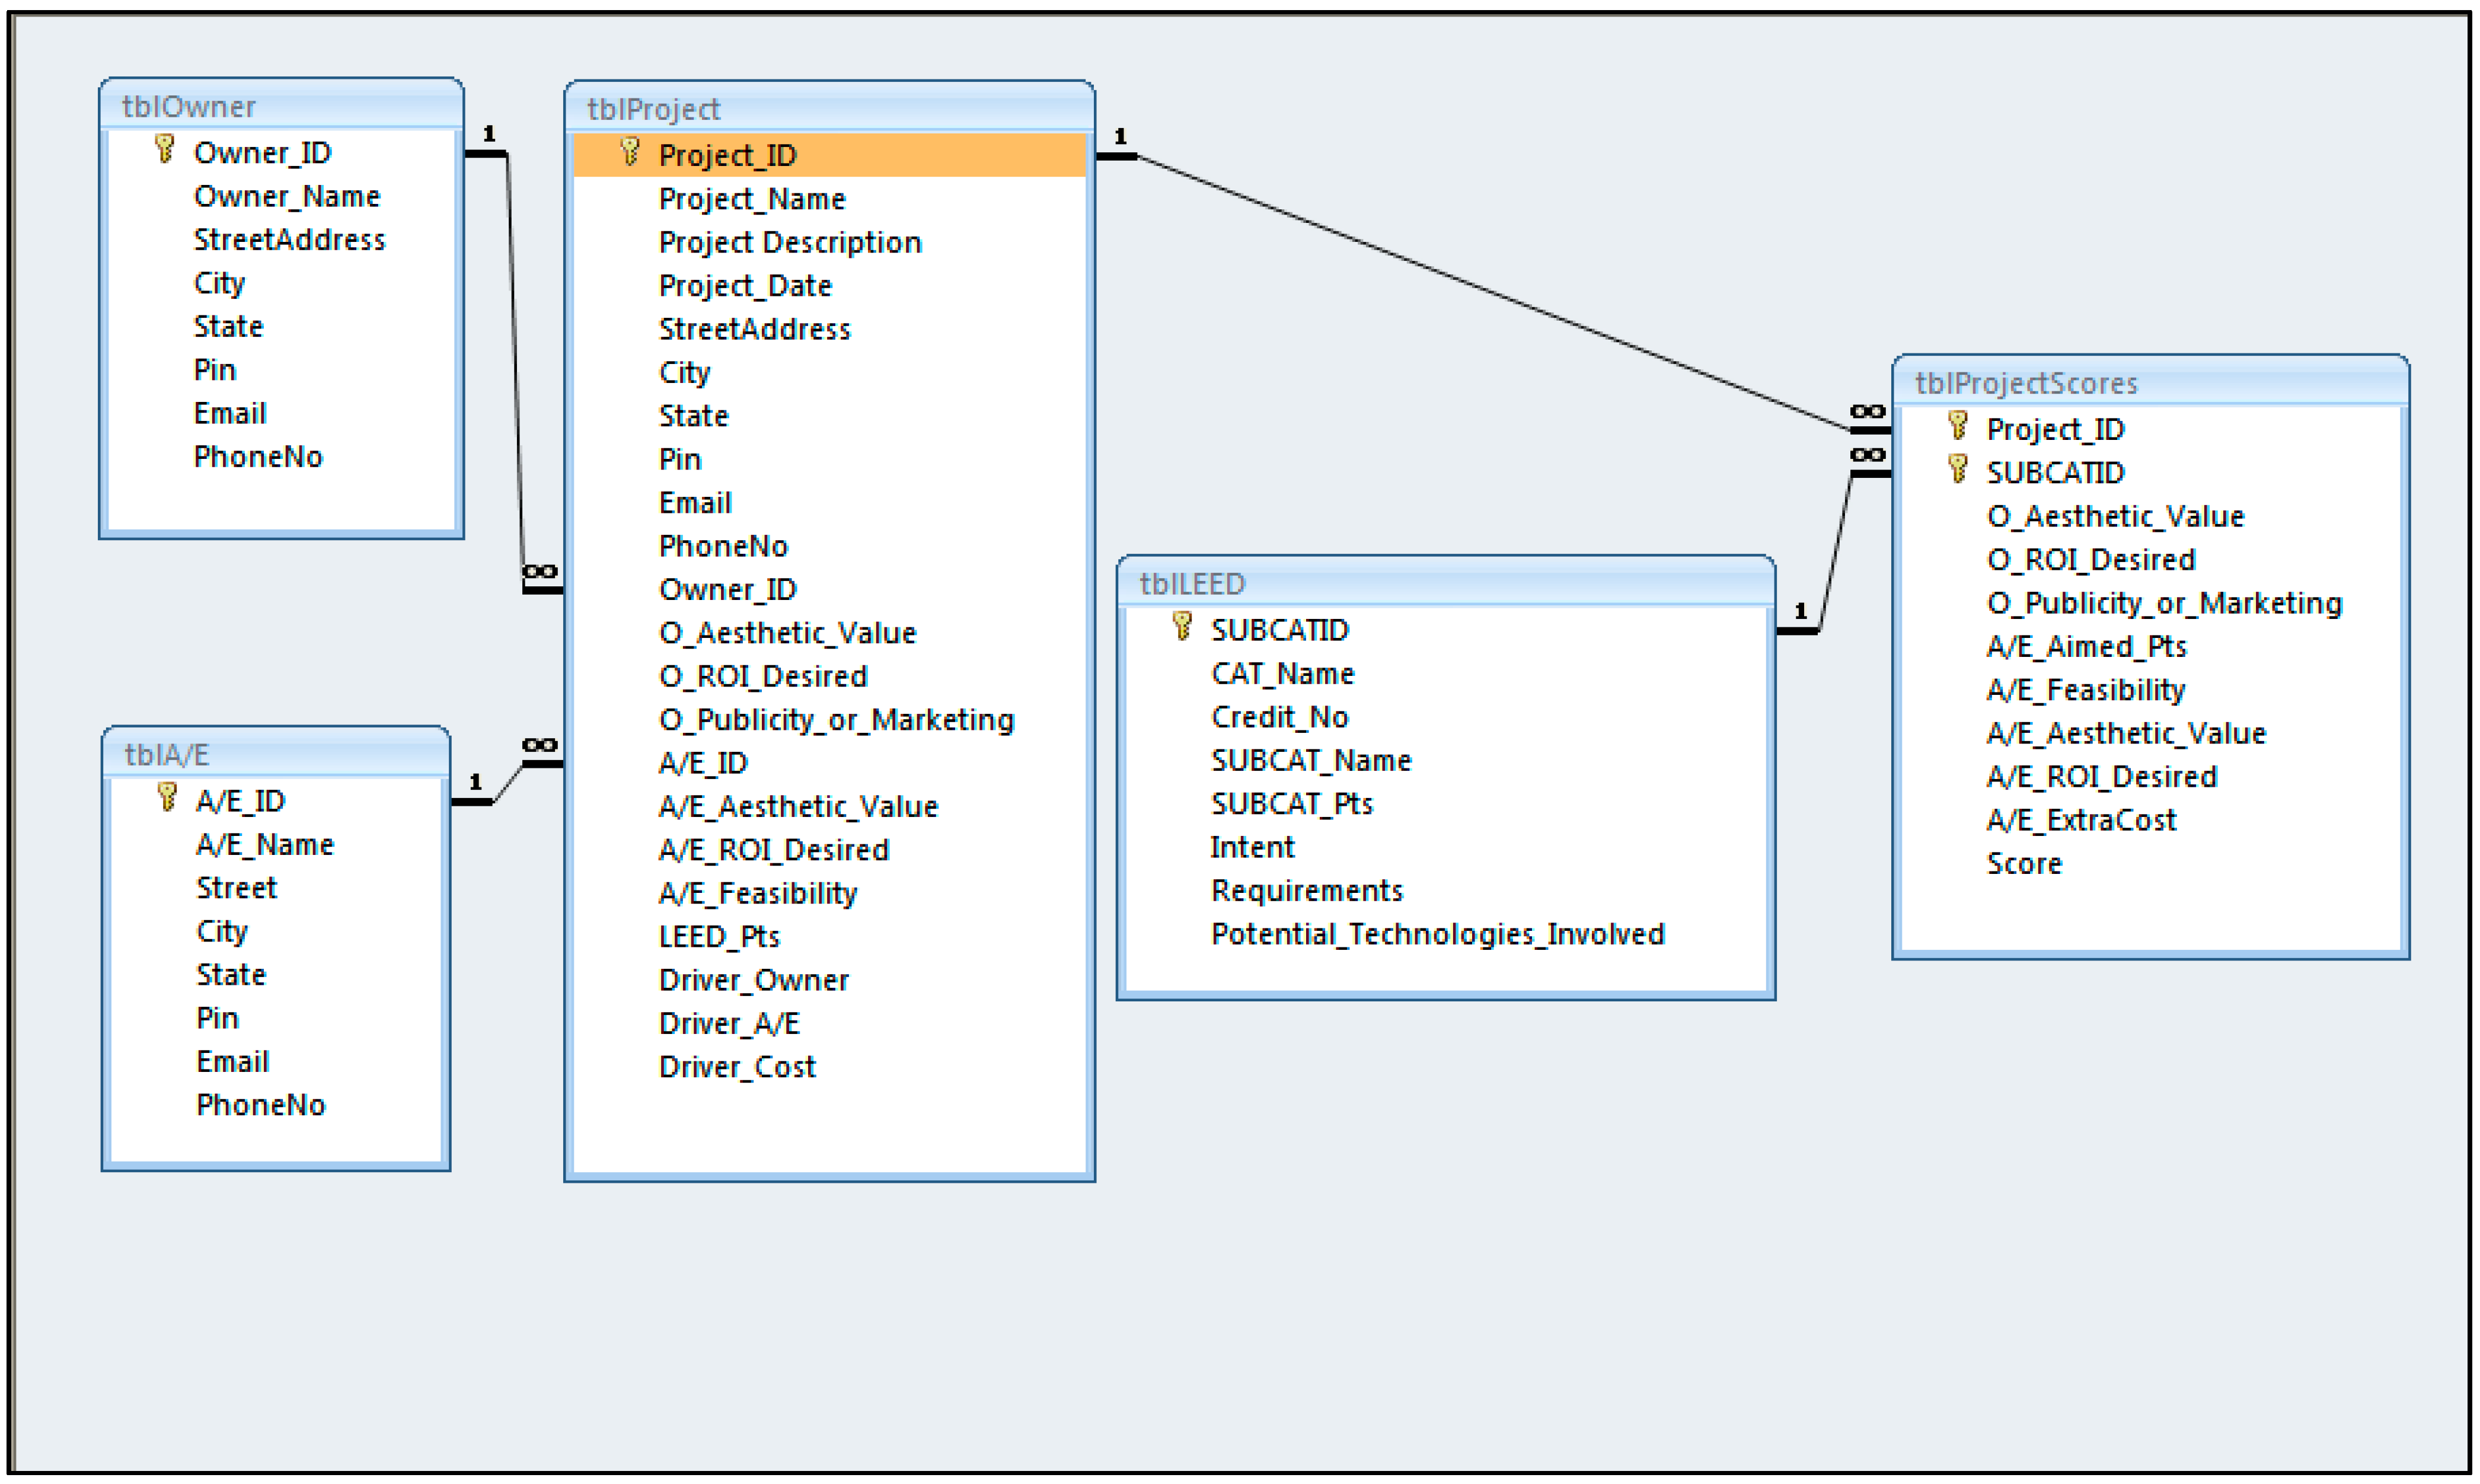
One owner can have many projects.
One project can have just a single owner.
One A/E can have many projects.
One project can have just a single A/E.
One project can have many scores.
One score can belong to a single project.
One LEED Category can have many scores.
One score can belong to a single LEED category.
From the business rules above, the researchers identified main entities and relationships followed by development of a data model to create the foundation of the LDRI tool. A data model is relatively simple graphical representation of complex real-world data structure and it facilitates interaction among the software designer, the applications programmer, and the end user [
25]. Among many different models, the researchers developed the entity relationship model. The entity relationship model (shown in
Figure 2), introduced by Chen in 1976, is a graphical representation of entities and their relationships in the tool (database structure) [
25].
Figure 2.
Entity relationship diagram.
Figure 2.
Entity relationship diagram.
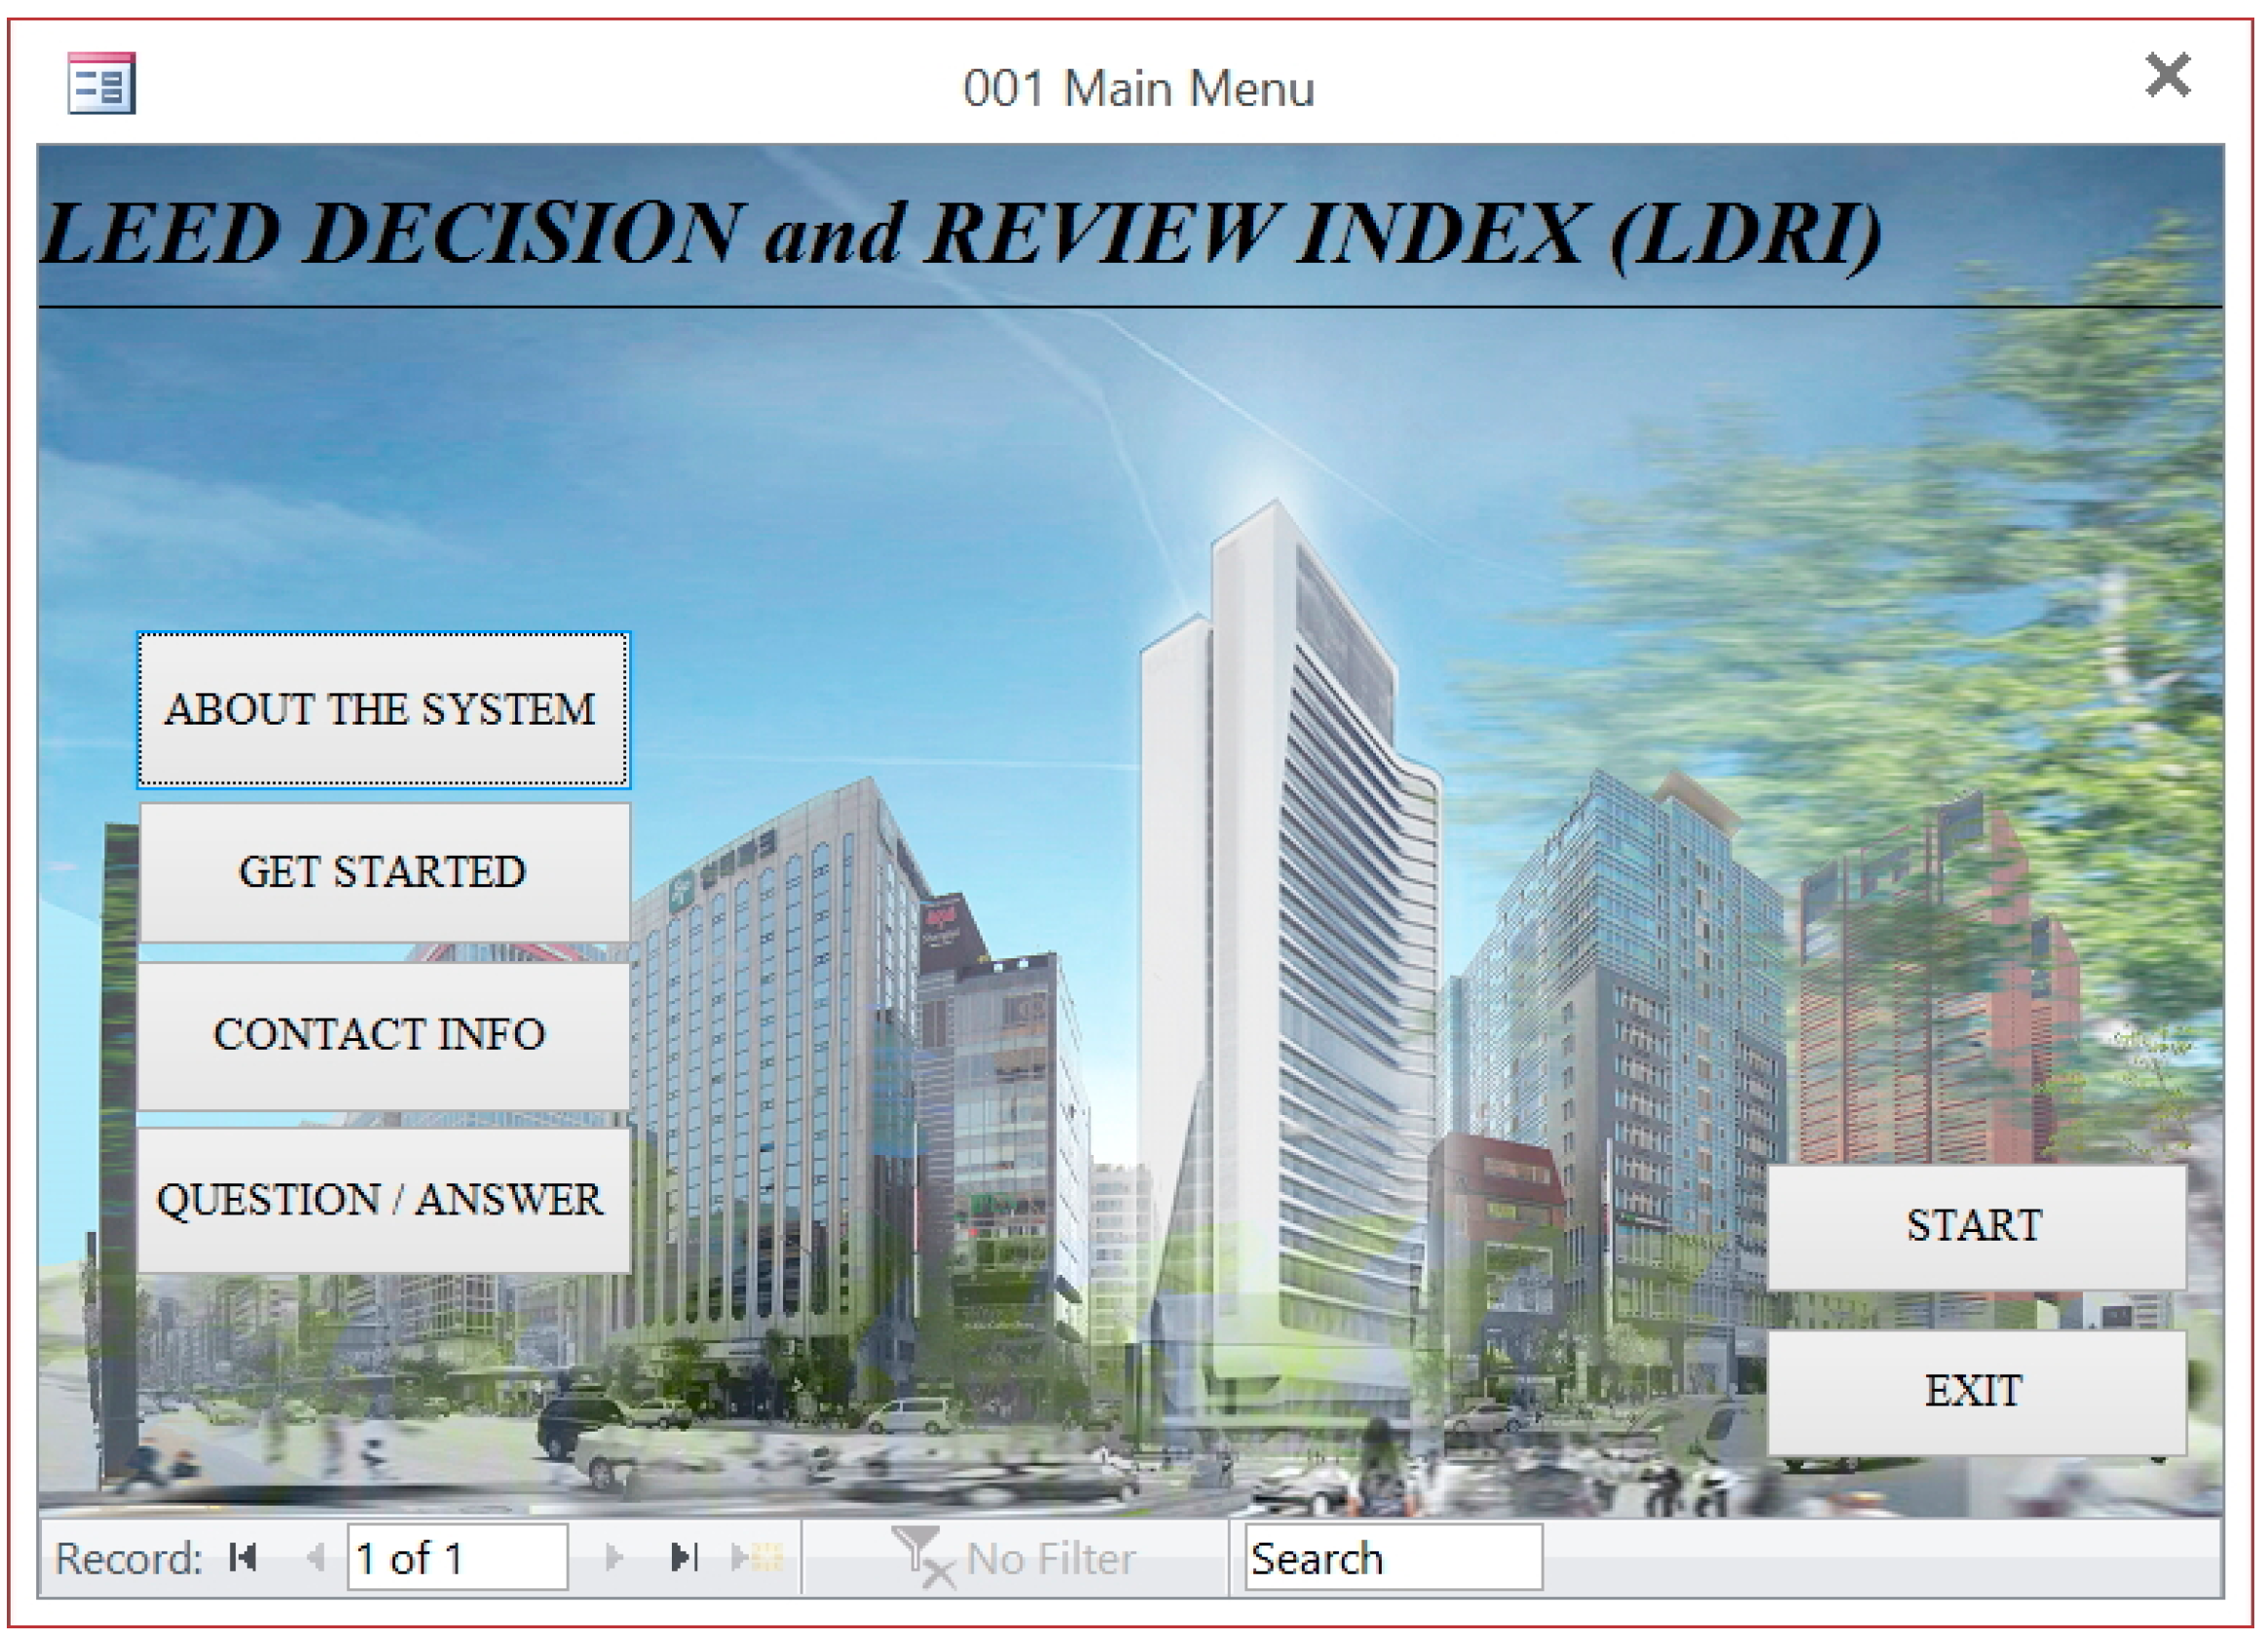
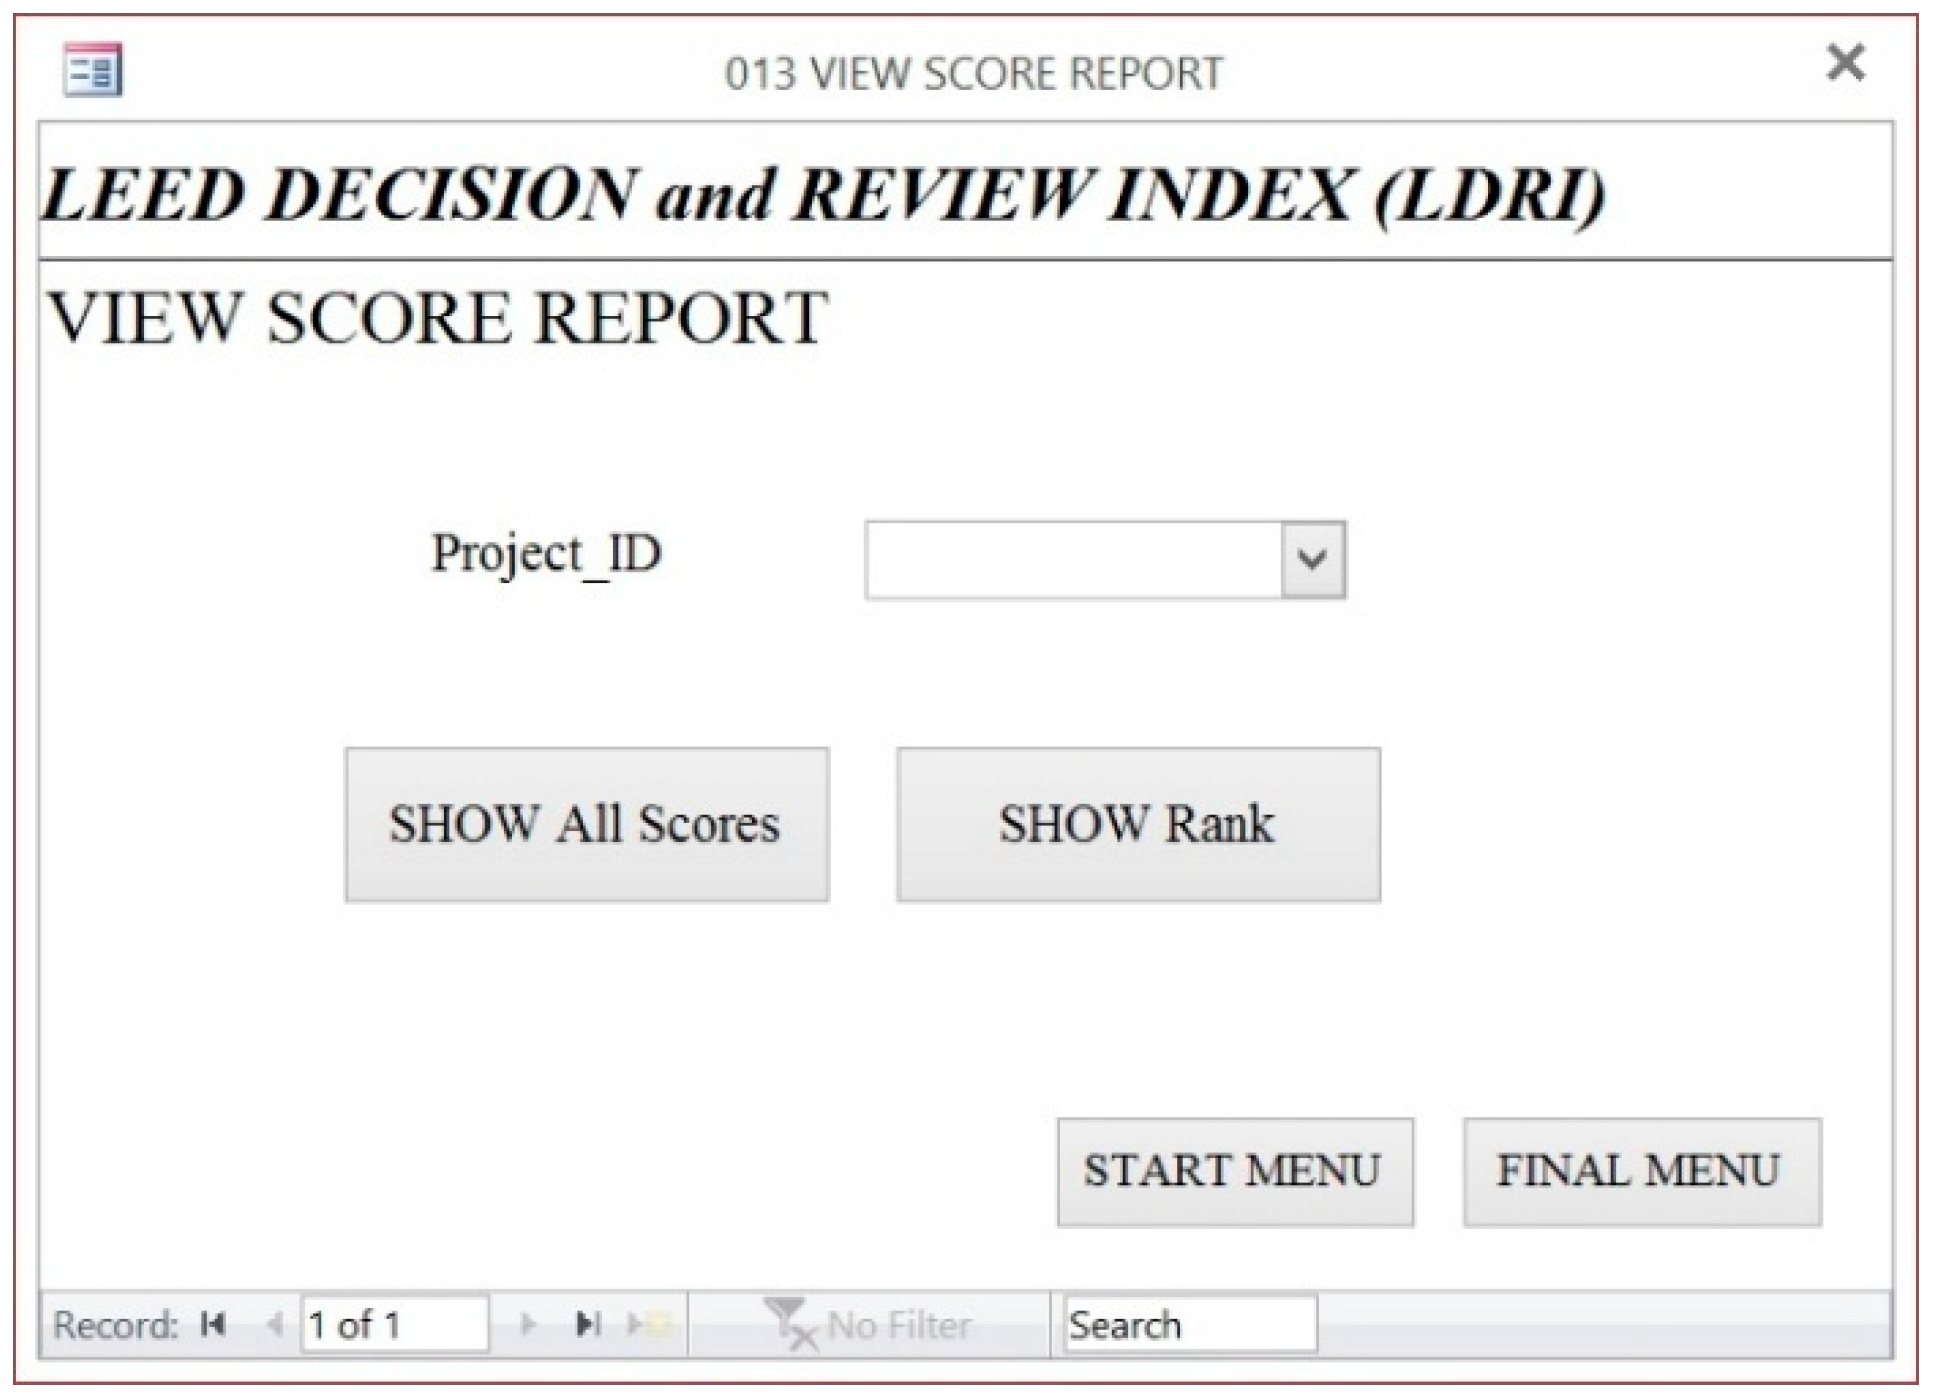
With these entities and relationships, to automate the data collection process using a series of forms, the researchers used macros and Structured Query Language (SQL). The forms were linked to each other using a common element in the forms such as the Project_ID. The final LDRI tool can be found in Results and Discussion section and the
Appendix.
2.5. Stage 5. Implementation
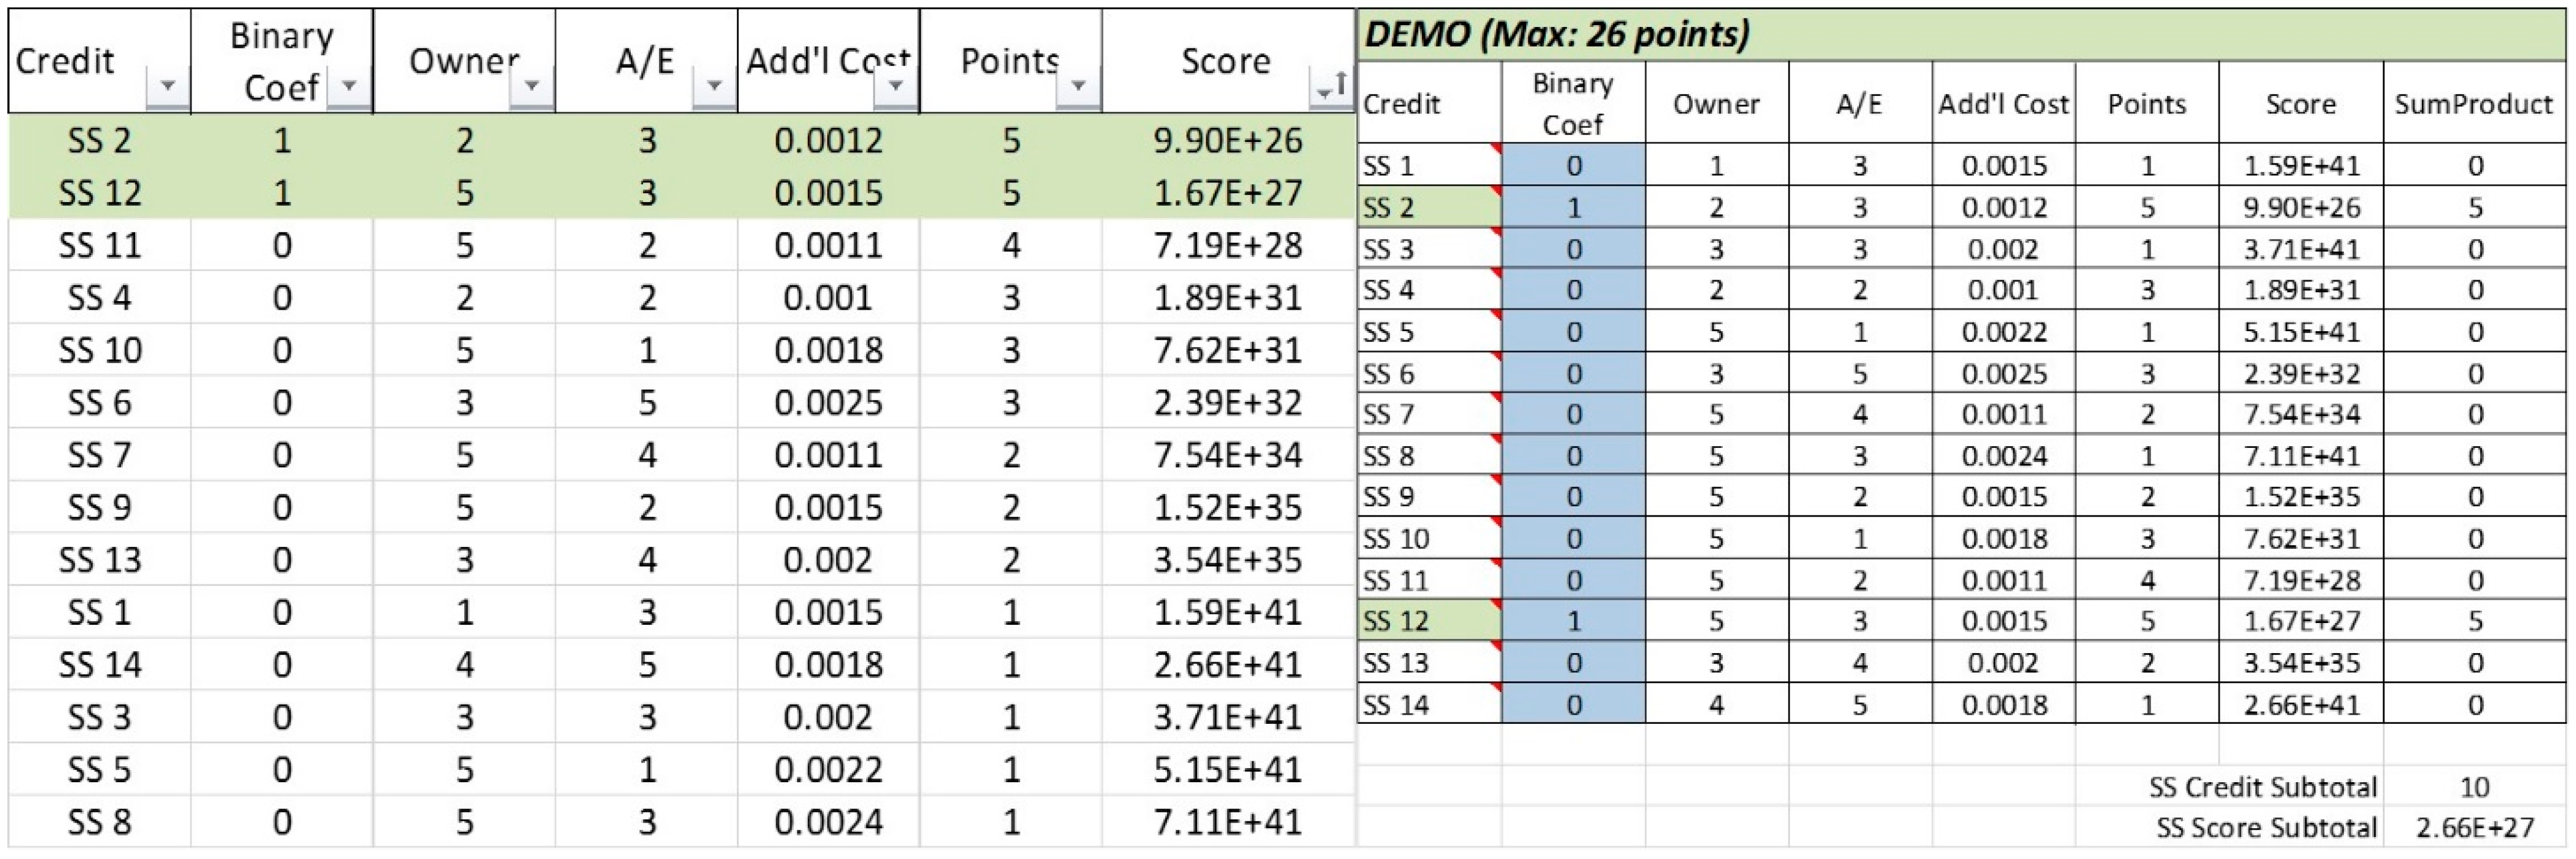
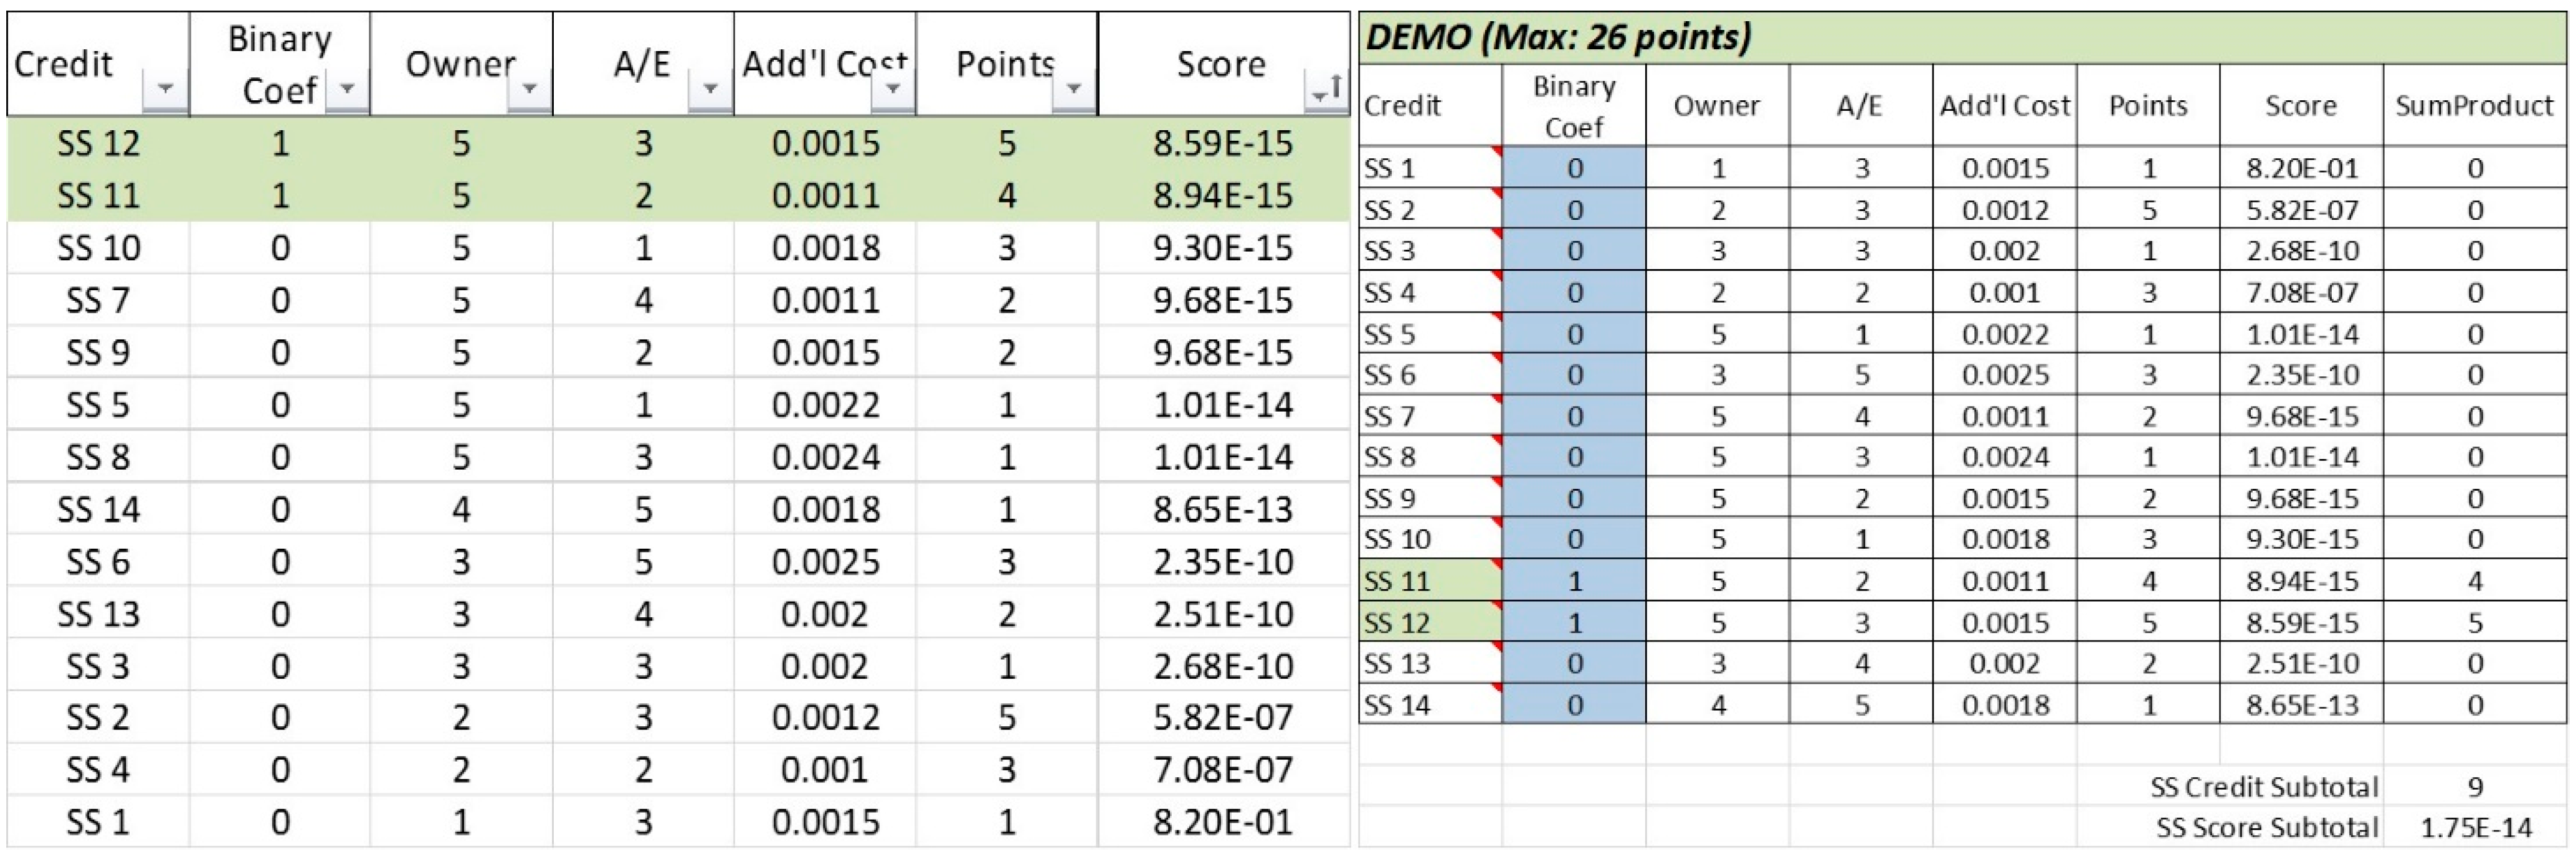
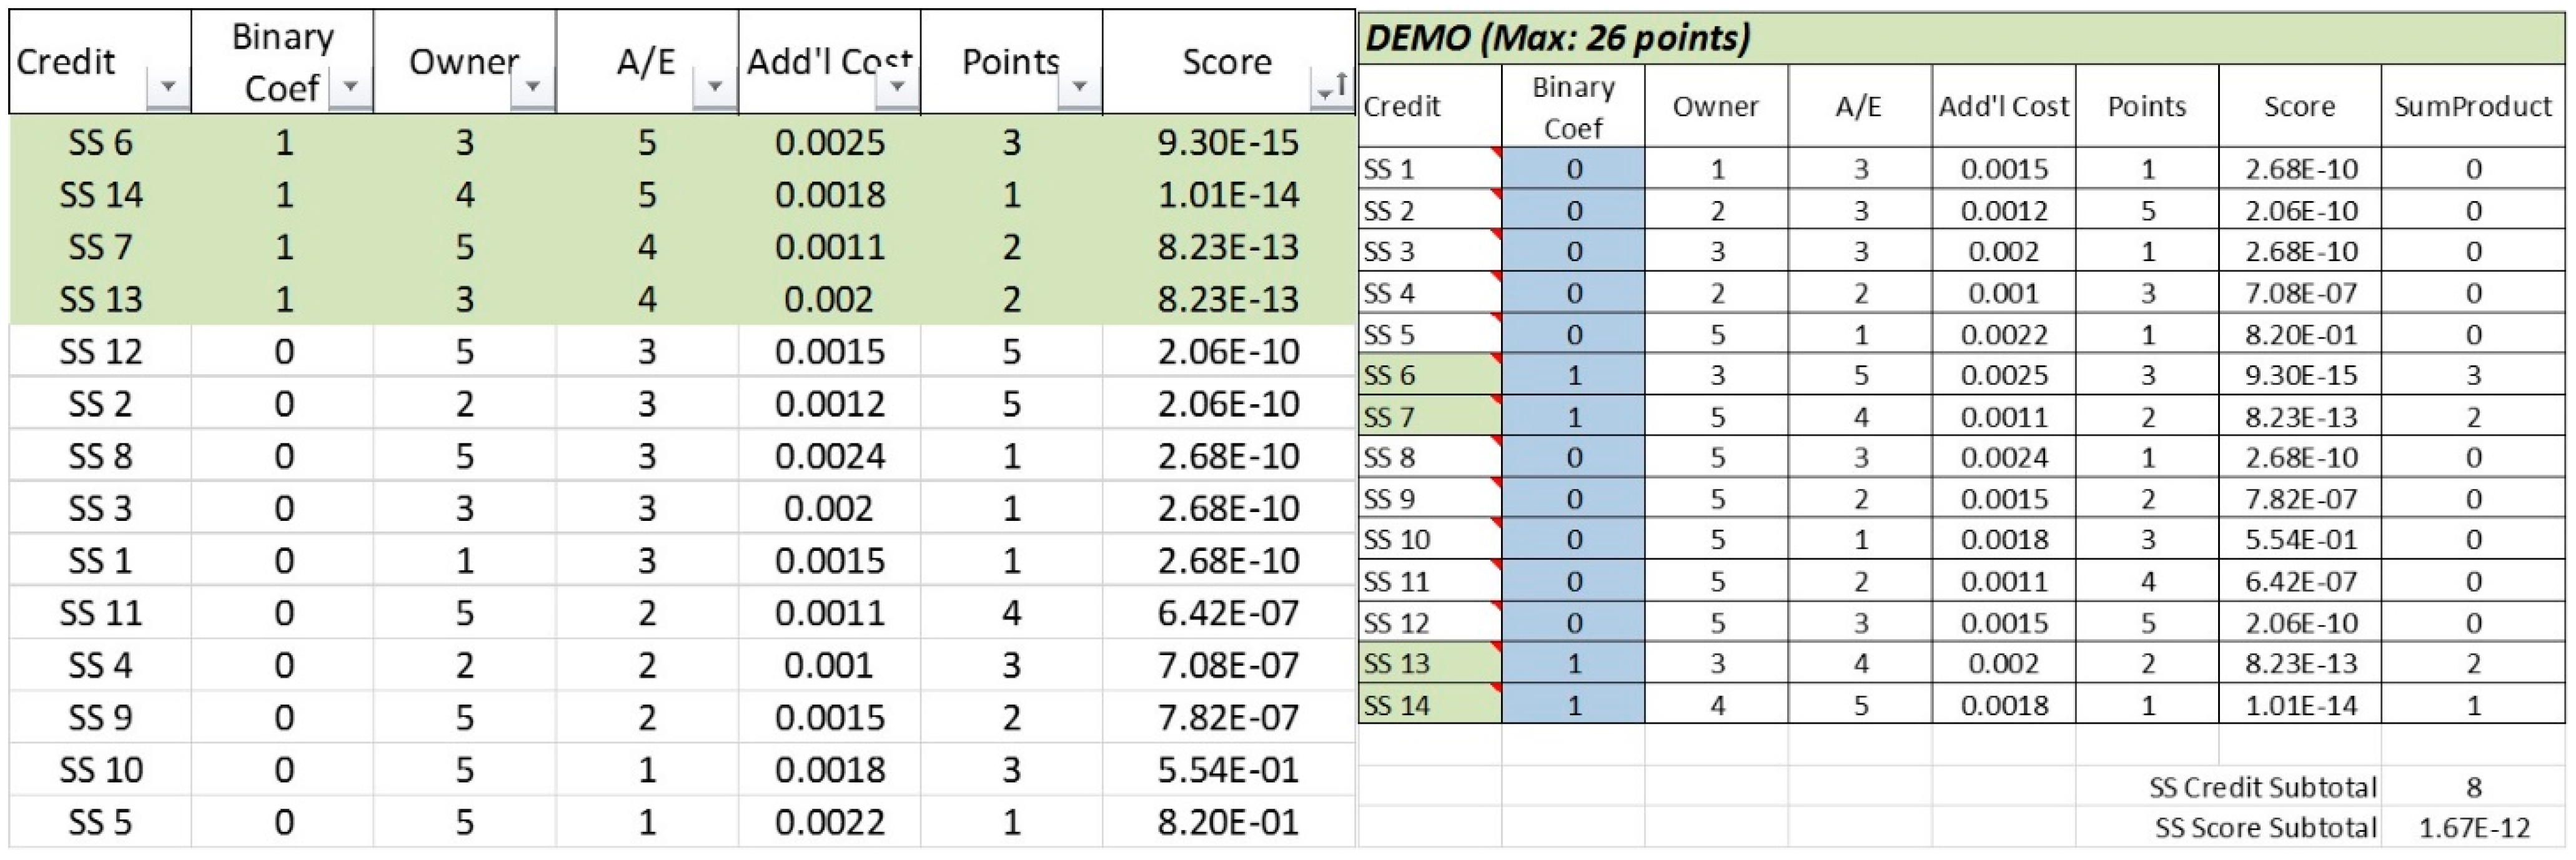
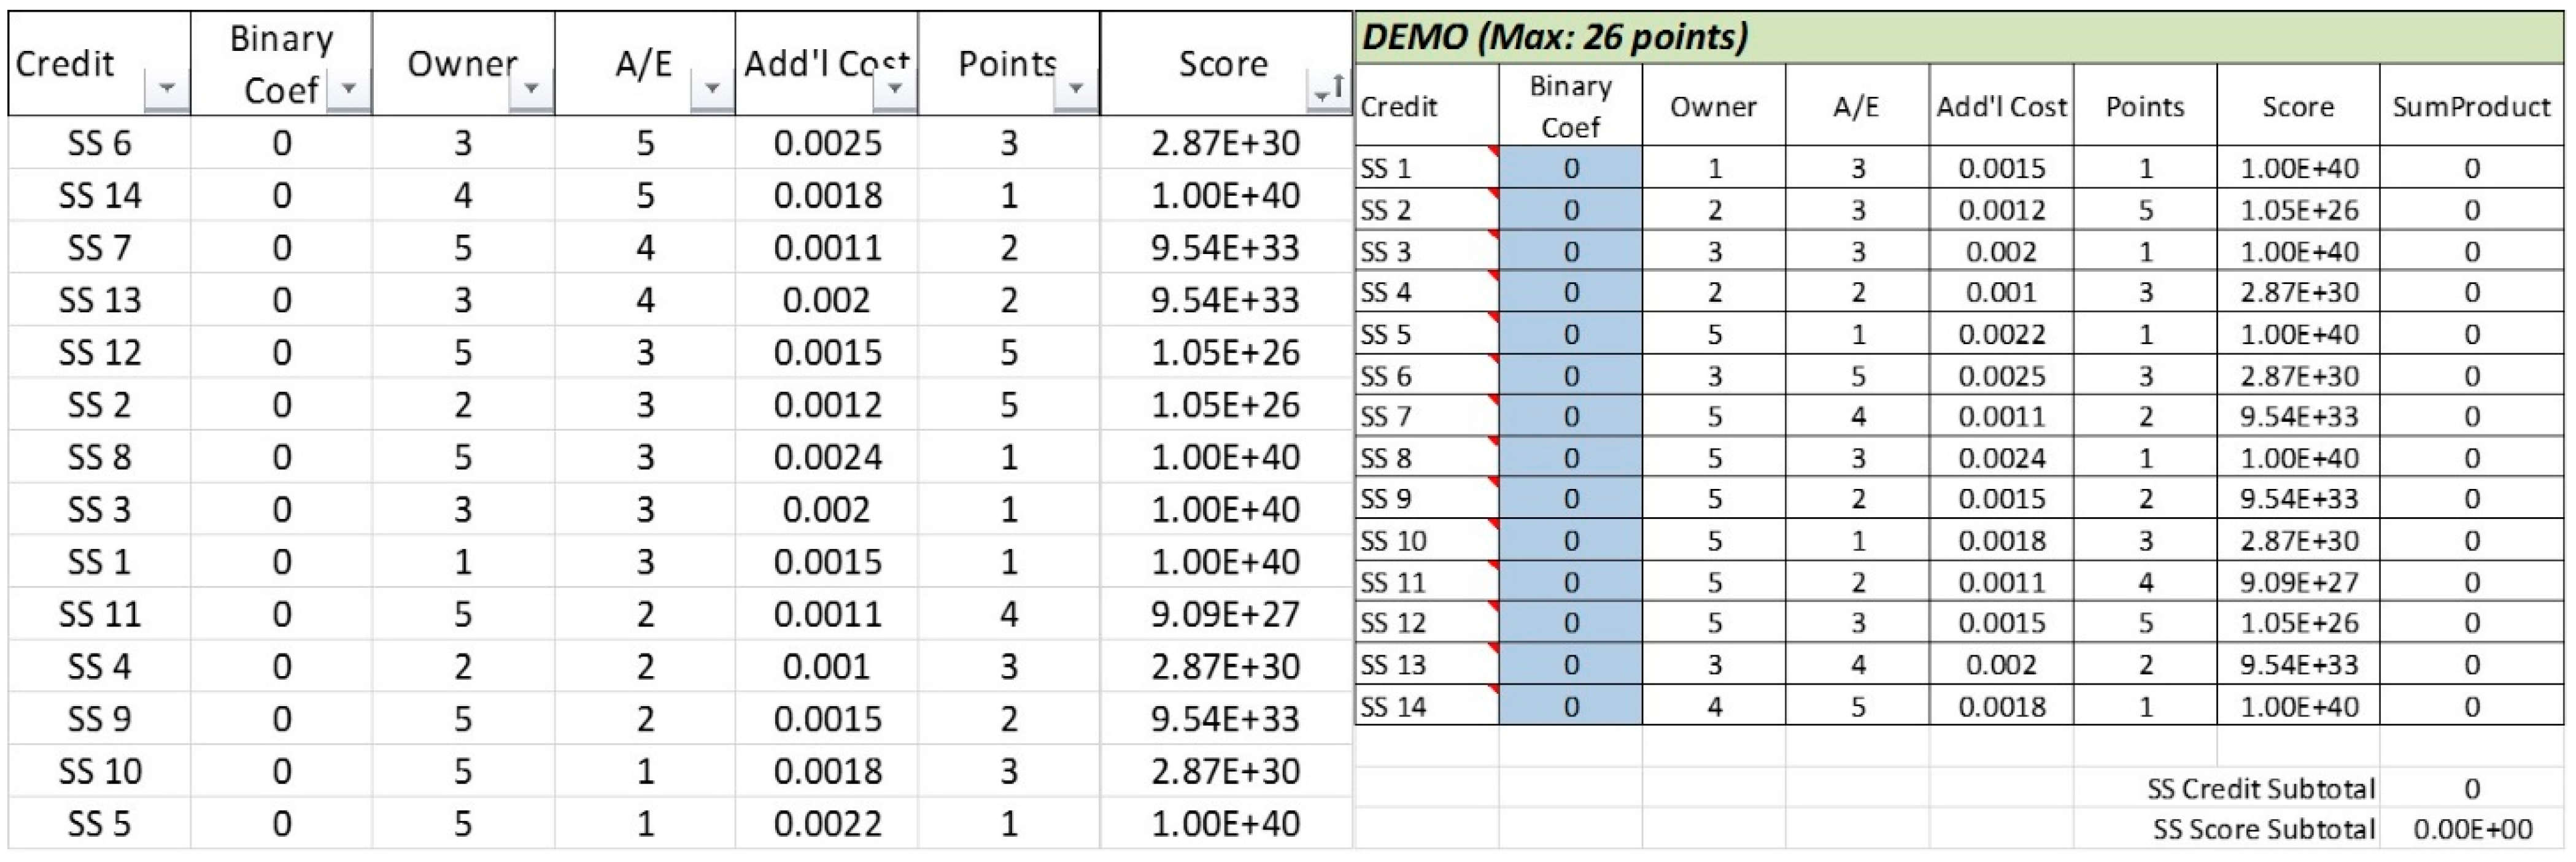
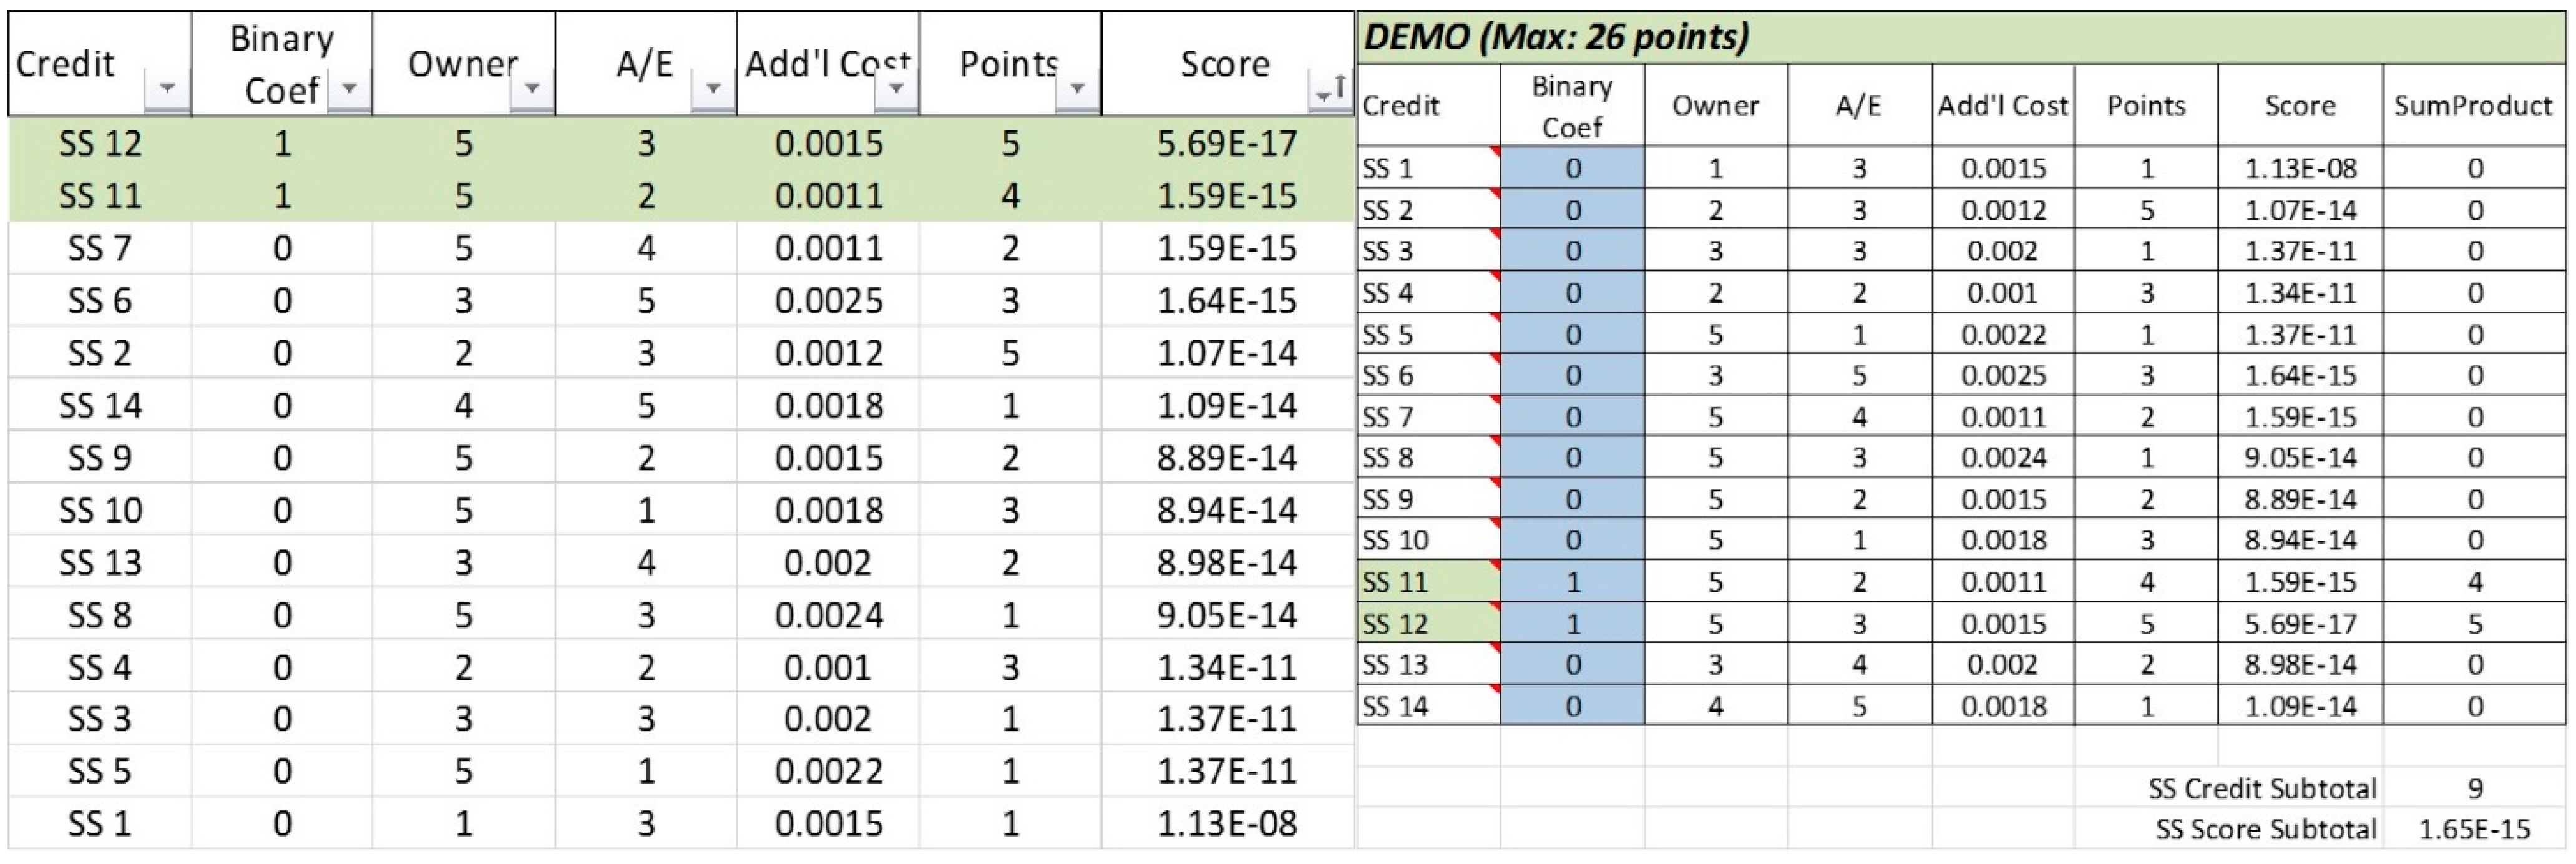
The objective function for optimization and the LDRI tool were tested through a demonstration set. As the full model is more complex, with 49 sub-categories, it is difficult to observe significant or meaningful differences between sub-categories scores, especially between sensitive scores (small score differences). Due to this reason, the researchers developed a demonstration (demo) set (
Figure 3). The demo set uses the same structure and formulas as the full model. The only difference is the scale; the demo set is smaller (
i.e., fewer number of credits to compare for selection). Compared to the model which has 49 sub-categories and 50 points constraint, the demo set consists of 14 subcategories and a 7 point constraint. The calculation system using binary coefficient and sumproduct, and range of owner, A/E, Add’l Cost, Points, and Objective function are same as the model. By using the demo set, the researchers tried several different objective functions, different sets of simulated data, and different coefficients. The researchers tried four different cases (1. balanced project; 2. cost-driven project; 3. owner-driven project; 4. A/E-driven project) to arrive at an optimal selection of sub-categories. The optimal solution was when the tool provided the same selection of sub-categories as the step-wise-process (conducting the process manually; 1. Rating; 2. Ranking; 3. Selecting). In other words, the researchers tested the model with the demo set by looking for same or similar selections of sub-categories between those given by the tool and the step-wise-process (selection by ascending order of scores with consideration of constraints).
Figure 3.
A sample demonstration set.
Figure 3.
A sample demonstration set.


