
Sustainable Water Infrastructure Asset Management: A Gap Analysis of Customer and Service Provider Perspectives


Abstract
:1. Introduction
2. Research Approach and Methodology

3. LOS Evaluation from the Customer’s Perspective


| Factors | LOW | LOCV | LCVA | Relative Weights of CVs () | Relative Weights of CVAs () |
|---|---|---|---|---|---|
| (A) | (B) | (C) | |||
| β | |||||
| Level 1 | |||||
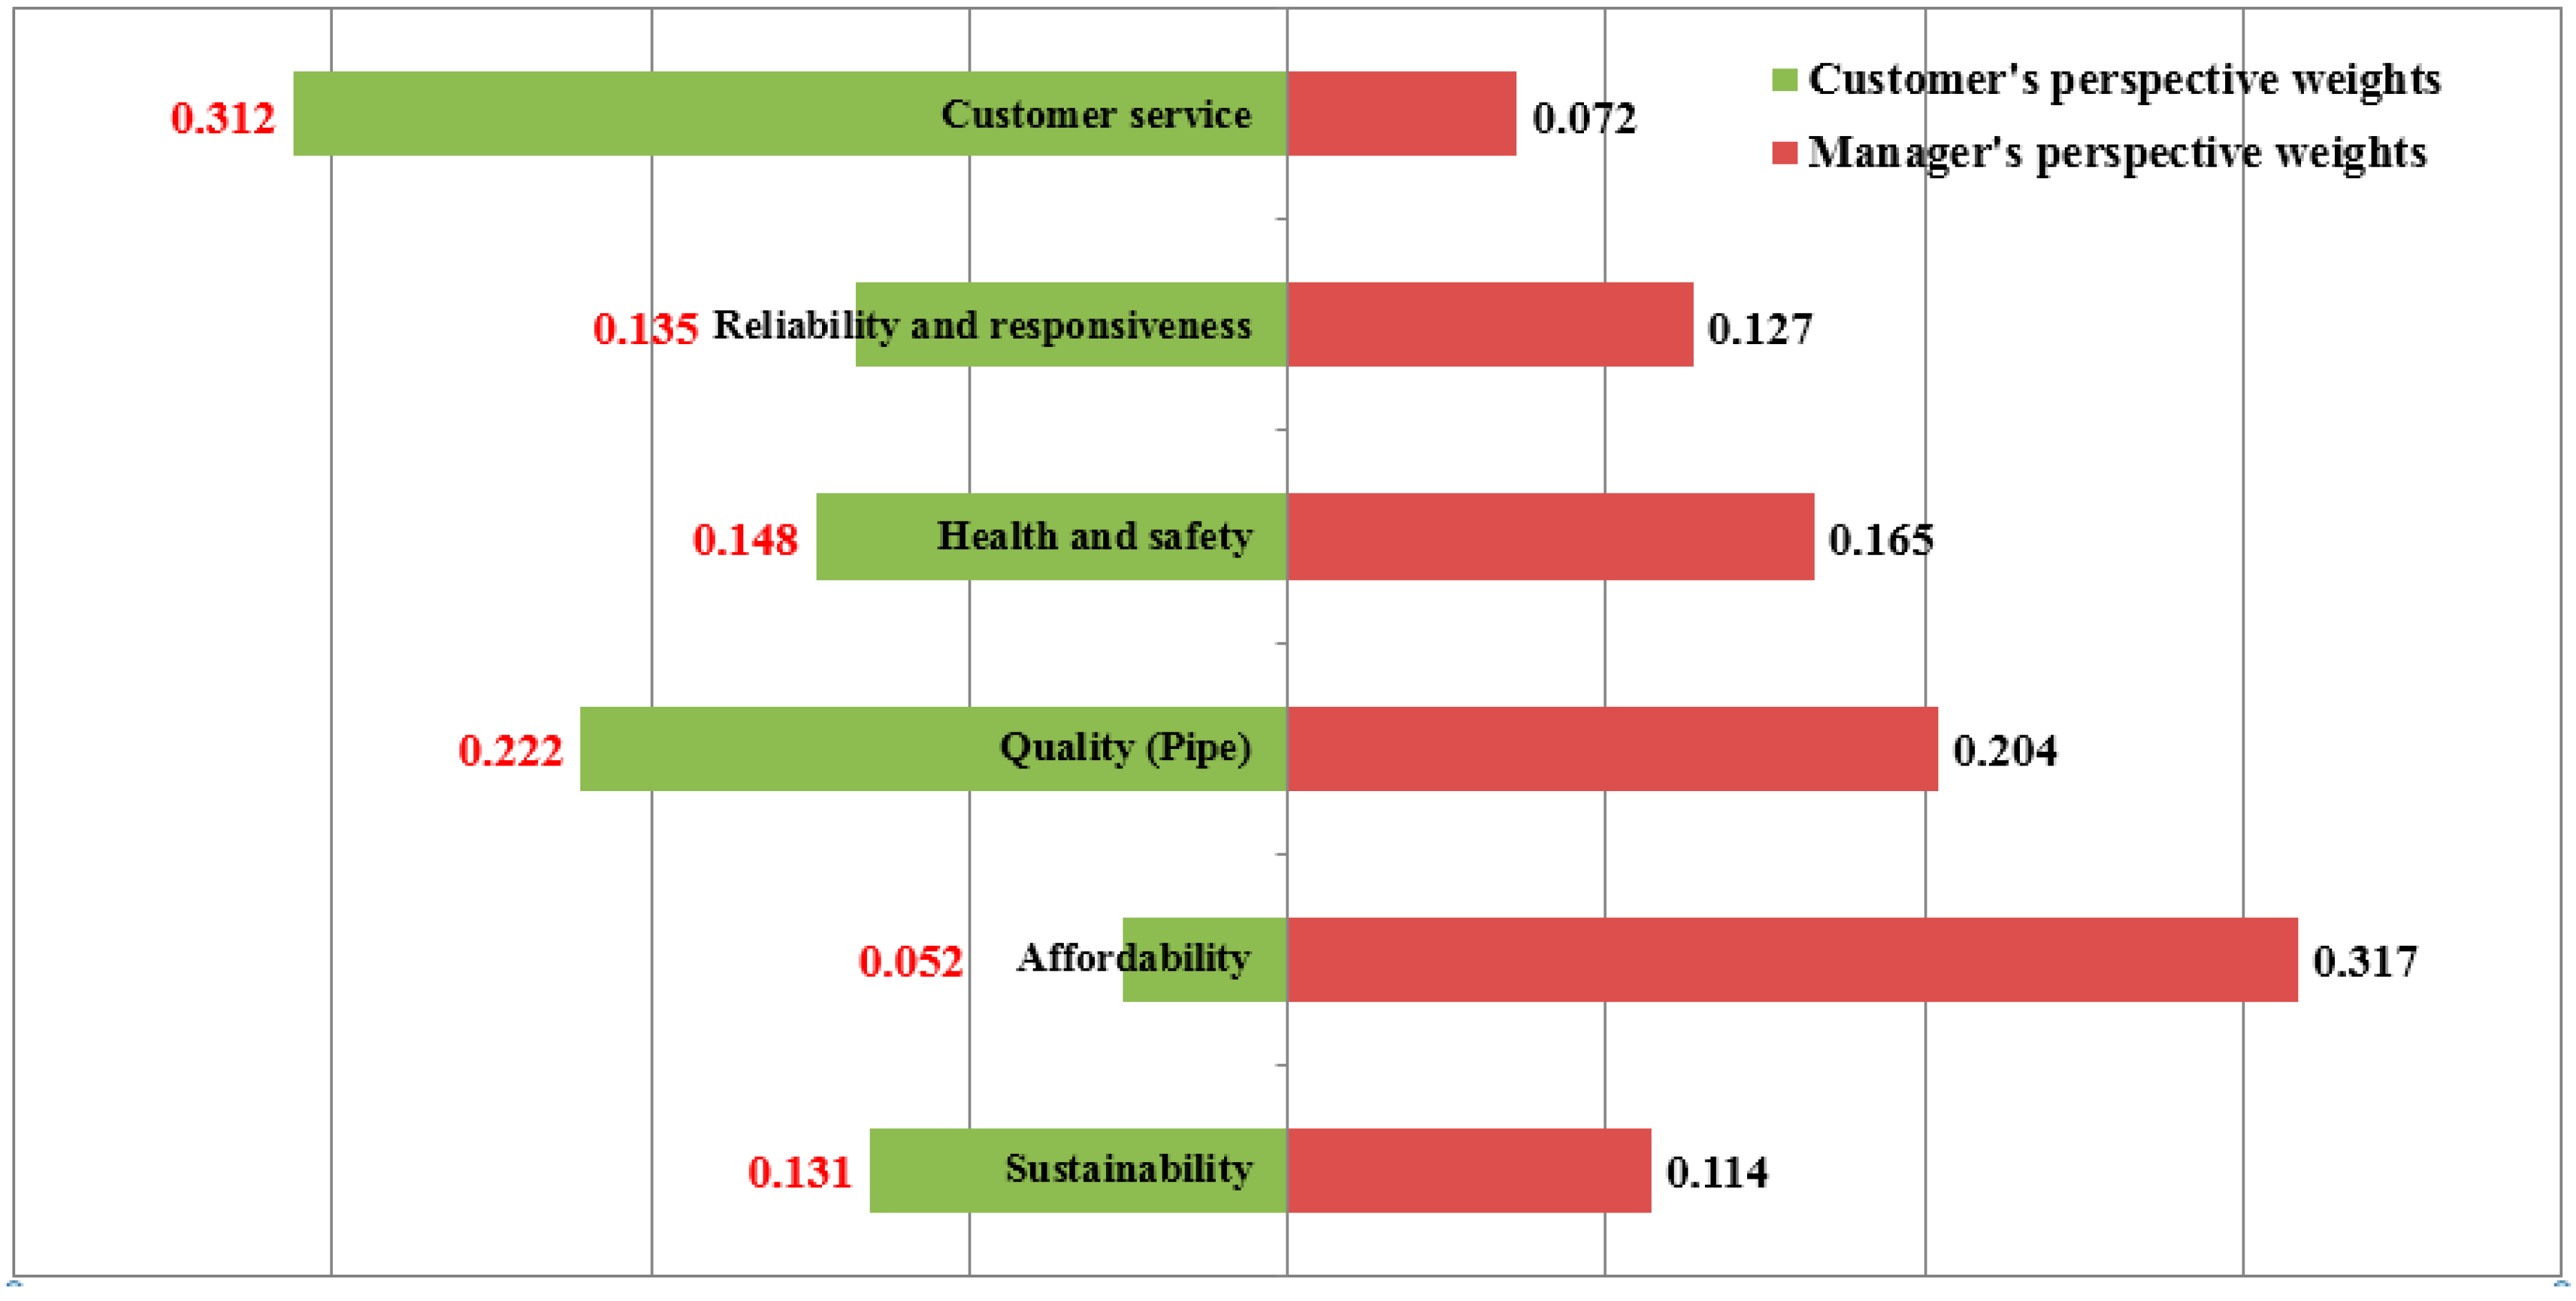
| Environmental | 0.131 | ||||
| Economic | 0.274 | ||||
| Social | 0.596 | ||||
| Level 2-Environmental | |||||
| Sustainability | 0.131 | 1 | 0.131 | ||
| Level 2-Economic | |||||
| Affordability | 0.274 | 0.189 | 0.052 | ||
| Quality | 0.810 | 0.222 | |||
| Level 2-Social | 0.596 | ||||
| Health/Safety | 0.249 | 0.148 | |||
| Reliability/Responsiveness | 0.227 | 0.135 | |||
| Customer service | 0.524 | 0.312 | |||
| Level 3-Sustainability | 0.131 | 1 | |||
| Water quality of water reservoir | 0.449 | 0.059 | |||
| Protection of water reservoir area | 0.551 | 0.072 | |||
| Level 3-Affordability | |||||
| Cost of water service | 0.274 | 0.189 | 1 | 0.052 | |
| Level 3-Quality(Physical) | |||||
| Water losses | 0.274 | 0.810 | 0.143 | 0.032 | |
| Water pressure | 0.326 | 0.072 | |||
| Useful life of water mains | 0.531 | 0.118 | |||
| Level 3-Health/Safety | |||||
| Safe to drink | 0.596 | 0.249 | 0.754 | 0.112 | |
| Probability of pipe accidents | 0.246 | 0.037 | |||
| Level 3-Reliability/Responsiveness | |||||
| Time to respond to planned service interruption | 0.596 | 0.227 | 0.297 | 0.040 | |
| Time to respond to unplanned interruption | 0.703 | 0.095 | |||
| Level 3-Customer service | |||||
| Information on internet | 0.596 | 0.524 | 0.519 | 0.162 | |
| Customer call center service | 0.481 | 0.150 |
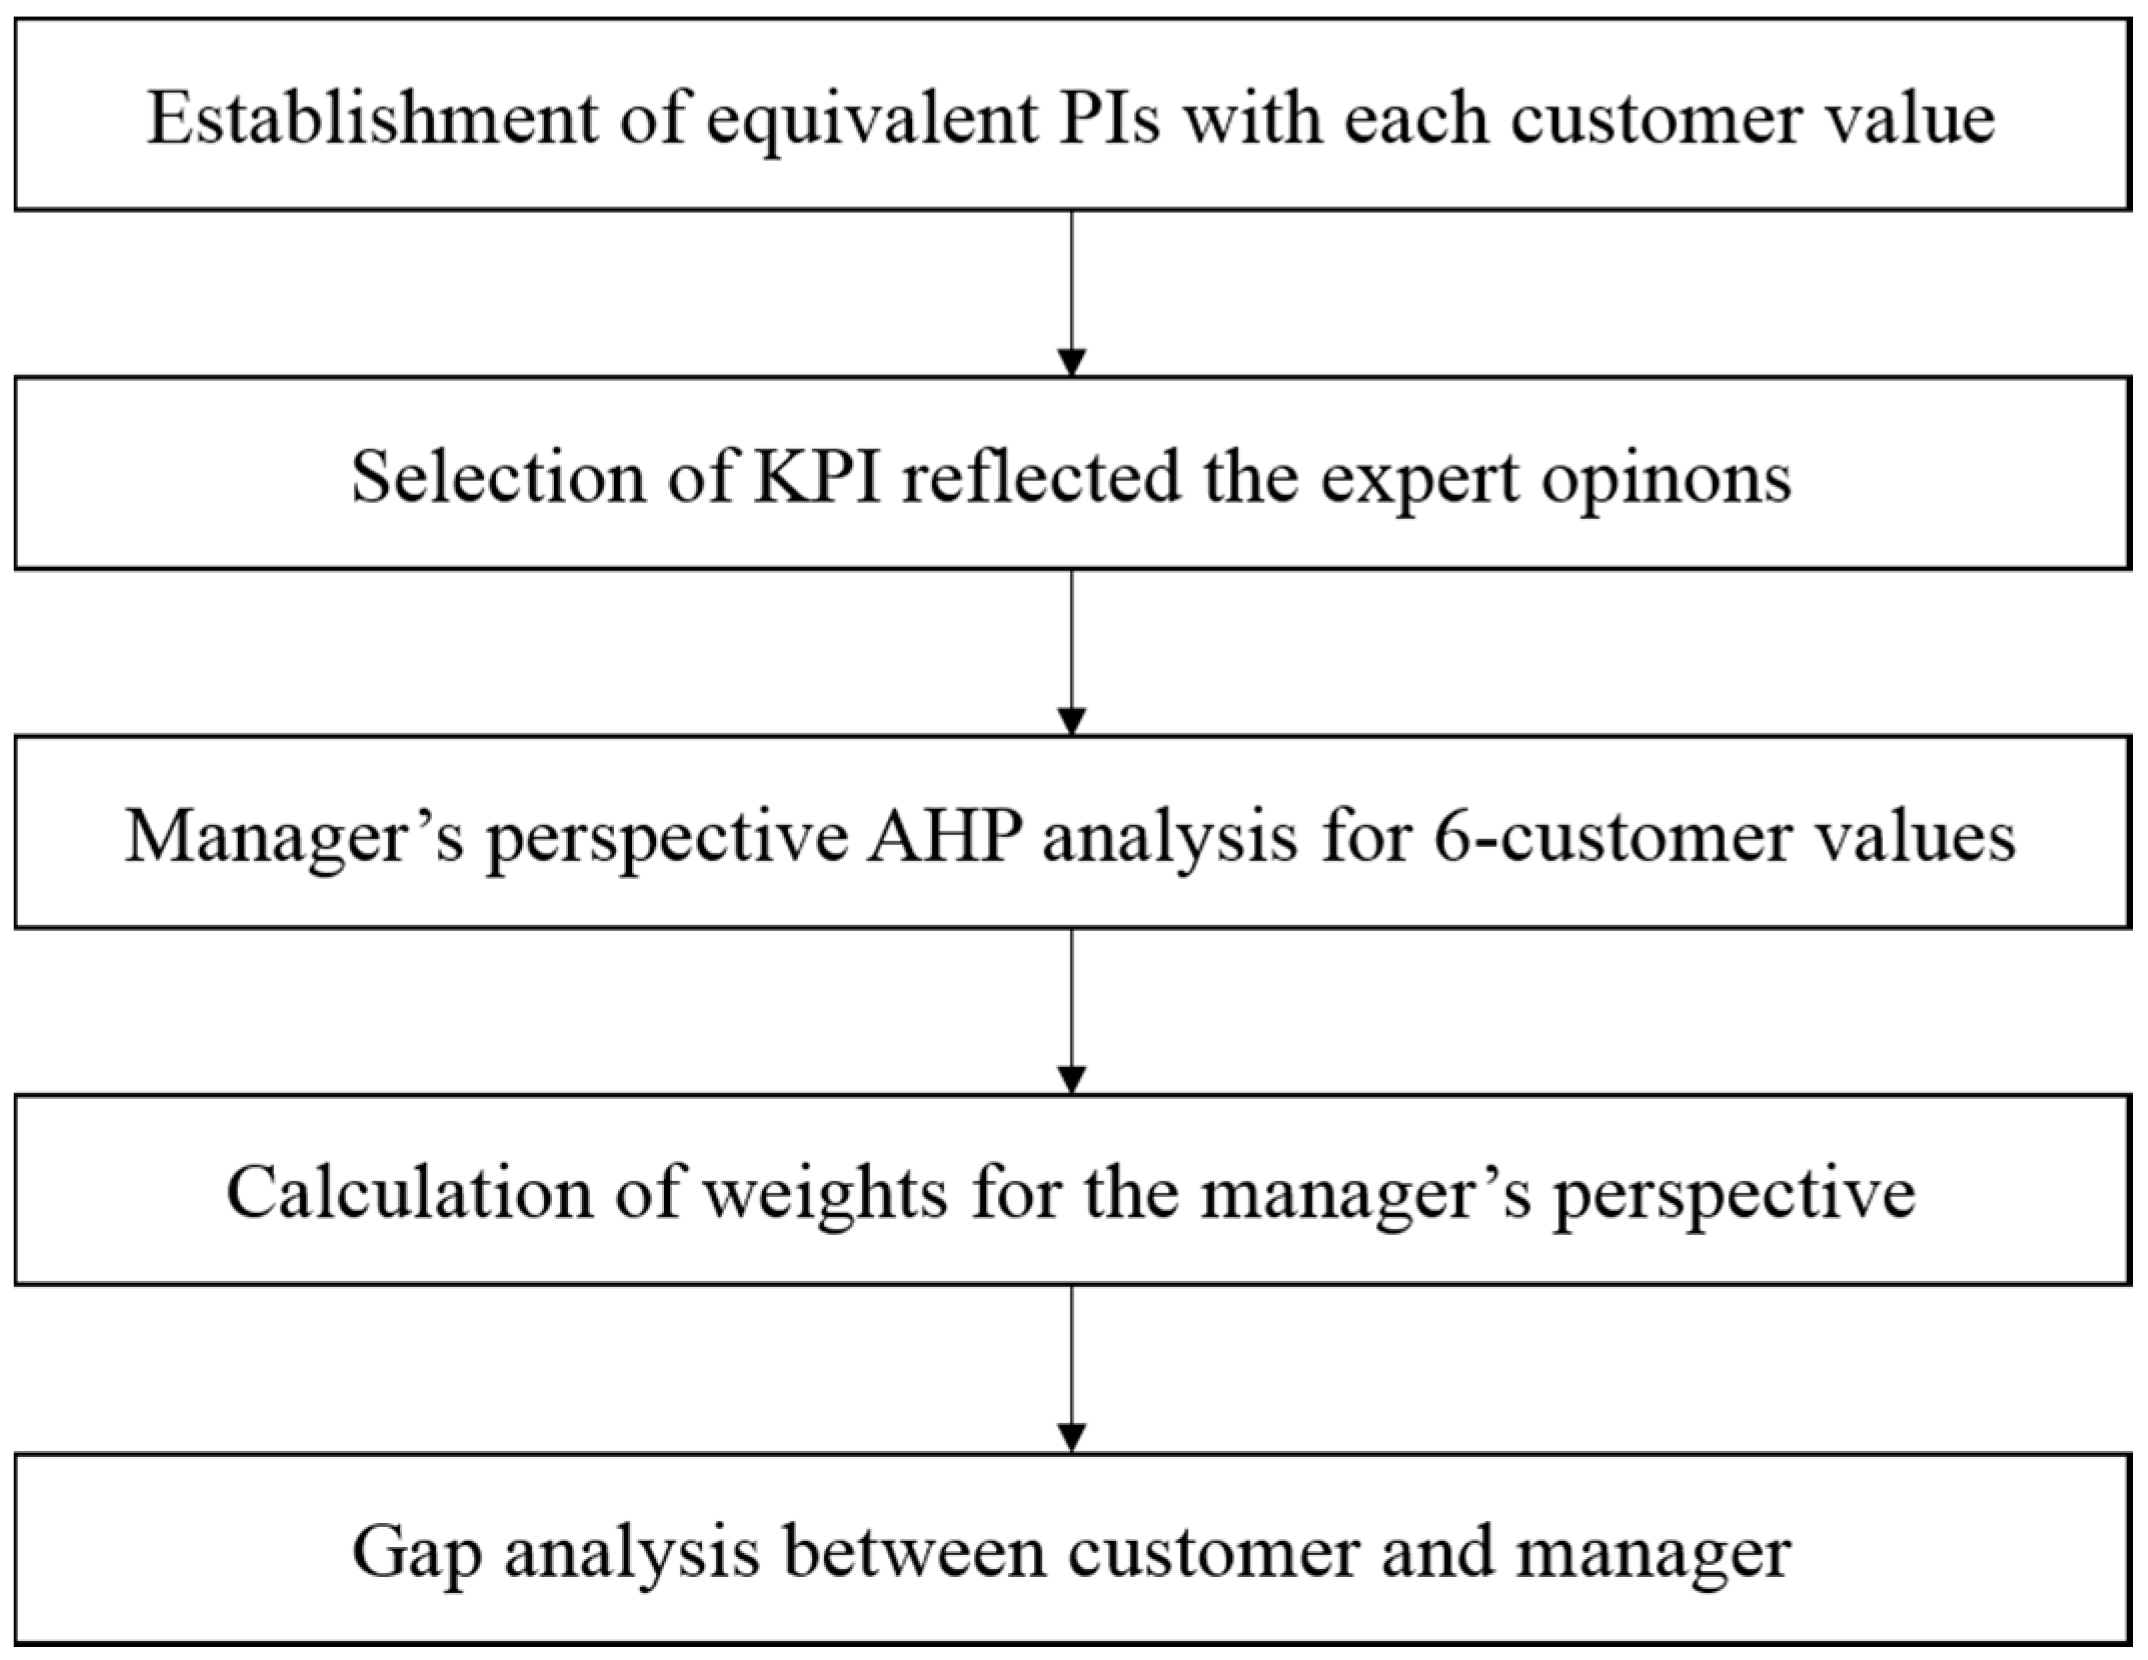
4. LOS Evaluation from the Manager’s Perspective
| Linguistic terms (the comparison of A to B) | Score |
|---|---|
| Absolutely strong (AS) | 9 |
| Between AS and VS | 8 |
| Very strong (VS) | 7 |
| Between VS and FS | 6 |
| Fairly strong (FS) | 5 |
| Between FS and SS | 4 |
| Slightly strong (SS) | 3 |
| Between SS and E | 2 |
| Equal (E) | 1 |
| Between E and SW | 1/2 |
| Slightly weak (SW) | 1/3 |
| Between SW and FW | 1/4 |
| Fairly weak (FW) | 1/5 |
| Between FW and VW | 1/6 |
| Very weak (VW) | 1/7 |
| Between VW and AW | 1/8 |
| Absolutely weak (AW) | 1/9 |

| Grade | Description |
|---|---|
| 1 | Ultra-advanced purification technology application (membrane filtration), 100% automated WTP, expanded facilities for source water management, 100% compliance rate for the water treatment plant safety inspection |
| 2 | Advanced purification technology application, more than 80% automated WTP, 100% compliance rate for the water treatment plant safety inspection |
| 3 | More than 60% automated WTP, more than 80% compliance rate for the water treatment plant safety inspection |
| 4 | More than 40% automated WTP, more than 60% compliance rate for the water treatment plant safety inspection |
| 5 | Less than 40% automated WTP, less than 60% compliance rate for water treatment plant safety inspection |
| Factor | Strategic Level (A) | Tactical Level (B) | Operational Level (C) | Weights of CVs () | Weights of PIs () |
|---|---|---|---|---|---|
| Level 1 | |||||
| Planet | 0.114 | ||||
| Profit | 0.522 | ||||
| People | 0.365 | ||||
| Level 2-Planet | |||||
| Sustainability | 0.114 | 1 | 0.114 | ||
| Level 2-Profit | |||||
| Affordability | 0.522 | 0.608 | 0.317 | ||
| Quality | 0.392 | 0.204 | |||
| Level 2-People | 0.365 | ||||
| Health/Safety | 0.453 | 0.165 | |||
| Reliability/Responsiveness | 0.348 | 0.127 | |||
| Customer service | 0.198 | 0.072 | |||
| Level 3-Sustainability | 0.114 | 1 | |||
| Water resource quality | 0.438 | 0.050 | |||
| Water resource quantity | 0.562 | 0.064 | |||
| Level 3-Affordability | |||||
| Total cost coverage ratio | 0.522 | 0.608 | 1 | 0.317 | |
| Level 3-Quality(Pipe) | |||||
| Apparent losses | 0.522 | 0.392 | 0.239 | 0.049 | |
| Pressure of supply adequacy | 0.485 | 0.099 | |||
| Pipe ratio of exceeded useful life | 0.276 | 0.056 | |||
| Level 3-Health/Safety | |||||
| Water quality of supplied water from Pipe | 0.365 | 0.453 | 0.633 | 0.105 | |
| Water quality of supplied water from treatment plant | 0.367 | 0.061 | |||
| Level 3-Reliability/Responsiveness | |||||
| System | 0.365 | 0.348 | 0.597 | 0.076 | |
| Manpower | 0.403 | 0.051 | |||
| Level 3-Customer service | |||||
| Satisfaction with customer service on information | 0.365 | 0.198 | 0.503 | 0.036 | |
| Satisfaction with customer service on emotion | 0.497 | 0.036 |
5. The Gap Analysis Results between the Perspectives of Customers and Managers
6. Conclusions
Acknowledgments
Author Contributions
Conflicts of Interest
References
- Schulting, F.; Alegre, H. Report: Global developments of strategic asset management. In Strategic Asset Management of Water Supply and Wastewater Infrastructure: Invited Papers from the IWA Leading Edge Conference on Strategic Asset Management (LESAM); Proceedings of the IWA Leading Edge Conference on Strategic Asset Management (LESAM), Lisbon, Portugal, 17–19 October 2007; IWA Publishing: London, UK, 2009; pp. 13–29. [Google Scholar]
- Kleiner, Y.; Sadiq, R.; Rajani, B. Modeling failure risk in buried pipes using fuzzy markov deterioration process. In Proceeding of the ASCE International Conference on Pipeline Engineering and Construction, San Diego, CA, USA, 1–4 August 2004.
- Rogers, P.D.; Grigg, N.S. Failure assessment modeling to prioritize water pipe renewal: Two case studies. J. Infrastruct. Syst. 2009, 15, 162–171. [Google Scholar] [CrossRef]
- Baah, K.; Dubey, B.; Harvey, R.; McBean, E. A risk-based approach to sanitary sewer pipe asset management. Sci. Total Environ. 2015, 505, 1011–1017. [Google Scholar] [CrossRef] [PubMed]
- Giustolisi, O.; Laucelli, D.; Savic, D.A. Development of rehabilitation plans for water mains replacement considering risk and cost-benefit assessment. Civil Eng. Environ. Syst. 2006, 23, 175–190. [Google Scholar] [CrossRef]
- Gaivoronski, A.; Sechi, G.M.; Zuddas, P. Cost/risk balanced management of scarce resources using stochastic programming. Eur. J. Oper. Res. 2012, 216, 214–224. [Google Scholar] [CrossRef]
- Halfawy, M.R.; Dridi, L.; Baker, S. Integrated decision support system for optimal renewal planning of sewer networks. J. Comput. Civil Eng. 2008, 22, 360–372. [Google Scholar] [CrossRef]
- KWR (Kiwa Water Research). Consumer Satisfaction, Preference and Acceptance Regarding Drinking Water Services: An Overview of Literature Findings and Assessment Methods; Kiwa Water Research: Nieuwegein, The Netherlands, 2008. [Google Scholar]
- Ojo, V.O. Customer satisfaction: A framework for assessing the service quality of urban water service providers in Abuja, Nigeria. Ph.D. Thesis, Loughborough University, Loughborough, UK, 2011. [Google Scholar]
- Hanson, J.J.; Murrill, S.D. South Tahoe Public Utility District 2012 Customer Satisfaction and Perceptions Survey Report of Results; Meta Research, Inc.: Sequim, WA, US, 2013. [Google Scholar]
- NAMS Group. International Infrastructure Management Manual. NZ National Asset Management Steering Group; Association of Local Government Engineers NZ Inc (INGENIUM): Thames, New Zealand, 2006. [Google Scholar]
- NAMS Group. Developing Levels of Service and Performance Measures. NZ National Asset Management Steering Group; Association of Local Government Engineers NZ Inc (INGENIUM): Thames, New Zealand, 2007. [Google Scholar]
- Levallois, P.; Grondin, J.; Gingras, S. Evaluation of consumer attitudes on taste and tap water alternatives in québec. Water Sci. Technol. 1999, 40, 135–139. [Google Scholar] [CrossRef]
- Lou, J.C.; Lee, W.L.; Han, J.Y. Influence of alkalinity, hardness and dissolved solids on drinking water taste: A case study of consumer satisfaction. J. Environ. Manag. 2007, 82, 1–12. [Google Scholar] [CrossRef] [PubMed]
- Kayaga, S.; Calvert, J.; Sansom, K. Paying for water services: Effects of household characteristics. Util. Policy 2003, 11, 123–132. [Google Scholar] [CrossRef]
- Wahid, N.A.; Hooi, C.K. Factors determining household consumer’s willingness to pay for water consumption in Malaysia. Asian Soc. Sci. 2015, 11. [Google Scholar] [CrossRef]
- Wikipedia. Gap Analysis. Available online: https://en.wikipedia.org/wiki/Gap_analysis (accessed on 23 September 2015).
- Mehan, G.T. The Clean Water and Drinking Water Infrastructure Gap Analysis; EPA-816-R-02-020; US Environmental Protection Agency Office of Water: Washington, DC, USA, 2002. Available online: http://www.epa.gov/safewater/gapreport.pdf (accessed on 23 September 2015).
- Lafferty, A.K.; Lauer, W.C. Benchmarking Performance Indicators for Water and Wastewater Utilities: Survey Data and Analyses Report; American Water Works Association: Denver, CO, USA, 2005; Available online: http://www.amazon.ca/Benchmarking-Performance-Indicators-Wastewater-Utilities/dp/158321366X (accessed on 23 September 2015).
- Graf, W. Assessing Utility Practices with the Strategic Asset Management Gap Analysis Tool (SAM Gap); SAM2C06; Water Environment Research Foundation: Alexandria, CO, USA, 2010; Available online: http://simple.werf.org/UploadFiles/SAM2C06 (accessed on 23 September 2015).
- Parasuraman, A.; Zeithaml, V.A.; Berry, L.L. A conceptual model of service quality and its implications for future research. J. Mark. 1985, 49, 41–50. [Google Scholar] [CrossRef]
- Tsai, W.H.; Hsu, W.; Chou, W.C. A gap analysis model for improving airport service quality. Total Qual. Manag. Bus. Excell. 2011, 22, 1025–1040. [Google Scholar] [CrossRef]
- Anand, S.V.; Selvaraj, M. Evaluation of service quality and its impact on customer satisfaction in indian banking sector—A comparative study using SERVPERF. Life Sci. J. Acta Zhengzhou Univ. Overseas Ed. 2013, 10, 3267–3274. [Google Scholar]
- Han, S.; Chae, M.; Hwang, H.; Choung, Y. Evaluation of customer-driven level of service for water infrastructure asset management. J. Manag. Eng. 2014, 31. Article 04014067. [Google Scholar] [CrossRef]
- Matos, R.; Cardoso, A.; Ashley, R.; Duarte, P.; Molinari, A.; Schulz, A. Performance Indicators for Wastewater Services; IWA Publishing: London, UK, 2003; Volume 1. [Google Scholar]
- Alegre, H. Performance Indicators for Water Supply Services; IWA Publishing: London, UK, 2006. [Google Scholar]
- Palme, U.; Tillman, A.-M. Sustainable development indicators: How are they used in Swedish water utilities? J. Clean. Prod. 2008, 16, 1346–1357. [Google Scholar] [CrossRef]
- Sklar, D.C. Performance measurement and reporting, Asset Management for Water and Wastewater Utilities. In Proceedings of the Water Environment Federation “Hot Topics” Workshop, New Orleans, LA, USA, 18–19 June 2008.
- Mutikanga, H.; Sharma, S.; Vairavamoorthy, K.; Cabrera, E., Jr. Using performance indicators as a water loss management tool in developing countries. J. Water Suppl. Res. Technol. Aqua 2010, 59, 471–481. [Google Scholar] [CrossRef]
- OFWAT (Office of Water Services). Key performance indicators-guidance. Available online: http://www.ofwat.gov.uk/regulating/compliance/gud_pro1203kpi.pdf (assessed on September 8 2015).
- Shinde, V.R.; Hirayama, N.; Mugita, A.; Itoh, S. Revising the existing performance indicator system for small water supply utilities in Japan. Urban Water J. 2013, 10, 377–393. [Google Scholar] [CrossRef]
- Haider, H.; Sadiq, R.; Tesfamariam, S. Performance indicators for small-and medium-sized water supply systems: A review. Environ. Rev. 2013, 22, 1–40. [Google Scholar] [CrossRef]
- Singh, M.; Mittal, A.K.; Upadhyay, V. Efficient water utilities: Use of performance indicator system and data envelopment analysis. Water Sci. Technol. Water Supply 2014, 14, 787–794. [Google Scholar] [CrossRef]
- Haider, H.; Sadiq, R.; Tesfamariam, S. Selecting performance indicators for small and medium sized water utilities: Multi-criteria analysis using ELECTRE method. Urban Water J. 2015, 12, 305–327. [Google Scholar] [CrossRef]
- Haider, H.; Sadiq, R.; Tesfamariam, S. Multilevel performance management framework for small to medium sized water utilities in Canada. Can. J. Civil Eng. 2015. [Google Scholar] [CrossRef]
- Haider, H.; Sadiq, R.; Tesfamariam, S. Inter-utility performance benchmarking model for small-to-medium-sized water utilities: Aggregated performance indices. ASCE J. Water Resour. Plan. Manag. 2015. [Google Scholar] [CrossRef]
- Slaper, T.F.; Hall, T.J. The triple bottom line: What is it and how does it work. Indiana Bus. Rev. 2011, 86, 4–8. [Google Scholar]
- Koo, D.-H.; Ariaratnam, S.T.; Kavazanjian, E., Jr. Development of a sustainability assessment model for underground infrastructure projects. Canadian J. Civil Eng. 2009, 36, 765–776. [Google Scholar] [CrossRef]
- Liner, B.; de Monsabert, S. Balancing the triple bottom line in water supply planning for utilities. J. Water Resour. Plan. Manag. ASCE 2011, 137, 335–342. [Google Scholar] [CrossRef]
- Kang, D.; Lansey, K. Dual water distribution network design under triple-bottom-line objectives. J. Water Resour. Plan. Manag. ASCE 2012, 138, 162–175. [Google Scholar] [CrossRef]
- Cronin, J.J., Jr.; Taylor, S.A. Measuring service quality: A reexamination and extension. J. Mark. 1992, 56, 55–68. Available online: http://www.researchgate.net/publication/225083621_Measuring_Service_Quality_-_A_Reexamination_And_Extension (accessed on 23 September 2015). [Google Scholar]
- Zeithaml, V.A.; Berry, L.L.; Parasuraman, A. Communication and control processes in the delivery of service quality. J. Mark. 1988, 52, 35–48. Available online: http://areas.kenan-flagler.unc.edu/Marketing/FacultyStaff/zeithaml/Selected%20Publications/Communication%20and%20Control%20Processes%20in%20the%20Delivery%20of%20Service%20Quality.pdf (accessed on 23 September 2015). [Google Scholar]
- Fox, J. Applied Regression Analysis, Linear Models, and Related Methods; Sage Publications Inc.: Thousand Oaks, CA, USA, 1997. [Google Scholar]
- Saaty, T.L. Multicriteria Decision Making: The Analytic Hierarchy Process; AHP series; RWS Publications: Pittsburgh, PA, USA, 1990; Volume 1. [Google Scholar]
- Orange County Sanitation District (OCSD). Orange County Sanitation District Asset Management Plan 2006. Available online: http://www.ocsd.com/Home/ShowDocument?id=11138 (assessed on 31 July 2015).
- OECD. frastructure to 2030: Mapping Policy for Electricity, Water and Transport; OECD: Paris, France, 2007. [Google Scholar]
- Hunter Water. Hunter Water 2009–2010 Annual Report. Available online: http://www.hunterwater.com.au/Resources/Documents/Annual-Reports---Past-Reports/Annual-Report-09-10.pdf (assessed on 31 July 2015).
© 2015 by the authors; licensee MDPI, Basel, Switzerland. This article is an open access article distributed under the terms and conditions of the Creative Commons Attribution license (http://creativecommons.org/licenses/by/4.0/).
Share and Cite
Han, S.; Hwang, H.; Kim, S.; Baek, G.S.; Park, J. Sustainable Water Infrastructure Asset Management: A Gap Analysis of Customer and Service Provider Perspectives. Sustainability 2015, 7, 13334-13350. https://doi.org/10.3390/su71013334
Han S, Hwang H, Kim S, Baek GS, Park J. Sustainable Water Infrastructure Asset Management: A Gap Analysis of Customer and Service Provider Perspectives. Sustainability. 2015; 7(10):13334-13350. https://doi.org/10.3390/su71013334
Chicago/Turabian StyleHan, Sangjong, Hwankook Hwang, Seonghoon Kim, Gyu Seok Baek, and Joonhong Park. 2015. "Sustainable Water Infrastructure Asset Management: A Gap Analysis of Customer and Service Provider Perspectives" Sustainability 7, no. 10: 13334-13350. https://doi.org/10.3390/su71013334
APA StyleHan, S., Hwang, H., Kim, S., Baek, G. S., & Park, J. (2015). Sustainable Water Infrastructure Asset Management: A Gap Analysis of Customer and Service Provider Perspectives. Sustainability, 7(10), 13334-13350. https://doi.org/10.3390/su71013334