Energy Efficiency and Energy Saving Potential in China: A Directional Meta-Frontier DEA Approach

Abstract
:1. Introduction

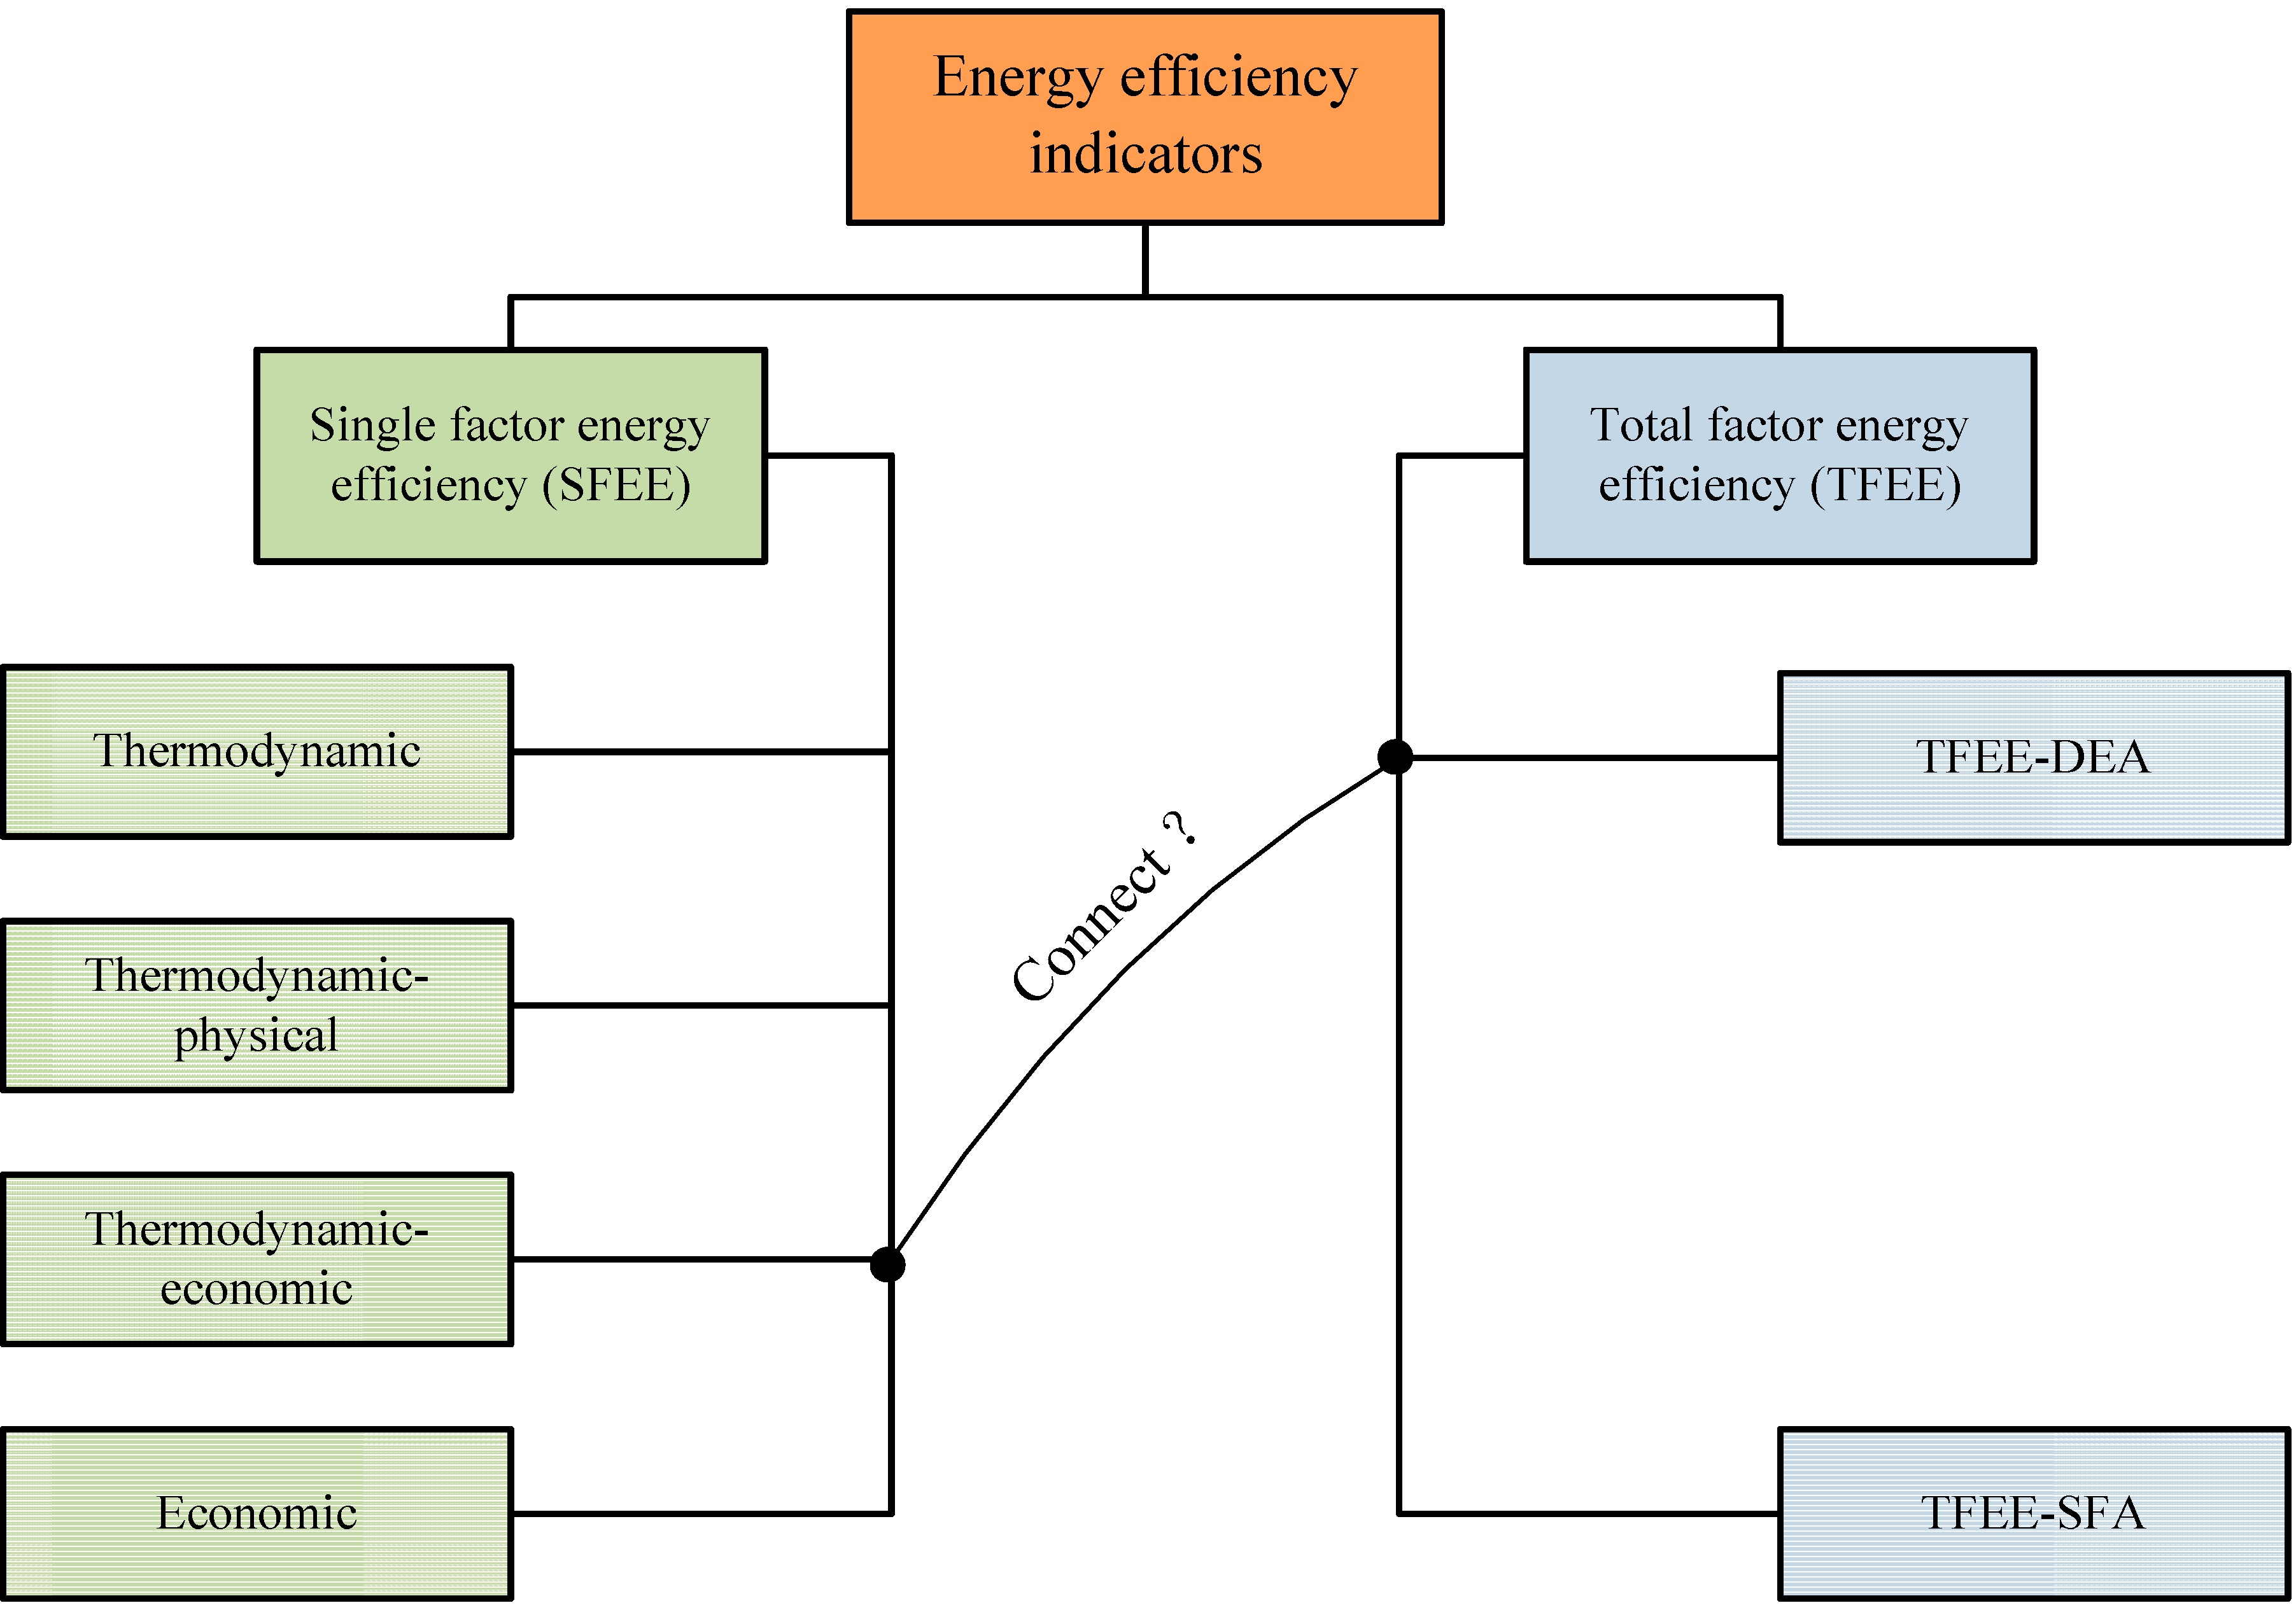
| Indicators | Definition | Advantages | Disadvantages |
|---|---|---|---|
| Thermodynamic | Energy output (J)/ Energy input (J) | Convenient for analyzing a specific process of the energy usage | Fails to embody the end-use of energy usage, and to achieve a macro-aggregation |
| Thermodynamic-physical | Energy usage (J)/ Energy service (physical unit) | Able to reflect directly the terminal service needed by energy consumers | Applicable only to a specific type of product, and relatively difficult in aggregating between different departments |
| Thermodynamic-economic | Energy usage (J)/ Energy service (monetary unit) | Able to measure the energy efficiencies at different levels (e.g. enterprise, industry and nation) | Fails to measure the potential technical efficiency of energy, and some non-efficiency factors may cause numerical changes |
| Economic | Energy usage (monetary unit)/ Energy service (monetary unit) | Able to reflect the economic productivity of energy and provide information on energy prices | Fails to measure the energy prices with an ideal price due to the constant price changes |
2. Methodology
2.1. Directional Distance Function
2.2. Energy Efficiency Indicator
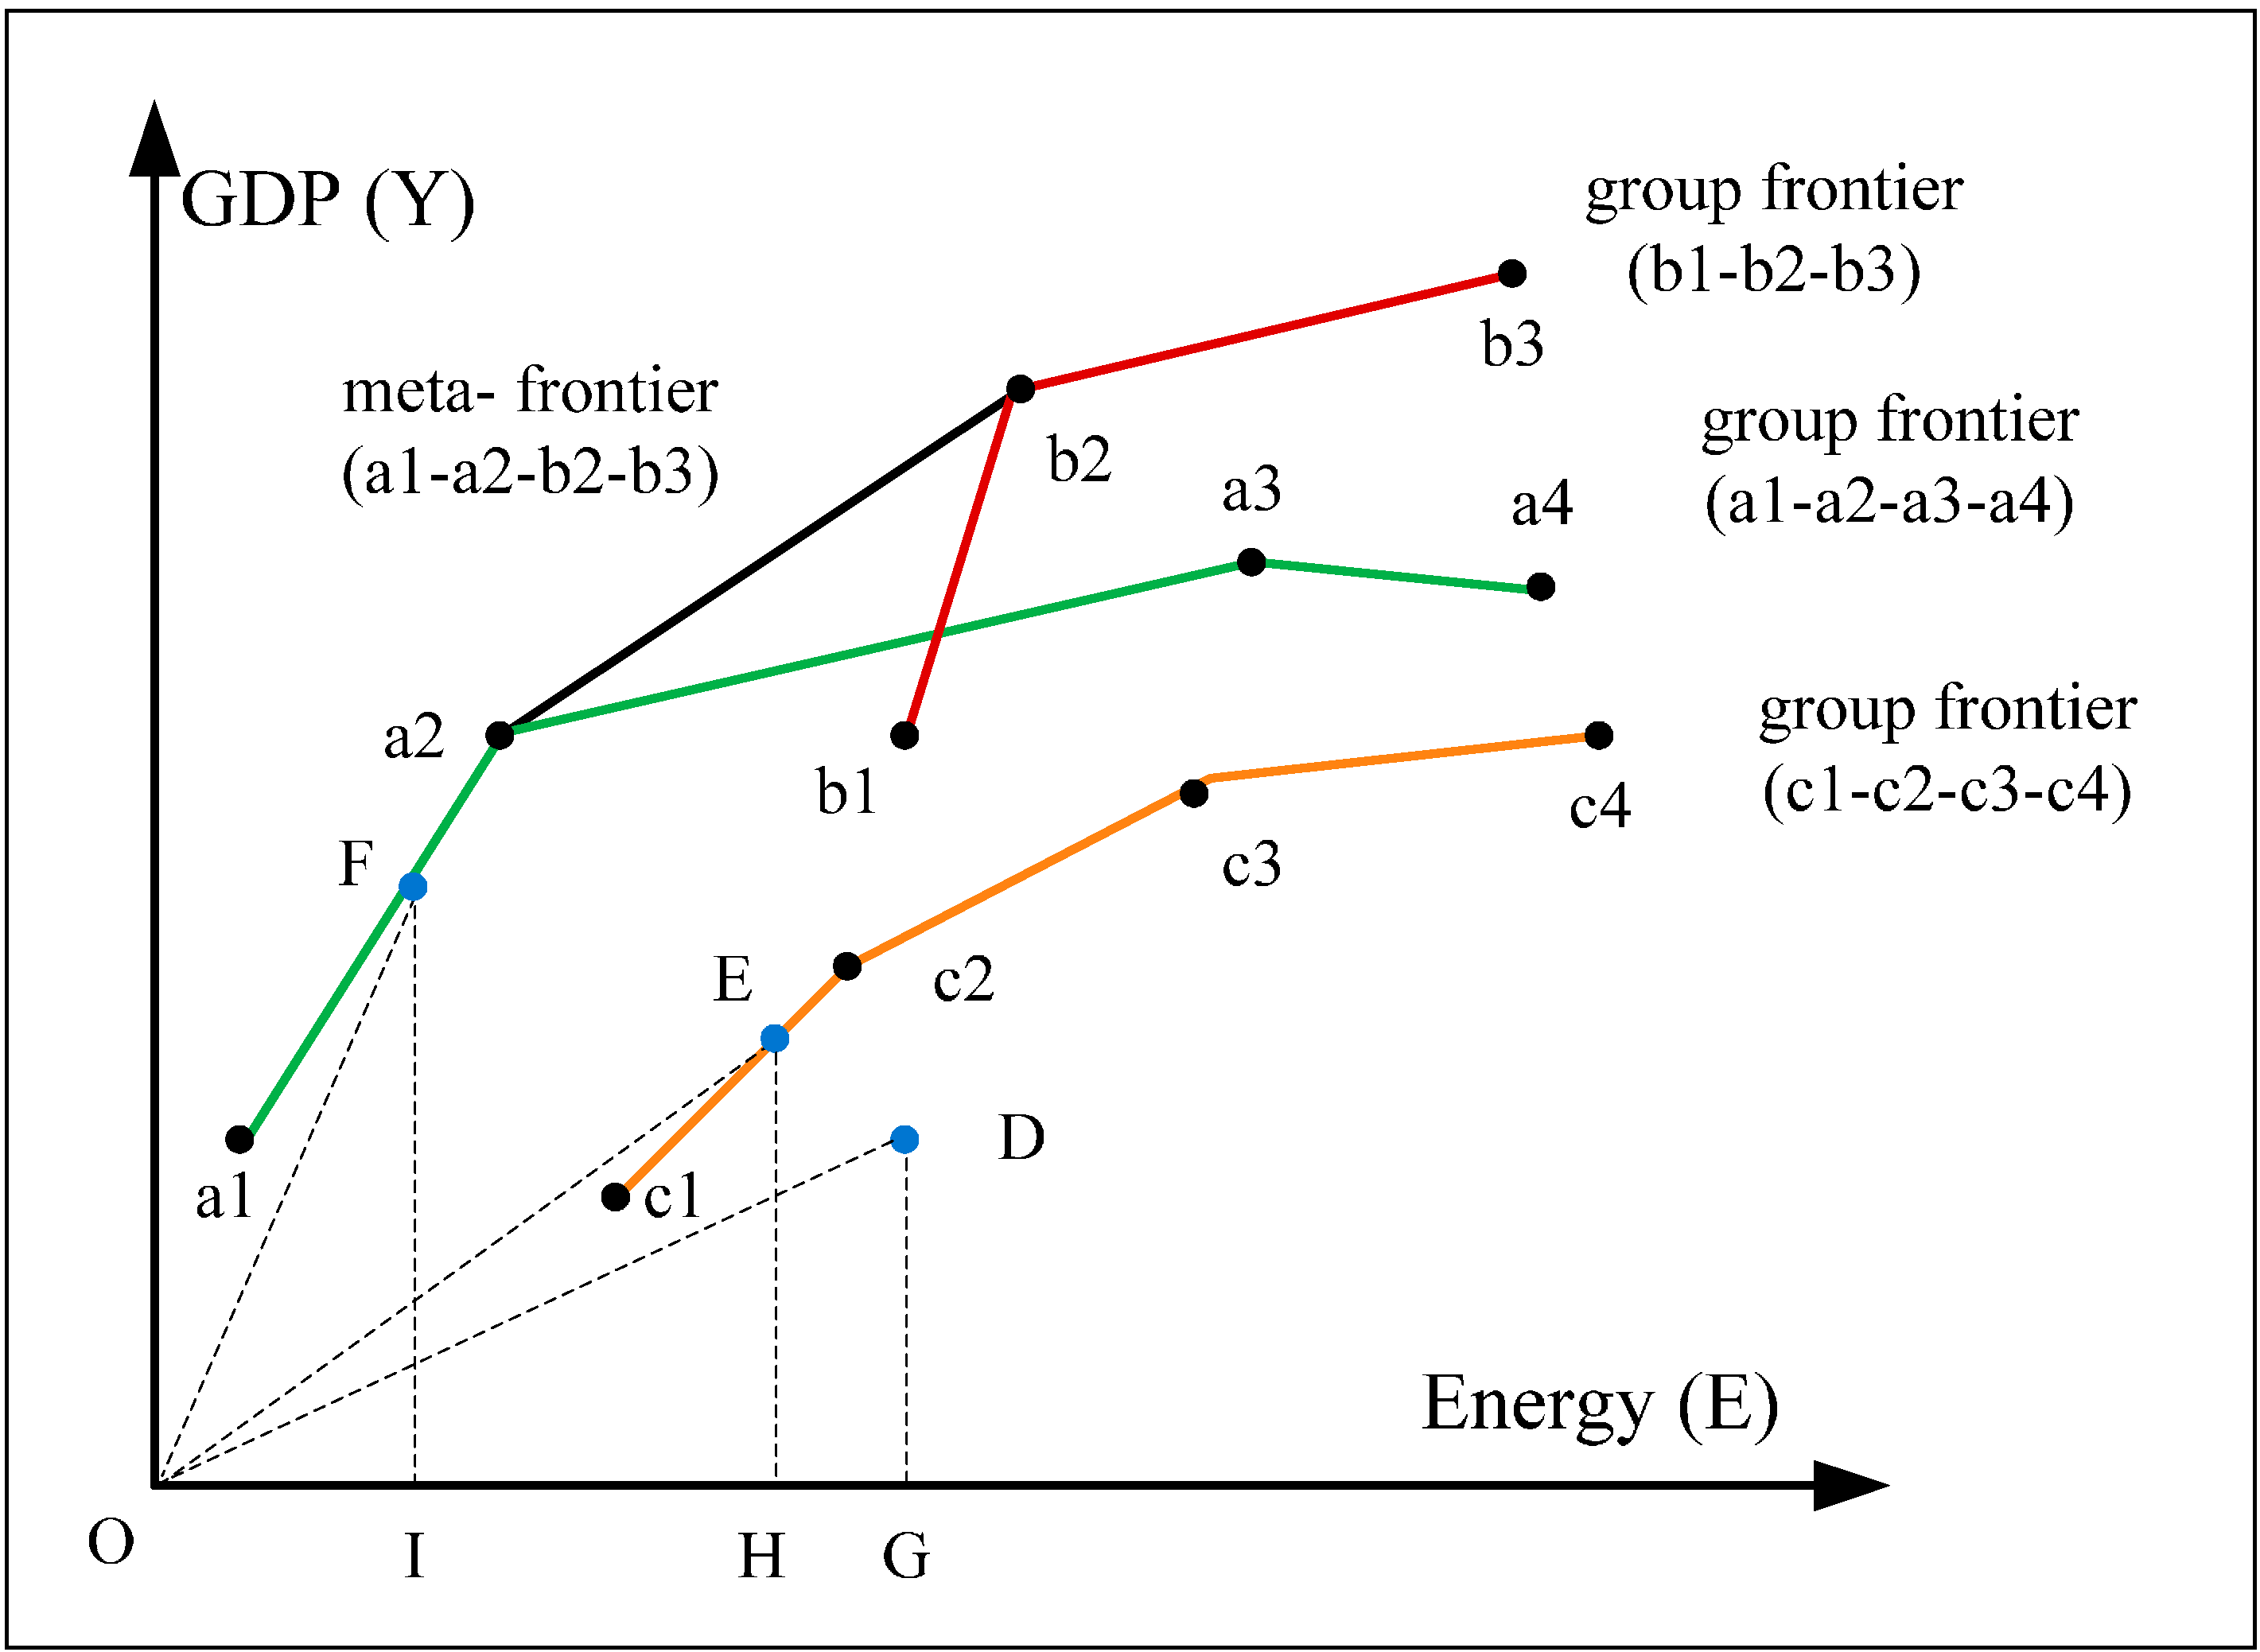
2.3. Heterogeneity of Production Technology and Energy Efficiency
3. Empirical Analysis and Discussion
3.1. Data Sources and Group Formulation
| East (Group 1) | Central (Group 2) | West (Group 3) | All | ||
|---|---|---|---|---|---|
| Input | Capital Stock(billion CNY) | 679.5 | 328.1 | 210.6 | 420.9 |
| Labor (million) | 24.9 | 27.5 | 19.5 | 23.8 | |
| Energy(million tons) | 121.5 | 89.2 | 65.8 | 93.4 | |
| Output | GDP(billion CNY) | 1062.8 | 576.6 | 334.5 | 677.5 |
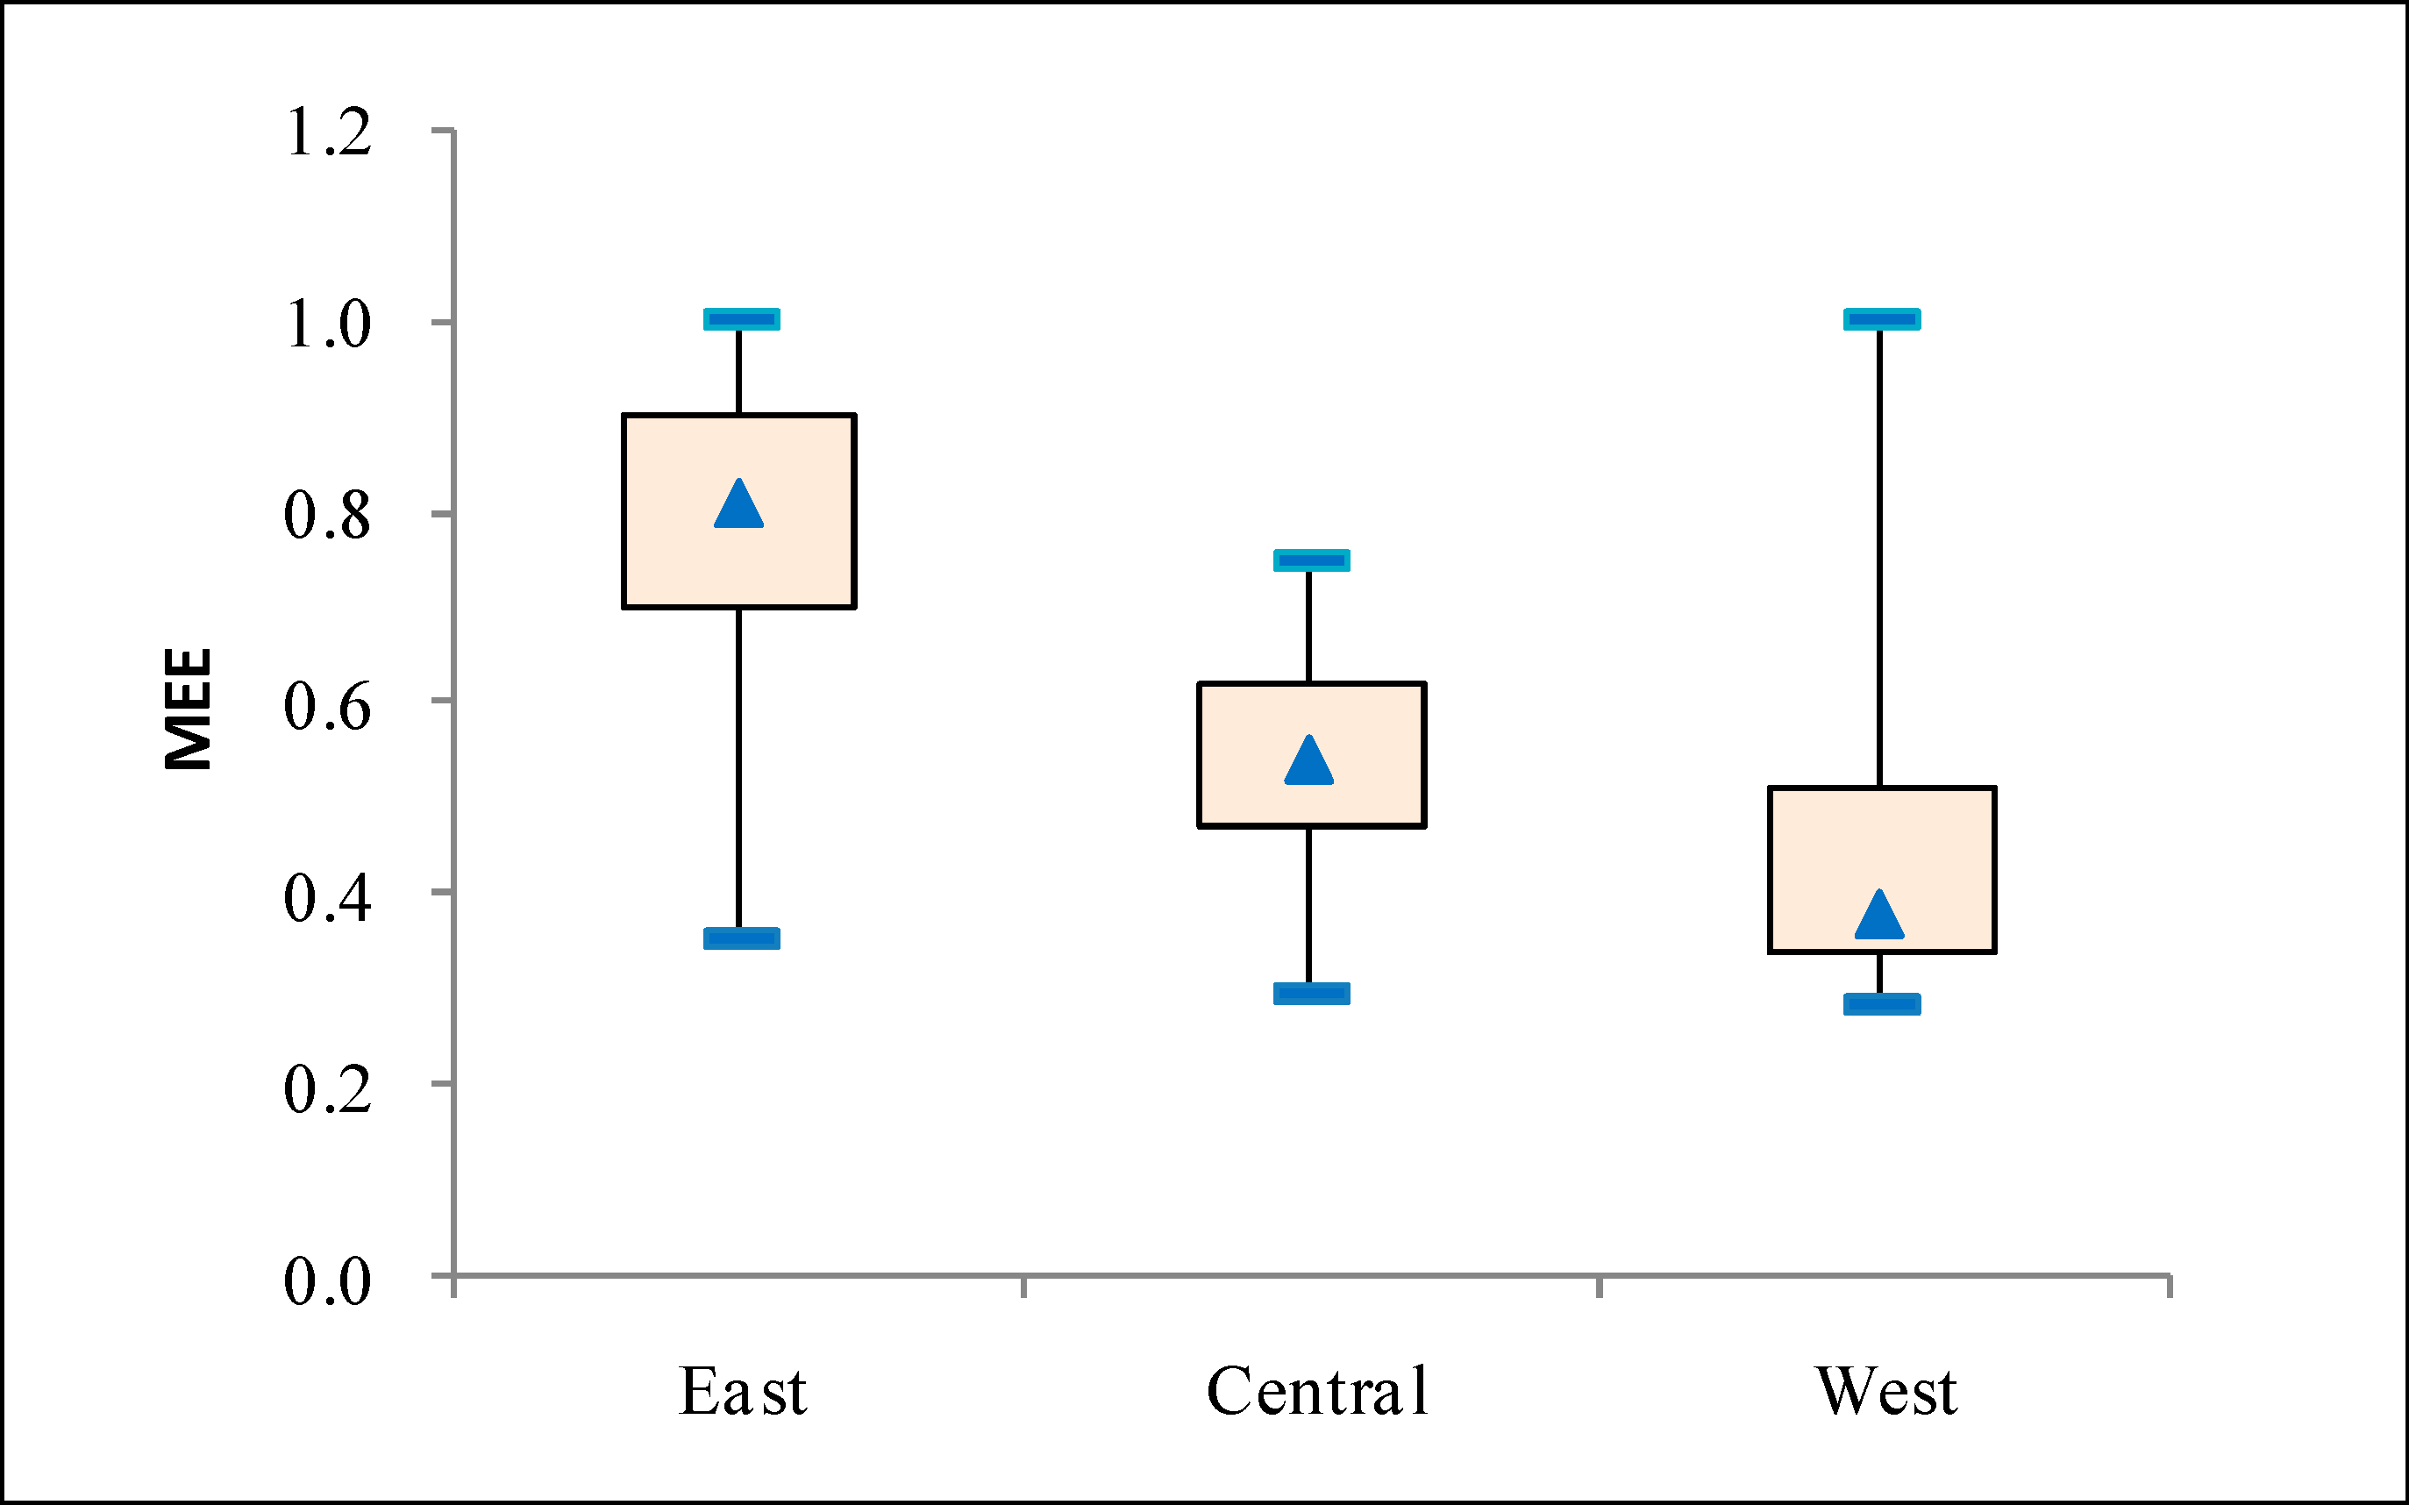
3.2. The Differences of Energy Efficiency
| Province | GEE | MEE | Province | GEE | MEE |
|---|---|---|---|---|---|
| East | 0.777 | 0.773 | Heilongjiang | 0.829 | 0.585 |
| Central | 0.755 | 0.547 | Anhui | 0.990 | 0.712 |
| West | 0.662 | 0.462 | Jiangxi | 0.889 | 0.641 |
| Beijing | 0.799 | 0.799 | Henan | 0.705 | 0.508 |
| Tianjin | 0.754 | 0.754 | Hubei | 0.703 | 0.511 |
| Hebei | 0.389 | 0.387 | Hunan | 0.798 | 0.573 |
| Liaoning | 0.987 | 0.947 | Inner Mongolia | 0.623 | 0.379 |
| Shanghai | 0.833 | 0.833 | Guangxi | 0.946 | 0.599 |
| Jiangsu | 0.785 | 0.785 | Chongqing | 0.854 | 0.511 |
| Zhejiang | 0.769 | 0.769 | Guizhou | 0.424 | 0.327 |
| Fujian | 0.967 | 0.967 | Yunnan | 0.967 | 0.967 |
| Shandong | 0.537 | 0.536 | Shaanxi | 0.778 | 0.478 |
| Guangdong | 0.906 | 0.906 | Gansu | 0.539 | 0.330 |
| Hainan | 0.827 | 0.827 | Qinghai | 0.439 | 0.352 |
| Shanxi | 0.428 | 0.368 | Ningxia | 0.368 | 0.315 |
| Jilin | 0.698 | 0.478 | Sinkiang | 0.683 | 0.363 |
| Null Hypothesis | U-Statistics | Z-Statistics | p-Value | |
|---|---|---|---|---|
| East | The center position of two population distributions is same | 59.000 | −0.099 | 0.921 |
| Central | 10.000 | −2.310 | 0.021 | |
| West | 20.500 | −2.231 | 0.026 |
3.3. The Technology Gap of Energy Efficiency
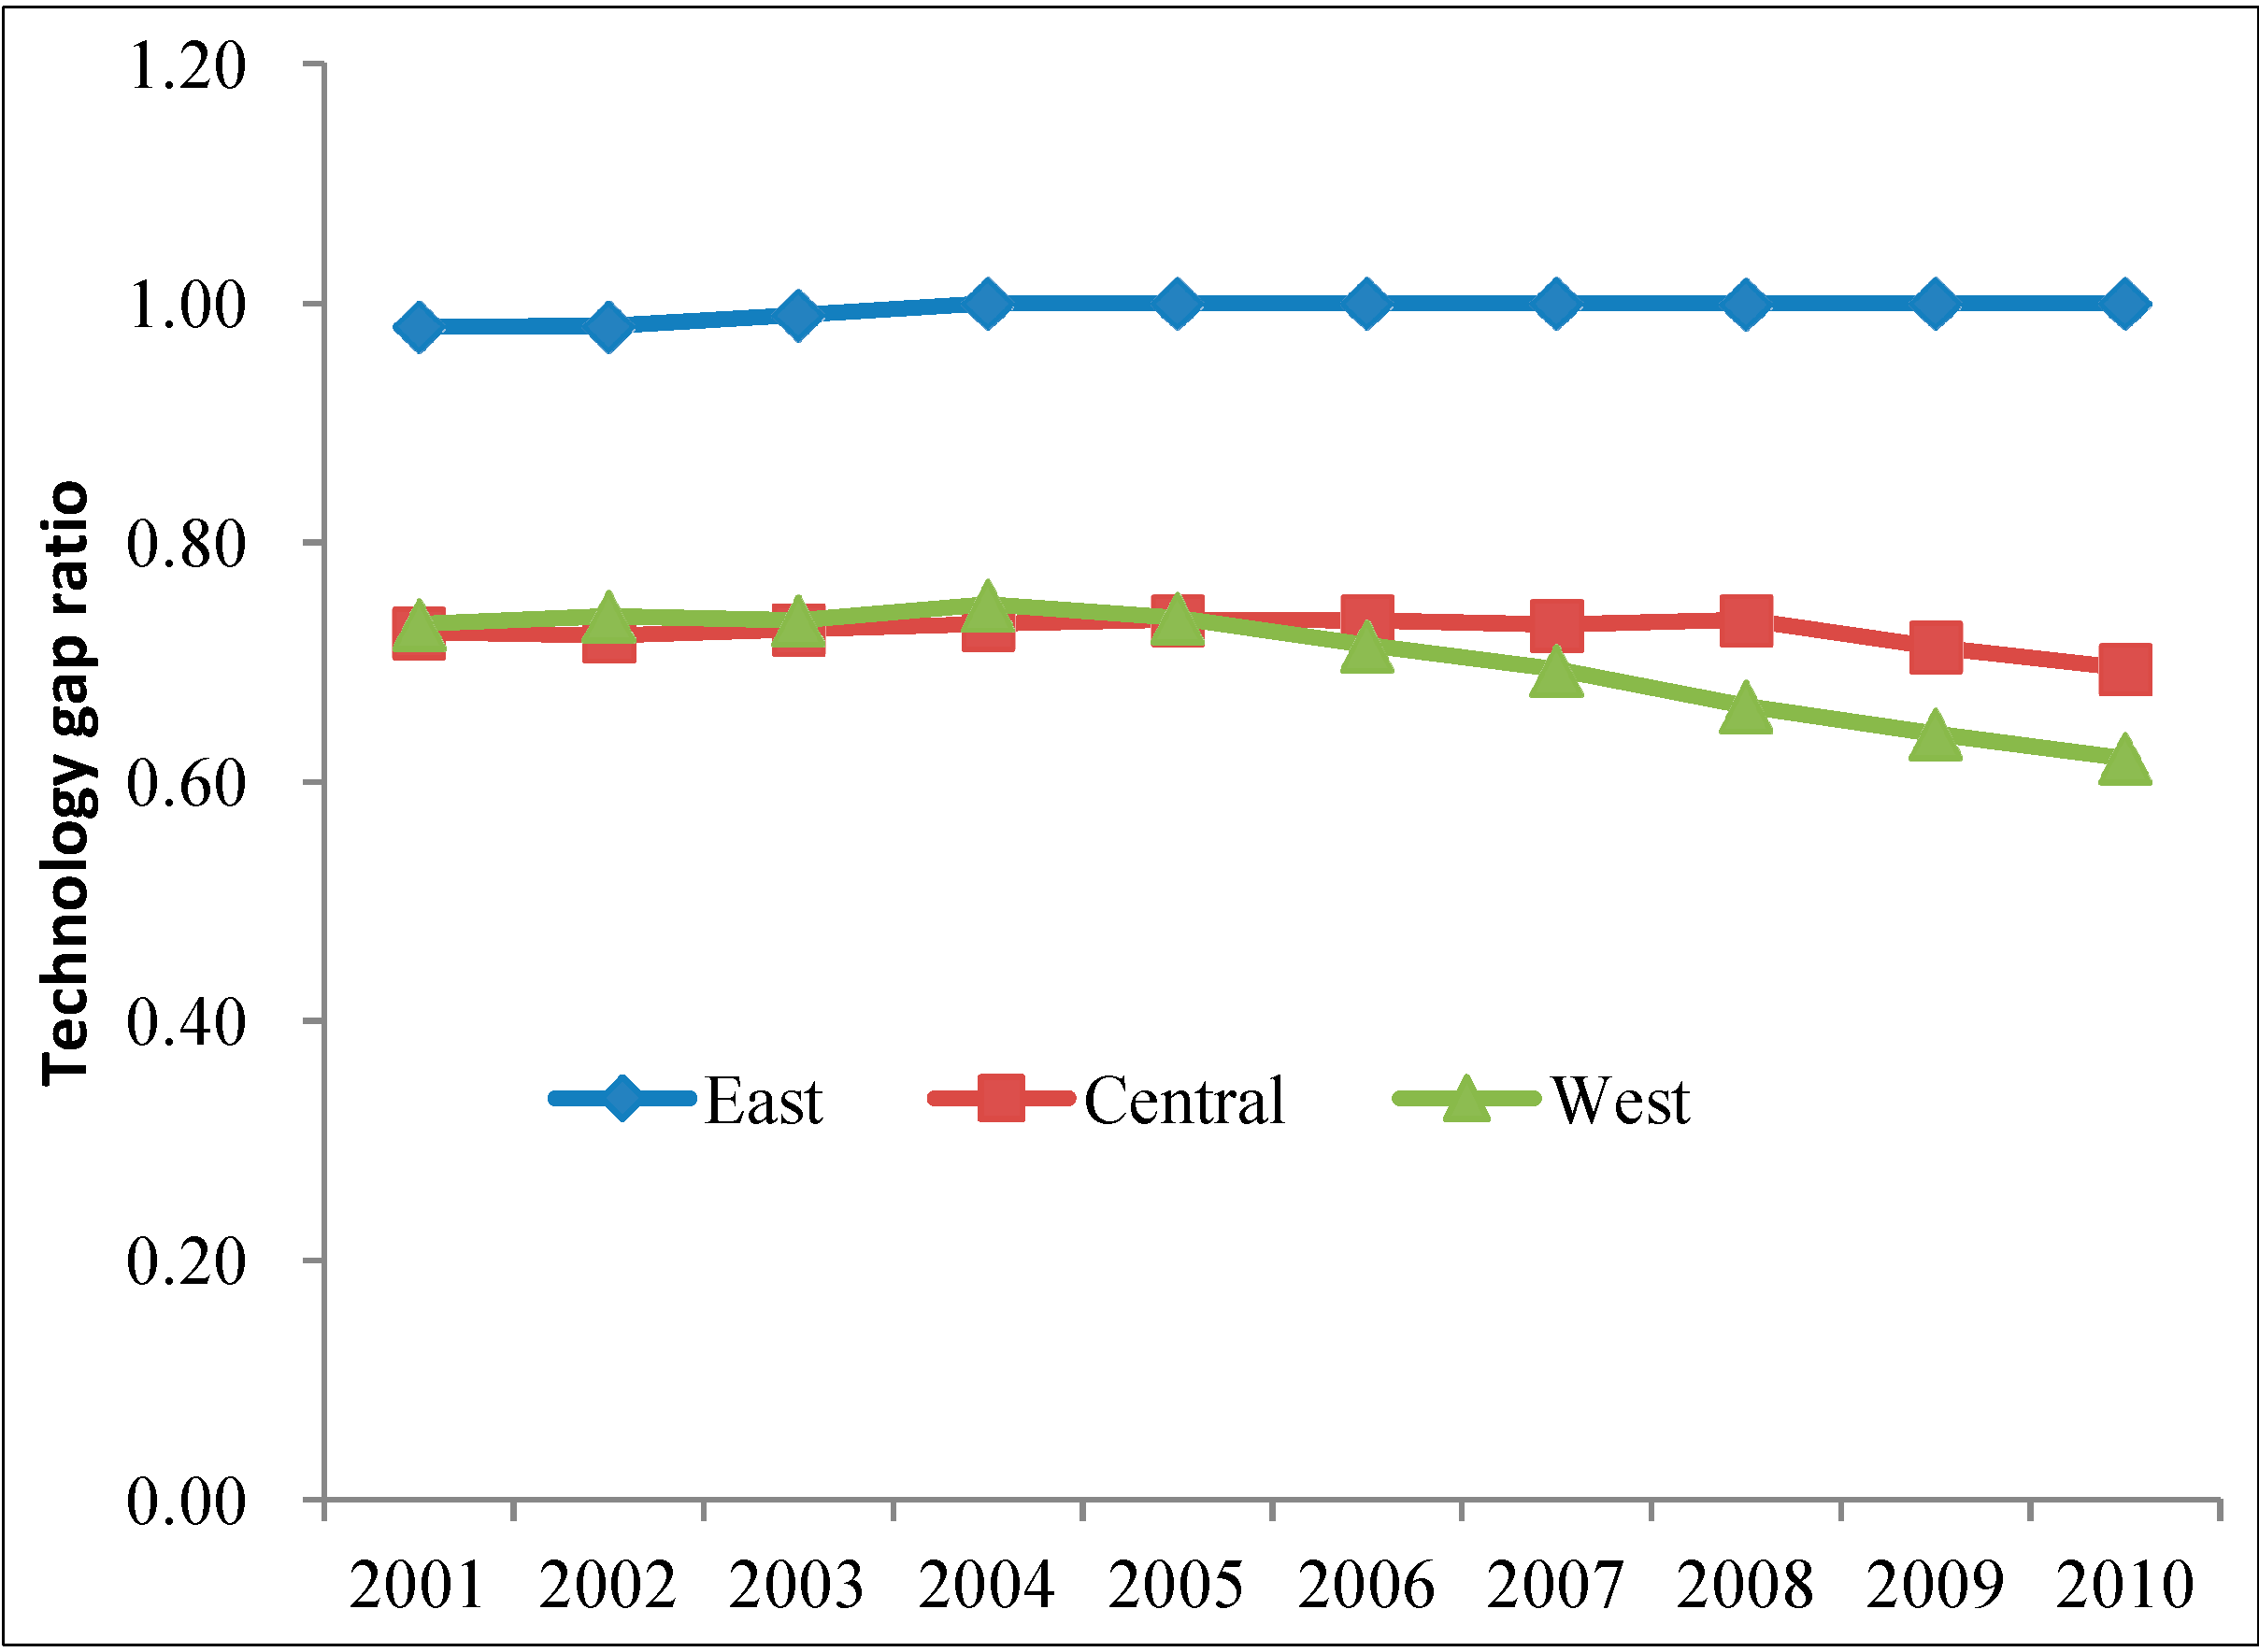
| Null Hypothesis | H-Statistics | p-Value |
|---|---|---|
| The center position of the three population distributions is the same. | 18.181 | 0.000 |
3.4. The Decomposition of Energy Intensity
| Province | AEI | GEI | MEI | ΔEI | ΔEI1 | ΔEI2 | Policy priority |
|---|---|---|---|---|---|---|---|
| (tons of standard coal/ten thousand CNY) | |||||||
| Beijing | 0.902 | 0.740 | 0.740 | 0.162 | 0.162 | 0.000 | M |
| Tianjin | 1.151 | 0.920 | 0.920 | 0.231 | 0.231 | 0.000 | M |
| Hebei | 2.099 | 0.853 | 0.828 | 1.271 | 1.246 | 0.025 | M |
| Liaoning | 1.605 | 1.588 | 1.542 | 0.063 | 0.017 | 0.045 | T |
| Shanghai | 0.917 | 0.781 | 0.781 | 0.136 | 0.136 | 0.000 | M |
| Jiangsu | 0.951 | 0.749 | 0.749 | 0.202 | 0.202 | 0.000 | M |
| Zhejiang | 0.977 | 0.764 | 0.764 | 0.213 | 0.213 | 0.000 | M |
| Fujian | 0.862 | 0.832 | 0.832 | 0.030 | 0.030 | 0.000 | M |
| Shandong | 1.448 | 0.812 | 0.788 | 0.660 | 0.636 | 0.024 | M |
| Guangdong | 0.823 | 0.754 | 0.754 | 0.069 | 0.069 | 0.000 | M |
| Hainan | 0.915 | 0.764 | 0.764 | 0.151 | 0.151 | 0.000 | M |
| Shanxi | 2.966 | 1.235 | 1.162 | 1.804 | 1.731 | 0.073 | M |
| Jilin | 1.612 | 1.160 | 0.786 | 0.827 | 0.452 | 0.374 | M&T |
| Heilongjiang | 1.356 | 1.157 | 0.809 | 0.547 | 0.200 | 0.348 | T&M |
| Anhui | 1.280 | 1.269 | 0.914 | 0.366 | 0.010 | 0.356 | T |
| Jiangxi | 1.129 | 1.019 | 0.737 | 0.392 | 0.109 | 0.283 | T&M |
| Henan | 1.520 | 1.084 | 0.780 | 0.740 | 0.437 | 0.304 | M&T |
| Hubei | 1.554 | 1.115 | 0.809 | 0.745 | 0.439 | 0.306 | M&T |
| Hunan | 1.384 | 1.099 | 0.792 | 0.592 | 0.285 | 0.307 | T&M |
| Inner Mongolia | 2.784 | 1.881 | 1.058 | 1.726 | 0.903 | 0.823 | M&T |
| Guangxi | 1.292 | 1.227 | 0.777 | 0.515 | 0.065 | 0.451 | T |
| Sichuan | 1.523 | 1.333 | 0.790 | 0.733 | 0.190 | 0.543 | T |
| Guizhou | 3.406 | 1.478 | 1.131 | 2.276 | 1.929 | 0.347 | M |
| Yunnan | 1.766 | 1.703 | 1.703 | 0.063 | 0.063 | 0.000 | M |
| Shanxi | 1.577 | 1.249 | 0.760 | 0.817 | 0.328 | 0.489 | T&M |
| Gansu | 2.307 | 1.268 | 0.773 | 1.534 | 1.039 | 0.495 | M&T |
| Qinghai | 3.269 | 1.428 | 1.165 | 2.104 | 1.841 | 0.263 | M&T |
| Ningxia | 4.314 | 1.492 | 1.320 | 2.994 | 2.823 | 0.172 | M |
| Xinjiang | 2.354 | 1.705 | 0.862 | 1.492 | 0.649 | 0.842 | T&M |
3.5. The Potential of Energy Savings
4. Conclusions
Acknowledgments
Author Contributions
Conflicts of Interest
References
- Patterson, M.G. What is energy efficiency? Concepts, indicators and methodological issues. Energ. Policy 1996, 24, 377–390. [Google Scholar] [CrossRef]
- Zhang, M.; Li, H.; Zhou, M.; Mu, H. Decomposition analysis of energy consumption in Chinese transportation sector. Appl. Energ. 2011, 88, 2279–2285. [Google Scholar] [CrossRef]
- Ang, B.W. Monitoring changes in economy-wide energy efficiency: From energy-GDP ratio to composite efficiency index. Energ. Policy 2006, 34, 574–582. [Google Scholar] [CrossRef]
- Choi, K.H.; Ang, B.W. Attribution of changes in Divisia real energy intensity index: An extension to index decomposition analysis. Energ. Econ. 2012, 34, 171–176. [Google Scholar] [CrossRef]
- Ramanathan, R. Combining indicators of energy consumption and CO2 emissions: a cross-country comparison. Int. J. Global Energ. Issues 2002, 17, 214–227. [Google Scholar]
- Zhang, N.; Choi, Y. Environmental energy efficiency of China’s regional economies: A non-oriented slacks-based measure analysis. Soc. Sci. J. 2013, 50, 225–234. [Google Scholar] [CrossRef]
- Ghali, K.H.; El-Sakka, M.I. Energy use and output growth in Canada: A multivariate cointegration analysis. Energ. Econ. 2004, 26, 225–238. [Google Scholar] [CrossRef]
- Hu, J.L.; Wang, S.C. Total-factor Energy Efficiency of Regions in China. Energ. Policy 2006, 34, 3206–3217. [Google Scholar] [CrossRef]
- Hu, J.L.; Kao, C.H. Efficient energy-saving targets for APEC economies. Energ. Policy 2007, 35, 373–382. [Google Scholar] [CrossRef]
- Zhou, P.; Ang, B.W. Linear programming models for measuring economy-wide energy efficiency performance. Energ. Policy 2008, 36, 2911–2916. [Google Scholar] [CrossRef]
- Wu, F.; Fan, L.W.; Zhou, P.; Zhou, D.Q. Industrial energy efficiency with CO2 emissions in China: A nonparametric analysis. Energ. Policy 2012, 49, 164–172. [Google Scholar] [CrossRef]
- Honma, S.; Hu, J.L. Industry-level total-factor energy efficiency in developed countries: A Japan-centered analysis. Appl. Energ. 2014, 119, 67–78. [Google Scholar] [CrossRef]
- Wang, Z.H.; Zeng, H.L.; Wei, Y.M.; Zhang, Y.X. Regional total factor energy efficiency: An empirical analysis of industrial sector in China. Appl. Energ. 2012, 97, 115–123. [Google Scholar] [CrossRef]
- Zhou, P.; Ang, B.W.; Zhou, D.Q. Measuring economy-wide energy efficiency performance: A parametric frontier approach. Appl. Energ. 2012, 90, 196–200. [Google Scholar] [CrossRef]
- Lin, B.; Du, K. Technology gap and China’s regional energy efficiency: A parametric metafrontier approach. Energ. Econ. 2013, 40, 529–536. [Google Scholar] [CrossRef]
- Chung, Y.H.; Färe, R.; Grosskopf, S. Productivity and undesirable outputs: A directional distance function approach. J. Environ. Manag. 1997, 51, 229–240. [Google Scholar] [CrossRef]
- Zhou, P.; Ang, B.W.; Wang, H. Energy and CO2 emission performance in electricity generation: A non-radial directional distance function approach. Eur. J. Oper. Res. 2012, 221, 625–635. [Google Scholar] [CrossRef]
- Tone, K. A slacks-based measure of efficiency in data envelopment analysis. Eur. J. Oper. Res. 2001, 130, 498–509. [Google Scholar] [CrossRef]
- Zhang, N.; Zhou, P.; Choi, Y. Energy efficiency, CO2 emission performance and technology gaps in fossil fuel electricity generation in Korea: A meta-frontier non-radial directional distance function analysis. Energ. Policy 2013, 56, 653–662. [Google Scholar] [CrossRef]
- Hayami, Y.; Ruttan, V. Agricultural development: An international perspective. J. Econ. Hist. 1973, 33, 484–487. [Google Scholar]
- O’Donnell, C.J.; Rao, D.S.P.; Battese, G.E. Metafrontier frameworks for the study of firm-level efficiencies and technology ratios. Empir. Econ. 2008, 34, 231–255. [Google Scholar]
- Oh, D.H. A metafrontier approach for measuring an environmentally sensitive productivity growth index. Energ. Econ. 2010, 32, 146–157. [Google Scholar] [CrossRef]
- Lin, C.H.; Chiu, Y.H.; Huang, C.W. Assessment of technology gaps of tourist hotels in productive and service processes. Serv. Ind. J. 2012, 32, 2329–2342. [Google Scholar] [CrossRef]
- Battese, G.E.; Rao, D.S.P.; O’Donnell, C.J. A metafrontier production function for estimation of technical efficiencies and technology gaps for firms operating under different technologies. J. Productivity Anal. 2004, 21, 91–103. [Google Scholar] [CrossRef]
- National Bureau of Statistics of China (NBSC). China Energy Statistical Year Book; China Statistics Press: Beijing, China, 2002–2012. [Google Scholar]
- National Bureau of Statistics of China (NBSC). China Statistical Year Book; China Statistics Press: Beijing, China, 2002–2011. [Google Scholar]
- Shan, H.J. Re-estimating the capital stock of China: 1952–2006. Q. Tech. Econ. 2008, 10, 17–31. (In Chinese) [Google Scholar]
- Wang, Q.; Zhao, Z.; Zhou, P.; Zhou, D. Energy efficiency and production technology heterogeneity in China: A meta-frontier DEA approach. Econ. Model 2013, 35, 283–289. [Google Scholar] [CrossRef]
- Tulkens, H.; Vanden, E.P. Non-parametric efficiency, progress, and regress measure for panel data: Methodological aspects. Eur. J. Oper. Res. 1995, 80, 472–479. [Google Scholar] [CrossRef]
- Wei, C.; Ni, J.; Shen, M. Empirical analysis of provincial energy efficiency in China. China World Econ. 2009, 17, 88–103. [Google Scholar] [CrossRef]
- Chiu, C.R.; Liou, J.L.; Wu, P.I.; Fang, C.L. Decomposition of the environmental inefficiency of the meta-frontier with undesirable output. Energ. Econ. 2012, 34, 1392–1399. [Google Scholar] [CrossRef]
© 2014 by the authors; licensee MDPI, Basel, Switzerland. This article is an open access article distributed under the terms and conditions of the Creative Commons Attribution license (http://creativecommons.org/licenses/by/3.0/).
Share and Cite
Wang, Q.; Zhou, P.; Zhao, Z.; Shen, N. Energy Efficiency and Energy Saving Potential in China: A Directional Meta-Frontier DEA Approach. Sustainability 2014, 6, 5476-5492. https://doi.org/10.3390/su6085476
Wang Q, Zhou P, Zhao Z, Shen N. Energy Efficiency and Energy Saving Potential in China: A Directional Meta-Frontier DEA Approach. Sustainability. 2014; 6(8):5476-5492. https://doi.org/10.3390/su6085476
Chicago/Turabian StyleWang, Qunwei, Peng Zhou, Zengyao Zhao, and Neng Shen. 2014. "Energy Efficiency and Energy Saving Potential in China: A Directional Meta-Frontier DEA Approach" Sustainability 6, no. 8: 5476-5492. https://doi.org/10.3390/su6085476
APA StyleWang, Q., Zhou, P., Zhao, Z., & Shen, N. (2014). Energy Efficiency and Energy Saving Potential in China: A Directional Meta-Frontier DEA Approach. Sustainability, 6(8), 5476-5492. https://doi.org/10.3390/su6085476