Abstract
Many native chili varieties are becoming extinct due to the lack of economic incentives for farmers to their continued cultivation in Peru. A potential high value pro-poor market for selling native chilies is the international tourism segment. The objectives of this research were to assess the acceptability of the potential introduction of dried native chilies in the international tourism segment by identifying the motivations for buying dried chilies as souvenirs, and then by evaluating the factors influencing the price premiums’ magnitudes related to different label information conditions, such as information about the farmer community, traditional cooking recipes, organic certification, and Fairtrade certification. A face-to-face survey was conducted with 200 international tourists at the airport in Cuzco, Peru. The data were analyzed using a probit and tobit models with sample selection. The results suggest that dried native chilies would have a relatively good acceptance among international tourists. About 62% of the respondents indicated they would buy dried native chilies, and of them, 62%–74% would pay an average price premium ranging from S/1.16–1.58 for different label information conditions. Nevertheless specific marketing campaigns should be designed for different types of international tourists in order to maximize the economic benefits for small-holder farmers.
Keywords:
international tourists; souvenirs; native crops; chili peppers; probit; tobit; sample selection; Peru 1. Introduction
One of the world’s centers of biodiversity for the genus Capsicum (chilies and peppers) is Peru [1,2]. Native chili varieties are rich in vitamins, antioxidants, and capsaicin, a component used for medicinal applications [3]. Many of those varieties are currently becoming extinct [1]. Supporting the in-situ conservation of native chili varieties can help to address current and future societal needs. However, native chili biodiversity are primarily preserved by small-holder farmers, who do not receive any compensation for these important societal services [1,4]. The project “Unravelling the potential of neglected crop diversity for high-value product differentiation and income generation for the poor: The case of chili pepper in its centre of origin” was funded by the German Development Cooperation (GIZ, 2010–2013). It was oriented towards the in-situ conservation of native chilies through the identification and promotion of high-value economic incentives for small-holder farmers. In particular, the project adapted and provided solar driers to local farmers to help them process and commercialize their native chilies. In this way, it was expected that poverty could also be reduced through pro-poor trade. The term “pro-poor” relates to a set of strategic tools specifically designed to reduce poverty as indicated in Ravallion [5].
A potential high value pro-poor market for selling native chilies is the international tourism segment. Peru received 2.7 million international tourists, who generated US$ 3.3 million in 2012 [6]. Consequently, international tourism constituted the fourth most important foreign currency generating activity in this country. Moreover, the international tourism sector is steadily increasing with an annual growth rate of 10%, above the average annual growth rate in other South American countries (5%) and in the rest of the world (4%) [6]. On the other hand, there is a large culinary tradition in Peru, whose special flavors have been recognized as “Cultural Heritage of the Americas” by the Organization of American States (OAS) [7]. This country was also designated as “The World’s Leading Culinary Destination” in 2012 and 2013 by the World Travel Awards, whose annual program is renowned as one of the most prestigious and comprehensive in the global travel and tourism industry [8]. The special flavors of the Peruvian cuisine could be attributed to a large extent to the use of native chili varieties in food preparation [9]. Ethnic souvenirs help their owners define and situate in-time experiences they wish to remember [10], and ethnic food encompasses country’s cultural image related to its traditions and heritage [11]. Therefore, it could be expected that international tourists would be interested in buying native chilies as ethnic food souvenirs. Nevertheless, taking home fresh chilies may be difficult for international tourists due to special regulations related to carrying fresh foods to their home countries, their high volume, and their perishable nature compared with dried chilies. As such, dried native chilies could be an option for international tourists interested in buying ethnic food souvenirs from Peru.
Although the expenditure patterns of international tourists have already been studied, little is known about their motivations for souvenir purchase decisions, in particular ethnic food souvenirs. Delineating international tourists’ characteristics that influence actual purchase decisions remains scantily examined [12]. The available research suggests that the incentives for buying souvenirs seem to vary according to [12]: demographic characteristics including age, education or gender, attitudes toward other cultures, exposure to the host culture, and attitudes towards souvenirs. In addition, travel motivations, such as historic or nature related tourism influence the type of souvenirs tourists purchase [13].
Thus, the objectives of this research were to assess the acceptability of the potential introduction of dried native chilies from Peru to the international tourism sector by identifying the motivations for buying dried chilies as souvenirs, and then by evaluating the determinants for paying price premiums for different label information conditions. To this end a face-to-face survey was designed including a close-ended question related to the native chili purchase decision, and in case of affirmative answer, the participants were then asked a subsequent open-ended contingent valuation question related to the price premium they would pay for the same product under different label information conditions (information about the farmer community, traditional cooking recipes, organic certification, and Fairtrade certification). These price premiums may help small-scale producers to compete against larger-scale producers, who would not be able to obtain, for example a Fairtrade certification, as suggested by Spaniolo et al. [14].
Open-ended contingent valuation formats have been used lately in several non-food research studies such as Sattout et al. [15], Veisten [16] and Solino et al. [17]. Contingent valuation methodologies have also been used in several research studies related to food valuation. For example, Hu et al. [18] evaluated consumers’ WTP for blueberry products in US, Markosyan et al. [19] assessed consumers’ WTP for apples enriched with antioxidants in US, Moon et al. [20] studied consumers’ willingness to accept GM food in UK, and Shi et al. [21] evaluated cross-price effects on WTP for orange juice in China. Nevertheless, studies related to ethnic foods are still scarce, especially those conducted inside developing and emerging countries. Therefore, the importance of this research is not only that it evaluates ethnic products in South America, but also that it provides an a-priori assessment of a pro-poor intervention, which could benefit small-holder farmers and native chilies biodiversity conservation in this particular region.
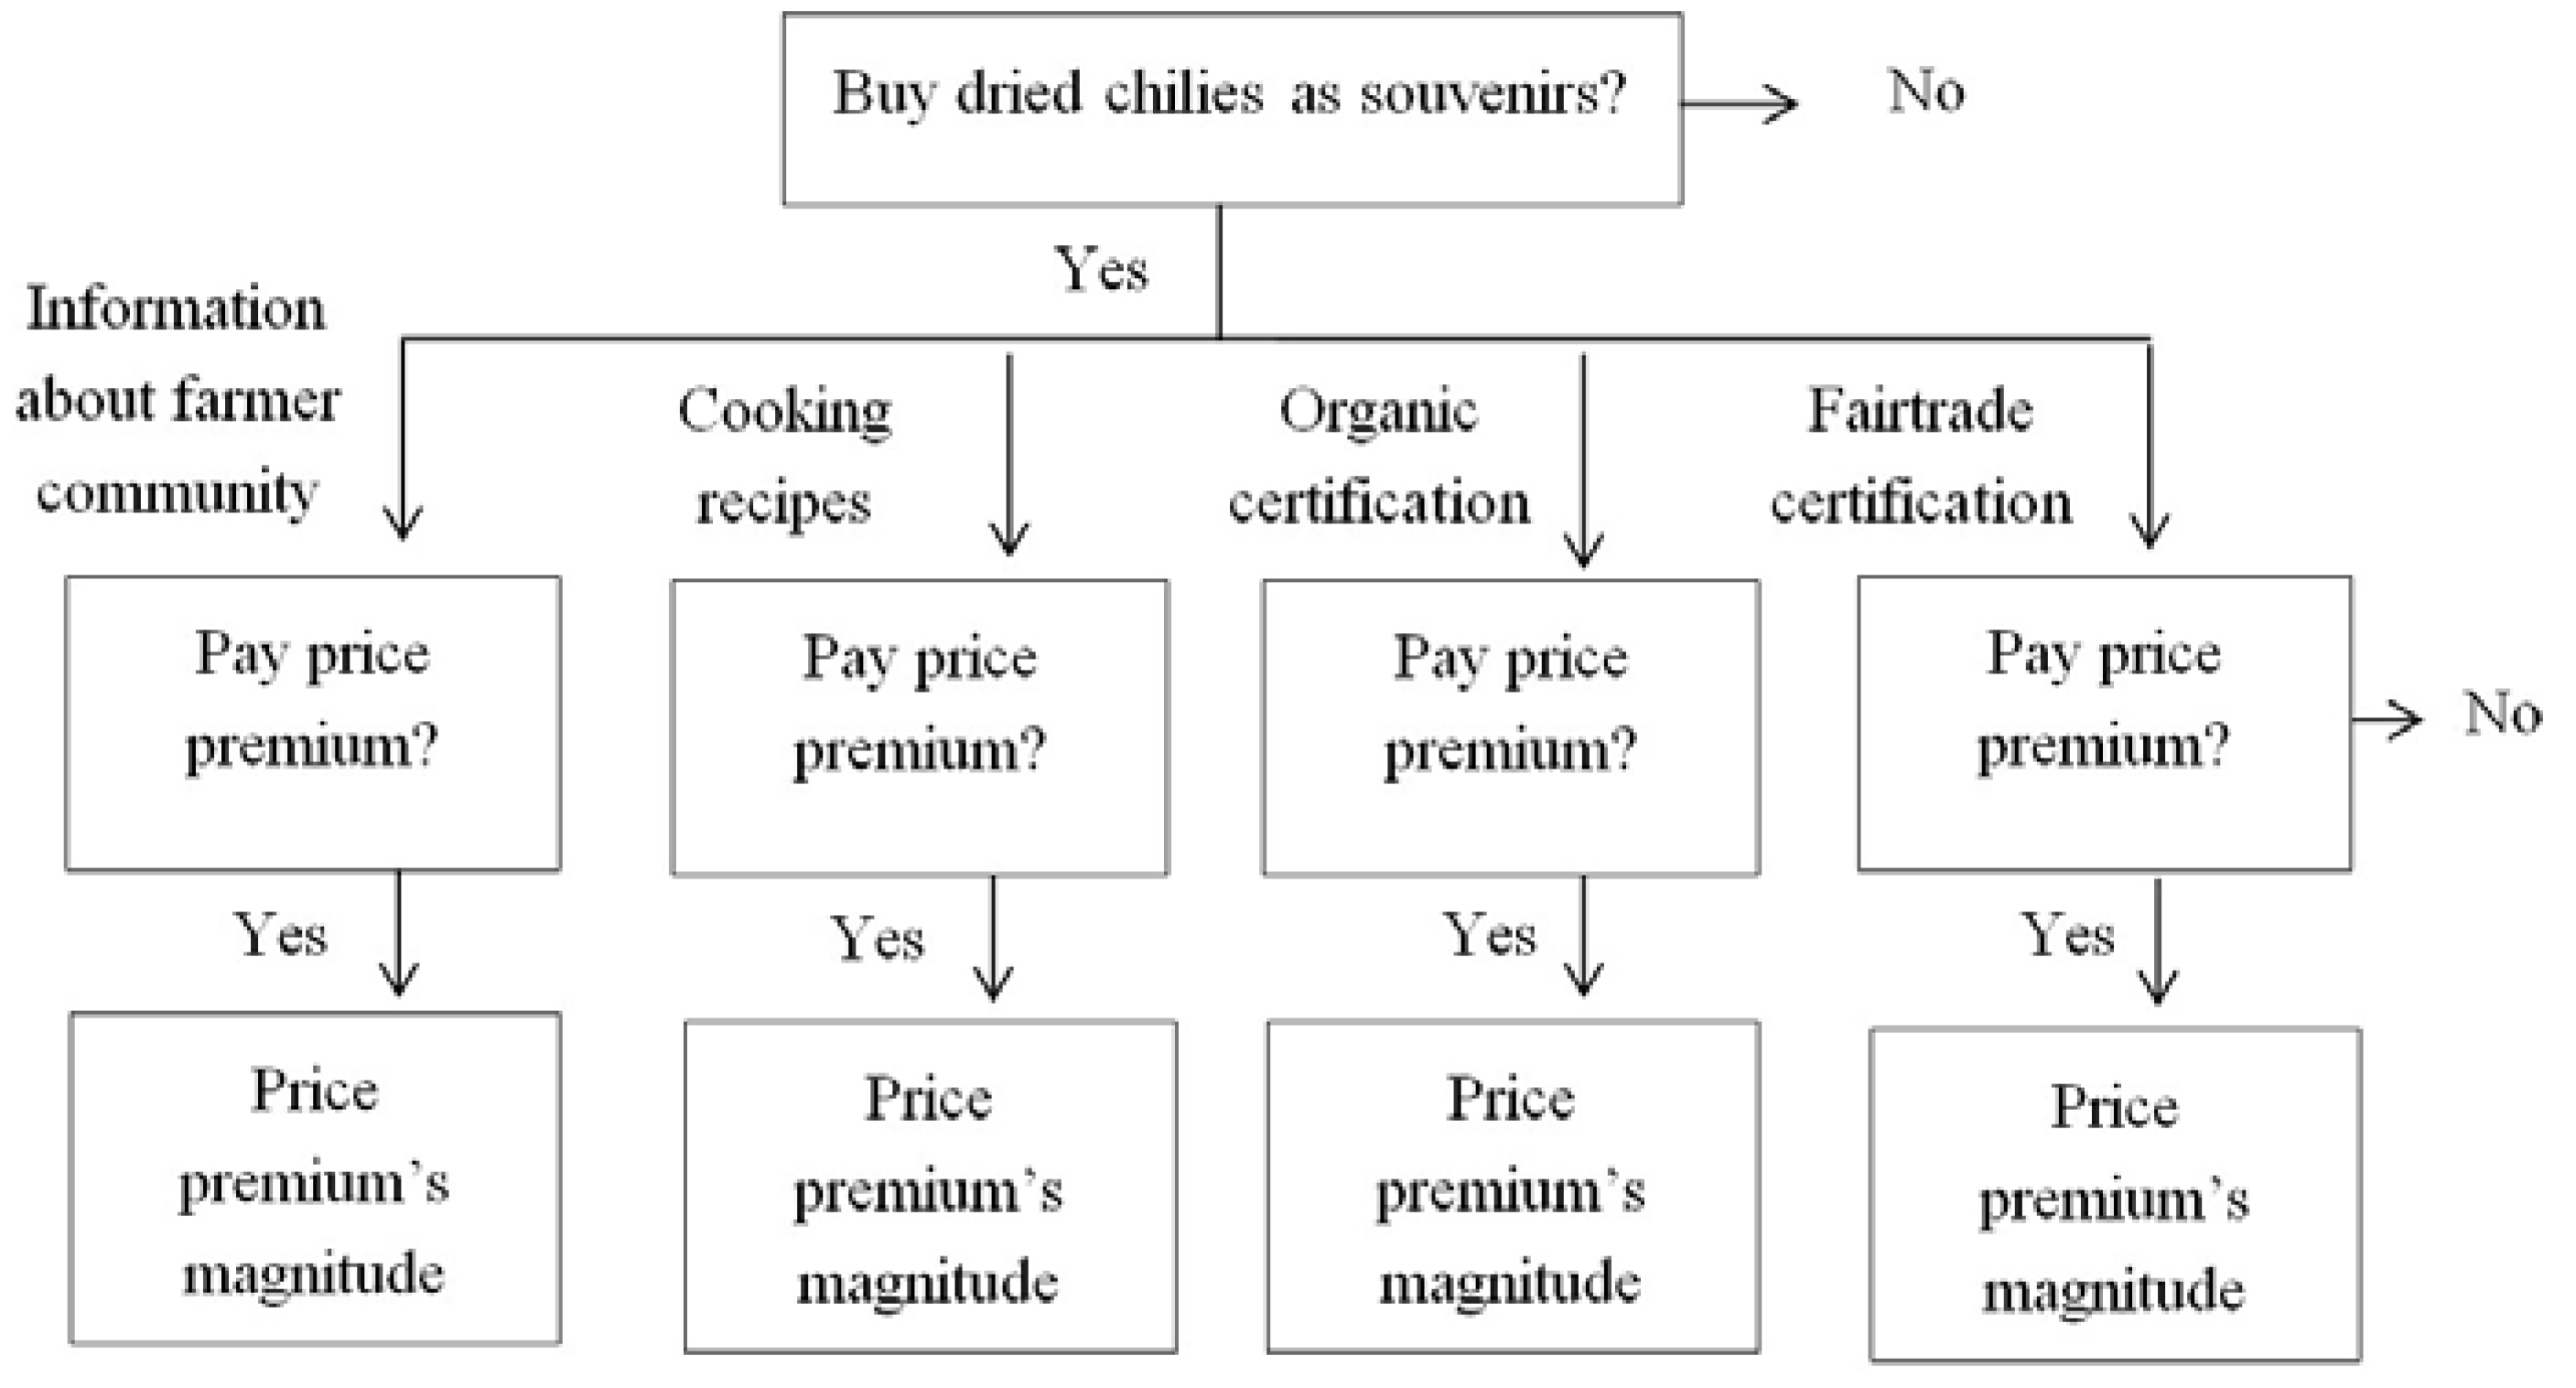
2. Data Collection and Methodology
The survey for this research was conducted with international tourists at the airport in Cuzco, the region receiving the largest number of international tourists in Peru. The authorities of Cuzco airport approved conducting the survey at the boarding area for international flights, which is of restricted access for the general public. A pilot questionnaire was first implemented during one week, and then the final survey was conducted during a three-week period with a total of 200 international tourists in 2011. The sampling methodology was a systematic sampling, which consisted of selecting a tourist following a specific pattern of time. The time interval was of 1 hour between questionnaires, given that each questionnaire took about 45 minutes to be completed. In addition, after 1 hour the third international tourist who entered the boarding area was requested to complete the survey. This was done in order to minimize biases that may have arisen by any potential self-selection of respondents by the enumerator. The response rate was 70%. The final questionnaire included 29 questions divided in 6 sections: (1) introduction and motivations for visiting Peru, (2) chili consumption in their home country, (3) food and chili consumption in Peru, (4) valuation questions, (5) souvenir shopping behavior, and (6) socio-economic characteristics. The valuation questions were: “Would you buy dried native chilies as souvenirs from Peru? The average price of 20 grams of dried chilies is about S/3 (€1≈S/3.4) in the local market.” In cases of an affirmative answer, the following up question was: “What would be the maximum additional amount you would you pay for the same quantity of dried chilies as a souvenir from Peru if the label includes: (a) information about the farmer community, (b) traditional cooking recipes, (c) organic certification logo, and (d) Fairtrade certification logo?” The decision – making process of the respondents is illustrated in Figure 1.
Figure 1.
Tree diagram of the participants’ decision process
Figure 1.
Tree diagram of the participants’ decision process

The advantages of conducting a contingent valuation with an open-ended elicitation format are that the question is convenient to answer (it involves requesting the participants to simply indicate their maximum amount they are willing to pay for a good or service) and provides a lower conservative estimate than other contingent valuation approaches [22]. In this study, the average price of S/3 for similar products was indicated as a reference price, given that the valuation of a good without considering its dependency with other goods available in the market has shown to yield biased estimates [23]. Reference prices can be operationalized as: the average price of similar products (as in this study), the current price of the brand chosen on last purchase occasion, current prices of brands weighted by loyalties of the respective brands, among others [23]. A reference price is needed because in a normal market situation, consumers are able to see and internally compare the prices of similar goods before their purchase decisions. It has been long recognized that consumers use a reference price to evaluate the purchase price of new products [23]. The main problem with using reference prices is that they cause anchoring effects. Nevertheless, Briesch et al. [23] have found that empirical models that consider reference prices perform better than models that do not consider it, regardless of how the reference price is operationalized. The authors concluded that the inclusion of reference price explains consumer choices better than a simpler model that does not consider it. On the other hand, the order of the label information indicated above was randomly assigned in the questionnaires to avoid potential ordering effects. The questions were preceded by a “cheap talk”, including a reminder of potential income constraints, which help to reduce potential hypothetical bias (the bias that arises due to the hypothetical nature of the questions) as suggested by Van Loo et al. [24].
As indicated before the decision procedure was sequential. The participants first had to decide if they would buy native chilies from Peru; then if they would pay price premiums for different product’s label information. These decisions could be subject to sample selection bias if they are analyzed independently. Sample selection bias refers to the error that arises when the selection of those participating in an activity (e.g. decision whether or not to buy dried chilies) is not random, but influenced by the survey participants themselves (for more information about sample selection bias see Heckman [25]). Therefore, the international tourist decisions were modeled using a probit model (decision whether to buy or not native chilies as souvenirs) and tobit models with sample selection (decisions whether to pay price premiums and the price premiums’ magnitudes, subject to buying native chilies as souvenirs).
2.1. Probit Model
Following Breen [26] in the probit model, the decision for buying native chilies as souvenirs (y), given a set of explanatory variables (x) is:
where yi= xi´β + ui and yi > 0 implies that xi´β + ui > 0 or ui >− xi´β. The distribution of the error, ui , is normal and symmetric, therefore
The probability that a normally distributed random variable with a zero mean and variance of σ2 is less or equal to xi´β is denoted by
Prob (yi > 0|xi)
Prob (ui ≤ xi´β)
which is called the standard normal distribution function. It provides the proportion of the area under the standard normal distribution curve that lies between −∞ and xi´β/σ. (This probability calculation is the probit model, where σ is assumed to be equal to 1.)
2.2. Tobit Model with Sample Selection
The tobit model represents the association between a non-negative dependent variable (price premium’s magnitude, zi) and a set of explanatory variables (xi). This model assumes that there is a latent variable (zi*). The observable variable zi is equal to the latent variable whenever the latent variable is above zero (zi = zi*, if zi *> 0) and otherwise zero (zi = 0, if zi* ≤ 0). Following Greene [27], the latent underlying regression is:
zi* = xi´β + εi , εi ~ N[0,σ2]
In addition, zi* is only observed when y = 1. As such, the tobit model with sample section is a mixture of censoring and a type of truncation (see Greene [27], page E1173), and therefore assumes correlation (ρ) between u from Equation (2) and ε from Equation (4).
3. Results
3.1. Descriptive Statistics
The description of the variables used in the econometric models is presented in Table 1. International tourists who indicated their willingness or intention to buy dried chilies represented 62% of the sample; of them, 62, 68, 72 and 74% indicated their willingness to pay (WTP) for additional label information with an average price premiums of S/1.16, 1.40, 1.29 and 1.58 for information about farmer community, organic certification, traditional cooking recipes, and Fairtrade certification, respectively. The average age of the respondents was 40 years, and there was near parity in the number of male and female respondents in the survey. Most of the respondents had a technical or university degree (16.6 years of education). Around 31% of the respondents were US or Canadian citizens and 28% were European citizens. The list of the country of citizenship for all the international tourists is included in the Appendix. The primary reason for visiting Peru was history related motivations (71% of respondents). Nature tourism, gastronomy, and family and friend visits were less usual, accounting for 28%, 15% and 11% of the respondents, respectively.
Table 1.
Description of variables for econometric models.
| Variable | Description | Mean | Standard Deviation | Number of observations |
|---|---|---|---|---|
| Decision to buy chilies | ||||
| Dried chilies | = 1 if indicated their willingness to buy dried chilies; 0 otherwise | 0.62 | - | 197 |
| WTP and price premiums for label information a,b | ||||
| Farmer community | = 1 if indicated their WTP a price premium for information about farmer community; 0 otherwise | 0.62 | - | 122 |
| Cooking recipes | = 1 if indicated their WTP a price premium for traditional cooking recipes; 0 otherwise | 0.72 | - | 122 |
| Organic | = 1 if indicated their WTP a price premium for organic certification; 0 otherwise | 0.68 | - | 122 |
| Fairtrade | = 1 if indicated their WTP a price premium for Fairtrade certification; 0 otherwise | 0.74 | - | 122 |
| Farmer community price | Price premium’s magnitude for information about farmer community | 1.16 | 2.38 | 122 |
| Cooking recipes price | Price premium’s magnitude for cooking recipes | 1.29 | 2.75 | 122 |
| Organic price | Price premium’s magnitude for organic certification | 1.40 | 2.37 | 122 |
| Fairtrade price | Price premium’s magnitude for Fairtrade certification | 1.58 | 2.56 | 122 |
| Socio-economic characteristics | ||||
| Age | Respondent age in years | 39.56 | 14.70 | 197 |
| Male | = 1 if respondent is male; 0 otherwise | 0.51 | - | 197 |
| Education | Respondent number of years of education | 16.60 | 2.38 | 197 |
| Europe | = 1 if European citizen; 0 otherwise | 0.28 | - | 197 |
| U.S. or Canada | = 1 if U.S. or Canadian citizen; 0 otherwise | 0.31 | - | 197 |
| Motivations for visiting Peru | ||||
| History | =1 if motivation for visiting Peru is history related; 0 otherwise | 0.71 | - | 197 |
| Nature | =1 if motivation for visiting Peru is nature related; 0 otherwise | 0.28 | - | 197 |
| Family and others | =1 if motivation for visiting Peru is family related and others; 0 otherwise | 0.11 | 197 | |
| Gastronomic | =1 if motivation for visiting Peru is food or gourmet related; 0 otherwise | 0.15 | - | 197 |
| Food and chili consumption in Peru | ||||
| Number of dishes | Number of Peruvian traditional dishes tried during visit to Peru | 5.11 | 2.03 | 197 |
| Peruvian food | Rating of Peruvian traditional food (from 1 “I did not like it at all” to 10 “I liked it a lot”) | 8.38 | 1.37 | 197 |
| Chili consumption in home country | ||||
| Grams of chili | Grams of chilies normally bought per month in country of origin | 137.44 | 485.59 | 197 |
| Souvenir shopping behavior | ||||
| Expenditure souvenirs | Total expenditure in souvenirs in Peru (in US$) | 539.05 | 698.21 | 197 |
| Income | Annual income before taxes in US$ | 44116.75 | 27848.01 | 197 |
| Ratio | Ratio between expenditure in souvenirs and income | 0.02 | 0.04 | 197 |
(a) The sample size is 122 without considering the respondents who indicated they would not buy native chilies as souvenirs from Peru; (b) The results of t-tests indicate that the means of the price premium’s magnitudes for the different label information conditions are statistically significantly different among them with probabilities in the range from 0.18 to 0.73.
The respondents tried on average five traditional dishes in Peru, and ranked traditional Peruvian food as 8.4 on a scale ranging from 1 to 10, where 1 represents “I did not like it at all” and 10 “I liked it a lot”. The average quantity bought per month of chilies was 137 grams in their home country. The average annual income before taxes was US$44116.75. Almost all the respondents bought souvenirs during their visit to Peru, with an average expenditure of US$539. Income and expenditure in souvenirs are correlated. Therefore, only the ratio between those two variables was included in the regressions. This ratio was on average 0.02.
3.2. Econometric Model Results
The results (marginal effects) of the determinants for the decision to buy dried chilies as souvenirs in Peru from the probit model are shown in Table 2. For the continuous variables in the probit model, the marginal effect is the increment in the likelihood to buy dried native chilies as souvenirs associated with a marginal increment in the corresponding explanatory variable. For the dummy variables in the probit model, the marginal effect is the increment in the likelihood to buy dried native chilies as souvenirs associated with a discrete change from zero to one of the explanatory variable. International tourists who were younger, more adventurous in trying new dishes, and liked Peruvian food the most were statistically significantly more likely to buy dried chilies as souvenirs from Peru. On the other hand, factors such as gender, education, tourist motivations for visiting Peru, quantity of chilies consumed in home country, country of origin, and income and expenditure in souvenirs in Peru (measured as ratio) were not statistically significant.
Table 2.
Decision to buy dried chilies.
| Variable | Decision to buy dried chilies as souvenirs (marginal effects) |
|---|---|
| Age | −0.00703 *** (0.00207) |
| Male | −0.08843 (0.06357) |
| Education | 0.00462 (0.01379) |
| History | 0.04754 (0.07619) |
| Nature | −0.10672 (0.08096) |
| Family | 0.01955 (0.11934) |
| Gastronomic | 0.11771 (0.09785) |
| Number of dishes | 0.04885 *** (0.01606) |
| Peruvian food | 0.05313 ** (0.02388) |
| Grams of chili | −0.30055 × 10⁻⁴ (0.6935 × 10⁻⁴) |
| Ratio | −0.73228 (0.71955) |
| Europe | −0.04548 (0.09151) |
| United States or Canada | 0.03489 (0.08038) |
| Log Likelihood | −108.48097 |
| Restricted Log Likelihood | −127.48859 |
| McFadden Pseudo R-squared | 0.14909 |
| Number of Observations | 193 |
Standard errors in parenthesis: Significant at *** 0.01; ** 0.05; * 0.1.
The results of the evaluation of the price premiums’ magnitudes for different label information conditions from the tobit models with sample selection are presented in Table 3. For the continuous variables in the tobit model, the marginal effect is the change in the WTP magnitude associated with a marginal increment in the corresponding continuous explanatory variable. For the case of dummy variables, the marginal effect is the ratio of the WTP magnitude for group typified by the dummy variable (e.g., male = 1 or males) over the WTP magnitude for the group not typified by the dummy variable (e.g., male = 0 or females). International tourists who were younger would pay more for information about farmer community, provision of traditional cooking recipes, and Fairtrade certification. Provision of traditional cooking recipes was statistically significantly attractive label condition for female international tourists (denoted as a negative and statistically significant estimate for male tourists), while information about farmer community was appealing for international tourists whose main motivation for visiting Peru is history factors. Gastronomic related tourists would pay more for provision of traditional cooking recipes, organic certification, and Fairtrade certification. International tourists who were more adventurous and tried more number of dishes in Peru would pay more for organic and Fairtrade certified dried chilies, while international tourists who liked Peruvian food the most would pay more for information about farmer community. On the other hand, home country, education, quantity of chili consumption in home country, and the ratio of souvenir expenditure and income were not statistically significantly associated with the price premiums’ magnitudes under different label information conditions.
Table 3.
Decision about the price premiums’ magnitudes.
| Information farmer community | Traditional cooking recipes | Organic certification | Fairtrade certification | ||
|---|---|---|---|---|---|
| Age | −0.06506 *** (0.02280) | −0.04311 * (0.02485) | −0.02254 (0.02026) | −0.03392* (0.01875) | |
| Male | −0.18820 (0.64177) | −1.42835 * (0.78310) | −0.35609 (0.58873) | −0.50987 (0.62543) | |
| Education | 0.08974 (0.11895) | 0.07455 (0.12903) | 0.13143 (0.08686) | 0.14731 (0.11886) | |
| History | 1.12018 * (0.65568) | 0.35208 (0.79582) | 0.78741 (0.66551) | 0.64919 (0.62830) | |
| Nature | 0.13067 (0.75303) | 0.03814 (0.79446) | −0.32997 (0.60269) | −0.35712 (0.63150) | |
| Family | −0.34635 (0.90281) | −1.06535 (1.12748) | −0.55613 (0.86226) | −0.73813 (0.89896) | |
| Gastronomic | 1.20026 (0.73638) | 1.65899 ** (0.81750) | 1.95403 *** (0.66657) | 1.64001 ** (0.68640) | |
| Number of dishes | 0.11728 (0.17402) | 0.28073 (0.18277) | 0.39592 *** (0.14777) | 0.25947 * (0.13364) | |
| Peruvian Food | 0.45743 * (0.25793) | 0.29815 (0.29240) | 0.32292 (0.23920) | 0.31139 (0.24533) | |
| Grams of chili | 0.00087 (0.00130) | 0.00091 (0.00151) | 0.00074 (0.00111) | 0.36906 × 10⁻⁴ (0.00098) | |
| Ratio | −5.45641 (9.99771) | −7.71234 (13.84207) | −1.13290 (9.95286) | −6.29125 (9.26799) | |
| Europe | 0.02142 (0.81628) | −0.28535 (0.97114) | −0.16079 (0.74757) | 0.43771 (0.84648) | |
| United States or Canada | 0.44950 (0.71434) | 0.38627 (0.77604) | −0.26255 (0.60277) | 0.40685 (0.60454) | |
| Constant | −5.82549 * (3.29543) | −4.70432 (3.32629) | −7.26493 *** (2.75229) | −5.89503 ** (2.89040) | |
| Sigma (a) | 2.74616 *** (0.33625) | 3.11637 *** (0.31494) | 2.60234 *** (0.22554) | 2.60427 *** (0.20867) | |
| Log likelihood function | −286.92469 | −297.66186 | −311.75838 | −322.42293 | |
| Number observations | 192 | 192 | 192 | 192 | |
Corrected tobit regressions for sample selection (all the correlations between the errors of the probit and tobit regressions were significant at 0.01, which suggests that the tobit models with sample selection are not misspecified). Standard errors in parentheses. Significant at: *** 0,01; ** 0,05; *0,1 (a) The sigmas in the tobit models were significant, which indicates that this specification is preferred to an ordinary least squared (OLS) specification.
4. Discussion and Conclusions
Dried native chilies had a relatively good acceptance among international tourists who visited Peru. About 62% of the respondents stated that they would buy dried native chilies as souvenirs from Peru. International tourists who were younger were statistically significantly more likely to buy native chilies. This result could be related to the fact that “exotic” ingredients, including native chilies, are becoming popular and increasingly part of Western countries’ diets [28], especially among younger consumers. Increased international tourism and business travels abroad, consumer enthusiasm for new flavors, and eating out may be main lifestyle factors contributing to increased consumption of ethnic foods among younger people, as suggested by CBI [29]. Also, international tourists who liked Peruvian food the most and were more adventurous in trying new Peruvian dishes were more likely to indicate they would buy dried native chilies. This provides evidence that the gastronomy boom in Peru could offer opportunities for small farmers to introduce and commercialize products derived from local biodiversity in the food market as suggested by Ginocchio [30].
Of the respondents who stated they would buy dried native chilies, 62%–74% indicated that they would pay an average price premium in the range from S/1.16–1.58 for different label conditions. The WTP for the different label information conditions are additive. This means that it would be possible to include all the information in the label of the product, and charge for it the sum of price premiums of the different label information conditions evaluated in this study. Nevertheless, it is difficult to include too much information in the labels of food products, and also, additional studies would need to be conducted in order to evaluate the cost-benefits of certain information conditions, such as organic and Fairtrade certifications. Obtaining and maintaining such certifications are costly for farmers.
A disaggregated evaluation by type of tourist suggests that international tourists, whose main motivation for visiting Peru are history related factors, would pay statistically significantly more for label information about farmer community. This is a relevant finding given that at the time when the survey was conducted, most of the tourists indicated they visited Peru due to history related reasons (71%). Therefore, including this kind of information in the labels could provide economic returns with relatively low investment in contrast to certification information. Conversely, international tourists who visited Peru mainly due to gastronomic reasons (15% of the respondents) would pay statistically significantly more for dried chilies if the label would include traditional cooking recipes, organic, or Fairtrade certification logos. Overall, the results suggest that dried native chilies would have acceptance in the international tourism segment in Peru and specific marketing campaigns should be designed and further evaluated for each type of international tourists in order to maximize the economic benefits derived from ethnic food commercialization, which could also benefit small-holder farmers and help to preserve local native biodiversity.
Acknowledgments
The research was funded by the German Federal Ministry for Economic Cooperation and Development through Deutsche Gesellschaft fuer Internationale Zusammenarbeit (GIZ). This work was carried out within the project “Unravelling the potential of neglected crop diversity for high-value product differentiation and income generation for the poor: The case of chili pepper in its centre of origin”, coordinated by Bioversity International. I would like to acknowledge Catarina Corrales for helping to organize the logistics and collecting the data in Cuzco, Peru.
Conflicts of Interest
The author declares no conflict of interest.
References
- Bioversity International. Descubriendo el potencial de la diversidad de los cultivos olvidados para la diferenciación de productos de alto valor y la generación de ingresos para los pobres: El caso de los chiles en su centro de origen; Project proposal presented to GIZ; Deutsche Gesellschaft für Internationale Zusammenarbeit (GIZ): Bogotá, Colombia, 2009. (In Spanish) [Google Scholar]
- Eshbaugh, W.H. Histoy and Explotaition of a Serendipitous New Crop Discovery. In New Crops; Janick, J., Simon, J., Eds.; Wiley: New York, NY, USA, 1993. [Google Scholar]
- Bosland, P.; Votava, E. Peppers: Vegetables and Spice Capsicums; Cabi Publishing: Wallingford, UK, 1993. [Google Scholar]
- Saavedra, H. Análisis de la cadena de valor del ají Charapita (Capsicum chinense) en la región de Ucayali, Perú: Thesis (Agricultural Engineer); Universidad Nacional Agraria La Molina (UNALM): Lima, Peru, 2011. (In Spanish) [Google Scholar]
- Ravallion, M. Pro-Poor Growth: A Primer; World Bank Policy Research Working Paper No. 3242; World Bank: Washington, DC, USA, 2004. [Google Scholar]
- PromPeru. Perfil del turista extranjero 2012; PromPeru: Lima, Peru, 2013. [Google Scholar]
- Organization of American States (OAS). Peruvian cuisine: cultural heritage of the Americas. Available online: http://www.oas.org/en/americas/pdf/2011/jun/oeacuisine.pdf (accessed on 11 November 2013).
- World Travel Awards. World’s leading culinary destination 2013. Available online: http://www.worldtravelawards.com/award-worlds-leading-culinary-destination-2013 (accessed on 20 February 2014).
- Valderrama, M. Gastronomía, desarrollo e identidad cultural; El caso peruano: Lima, Peru, 2010. (In Spanish) [Google Scholar]
- Anderson, L.; Littrell, M. Souvenir-purchase behaviour of women tourists. Ann. Tour. Res. 1995, 22, 328–348. [Google Scholar] [CrossRef]
- Camarena, D.; Sanjuan, A.; Philippidis, G. Influence of ethnocentrism and neo-phobia on ethnic food consumption in Spain. Appetite 2011, 57, 121–130. [Google Scholar] [CrossRef]
- Kim, S.; Littrell, M. Souvenir buying intentions for self versus others. Ann. Tour. Res. 2001, 28, 638–657. [Google Scholar] [CrossRef]
- Swanson, K.; Horridge, P. Travel motivations as souvenir purchase indicators. Tour. Manag. 2006, 27, 671–683. [Google Scholar] [CrossRef]
- Spaniolo, L.; Howard, P. Consumer preferences for alternative eco-labels. A qualitative analysis of natural store and food co-op shoppers’ motivations. Appetite 2011, 56, 545. [Google Scholar] [CrossRef]
- Sattout, E.; Talhouk, S.; Caligari, P. Economic value of cedar relics in Lebanon: An application of contingent valuation method for conservation. Ecol. Econ. 2007, 61, 315–322. [Google Scholar] [CrossRef]
- Veisten, K. Willingness to pay for eco-labelled wood furniture: Choice-based conjoint analysis versus open-ended contingent valuation. J. Forest Econ. 2007, 13, 29–48. [Google Scholar] [CrossRef]
- Solino, M.; Prada, A.; Vazquez, M. Designing a forest-energy policy to reduce forest fires in Galicia (Spain): A contingent valuation approach. J. Forest Econ. 2010, 16, 217–233. [Google Scholar] [CrossRef]
- Hu, W.; Woods, T.; Bastin, S.; Cox, L.; You, W. Assessing consumer willingness to pay for value-added blueberry products using a payment card survey. J. Agr. Appl. Econ. 2011, 43, 243–258. [Google Scholar]
- Markosyan, A.; Wahl, T.; McCluskey, J. Functional foods in the Marketplace: Willingness to Pay for Apples Enriched with Antioxidants. In Presented at the American Agricultural Economics Association Annual Meeting, Portland, OR, USA, 29 July–1 August 2007.
- Moon, W.; Rimal, A.; Balasubramanian, S. UK Consumers’ Willingness to Accept GM food. In Presented at the Southern Agricultural Economics Association Meeting, Mobile, AL, USA, 4–7 February 2007.
- Shi, L.; Chen, X.; Gao, Z. The cross-price effect on Willingness-to-Pay Estimates in Open-Ended Contingent Valuation. In Presented at the Agricultural & Applied Economics Association, Washington, DC, USA, 4–6 August 2013.
- Venkatachalam, L. The contingent valuation method: A review. Environ. Impact Assess. Rev. 2004, 24, 89–124. [Google Scholar] [CrossRef]
- Briesch, R.; Krishnamurthi, L.; Mazumdar, T. A comparative analysis of reference price models. J. Consum. Res. 1997, 24, 202–214. [Google Scholar]
- Van Loo, E.; Caputo, V.; Nayga, R.; Meullenet, J.; Ricke, S. Consumer’ willingness to pay for organic chicken breast: Evidence from choice experiment. Food Qual. Prefer. 2011, 22, 603–613. [Google Scholar]
- Heckman, J. Sample Selection Bias as Specification Error. Econometrica 1979, 47, 153–161. [Google Scholar] [CrossRef]
- Breen, R. Regression Models. Censored, Sample—Selected or Truncated Data; Quantitative Applications in the Social Sciences; SAGE Publications: Thousand Oaks, CA, USA, 1996. [Google Scholar]
- Greene, W.H. Limdep; Version 10; Econometric Modelling Guide; Econometric Software, Inc.: New York, NY, USA, 2012. [Google Scholar]
- Khokhar, S.; Gilbert, P.; Moyle, C.; Carnovale, E.; Shahar, D.; Ngo, J.; Saxholt, E.; Ireland, J.; Jansen-van der Vliet, M.; Bellemans, M. Harmonised procedures for producing new data on the nutritional composition of ethnic foods. Food Chem. 2009, 113, 816–824. [Google Scholar] [CrossRef]
- Centre for the Promotion of Imports from developing countries (CBI). Market Survey. The Fresh Fruit and Vegetable Market in EU, CBI: The Hague, The Netherlands, 2006.
- Ginocchio, L. Pequena agricultural y gastronomia: Oportunidades y desafios; APEGA: Lima, Peru, 2012. (In Spanish) [Google Scholar]
Appendix
Table A1.
List of country of citizenship of respondents.
| Number of tourists | Percentage | |
|---|---|---|
| USA | 50 | 25.4 |
| Argentina | 14 | 7.1 |
| Brazil | 13 | 6.6 |
| England | 13 | 6.6 |
| Canada | 12 | 6.1 |
| Spain | 10 | 5.1 |
| Germany | 10 | 5.1 |
| Chile | 9 | 4.6 |
| Australia | 8 | 4.1 |
| Ecuador | 7 | 3.6 |
| France | 7 | 3.6 |
| Mexico | 7 | 3.6 |
| Colombia | 6 | 3.0 |
| Switzerland | 6 | 3.0 |
| Venezuela | 4 | 2.0 |
| Belgium | 2 | 1.0 |
| Denmark | 2 | 1.0 |
| El Salvador | 2 | 1.0 |
| Russia | 2 | 1.0 |
| China | 1 | 0.5 |
| The Caribbean | 1 | 0.5 |
| Scotland | 1 | 0.5 |
| Guatemala | 1 | 0.5 |
| Haiti | 1 | 0.5 |
| The Netherlands | 1 | 0.5 |
| Nicaragua | 1 | 0.5 |
| Norway | 1 | 0.5 |
| New Zealand | 1 | 0.5 |
| Pakistan | 1 | 0.5 |
| Czech Republic | 1 | 0.5 |
| Sweden | 1 | 0.5 |
| Uruguay | 1 | 0.5 |
| Total | 197 | 100.0 |
© 2014 by the authors; licensee MDPI, Basel, Switzerland. This article is an open access article distributed under the terms and conditions of the Creative Commons Attribution license (http://creativecommons.org/licenses/by/3.0/).