Application of Low-Phosphorous Fertilizers on Tea Plantations as a Novel Best Management Practice

 ,
, 
Abstract
:1. Introduction
2. Methodology
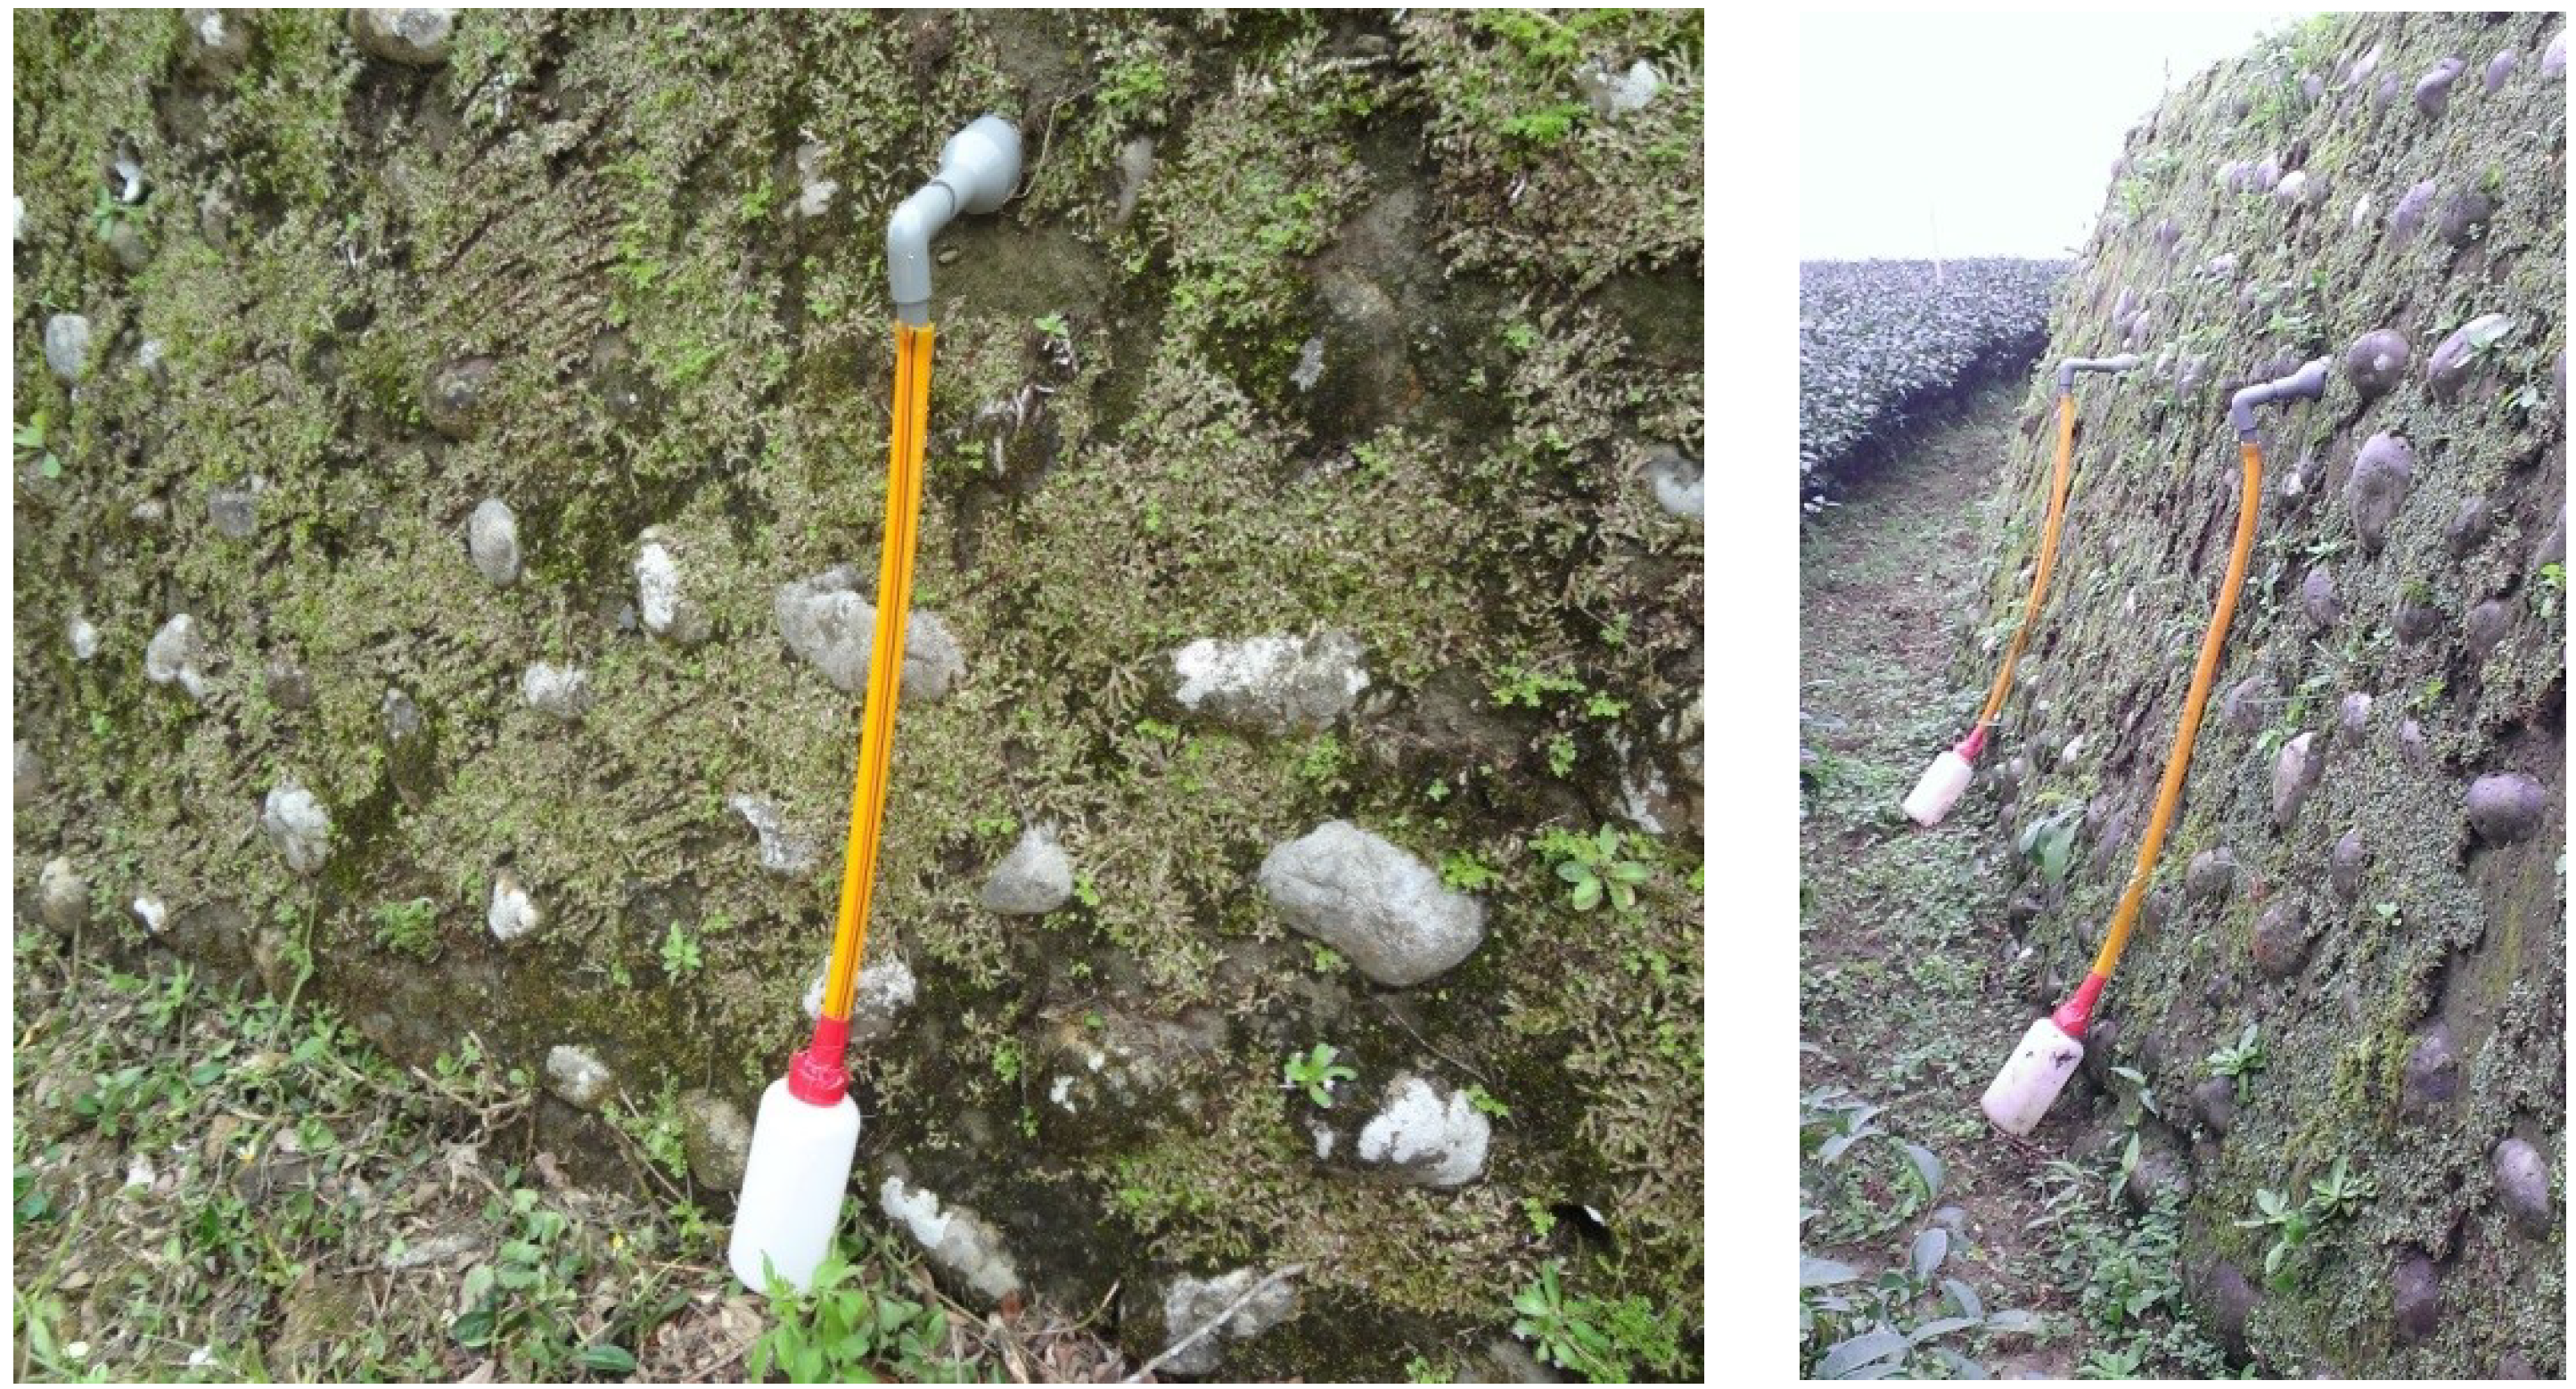
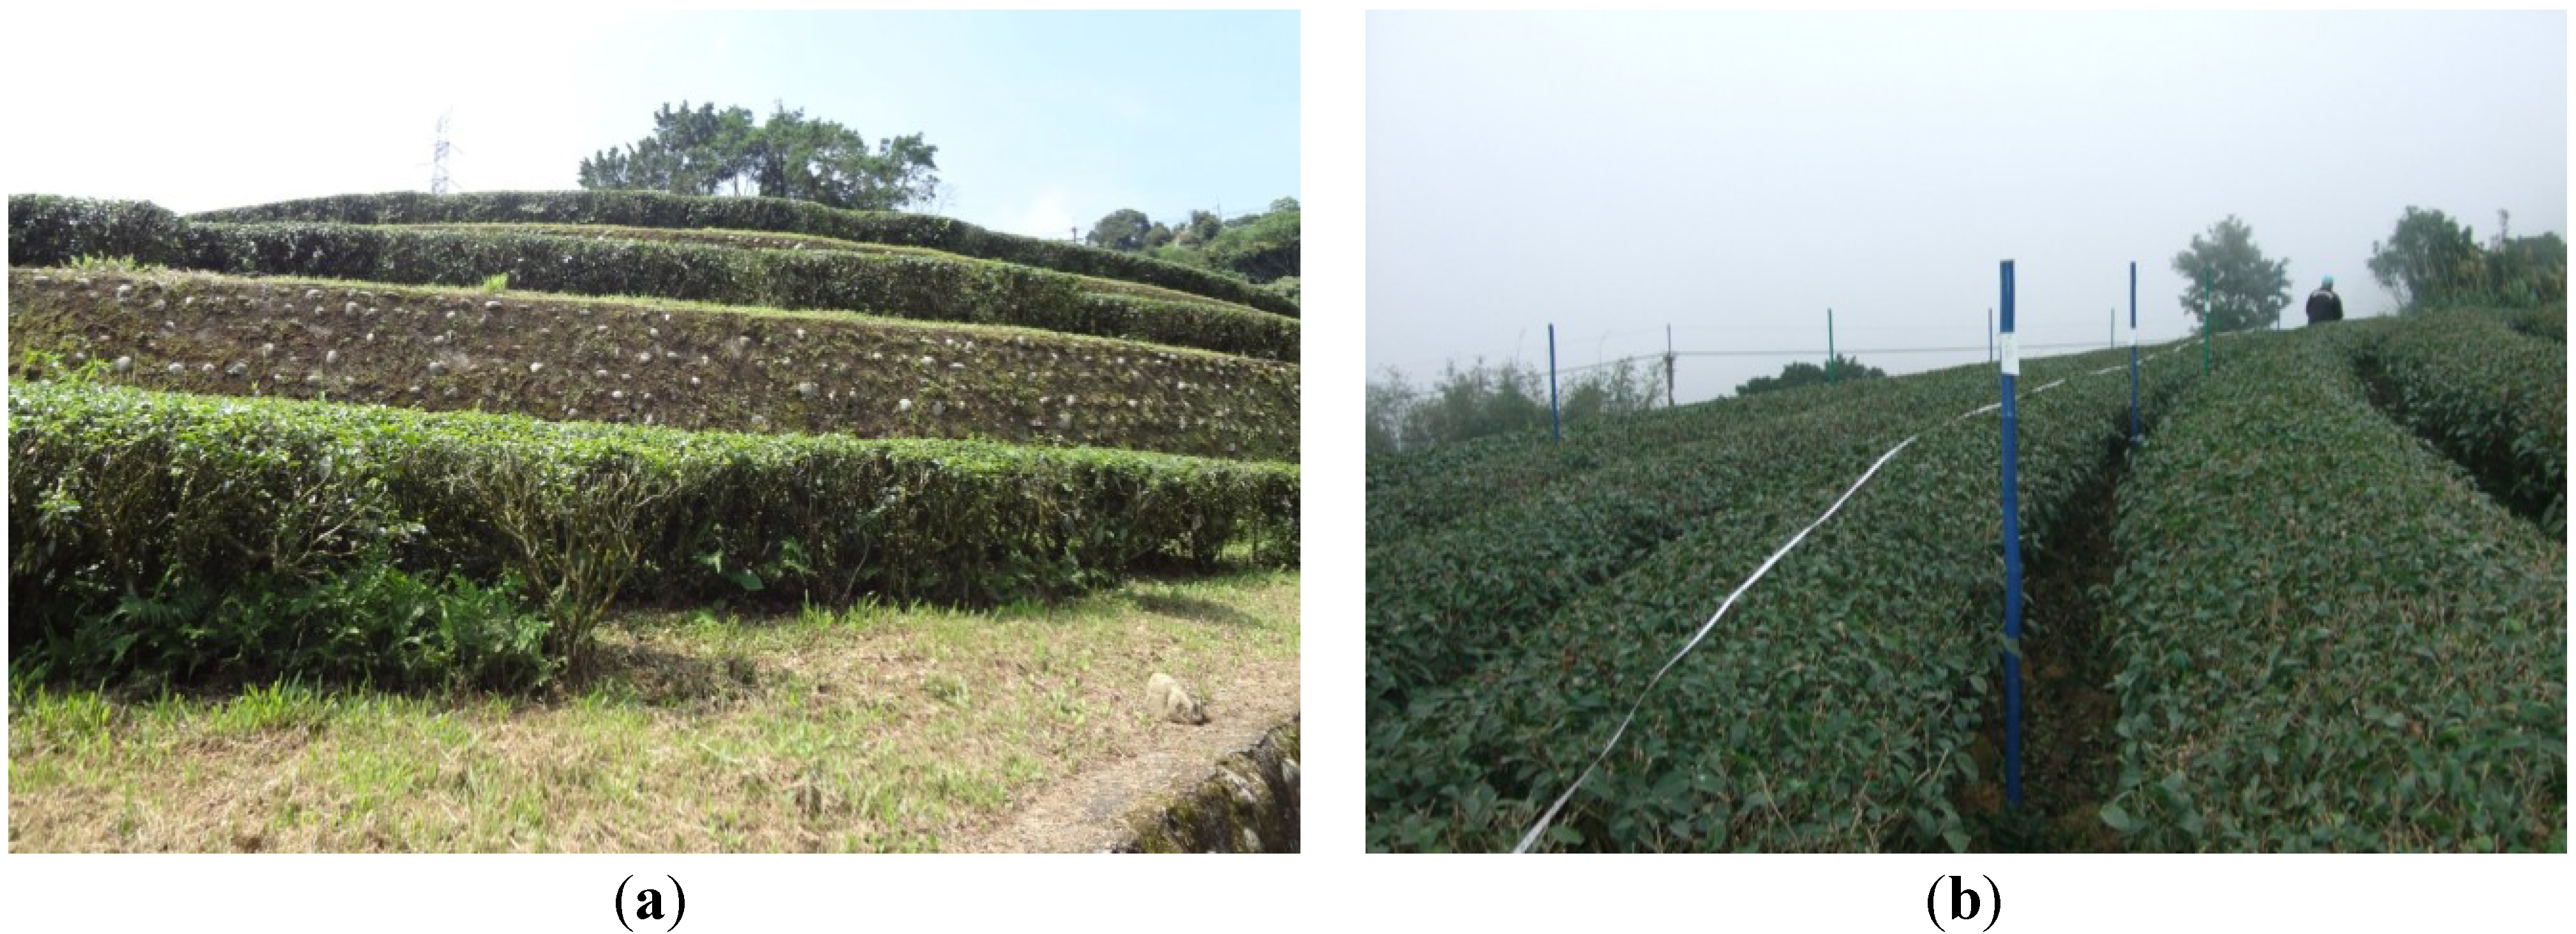
2.1. Test Fields

2.2. Analyses
2.2.1. Soil Analysis
2.2.2. Water Quality Analysis


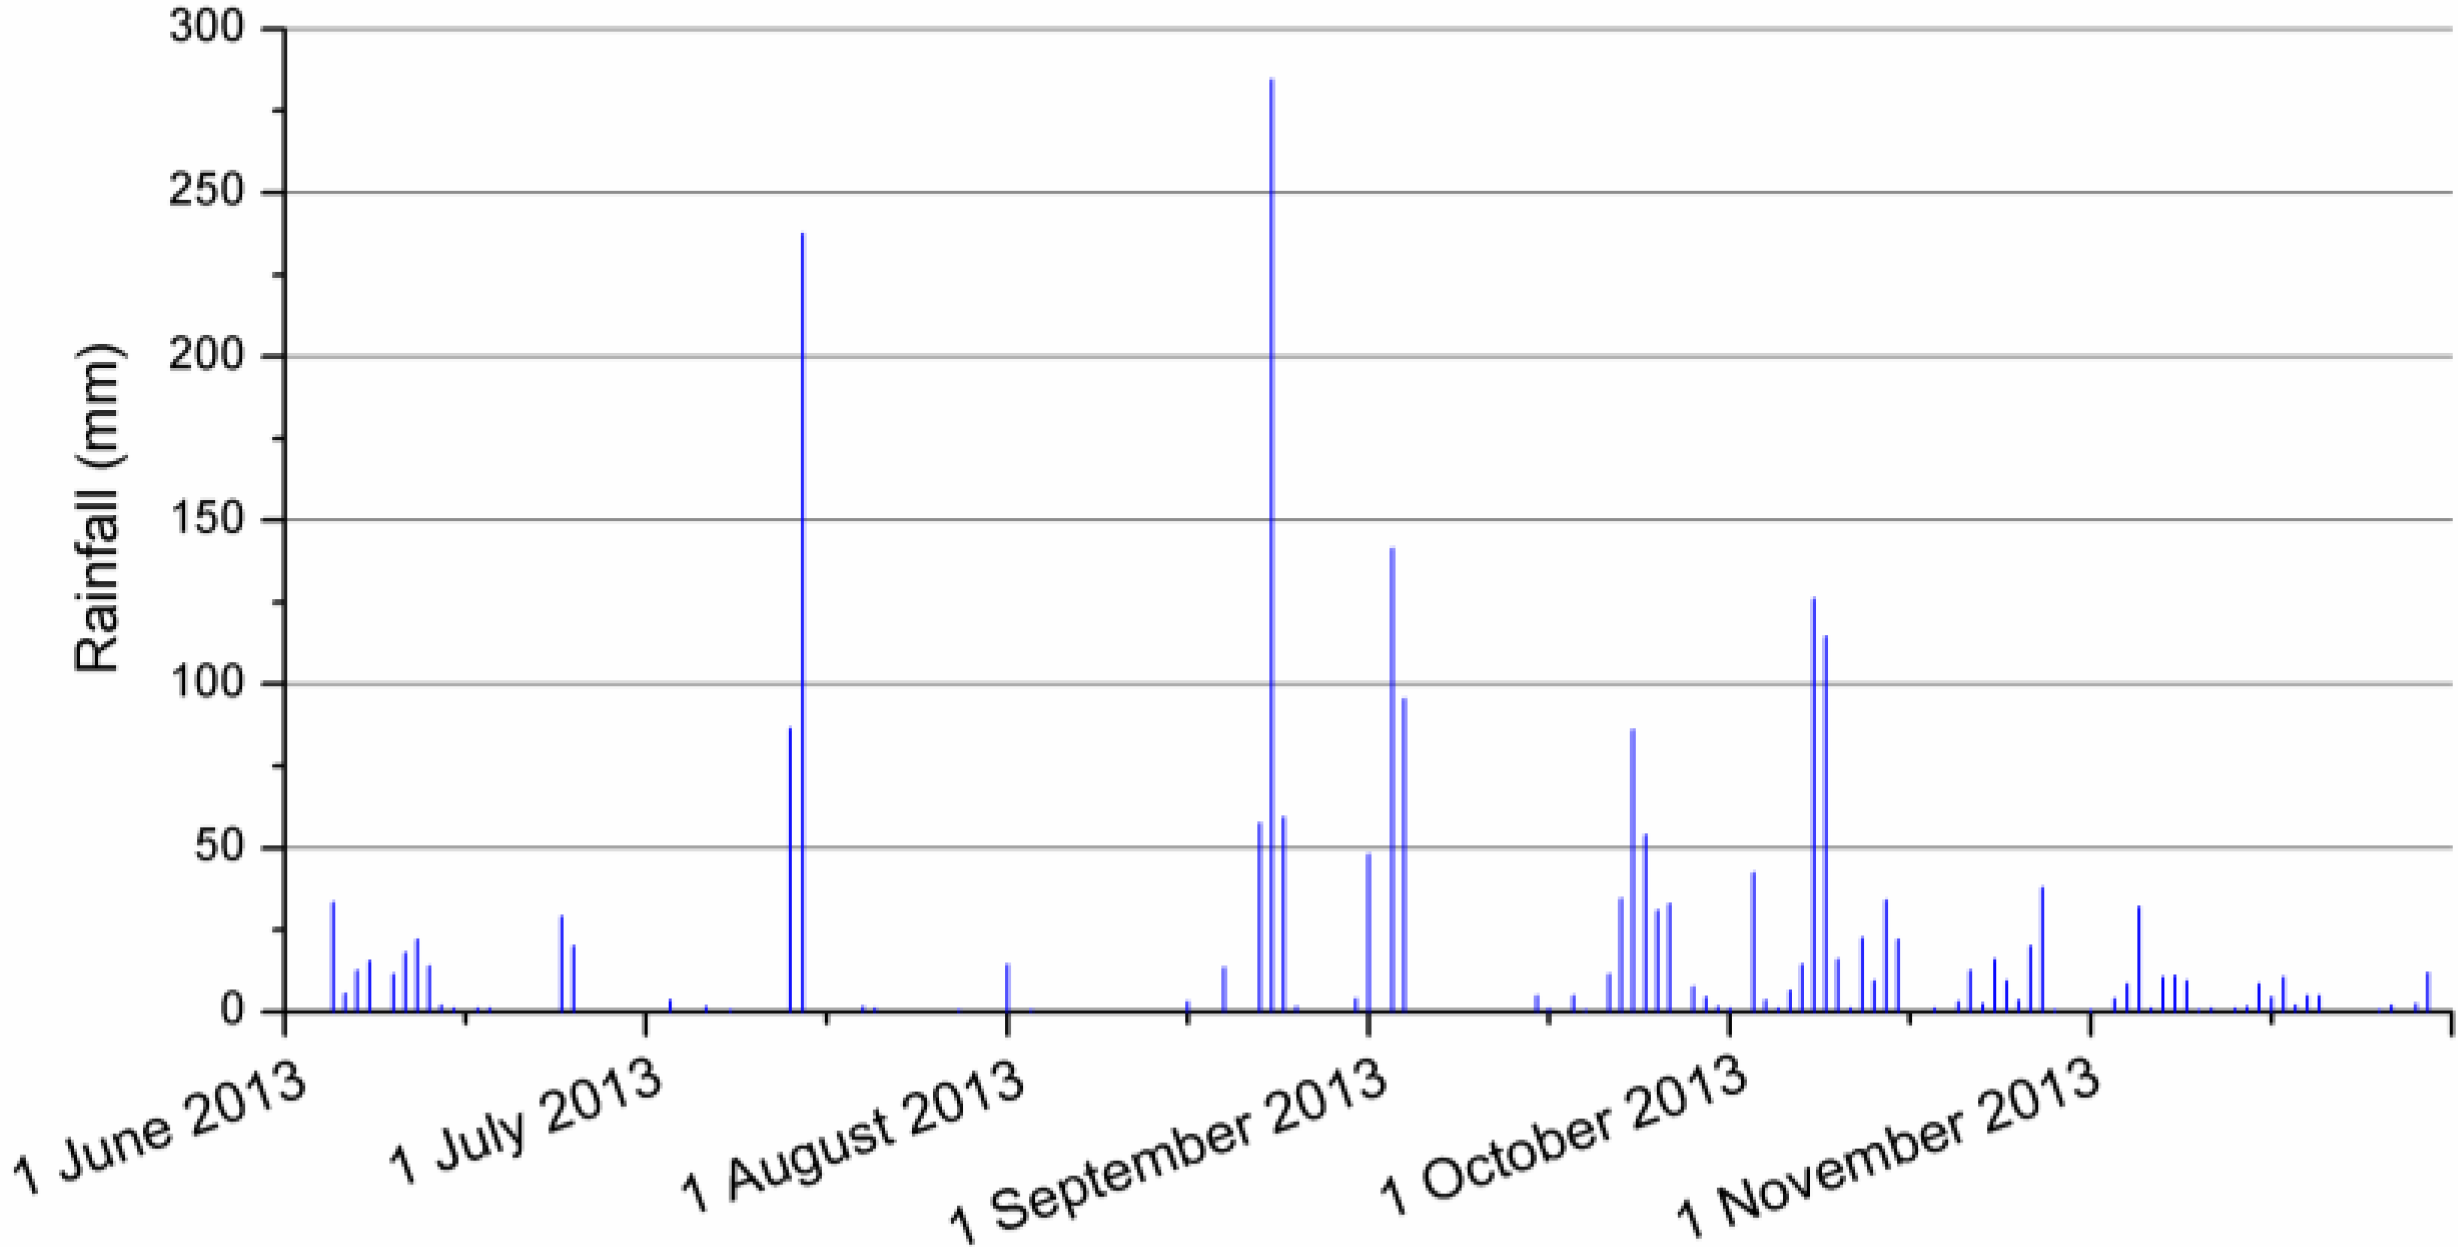
| Date | Rainfall (mm) | Regular-P site | Low-P site |
|---|---|---|---|
| 29 August 2013 | 48 | Partial * | Yes |
| 31 August 2013 | 141.5 | Yes | Yes |
| 21 September 2013 | 54 | Partial * | Yes |
| 6 October 2013 | 114.5 | Yes | Yes |
| 24 October 2013 | 38 | Yes | No |
| 13 November 2013 | 23.5 | Yes | No |
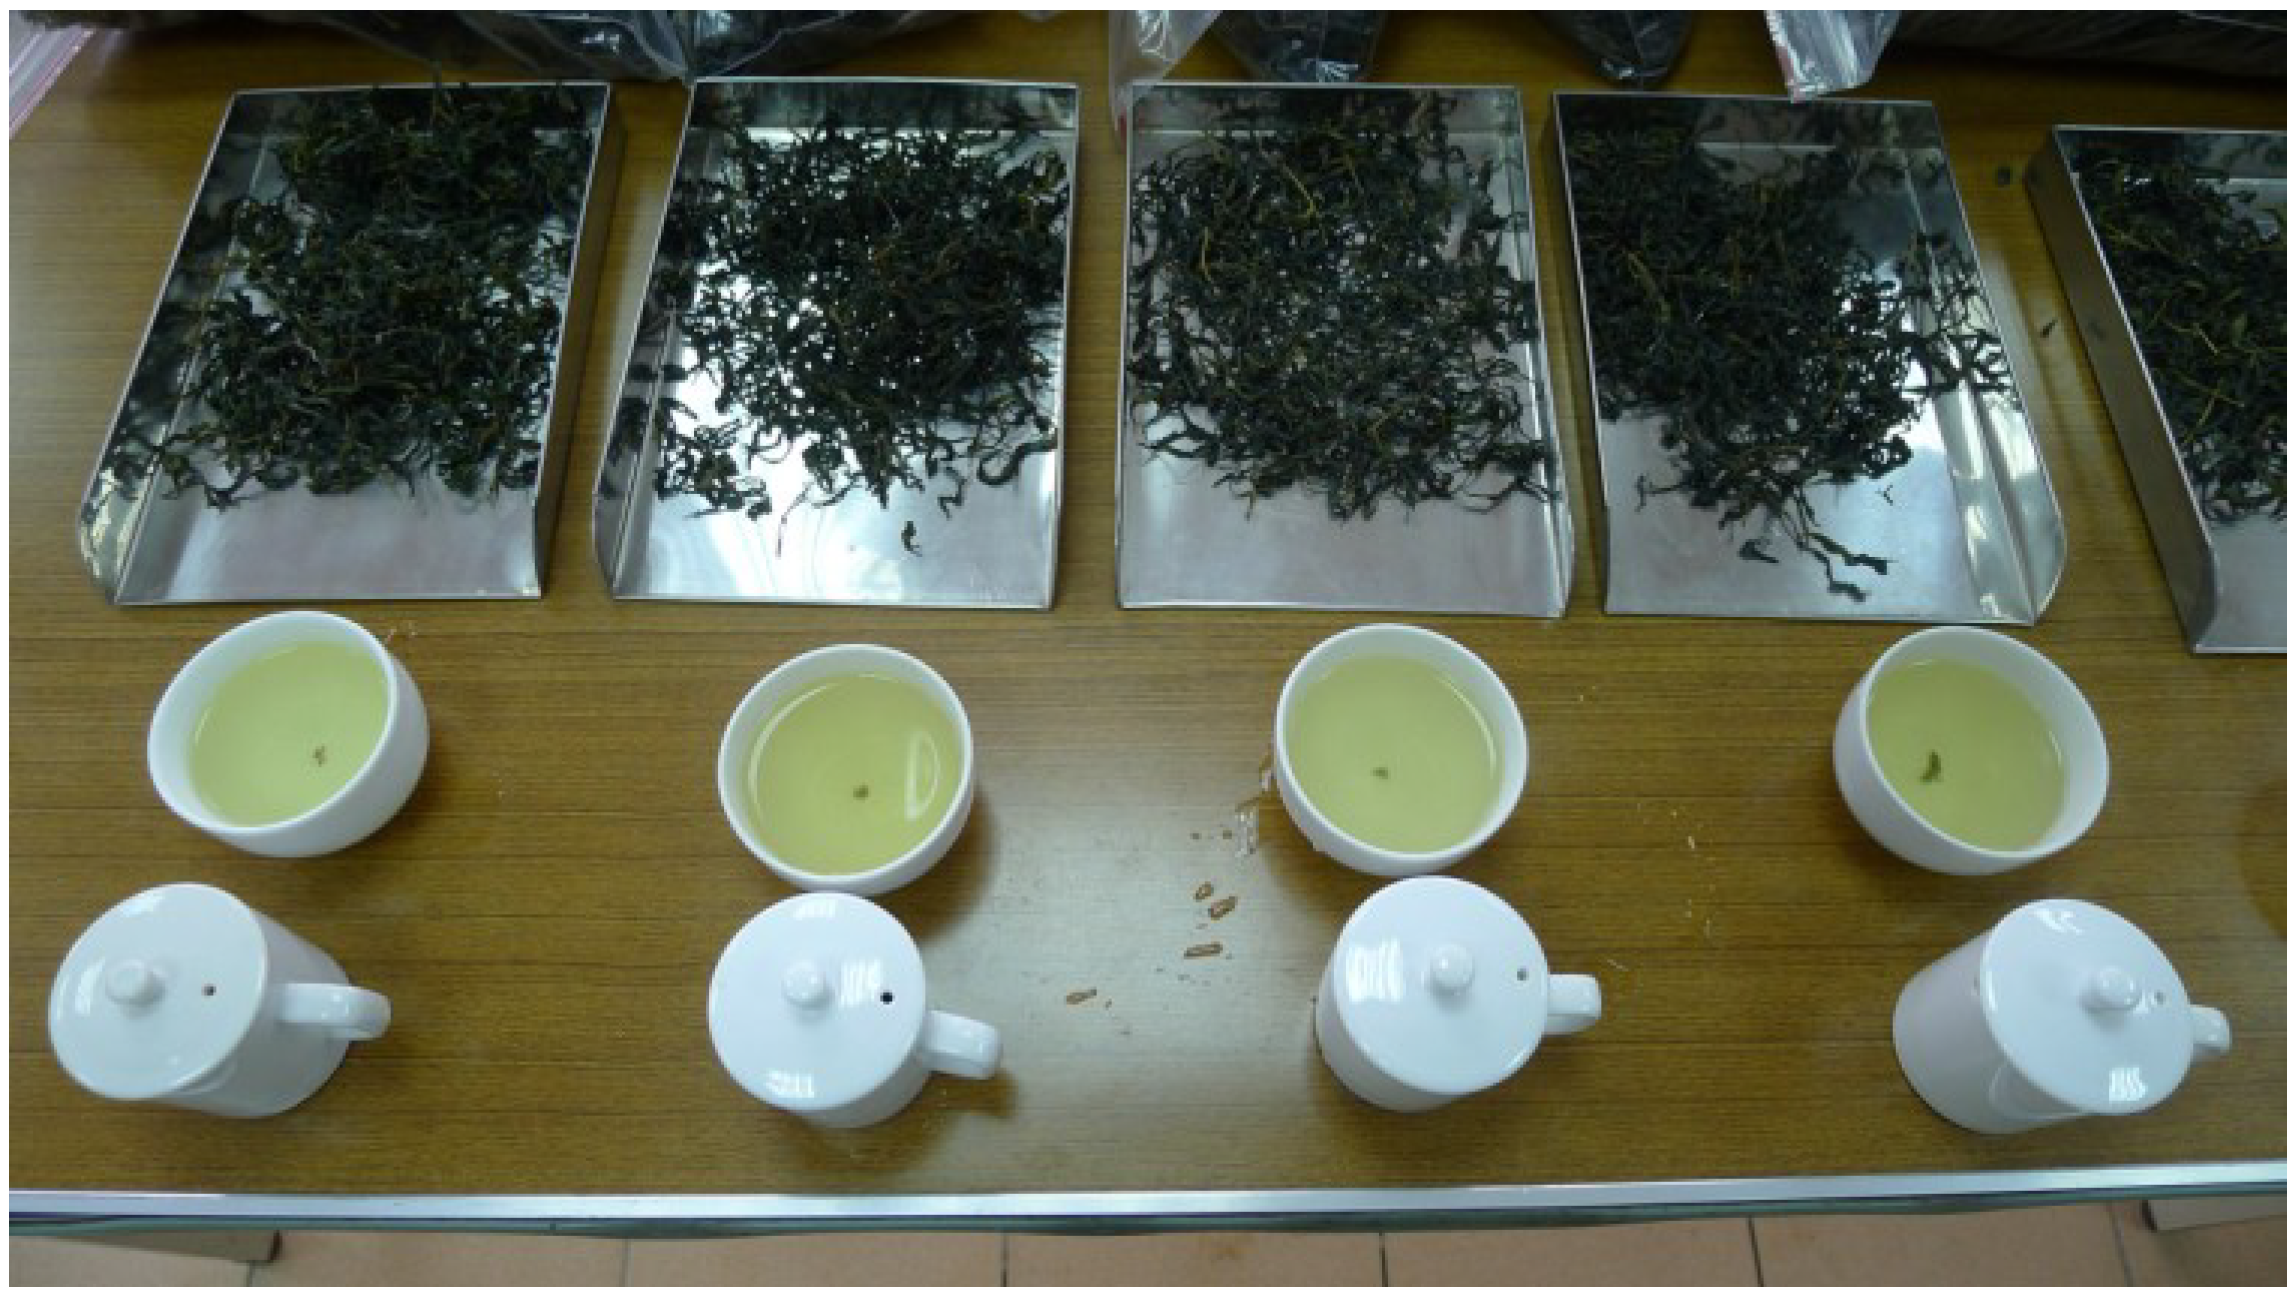
2.2.3. Tea Analysis
3. Results and Discussion
3.1. Soil Quality
| Treatment | pH (1:1) | Organic matter (OM) (g/kg) | Bray-1 P (mg/kg) | Extractable K (mg/kg) | Extractable Ca (mg/kg) | Extractable Mg (mg/kg) |
|---|---|---|---|---|---|---|
| Regular-P | ||||||
| Topsoil | 4.01 ± 0.16 | 91.2 ± 8.2 | 776.3 ± 178.2 | 269.8 ± 27.2 | 504.1 ± 116.0 | 32.4 ± 7.6 |
| Bottom soil | 4.26 ± 0.10 | 65.7 ± 5.0 | 400.2 ± 133.2 | 108.4 ± 11.5 | 414.8 ± 44.7 | 36.7 ± 3.5 |
| Low-P | ||||||
| Topsoil | 4.35 ± 0.07 | 99.9 ± 4.4 | 920.6 ± 78.5 | 221.1 ± 12.7 | 465.9 ± 86.9 | 41.2 ± 9.2 |
| Bottom soil | 4.39 ± 0.16 | 59.4 ± 1.7 | 681.4 ± 65.0 | 157.5 ± 9.4 | 373.3 ± 53.3 | 39.7 ± 5.3 |
| Treatment | pH (1:1) | OM (g/kg) | Bray-1 P (mg/kg) | Extractable K (mg/kg) | Extractable Ca (mg/kg) | Extractable Mg (mg/kg) |
|---|---|---|---|---|---|---|
| Regular-P | ||||||
| Topsoil | 3.64 ± 0.14 | 65.0 ± 6.2 | 526.8 ± 195.3 | 201.7 ± 13.1 | 525.9 ± 150.1 | 32.0 ± 7.3 |
| Bottom soil | 3.66 ± 0.08 | 34.5 ± 1.4 | 192.5 ± 156.9 | 130.0 ± 11.8 | 203.6 ± 10.4 | 18.0 ± 2.5 |
| Low-P | ||||||
| Topsoil | 3.55 ± 0.04 | 76.7 ± 9.9 | 454.3 ± 164.4 | 216.3 ± 3.78 | 373.3 ± 52.3 | 28.9 ± 3.6 |
| Bottom soil | 3.73 ± 0.03 | 32.7 ± 3.4 | 231.0 ± 96.1 | 139.2 ± 3.3 | 259.4 ± 26.3 | 24.3 ± 2.4 |
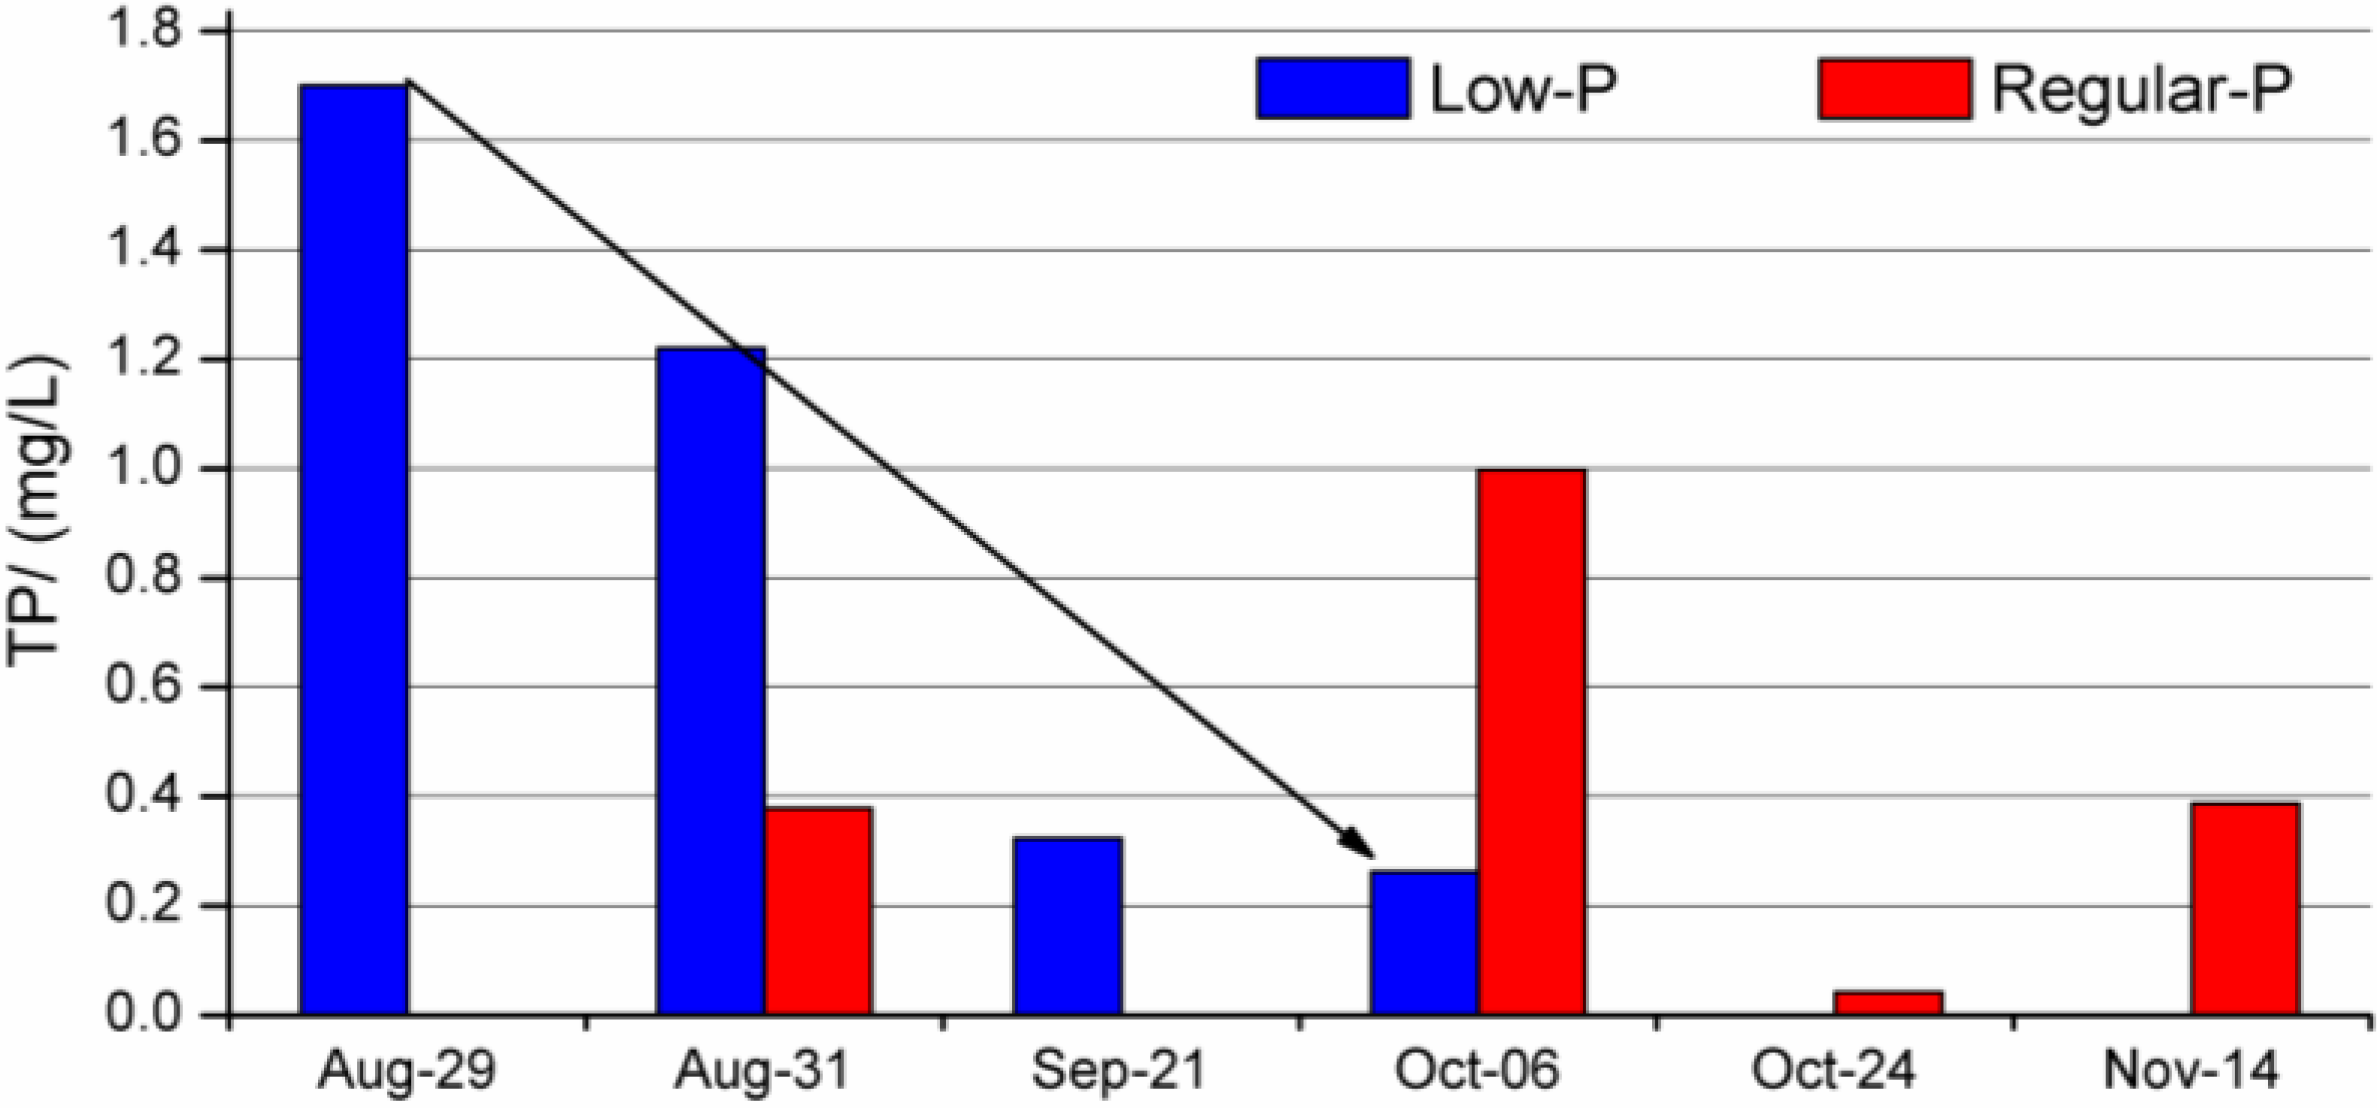
3.2. Effluent Water Quality
| Treatment | DO (mg/L) | pH | Conductivity | TDS (mg/L) | COD (mg/L) | SS (mg/L) | TP (mg/L) | TKN (mg/L) | NO2-N (mg/L) | NO3-N (mg/L) | TN (mg/L) | |
|---|---|---|---|---|---|---|---|---|---|---|---|---|
| Regular-P | Average | 9.84 | 7.45 | 198.98 | 143.22 | 78.20 | 50.50 | 0.45 | 5.40 | 7.16 | 11.75 | 22.52 |
| SD | 4.17 | 0.72 | 139.56 | 74.70 | 88.10 | 63.75 | 0.40 | 8.49 | 11.63 | 10.56 | 20.27 | |
| Low-P | Average | 13.47 | 6.98 | 176.88 | 128.14 | 54.73 | 68.00 | 0.88 | 6.53 | 0.54 | 1.40 | 8.47 |
| SD | 10.60 | 0.49 | 126.88 | 84.47 | 27.23 | 24.92 | 0.70 | 4.75 | 0.79 | 1.02 | 5.50 |
3.3. Tea Quality
| Treatment | Leaf length (mm) | Leaf width (mm) | Internode length (mm) | Leaf thickness (μm) | Number of tea buds from a standard area (buds) | Weight of 100 tea buds (g) |
|---|---|---|---|---|---|---|
| Spring | ||||||
| Regular-P | 69.4 ± 2.1 a | 33.1 ± 0.8 a | 32.2 ± 1.5 a | 27.8 ± 0.4 a | 45.6 ± 1.4 a | 52.2 ± 2.7 a |
| Low-P | 66.8 ± 1.9 a | 32.6 ± 0.8 a | 29.0 ± 1.0 a | 27.5 ± 0.4 a | 42.0 ± 3.9 a | 53.7 ± 2.6 a |
| Winter | ||||||
| Regular-P | 61.2 ± 1.1 a | 31.2 ± 0.5 a | 24.7 ± 0.8 a | 26.7 ± 0.3 a | 43.0 ± 2.8 a | 54.4 ± 1.5 a |
| Low-P | 58.4 ± 1.1 a | 31.2 ± 0.5 a | 25.4 ± 0.8 a | 25.3 ± 0.2 b | 27.2 ± 2.9 b | 53.8 ± 1.9 a |
| Treatment | N (g/kg) | P (g/kg) | K (g/kg) | Ca (g/kg) | Mg (g/kg) |
|---|---|---|---|---|---|
| Spring | |||||
| Regular-P | 28.7 ± 0.8 b | 3.1 ± 0.1 a | 11.6 ± 0.1 a | 2.9 ± 0.1 a | 1.4 ± 0.0 a |
| Low-P | 36.9 ± 0.7 a | 3.1 ± 0.1 a | 11.8 ± 0.1 a | 3.1 ± 0.0 a | 1.4 ± 0.0 a |
| Winter | |||||
| Regular-P | 43.0 ± 0.3 a | 3.6 ± 0.0 a | 26.1 ± 1.2 a | 2.4 ± 0.0 b | 1.6 ± 0.0 a |
| Low-P | 42.2 ± 0.2 a | 3.6 ± 0.0 a | 25.6 ± 2.4 a | 2.7 ± 0.0 a | 1.6 ± 0.0 a |
| Treatment | Fe (mg/kg) | Mn (mg/kg) | Cu (mg/kg) | Al (mg/kg) | Zn (mg/kg) |
| Spring | |||||
| Regular-P | 218.6 ± 6.8 a | 720.0 ± 5.5 b | 13.1 ± 1.5 a | 720.3 ± 5.7 a | 29.4 ± 1.7 a |
| Low-P | 118.4 ± 1.5 b | 796.0 ± 3.8 a | 11.3 ± 0.2 a | 544.0 ± 3.7 b | 24.2 ± 0.6 a |
| Winter | |||||
| Regular-P | 112.8 ± 1.7 a | 787.3 ± 14.3 a | 7.0 ± 0.1 a | - | 20.3 ± 0.3 a |
| Low-P | 106.9 ± 1.9 a | 767.5 ± 9.6 a | 6.7 ± 0.2 a | - | 17.3 ± 0.4 b |
| Treatment | Appearance (20%) | Color of liquid (20%) | Aroma (30%) | Taste (30%) | Total score (100%) |
|---|---|---|---|---|---|
| Spring | |||||
| Regular-P | 11.0 | 14.0 | 21.0 | 21.0 | 67.0 |
| Low-P | 11.0 | 14.0 | 25.5 | 25.5 | 76.0 |
| Winter | |||||
| Regular-P | 15.3 | 13.3 | 23.3 | 22.3 | 74.3 |
| Low-P | 14.7 | 14.7 | 24.0 | 23.0 | 76.3 |

| Treatment | Theanine (mg/g) | Caffeine (mg/g) | Catechin (mg/g) | Total catechin (mg/g) |
|---|---|---|---|---|
| Spring | ||||
| Regular-P | 9.26 ± 0.09 b | 15.55 ± 0.44 a | 23.34 ± 0.53 a | 96.44 ± 1.59 a |
| Low-P | 10.76 ± 0.00 a | 17.01 ± 0.42 a | 24.75 ± 1.22 a | 95.16 ± 2.51 a |
| Winter | ||||
| Regular-P | 6.55 ± 0.31 a | 14.98 ± 0.67 a | 21.54 ± 1.44 a | 46.00 ± 2.26 a |
| Low-P | 7.49 ± 0.23 a | 15.13 ± 0.24 a | 19.49 ± 0.42 a | 43.15 ± 0.50 a |
4. Conclusions
Acknowledgment
Author Contributions
Conflicts of Interest
References
- Frossard, E.; Condron, L.M.; Oberson, A.; Sinaj, S.; Fardeau, J.C. Process governing phosphorus availability in temperate soils. J. Environ. Qual. 2000, 29, 15–23. [Google Scholar]
- Sainju, U.M.; Whitehead, W.F.; Singh, B.P. Agricultural management practices to sustain crop yields and improve soil and environmental quality. Sci. World J. 2003, 3, 768–789. [Google Scholar]
- Hirono, Y.; Watanabe, I.; Nonaka, K. Trends in water quality around an intensive tea-growing area in Shizuoka, Japan. Soil Sci. Plant Nutr. 2009, 55, 783–792. [Google Scholar]
- Liu, Z.; Yang, J.; Yang, Z.; Zou, J. Effects of rainfall and fertilizer types on nitrogen and phosphorus concentrations in surface runoff from subtropical tea fields in Zhejiang, China. Nutr. Cycle Agoroecosyst. 2012, 93, 297–307. [Google Scholar]
- Maghanga, J.K.; Kituyi, J.L.; Kisinyo, P.O.; Ngetich, W.K. Impact of nitrogen fertilizer applications on surface water nitrate levels within a Kenyan tea plantation. J. Chem. 2013. [Google Scholar] [CrossRef]
- Kim, M.K.; Seo, M.C.; Kim, M.Y.; Chung, J.B.; Kim, B.J. Estimating nitrogen and phosphorus contents using model integrated in small agricultural watersheds. J. Environ. Sci. Health Part A 2004, 39, 1833–1842. [Google Scholar]
- Chang, S.P.; Chuang, S.M. Eutrophication study of twenty reservoirs in Taiwan. Water Sci. Technol. 2001, 44, 19–26. [Google Scholar]
- Zehetner, F.; Vemuri, N.L.; Huh, C.A.; Kao, S.J.; Hsu, S.C.; Huang, J.C.; Chen, Z.S. Soil and phosphorus redistribution along a steep tea plantation in the Feitsui reservoir catchment of northern Taiwan. Soil Sci. Plant Nutr. 2008, 54, 618–626. [Google Scholar]
- Chang, Y.C. The Effect of Fertilizing Tea Plantation to Peishih River. Master’s Thesis, National Taiwan University, Taipei, Taiwan, 2009. [Google Scholar]
- Wu, C.W. Developing a nutrient TMDL program in Feitsui Reservoir Watershed. Master’s Thesis, National Taipei University of Technology, Taipei, Taiwan, 2010. [Google Scholar]
- Zheng, Z.M.; Zhang, T.Q. Soil Phosphorus Tests and Transformation Analysis to Quantify Plant Availability: A Review. In Soil Fertility Improvement and Integrated Nutrient Management—A Global Perspective; Whalen, J.K., Ed.; In Tech: Winchester, UK, 2012; pp. 19–36. [Google Scholar]
- Blevins, R.L.; Frye, W.W.; Baldwin, P.L.; Robertson, S.D. Tillage effects on sediment and soluble nutrient losses from a Maury silt loam soil. J. Environ. Qual. 1990, 19, 683–686. [Google Scholar]
- Sharpley, A.N.; Smith, S.J. Wheat tillage and water quality in the Southern plains. Soil Tillage Res. 1994, 30, 33–48. [Google Scholar]
- Knudsen, D.; Peterson, G.A.; Pratt, P.F. Lithium, Sodium and Potassium. In Methods of Soil Analysis Part 2. Chemical and Microbiological Properties; Page, A.L., Ed.; American Society of Agronomy: Madison, WI, USA, 1982; pp. 225–238. [Google Scholar]
- Recommended Chemical Soil Test Procedures for the North Central Region. Available online: http://infohouse.p2ric.org/ref/17/16690.pdf (accessed on 1 October 2014).
- Bremner, J.M. Total Nitrogen, organic Forms of Nitrogen, Organic Forms of Nitrogen. In Method of Soil Analysis Part 2; Black, C.A., Ed.; American Society of Agronomy: Madison, WI, USA, 1965; pp. 1149–1178. [Google Scholar]
© 2014 by the authors; licensee MDPI, Basel, Switzerland. This article is an open access article distributed under the terms and conditions of the Creative Commons Attribution license (http://creativecommons.org/licenses/by/4.0/).
Share and Cite
Chen, C.-F.; Hu, C.-Y.; Liou, M.-L.; Wu, C.-C.; Su, Y.-S.; Liu, C.-J. Application of Low-Phosphorous Fertilizers on Tea Plantations as a Novel Best Management Practice. Sustainability 2014, 6, 6985-6997. https://doi.org/10.3390/su6106985
Chen C-F, Hu C-Y, Liou M-L, Wu C-C, Su Y-S, Liu C-J. Application of Low-Phosphorous Fertilizers on Tea Plantations as a Novel Best Management Practice. Sustainability. 2014; 6(10):6985-6997. https://doi.org/10.3390/su6106985
Chicago/Turabian StyleChen, Chi-Feng, Chih-Yi Hu, Ming-Lone Liou, Chia-Chang Wu, Yen-Shuo Su, and Chien-Ju Liu. 2014. "Application of Low-Phosphorous Fertilizers on Tea Plantations as a Novel Best Management Practice" Sustainability 6, no. 10: 6985-6997. https://doi.org/10.3390/su6106985
APA StyleChen, C.-F., Hu, C.-Y., Liou, M.-L., Wu, C.-C., Su, Y.-S., & Liu, C.-J. (2014). Application of Low-Phosphorous Fertilizers on Tea Plantations as a Novel Best Management Practice. Sustainability, 6(10), 6985-6997. https://doi.org/10.3390/su6106985