1. Introduction
In the last ten years power generation by photovoltaic systems increased significantly, according to a general trend characterized by the big growth of all renewable energies [
1,
2]. In 2012, the cumulative installed PV power exceeded the threshold of 100 GW, producing at the end of 2012 at least 110 TWh of electricity. The growth was accompanied by an increase of awareness by consumers who developed a positive attitude towards green electricity [
3,
4].
In this context, the PV industry is working to optimize the quality of its products, both from the technical and the environmental point of view [
5] and in order to be competitive in the worldwide market. In order to check the performance of the manufactured PV devices, according to the standard provided by the International Electrotechnical Commission (IEC), PV manufacturers increasingly make use of Sun simulators, a test facility that simulates Sun radiation and checks the efficiency of the PV device under controlled conditions. However, the costs for these kinds of tests are still high, because Sun simulators are still very expensive.
The research is creating a new cheaper Sun simulator thanks to the collaboration with an important Umbrian PV service company (CERIP srl). An initial PV market analysis was carried out in order to understand the potential penetration of Sun simulators in the global market, and an analysis of the current Sun simulators technologies was performed in order to compare performances and costs.
The main result of the economic analysis is that one of the most significant costs of the test device is due to the employment of the Air Mass 1.5 G filter [
6].
Such a filter is required to absorb the Sun spectrum produced by a xenon lamp in different ways for each waveband. The cost of an AM 1.5 filter can reach over €6 per square centimeter. Therefore, the aim of this work is to find a cheaper filter to be used in Sun simulators, employing glass covered with chemical compounds. Different systems were identified and simulated, and the preliminary results are presented in the paper.
2. The Photovoltaic Market
In 1999, the global PV generation was less than 1 GW, while in 2012, PV generation achieved the threshold of 100 GW. Therefore, after 12 years, PV power is a hundred-fold [
1].
The determining factors for this growth, in addition to the great technological advances of the production systems and to the best power conversion efficiencies, are to be found in the national incentive policies of several countries (the Appendix
Table A1 shows a list of the main incentives for photovoltaic installations in the world). These incentives are dictated both by a new awareness of environmental issues enhanced by the ratification of the Kyoto Protocol and by the necessity of finding alternative uses of traditional sources (fossil fuels) for the production of electricity. The integration of PV panels in buildings [
7], which in many industrial countries results in higher incentives, is another key factor of such big growth. Nowadays, photovoltaic technology is ready to become the best source in the world for green electricity generation.
The IHS analysts (IHS is a global information company with world-class experts in energy and economical areas) and [
8] estimate that the new installed worldwide capacity will be 41 GW in 2014. As far as annual growth rates are concerned, after the record of +35% in 2011, in 2012, the increase was 15% and in 2013 “only” 13%. For 2014, the growth should be +17%.
Future growth will be mainly due to the creation of new markets in emerging countries and due to the development of PV in large markets that are relatively young, such as Japan and China. Asia in general will become increasingly important in 2014, attracting 48% of worldwide installations (compared to 39% in 2012), while the share in Europe will be less important: 29% of the market compared to 57% in 2012. In the opinion of IHS experts in Europe, the most mature markets, such as Italy and Germany, will experience a certain stagnation; only new markets, such as Turkey, Poland, Ukraine and Russia, will show important development.
In conclusion, the photovoltaic market shows a continuous growth that will need new and cheaper systems to test the performance of new PV devices.
3. Sun Simulators
Different Sun simulators are commercially available for artificial weathering tests or design qualification tests, though the characteristic factors for different wavelength ranges of the light source are not yet indicated in relation to a “reference Sun” [
9]. Only Sun simulators employed for PV testing must have certain characteristics regarding spectra. In fact, according to the IEC, the solar simulator for PV testing is classified on the basis of the irradiance guaranteed within specific ranges of wavelengths.
It is known that some errors in the measurement of PV devices can be made, since there is a mismatch in the spectral irradiance between a “reference Sun” and natural sunlight [
10,
11]. Therefore, more differences between the employed spectra and the reference spectra make the quality and precision of PV performance measurements worse. Solar simulators can employ steady-state or flash lamps and different types of light sources, such as xenon lamps, metal halide lamps or LED. In particular, solar simulators are able to fit irradiance distribution to a reference one using a combination of lamps and filters (AM 1.5) and are classified by the grade of fitting. Furthermore, another two parameters are employed to classify Sun simulators, such as the uniformity and the stationarity of the light beam. In the stationary systems, the light uniformity can be closely related with the number of lamps and the respective photometric solids. Generally, an increase of the spring numbers corresponds to an increase of irradiance uniformity. The temporal stability (stationary) of the illumination is instead linked to the absence of fluctuations in the voltage of the supply source; a good feeding system ensures a negligible degree of instability. The main disadvantage of the use of a stationary system is the heating of the sample under the light during the test; this changes the environmental conditions (mainly temperature) of measurements [
12].
The functionality of a Sun simulator with a flash lamp depends on the synchronization between the flash and the acquisition system. This need arises from the fact that the light pulse is characterized by a specific decay kinetics. In the case of a purely exponential decay, a minimum uncertainty for the acquisition delay involves a significant error on the determination of the performance of the photovoltaic device; therefore, it is necessary to repeat the measurement several times and average the results in order to minimize the error. However, one of the main advantages of pulsed solar simulators is the absence of the temperature increase on the tested sample.
In consideration of this, the manufacturing of a Sun simulator depends on the choice of lamp.
The majority of solar simulators employ stationary lamps, as they ensure the high uniformity and stability of the light radiation. Applying correction coefficients to the measures solves the problem of temperature. However, such simulators have higher costs due to the high number of light sources and filters. The cost of a Sun simulator can reach $130,000–150,000. In particular, from an economical point of view, the filter is one of the most expensive components (other expensive components are the lamp and the acquisition system). Several articles on solar filters and coatings for buildings (window application)s [
13,
14,
15,
16] or on filters for chemical, electronic and optical applications [
17,
18] can be found in the literature. On the contrary, relevant research works on AM 1.5 G filters for solar simulators are missing. Developing an innovative, low-cost filter for Sun simulators and, therefore, reducing the cost of illumination systems is the aim of the present research work.
4. Filters of Light Emission
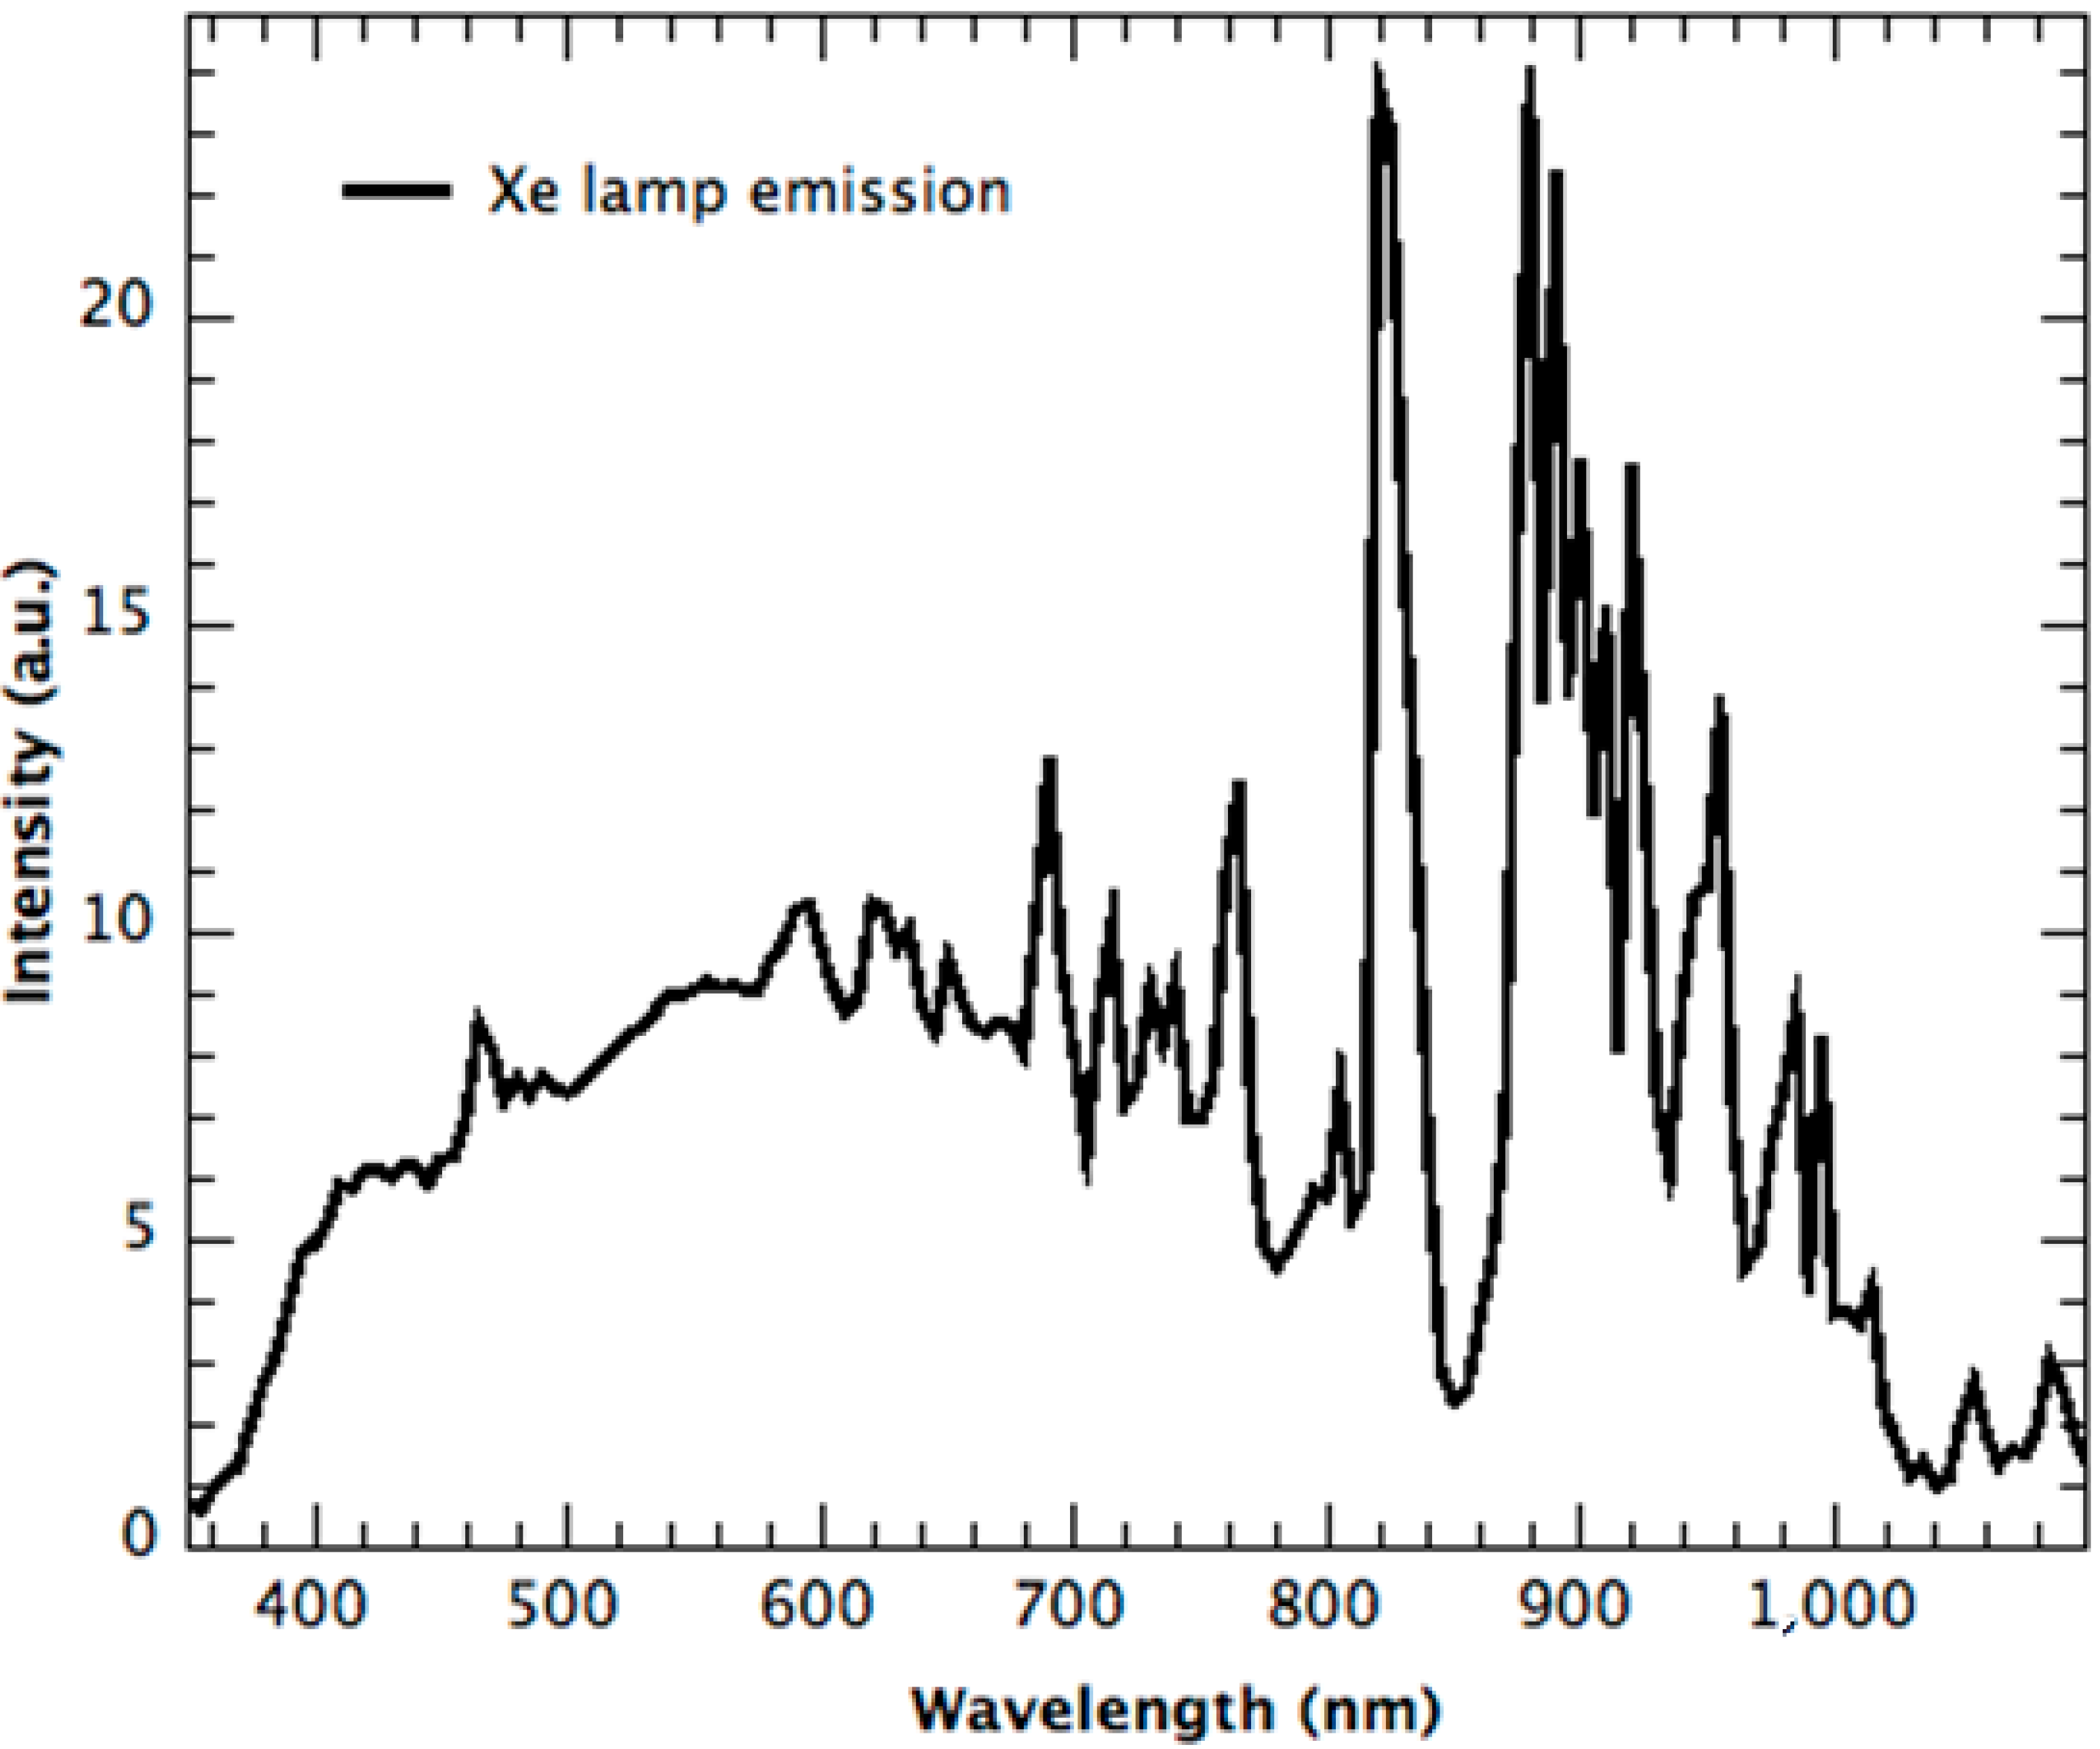
The quality and accuracy of pulsed Sun simulators depend on the performance of the light radiation source in terms of spatial uniformity, temporal stability and emission spectrum. The first two features can be modulated by a light propagation chamber design, while the light emission spectrum depends on the characteristics of the lamp and filter. The research has been carried out using the spectrum of a xenon lamp, because this devise is the most common system employed in Sun simulators. Therefore, the light emission data used for the analysis belongs to a xenon flash lamp, the spectral properties of which are provided by the hardware manufacturer (
Figure 1).
Figure 1.
Xenon lamp spectrum.
Figure 1.
Xenon lamp spectrum.
As shown in
Figure 1, the xenon lamp emission spectrum is continuous throughout the region between 350 and 1100 nm, with a large band centered at 550 nm and two strong bands at 820 and 880 nm wavelength.
Table 1, first column, shows the spectral match obtained from the ratio between the xenon lamp spectrum intensity percentage and the reference percentage required by IEC 60904-9 [
19].
Spectral match values are included between 0.58 and 1.98, and according to IEC 60904-9, they are compatible with only the worst class of irradiance distribution (C class).
A commercial air mass 1.5 G filter was introduced into an illumination cone in order to obtain a better class (B Class).
Table 1.
Spectral match calculations.
Table 1.
Spectral match calculations.
| Range (nm) | Lamp | Lamp + Filter | Lamp + Skin |
|---|
| Found % | Required % | Spectral Match | Found % | Required % | Spectral Match | Found % | Required % | Spectral Match |
|---|
| 400–500 | 10.7 | 18.5 | 0.58 | 15.6 | 18.5 | 0.84 | 14.3 | 18.5 | 0.77 |
| 500–600 | 14.4 | 20.1 | 0.72 | 21.7 | 20.1 | 1.07 | 21.2 | 20.1 | 1.06 |
| 600–700 | 15.2 | 18.3 | 0.83 | 21.0 | 18.3 | 1.14 | 19.1 | 18.3 | 1.04 |
| 700–800 | 12.2 | 14.8 | 0.82 | 18.0 | 14.8 | 1.22 | 12.0 | 14.8 | 0.81 |
| 800–900 | 24.2 | 12.2 | 1.98 | 13.2 | 12.2 | 1.08 | 18.1 | 12.2 | 1.49 |
| 900–1100 | 23.3 | 16.1 | 1.45 | 10.5 | 16.1 | 0.65 | 15.3 | 16.1 | 0.95 |
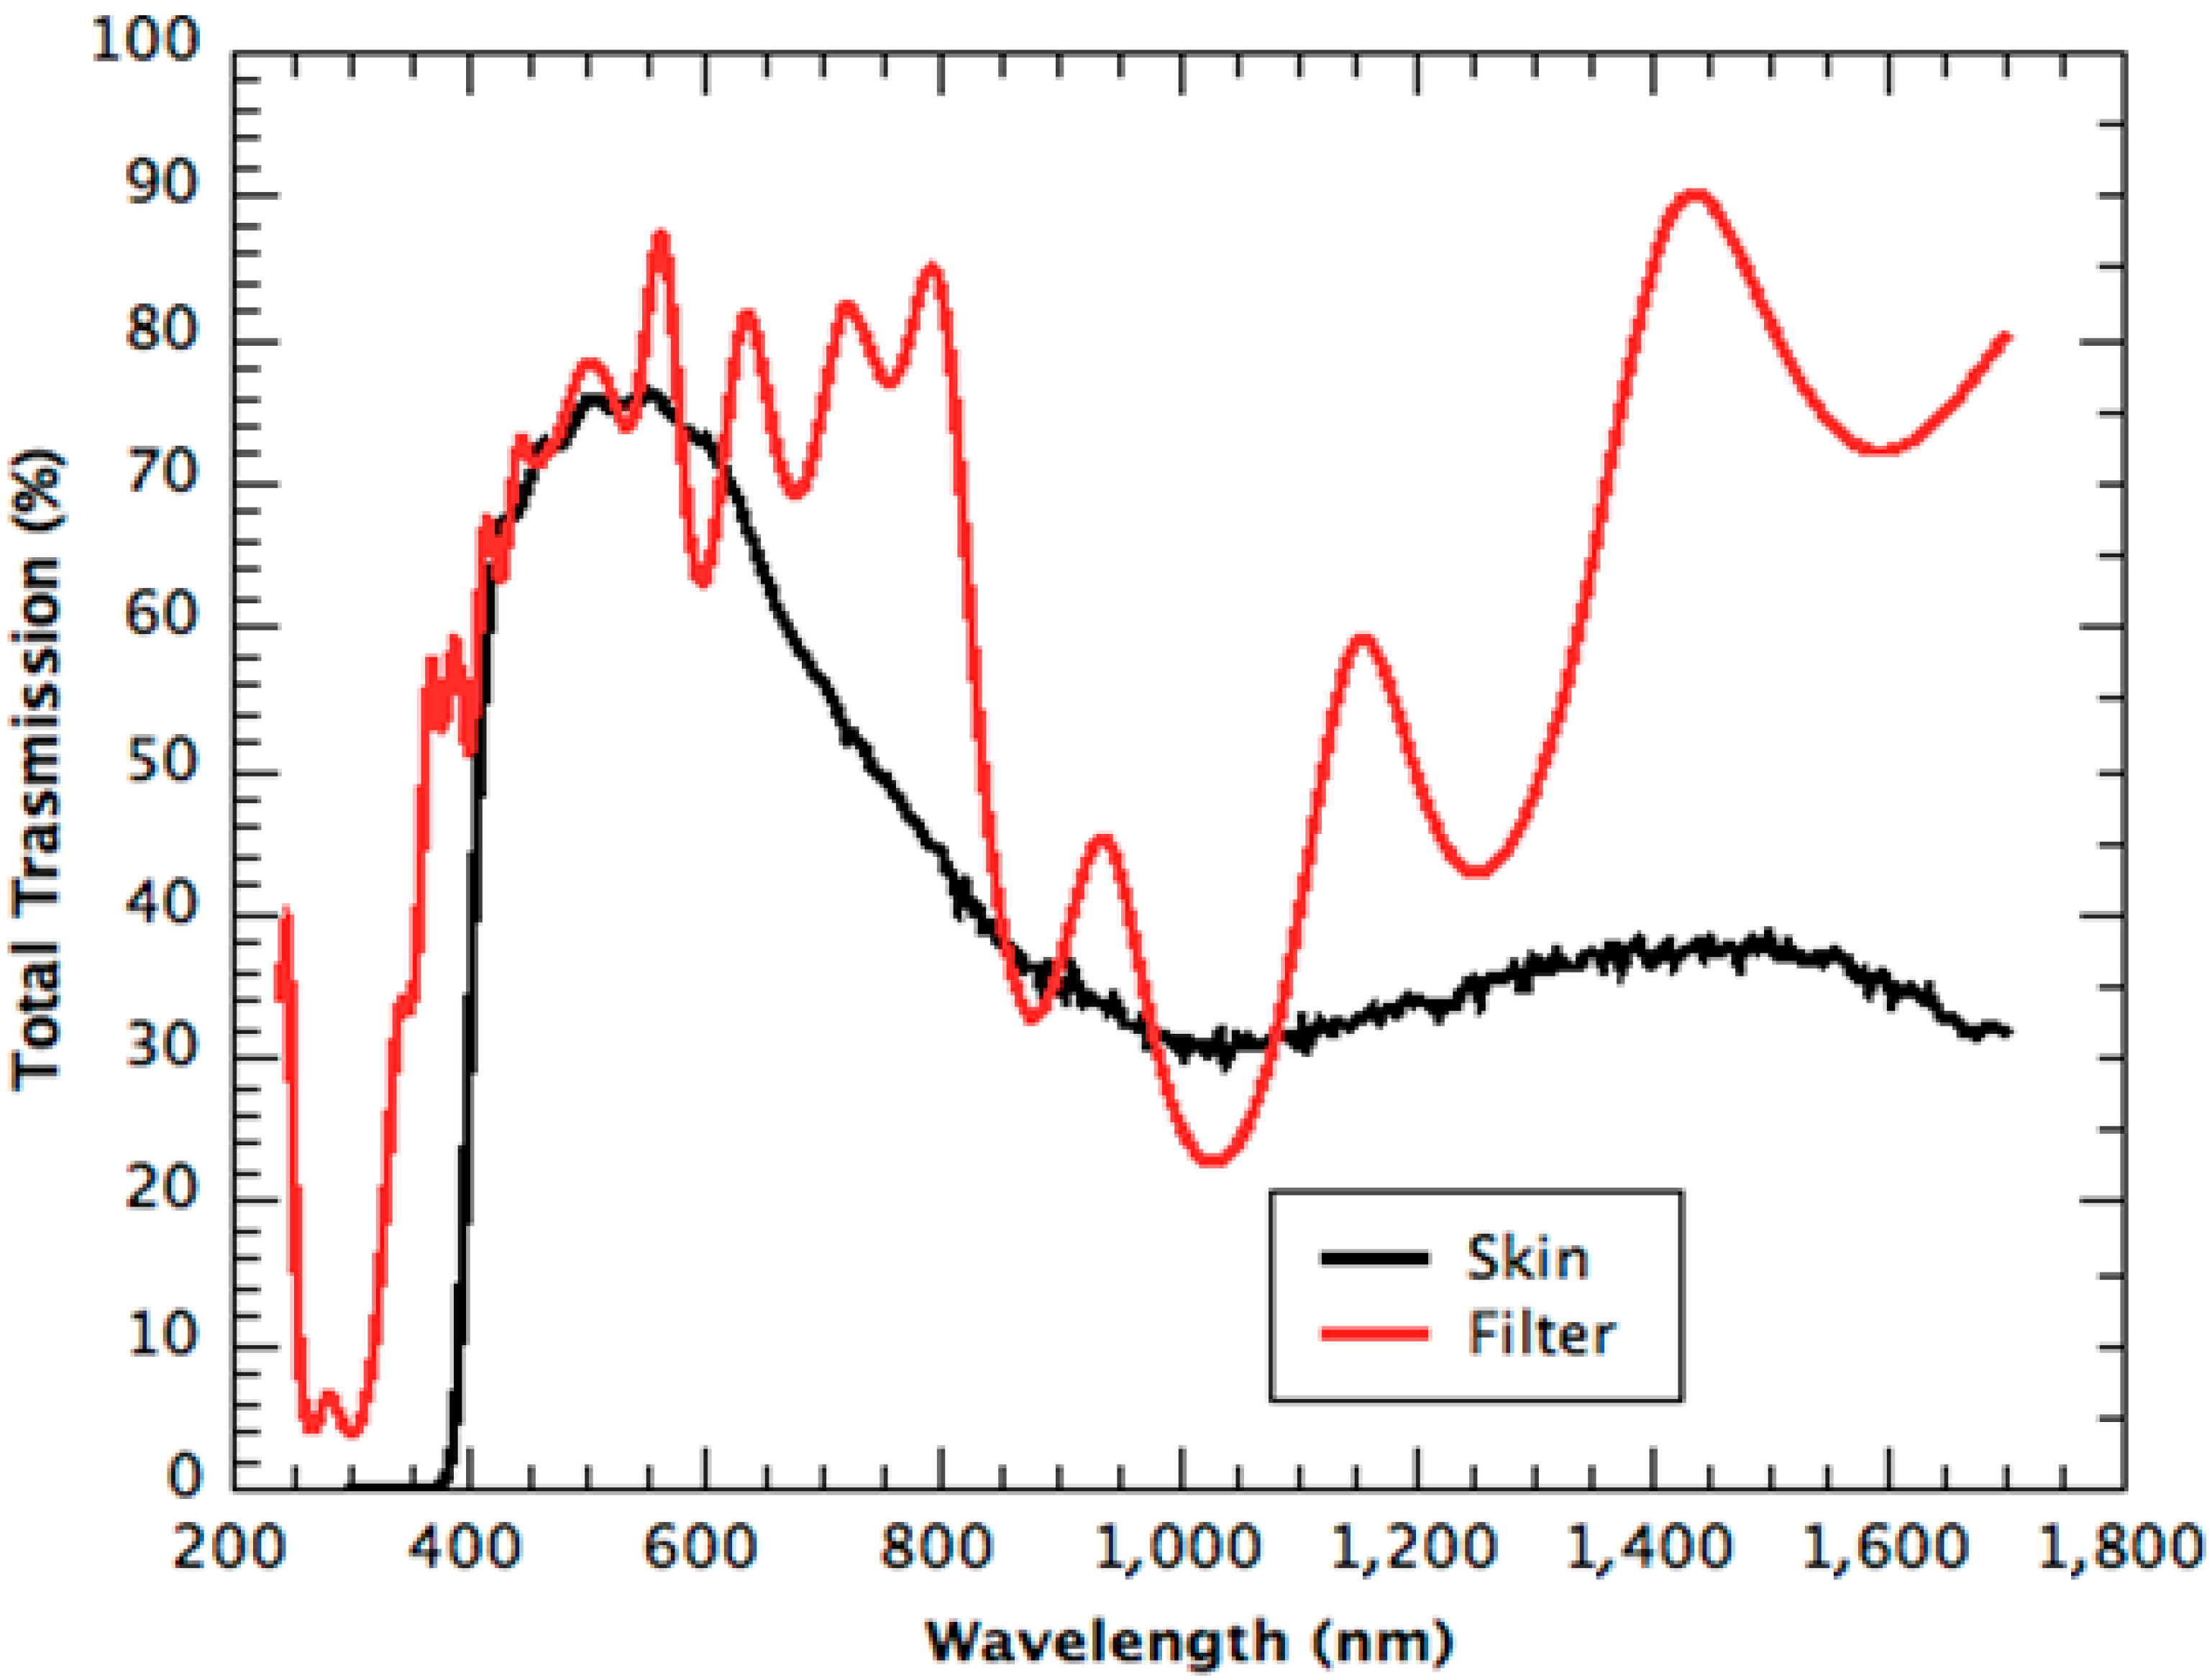
This system shows a good transmission coefficient (about 75%) up to 800 nm, after which the transmitted light decreases and increases again from 1,200 nm. The recorded transmission spectrum is presented in
Figure 2 (red line).
Figure 2.
Filter (red) and skin (black) total transmission spectra.
Figure 2.
Filter (red) and skin (black) total transmission spectra.
The coupling of the lamp with the filter showed the better compatibility of solar radiation with IEC, as shown in
Table 1, second column (lamp + filter). In this case, a 0.65 spectral match value is found, which is compatible with a Class B solar simulator.
Filter use does not allow the achievement of the class of spectral coherence (Class A); furthermore filters are expensive and very small, i.e., the square filter maximum size is 7 × 7 cm2, and it costs more than 2000 US Dollars.
Therefore, two alternatives have been analyzed to optimize light emission. First of all, an optical compatible skin was studied in order to overcome the geometric difficulties and to reduce its cost (about €50 per m2).
The transmission skin spectrum is shown in black in
Figure 2; comparing the filter with the skin, it is possible to see a good overlap at low wavelengths up to 600 nm, whereas the energy difference becomes too wide for the 800–900 nm range, as
Table 1 points out. Despite cost advantages, there is no significant spectral match improvement, as in this case, a “bad B” class is obtained.
Skin can be used with or without support (such as a glass surface) in the function of a solar simulator emission device (pulsed or stationary light source); for example, if a pulsed source is employed, low temperatures are achieved, and for this reason, no support is necessary. Contrarily, stationary devices require supported skin in order to avoid a high temperature, causing the plastic material to soften.
The most important support characteristic have to be the high transparency between 400 and 1100 nm in order to maintain skin absorbance. Such features are typically made of quartz [
20], but its high cost and the difficulty in obtaining a large sheet make its application undesirable. Then, a market survey was carried out in order to research an economical and limitless dimensions solution.
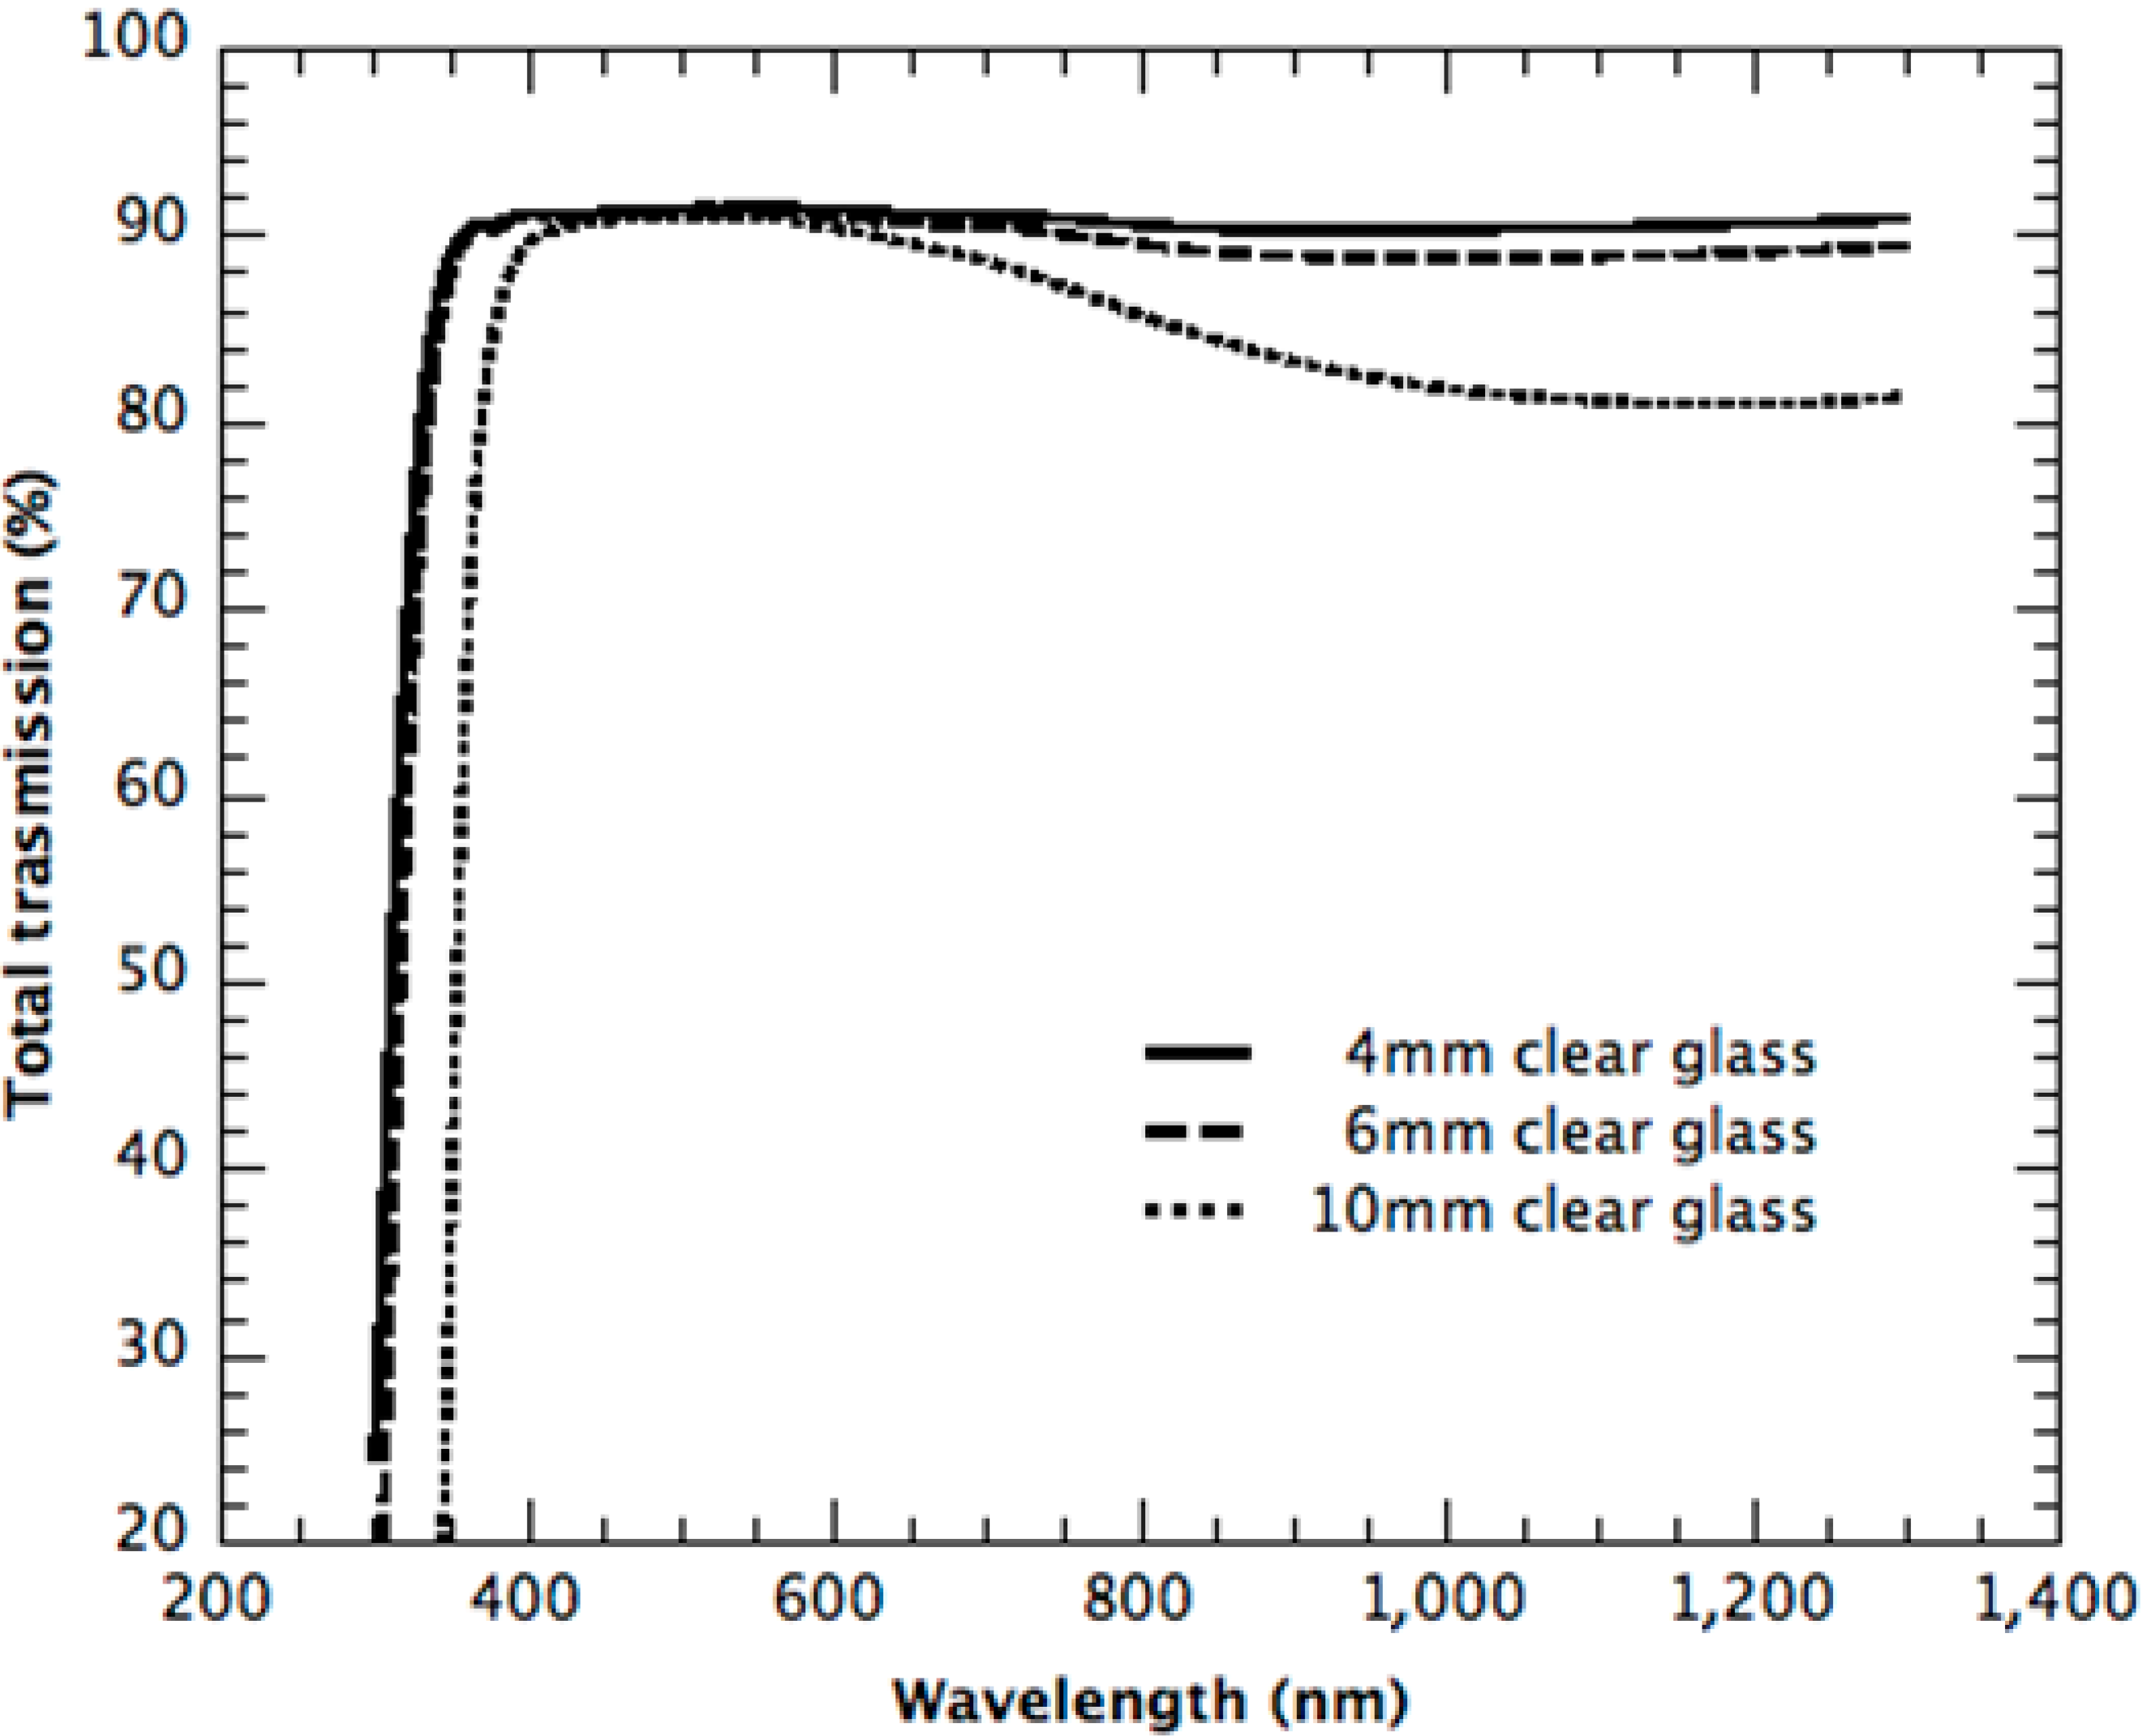
A “clear glass” can be a solution. Three commercial thicknesses were considered, but as can be seen in
Figure 3, when thickness increases, the total transmission decreases above 600 nm.
Figure 3.
Transmission percentage of a clear glass for different thickness.
Figure 3.
Transmission percentage of a clear glass for different thickness.
5. Alternative Solutions Proposed
In order to overcome such difficulties, research focused on two different solutions based on finding an organic molecular/polymer system (or more) that is able to correct incident light.
5.1. First Solution
The first solution intends to improve the skin + clear glass filtering capacity.
The weakness of glass-skin solution is the poor absorption at 800–900 nm. For this reason, it was decided to increase the absorbance value in this range through specific molecular/polymer system absorption. This system must have the following characteristics: film-forming ability, light stability, absorbance in a small portion of the electromagnetic spectrum and solubility in low-boiling-point solvents.
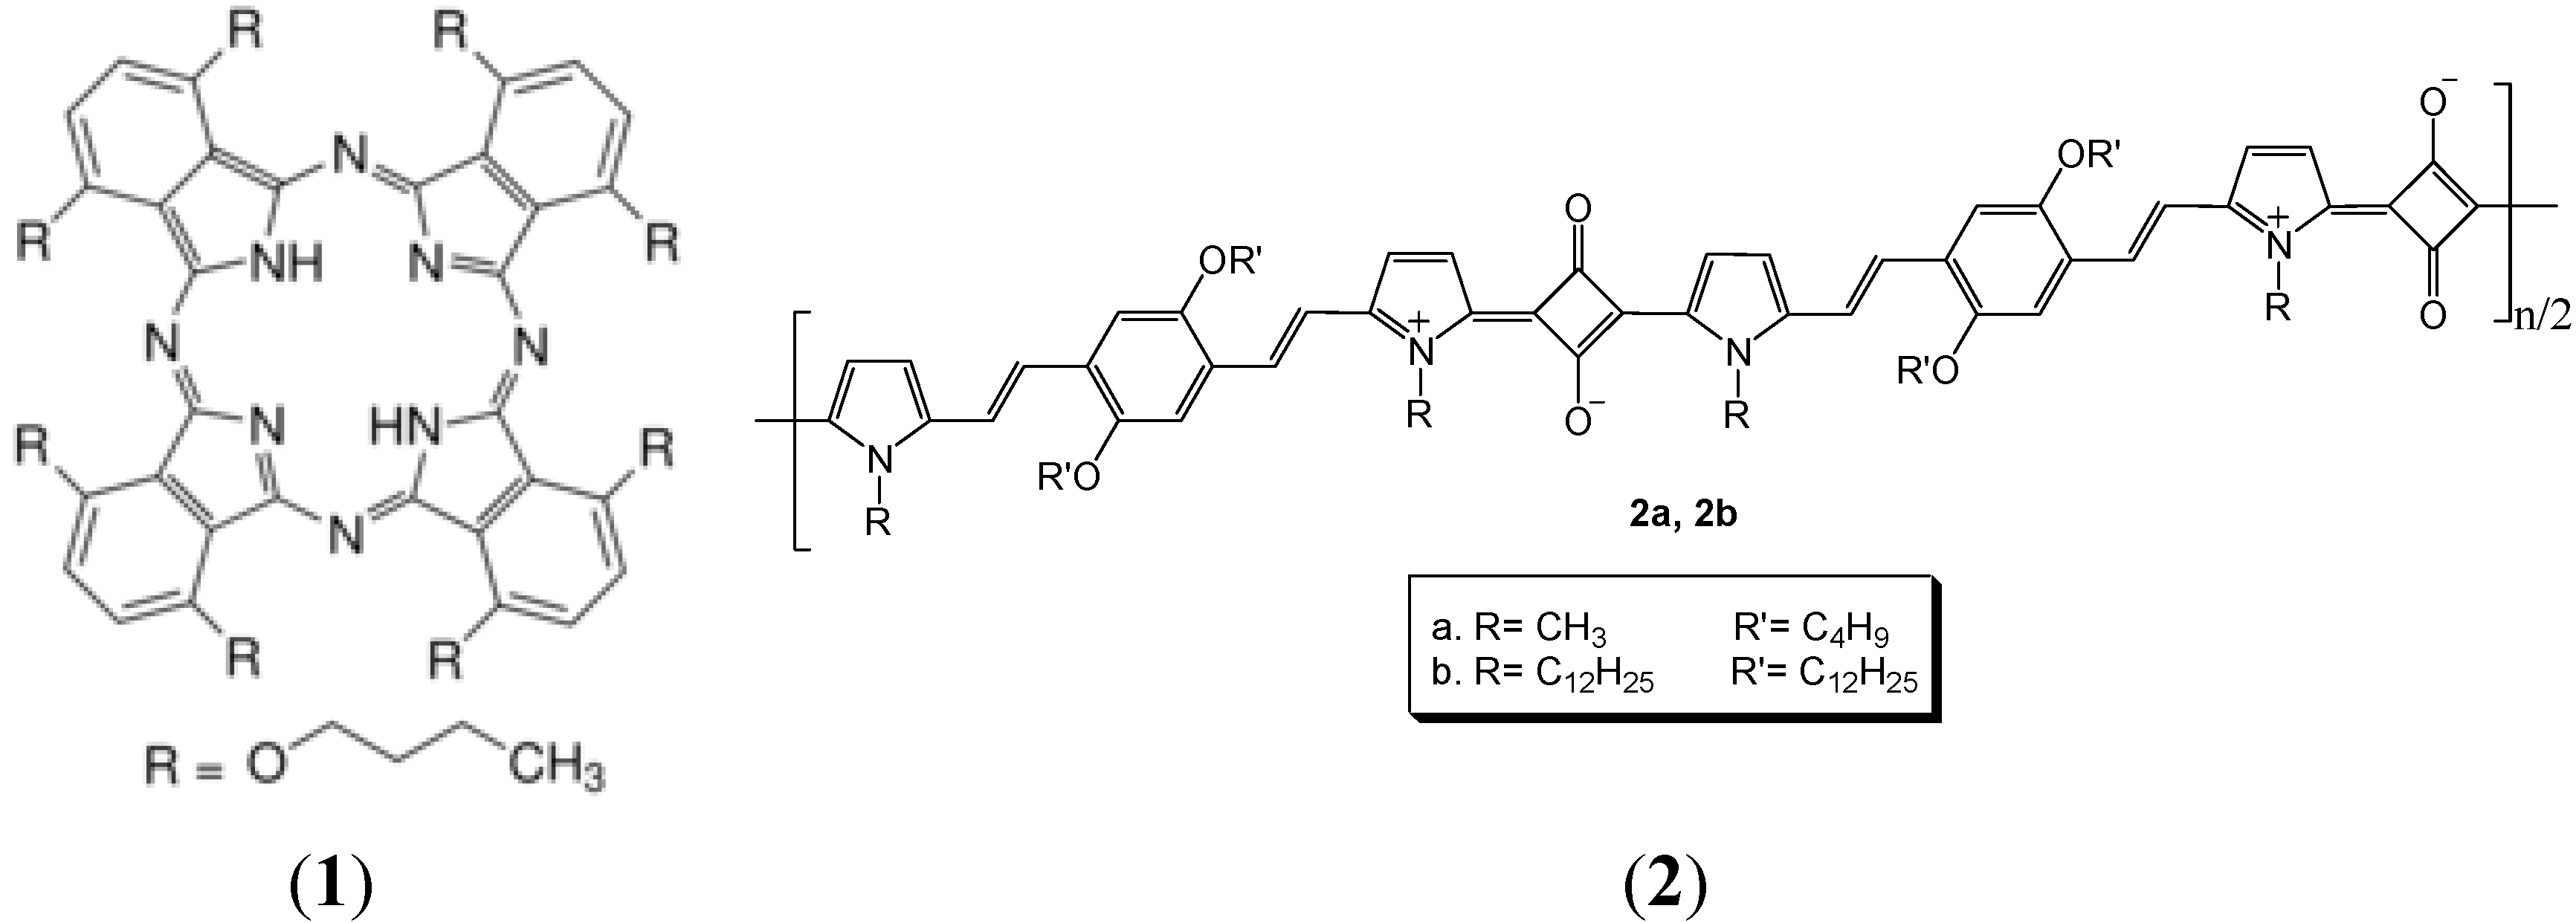
A corrective effect was simulated with different pristine molecules, but without good results. Working devices have only been obtained with two absorbents mixture: 1,4,8,11,15,18,22,25-octabutoxy-29H,31H-phthalocyanine (here called
1) and a polysquaraine (
2), whose chemical structures are reported in
Figure 4. Both species respect all of the above conditions [
21,
22,
23,
24].
Figure 4.
Chemical structures of 1 and 2.
Figure 4.
Chemical structures of 1 and 2.
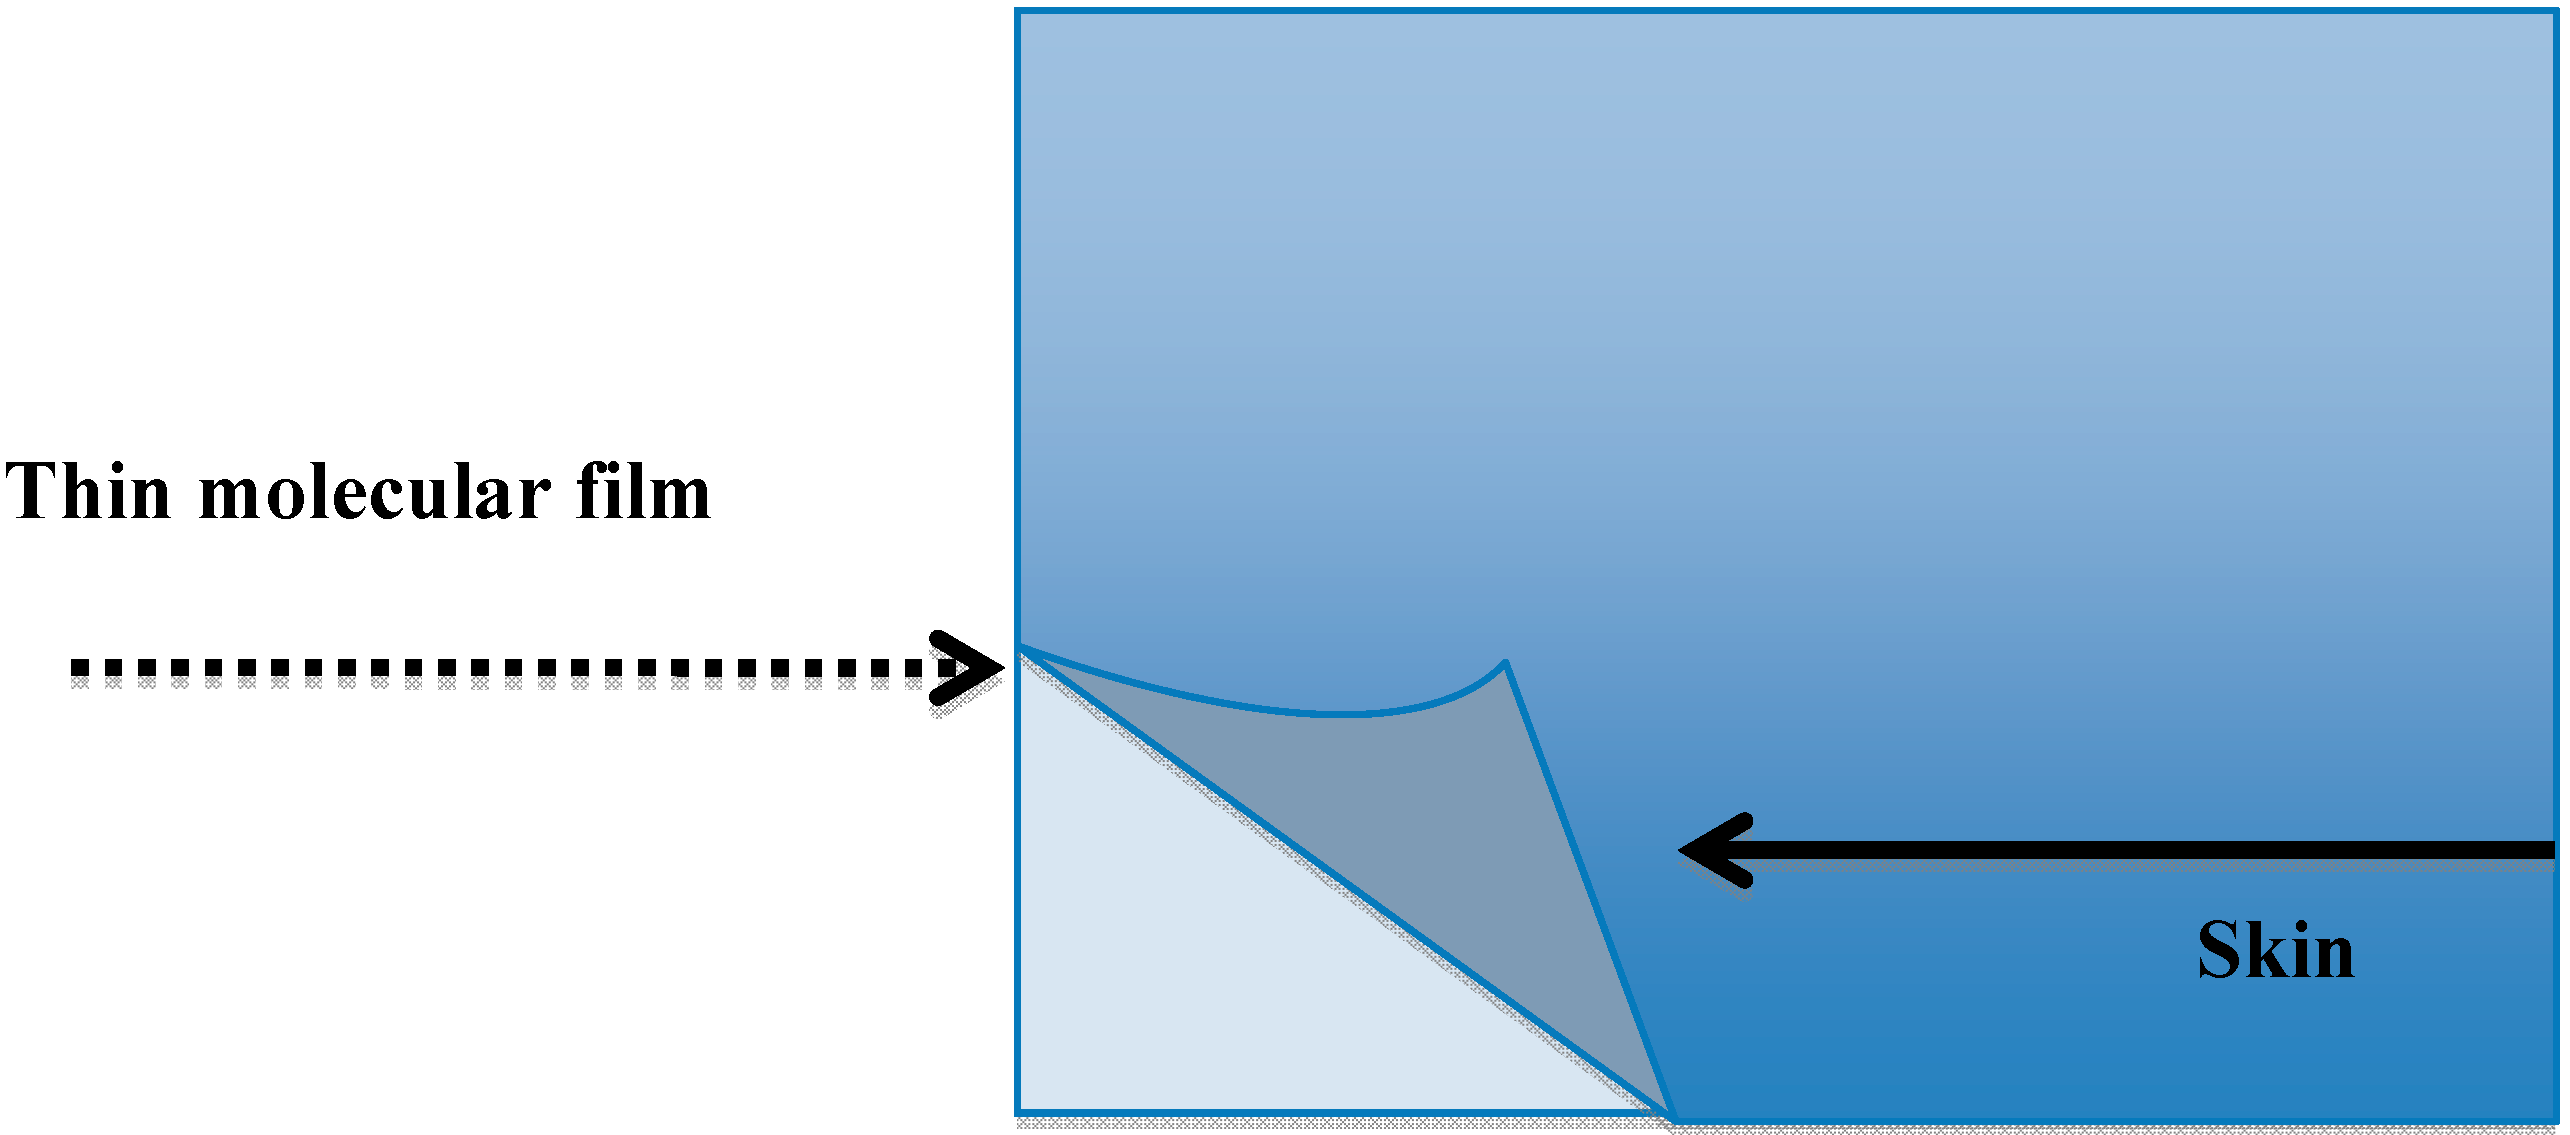
In order to create a filtering system, the skin was directly linked to a clear glass coupling with a two-molecule mixture thin film on opposite sides, as shown in
Figure 5.
Figure 5.
Clear glass covered with the skin and thin molecular film.
Figure 5.
Clear glass covered with the skin and thin molecular film.
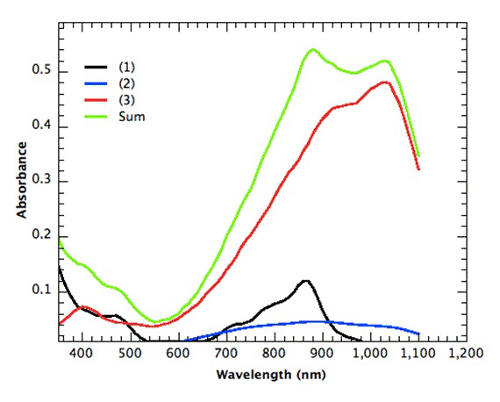
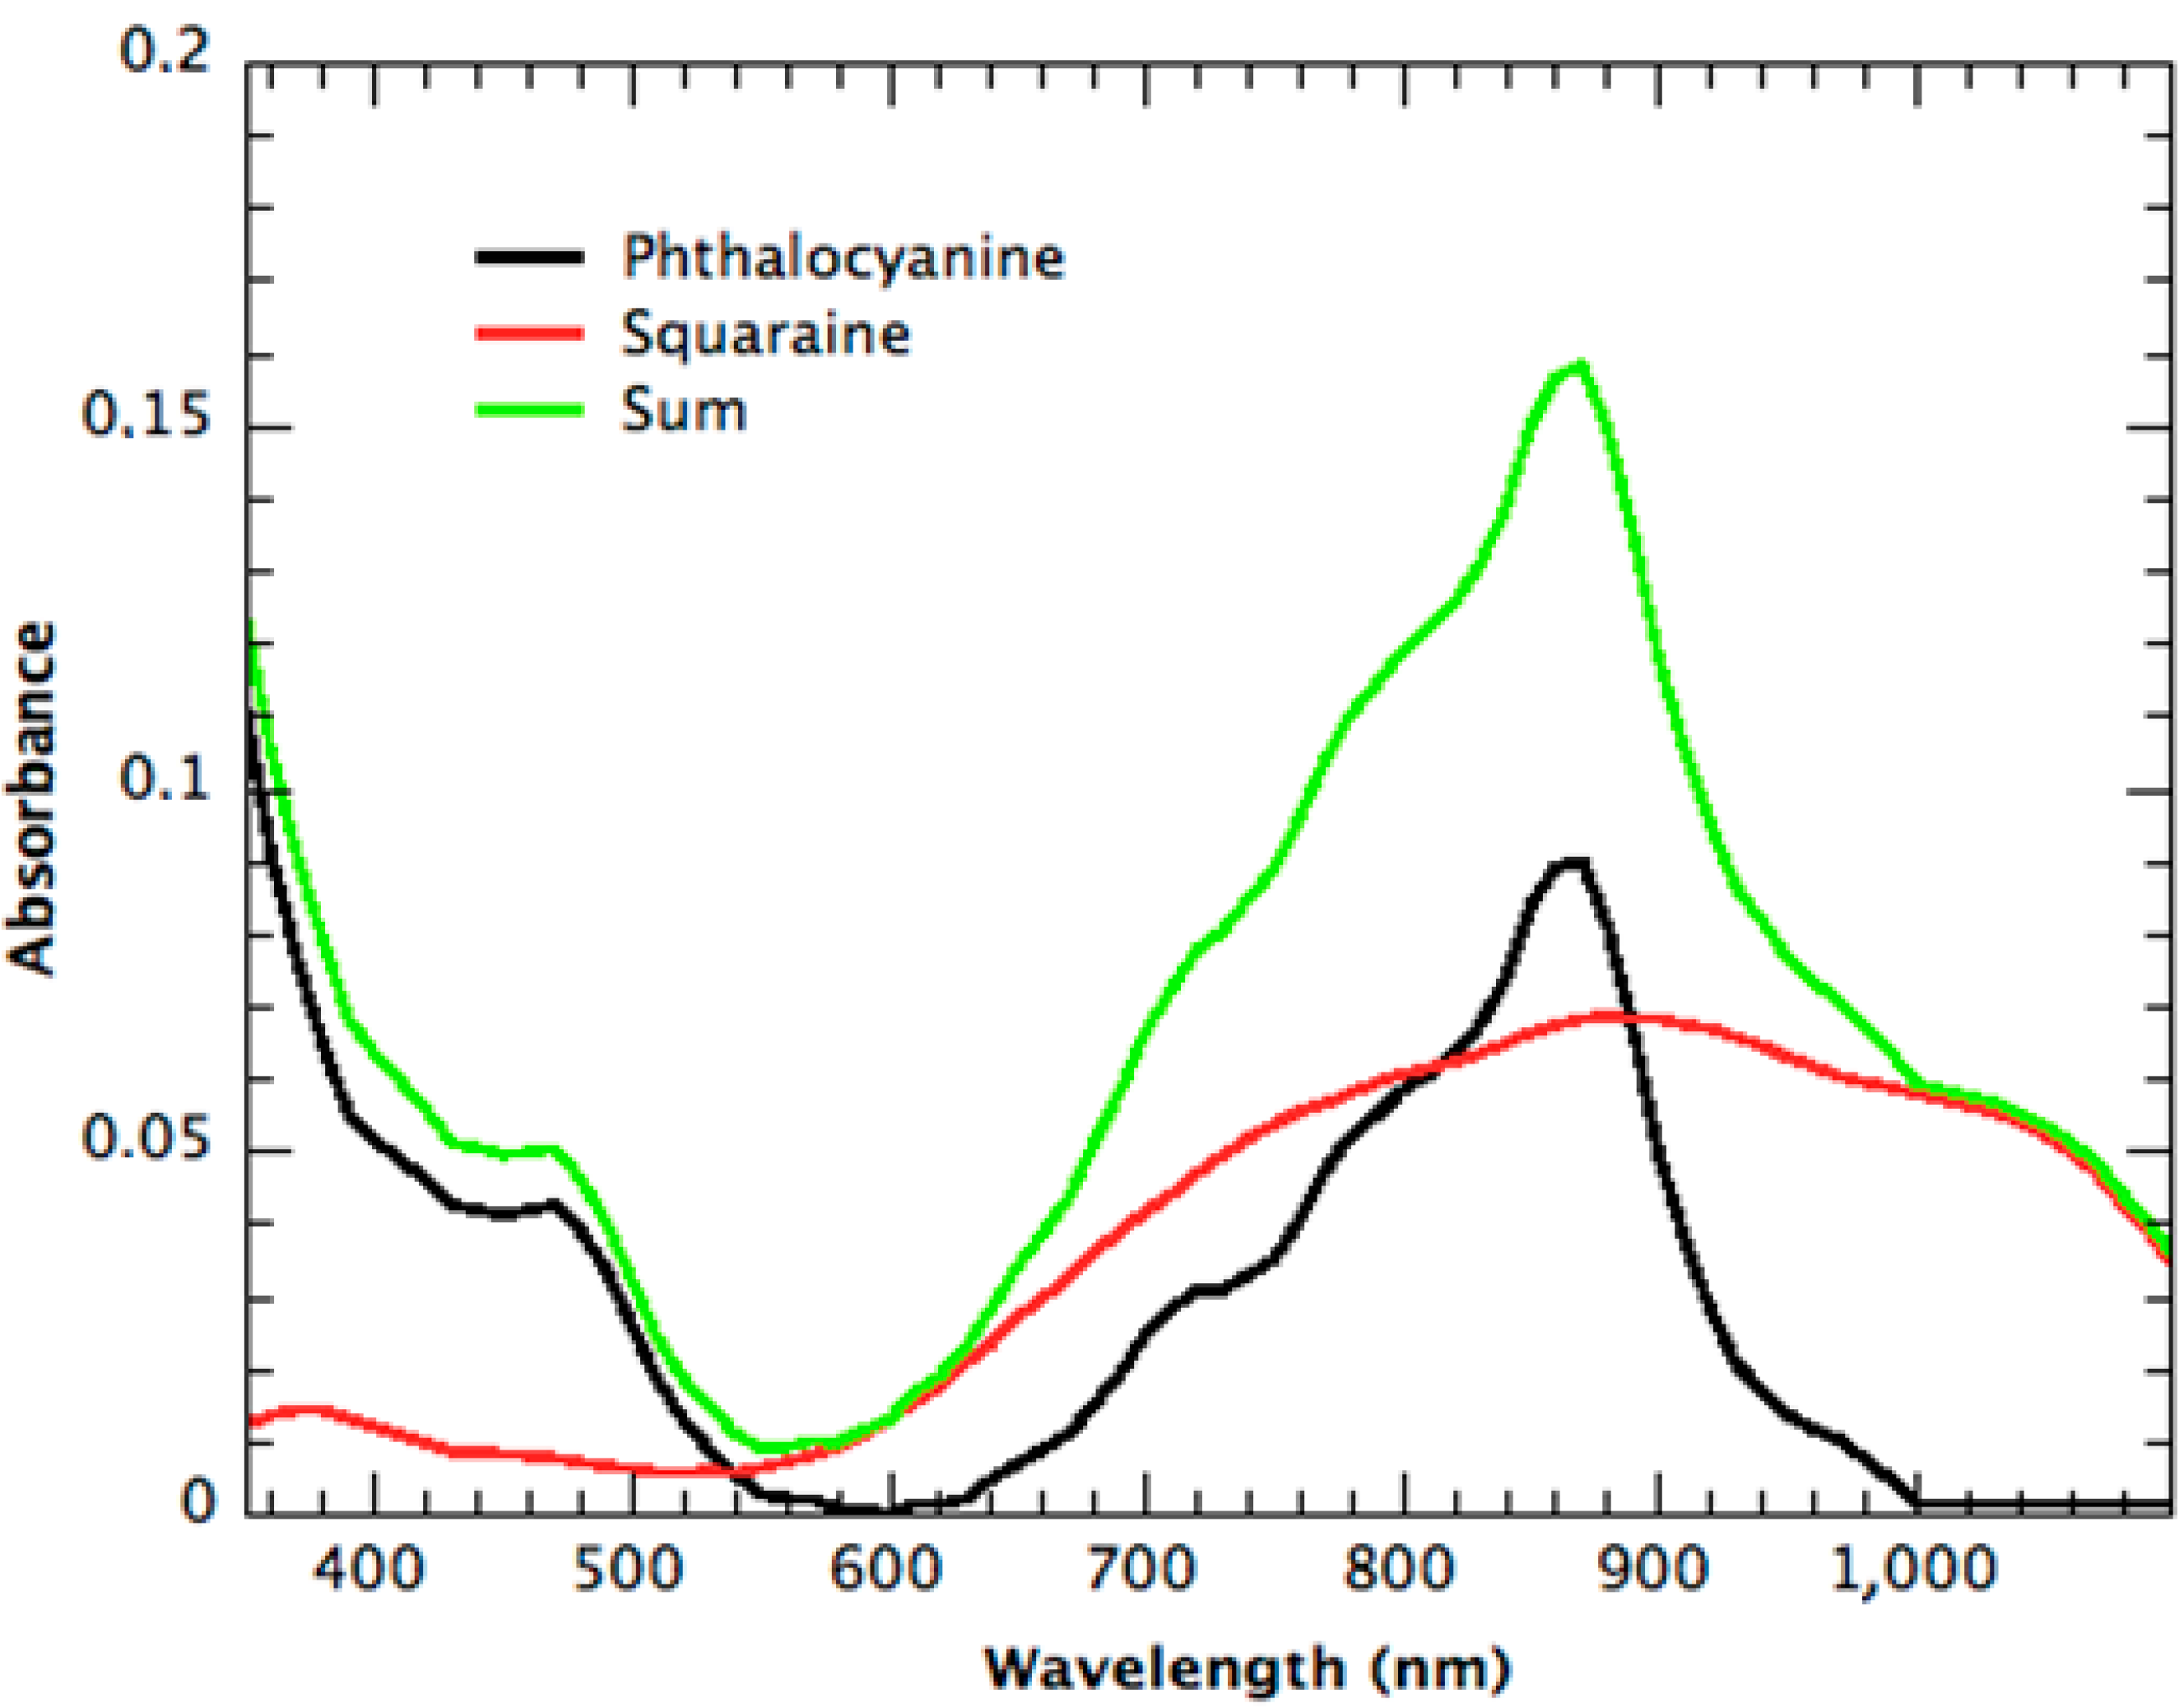
The best simulation was obtained with the same film absorbance mixture at 800 nm; the final absorption spectrum can be approximated as the sum of individual compounds’ spectra (
Figure 6).
Figure 6.
Phthalocyanine, Squaraine and sum of the thin films’ absorption spectra.
Figure 6.
Phthalocyanine, Squaraine and sum of the thin films’ absorption spectra.
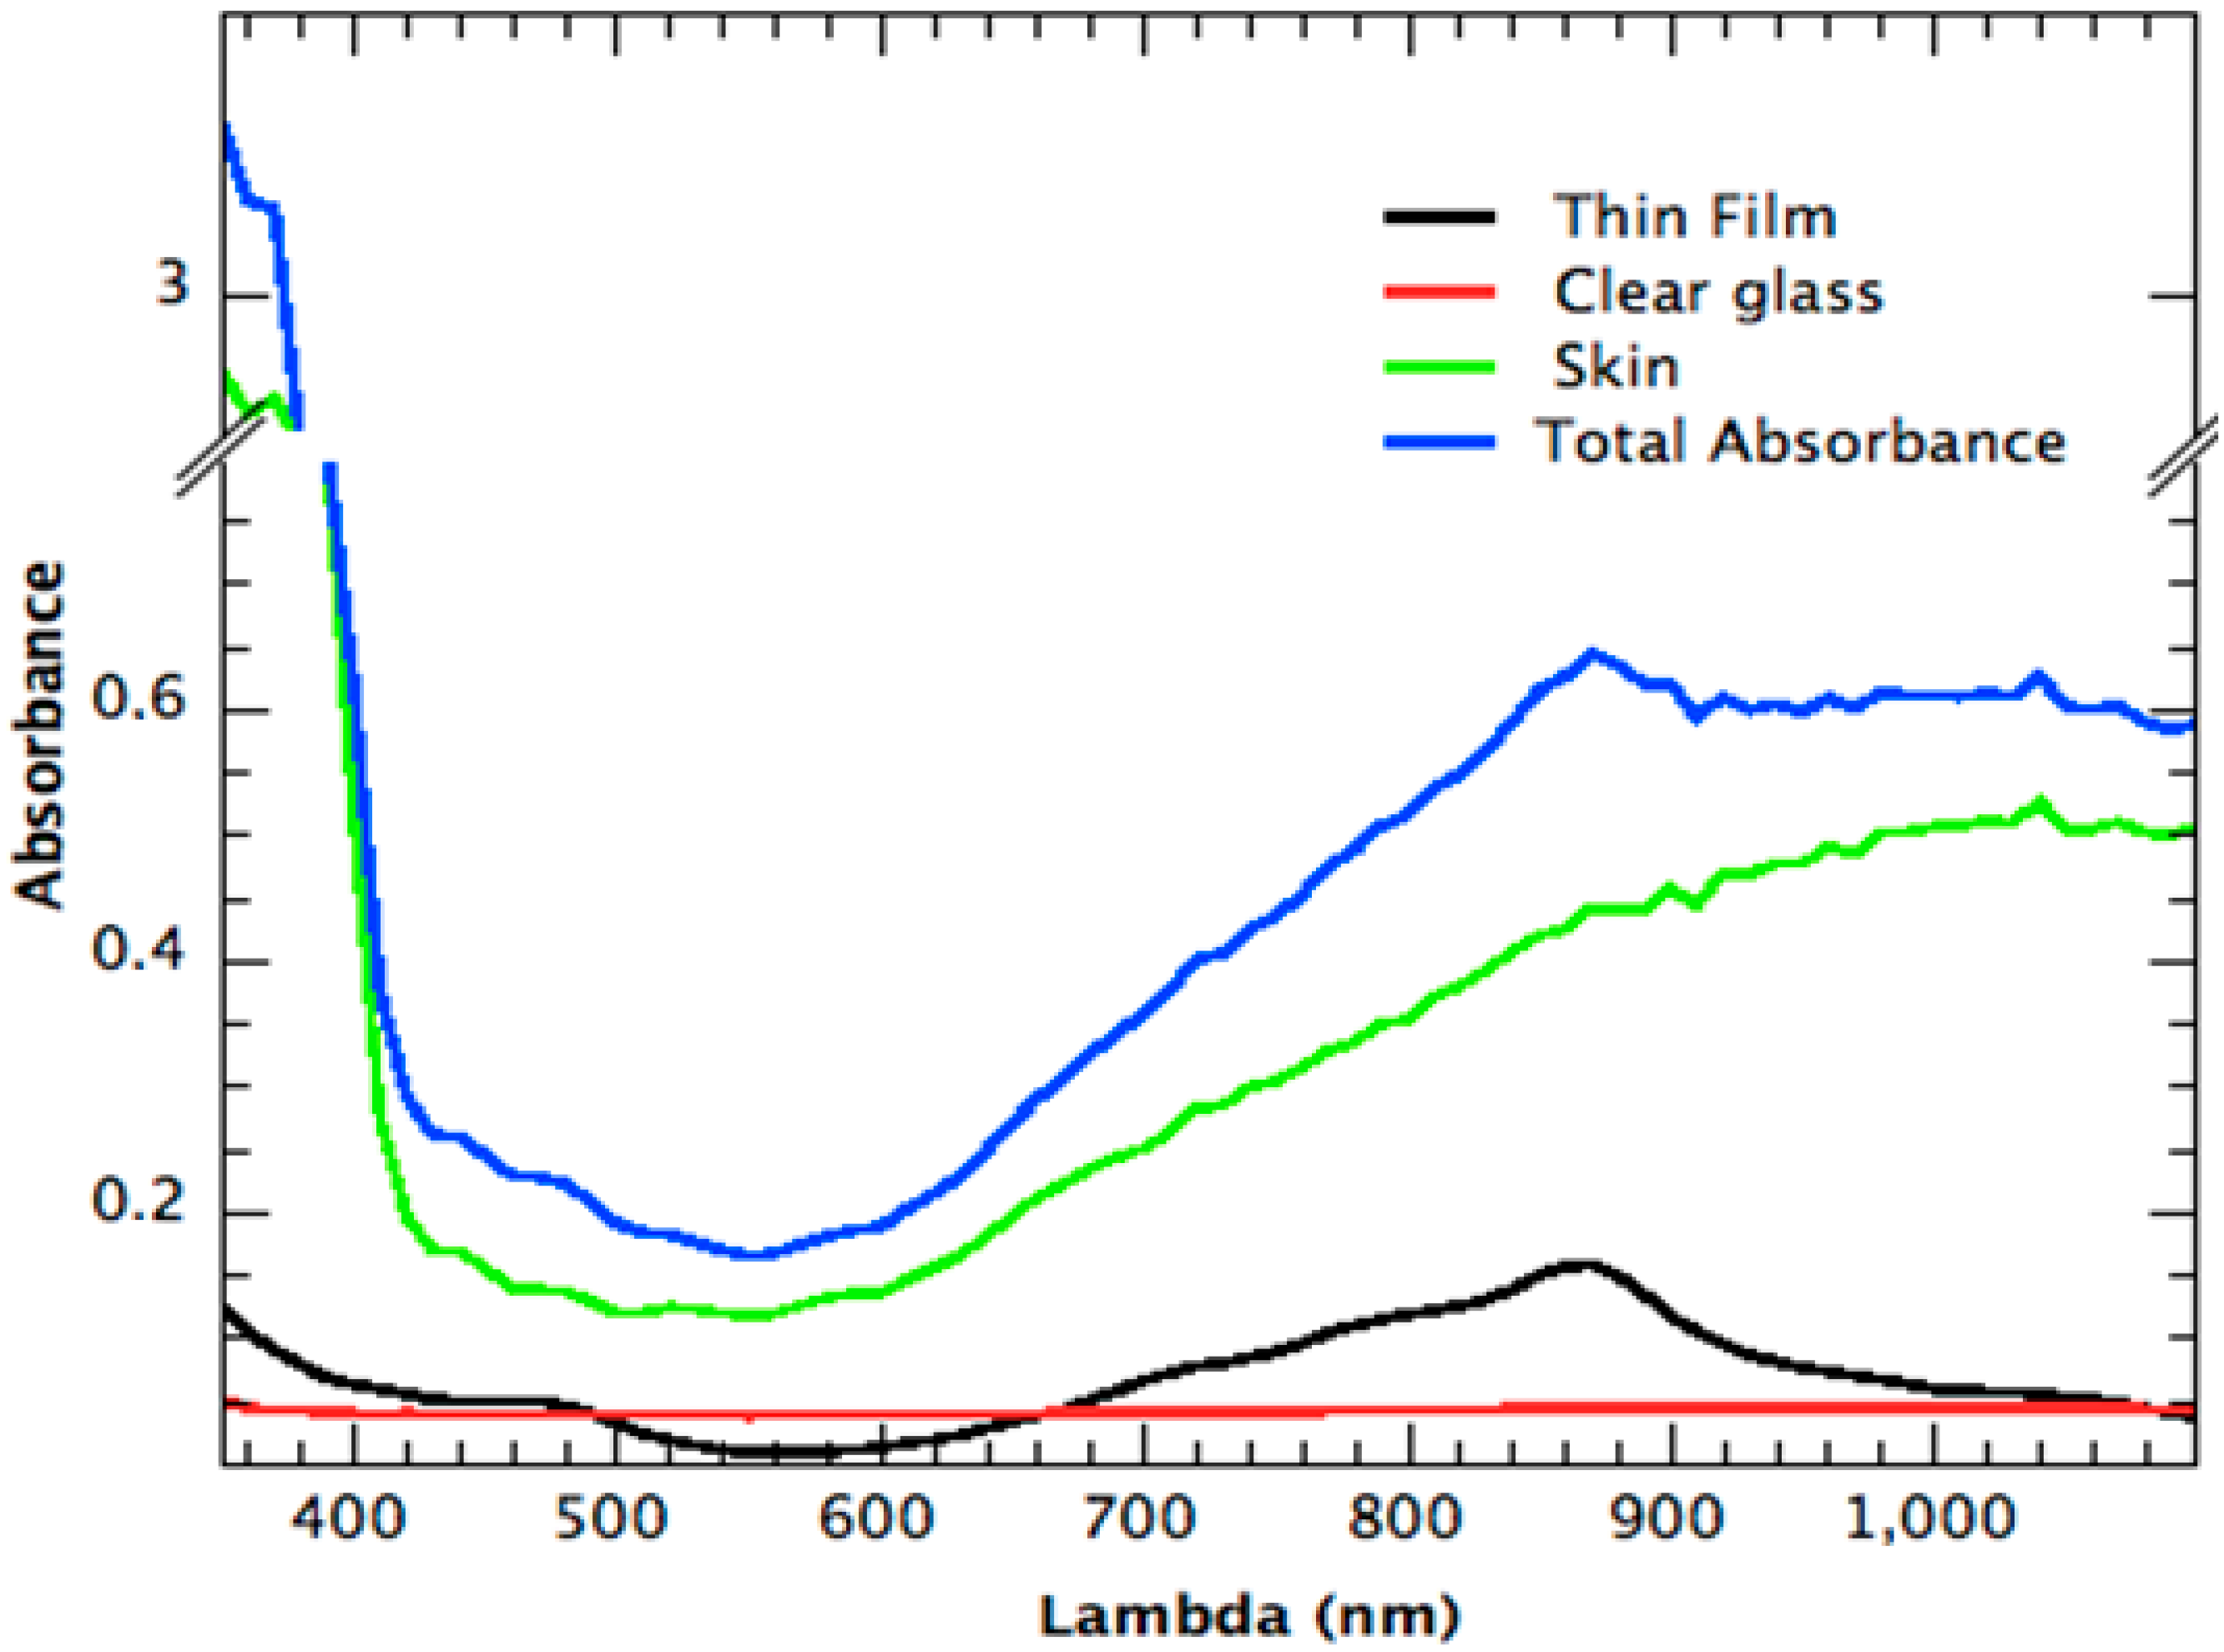
In order to predict the final emission spectrum necessary for spectral match calculation, both the total theoretical absorbance (
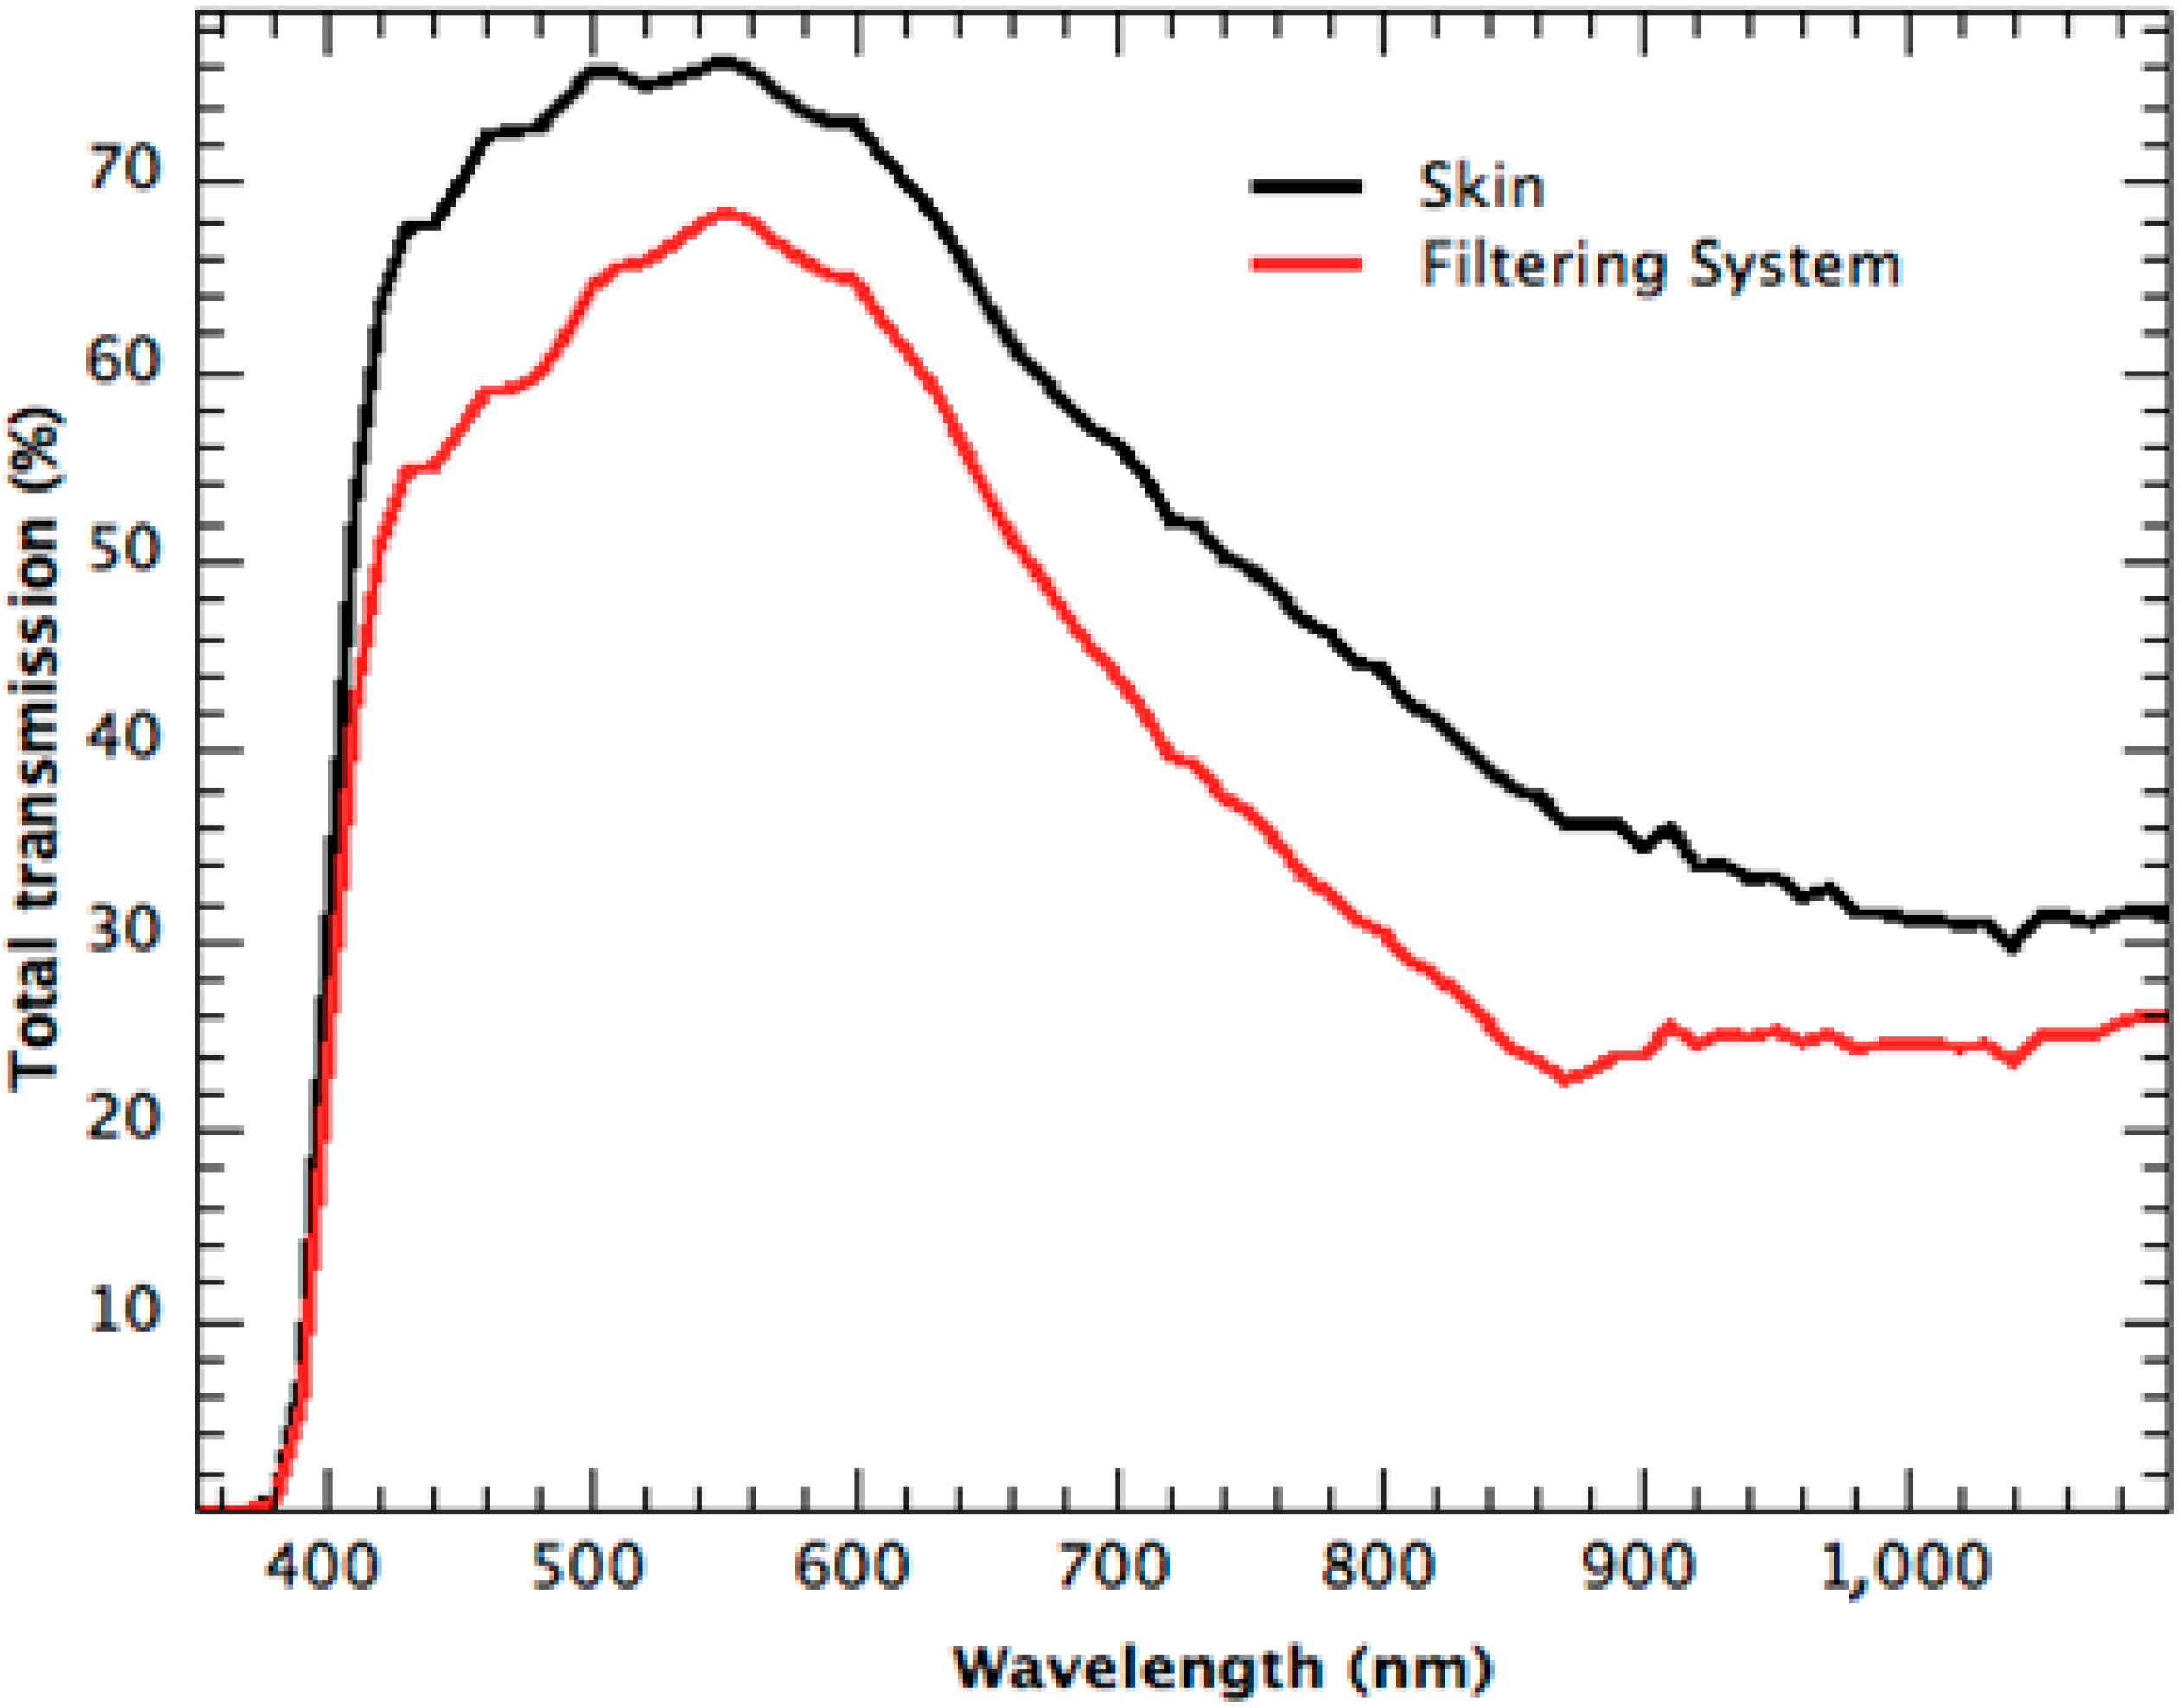
Figure 7) of the filtering system (glass + skin + mixture thin film) and the total transmission spectrum (
Figure 8) were evaluated.
Figure 7.
Clear glass, skin, thin film and total (theoretical) absorption spectra.
Figure 7.
Clear glass, skin, thin film and total (theoretical) absorption spectra.
Figure 8.
Skin and filtering system total transmission spectra.
Figure 8.
Skin and filtering system total transmission spectra.
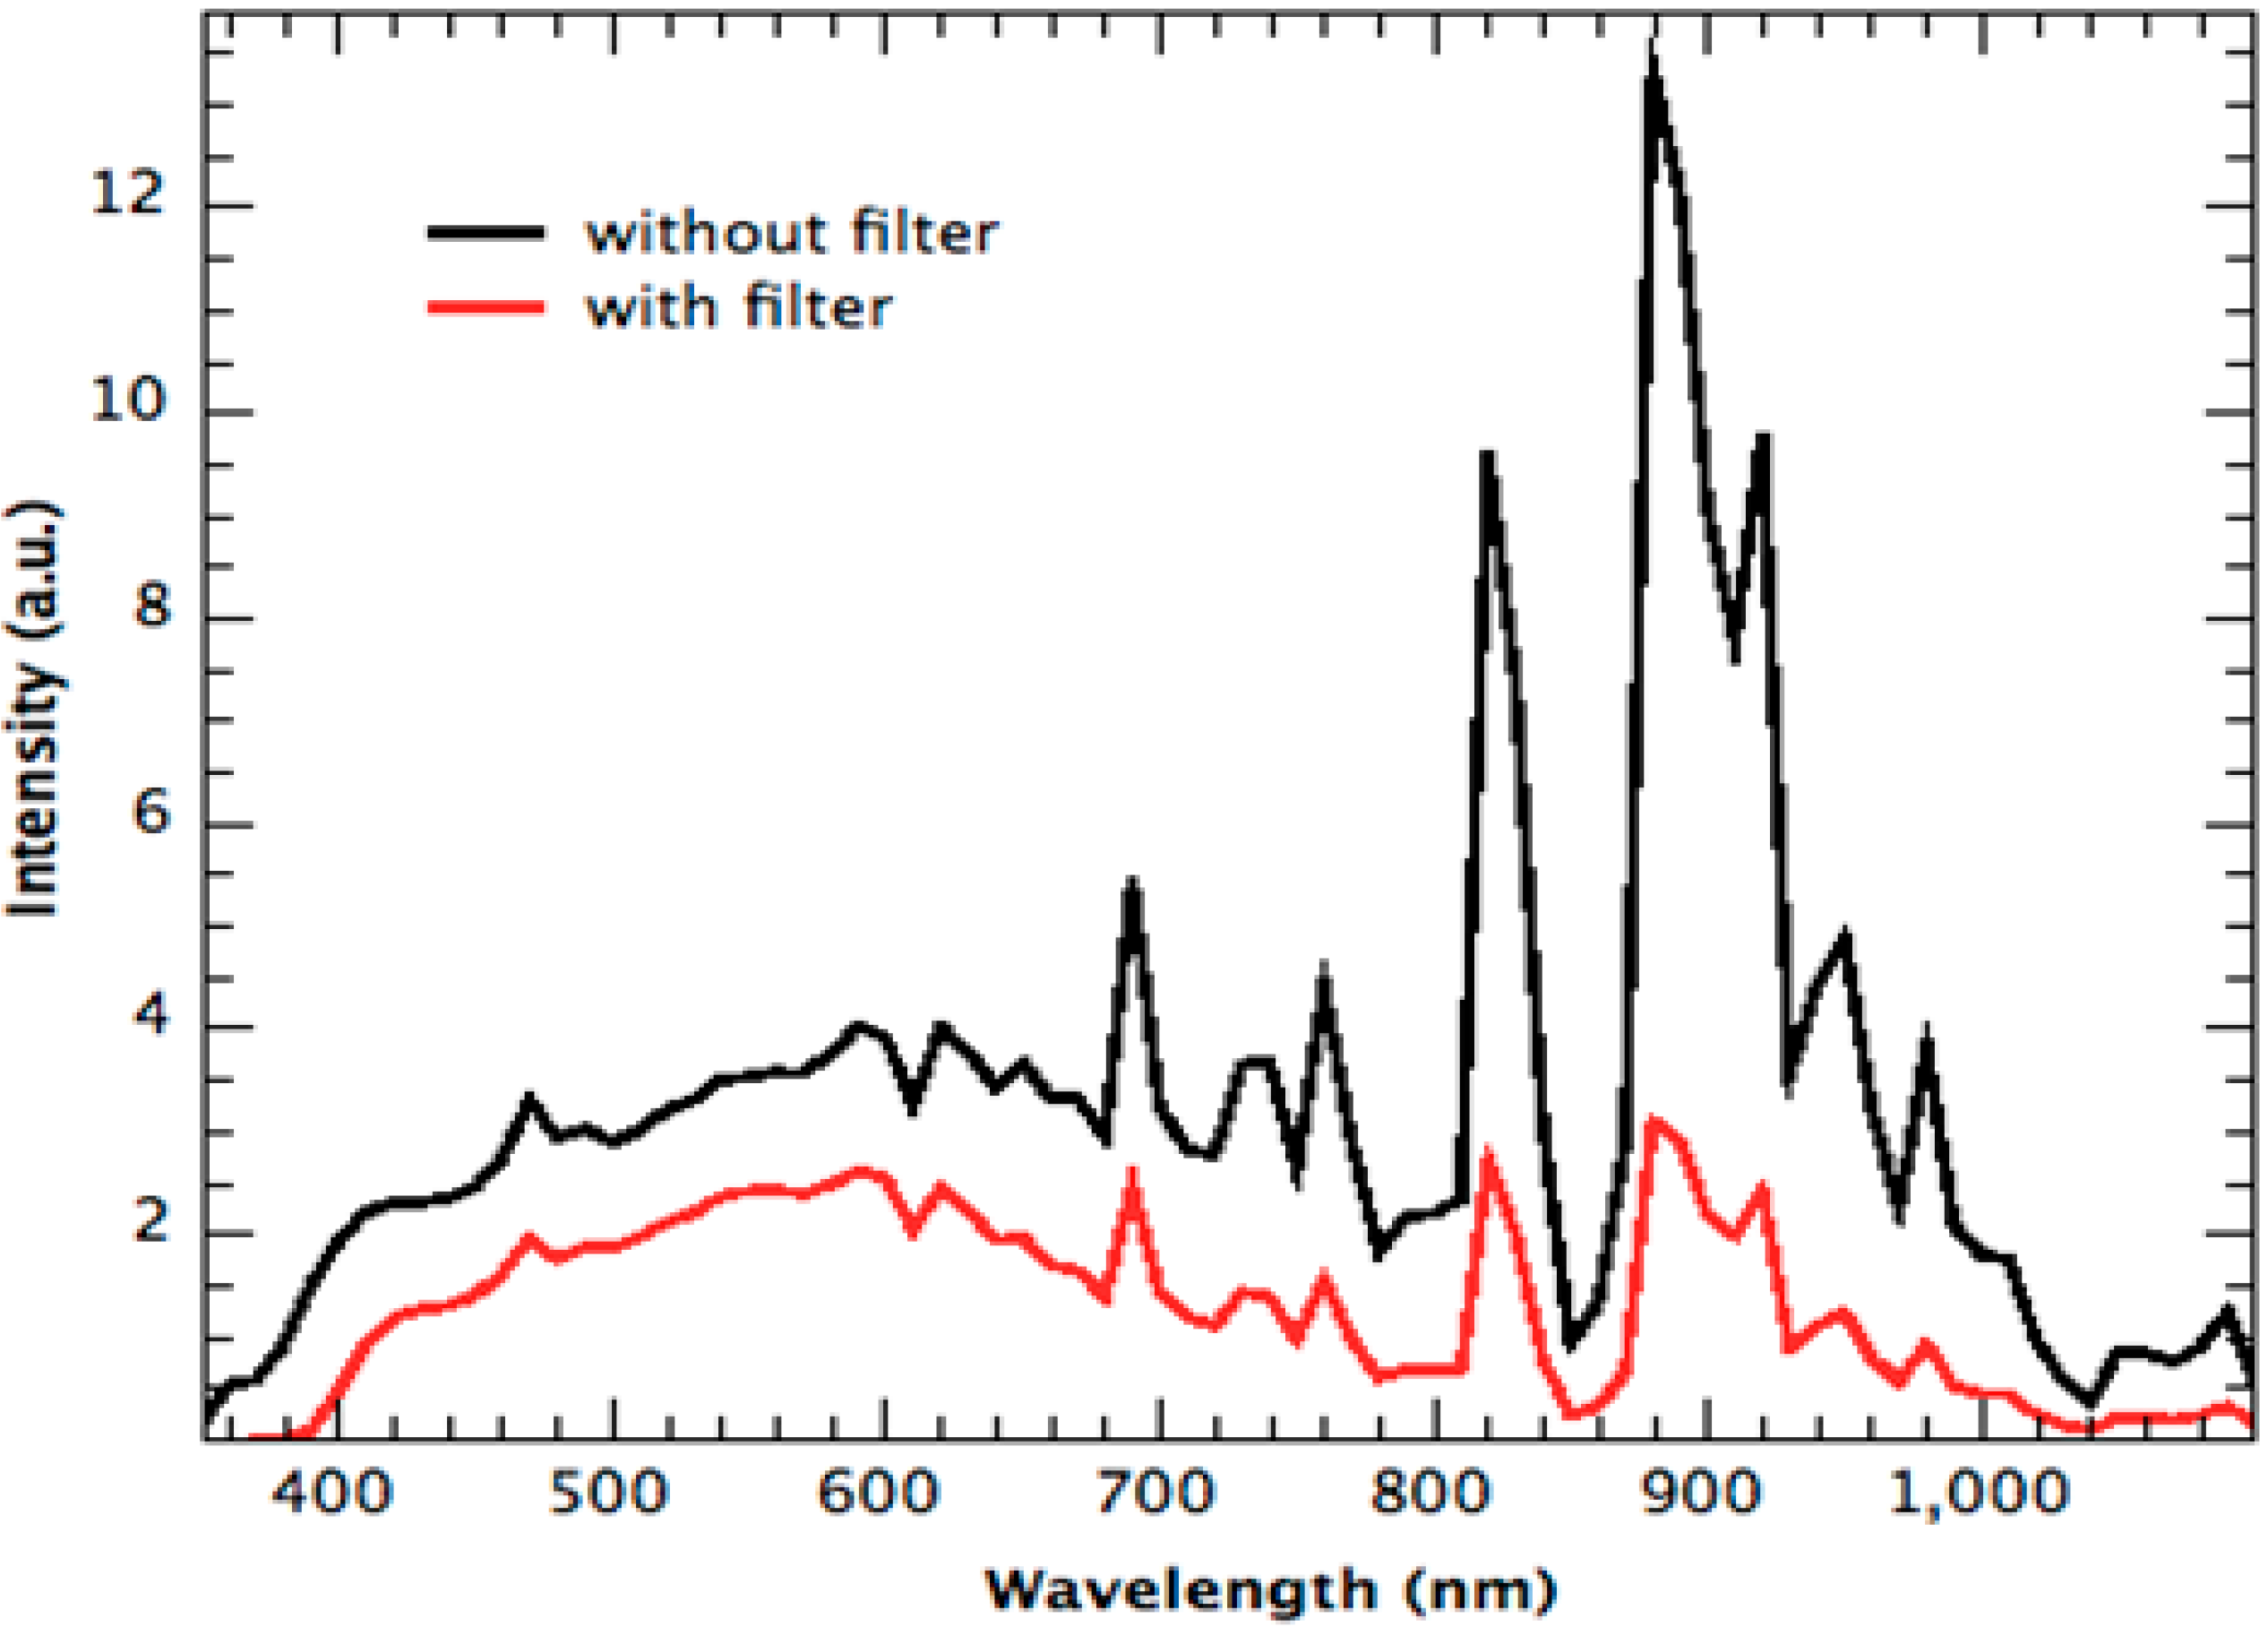
By interpolating the theoretical filtering system transmission total spectrum with the lamp total emission spectrum, it is possible to obtain the final emission radiation (theoretical) spectrum shown in
Figure 9.
Comparing results with and without filter light emission, it is clear that the filtering system introduction causes considerable emissive intensity attenuation (about 25%), and it solves excessive lamp emission in the 800 nm and 900 nm wavelength areas, taking a spectral match value between 0.75 and 1.25, consistent with IEC60904-9 A class (
Table 2).
If theoretical results are confirmed by means of experimental measurements, 1 and 2 included in the skin blend can be used as specific filtering devices in Sun simulators with considerable cost reduction and good results.
Figure 9.
With and without filter xenon lamp light emission.
Figure 9.
With and without filter xenon lamp light emission.
Table 2.
Lamp + filtering system spectral match calculation.
Table 2.
Lamp + filtering system spectral match calculation.
| Range (nm) | Lamp + Filtering System |
|---|
| Found % | Required % | Spectral Match |
|---|
| 400–500 | 14.8 | 18.5 | 0.80 |
| 500–600 | 23.9 | 20.1 | 1.19 |
| 600–700 | 20.4 | 18.3 | 1.11 |
| 700–800 | 11.2 | 14.8 | 0.76 |
| 800–900 | 15.2 | 12.2 | 1.25 |
| 900–1,100 | 14.5 | 16.1 | 0.90 |
5.2. Second Solution
Secondly, a light optimization solution was studied without skin employment. In this case, the idea is to create a new type of solid filter. The simplest solution is to make a thin molecular film on a transparent support, and as previously said, clear glass is suitable for this task.
The first simulation was carried out with the 1 and 2 mixture thin film on clear glass.
Table 3 shows no good results, it reveals insufficient absorption above 800 nm.
Table 3.
Lamp + (1) +(2) + filtering system spectral match calculation.
Table 3.
Lamp + (1) +(2) + filtering system spectral match calculation.
| Range (nm) | Lamp + 1–2 Thin Film Filter |
|---|
| Found % | Required % | Spectral Match |
|---|
| 400–500 | 11.4 | 18.5 | 0.62 |
| 500–600 | 16.6 | 20.1 | 0.83 |
| 600–700 | 16.6 | 18.3 | 0.91 |
| 700–800 | 11.8 | 14.8 | 0.79 |
| 800–900 | 20.8 | 12.2 | 1.71 |
| 900–1,100 | 22.8 | 16.1 | 1.41 |
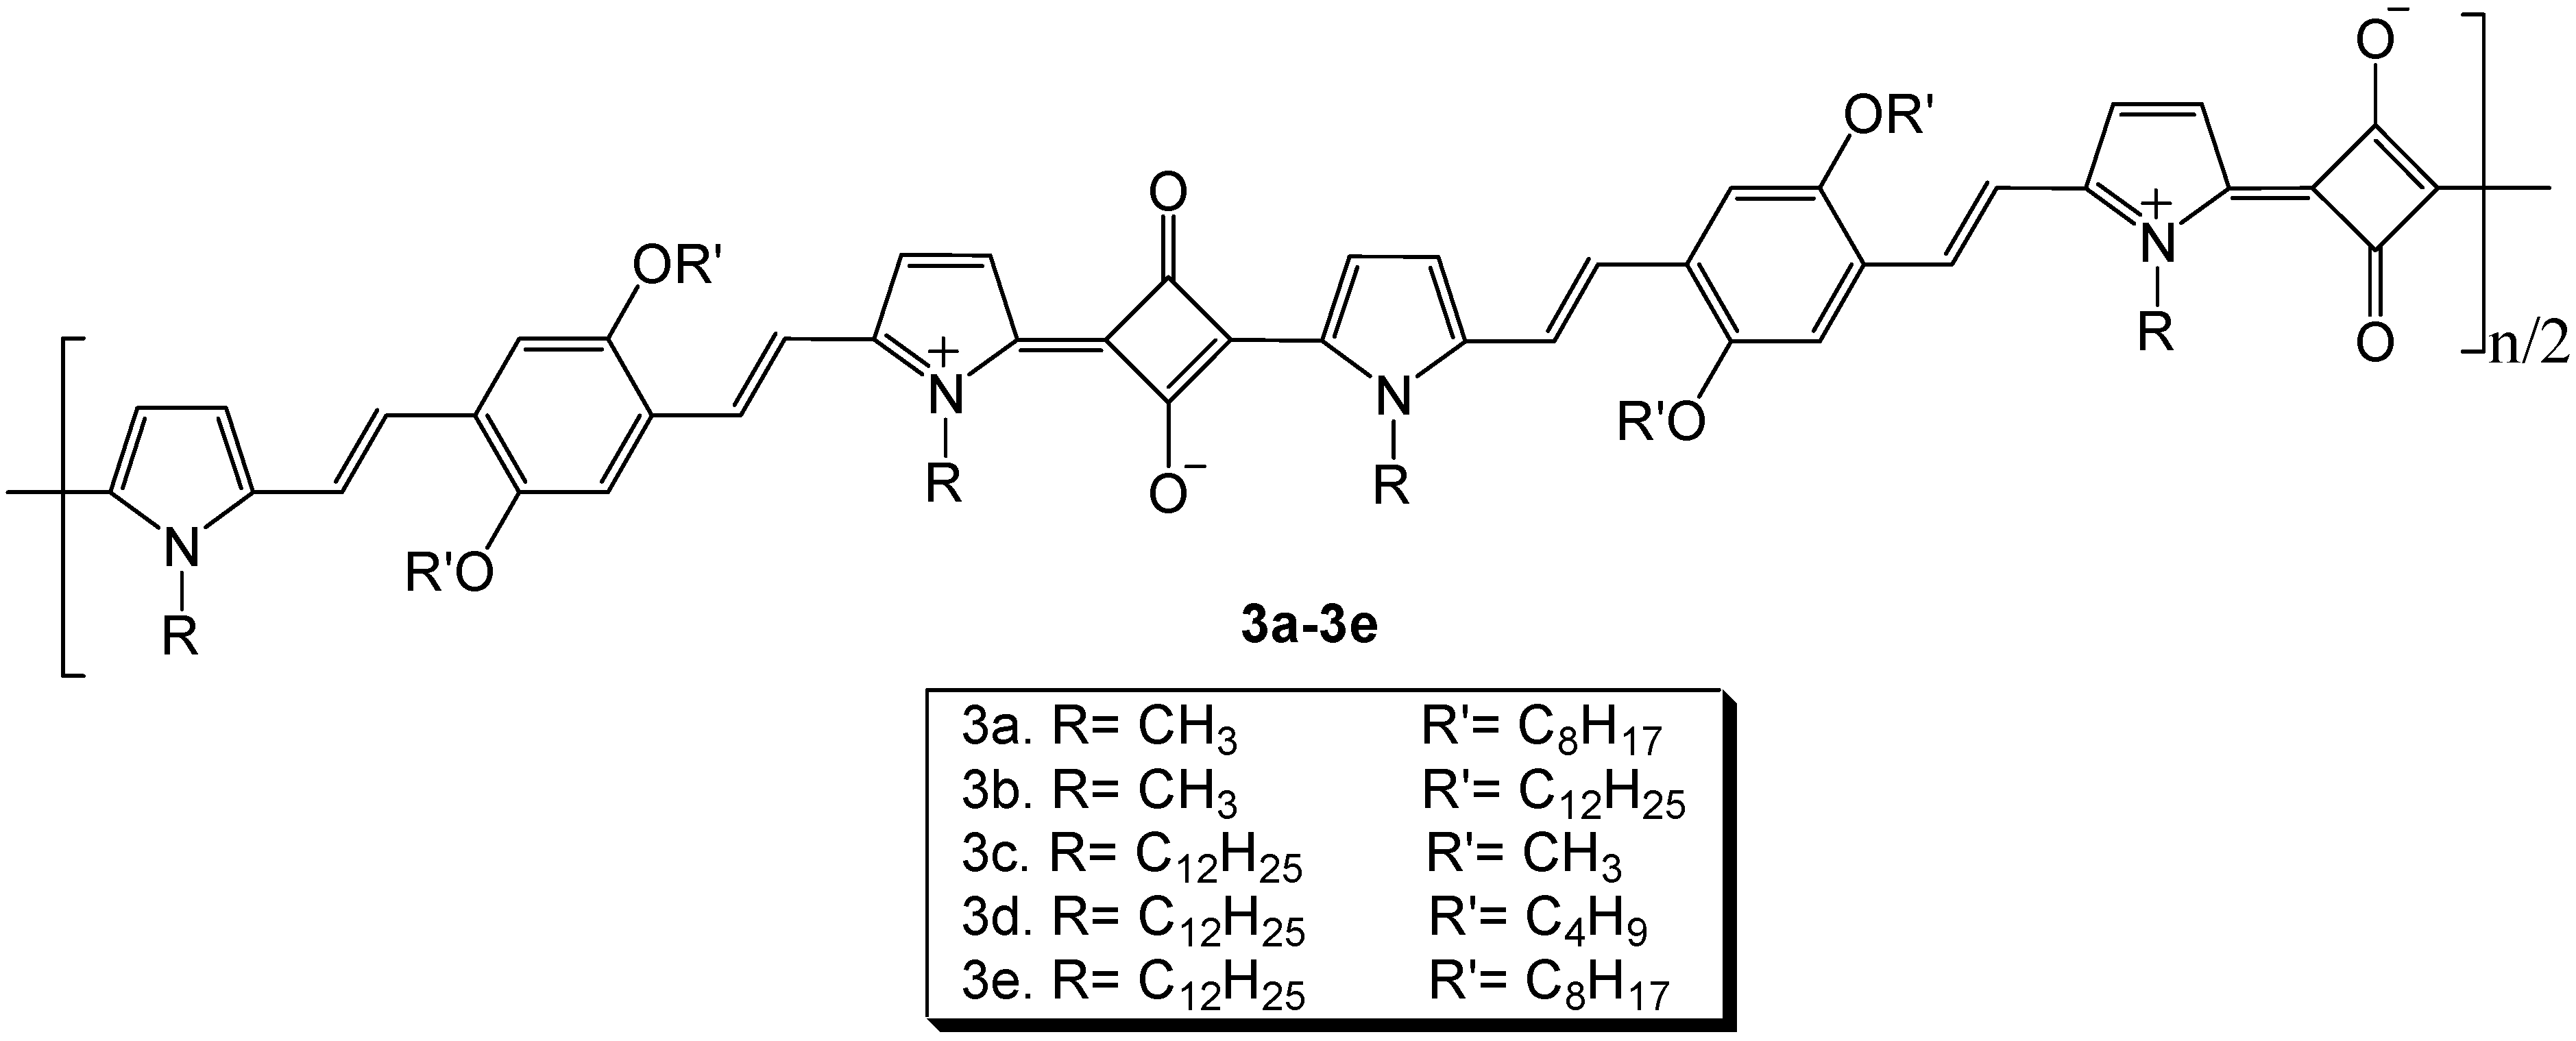
Another polysquaraine with a strong absorption band centered at 1000 nm was found from Scientific Literature. The chemical structure of this compound (
3) is reported in
Figure 10.
Figure 10.
The chemical structure of 3.
Figure 10.
The chemical structure of 3.
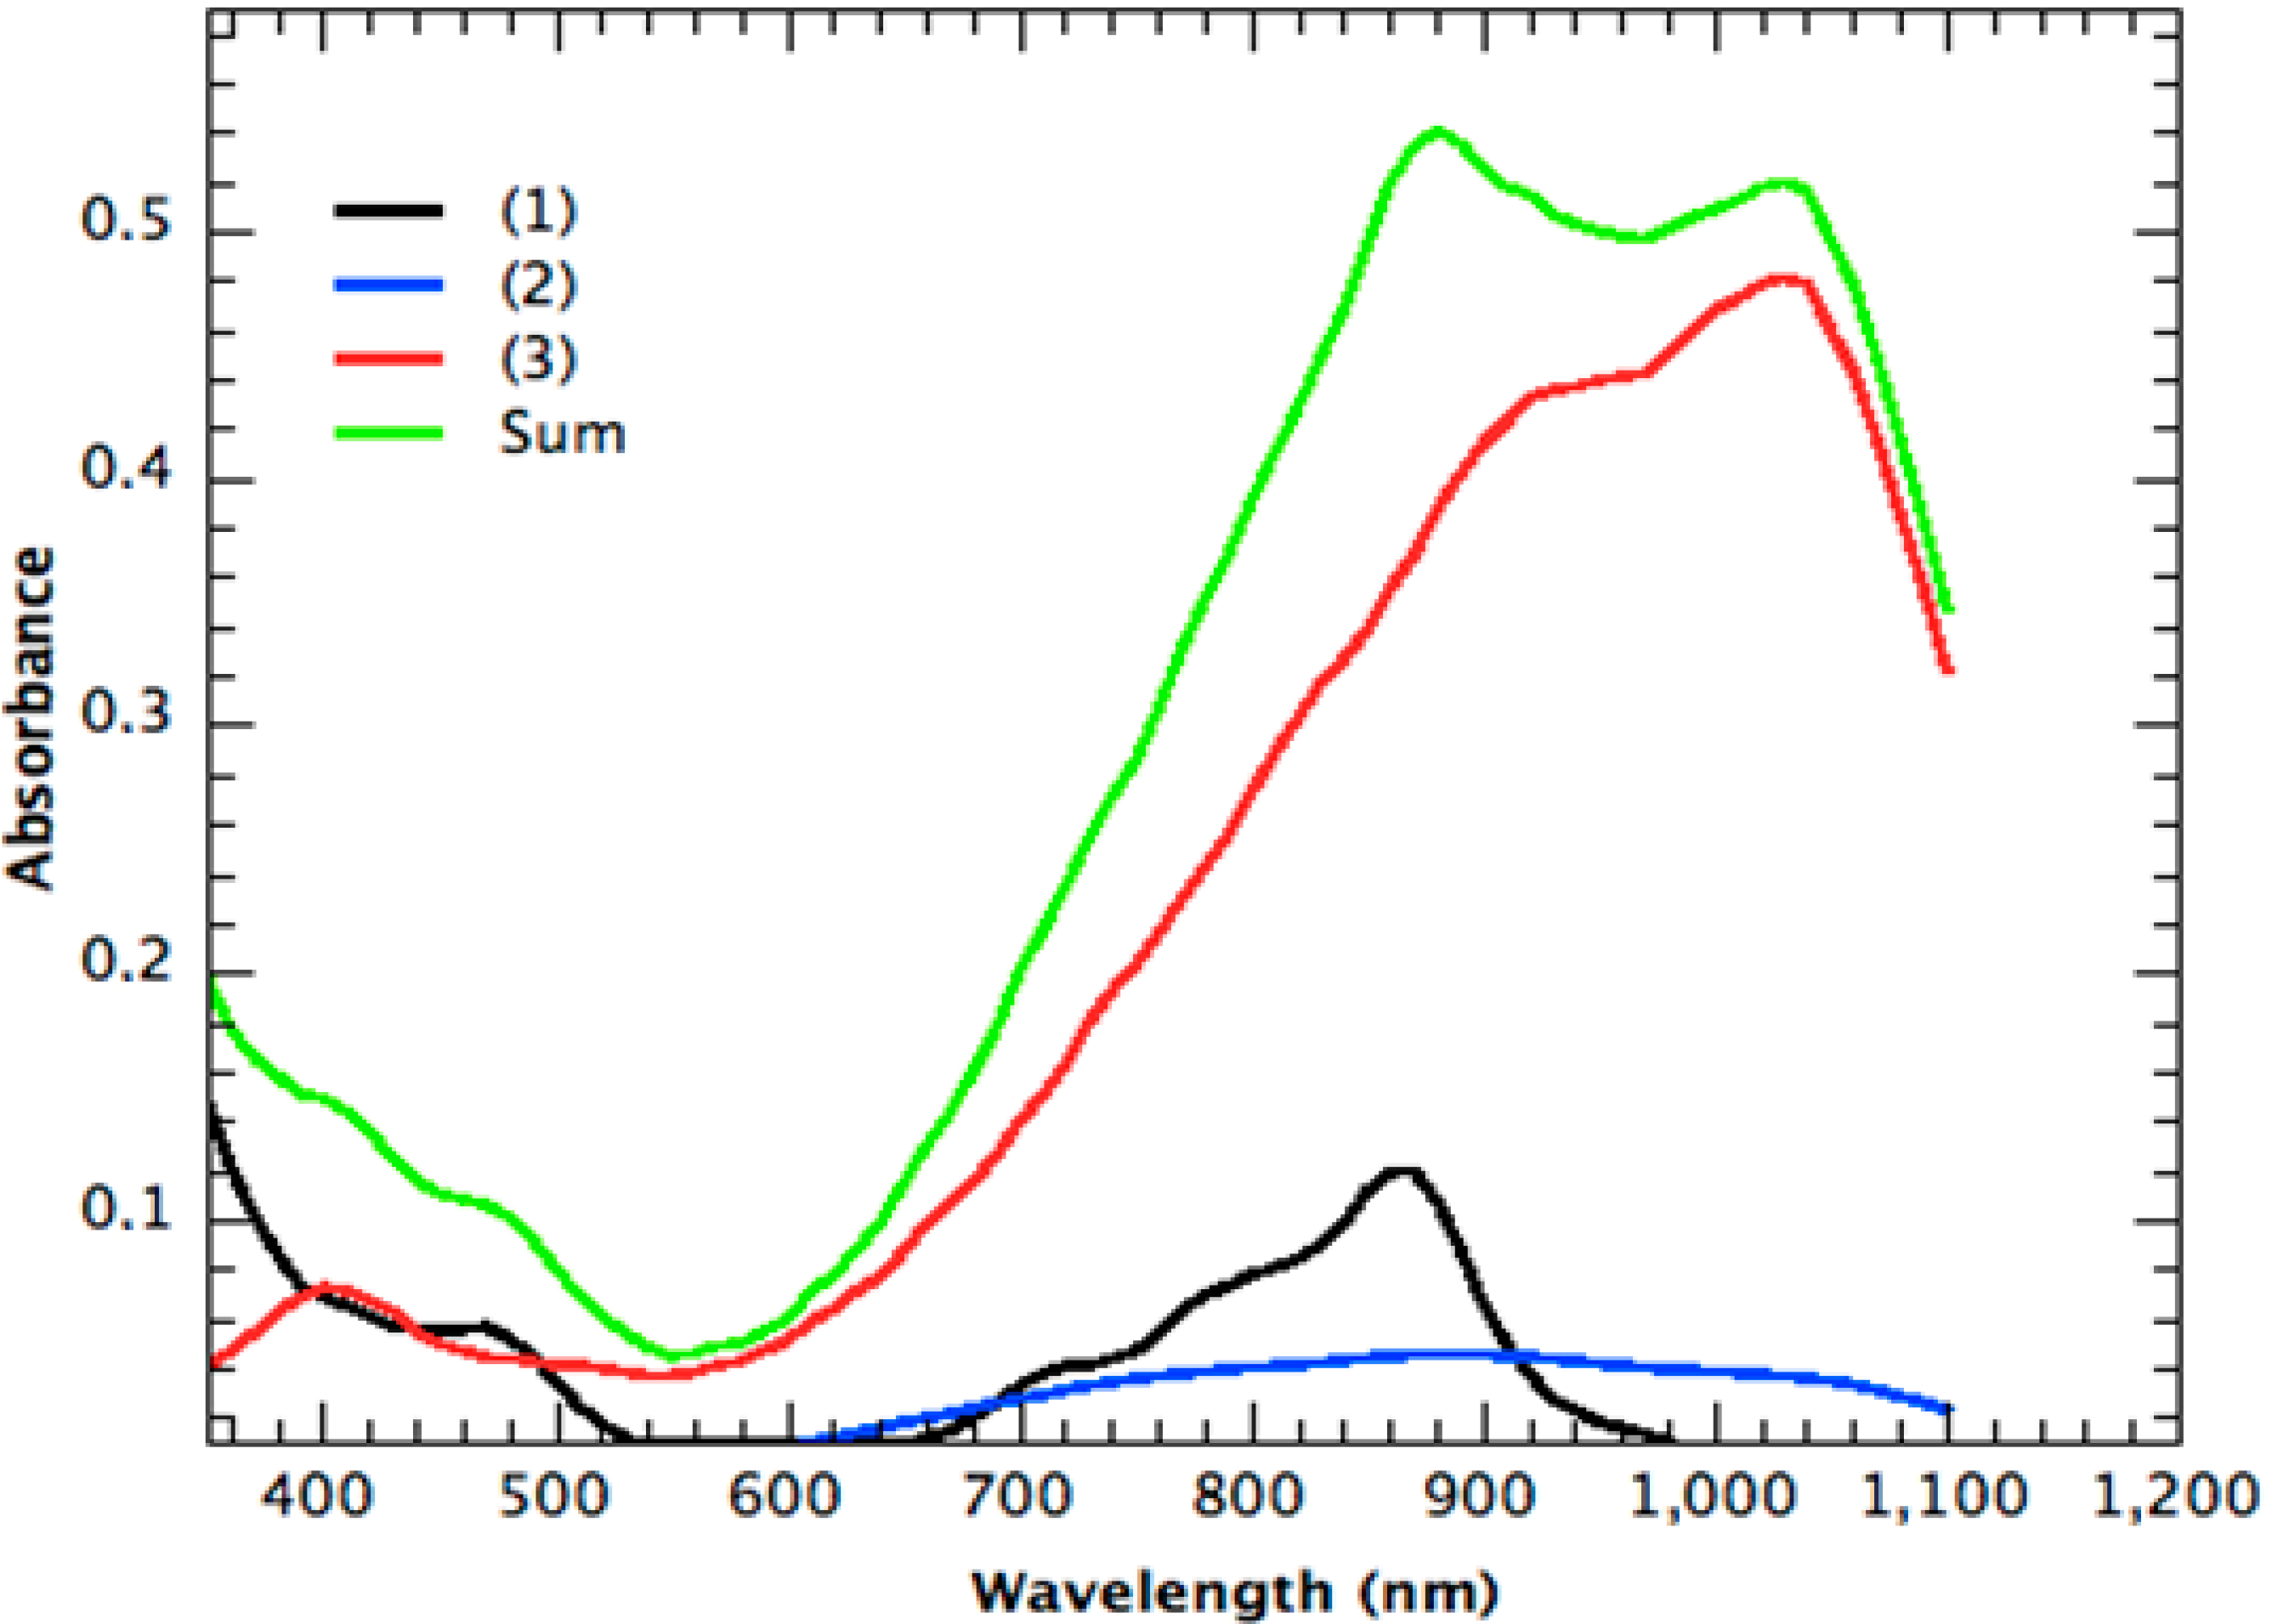
After this addition, the calculations give very satisfactory results, allowing the achievement of the highest theoretical class in spectral match terms.
Table 4 reports spectral match data obtained with three compounds under the following considerations: each molecule of the thin film contributes in percentage to the total absorption spectrum, and in particular,
1 contributes to 35%,
2 to 9% and
3 to 55%.
Figure 11 shows compounds and total absorption spectra, while
Figure 12 shows the total transmission obtained using the 1 + 2 + 3 thin film on clear glass.
In this case, experimental confirmations would lead to the production of a low cost solid filter available for pulsed xenon sources with spectral characteristics similar to the one used in the solar simulator.
Table 4.
Lamp + (1) + (2) + (3) + filtering system spectral match calculation.
Table 4.
Lamp + (1) + (2) + (3) + filtering system spectral match calculation.
| Range (nm) | Lamp + 1–2–3 Thin Film Filter |
|---|
| Found % | Required % | Spectral Match |
|---|
| 400–500 | 15.4 | 18.5 | 0.83 |
| 500–600 | 23.6 | 20.1 | 1.18 |
| 600–700 | 21.4 | 18.3 | 1.17 |
| 700–800 | 11.8 | 14.8 | 0.80 |
| 800–900 | 14.3 | 12.2 | 1.17 |
| 900-1,100 | 13.5 | 16.1 | 0.84 |
Figure 11.
1, 2, 3 and total absorption spectra.
Figure 11.
1, 2, 3 and total absorption spectra.
Figure 12.
Total transmission filtering (1 + 2 + 3 thin film on clear glass) system.
Figure 12.
Total transmission filtering (1 + 2 + 3 thin film on clear glass) system.
6. Conclusions
The Maketbuzz report [
8] forecasts that over 100 GW of PV power will be installed in 2018 with an annual PV module revenue of $50 billion. Consequently, the PV market needs a low cost apparatus (Sun simulator) to test and commercialize PV devices. Within this context, the University of Perugia, in cooperation with a PV company, has been carrying out, in the last few years, studies about Sun simulators in order to manufacture a cheaper one for PV testing. Economic analysis has, in fact, highlighted that the cost of the light filter is very high. For this reason, the research focused on the replacement of Sun simulator filters with cheaper materials. Three kinds of innovative chemical compounds, spread on a glass support with a skin, were examined in order to analyze their effects from the sunlight absorbance point of view. In particular, two solutions were developed: the filter can be manufactured using a polysquaraine and a cyanine mixture spread over a skin that is directly linked to a clear glass or two such compounds mixed with another polysquaraine are spread over the glass.
Results show that the developed molecular structure can absorb the xenon spectrum in order to replace the effect of an AM 1.5 filter corresponding to IEC standard requirements. The advantage of the new proposed system (clear glass + skin and chemical compounds) is less cost ($50 per square meter) instead of a 1.5-G filter that costs over $10,000 per square meter). If experimental analysis confirms the theory, the skin filter could be a new patent to employ in order to reduce Sun simulator costs.

 ,
, 


