Nondestructive Evaluation of Historic Hakka Rammed Earth Structures

Abstract
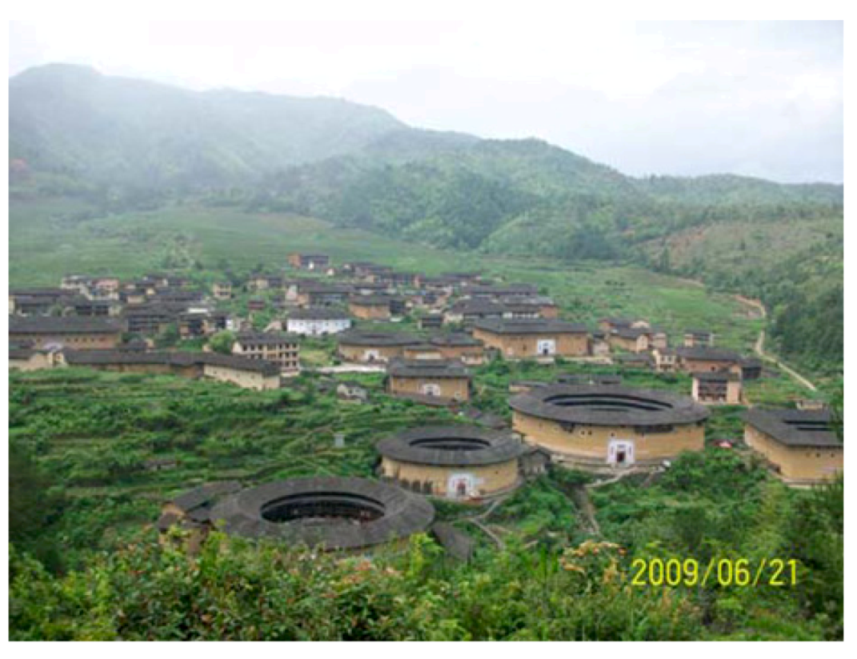
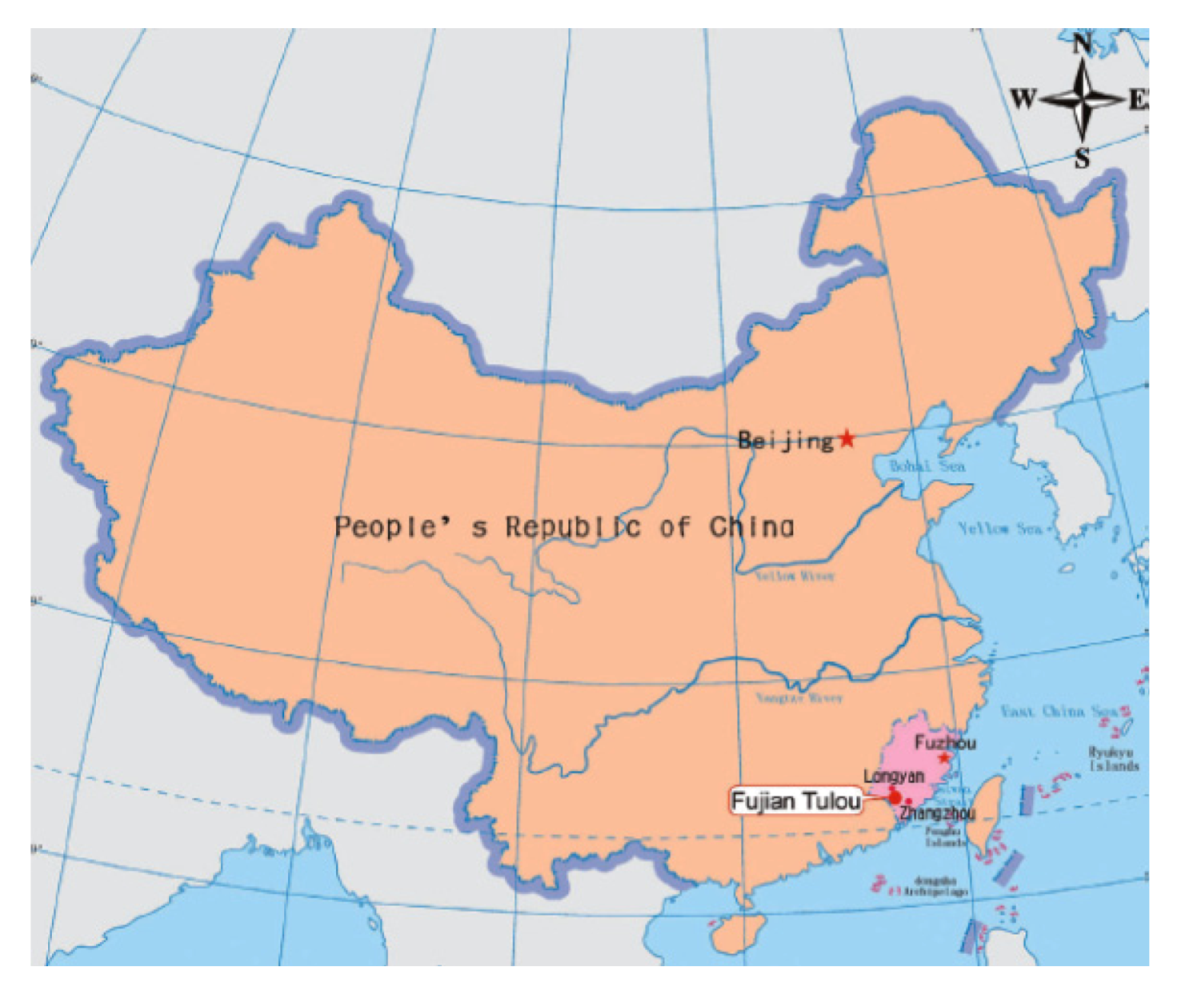
:1. Introduction


| Title of Tulou | Shape | Number of Story | Age | Status |
|---|---|---|---|---|
| Fuxing Tulou | Square | 2 story | over 1,200 years | partially in service |
| Wuyun Tulou | Square | 4 story | over 500 years | partially in service |
| Chengqi Tulou | Round | 4 story | over 300 years | in service |
| Huanji Tulou | Round | 4 story | over 300 years | in service |
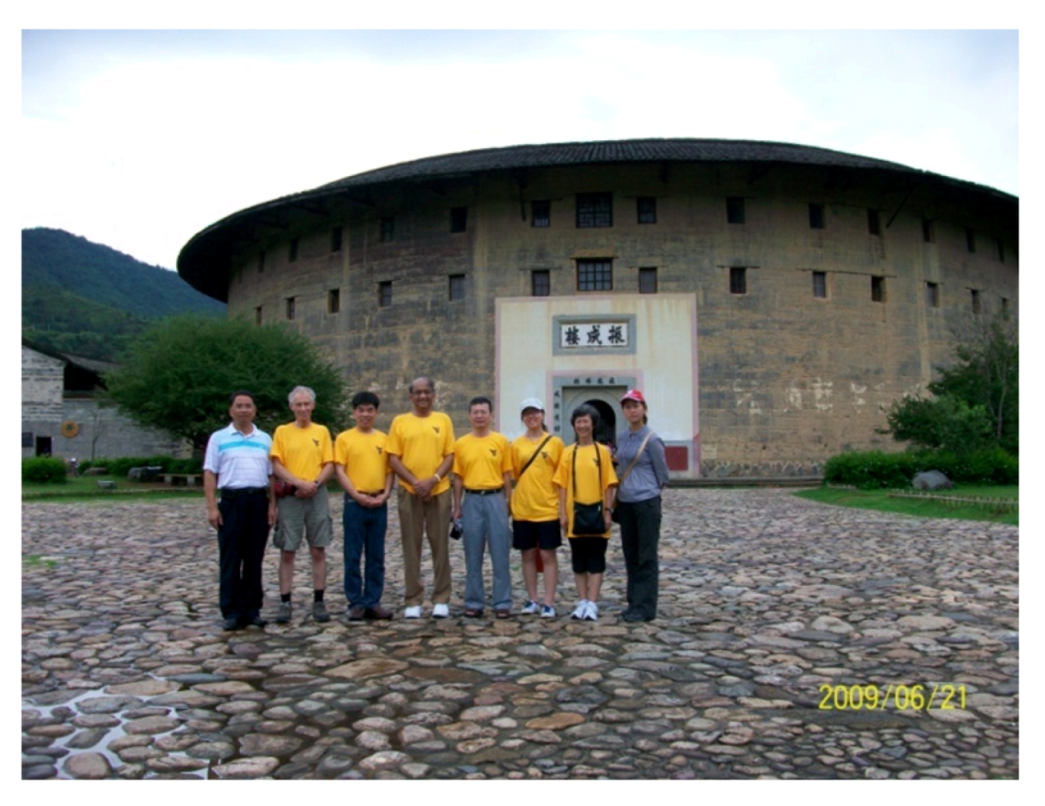
| Zhencheng Tulou | Round | 4 story | about 100 years | in service |
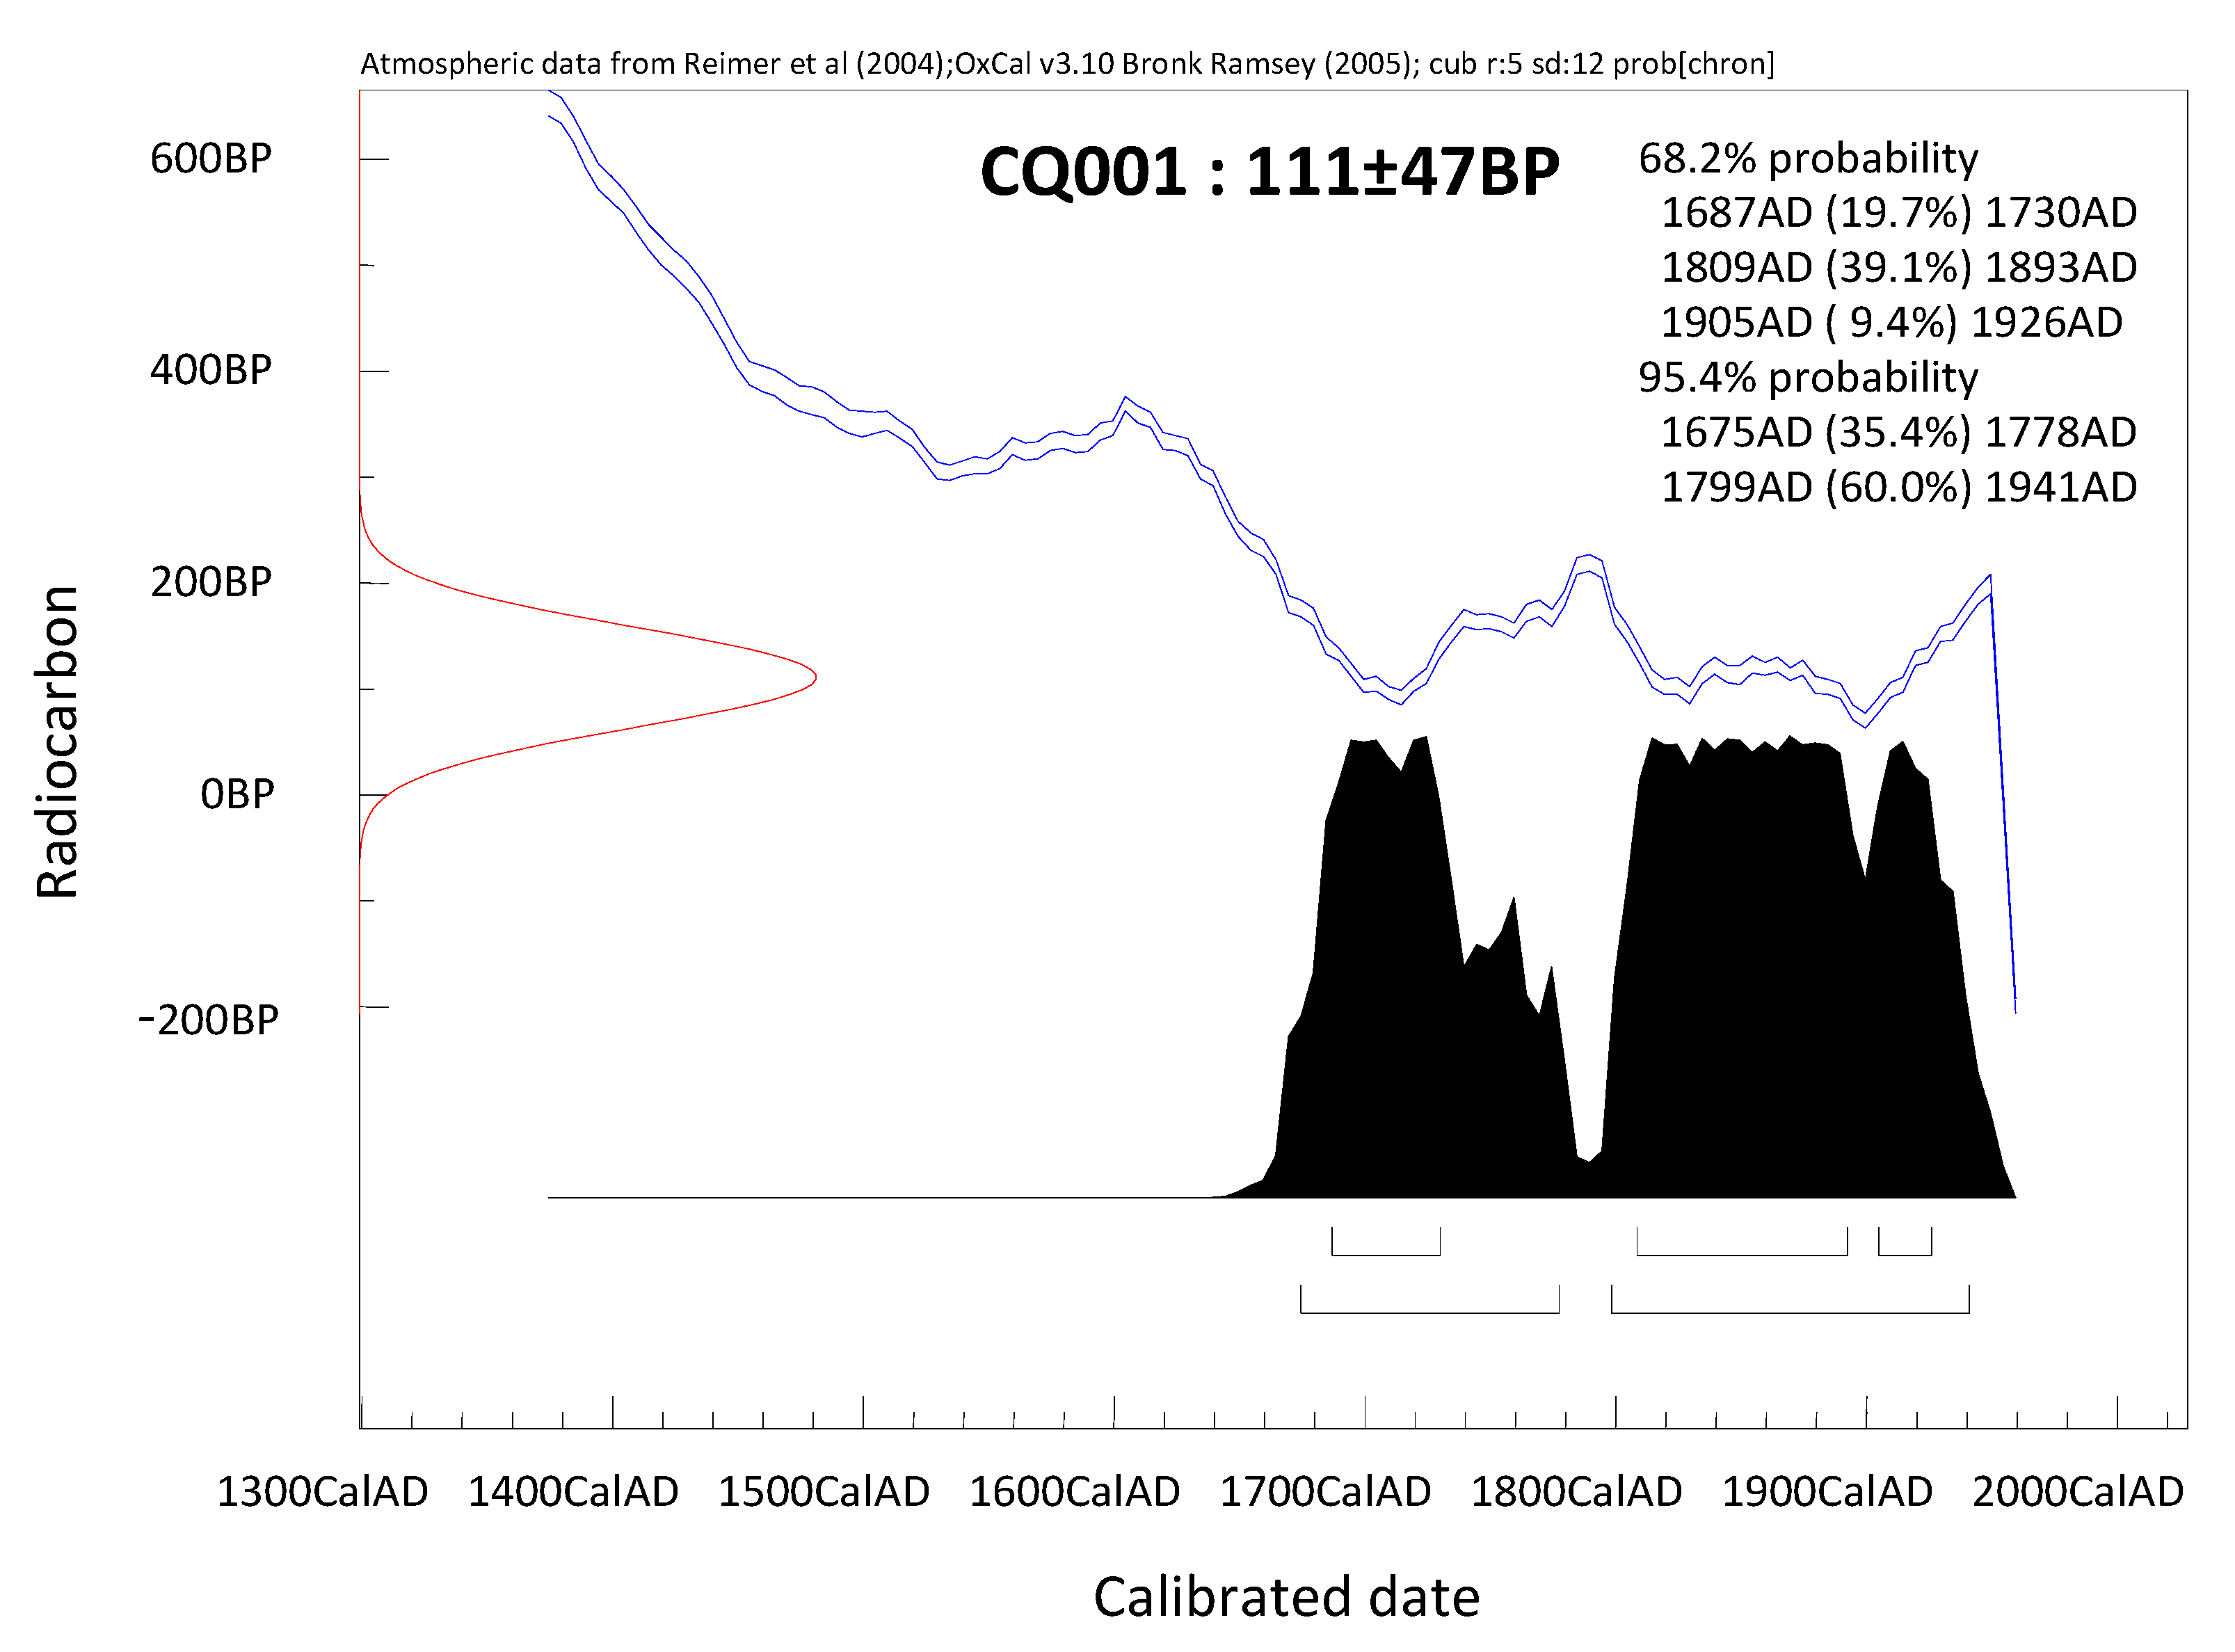
2. Radiocarbon Dating Age of Chengqi Tulou
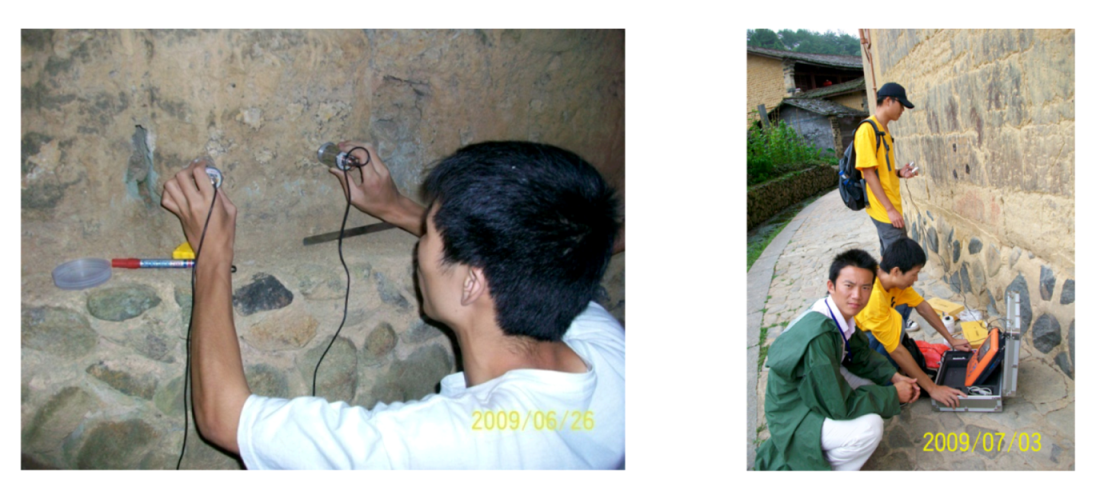
3. Nondestructive Evaluation of Rammed Earth Walls

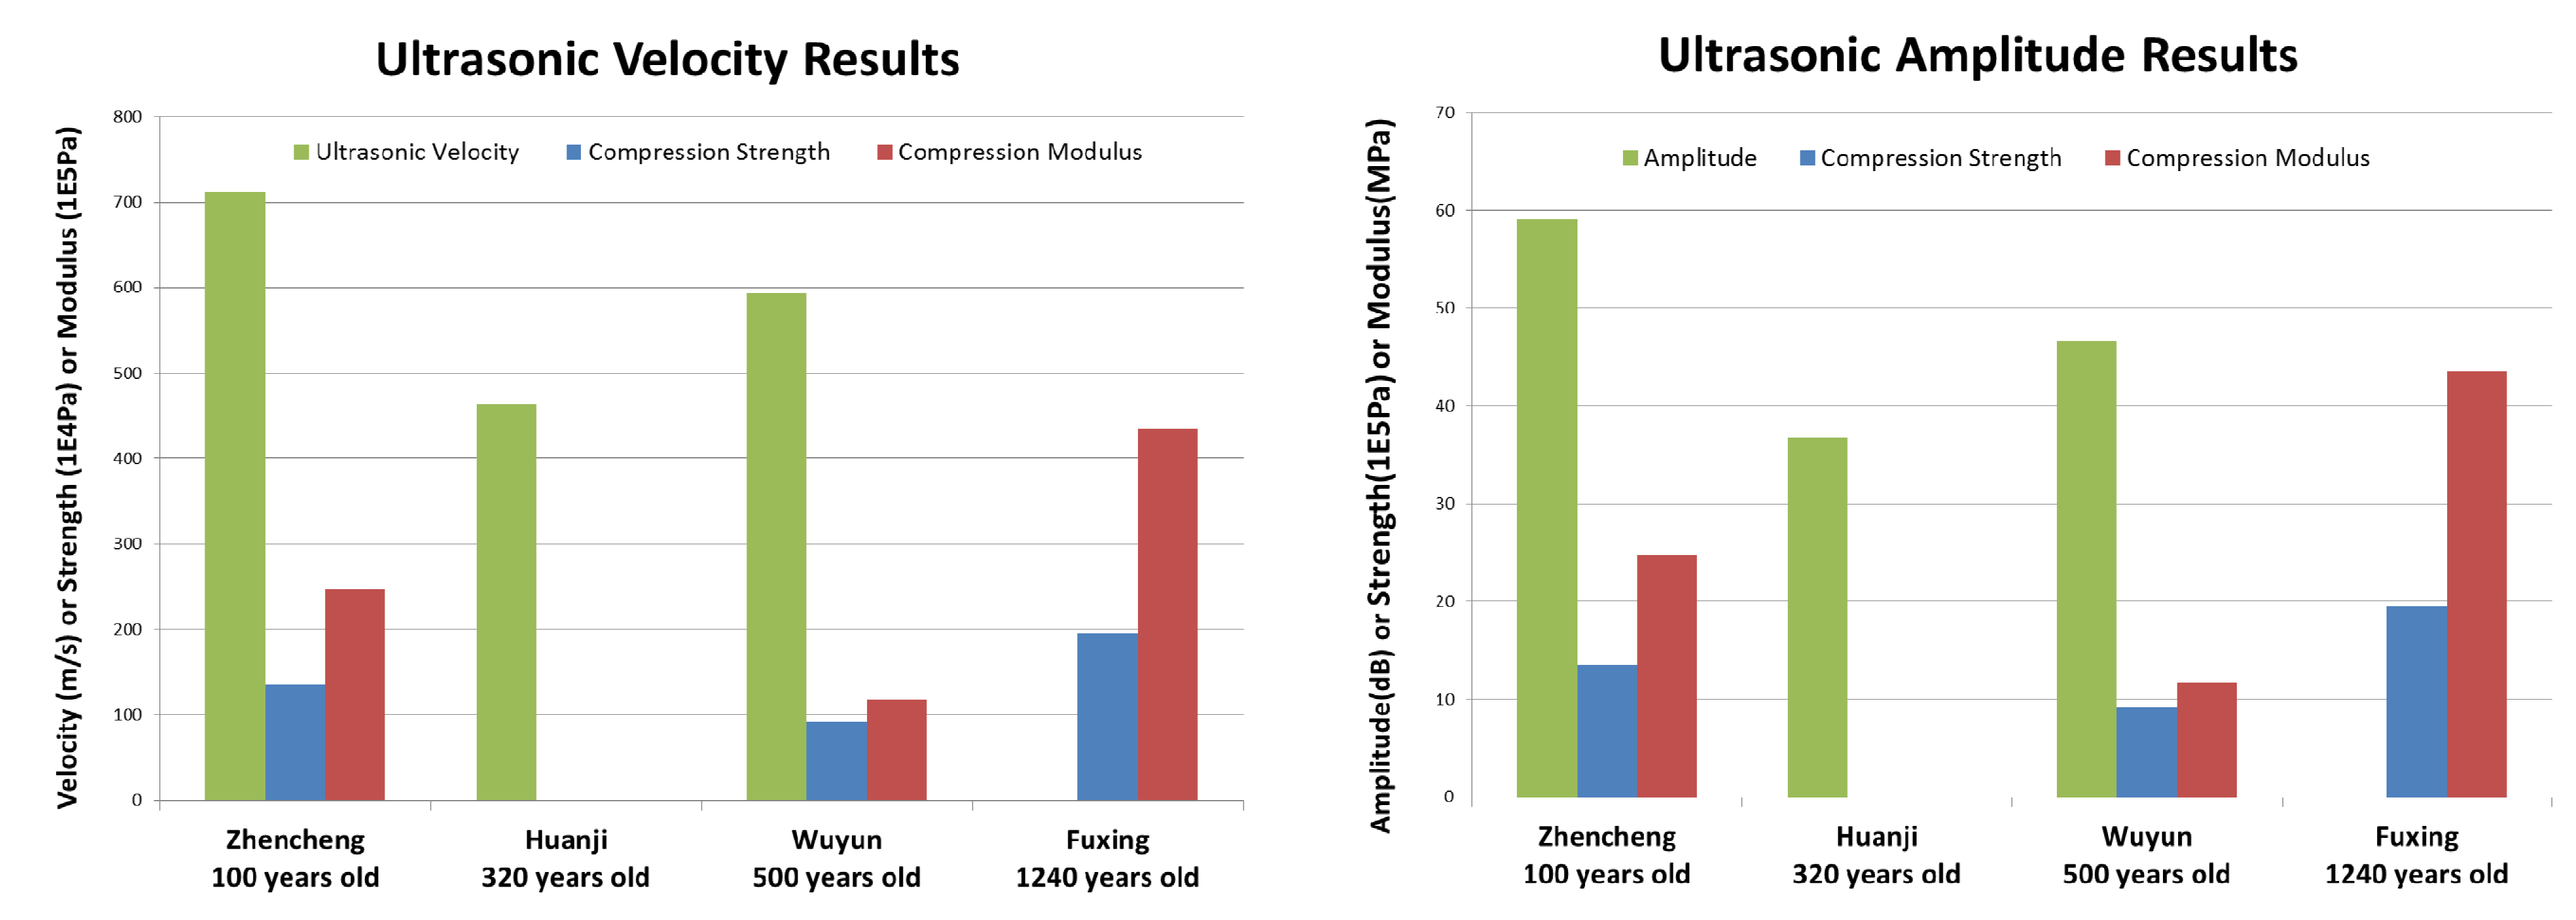
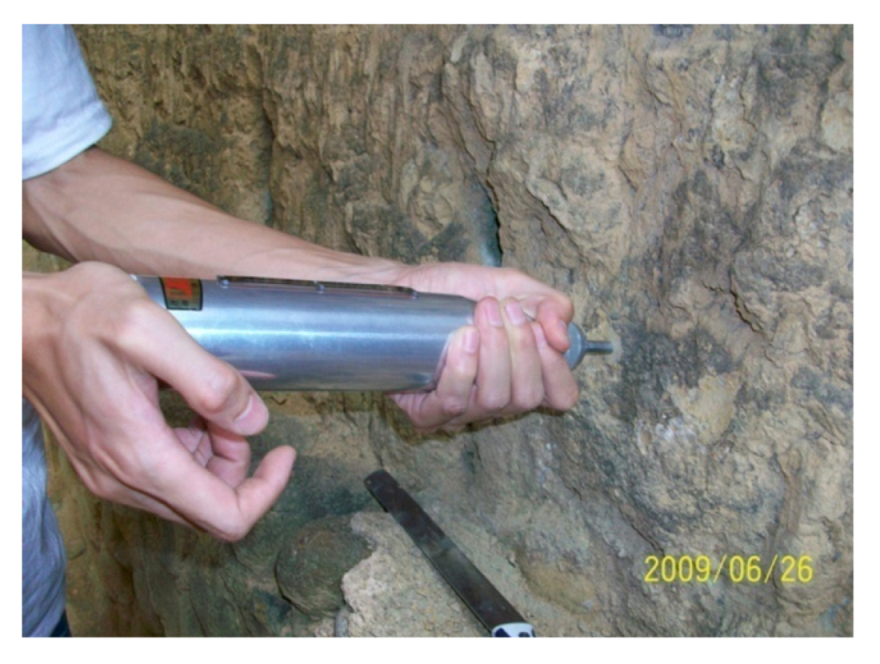
3.1. Ultrasonic Method

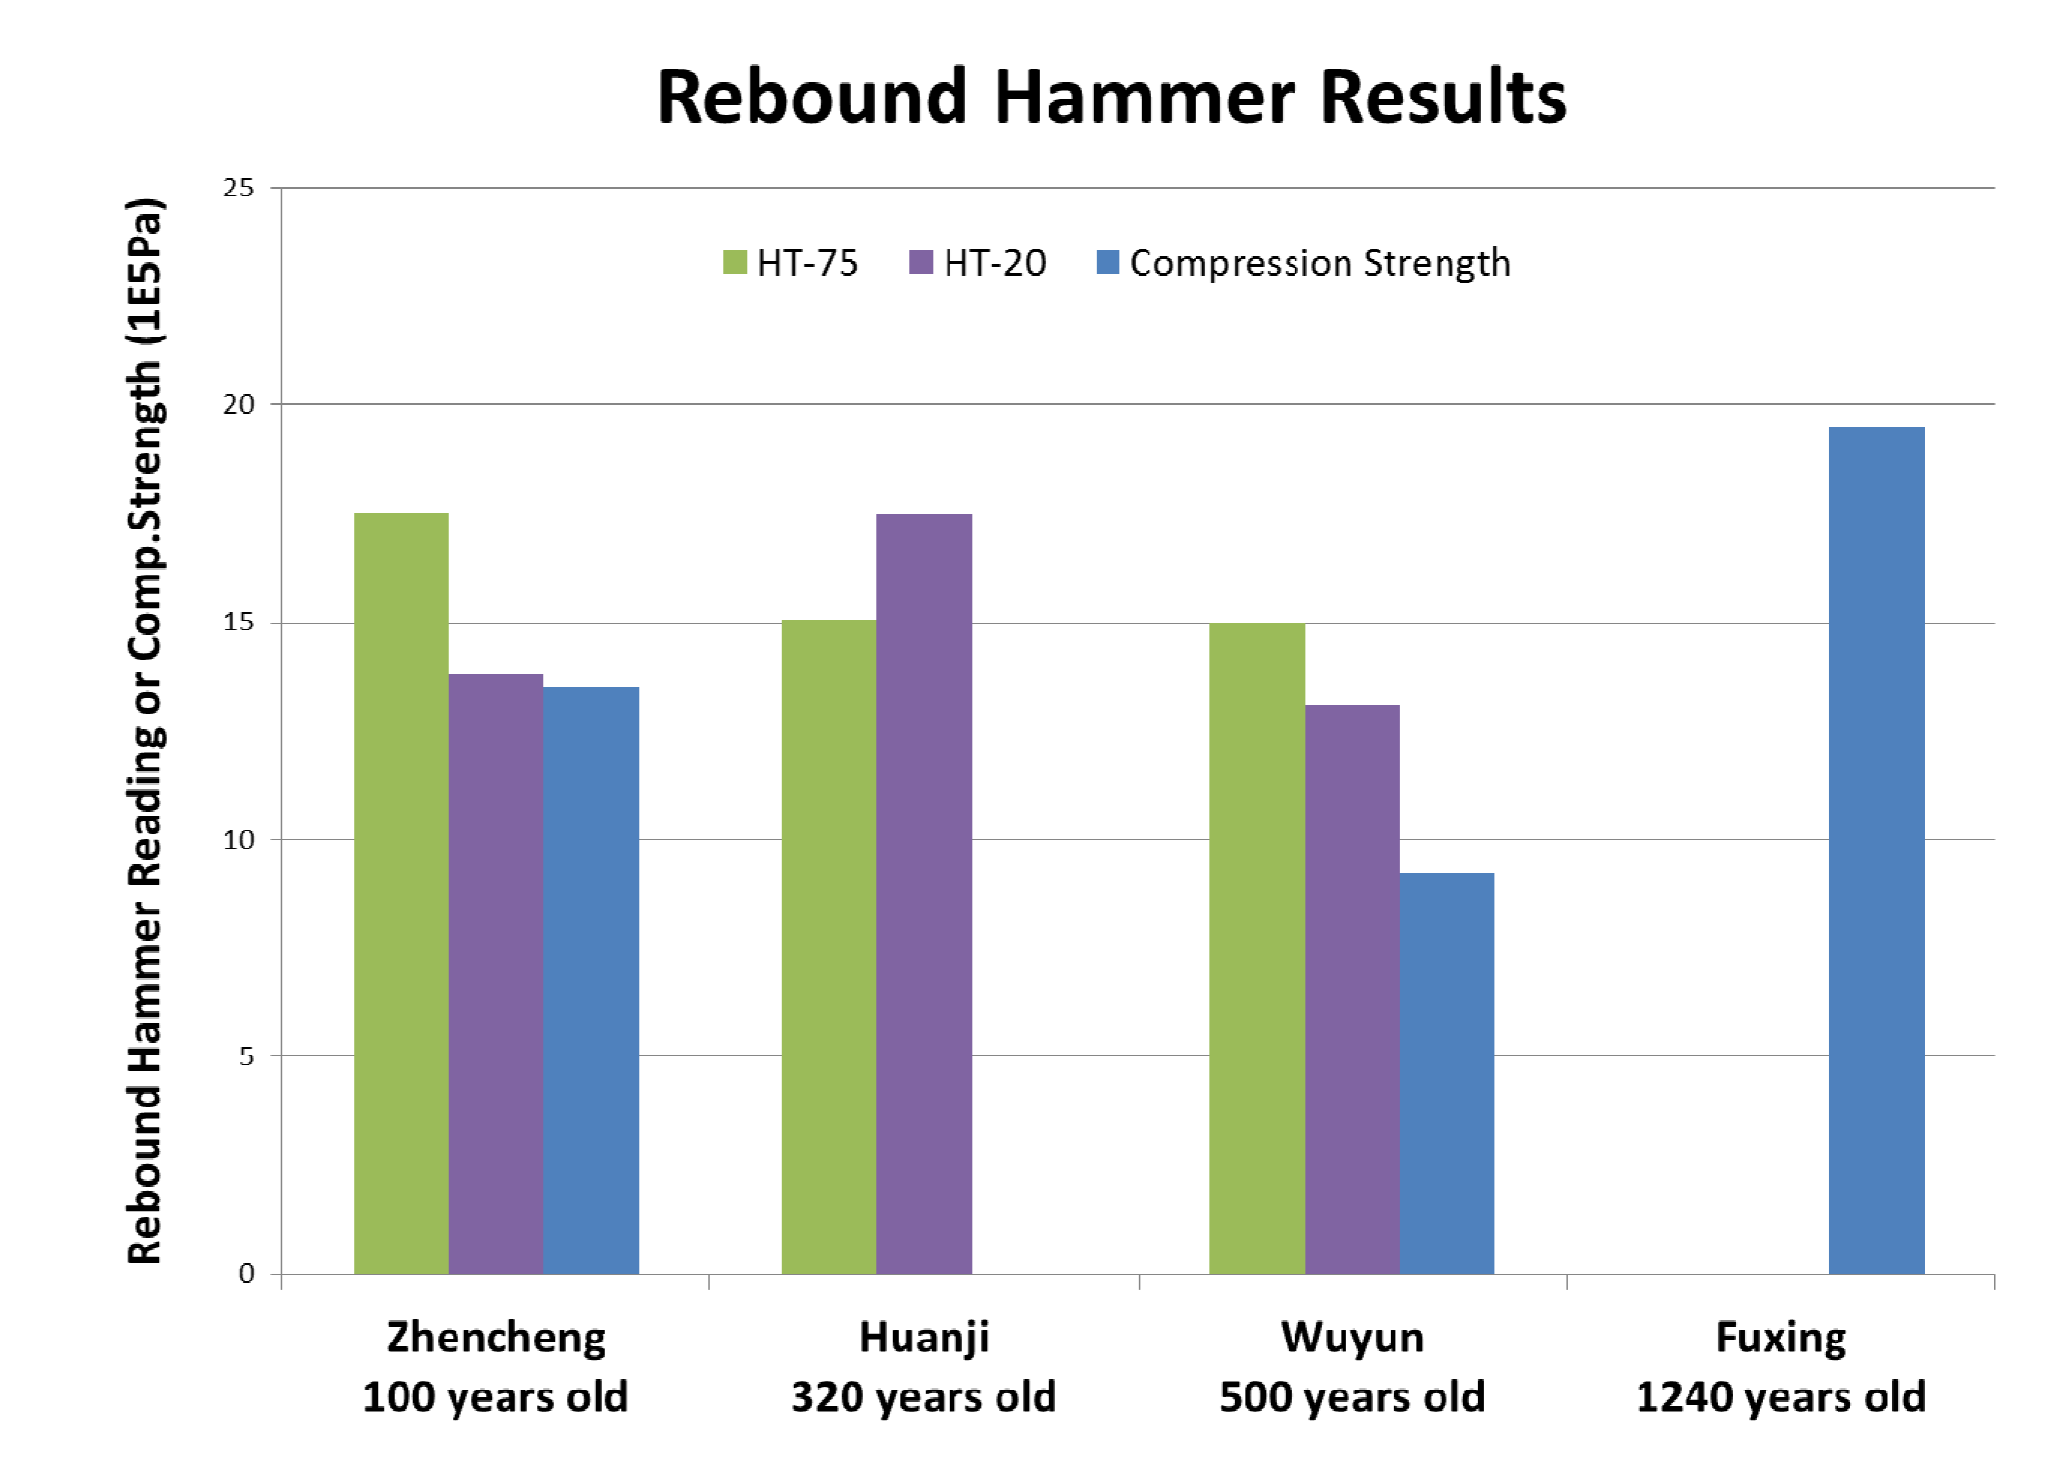
3.2. Rebound Hammer Method

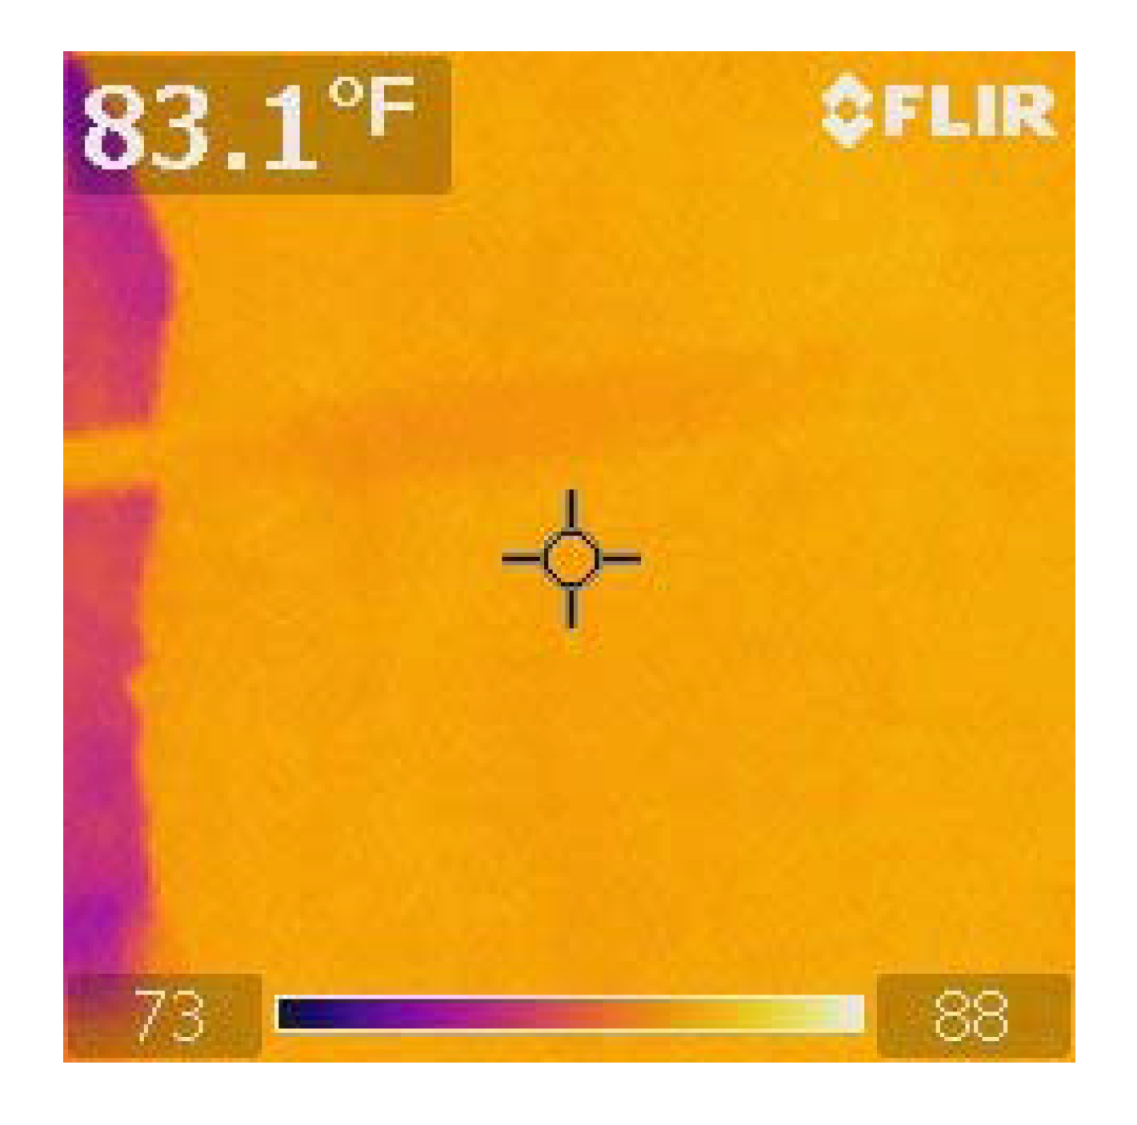
3.3. Infrared Thermography Scanning Method
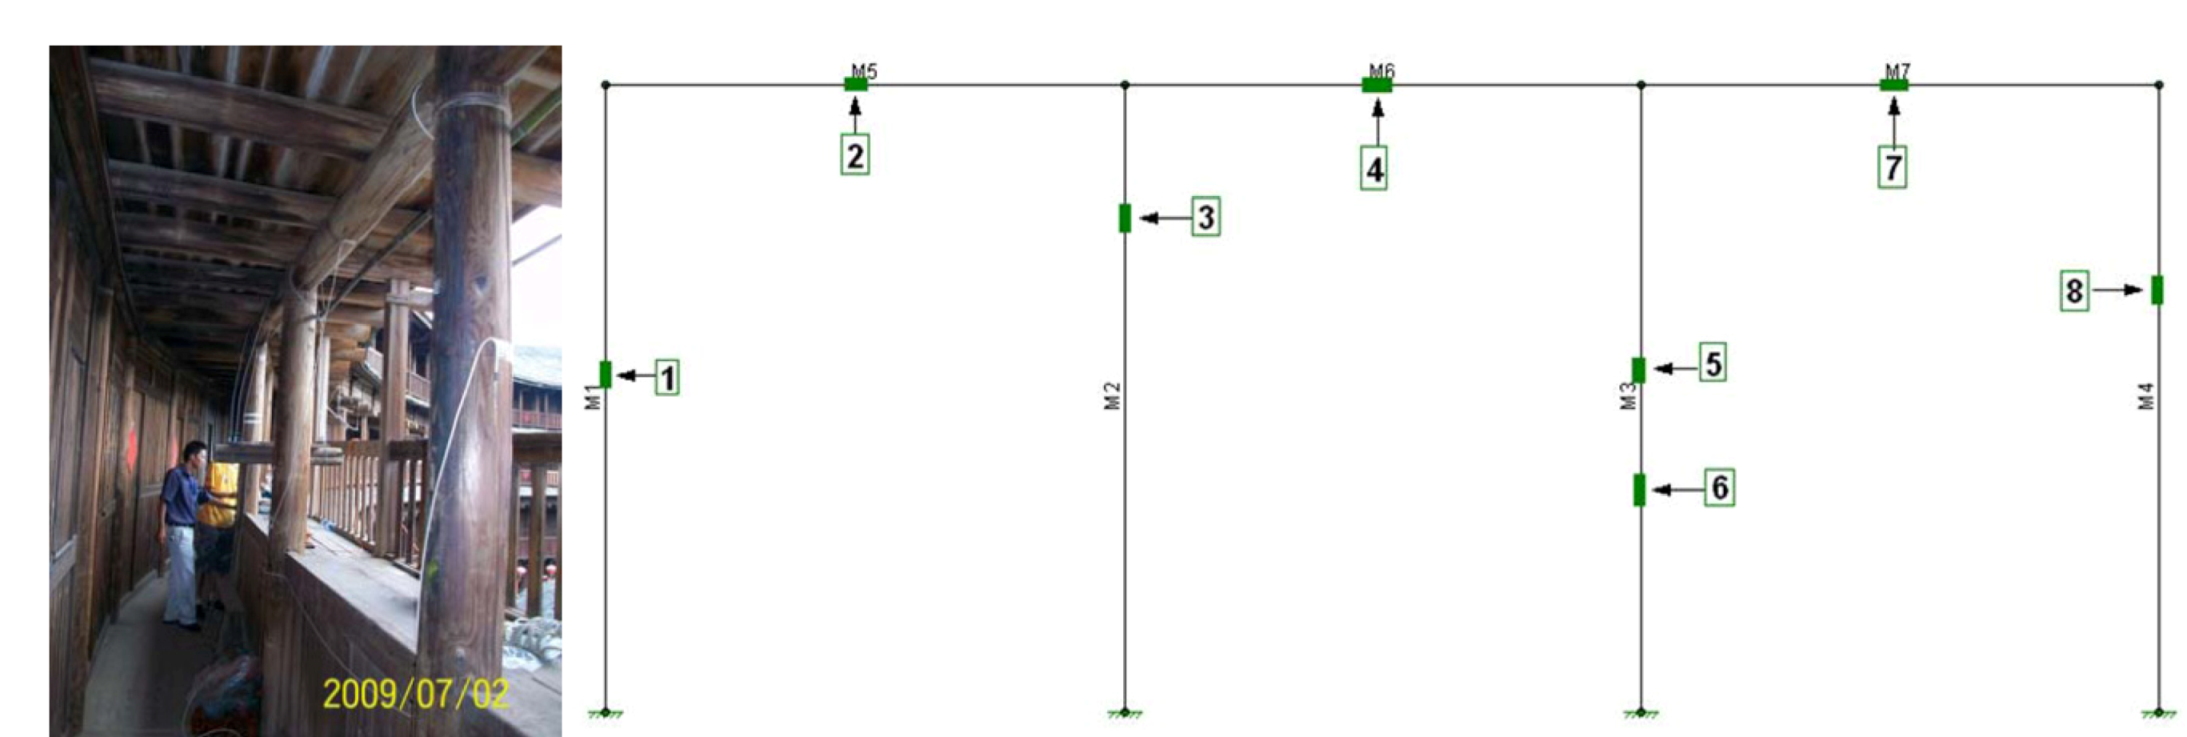
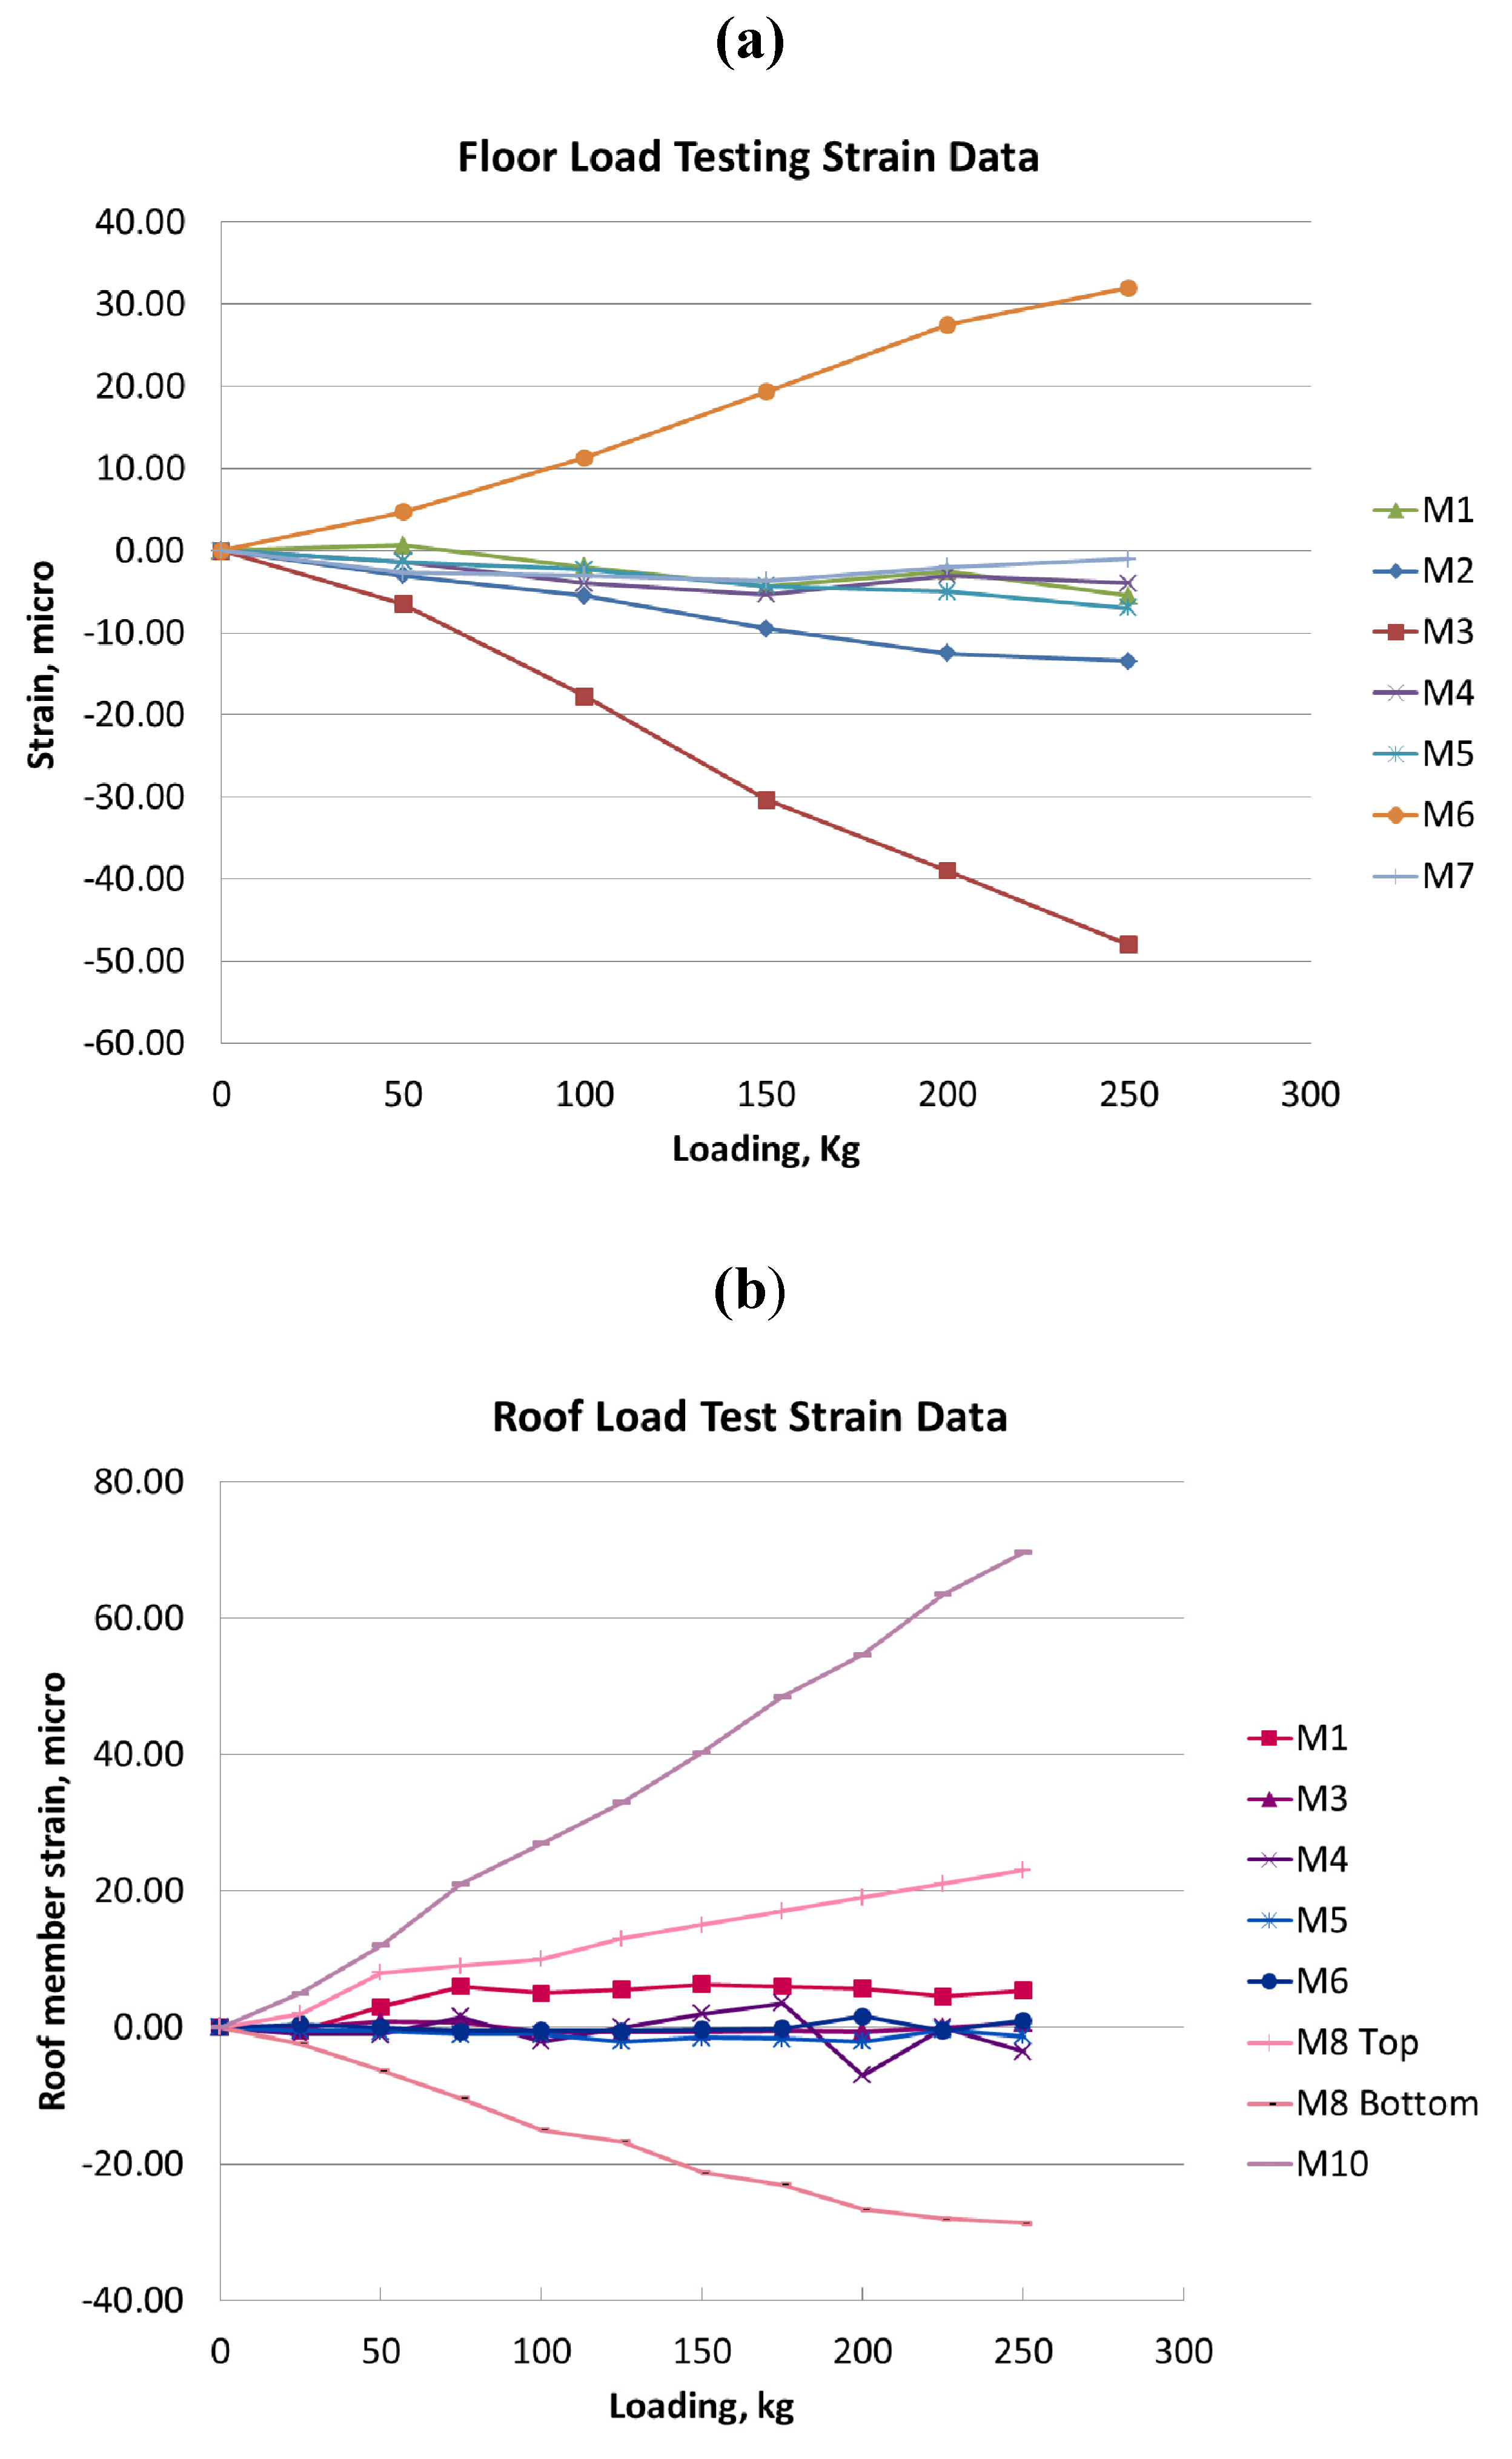
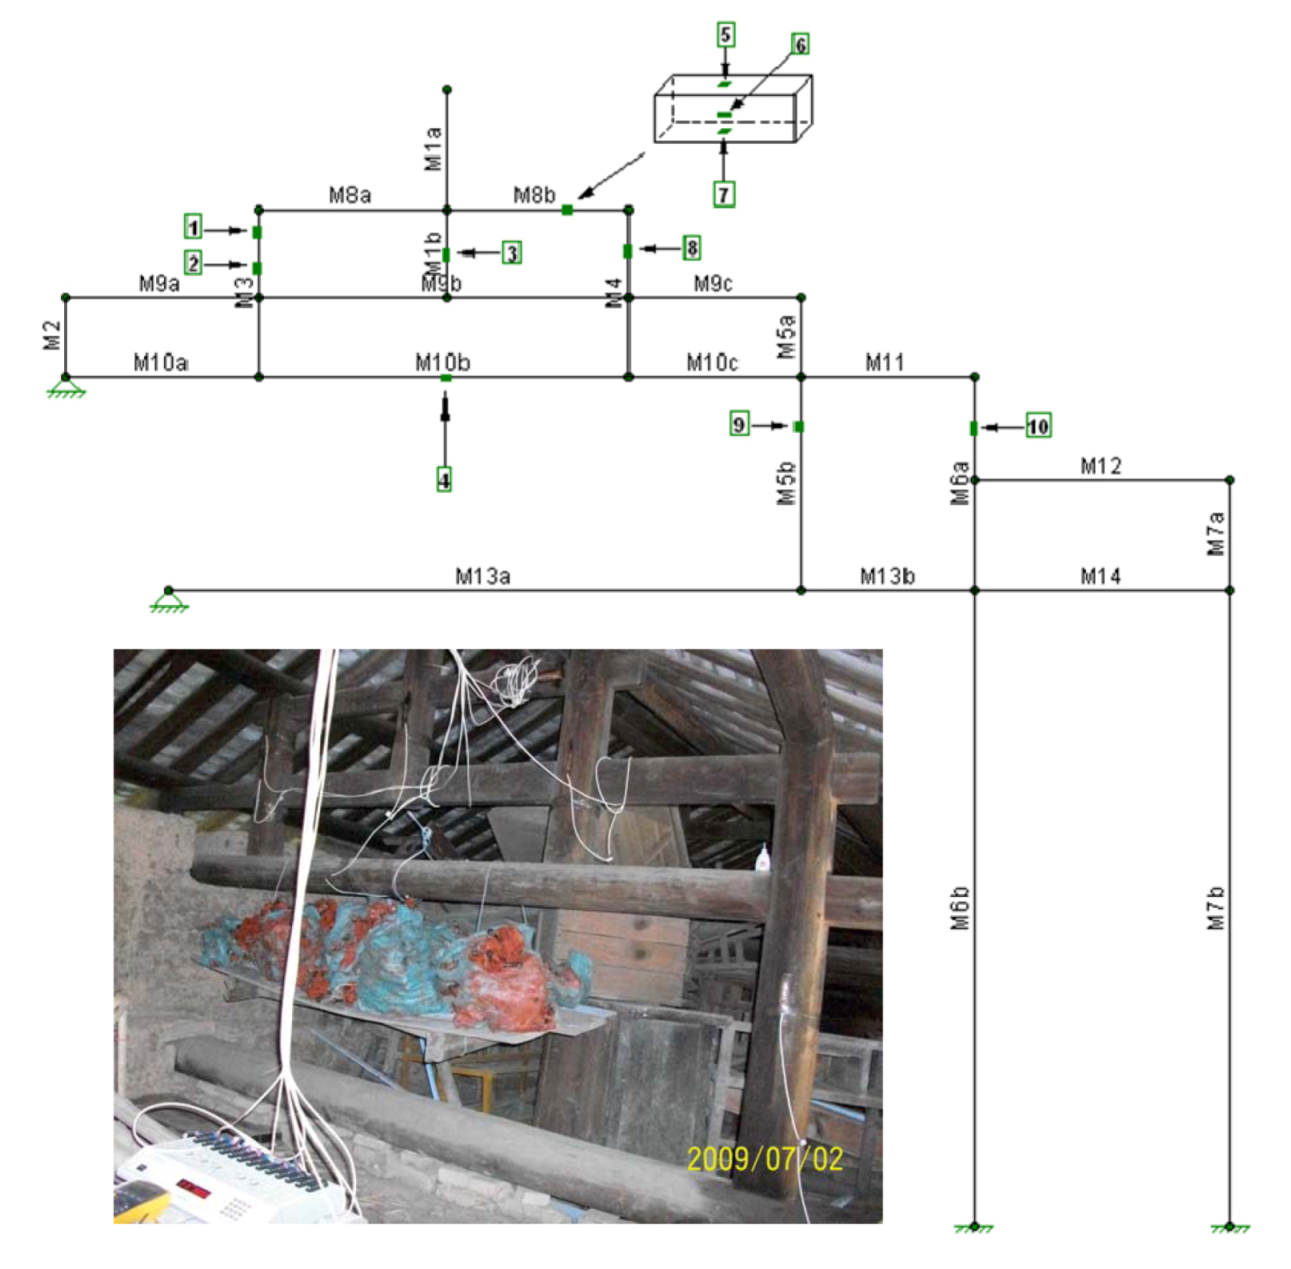
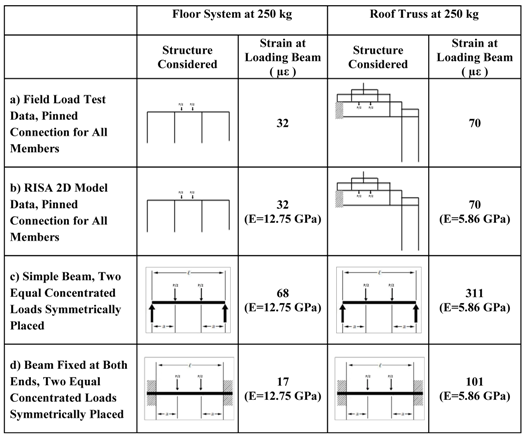
4. Structural Evaluation of Floor and Roof System
4.1. Full Scale Floor System Testing


4.2. Full Scale Roof Truss Testing

4.3. Discussion on Load Sharing Effects of Floor and Roof Truss Systems
 |


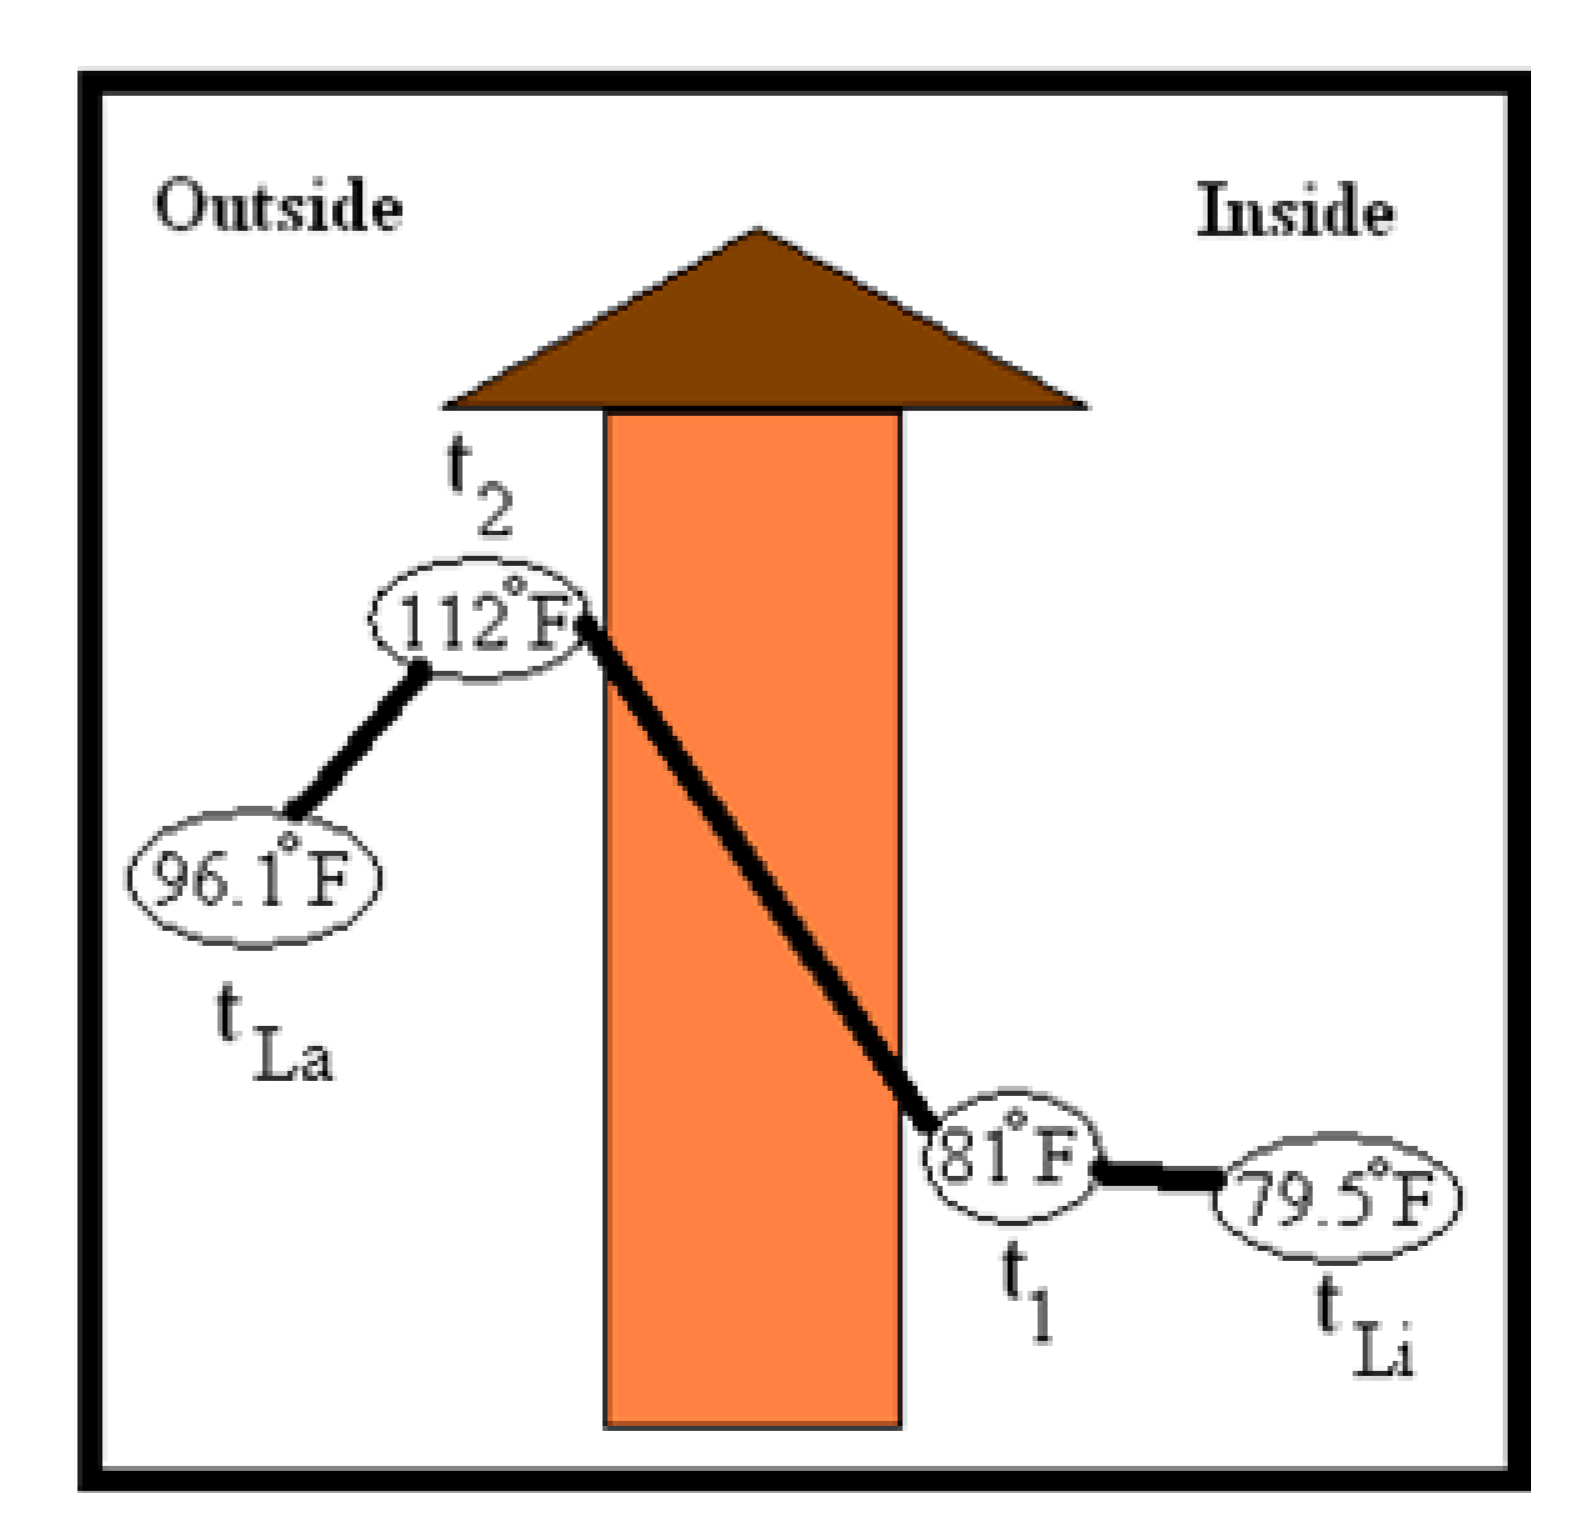
5. Thermal Comfort Analysis of Living in Hakka Tulou
| Temperature data (F) at different locations of thermocouple | |||||||
|---|---|---|---|---|---|---|---|
| Time | Court yard | Inside room | Inner wall surface | Inside inner wall | Inside outer wall | Outer wall surface | Outer yard |
| 10:50 | 80.2 | 80.2 | 81 | 79.9 | 81.9 | 88 | 82.9 |
| 12:00 | 81.5 | 79.7 | 81 | 79.9 | 82.2 | 89 | 84 |
| 13:30 | 82.4 | 79.5 | 83 | 79.9 | 82.9 | 95 | 89.6 |
| 15:20 | 82.9 | 79.5 | 81 | 80.1 | 84.7 | 112 | 96.1 |
| 18:00 | 82.6 | 79.7 | 80 | 80.1 | 90.7 | 101 | 96.6 |

| Location of humidity sensor | |||||
|---|---|---|---|---|---|
| Time | Court yard | Inside room | Inside inner wall | Inside outer wall | Outer yard |
| 10:50 | 74 | 78 | 82 | 66 | 71 |
| 12:00 | 74 | 80 | 82 | 65 | 69 |
| 13:30 | 69 | 79 | 82 | 49 | 60 |
| 15:20 | 69 | 79 | 81 | 32 | 53 |
| 18:00 | 69 | 79 | 81 | 38 | 46 |
6. Conclusions
Acknowledgments
Conflict of Interest
References and Notes
- Jaquin, P.A. Historic Rammed Earth. Available online: http://www.historicrammedearth.co.uk/ (accessed on 10 November 2008).
- NAREBA. North American Rammed Earth Builders Association. Available online: http://www.nareba.org/about.html (accessed on 10 November 2008).
- Collins, H. Desert Living Center in Las Vegas Teaches Sustainability. Available online: http://www.govtech.com/technology/Desert-Living-Center-in-Las-Vegas-Teaches-Sustainability.html (accessed on 17 January 2013).
- Aaberg-Jørgensen, J. The Construction of Clan Homes in Fujian. Available online: http://www.chinadwelling.dk/ (accessed on 10 November 2008).
- Ostrowski, J.; Ostrowski, H.; Li, X.Y.; Ueda, M. Hakka Eco-Village Study Tour Report, Internal Report; ASH‑Inc.: Calgary, AB, Canada, 2007. [Google Scholar]
- Liang, R.; Hota, G. Hakka Tulou and Science. In Hakka Tulou Forum 2009: Lessons to Be Learned, Past, Present and Future; Xiamen University: Xiamen, China, 2009. [Google Scholar]
- Halabe, U.B.; Petro, S.H.; Hota, G. NDE Methods for Highway Bridge Superstructures; Report No. 95-215; West Virginia University Constructed Facilities Center: Morgantown, WV, USA, 1995. [Google Scholar]
- Liang, R.; Stanislawski, D.; Hota, G. Structural Responses of Hakka Rammed Earth Buildings under Earthquake Loads. In Proceedings of International Workshop on Rammed Earth Materials and Sustainable Structures, Xiamen University, Xiamen, China, 28–31 October 2011; Southeast University Press: Xiamen, China, 2011. [Google Scholar]
- Stanislawski, D. Mechanical Response and Finite Element Modeling of Hakka Tulou Rammed Earth Structures.
- Wang, F. A History of the Tulou Buildings; Haifeng Publishing House: Fuzhou, China, 2008. [Google Scholar]
- Green, D.W.; Winandy, J.E.; Kretschmann, D.E. Mechanical properties of wood. In Wood Handbook—Wood as An Engineering Material; US Department of Agriculture Forest Products Laboratory: Madison, WI, USA, 1999; Chapter 4. [Google Scholar]
- PCI, Design Handbook Precast & Prestress Concrete, 4th ed; Precast/Prestressed Concrete Institute: Chicago, CA, USA, 1992.
- Reardon, C.; McGee, C.; Milne, G. Your Home Technical Manual; Australian Government Department of Climate Change and Energy Efficiency: Canberra, Australia, 2010, 4th ed. Available online: http://www.yourhome.gov.au/technical/index.html (accessed on 24 January 2011).
- Ueda, M. A preliminary environmental assessment for the preservation and restoration of Fujian Hakka Tulou complexes. Sustainability 2012, 4, 2803–2817. [Google Scholar] [CrossRef]
- Ciancio, D. Use of Rammed Earth in Aboriginal Remote Communities of Western Australia: A Case Study on Sustainability and Thermal Properties. In Proceedings of Int. Workshop on Rammed Earth Materials and Sustainable Structures, Xiamen University, Xiamen, China, 28–31 October 2011; Southeast University Press: Xiamen, China, 2011. [Google Scholar]
- Watanabe, T. Study of Energy Consumption and Indoor Environment Problems of Residential Buildings in China by Research Committee of Architectural Institute of Japan. Available online: http://news-sv.aij.or.jp/t300/HP/English3.pdf (accessed on 10 November 2008).
© 2013 by the authors; licensee MDPI, Basel, Switzerland. This article is an open-access article distributed under the terms and conditions of the Creative Commons Attribution license (http://creativecommons.org/licenses/by/3.0/).
Share and Cite
Liang, R.; Hota, G.; Lei, Y.; Li, Y.; Stanislawski, D.; Jiang, Y. Nondestructive Evaluation of Historic Hakka Rammed Earth Structures. Sustainability 2013, 5, 298-315. https://doi.org/10.3390/su5010298
Liang R, Hota G, Lei Y, Li Y, Stanislawski D, Jiang Y. Nondestructive Evaluation of Historic Hakka Rammed Earth Structures. Sustainability. 2013; 5(1):298-315. https://doi.org/10.3390/su5010298
Chicago/Turabian StyleLiang, Ruifeng, Gangarao Hota, Ying Lei, Yanhao Li, Daniel Stanislawski, and Yongqiang Jiang. 2013. "Nondestructive Evaluation of Historic Hakka Rammed Earth Structures" Sustainability 5, no. 1: 298-315. https://doi.org/10.3390/su5010298
APA StyleLiang, R., Hota, G., Lei, Y., Li, Y., Stanislawski, D., & Jiang, Y. (2013). Nondestructive Evaluation of Historic Hakka Rammed Earth Structures. Sustainability, 5(1), 298-315. https://doi.org/10.3390/su5010298