1. Introduction
The sustained expansion of electricity generation infrastructure based on renewable energy resources, together with the continuous growth in electricity demand driven by productive and commercial activities, has become a determining factor in ensuring secure and continuous power supply over time [
1]. At the same time, the intensive integration of generation based on intermittent energy sources has transformed the operational dynamics of electric power systems and has increased the operational relevance of renewable variability in system analysis and dispatch planning [
2]. In addition, the growing participation of demand-side resources and weather-dependent generation introduces major operational challenges for maintaining secure, stable, and economically efficient system operation [
3].
As reported in [
4], the quality of dispatch decisions is strongly influenced by the accuracy of demand and renewable-resource forecasts. In large regional electric networks, this issue becomes especially relevant because system scale, heterogeneity, and operational complexity condition the way in which generation scheduling problems are formulated and solved. In this broader context, uncertainty-aware formulations such as stochastic and robust optimization have become increasingly important in the literature [
5]. However, the present study adopts a deterministic day-ahead hourly scheduling perspective in order to establish a clear benchmark for analyzing the coordinated effect of interzonal power exchange and battery energy storage on operating cost, renewable utilization, and sustainability-oriented performance.
The operational contribution of intermittent non-dispatchable generation can be enhanced by reducing, or at least properly managing, the stochastic nature associated with its production [
6]. Although local meteorological conditions impose an upper bound on the amount of energy that can be harvested at a given instant, modern renewable generation technologies allow an increasingly relevant degree of control at the technology or unit level [
7]. In parallel, renewable generation technologies typically require considerable upfront investment, which implies that system operation should be organized in a way that facilitates economically viable recovery of investment costs [
8]. In this context, large-scale energy storage systems have emerged as strategic assets because they enable residual or surplus energy to be managed through optimized charging and discharging cycles [
9]. Another critical issue is associated with the operational and economic limitations of conventional dispatchable sources. For example, the heat rates of coal- and gas-based plants may deteriorate significantly when they are forced to operate at low loading levels, while frequent ramping and start-up/shut-down actions required to accommodate renewable variability may impose excessive thermal stress and operational rigidity on plant equipment [
10].
Recent research has also shown that the flexibility available to interconnected power systems is no longer limited to conventional storage technologies alone. In particular, the increasing coupling between electricity networks, electrified transportation, and building systems has opened new possibilities for coordinated operation based on spatial-temporal flexibility from cross-sector resources. In parallel, emerging large-scale electricity consumers such as data centers are increasingly being analyzed as flexible demand resources or virtual storage systems capable of supporting load balancing and economic operation in interconnected networks. These developments broaden the current research landscape of coordinated dispatch and flexibility management [
11,
12]. Nevertheless, the present study focuses on the coordinated hourly dispatch of electrical generation and battery energy storage within a multi-zone power-system framework, which allows the analysis to remain centered on interzonal exchange, renewable integration, and cost-effective operational scheduling.
Therefore, any meaningful economic dispatch algorithm for modern power systems must explicitly account for the costs and operational constraints associated with both conventional and renewable generation sources. Traditionally, mathematical formulations of the economic dispatch problem have focused on minimizing the operating cost associated with the generating plants required to meet demand, commonly represented as a single control area of the power system [
13]. However, contemporary electric systems are no longer composed of a homogeneous fleet of conventional generation units. Instead, they integrate conventional and intermittent renewable resources together with increasingly relevant technological elements associated with energy reserve and accumulation. Consequently, the non-homogeneous nature of present-day generation portfolios, as well as the incorporation of storage systems, gives rise to new challenges and opportunities for system operators to schedule generation optimally in order to satisfy load demand through a more sustainable and equitable operation while respecting the applicable system constraints [
14].
Since renewable and conventional generation resources are usually geographically distributed, the problem naturally evolves into a multi-area or multi-zone dispatch framework. In this setting, interconnected electric power systems are concerned with coordinating multiple areas through geographically distributed energy groups that must be supplied economically and securely [
15]. Accordingly, determining optimal operating states requires the compilation and coordinated processing of detailed data related to conventional and renewable generating units, power transmission facilities, and forecasted demand in interconnected areas, in order to formulate and solve large-scale generation scheduling problems at the system-wide level [
16]. This solution paradigm is generally centralized and highly complex because of the large number of decision variables and constraints involved [
17]. Furthermore, in addition to technical and regulatory issues affecting system operator decisions, the exchange of network-related data among areas may be restricted by privacy concerns and commercial sensitivity, which complicates efficient centralized coordination [
16]. As a result, considerable research interest has been devoted to the development of solution approaches that improve the coordination of interconnected areas while overcoming the limitations associated with fully centralized strategies and non-transparent data sharing [
18].
Under these conditions, several studies have addressed the modeling and solution of the multi-area economic dispatch problem. For instance, ref. [
19] solved the multi-area economic dispatch problem with tie-line constraints using evolutionary programming. A direct search method for dispatch problems considering transmission-capacity limitations was presented in [
20]. The work reported in [
21] proposed a covariance matrix adaptation evolutionary strategy for multi-area dispatch problems using a Karush–Kuhn–Tucker optimality criterion. Likewise, ref. [
22] employed particle swarm optimization (PSO) to solve the economic allocation of generating units in multiple areas while incorporating line transfer capacities and spinning-reserve sharing in order to improve security and reliability. In [
23], a neural-network-based nonlinear optimization approach was introduced to facilitate the study of interconnected multi-area economic dispatch under security constraints. In [
24], the multi-area economic dispatch problem was formulated with multiple constraints, and the quality of the obtained solutions was compared for several differential-evolution variants and an improved PSO strategy. Similarly, ref. [
25] applied artificial bee colony optimization to determine the economic allocation of generating plants located in multiple areas under different system specifications. More recent studies have also emphasized coordinated planning under renewable uncertainty, multi-energy coupling, reserve co-optimization, and distributed or semi-decentralized solution strategies in interconnected systems [
16,
18,
26,
27,
28]. Although these studies have substantially advanced the state of the art, they often emphasize planning horizons, uncertainty-aware coordination, reserve sharing, or distributed solution architectures. By contrast, the present work concentrates on deterministic day-ahead hourly dispatch and explicitly integrates interzonal exchange, renewable generation, hydroelectric energy quotas, and battery energy storage in a unified nonlinear programming framework for a multi-zone electrical system. In this sense, the contribution of the manuscript lies not in replacing robust or stochastic formulations, but in providing a structured operational benchmark that isolates and quantifies the coordinated effect of interconnection and storage on hourly cost, renewable utilization, and environmental performance.
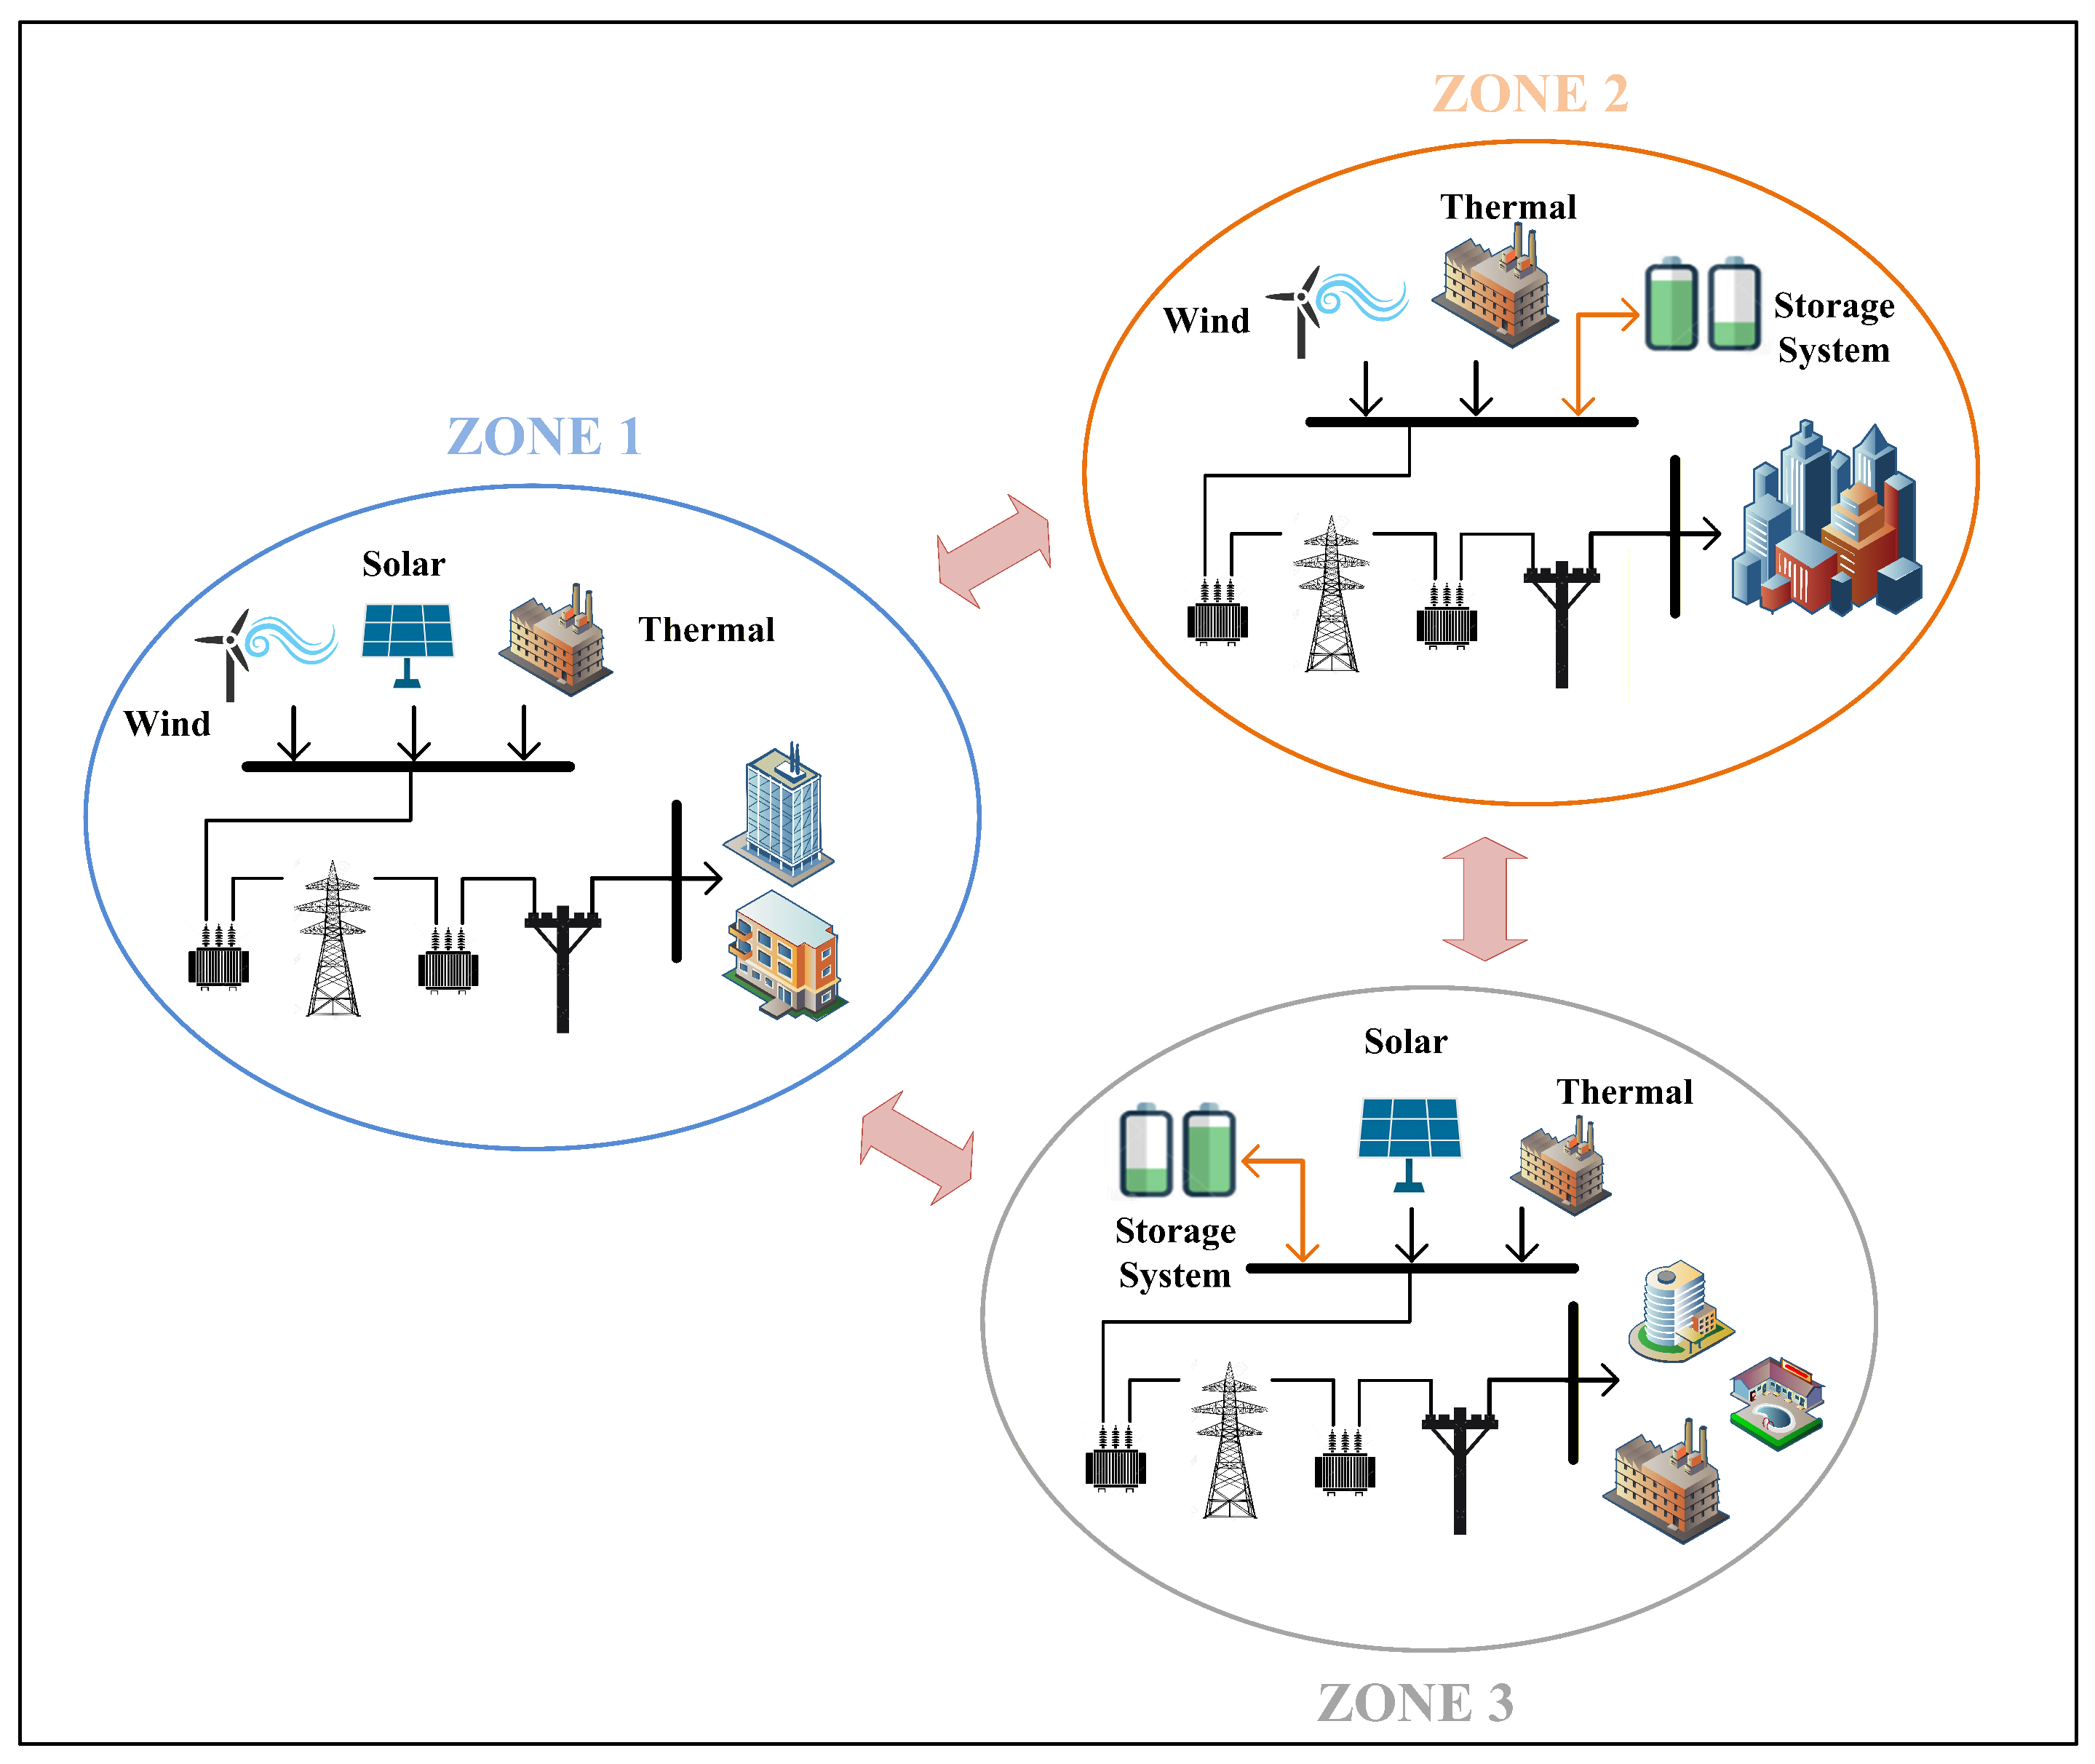
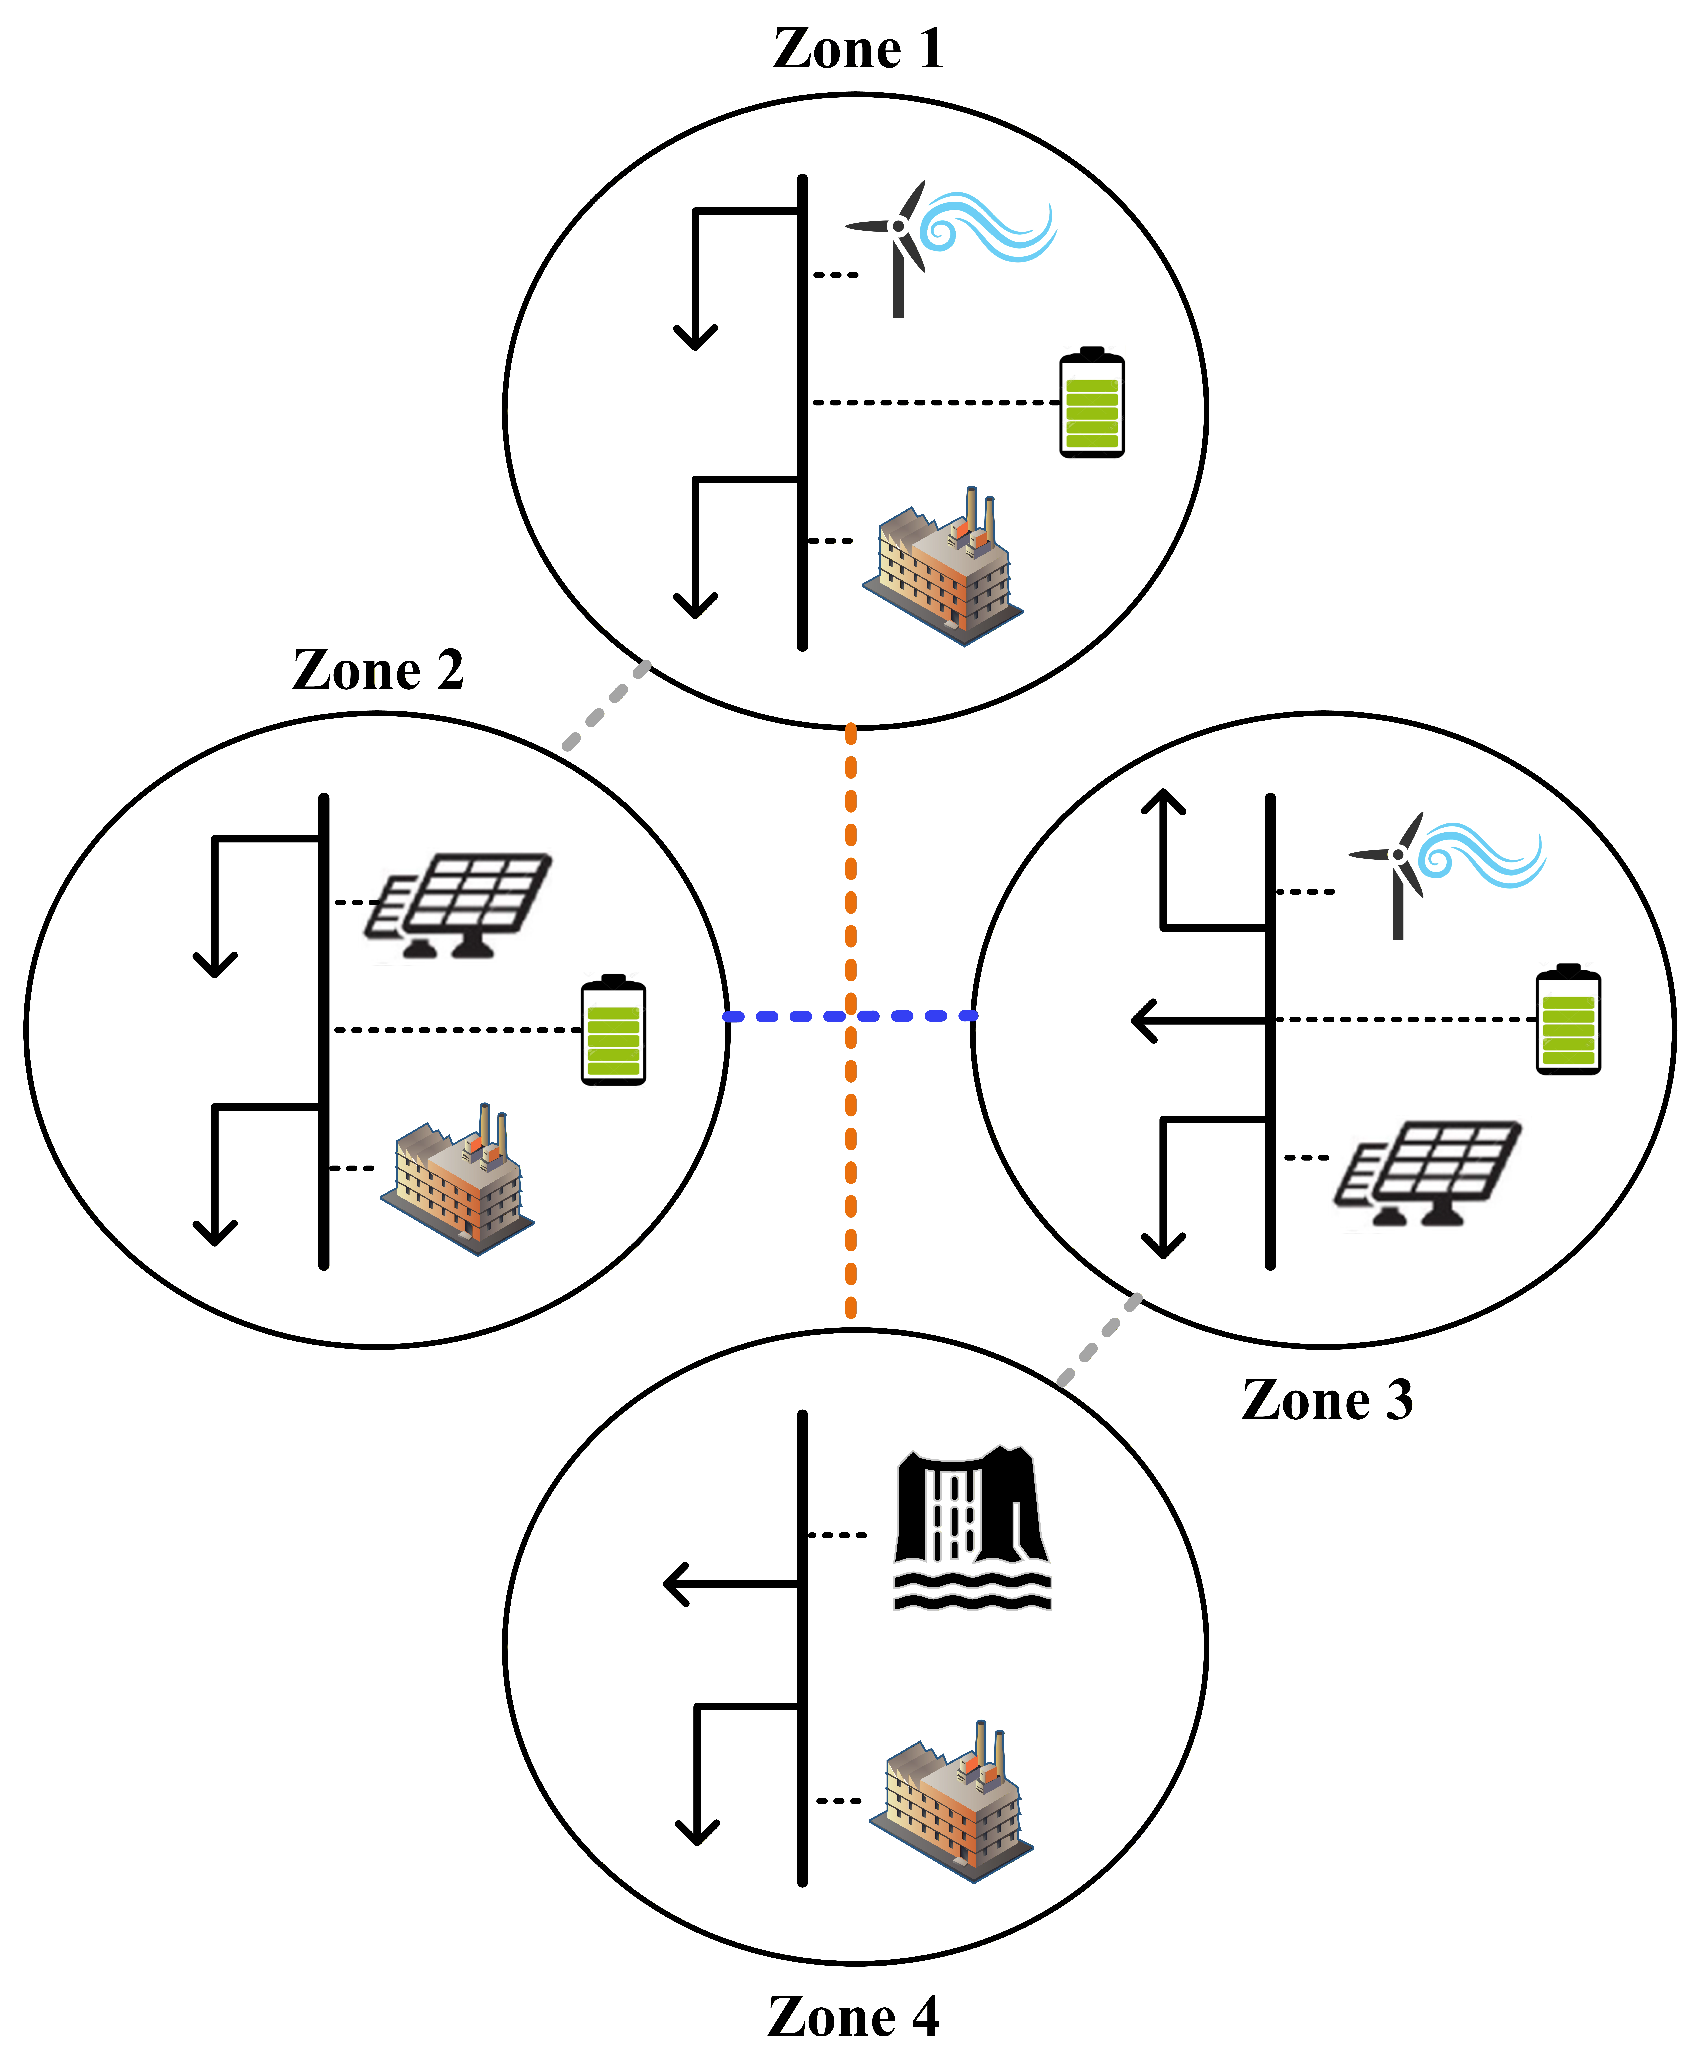
In this work, a nonlinear mathematical optimization model is developed to determine the optimal hourly dispatch of generating plants for electricity supply in an interconnected multi-zone system. The formulation explicitly incorporates conventional generation, renewable generation, battery energy storage systems, and interzonal power exchanges in order to minimize the total operating cost while satisfying generation limits, load-supply requirements, storage constraints, and transfer-capacity restrictions. The conceptual structure of the system under study is shown in
Figure 1, where multiple electrically interconnected zones are supplied by a heterogeneous generation portfolio and storage devices provide operational flexibility to absorb surplus energy or inject power during deficit periods. This operating scheme is consistent with the physical and mathematical structure of the proposed model, since each zone must satisfy its demand while coordinated exchanges among areas and storage operations improve the effective utilization of renewable energy resources.
The contributions of this study can be summarized as follows. First, a nonlinear optimization framework is formulated for the hourly economic dispatch of interconnected multi-zone power systems integrating thermal, hydroelectric, wind, photovoltaic, and battery energy storage resources within a unified mathematical model. Second, the formulation explicitly represents interzonal power exchanges, thermal ramp-rate limits, battery state-of-charge dynamics, storage operating bounds, and hydroelectric energy quotas, thereby preserving the main operational couplings that govern coordinated multi-zone dispatch. Third, the proposed framework is applied to a three-zone benchmark system in order to compare autonomous zonal operation against coordinated interconnected operation with storage support and to quantify the resulting technical, economic, and environmental effects. In this sense, unlike studies primarily focused on stochastic dispatch, robust coordination, reserve sharing, or long-term multi-area planning, the present work is deliberately centered on deterministic hourly operation and on the explicit operational interaction among interzonal exchanges, renewable generation, hydroelectric quotas, and battery-supported flexibility.
To position the proposed framework more explicitly with respect to the recent literature,
Table 1 summarizes representative studies and contrasts them with the present work according to verified comparison dimensions. This comparison clarifies the specific contribution of the manuscript in terms of coordinated multi-zone operation, problem scope, renewable and storage integration, reserve or reliability considerations, environmental or sustainability-related assessment, uncertainty treatment, and solution approach. It should be emphasized, however, that this literature-based positioning is intended to delimit the methodological contribution of the study rather than to provide a numerical benchmark against alternative optimization methods or independently published test systems.
To facilitate the interpretation of the comparative sustainability results,
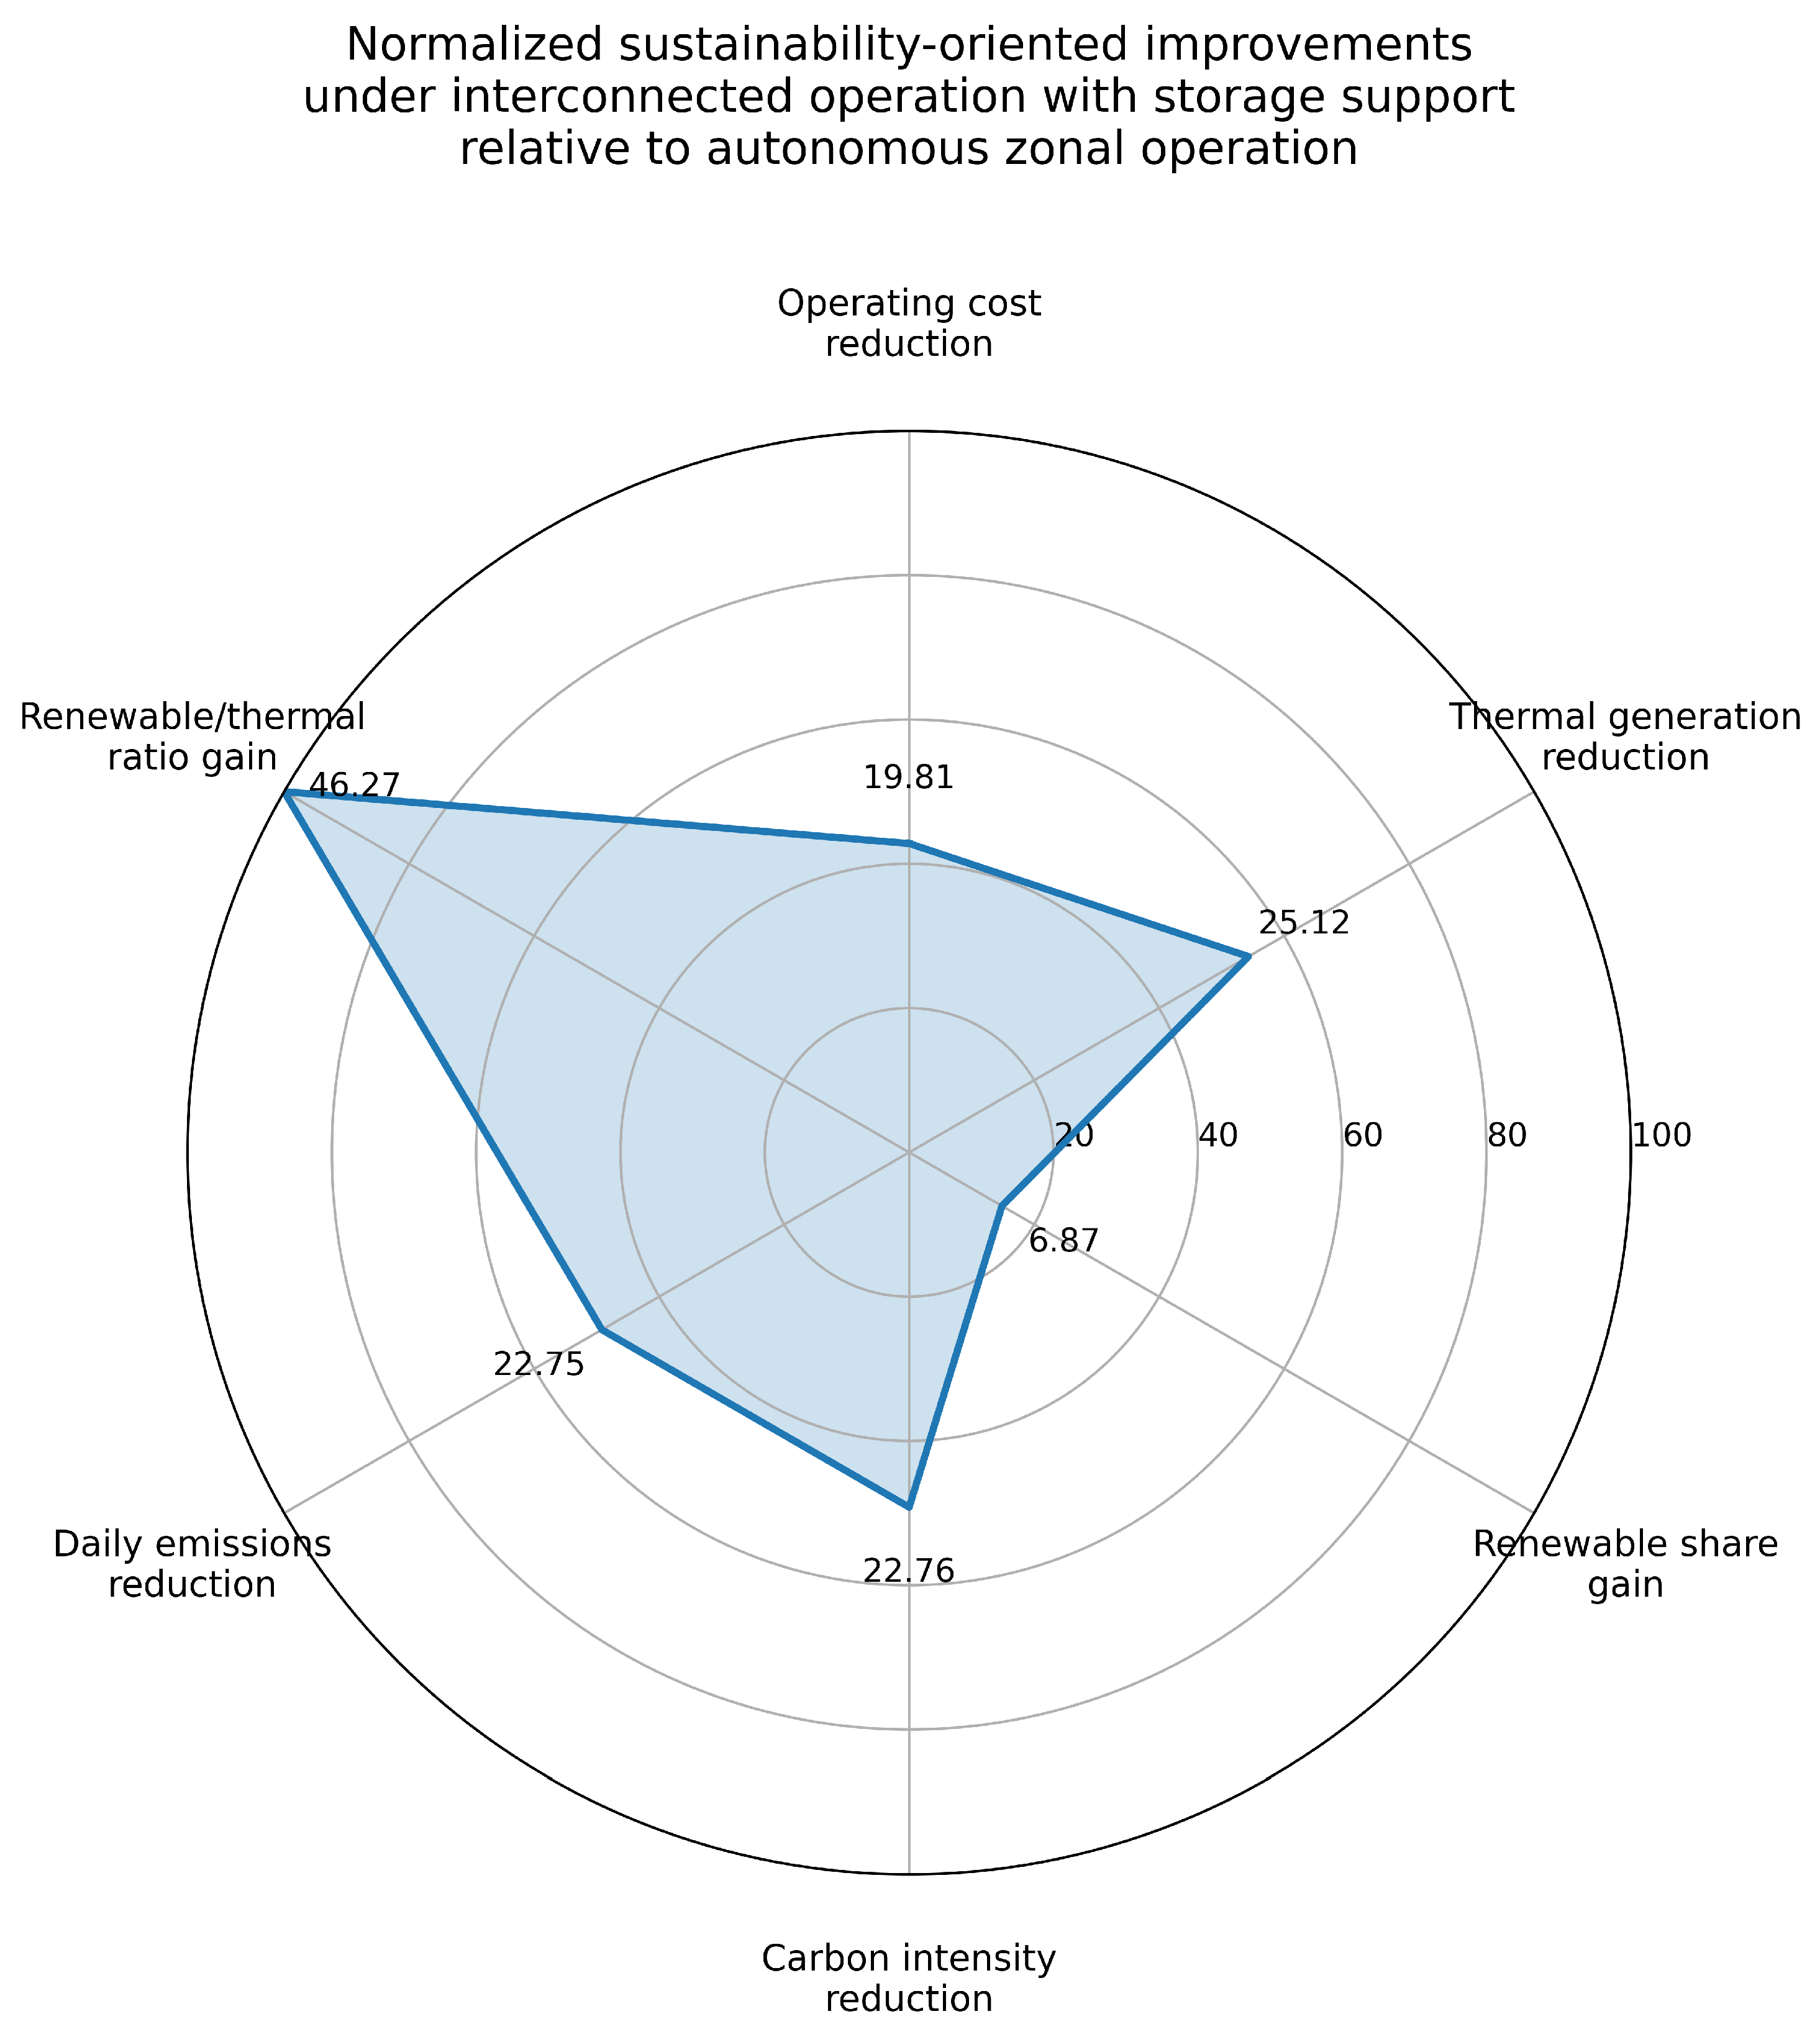
Figure 2 presents a radar-chart representation of the principal sustainability-oriented improvements achieved under interconnected operation with storage support relative to autonomous zonal operation. The figure is constructed from the comparative indicators reported in
Table 2, namely operating cost reduction, thermal generation reduction, renewable share gain, carbon intensity reduction, daily emissions reduction, and the increase in the renewable-to-thermal ratio. For visual comparability, the plotted values were normalized to a common radial scale from 0 to 100 using the maximum relative improvement among the selected indicators, while the original non-normalized values are retained as numerical annotations on each axis. This graphical representation provides a compact multidimensional view of the economic, energetic, and environmental gains obtained through the coordinated dispatch strategy.
The remainder of this paper is organized as follows.
Section 2 presents the theoretical framework related to multi-zone economic dispatch, renewable generation, and energy storage systems.
Section 3 describes the materials and methods, including the mathematical formulation of the proposed nonlinear optimization model, the computational implementation, and the analyzed operating scenarios.
Section 4 presents and discusses the obtained results from a comparative perspective. Finally,
Section 5 summarizes the main conclusions of the study and outlines possible directions for future research.
3. Materials and Methods
This section presents the mathematical formulation, computational implementation, and case-study specification adopted for the hourly economic dispatch problem analyzed in this work. The proposed methodology is formulated as a nonlinear optimization model in which the hourly active-power output of each generating unit is determined for every zone of the interconnected system. The formulation explicitly represents conventional generation, renewable generation, interzonal power exchange, and battery energy storage systems (BESS), thereby enabling a coordinated dispatch strategy over the 24-h scheduling horizon.
From an optimization standpoint, the model seeks the least-cost operating schedule that satisfies the hourly demand of each zone while preserving the technical feasibility of generation units, storage devices, and interconnection links. The resulting problem is nonlinear because the operating cost of thermal generation is modeled through quadratic functions, whereas the remaining technologies are represented through linear variable-cost terms. The storage systems are modeled through intertemporal state equations and operating bounds, which introduce temporal coupling between successive hours and increase the physical realism of the formulation. The complete model therefore combines spatial coupling, through power exchange among zones, and temporal coupling, through thermal ramp limits and storage dynamics.
3.1. Sets, Parameters, Variables, and Nomenclature
For mathematical consistency, the notation employed throughout the formulation is summarized in Nomenclature. The symbols include sets, indices, decision variables, and technical and economic parameters associated with conventional generation, renewable generation, hydroelectric production, energy storage, interzonal exchange, and hourly demand.
For compactness, the dispatch problem can be stated as the minimization of the total operating cost over all zones and hourly intervals, subject to power-balance constraints, generating-unit operating limits, storage dynamics, and interconnection constraints. This compact representation is expressed as
where
denotes the vector of decision variables and
denotes the feasible set induced by the physical and operational constraints defined in the following subsections.
For ease of reproducibility, the expanded form of the compact model in Equation (
1) consists of minimizing the total operating cost defined by Equations (
2)–(
4), subject to the interzonal exchange constraints in Equations (
5) and (
6), the generator operating limits in Equations (
7) and (
8), the zonal power-balance relation in Equation (
9), the thermal ramp-rate constraints in Equations (
10) and (
11), the BESS state-of-charge dynamics in Equations (
12) and (
13), the BESS operating bounds in Equations (
14)–(
16), and the hydroelectric energy-quota constraints in Equations (
17) and (
18).
3.2. Objective Function
The economic objective of the model is to minimize the total operating cost of the interconnected multi-zone system over the 24-h study horizon. The total cost is decomposed into two components: the operating cost of thermal generation and the operating cost associated with renewable and hydroelectric generation. Under the available data structure, battery energy storage is represented through its physical operation and its contribution to the zonal power balance. However, no explicit storage degradation or cycling cost is incorporated in the objective function. Accordingly, the BESS scheduling results should be interpreted as a benchmark representation of short-term operational flexibility rather than as a lifecycle-cost-optimal storage management strategy. This modeling choice preserves the focus of the study on coordinated dispatch, interzonal exchange, and renewable integration under a deterministic hourly scheduling framework.
The total system operating cost is defined as
The thermal-generation cost is modeled by means of quadratic cost functions:
Equation (
3) captures the nonlinear fuel-cost behavior of thermal units. The coefficient
determines the curvature of the cost function,
defines its linear marginal component, and
accounts for the constant operating term. This formulation is standard in economic dispatch because it preserves the convex economic response of thermal units over their operating range.
The renewable and hydroelectric operating cost is represented through linear terms:
Equation (
4) allows the optimization model to account for the variable operating cost of wind, photovoltaic, and hydroelectric resources using the unit-price data available for the case study. By combining (
3) and (
4), the model determines the economically optimal hourly schedule while preserving the technological distinctions among dispatchable thermal units, variable renewable resources, and hydroelectric units.
3.3. Constraint Formulation
The feasibility region of the dispatch problem is defined by a set of constraints that represent the electrical and operational behavior of the system. These constraints include interzonal exchange limits, generator operating bounds, zonal power balance, thermal ramping, storage dynamics, storage operating bounds, and hydroelectric energy quotas. Within the scope of the present formulation, no explicit spinning-reserve constraints, contingency states, or N-1 security requirements are imposed. Accordingly, the feasible set corresponds to a deterministic economic-dispatch benchmark under nominal operating conditions.
3.3.1. Interzonal Power-Exchange Constraints
Because the system consists of electrically interconnected zones, the power exchanged between any pair of zones must remain within the admissible transfer-capacity limit of the corresponding interconnection link. The lower and upper bounds of interzonal exchange are given by
To ensure directional consistency of bilateral transfers, antisymmetry of the exchanged power is imposed through
Equations (
5) and (
6) guarantee a physically consistent representation of interzonal exchanges and prevent infeasible schedules based on unlimited or contradictory transfers. In the present formulation, interzonal power transfers are represented as lossless bilateral exchanges bounded by transfer-capacity limits. Therefore, the proposed dispatch framework does not explicitly incorporate transmission-loss terms in the interzonal exchange equations or in the zonal power-balance relation. This simplifying assumption was adopted in order to preserve the analytical focus on coordinated generation scheduling, storage operation, and transfer-capacity management within the three-zone benchmark system. Consequently, the reported economic and environmental benefits should be interpreted under an idealized interzonal exchange representation in which transmission losses are neglected.
3.3.2. Generator Operating Limits
Each generating unit must operate within its admissible output range. For dispatchable technologies, namely thermal and hydroelectric units, the power output is bounded by
For wind and photovoltaic generation, the dispatchable output is additionally limited by the hourly availability of the primary resource:
These bounds distinguish between controllable generation technologies and resource-limited renewable technologies, thereby preserving the physical realism of the formulation.
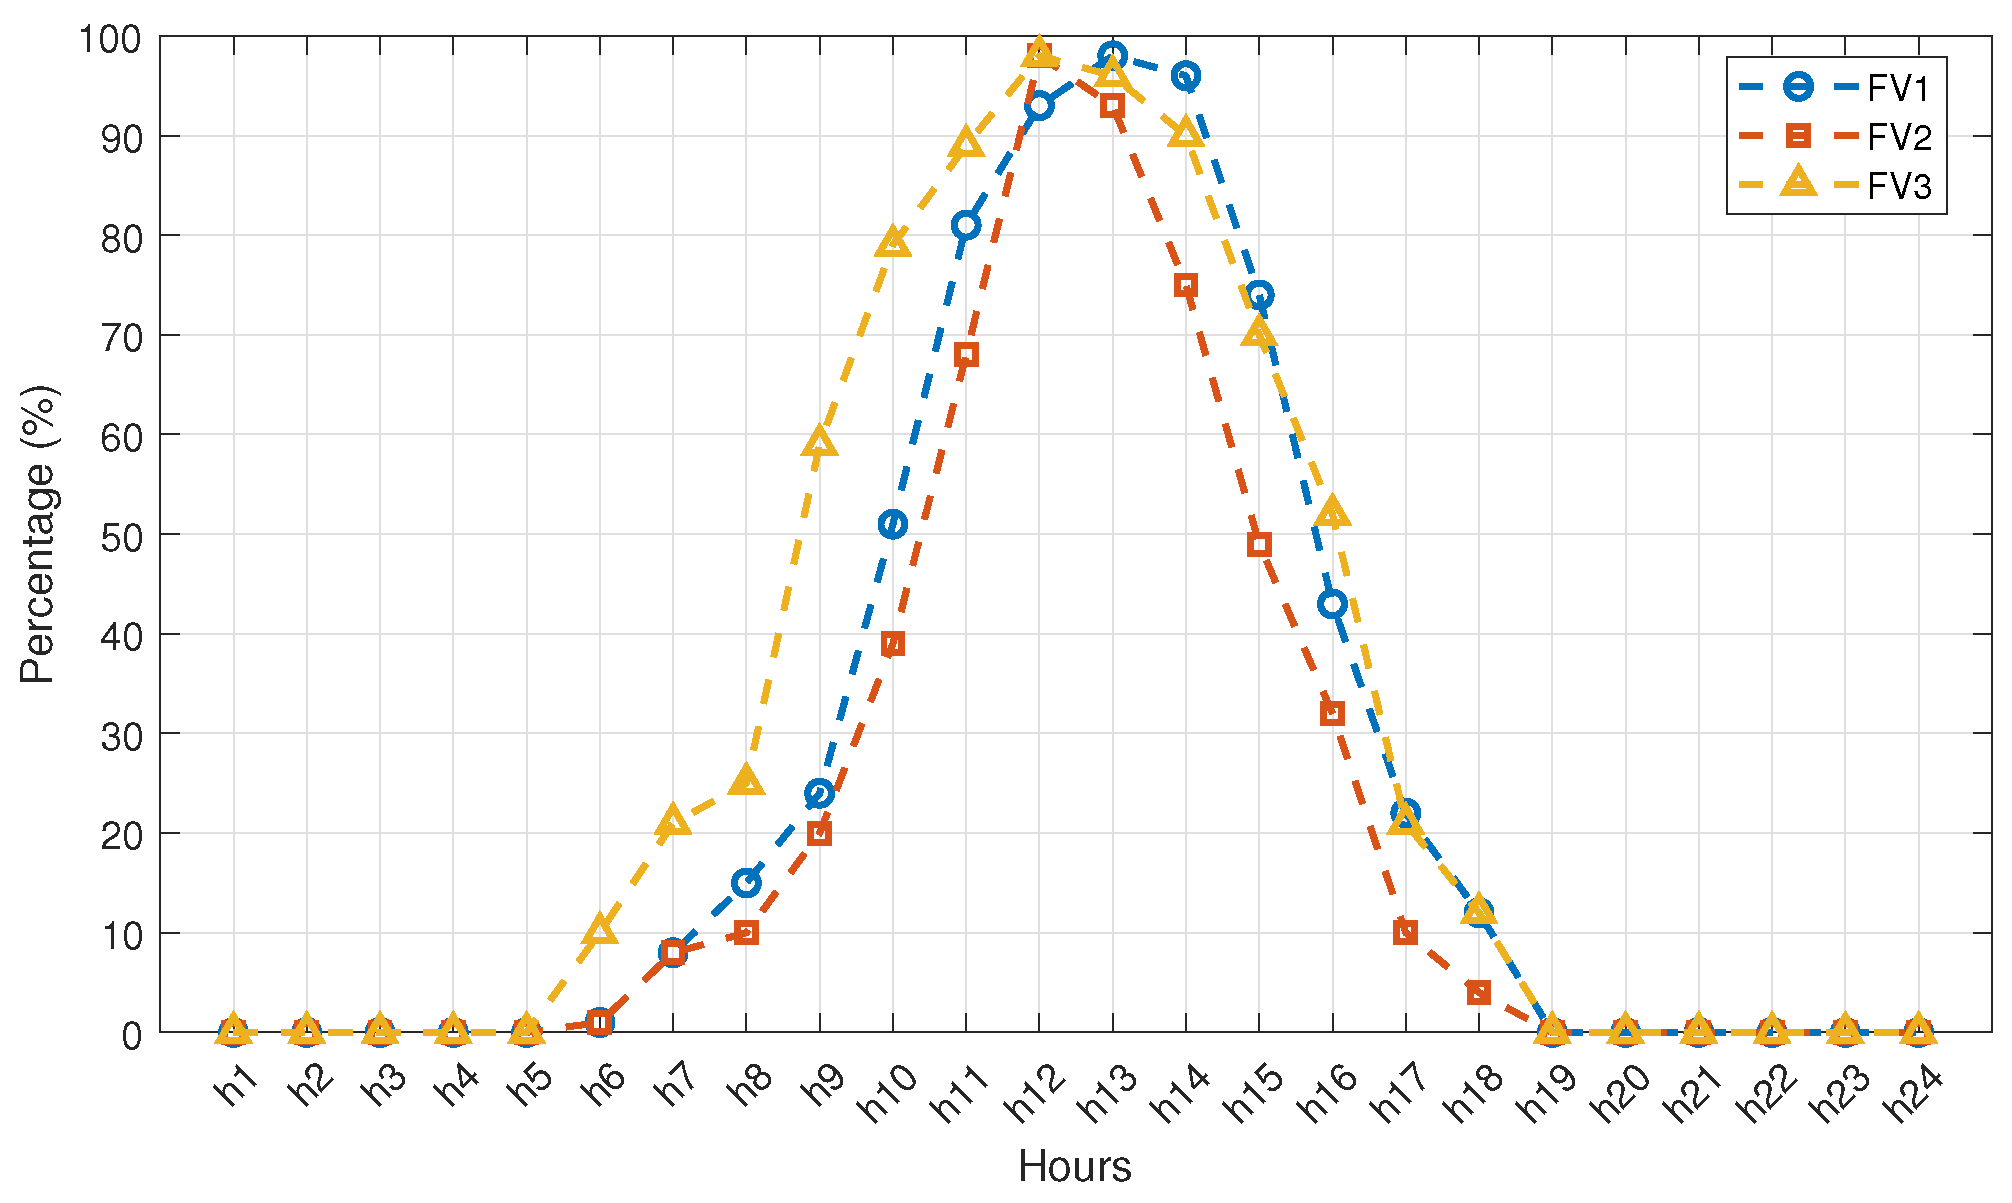
In this formulation, the hourly renewable-resource profiles are treated as exogenous availability inputs through the parameter . Therefore, wind and photovoltaic generation are not modeled as fixed injections, but as dispatchable variables bounded above by the available resource at each hour. Under this representation, renewable curtailment is implicitly allowed whenever the optimal solution requires dispatching less than the maximum available renewable power in order to satisfy the global cost-minimization objective and the operational constraints of the interconnected system.
3.3.3. Zonal Power-Balance Constraint
At each hour, the electrical demand of each zone must be satisfied by the combination of local generation, storage charging/discharging decisions, and net interzonal exchange. The hourly power-balance equation is written as
Equation (
9) is the central coupling relation of the model. It links generation dispatch, storage operation, and interzonal transfers in a single nodal relation and guarantees the adequacy of supply for every zone and every hour of the study horizon.
3.3.4. Thermal Ramp-Rate Constraints
The output of thermal generators cannot vary arbitrarily between consecutive hours because their operation is constrained by ramping capabilities. These dynamic limits are represented through the ramp-up and ramp-down inequalities
These constraints prevent unrealistic dispatch trajectories and preserve the temporal continuity of thermal-unit operation.
3.3.5. Battery State-of-Charge Dynamics
The dynamic evolution of each storage unit is represented by an hourly state-of-charge equation that relates the energy stored at two consecutive periods while accounting for charging and discharging efficiencies:
The initial state of charge of each storage system is imposed through
Equations (
12) and (
13) introduce intertemporal dependence into the optimization problem and allow the model to schedule charging and discharging actions according to both system conditions and economic signals.
3.3.6. Battery Operating Limits
The state of charge and charging/discharging powers of each storage unit must remain within admissible operating ranges. The state-of-charge bounds are given by
The charging-power and discharging-power bounds are defined, respectively, as
These limits ensure that storage operation remains consistent with energy-capacity restrictions and with the admissible charging and discharging regimes specified for the case study. In operational terms, the adopted charging and discharging bounds are defined as normalized fractions of the installed energy capacity, which provides a consistent way of representing finite BESS power capability within the benchmark formulation. Under this parameterization, the admissible charging and discharging rates remain physically linked to the storage size of each unit and prevent unrealistic power exchanges relative to the installed energy volume.
3.3.7. Hydroelectric Energy-Quota Constraints
Hydroelectric production is limited not only by hourly power capacity but also by the total energy that can be dispatched over the study horizon. To represent this characteristic, the formulation incorporates an energy-quota restriction for each hydroelectric unit:
For completeness, the aggregate hydroelectric production of the full system must also satisfy
These relations prevent the optimization model from assigning hydroelectric schedules that exceed the available water-energy budget. Under this representation, the hydroelectric units are modeled through an aggregate daily energy quota rather than through a detailed hydraulic formulation. Therefore, the proposed model captures the intertemporal limitation associated with the total hydroelectric energy that can be dispatched over the 24-h horizon, while it does not explicitly represent reservoir-volume dynamics, hydraulic head variations, water inflows, or cascade coupling among hydro plants. Accordingly, the hydroelectric schedules obtained in this study should be interpreted as quota-constrained dispatch results consistent with the benchmark scope of the formulation.
3.4. Computational Solution Algorithm
The mathematical formulation presented above defines a nonlinear constrained optimization problem whose solution requires a structured computational implementation. In methodological terms, the numerical procedure must: (i) read and organize the zonal input data; (ii) instantiate the decision variables and model parameters; (iii) assemble the objective function and all operational constraints; (iv) solve the resulting nonlinear program with a suitable numerical solver; and (v) verify the validity of the obtained solution before performing result extraction and analysis. Since the dispatch variables are coupled both spatially, through interzonal exchanges, and temporally, through thermal ramping and battery state-of-charge dynamics, an explicit description of the computational workflow is necessary to ensure methodological clarity and reproducibility.
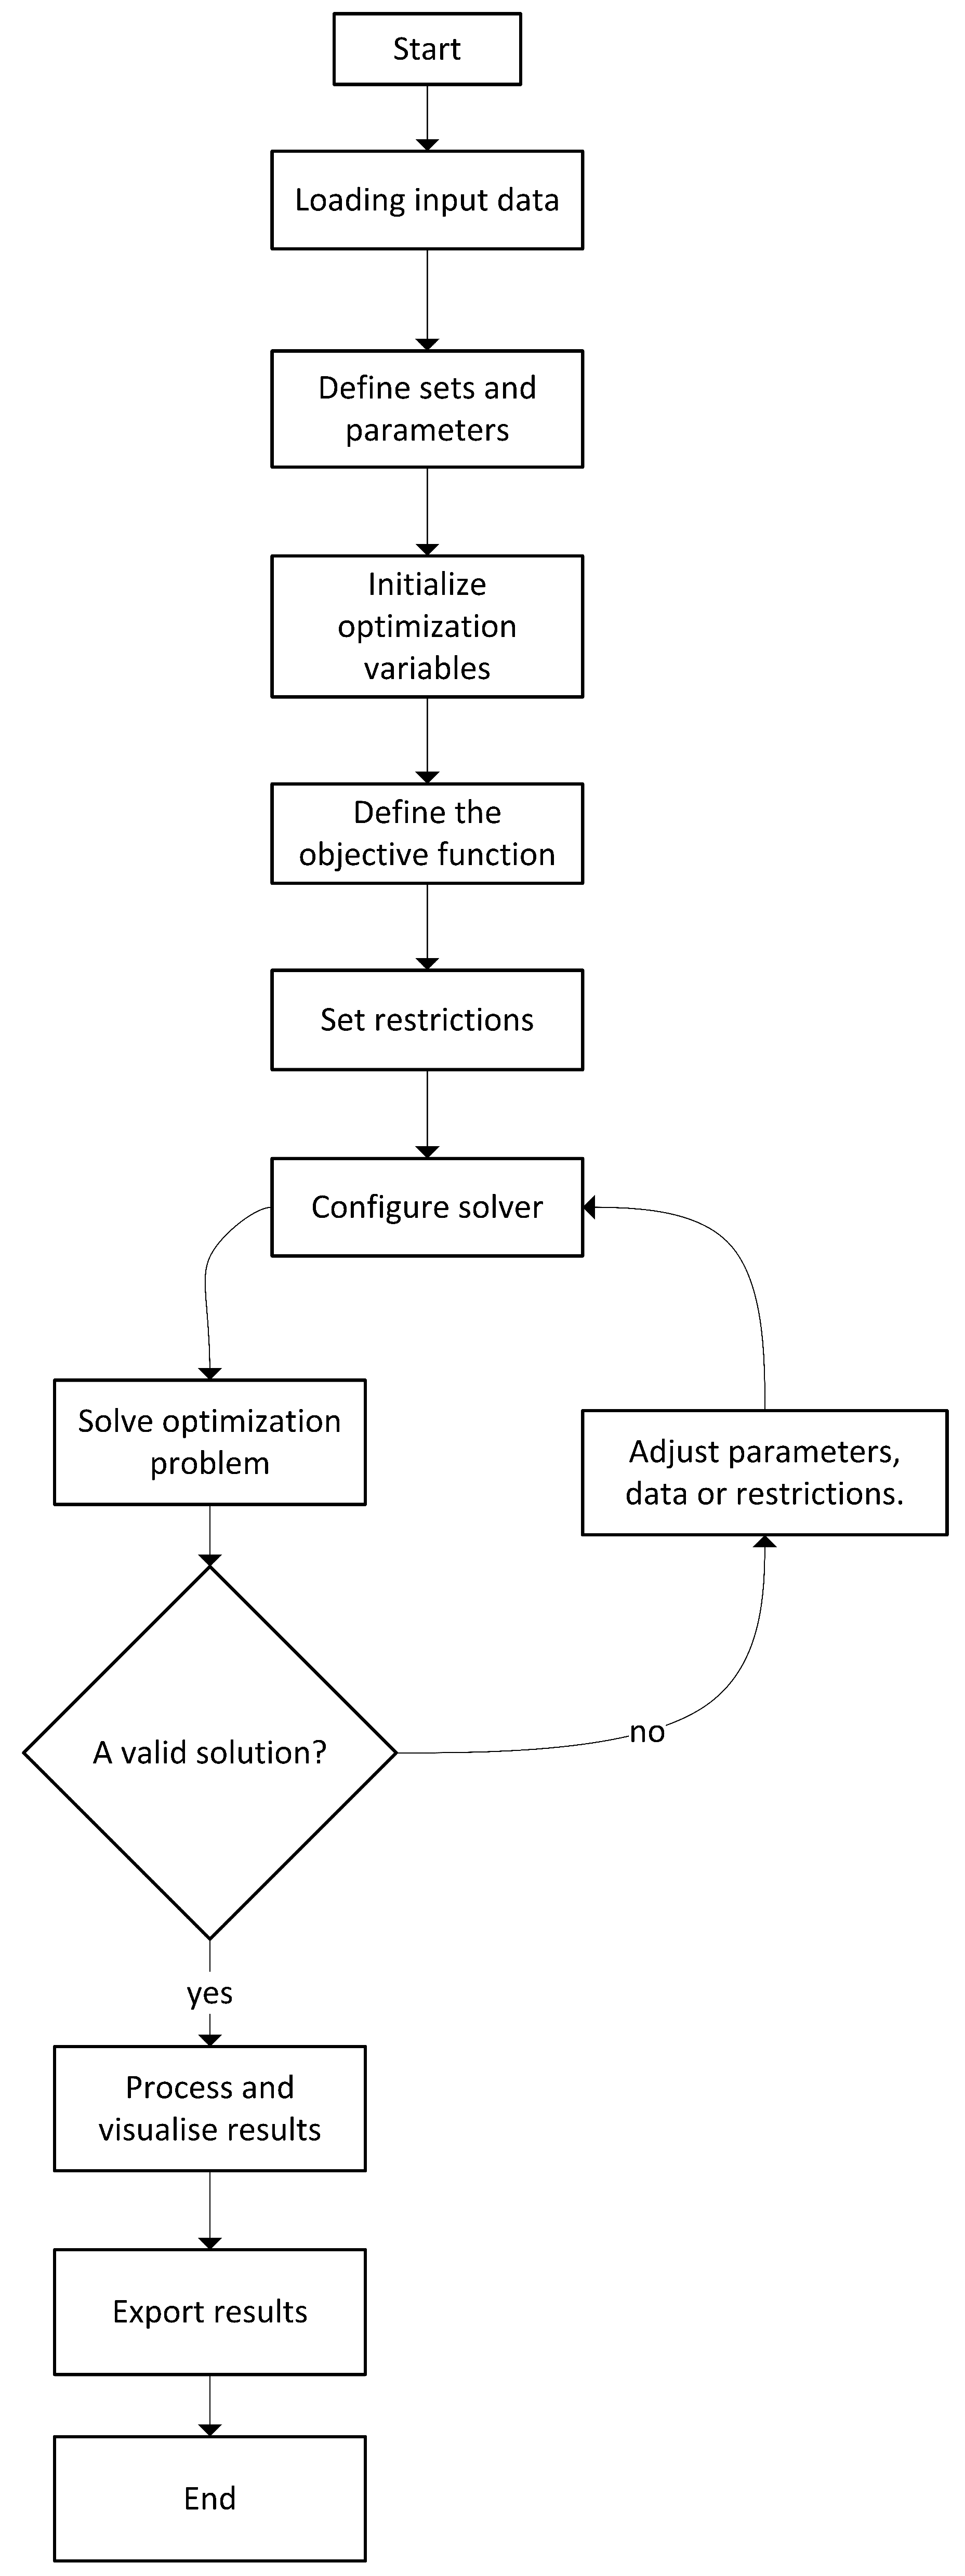
Accordingly, Algorithm 1 summarizes the numerical implementation adopted for the hourly economic dispatch of the interconnected multi-zone system with renewable generation and battery energy storage. The procedure is fully aligned with the mathematical model formulated in this section and with its implementation in MATLAB R2025b using optimproblem and fmincon. In methodological terms, the present work uses nonlinear programming as the solution mechanism for the proposed deterministic benchmark and does not include a numerical performance comparison against alternative metaheuristic, evolutionary, or decomposition-based methods. Therefore, the objective of the computational implementation is to demonstrate the feasibility and internal consistency of the proposed formulation rather than to establish a solver-ranking exercise across optimization paradigms.
Algorithm 1 shows that the numerical solution process is not limited to solver execution. Instead, it comprises a complete modeling pipeline in which data consistency, variable definition, objective-function assembly, constraint implementation, convergence verification, and result extraction are treated as integral parts of the methodology. This distinction is important because, in nonlinear dispatch problems with temporal and interzonal coupling, the quality and physical coherence of the final solution depend on both the mathematical formulation and the robustness of the computational implementation. In methodological terms, the present study validates the formulation through its successful application to a structured three-zone benchmark system and through the internal consistency of the obtained dispatch, storage, and interzonal exchange schedules under the two analyzed operating scenarios. However, the study does not include a numerical benchmark against alternative solvers, metaheuristic methods, or external published datasets. From a computational perspective, the size of the optimization problem increases with the number of zones, generating units, storage devices, interzonal links, and hourly periods considered in the study horizon. Therefore, although the proposed nonlinear programming framework is fully suitable for the three-zone benchmark system analyzed in this work, its direct application to larger real-world networks would lead to a substantially higher-dimensional decision space and a more demanding constrained optimization problem. In such cases, computational performance would depend not only on solver configuration, but also on data structure, initialization quality, and the possible use of decomposition, parallelization, or reduced-order formulations to preserve tractability.
| Algorithm 1 Computational procedure for hourly economic dispatch in an interconnected multi-zone power system |
- Require:
Sets ; technical and economic parameters of generating units; interzonal transfer capacities; BESS parameters; hourly demand profiles; renewable availability factors. - Ensure:
Optimal hourly dispatch of all generating units, interzonal power exchanges, BESS charging/discharging schedules, state-of-charge trajectories, and minimum total operating cost. - 1:
Load and validate all input datasets corresponding to generation, storage, interconnection, and hourly demand. - 2:
Define the study horizon and instantiate the sets of zones, time periods, generating units, and storage systems. - 3:
Construct the model parameters associated with operating costs, generation bounds, ramp-rate limits, renewable availability, BESS efficiencies, BESS energy limits, and interzonal transfer capacities. - 4:
Initialize the decision variables: - 5:
Define the total operating-cost objective function as the sum of the thermal-generation cost and the renewable/hydroelectric operating cost over all zones and hours. - 6:
Assemble the interzonal exchange constraints, including transfer-capacity bounds and antisymmetry conditions. - 7:
Assemble the generation-capacity constraints for thermal, hydroelectric, wind, and photovoltaic units. - 8:
Assemble the hourly zonal power-balance constraints. - 9:
Assemble the thermal ramp-up and ramp-down constraints. - 10:
Assemble the BESS state-of-charge balance equations and the corresponding initial-state conditions. - 11:
Assemble the BESS operating bounds, including state-of-charge limits and charging/discharging-power limits. - 12:
Assemble the hydroelectric energy-quota constraints over the complete scheduling horizon. - 13:
Create the nonlinear optimization problem in MATLAB: prob_opt = optimproblem(‘ObjectiveSense’,‘minimize’); - 14:
Assign the objective function and the complete set of constraints to prob_opt. - 15:
Define an initial feasible guess for the optimization variables. - 16:
Configure the nonlinear solver: options = optimoptions(‘fmincon’, … ‘Algorithm’,‘interior-point’, … ‘MaxIterations’,10,000, … ‘Display’,‘iter-detailed’); - 17:
Solve the optimization problem: [sol,fval,exitflag,output] = solve(prob_opt,x0,‘Options’,options); - 18:
if then - 19:
Extract the optimal dispatch schedules, interzonal exchanges, BESS charging/discharging profiles, and state-of-charge trajectories. - 20:
Compute the total operating cost and the zonal and technological energy contributions. - 21:
Export the results for subsequent analysis and visualization: save(‘Dispatch_Results.mat’,‘sol’,‘fval’); - 22:
else - 23:
Review the input data, parameter consistency, initial point, and constraint set. - 24:
Adjust the numerical configuration or model data if necessary. - 25:
Repeat the optimization process until a valid numerical solution is obtained. - 26:
end if
|
For complementary visualization,
Figure 6 presents the flowchart associated with the solution procedure. While Algorithm 1 provides the formal sequential description of the numerical implementation, the flowchart highlights the iterative logic of the process, particularly the verification stage through which model data, numerical parameters, or constraints may need to be adjusted when the optimization problem does not initially return a valid solution.
3.5. Case Study Description
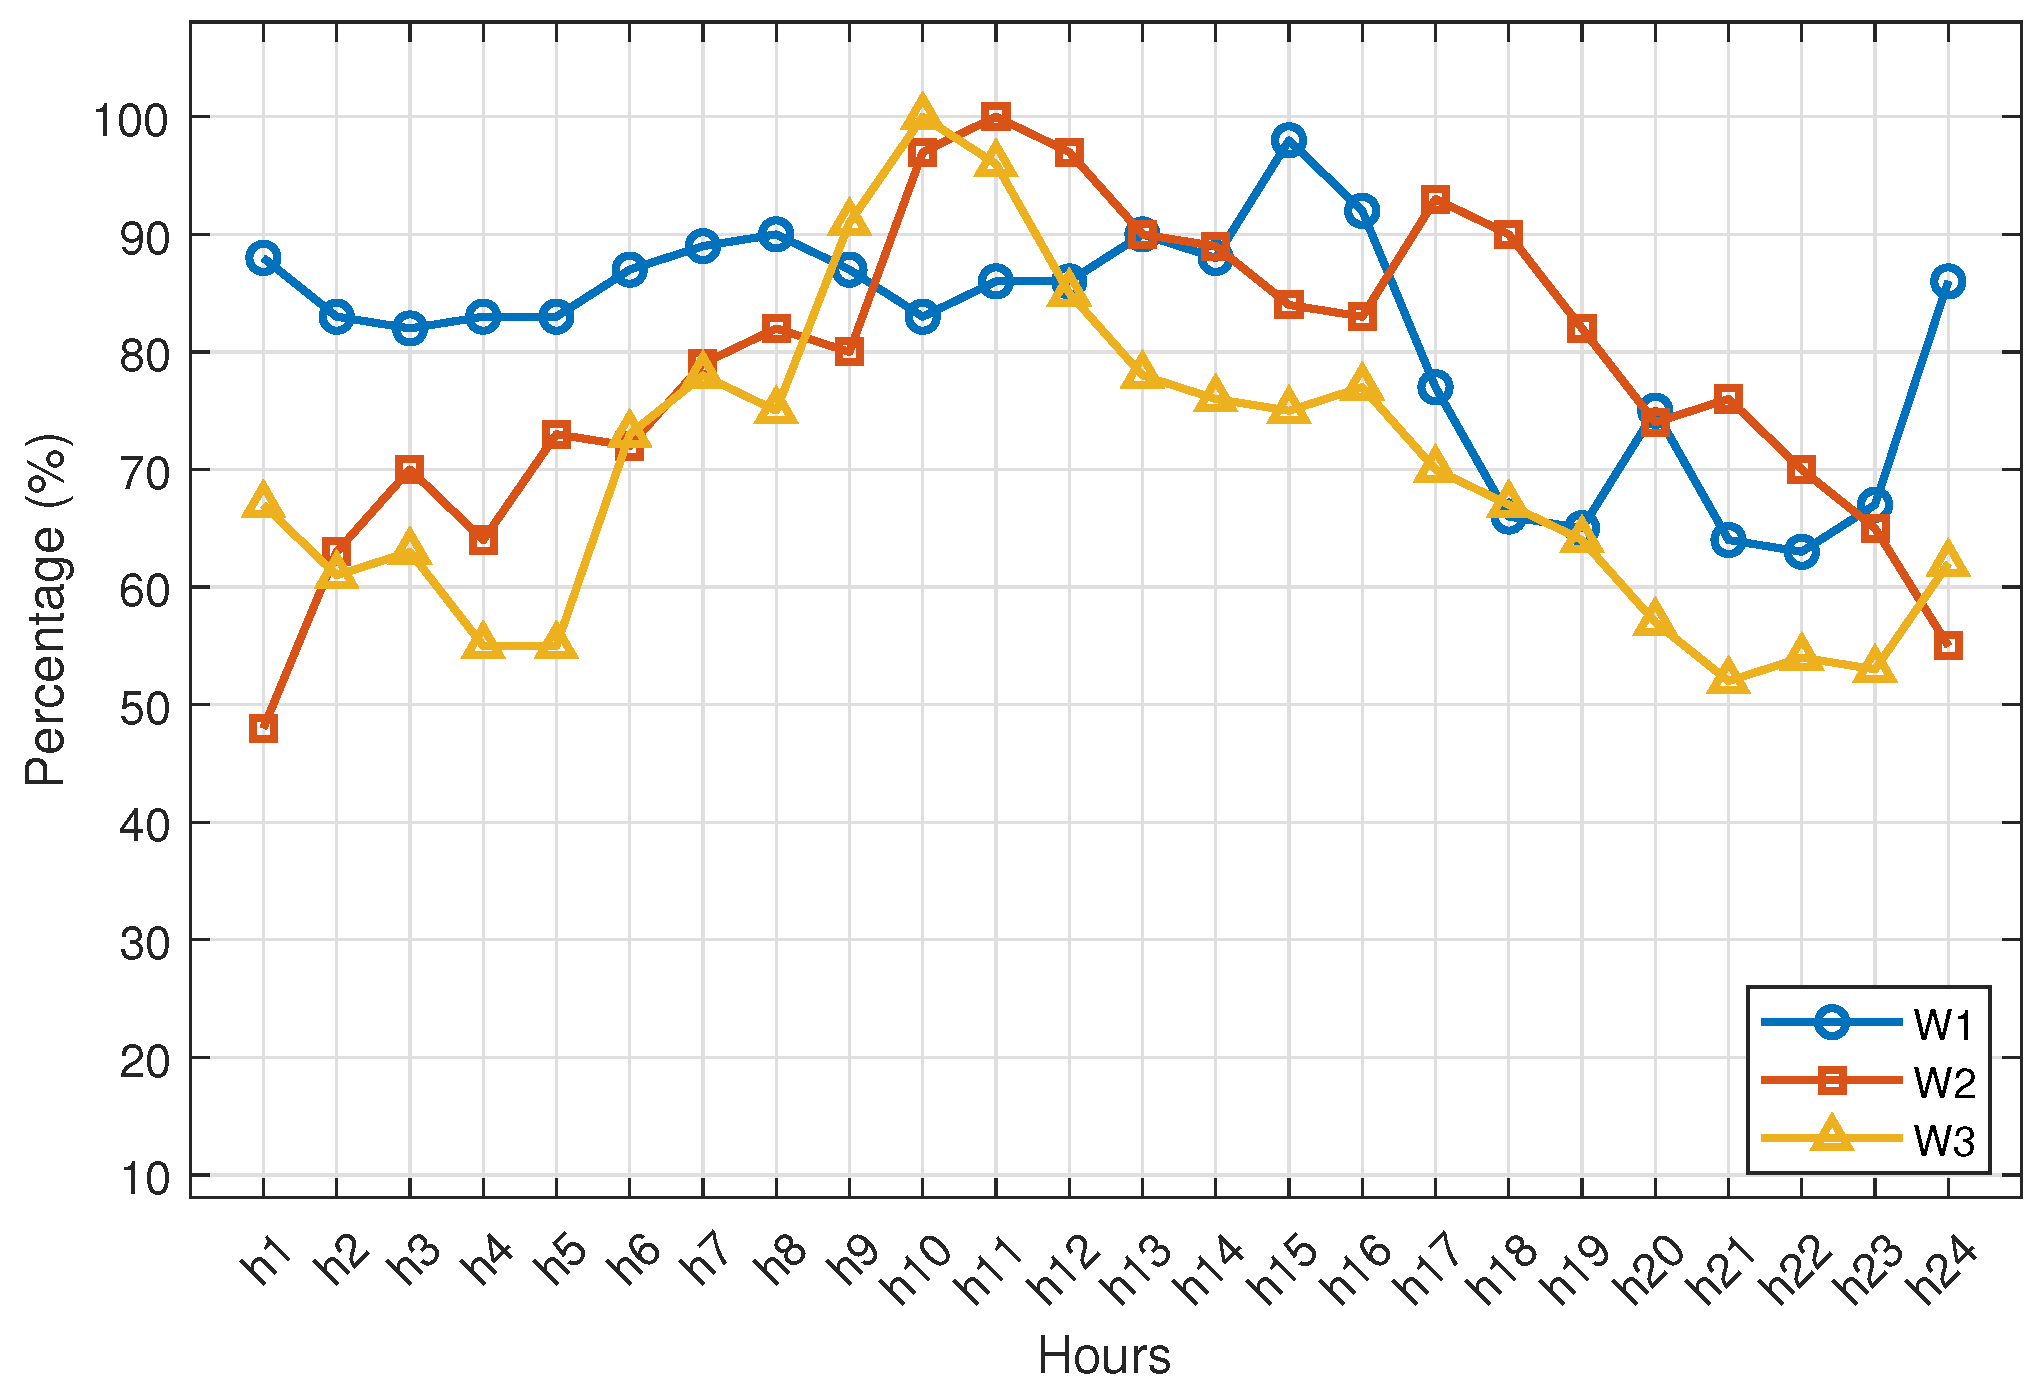
The proposed formulation is applied to a prototype interconnected power system composed of three zones. The case study includes thermal, hydroelectric, wind, and photovoltaic generation, interzonal transmission links, battery energy storage systems, and hourly demand curves. To preserve the readability of the main manuscript, only the information strictly necessary to understand the structure of the benchmark system is presented in this section, whereas the detailed technical parameters and input profiles used to instantiate the model are reported in
Appendix A.
3.5.1. Generation Portfolio
The generating system considered in the case study comprises thermal, hydroelectric, wind, and photovoltaic units distributed over three zones. The geographical allocation of the units is relevant because it defines the local generation mix of each zone and determines the extent to which each area depends on internal generation or on power exchange with neighboring zones. This zonal distribution is summarized in
Table 4. The detailed thermal operating limits, thermal cost coefficients, renewable and hydroelectric technical data, battery parameters, and hourly renewable-resource and demand input profiles are provided in
Appendix A for reproducibility.
3.5.2. Interzonal Network
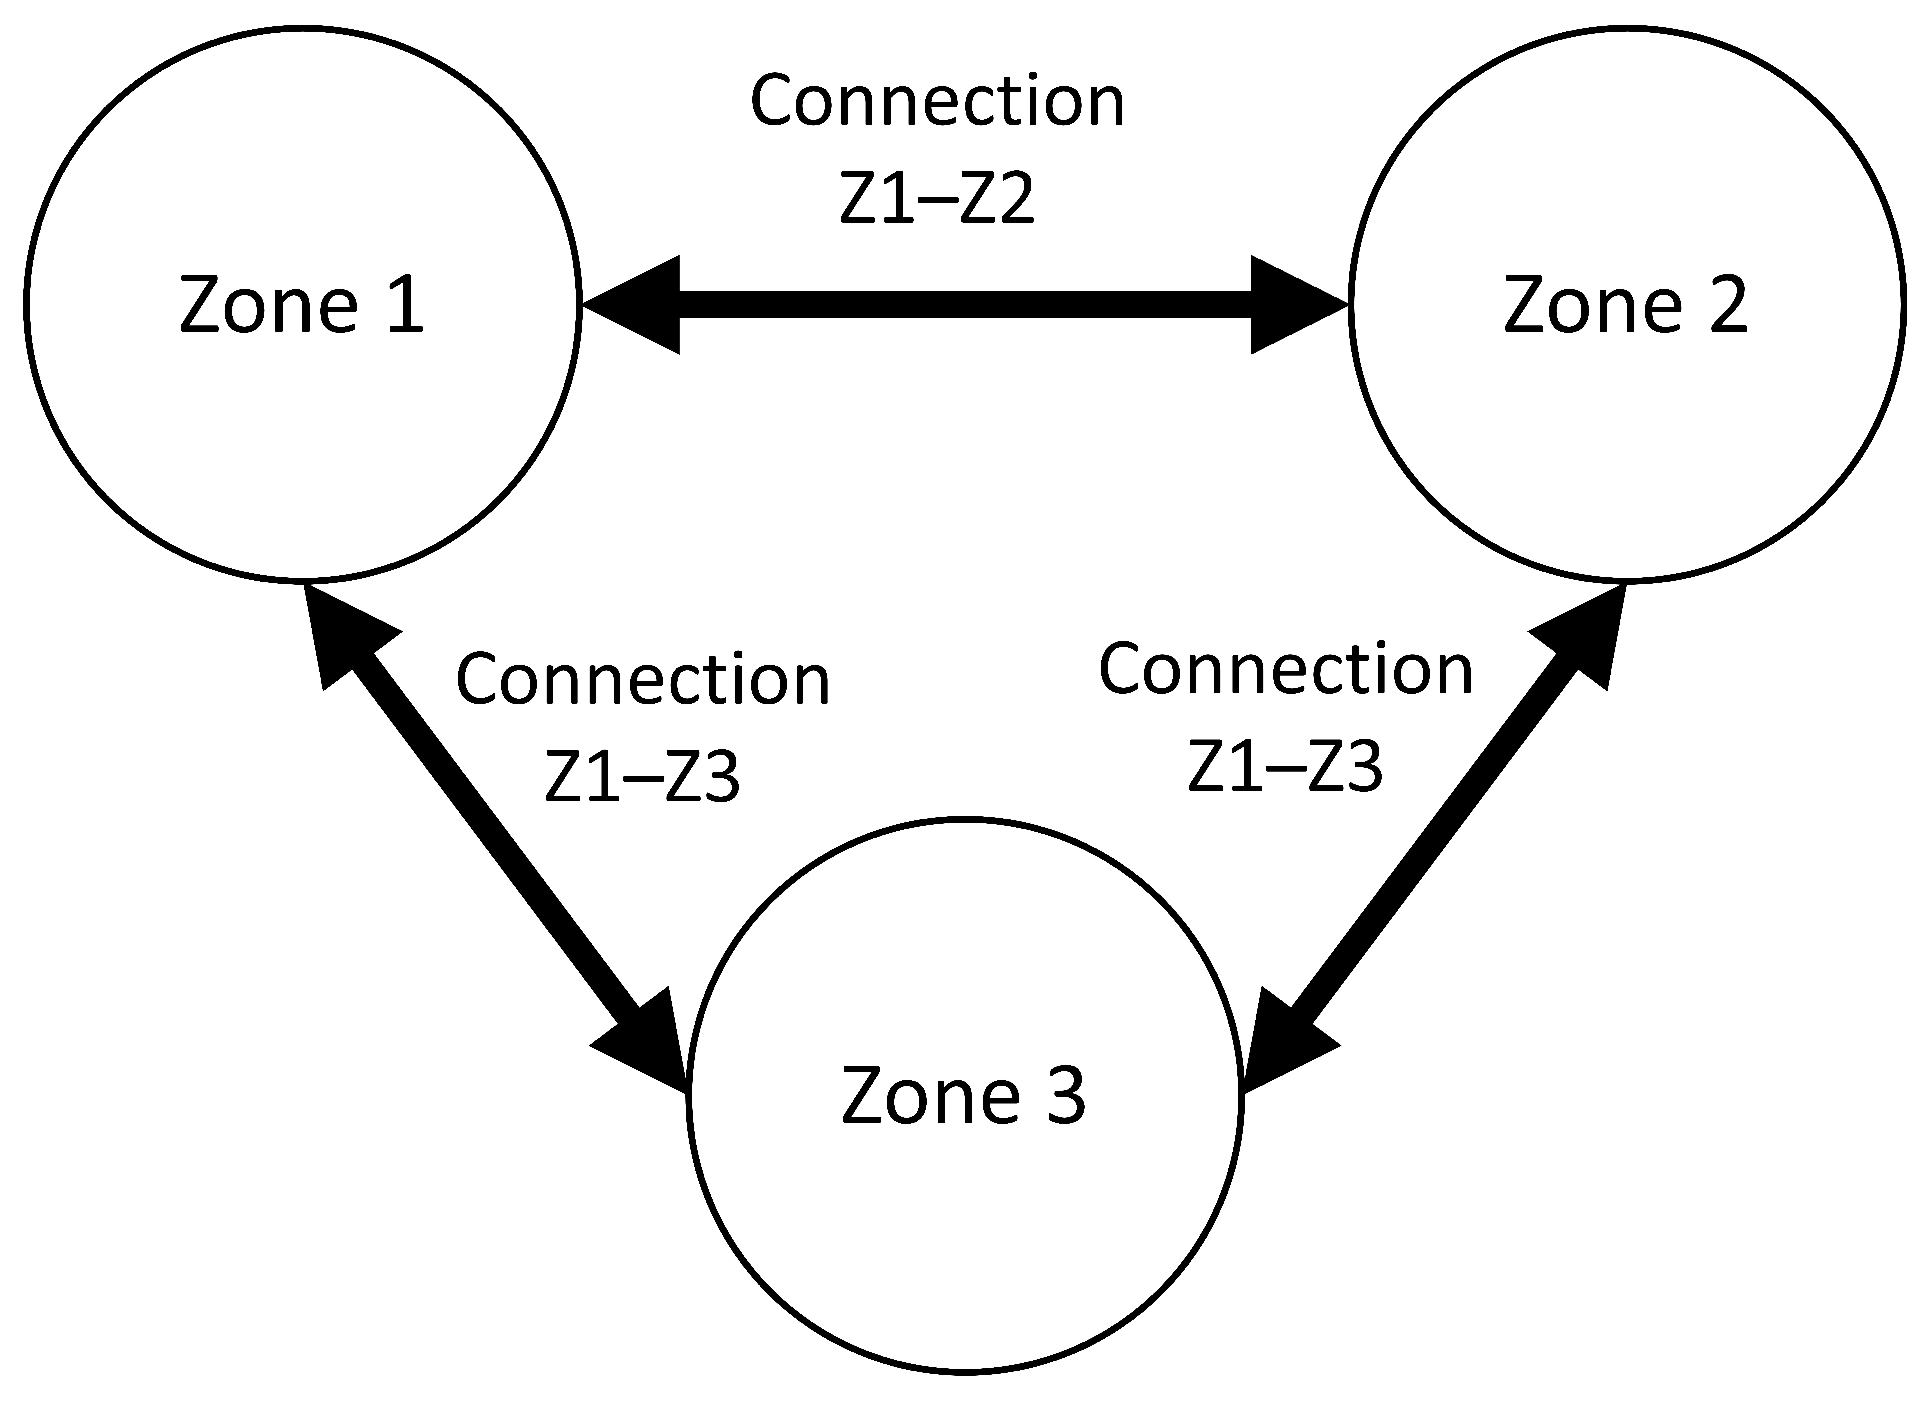
The topology of the interzonal network determines the admissible power exchanges among zones and therefore directly affects the optimal coordinated dispatch. The general interconnection layout of the three-zone system is illustrated in
Figure 7. Based on this scheme, the transfer-capacity limits adopted for the interzonal links are reported in
Table 5, following [
74].
3.5.3. Operating Scenarios
To evaluate the technical and economic effect of coordinated operation, the optimization model is solved under two comparative scenarios.
Scenario 1: Autonomous zonal operation. Each zone supplies its own demand using only the generating units locally installed in that zone. Under this configuration, no interzonal exchange and no participation of battery energy storage systems are considered. This scenario provides the reference case for subsequent comparison.
Scenario 2: Interconnected operation with storage support. The three zones operate in an integrated manner, considering interzonal power exchange, coordinated use of the available generating units, and the participation of the battery energy storage systems installed in the predefined zones. This scenario is used to quantify the effect of interconnection and storage on the hourly dispatch and total operating cost of the system.
4. Results
This section presents the results obtained for the two operating scenarios defined in
Section 3.5.3. The discussion is organized in three stages. First, the autonomous zonal operation of Scenario 1 is examined in terms of hourly dispatch, technology participation, and operating cost. Second, the coordinated multi-zone operation with interconnection and battery energy storage support considered in Scenario 2 is analyzed. Finally, a comparative assessment is performed in order to quantify the energetic and economic effects associated with coordinated dispatch, interzonal exchange, and storage participation. Within the scope of the present study, the validation of the proposed formulation is based on the internal consistency of the optimized schedules, the satisfaction of all modeled operational constraints, and the comparative coherence of the two benchmark operating scenarios. Accordingly, the results should be interpreted as a structured validation of the deterministic multi-zone dispatch framework rather than as an external validation against historical system operation or independently published benchmark datasets.
4.1. Scenario 1: Autonomous Zonal Operation
Scenario 1 represents the reference operating condition in which each zone supplies its own hourly demand using only the generating units locally available in that zone. Under this configuration, no interzonal exchange and no participation of battery energy storage systems are allowed. Consequently, the resulting dispatch reflects the intrinsic capability of each zone to satisfy its demand using its internal generation mix.
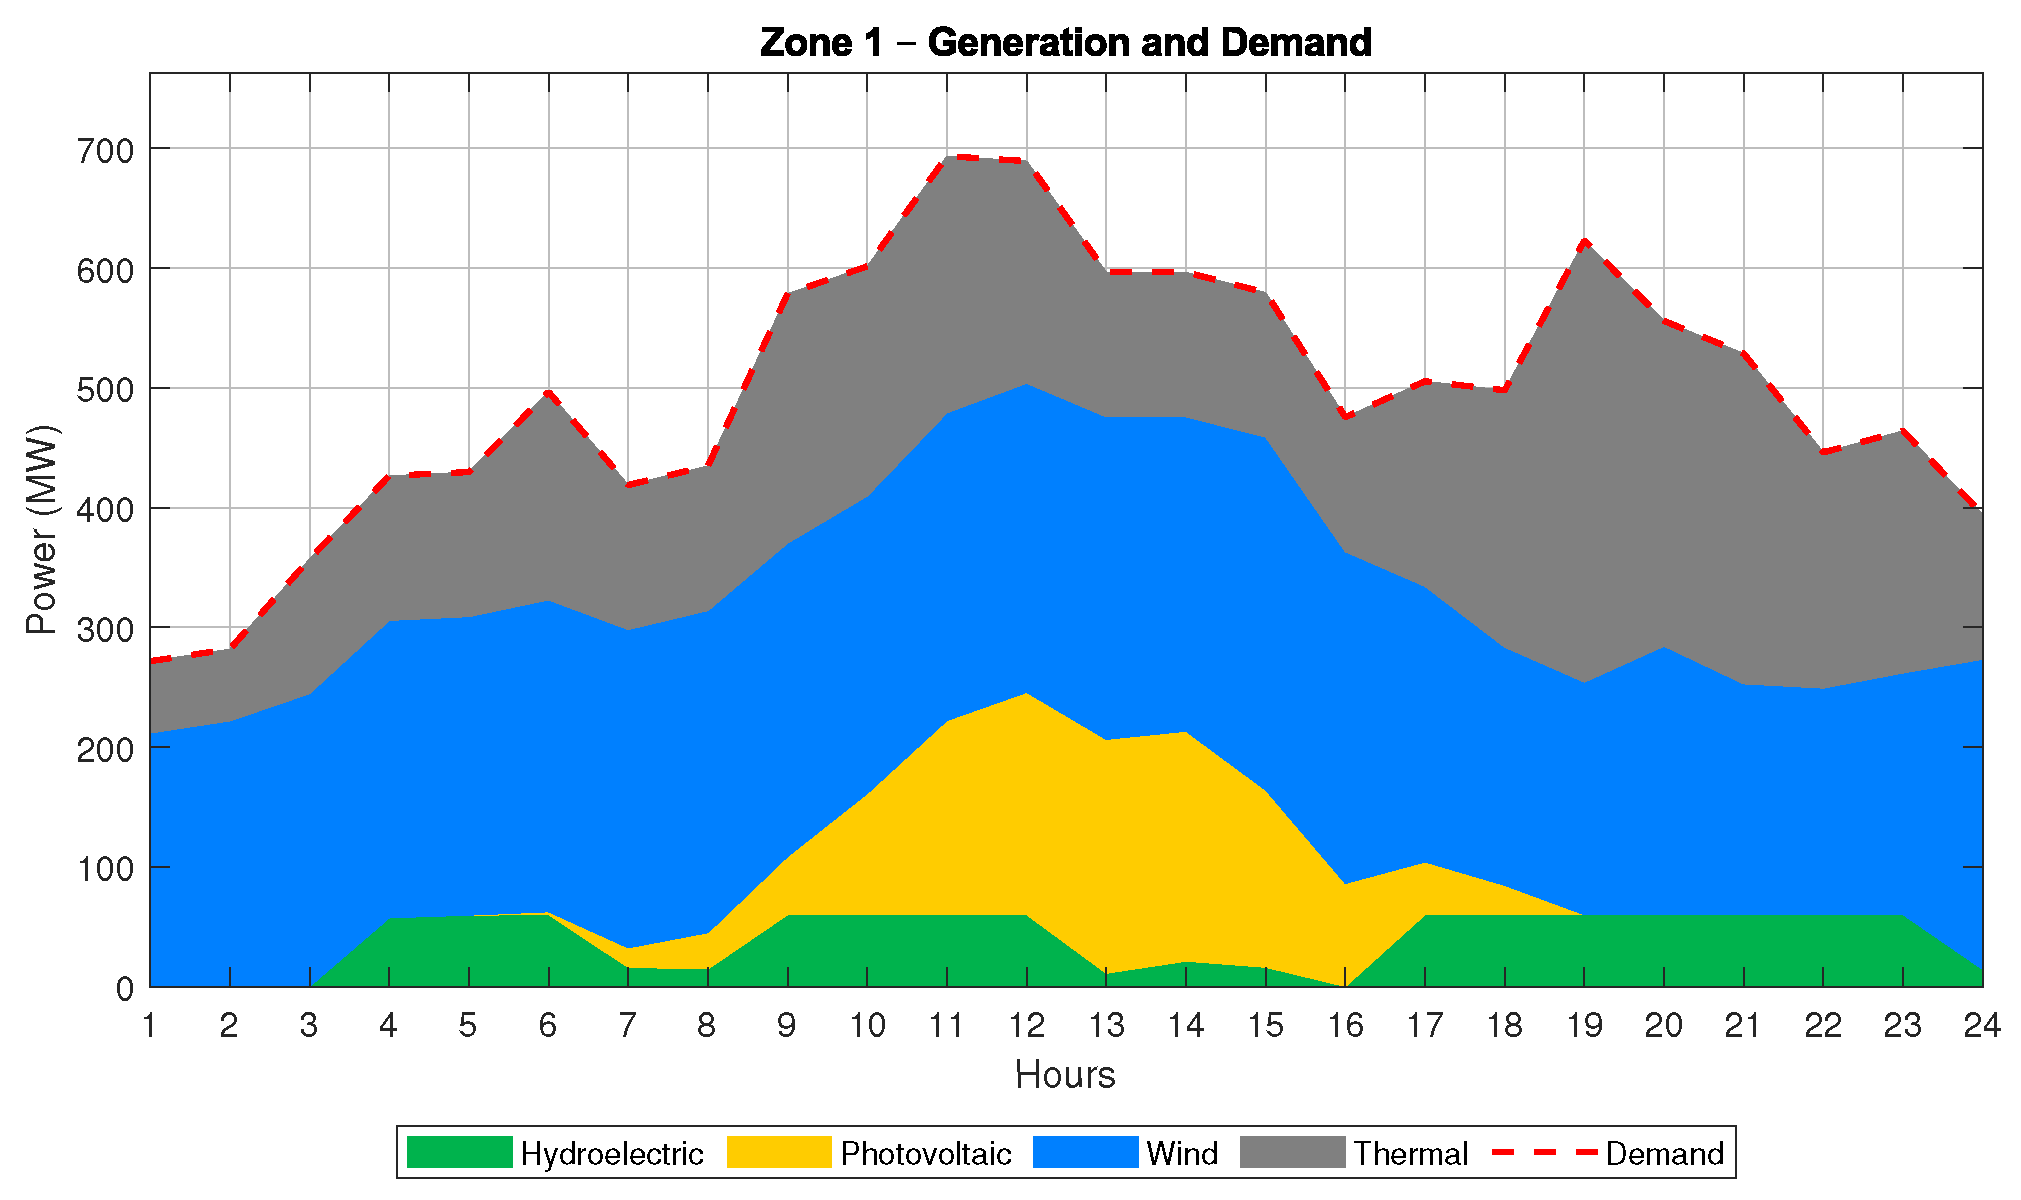
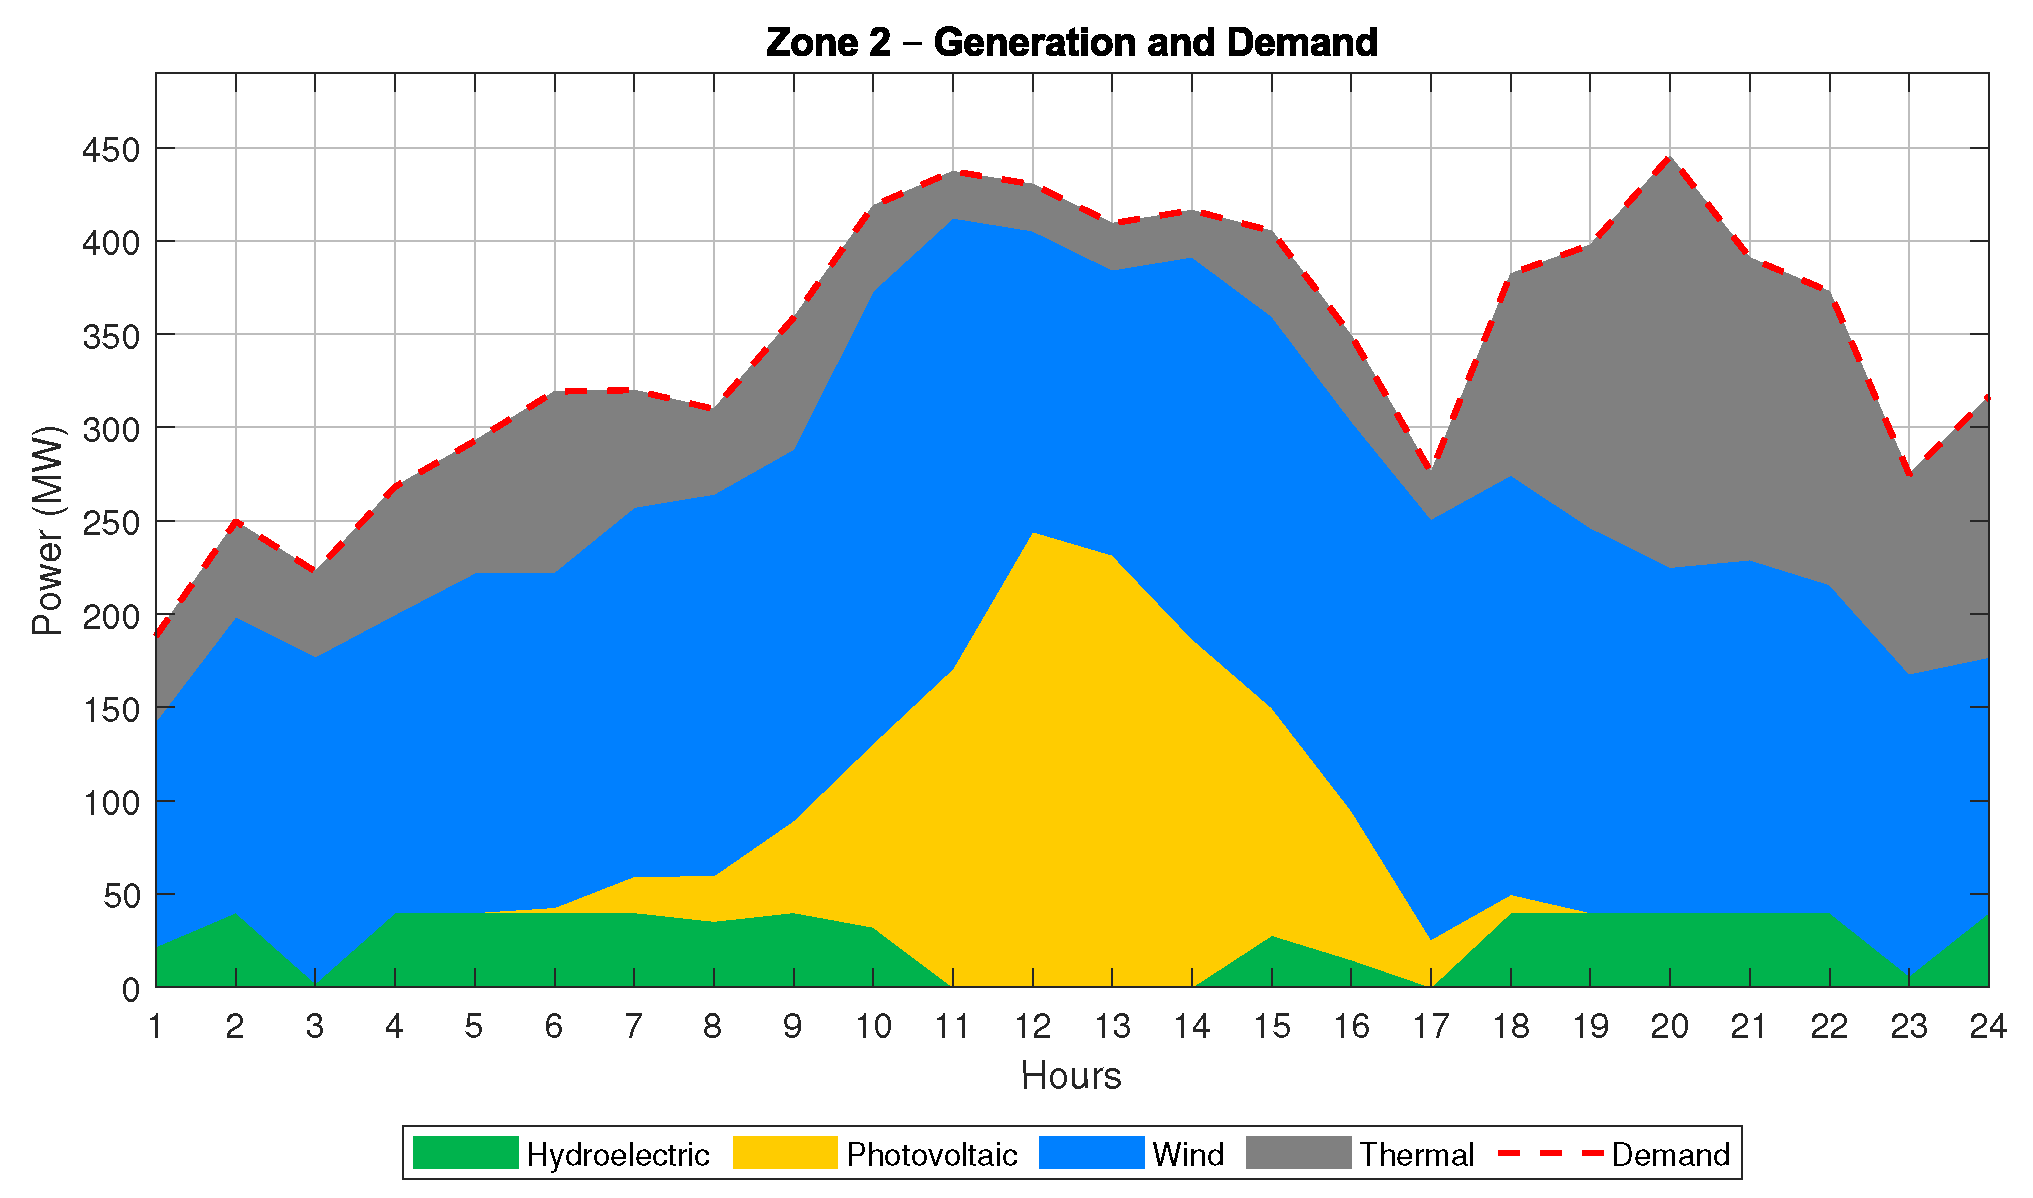
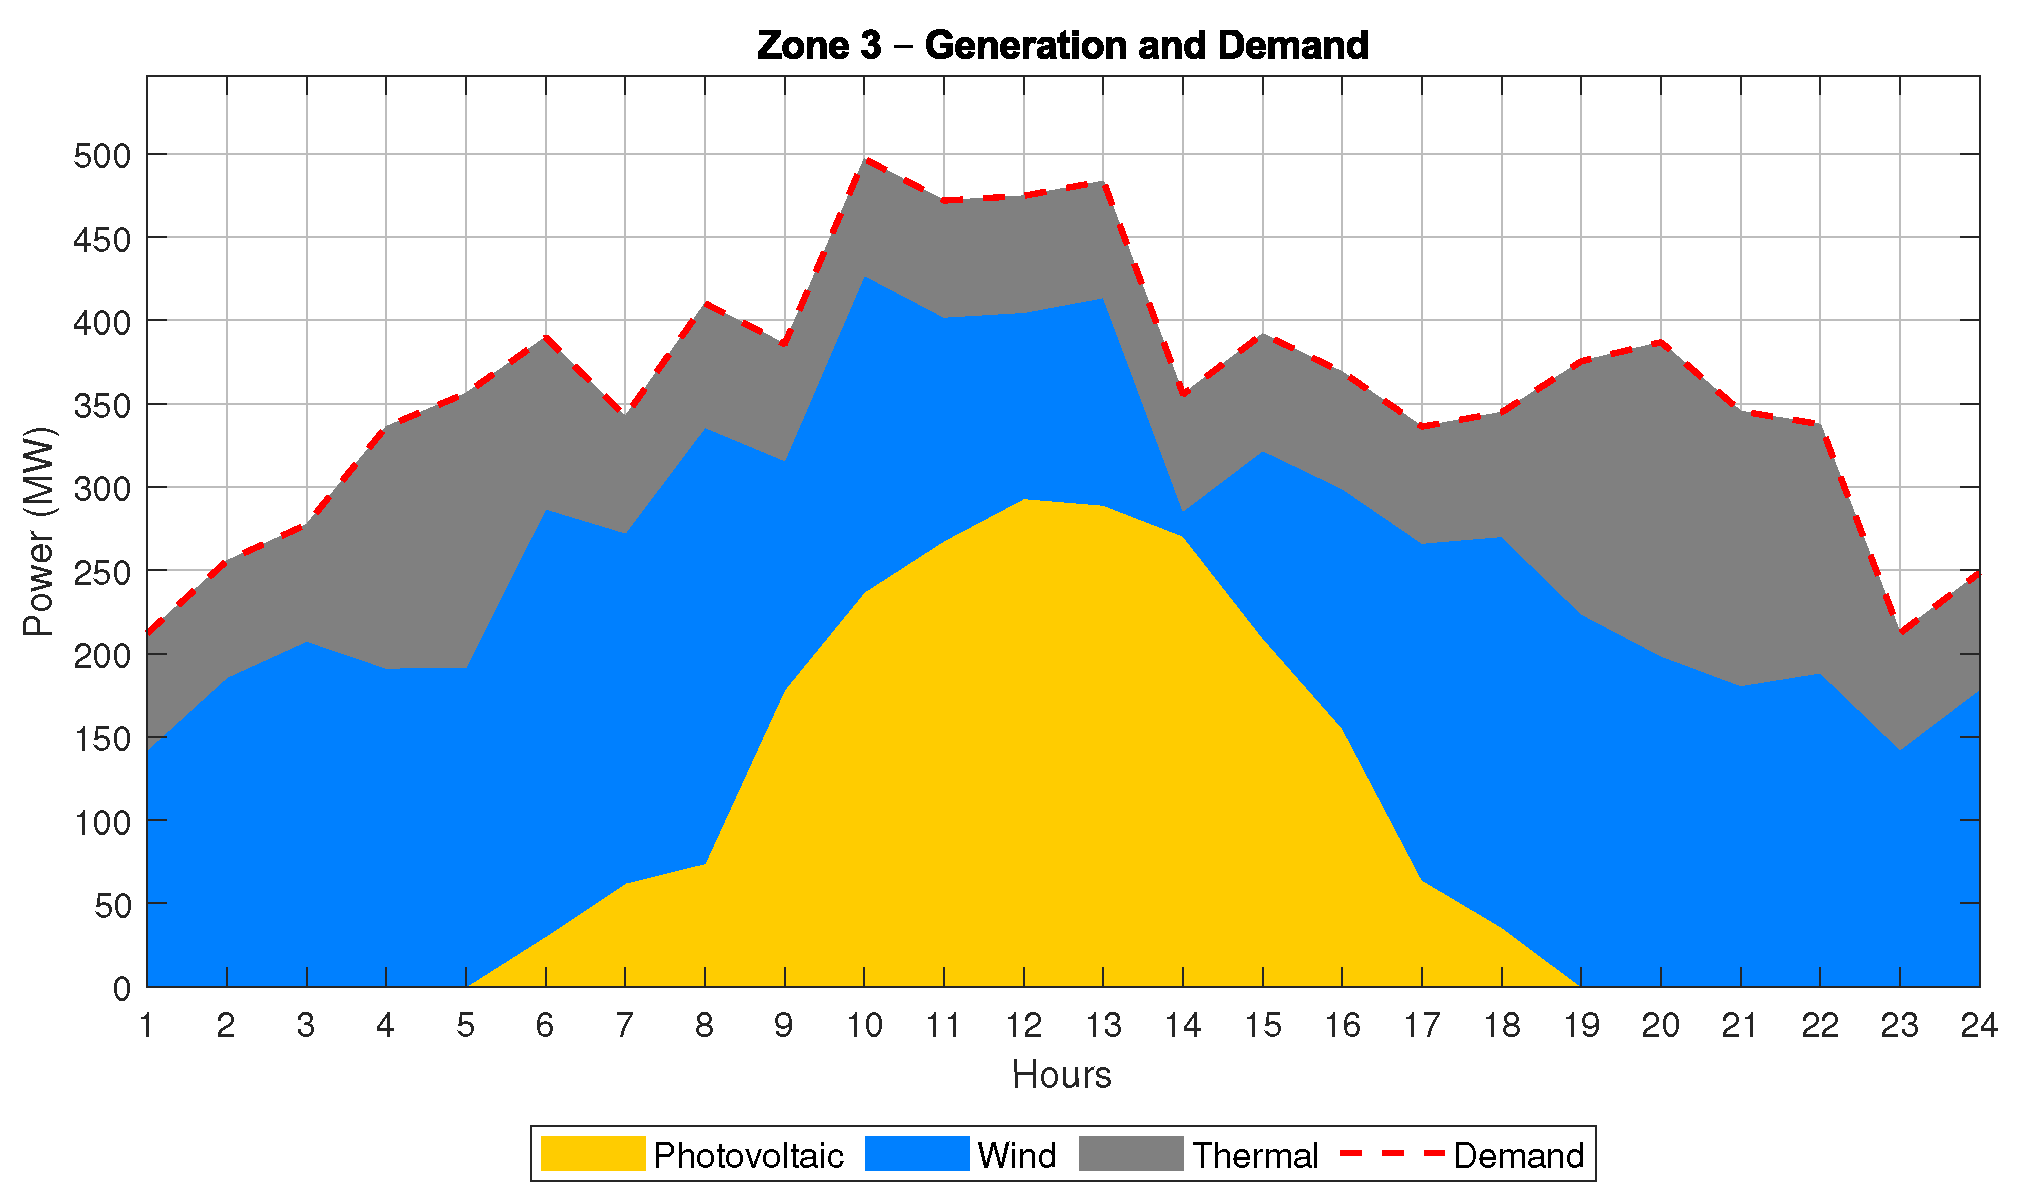
The hourly dispatch profiles corresponding to Scenario 1 are shown in
Figure 8,
Figure 9 and
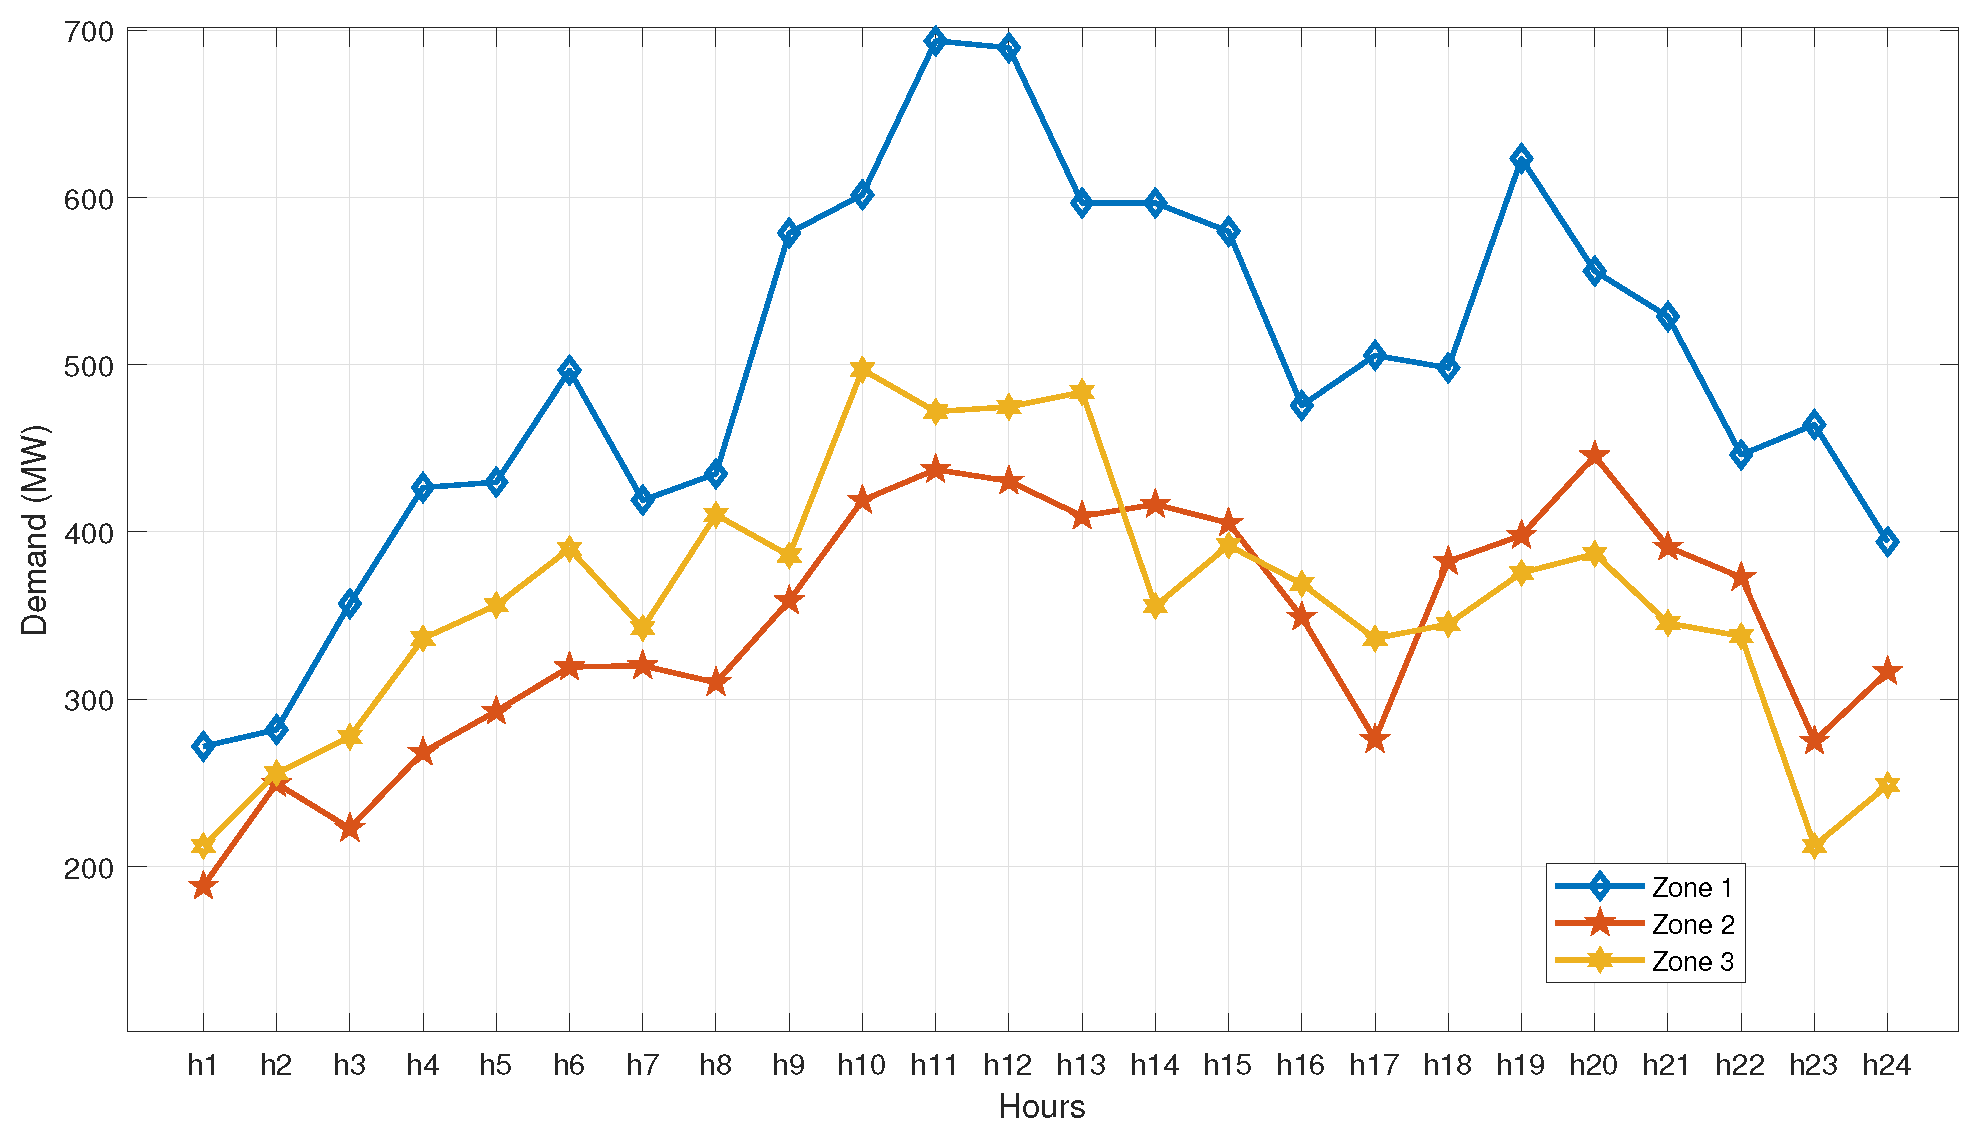
Figure 10. These three figures are essential because they provide the time-resolved composition of generation in Zones 1, 2, and 3, respectively, and make it possible to verify that the demand curve is fully covered throughout the 24-h horizon in every zone. In addition, they reveal the relative contribution of hydroelectric, photovoltaic, wind, and thermal generation according to the resource availability and local generation portfolio of each zone.
From
Figure 8,
Figure 9 and
Figure 10, it is observed that demand is met in all zones without recourse to external support. Zone 1 exhibits the highest demand level and therefore requires a broader contribution from all available technologies. Zone 2 shows a more moderate demand level and a visible participation of hydroelectric and renewable resources. Zone 3, in turn, is supplied by photovoltaic, wind, and thermal generation, consistent with the absence of hydroelectric generation in its local portfolio. In all three cases, the temporal pattern of dispatch reflects the hourly variability of renewable availability and the compensating role of thermal generation in maintaining supply adequacy.
To quantify the daily energy supplied in each zone,
Table 6 presents the energy allocation by technology and zone for Scenario 1. This table complements the hourly plots by aggregating the dispatched energy over the full day and therefore provides the basis for the subsequent comparative analysis.
Table 6 shows that the total daily energy supplied by the autonomous operation reaches 28.80 GWh, distributed as 11.94 GWh in Zone 1, 8.25 GWh in Zone 2, and 8.60 GWh in Zone 3. The results confirm that the autonomous configuration is able to satisfy the full system demand, although the burden of supply is not uniformly distributed across technologies or zones. In particular, the contribution of thermal generation remains significant, especially in those periods where renewable production is insufficient to cover the local load profile.
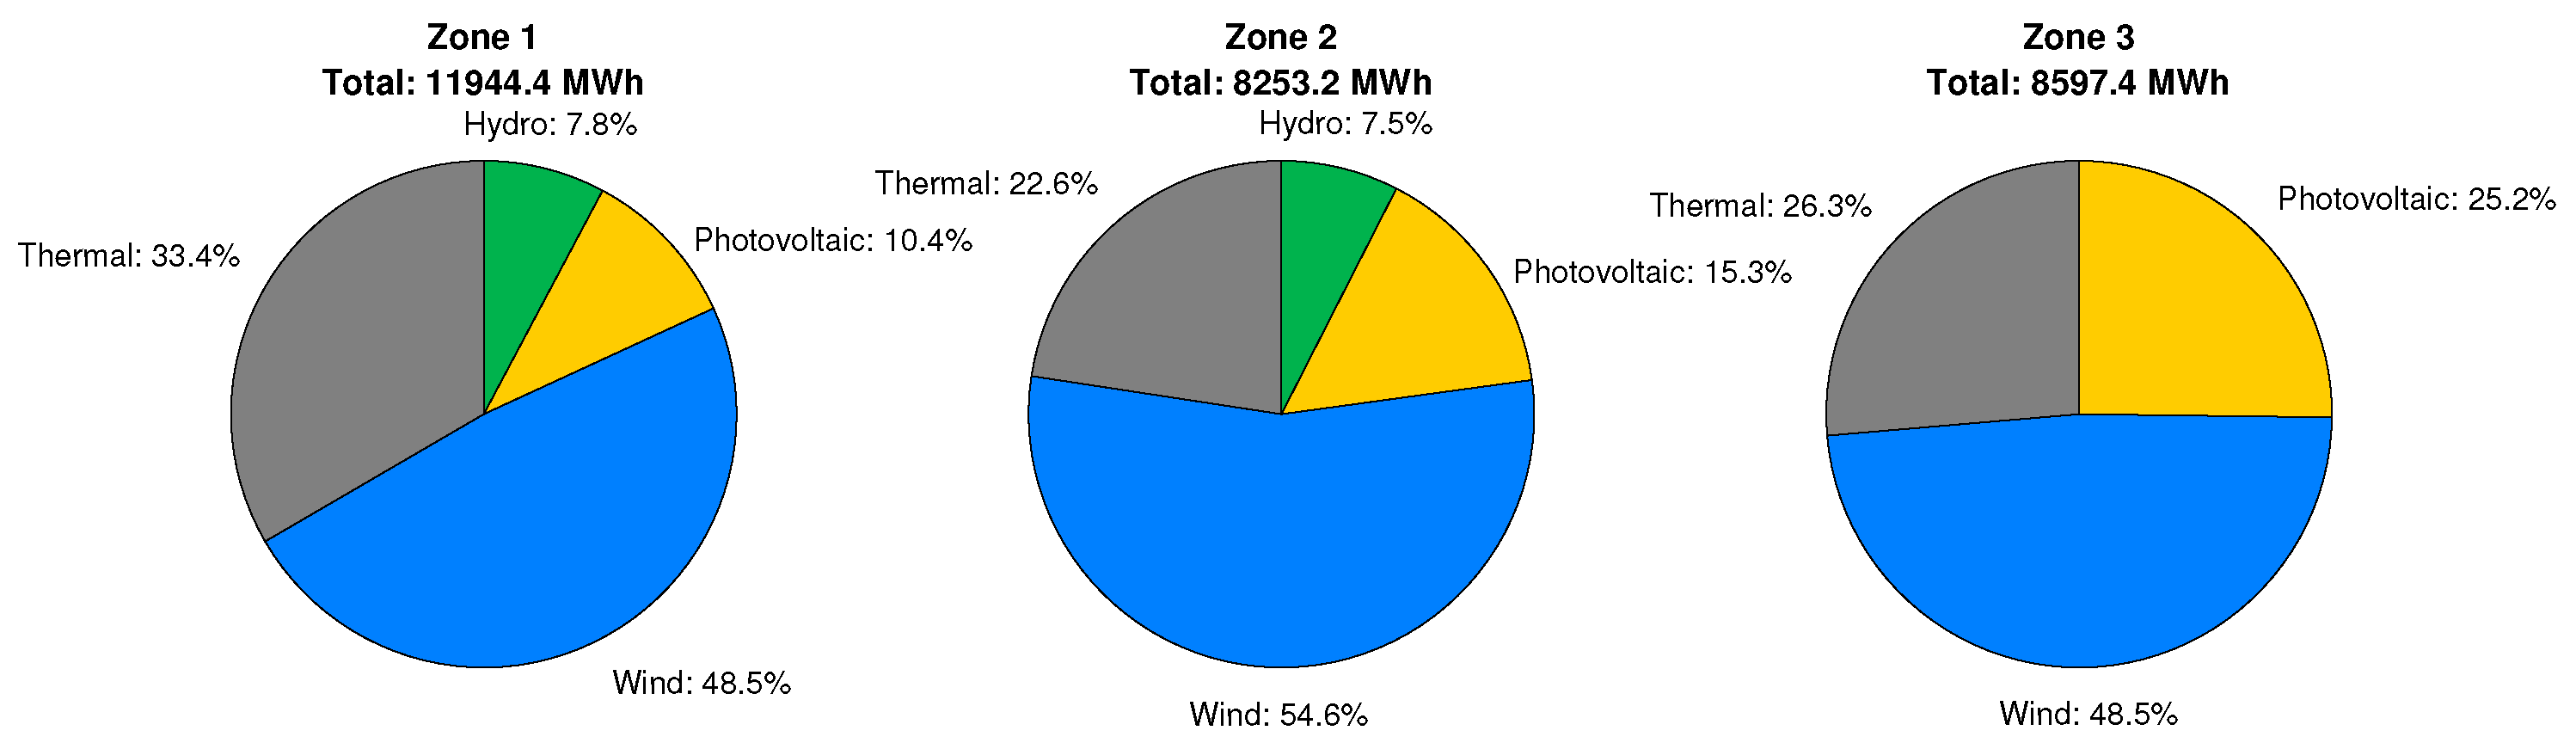
The relative contribution of each technology to the zonal energy supply is illustrated in
Figure 11. This figure is useful because it summarizes the generation mix of each zone in percentage terms, thereby facilitating the interpretation of the energy structure associated with autonomous operation.
As shown in
Figure 11, wind generation constitutes the dominant contribution in the three zones, while thermal generation provides the firm support required to maintain adequacy. Hydroelectric generation is limited to Zones 1 and 2, whereas photovoltaic generation exhibits a noticeable contribution in all zones, particularly where solar availability and installed capacity allow a stronger daytime penetration. This composition evidences that, even under autonomous operation, renewable resources already play an important role; however, thermal generation remains indispensable for balancing the hourly net load.
The economic implications of the autonomous dispatch are reported in
Table 7. This table presents the operating cost disaggregated by zone and generation technology and therefore provides the baseline against which the interconnected scenario will be evaluated.
Table 7 indicates that the total operating cost of the system under autonomous zonal operation is 8.23 million USD. The dominant contribution corresponds to thermal generation, with 7.27 million USD, which confirms that the principal economic burden of the autonomous strategy is associated with dispatchable thermal support. Zone 1 records the highest total cost, consistent with its higher energy requirement and the larger contribution of thermal generation required to complement the local renewable output.
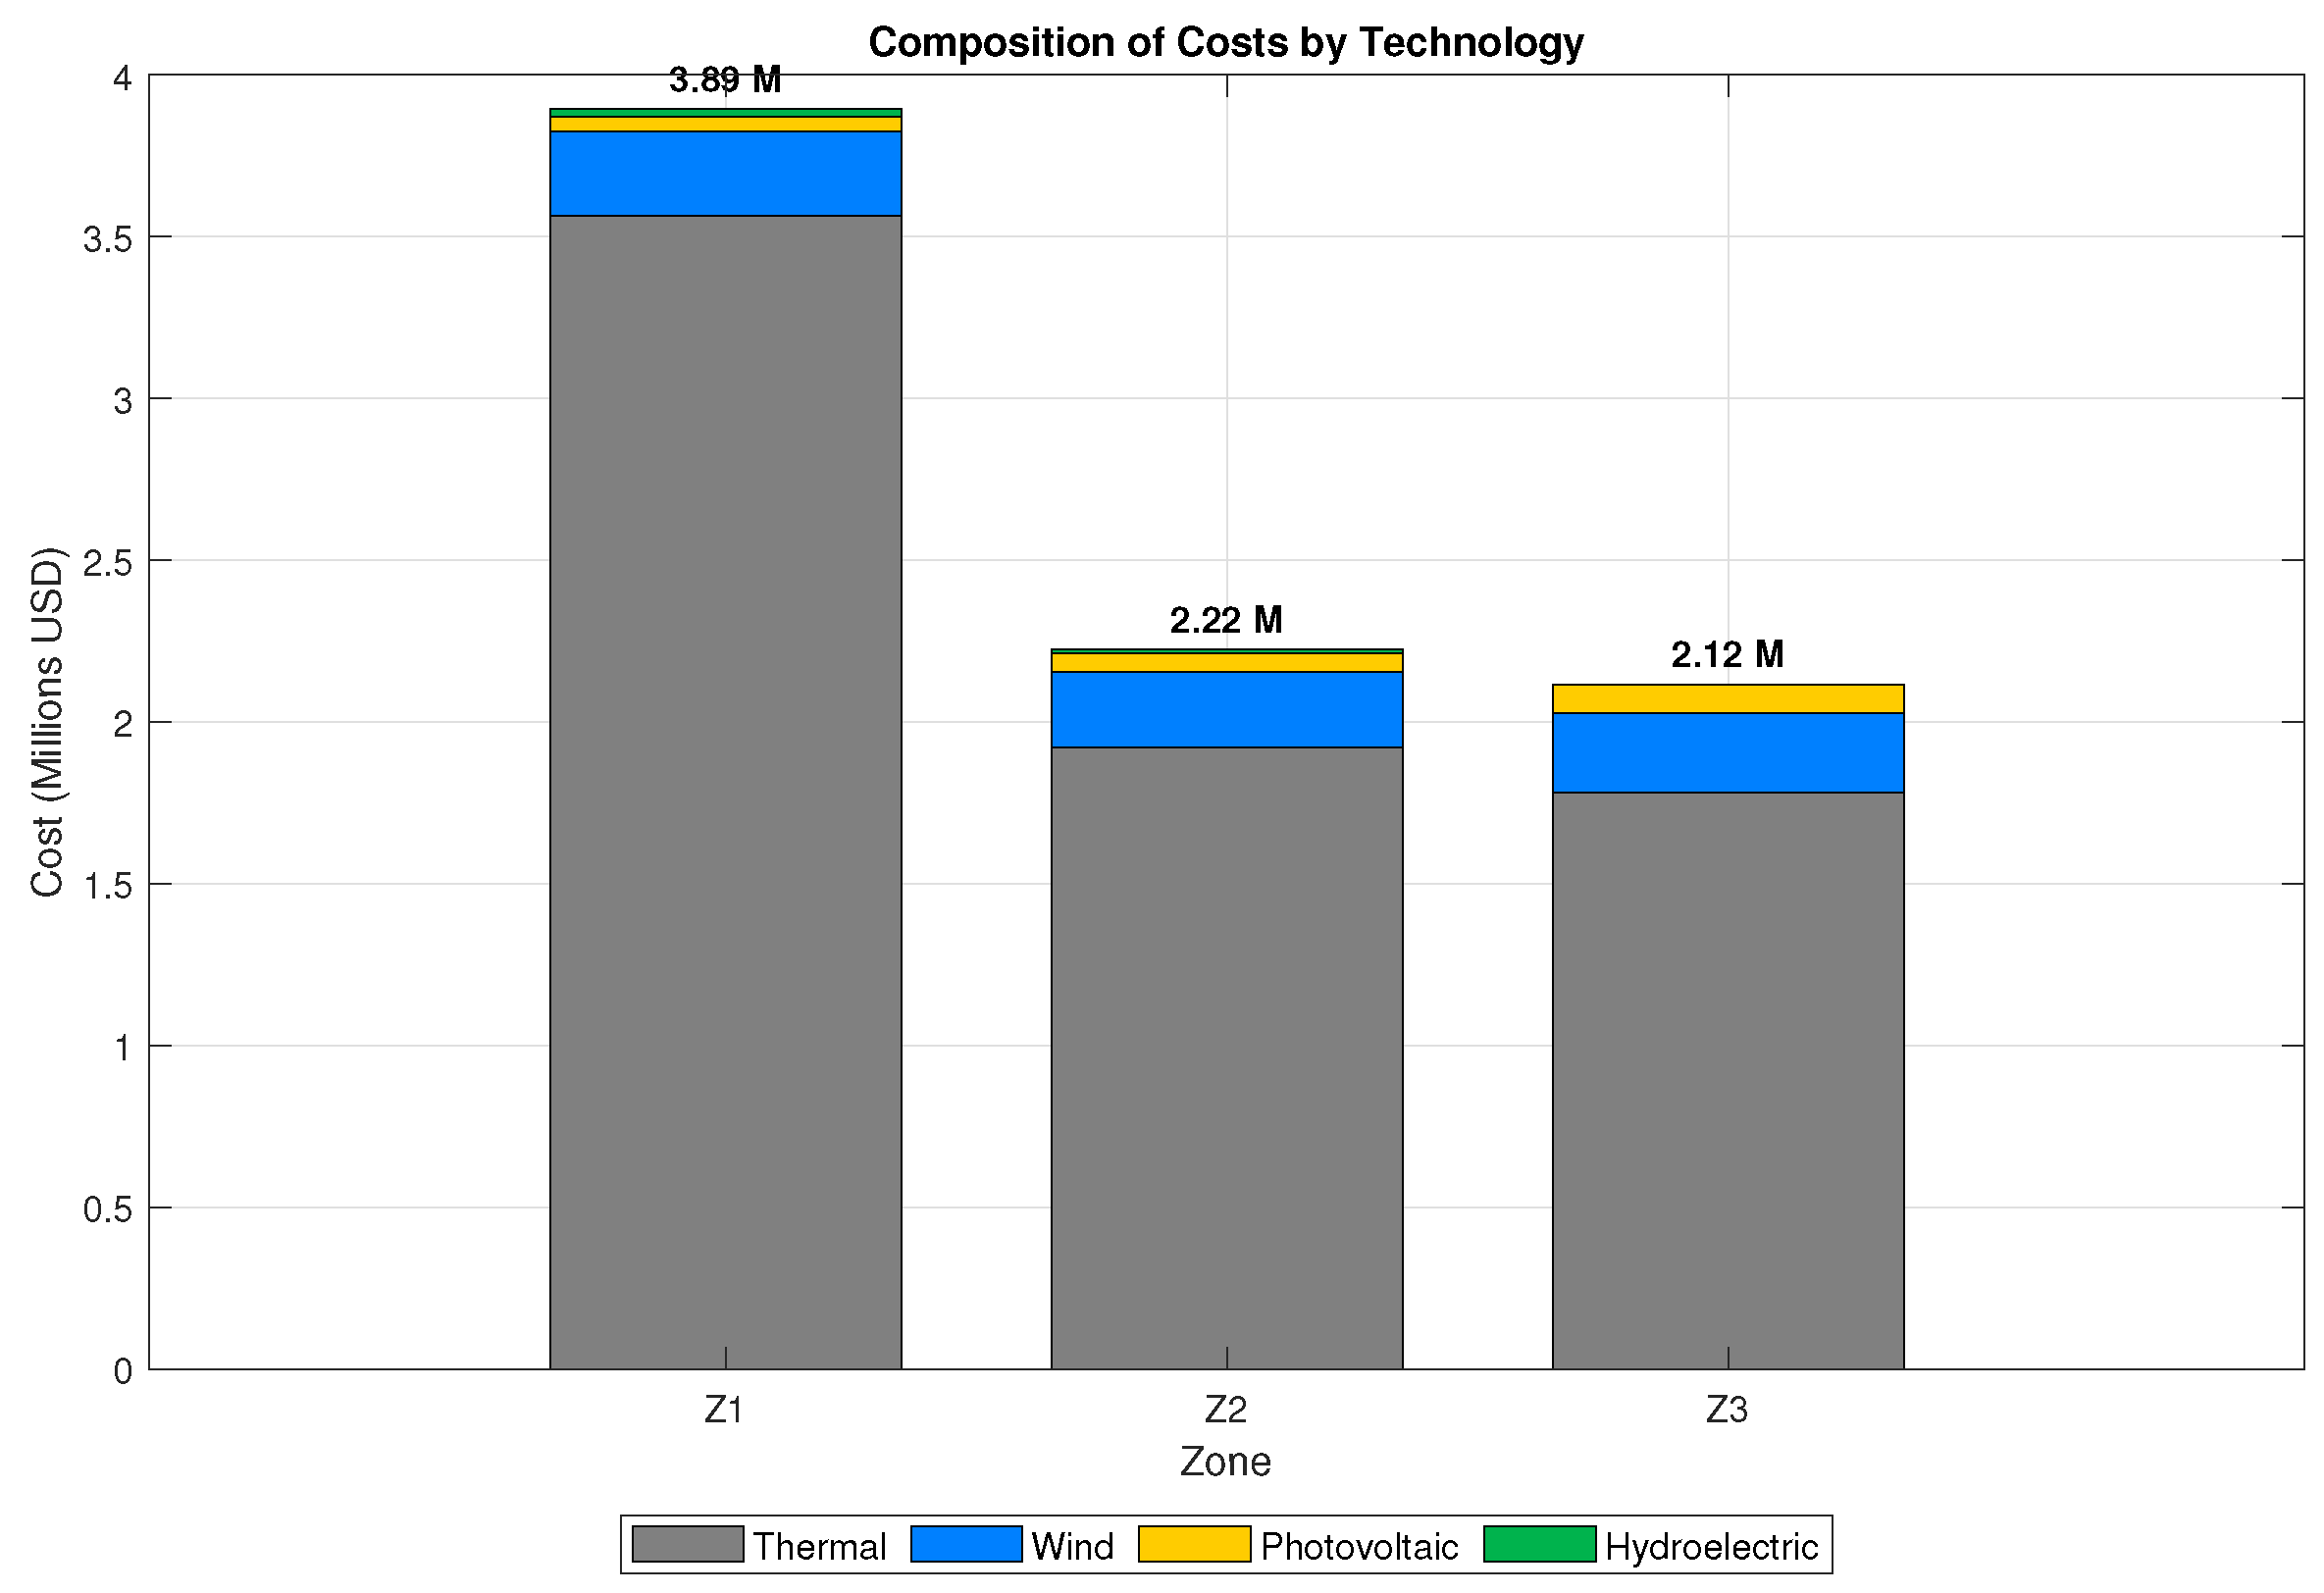
The cost composition of Scenario 1 is graphically summarized in
Figure 12. This figure highlights the strong dominance of thermal generation in the zonal cost structure and facilitates the comparison of the total operating burden among zones.
Figure 12 confirms that thermal generation is the main driver of total operating cost in all zones. Although renewable and hydroelectric technologies contribute to the energy supply, their economic burden is comparatively smaller. This cost structure anticipates that any mechanism capable of displacing part of the thermal generation, such as interzonal coordination or storage-supported renewable integration, may produce a significant reduction in total operating cost.
4.2. Scenario 2: Interconnected Operation with Storage Support
Scenario 2 represents the coordinated operation of the three-zone system under interconnection and with active participation of battery energy storage systems. In this configuration, the model is allowed to dispatch generation jointly across zones, to exchange power through the interzonal links, and to schedule BESS charging and discharging actions in Zones 2 and 3. The resulting solution therefore reflects the economically optimal coordination of generation, storage, and interzonal transfers over the full study horizon.
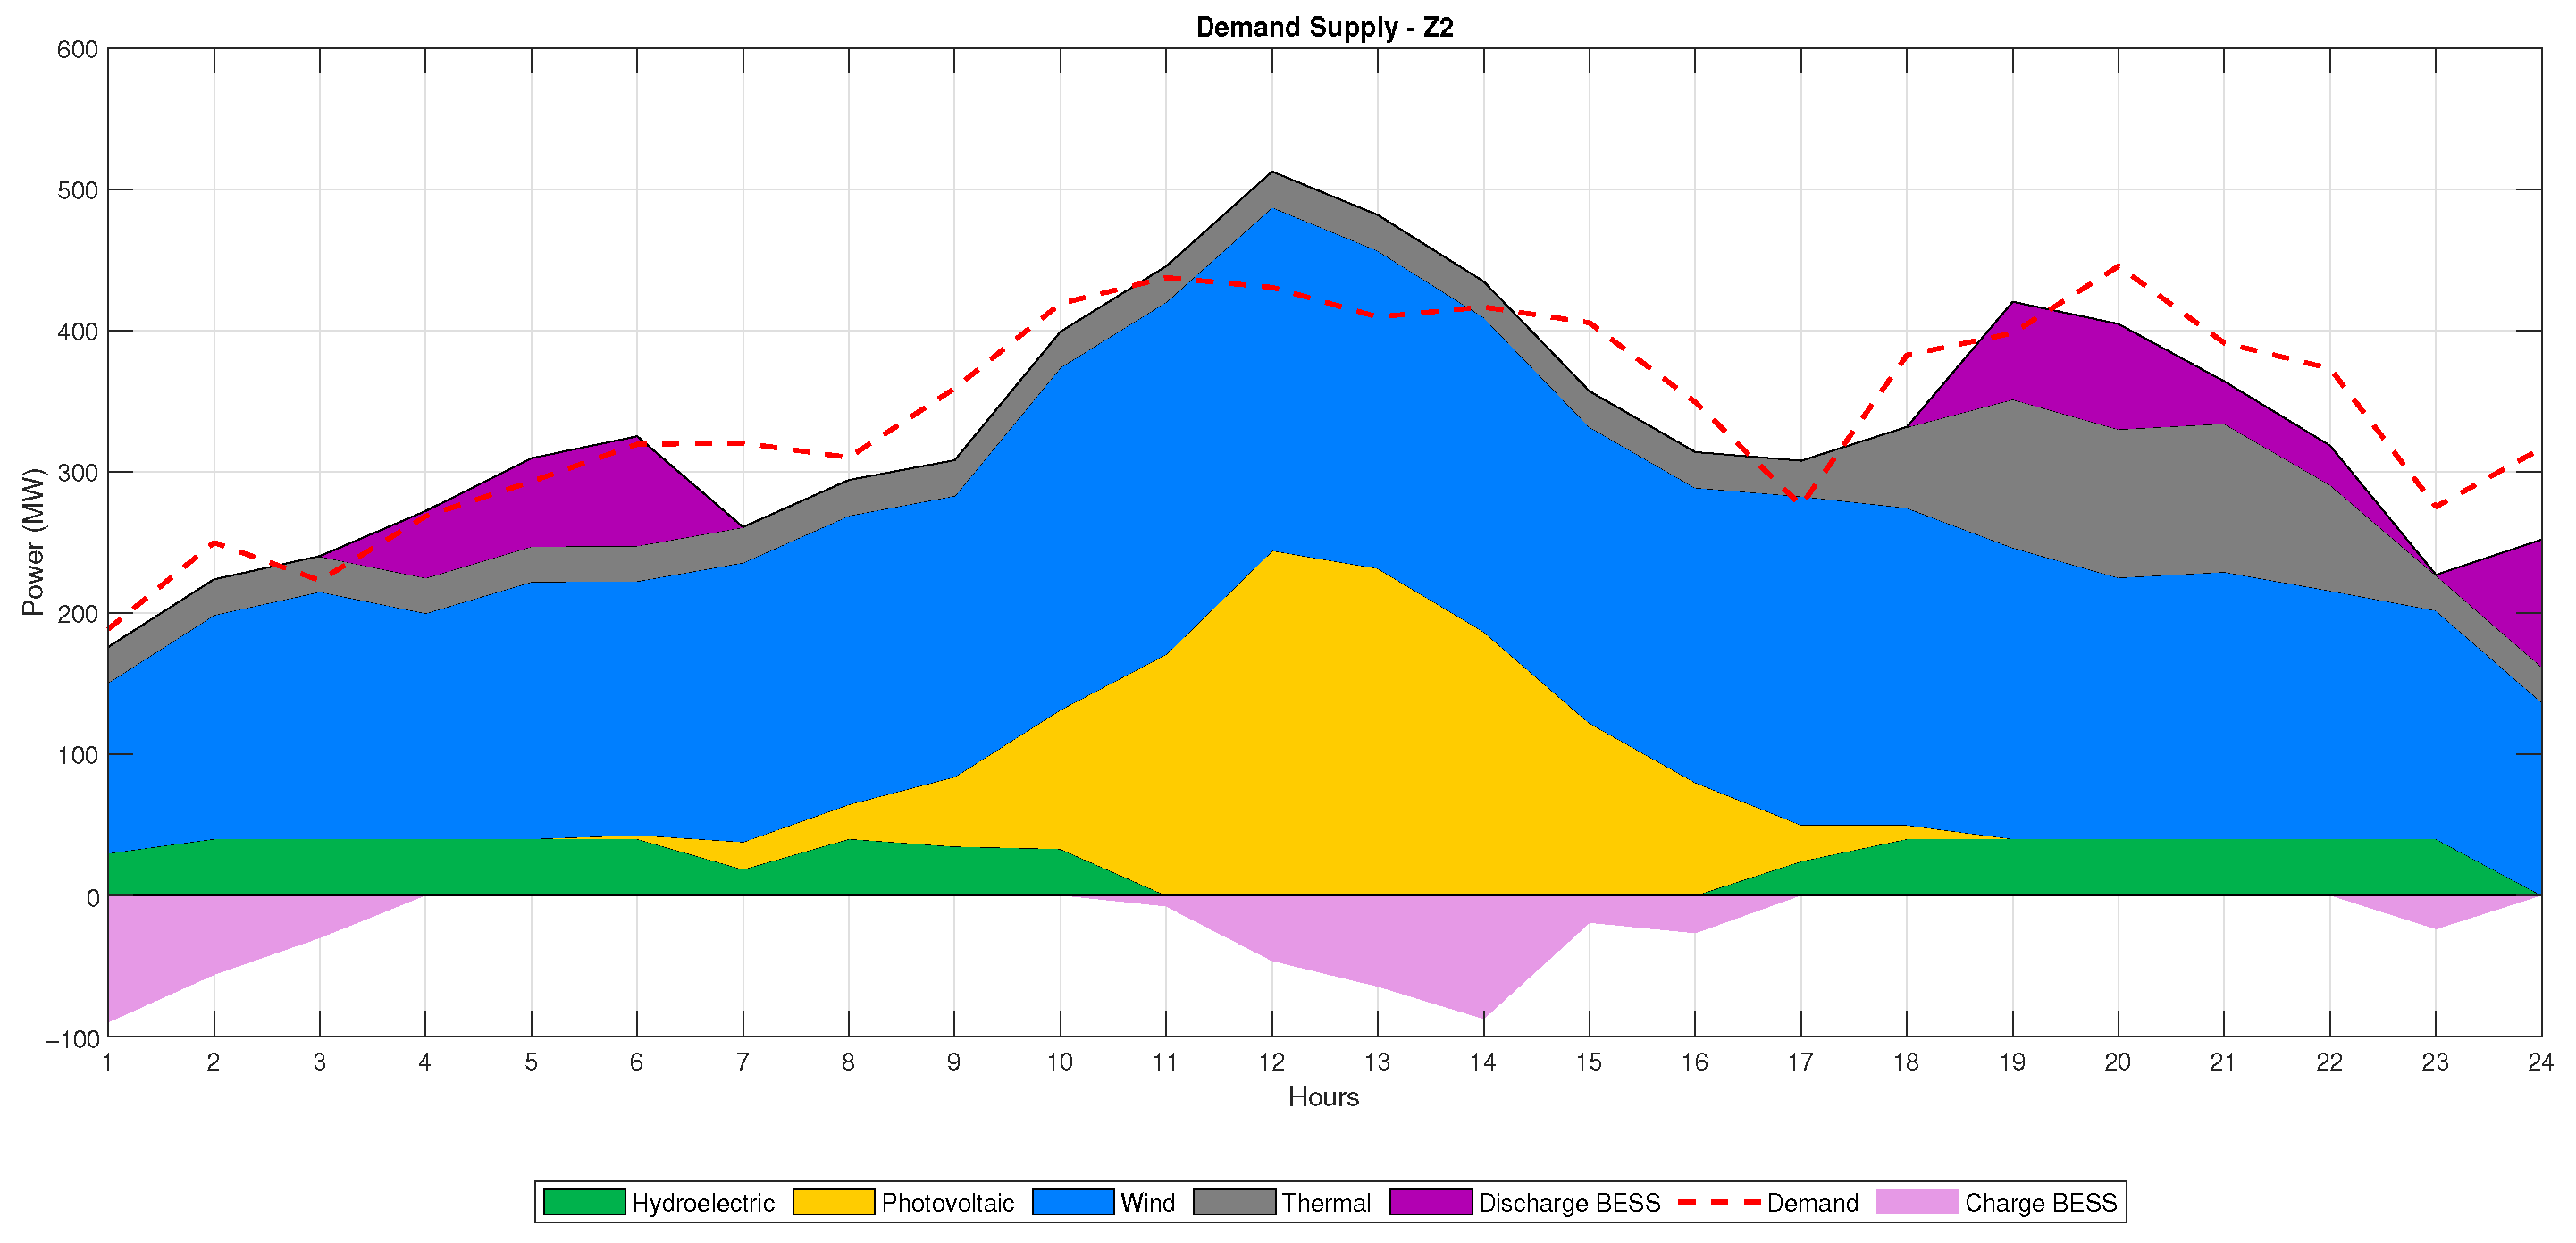
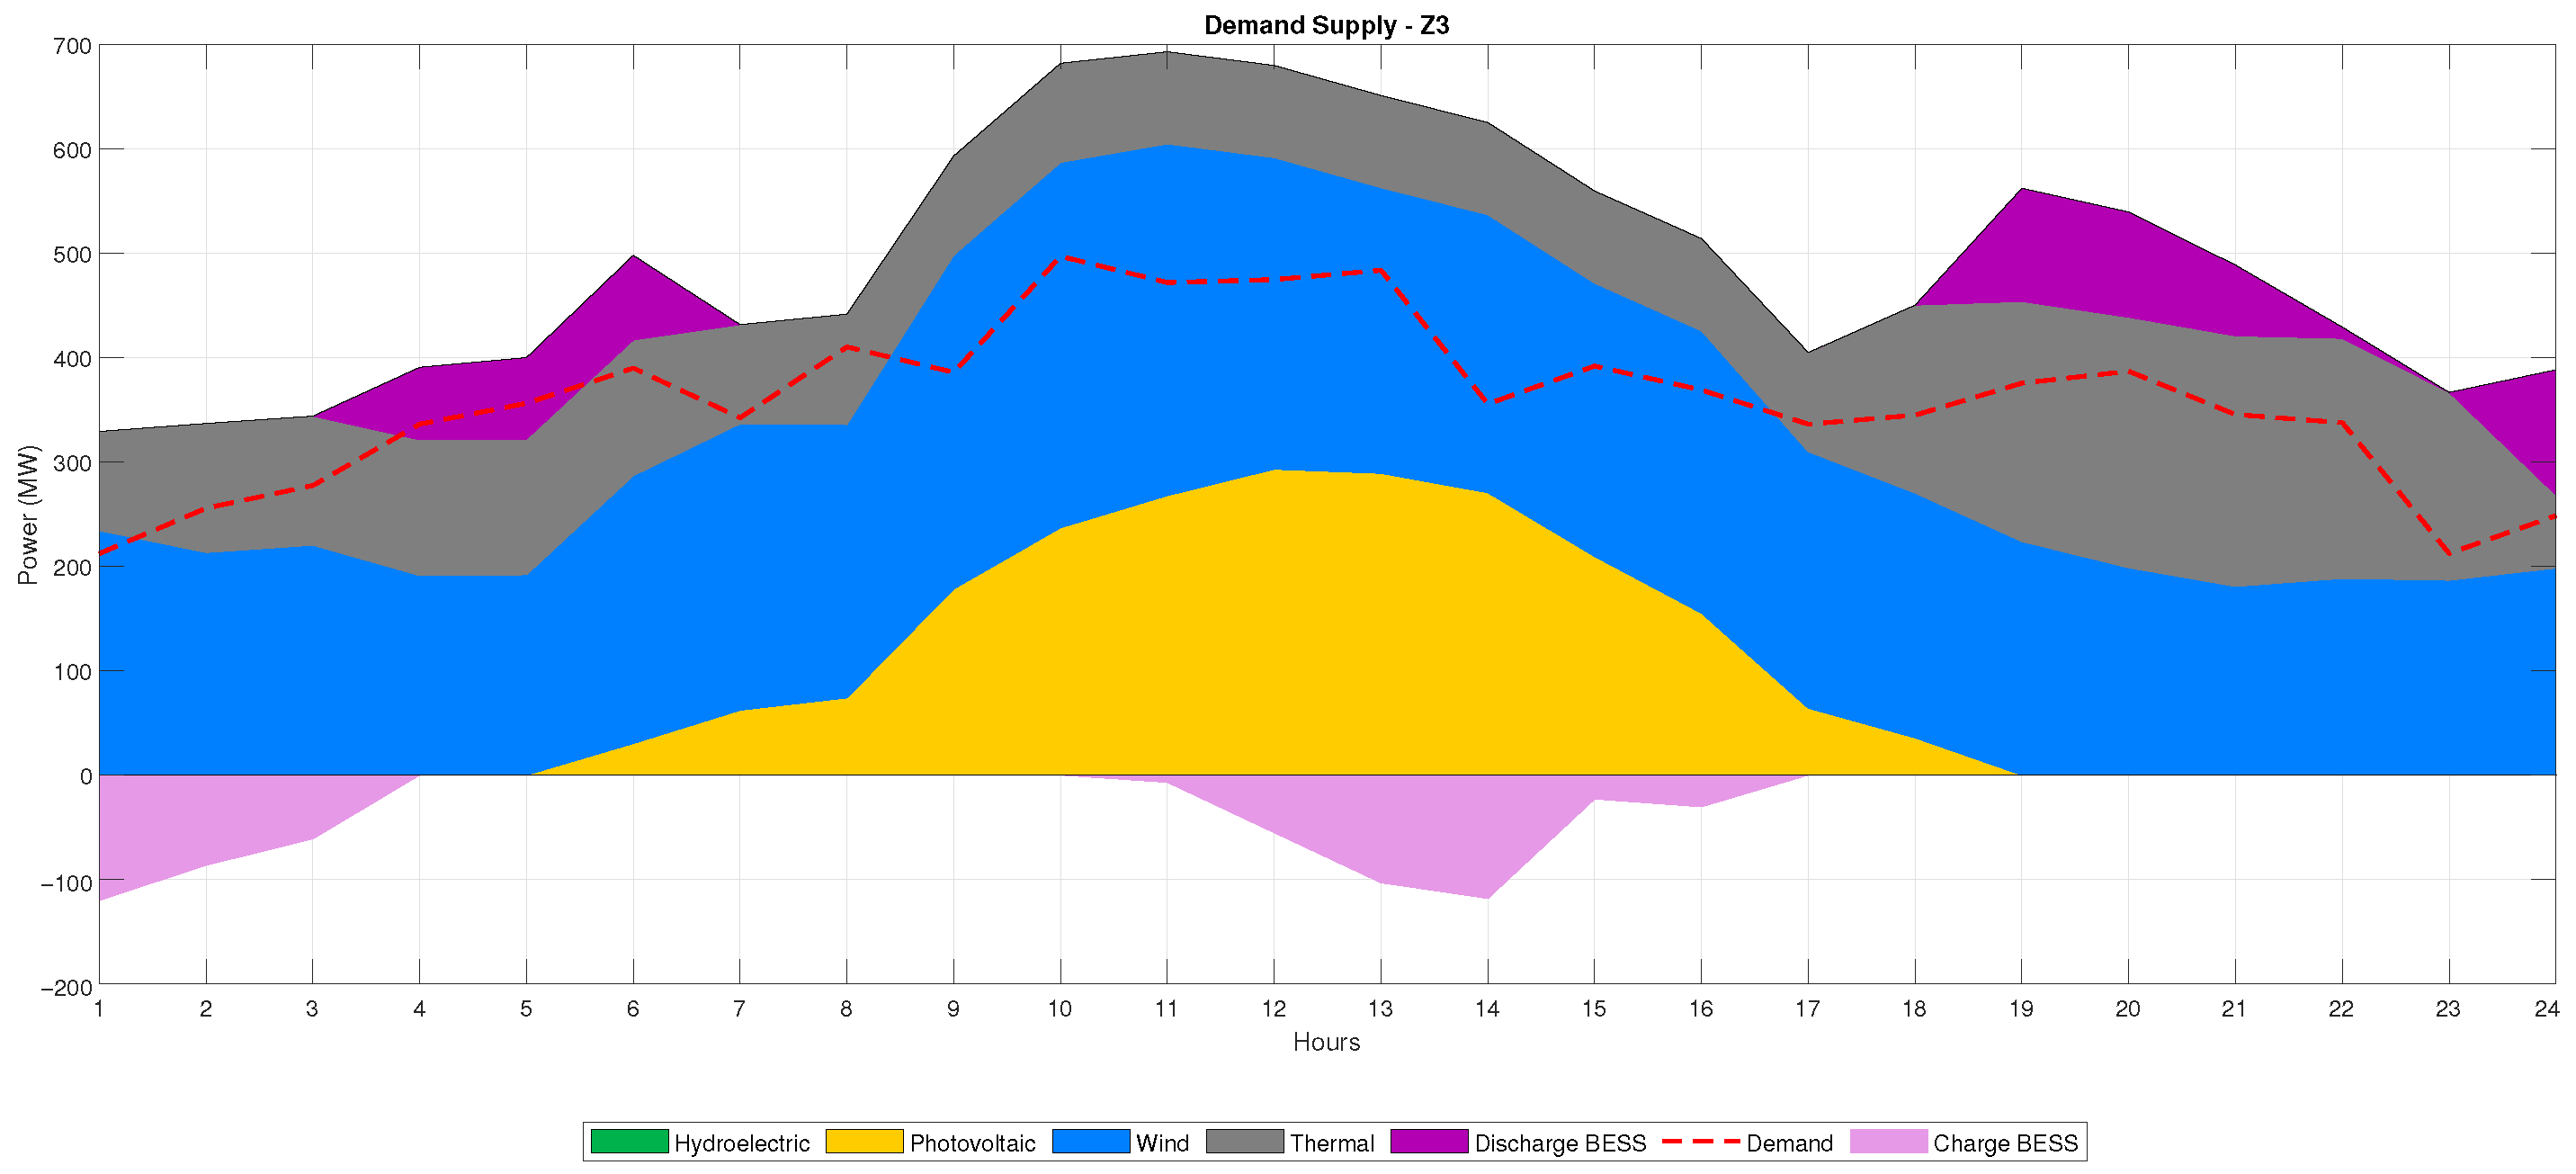
The hourly dispatch results for Scenario 2 are shown in
Figure 13,
Figure 14 and
Figure 15. In contrast to Scenario 1, these figures include not only the contribution of the generating technologies but also the charging and discharging actions of the storage systems. Consequently, they provide a direct visualization of how storage modifies the effective supply profile and supports coordinated operation.
Figure 13,
Figure 14 and
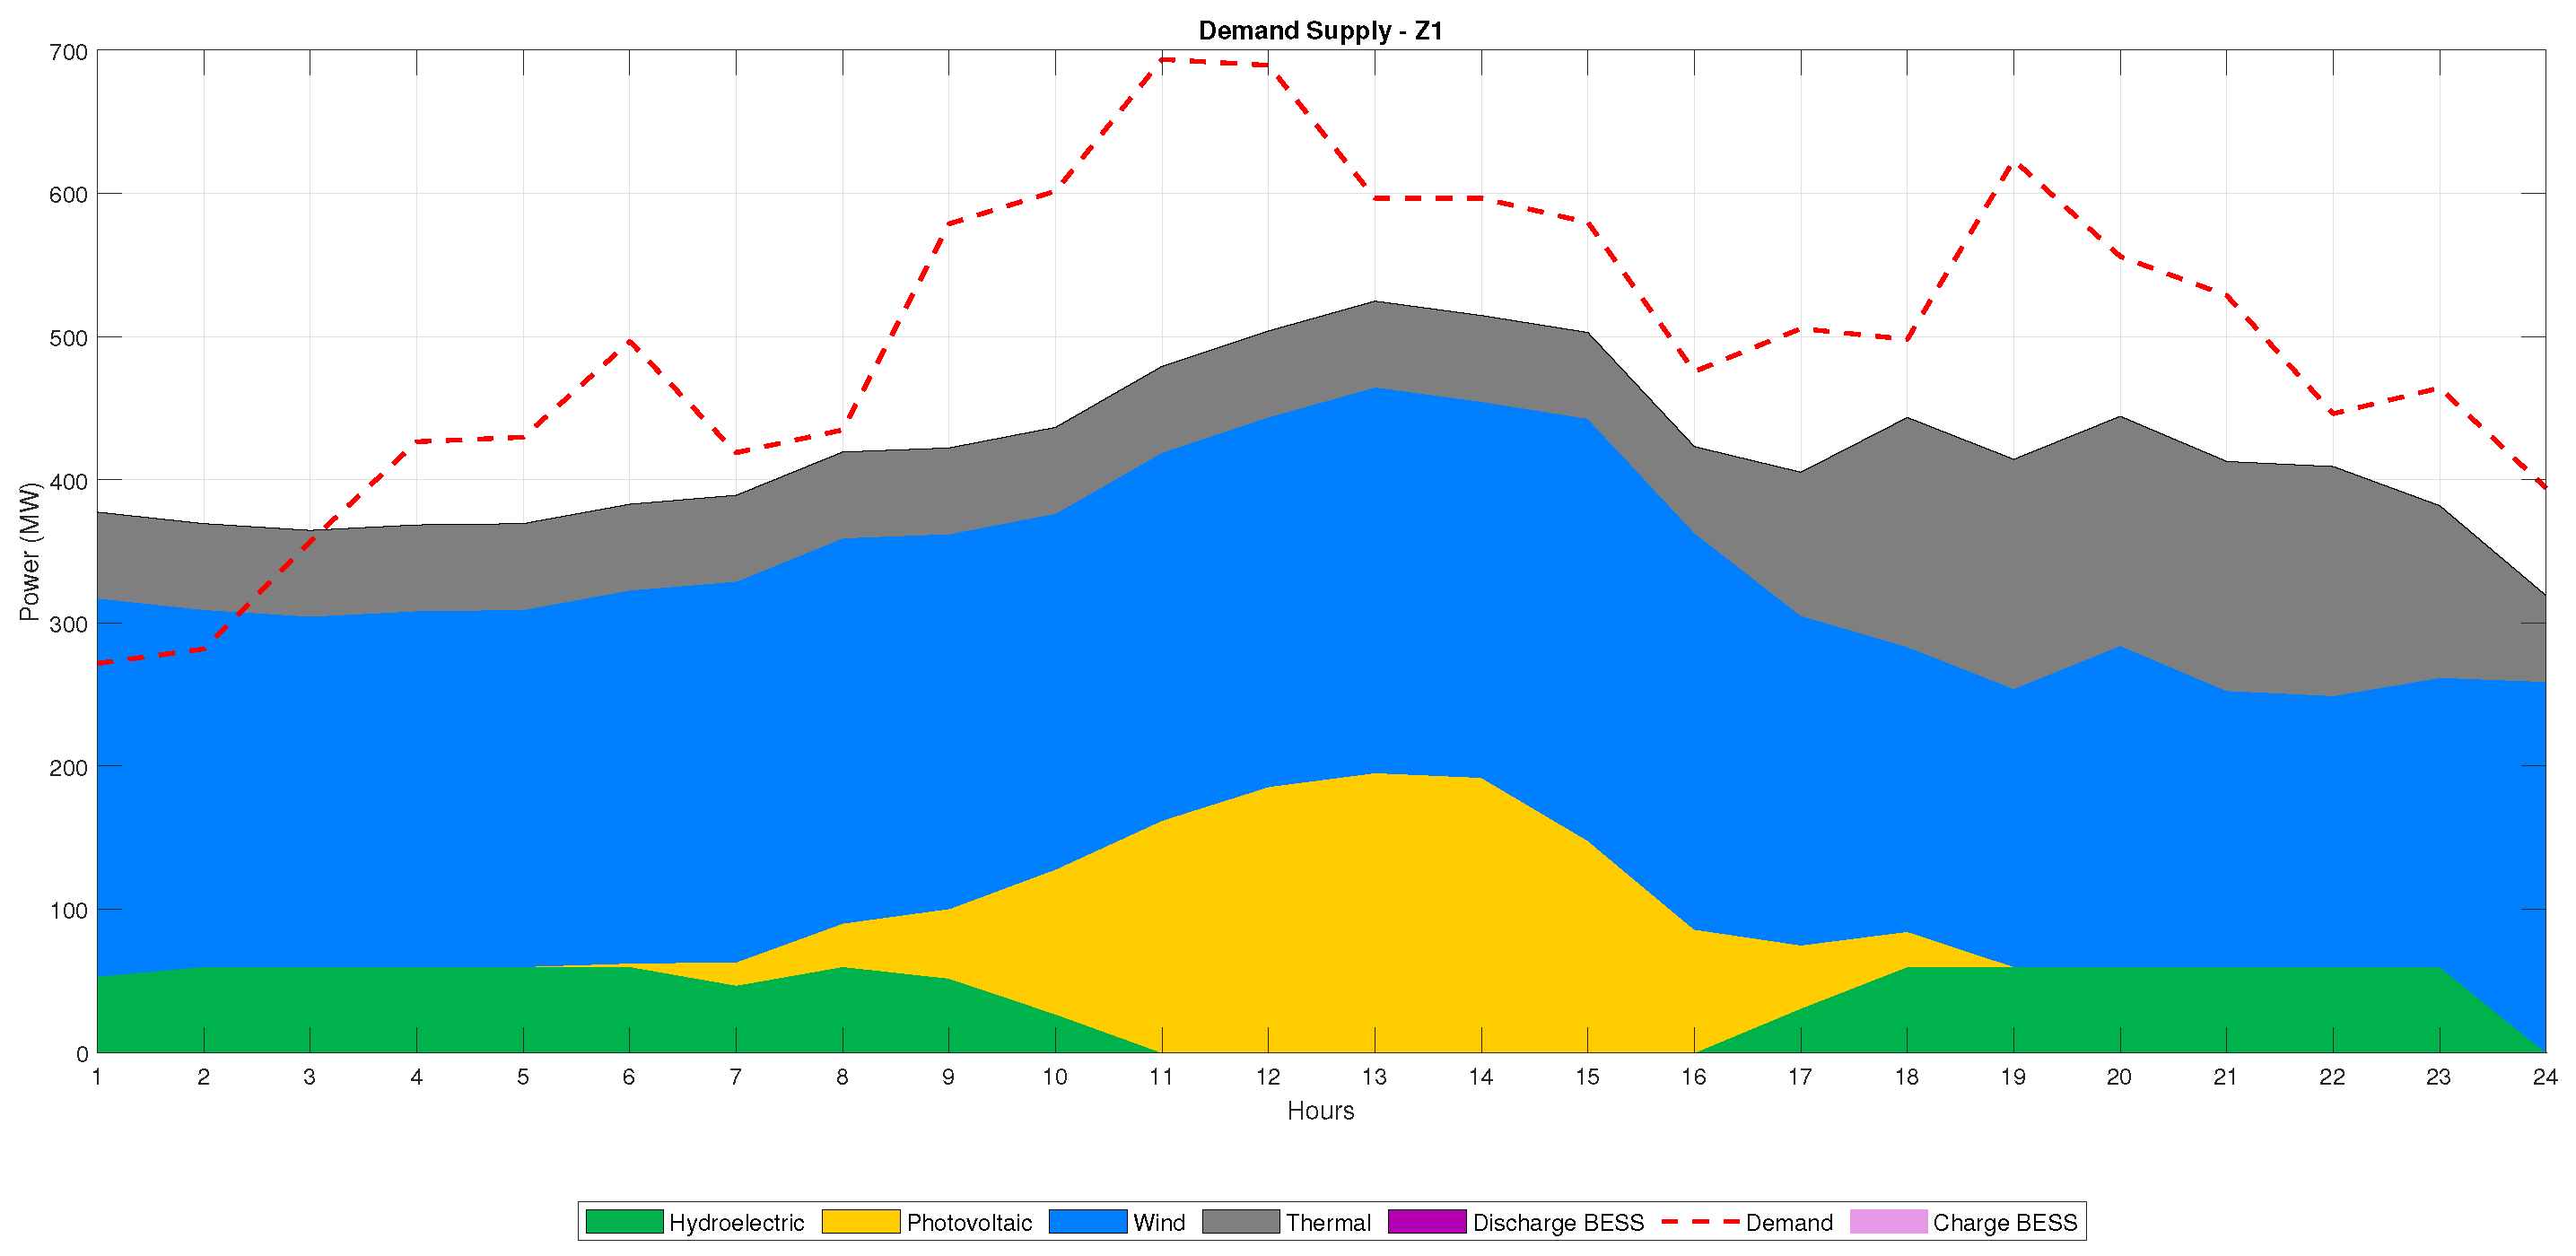
Figure 15 show that the interconnected system continues to satisfy the hourly demand of each zone while allowing a more flexible use of renewable generation and thermal support. In Zones 2 and 3, charging periods are associated with hours of greater resource availability or economically favorable supply conditions, whereas discharging periods occur when the system benefits from additional support to reduce the reliance on more expensive thermal production. As a result, storage operates as an intertemporal flexibility mechanism that complements both local renewable generation and interzonal transfers.
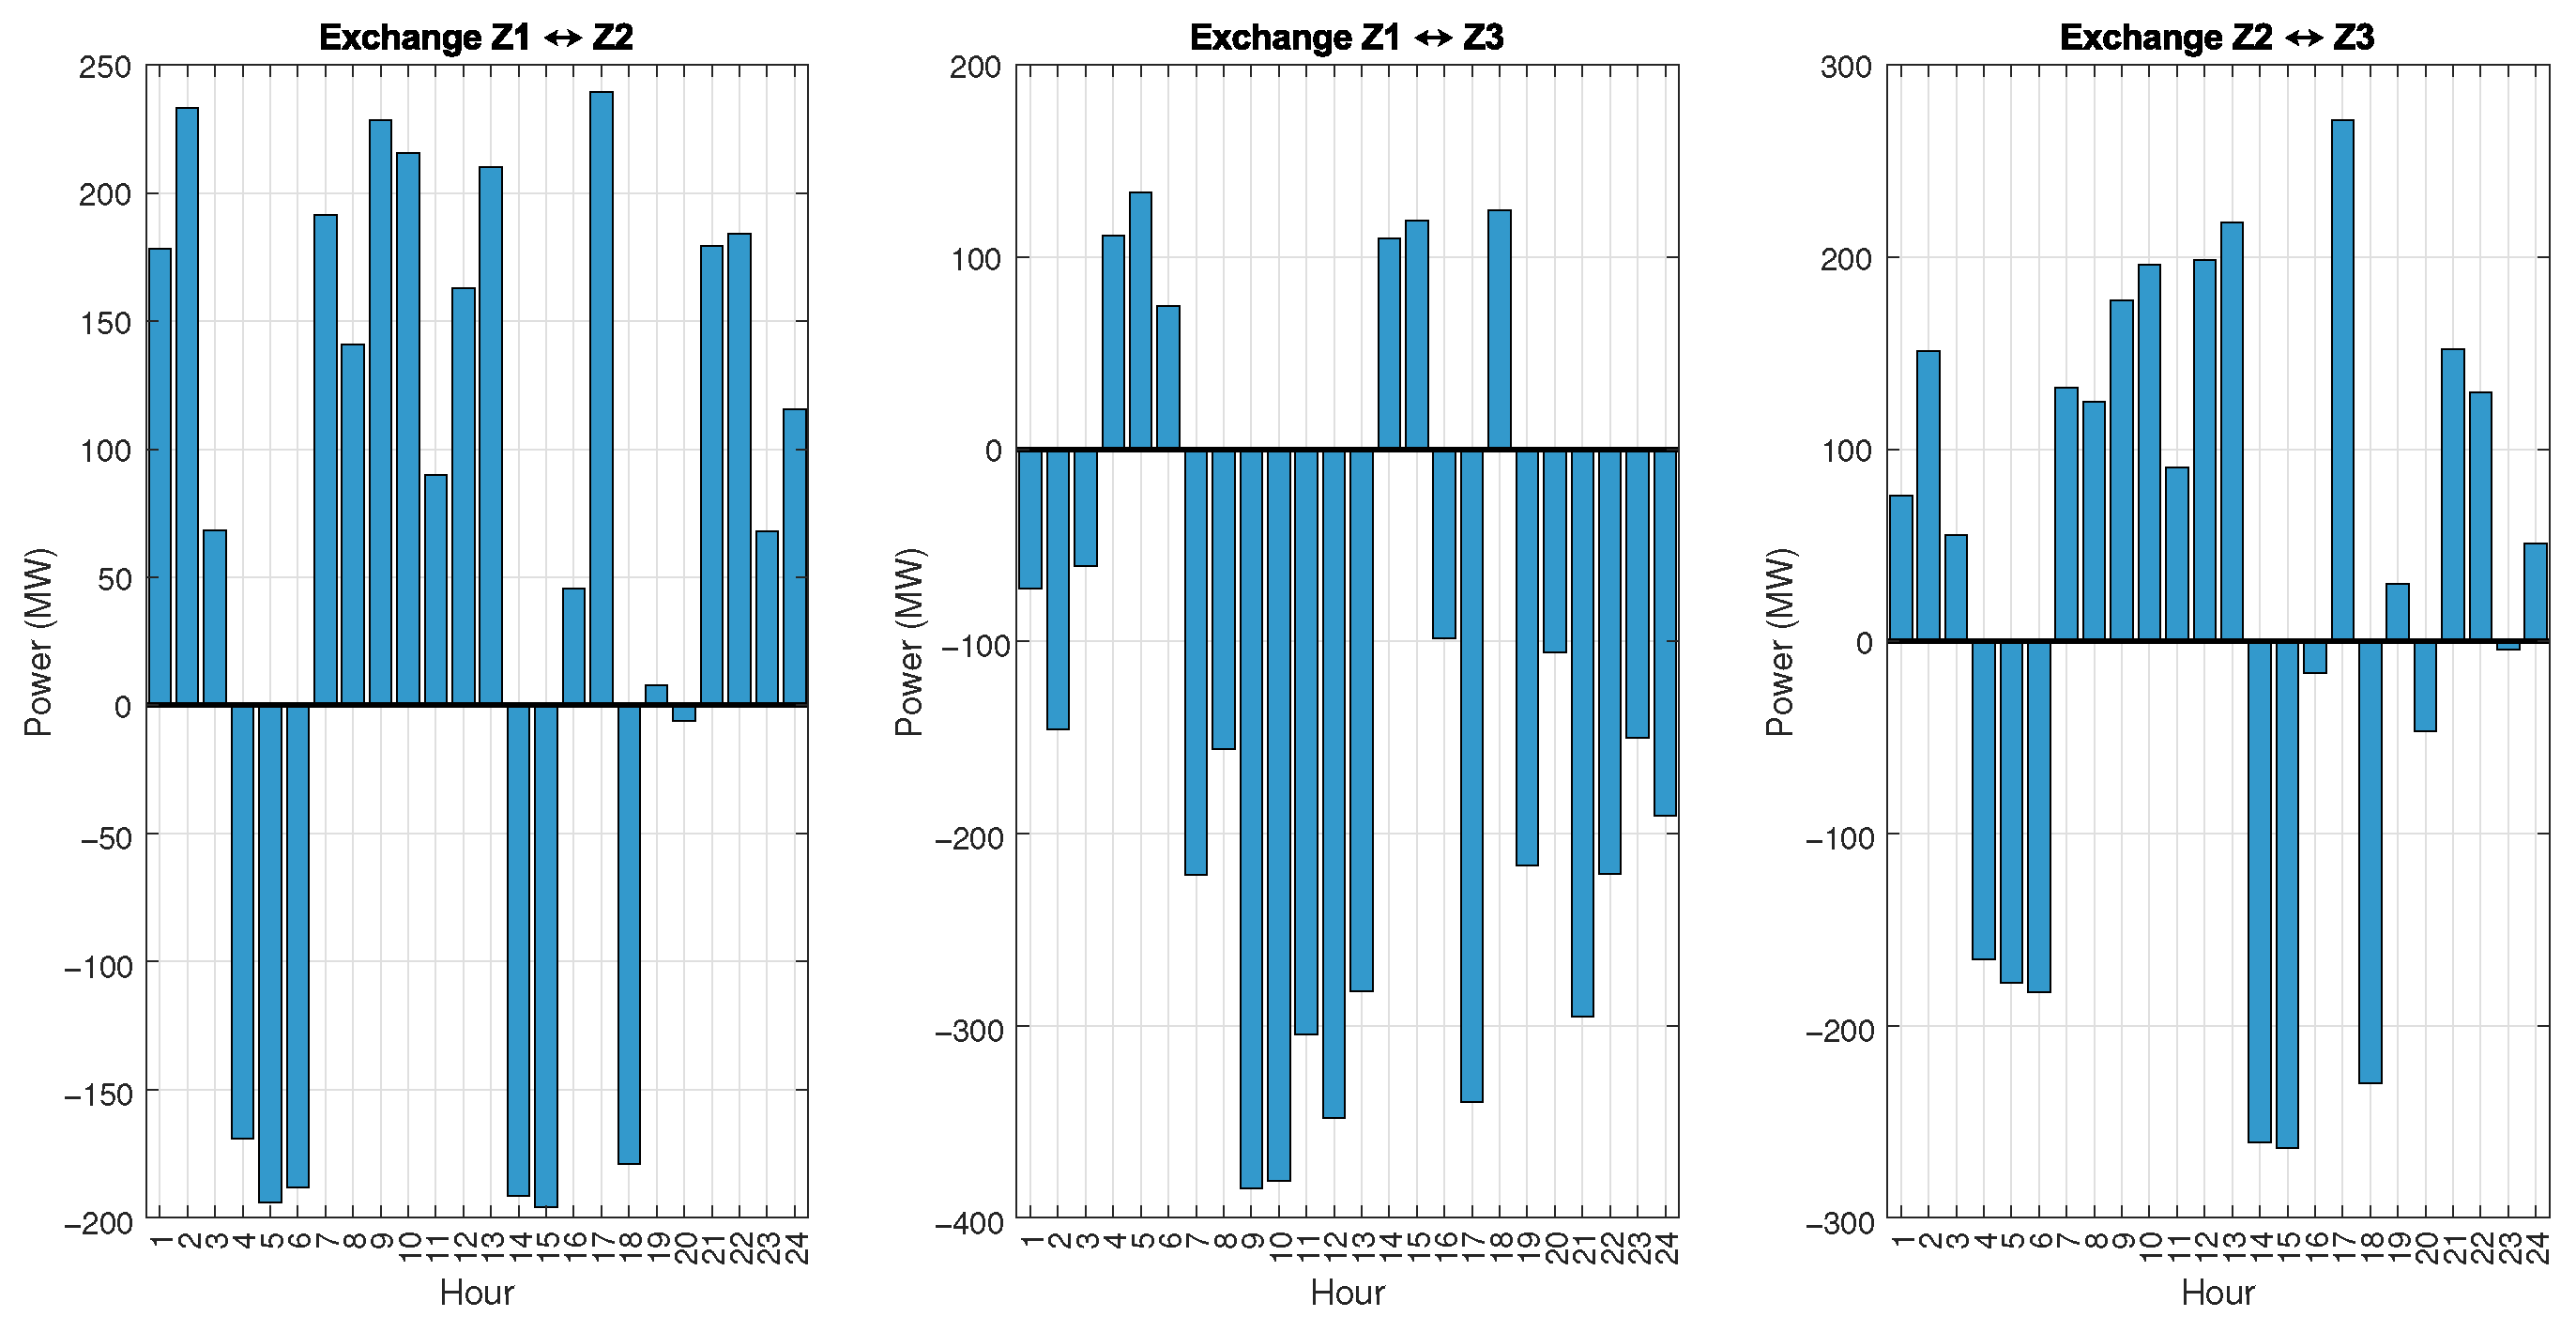
The coordinated nature of Scenario 2 is more clearly observed in
Figure 16, which presents the hourly interzonal exchanges. This figure is central for interpreting the multi-zone optimization results because it reveals when each transmission corridor operates in import or export mode and therefore identifies the zones acting as net suppliers or net receivers over time.
Figure 16 demonstrates that Scenario 2 is characterized by active bilateral energy exchange throughout the day. The transfer patterns indicate that the coordinated dispatch is not solely determined by local generation adequacy but also by the comparative economic advantage of particular zonal resources and by the flexibility introduced by storage. Consequently, the interconnection network is effectively used to reallocate energy spatially, enabling lower-cost generation and stored energy to support zones where local autonomous operation would otherwise require higher-cost thermal production.
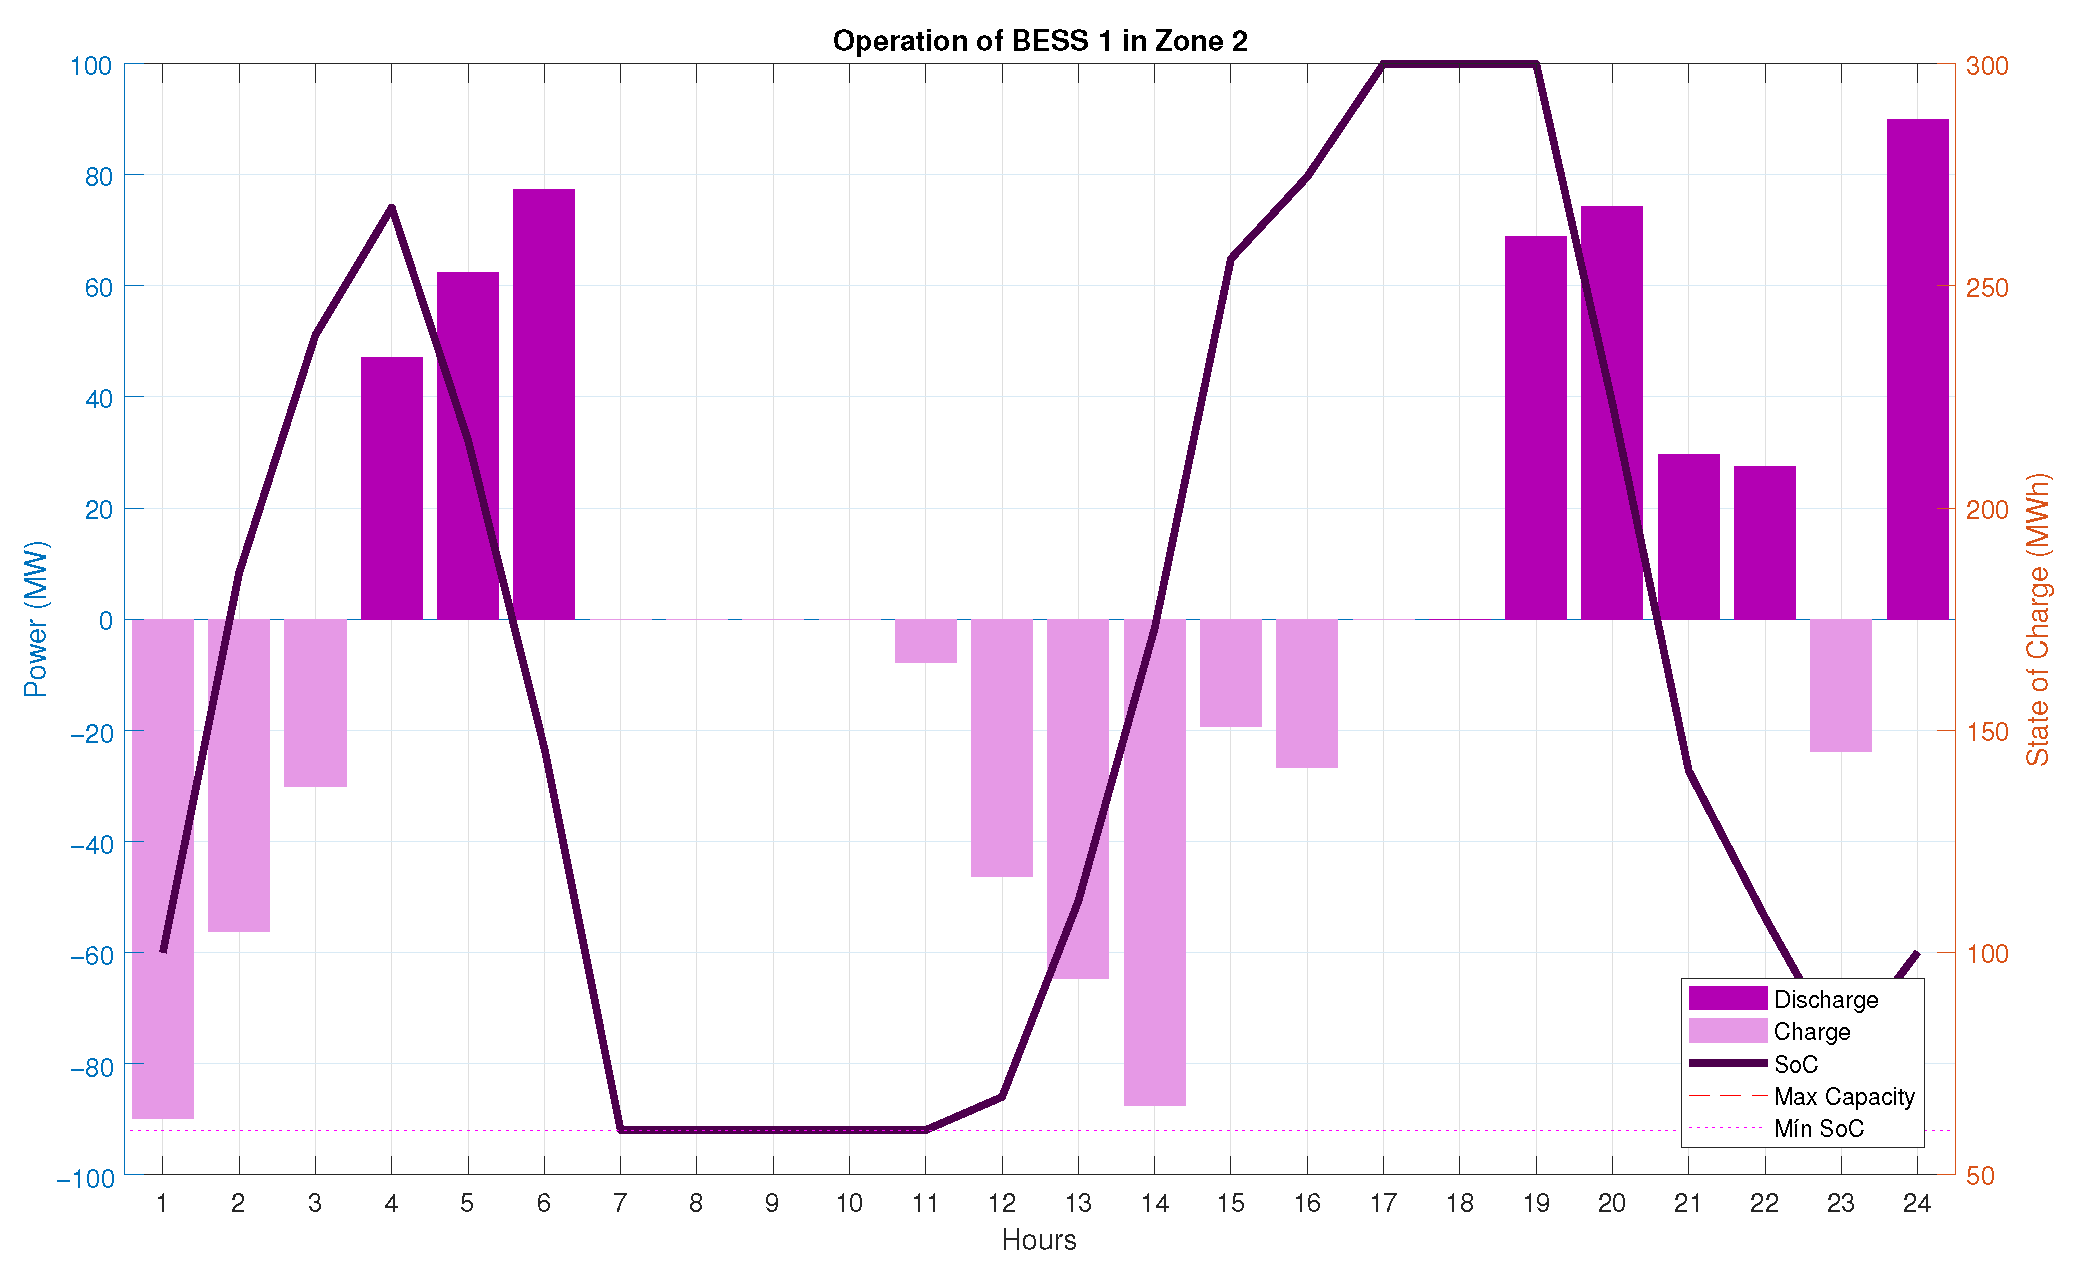
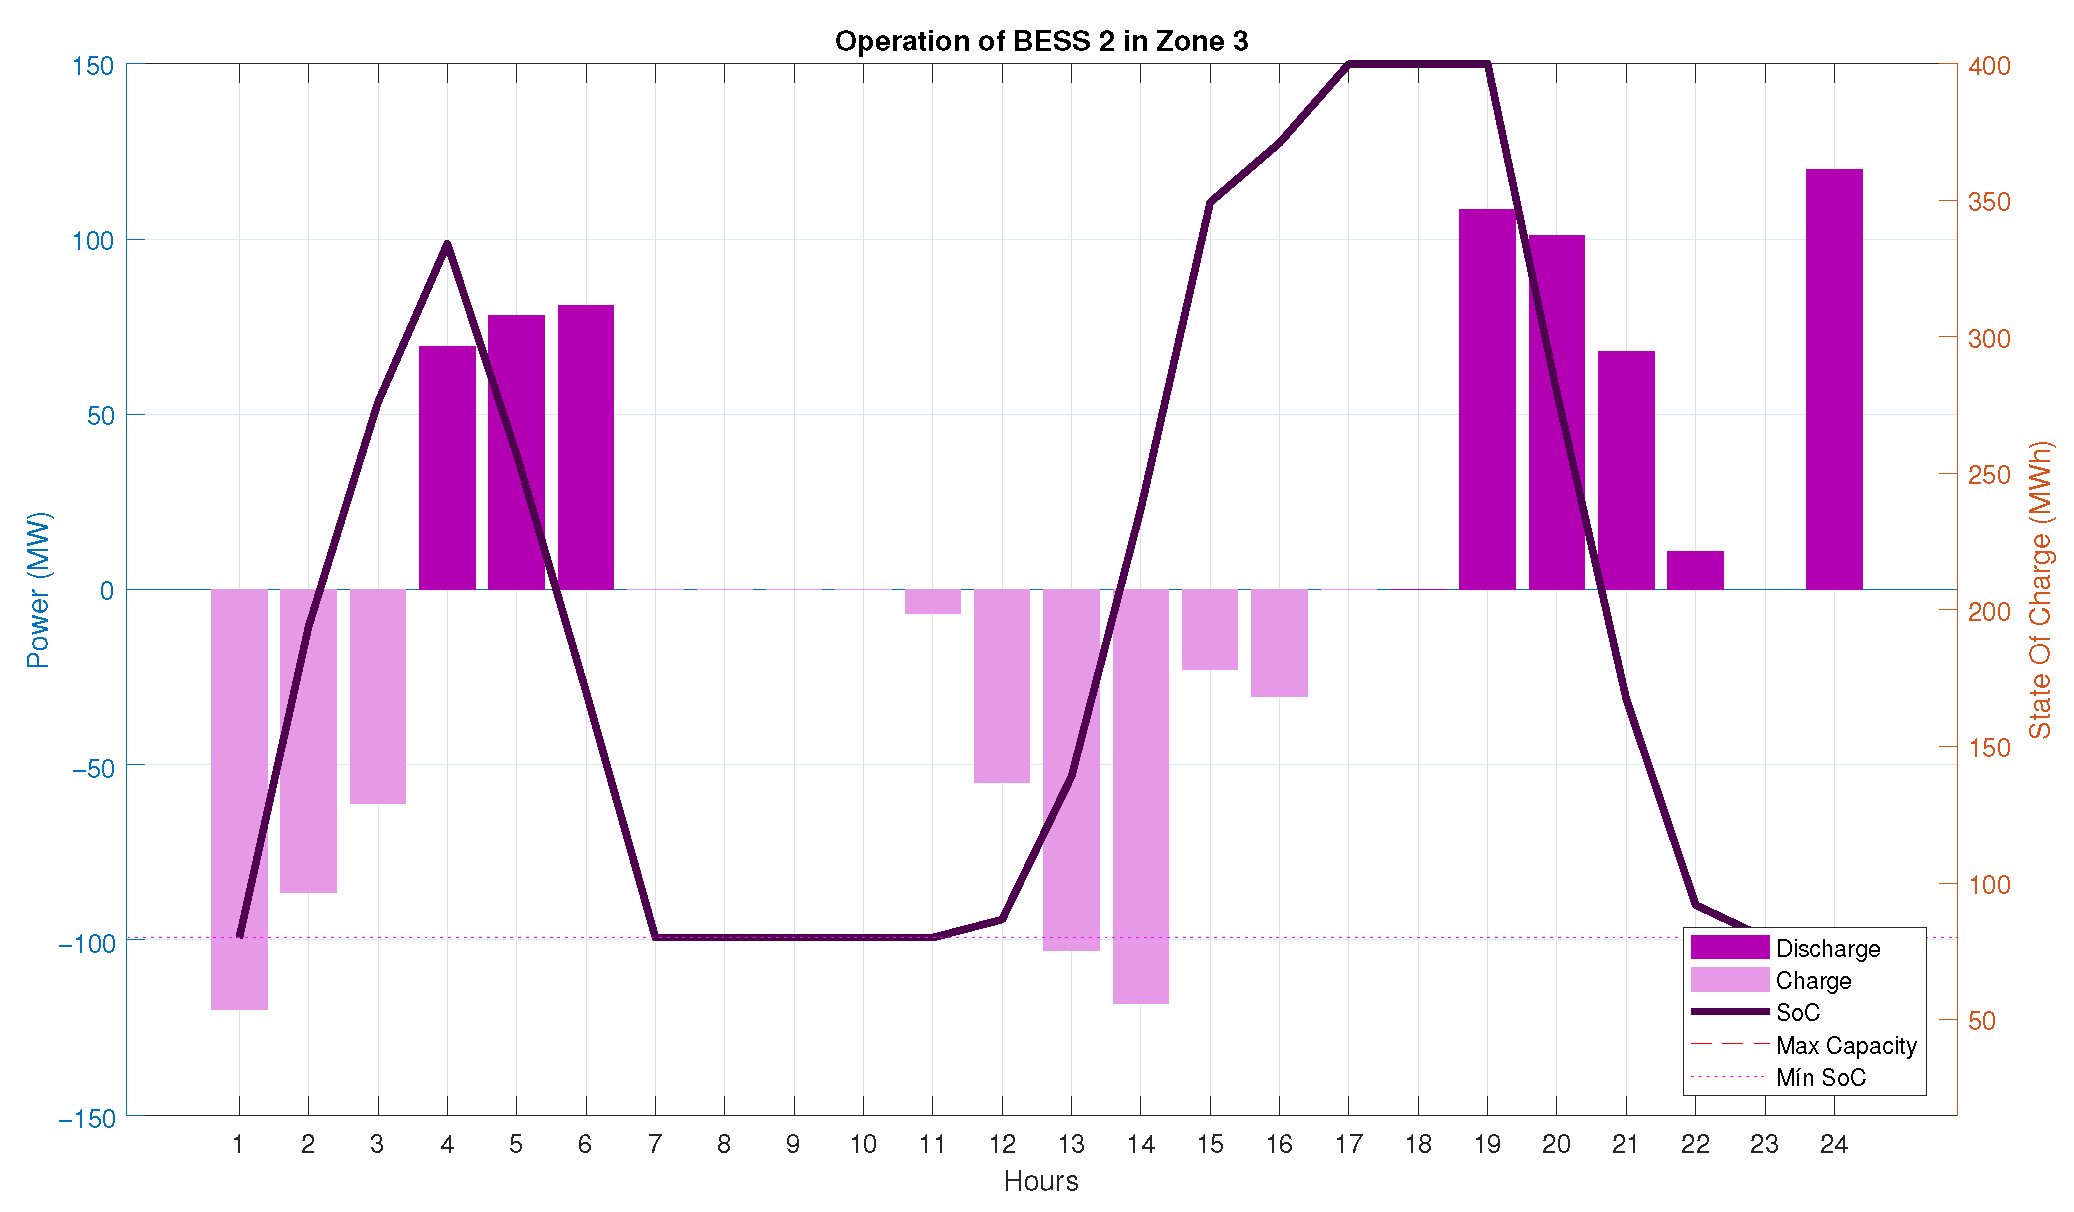
The role of the battery systems is further clarified in
Figure 17 and
Figure 18, which show the charging power, discharging power, and state-of-charge trajectory of the BESS installed in Zones 2 and 3, respectively. These figures are important because they verify the physical consistency of the storage schedule and demonstrate that the optimization respects both the maximum capacity and the minimum admissible state of charge.
Figure 17 and
Figure 18 confirm that both storage systems operate within their admissible energy bounds during the full 24-h horizon. In both zones, the state of charge increases during charging intervals and decreases during discharging intervals without violating the maximum storage capacity or the minimum reserve threshold. This result is relevant because it demonstrates that the cost reduction obtained in Scenario 2 is not a consequence of infeasible storage use, but rather of a physically admissible scheduling of charging and discharging actions coordinated with renewable generation and interzonal power exchange. In addition, the obtained trajectories are fully consistent with the benchmark operating parameters reported in
Table A4 and with the normalized storage limits imposed through Equations (
14)–(
16). Nevertheless, the present formulation does not impose a terminal state-of-charge equality condition between the end and the beginning of the 24-h horizon, so the reported storage-related benefits should be interpreted within the scope of a deterministic single-day scheduling benchmark.
The economic outcome of the interconnected strategy is summarized in
Table 8. This table reports the operating cost by technology and zone under Scenario 2 and therefore allows a direct comparison with the autonomous case.
Table 8 shows that the total operating cost under interconnected operation with storage support is 6.60 million USD. Compared with the 8.23 million USD obtained in Scenario 1, this result indicates a substantial reduction in total system cost. The largest contribution to the reduction is associated with the decrease in total thermal operating cost, which falls to 5.52 million USD. This confirms that coordinated interzonal operation and storage scheduling effectively displace part of the higher-cost thermal production required under autonomous zonal dispatch.
4.3. Comparative Analysis
A rigorous comparison between the two scenarios requires the simultaneous examination of energy allocation, interzonal transfers, storage participation, and cost structure.
Table 9 provides the comparative energy results of the two operating scenarios and therefore constitutes the starting point for the system-level analysis.
Table 9 shows that the total daily energy supplied remains constant at 28.80 GWh in both scenarios, which is expected because the total demand of the system is unchanged. However, the internal composition of the supply changes significantly. In Scenario 2, wind generation increases from 14.46 GWh to 16.44 GWh, whereas thermal generation decreases from 8.12 GWh to 6.08 GWh. This shift indicates that interconnection and storage allow a more extensive exploitation of renewable resources and reduce the dependence on thermal generation at the system level.
The relative changes in technology-specific energy allocation are quantified in
Table 10. This table is useful because it isolates the directional change of each technology by zone when the system transitions from autonomous to coordinated operation.
According to
Table 10, coordinated operation produces only marginal changes in hydroelectric and photovoltaic production, while the most relevant redistribution occurs in wind and thermal generation. Wind generation increases by 1% in Zone 1, 4% in Zone 2, and 41% in Zone 3. At the same time, thermal generation decreases by 49% in Zone 1 and by 51% in Zone 2, whereas it increases by 38% in Zone 3. These results indicate that the optimal interconnected solution concentrates a greater share of dispatch in those zones and technologies that are economically more competitive under the network and storage constraints. In particular, Zone 3 emerges as an important supply region in Scenario 2, combining strong wind participation with additional thermal support and export capability.
The spatial redistribution of energy is explicitly quantified in
Table 11, which presents the interzonal energy transfers observed under the interconnected scenario.
Table 11 shows that Zone 3 acts as the main net exporter of the system, delivering a total of 2.60 GWh, of which 1.59 GWh is transferred to Zone 1 and 1.01 GWh to Zone 2. In parallel, Zone 2 exports 0.28 GWh to Zone 1. Consequently, Zone 1 is the main net importing area, receiving 1.87 GWh in total. This exchange pattern is fully consistent with the reduction in thermal generation observed in Zones 1 and 2 and with the increase in generation dispatched in Zone 3. Therefore, the interconnection network effectively enables the system to replace more expensive local generation with lower-cost imported energy.
The direct contribution of the storage systems to the energy balance is summarized in
Table 12. This table reports the daily charged and discharged energy of the BESS installed in Zones 2 and 3 and therefore allows the net storage contribution to be quantified.
Table 12 indicates that the storage systems absorb a total of 1.06 GWh and subsequently deliver 1.11 GWh to the system. Although the net balance is relatively small at the daily level, the operational significance of the BESS is not limited to the absolute amount of energy shifted. Their main value lies in the temporal relocation of energy and in the additional flexibility they provide for coordinating renewable generation and interzonal transfers. This behavior is consistent with the hourly BESS profiles shown in
Figure 17 and
Figure 18, where charging and discharging occur during economically strategic periods.
The economic comparison between both scenarios is summarized in
Table 13. This table is particularly relevant because it consolidates the technology-specific and zonal cost breakdown for the two operating strategies.
Table 13 shows that coordinated operation reduces the total operating cost from 8.23 million USD to 6.60 million USD, which corresponds to a reduction of 1.63 million USD. The dominant mechanism behind this reduction is the decrease in total thermal cost, from 7.27 million USD to 5.52 million USD. At the zonal level, the most significant decreases occur in Zones 1 and 2, whereas Zone 3 exhibits a higher total cost in Scenario 2 because it becomes a major exporting zone and therefore dispatches a larger share of generation to support the rest of the system.
The technology-specific cost variations are reported in
Table 14. This table isolates the absolute and relative changes in cost between both scenarios and therefore clarifies which technologies are responsible for the net economic improvement.
According to
Table 14, the strongest economic effect is the reduction in thermal-generation cost in Zones 1 and 2, which offsets the increase in thermal and wind costs observed in Zone 3. This result is fully consistent with the transfer pattern identified in
Table 11: the interconnected solution shifts part of the generation burden toward zones with more favorable supply conditions and uses the transmission network and storage systems to redistribute that energy spatially and temporally. From a mechanistic perspective, the cost reduction is explained by three mutually reinforcing effects. First, interzonal coordination allows the system to exploit geographical diversity in resource availability and generation cost, so that part of the demand in importing zones can be supplied by comparatively more economical generation dispatched elsewhere. Second, the battery systems reduce the need for thermally supplied balancing energy during critical hours by shifting energy from periods of more favorable operating conditions to periods of higher marginal cost. Third, because thermal generation is the dominant contributor to total operating cost in the autonomous case, even partial displacement of thermal output produces a disproportionately large reduction in system-wide cost. Therefore, the economic benefit of Scenario 2 does not arise from a simple reduction of generation, but from a coordinated reallocation of production across zones and hours that preferentially displaces the most expensive thermal support.
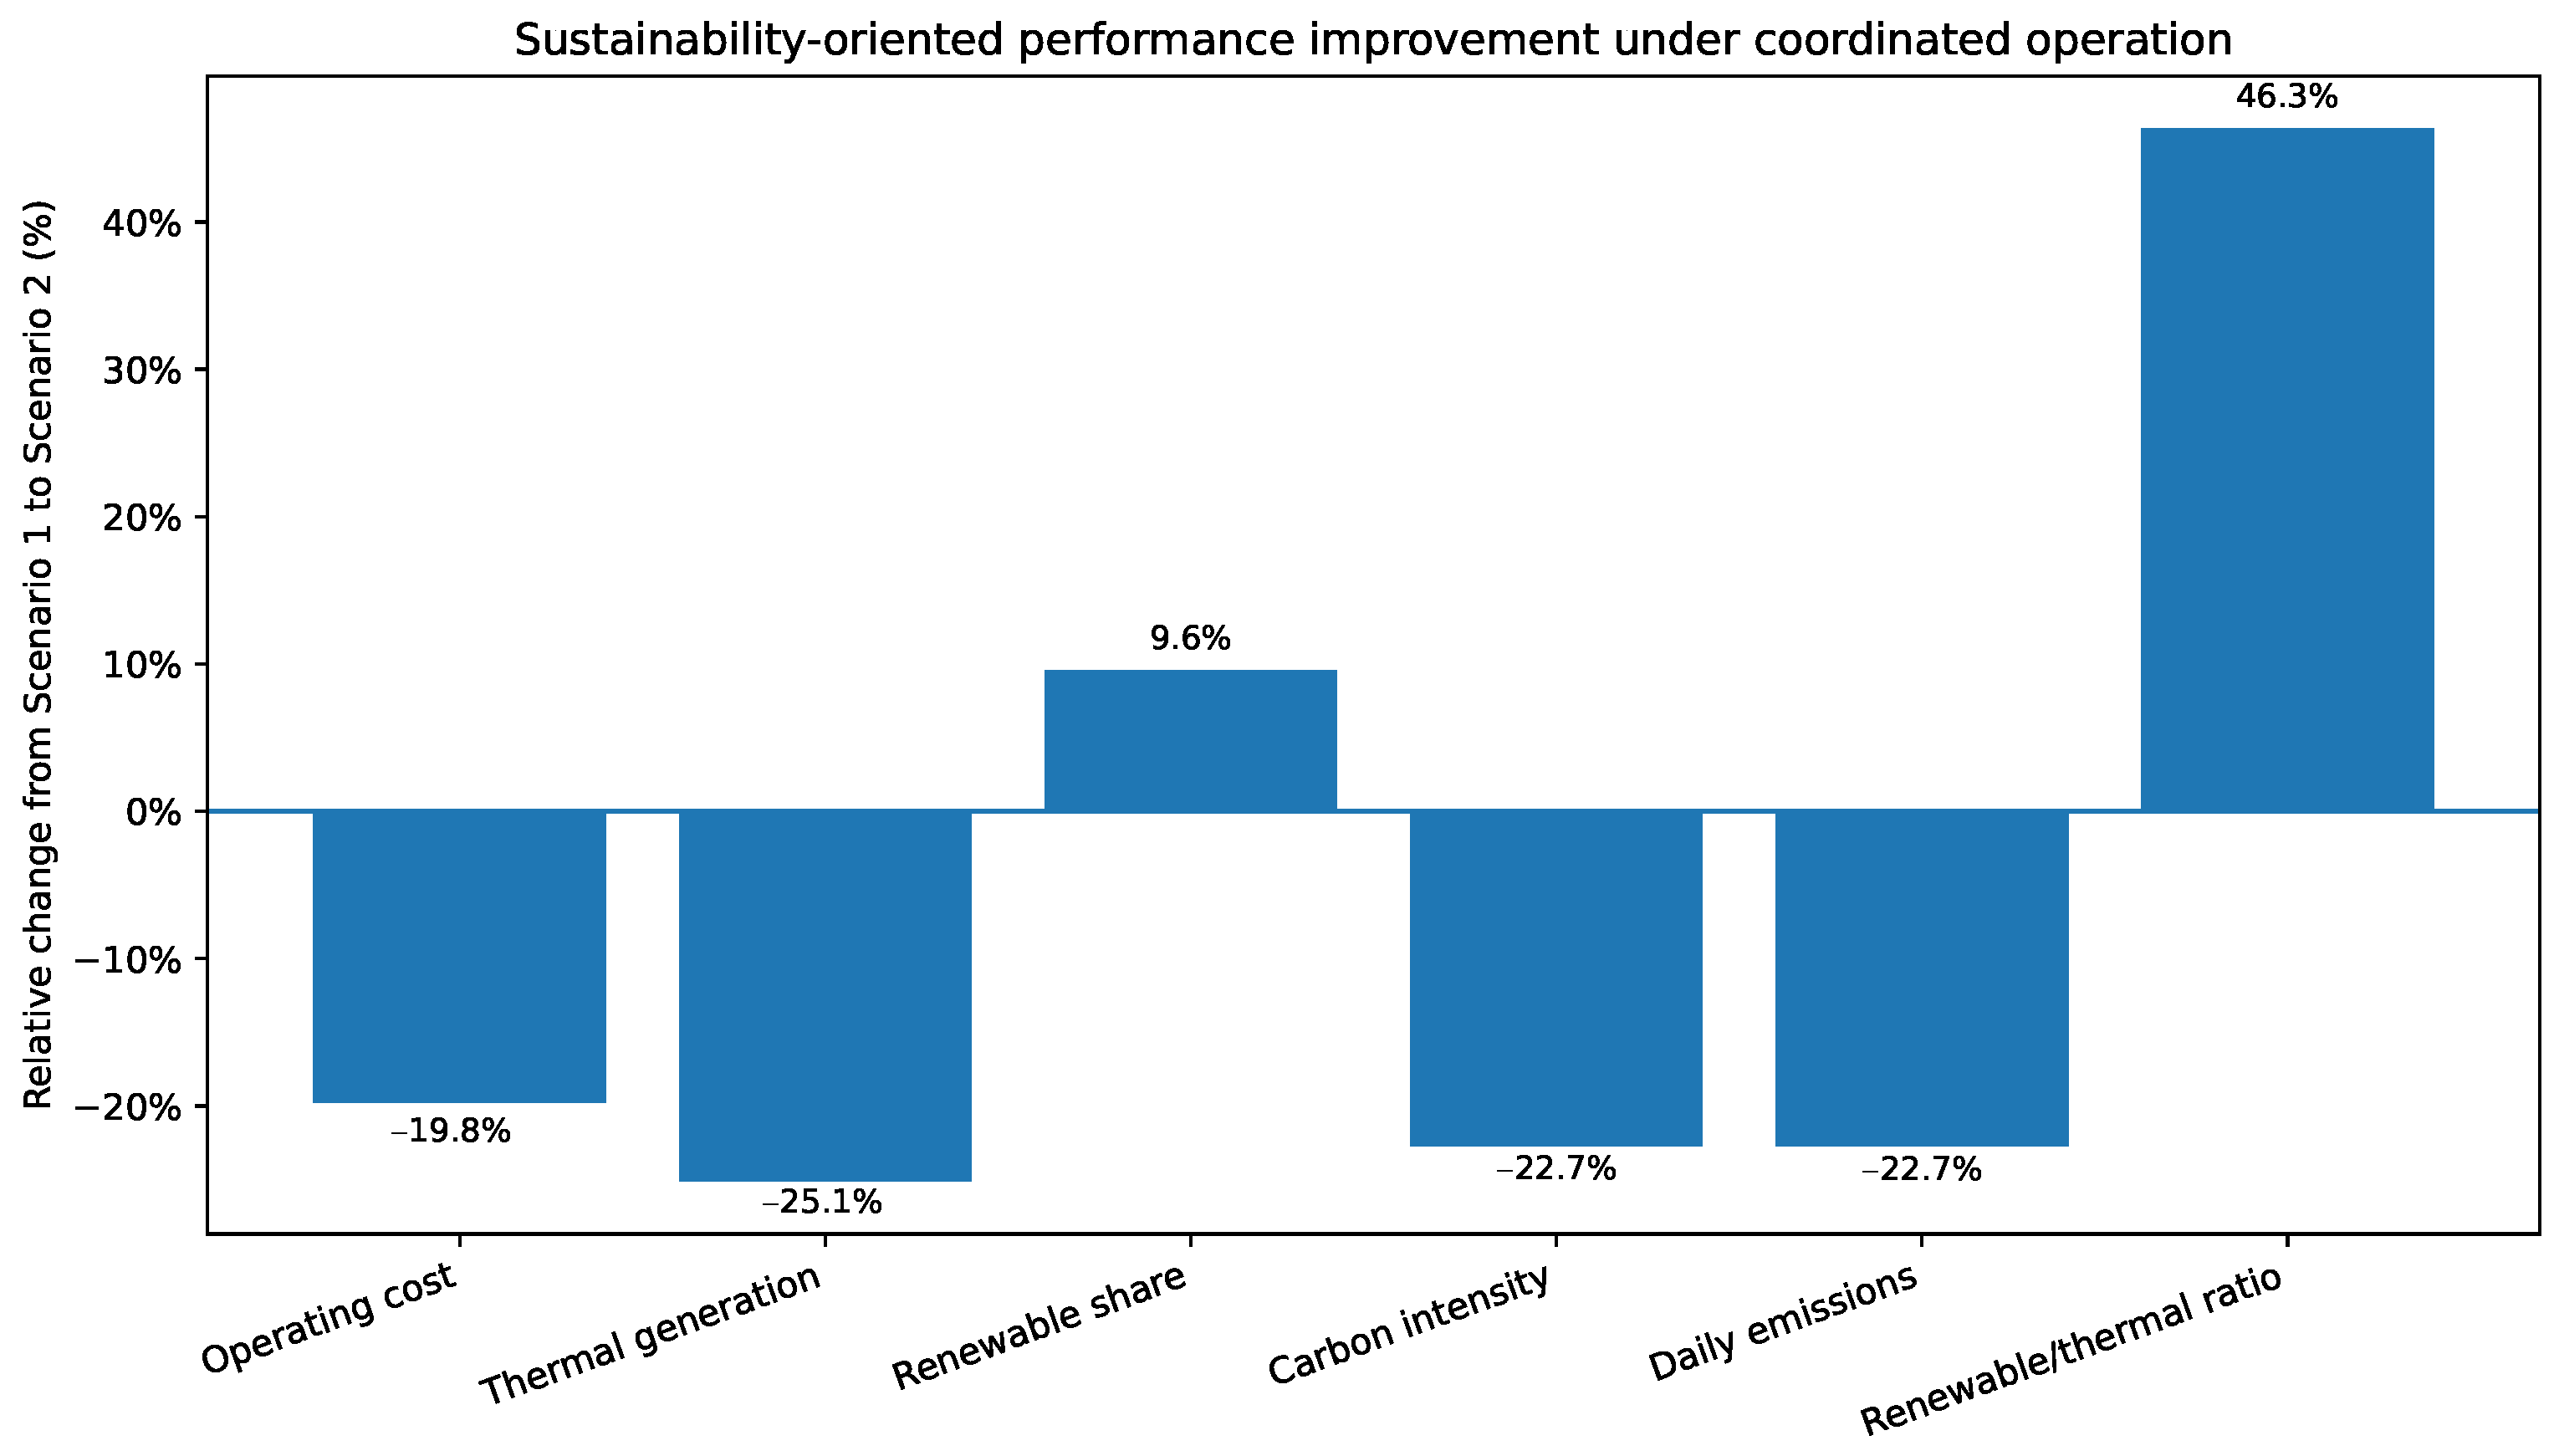
Overall, the reduction from 8.23 million USD to 6.60 million USD represents a decrease of 19.8% in total operating cost. Under the assumptions of the study, this reduction corresponds to a daily saving of 1.63 million USD. The annual value of approximately 595 million USD is obtained by linearly extrapolating this daily difference over 365 operating days. Therefore, this figure should be interpreted only as an indicative annualized projection derived from the representative 24-h benchmark analyzed in this work, rather than as a forecast of real yearly system savings under variable seasonal, operational, and market conditions. The obtained results therefore demonstrate that coordinated operation with interzonal exchange and battery energy storage support yields a substantial economic advantage over autonomous zonal operation, while simultaneously increasing the effective participation of renewable generation and reducing the dependence on higher-cost thermal dispatch.
4.4. Sustainability and Environmental Performance Assessment
In addition to the economic and energetic comparison developed above, a complementary sustainability-oriented assessment was conducted in order to quantify the environmental and operational implications of the coordinated multi-zone dispatch strategy. This additional analysis is particularly relevant for the scope of Sustainability, because the benefits of interconnection and battery-supported coordination are not limited to cost reduction; they also affect the renewable penetration level, the dependence on thermal generation, the carbon intensity of supplied electricity, and the effective use of flexibility resources.
The sustainability assessment was constructed from the dispatch results already obtained for Scenarios 1 and 2. Accordingly, the comparison preserves the same total daily supplied energy and focuses on how the coordinated strategy modifies the generation mix and the associated environmental indicators. To extend the interpretation of the original optimization results, a set of derived indicators was defined, including: total renewable generation, renewable share, thermal share, renewable-to-thermal ratio, specific operating cost, estimated daily emissions, carbon intensity, and the storage contribution relative to daily demand. For the environmental calculations, representative technology-specific emission factors were adopted in order to estimate the relative carbon implications of the two dispatch strategies. In particular, the environmental comparison uses life-cycle emission factors for hydroelectric, photovoltaic, and wind generation, together with a single aggregated constant emission factor for the thermal fleet, so that the carbon assessment remains consistent with the technology aggregation level of the dispatch model. Under this complementary approach, the sustainability indicators remain fully consistent with the energetic and economic behavior of the optimized solutions. It should be noted, however, that these comparative indicators were derived from a deterministic dispatch setting based on fixed hourly demand and renewable-resource profiles. Therefore, the reported economic and environmental improvements should be interpreted as benchmark results under forecasted operating conditions rather than as a sensitivity-based or uncertainty-aware assessment.
To provide full methodological transparency for the supplementary environmental assessment,
Table 15 reports the emission factors adopted for each generation technology considered in the dispatch comparison. These factors were used to translate the technology-specific dispatched energy into daily greenhouse-gas emissions and carbon-intensity indicators. For hydroelectric, photovoltaic, and wind generation, representative life-cycle factors were assigned in order to reflect the environmental burden associated with each technology beyond direct on-site operation. For thermal generation, a single aggregated emission factor was adopted to represent the combined environmental effect of the dispatchable thermal fleet considered in the study. Under this approach, the environmental assessment remains consistent with the technology aggregation level used in the optimization model and in the comparative energy results.
Table 15 defines the environmental conversion parameters used in the supplementary assessment. In particular, the lower factors associated with renewable and hydroelectric technologies reflect their comparatively reduced carbon footprint, whereas the higher factor assigned to thermal generation captures the greater emission burden associated with fossil-fuel-based electricity production. This distinction allows the environmental assessment to quantify how the coordinated dispatch strategy modifies not only the economic allocation of generation, but also the resulting carbon profile of the supplied electricity.
Based on the factors reported in
Table 15, the estimated daily emissions of the optimized dispatch were computed as
where
,
,
, and
denote the emission factors of thermal, hydroelectric, photovoltaic, and wind generation, respectively. Since hourly power is expressed in MW and the scheduling interval is one hour, Equation (
19) yields the total emissions in tCO
2-e/day.
The carbon intensity of the supplied electricity was then calculated as
where CI is expressed in kgCO
2-e/MWh. Under this formulation, the avoided emissions associated with Scenario 2 were obtained as the difference between the daily emissions estimated for Scenario 1 and Scenario 2.
The comparative sustainability indicators are summarized in
Table 2. This table shows that the interconnected operation with battery support improves the overall sustainability performance of the system by increasing the renewable contribution, reducing the dependence on thermal generation, lowering the specific operating cost, and decreasing the estimated carbon footprint of the supplied electricity.
The indicators reported in
Table 2 reveal that the coordinated operation strategy improves the sustainability profile of the system in several complementary dimensions. First, the renewable share increases from 71.81% to 78.68%, while the thermal share decreases from 28.19% to 21.11%. Second, the renewable-to-thermal generation ratio rises from 2.55 to 3.73, indicating a substantially cleaner supply structure under interconnected operation. Third, the BESS contribution reaches 3.85% of the total daily demand, confirming that battery storage acts as an effective flexibility resource for supporting renewable integration and temporal energy shifting.
From an environmental perspective, the estimated daily emissions decrease from 5455.3 to 4214.2 tCO2-e/day, while the carbon intensity of supplied electricity decreases from 189.4 to 146.3 kgCO2-e/MWh. These results indicate that the coordinated use of interzonal exchange and battery storage not only reduces the system operating cost but also improves its environmental performance by displacing a significant portion of higher-emission thermal generation. The underlying mechanism is again associated with the change in the marginal generation structure of the system. Because the coordinated strategy increases wind utilization, preserves hydroelectric participation, and reduces the relative contribution of thermal generation, the total supplied electricity is produced with a cleaner average technology mix. In this sense, the reduction in carbon intensity is not merely a consequence of lower total emissions, but of a structural shift in dispatch composition toward technologies with lower specific emission factors. Under the adopted assumptions, the reduction achieved by Scenario 2 is equivalent to approximately 1241.0 tCO2-e/day, or 453.0 ktCO2-e/year.
To facilitate the interpretation of these results,
Figure 19 synthesizes the relative improvement of the principal sustainability-oriented indicators when the system evolves from autonomous zonal operation to coordinated interconnected operation with storage support. The figure confirms that the most relevant gains are associated with the reduction in thermal generation, the decrease in emissions and carbon intensity, and the increase in the renewable-to-thermal ratio.
Overall, the supplementary sustainability assessment confirms that the proposed coordinated dispatch framework generates benefits that extend beyond purely economic criteria. In addition to reducing the total operating cost, the integrated use of interzonal coordination and battery energy storage increases renewable penetration, reduces dependence on thermal generation, lowers the carbon intensity of electricity supply, and improves the environmental performance of the interconnected system. These findings reinforce the relevance of the proposed methodology for sustainability-oriented operation of multi-zone power systems.
4.5. Scope and Robustness of the Present Benchmark Results
The economic, energetic, and environmental improvements reported in this section were obtained for the baseline benchmark configuration adopted in the study, under fixed hourly demand profiles, fixed renewable-resource availability profiles, fixed interzonal transfer-capacity limits, and the battery storage parameters specified for the analyzed case. Accordingly, the present results should be interpreted as benchmark outcomes associated with that reference operating configuration rather than as fully generalized performance indicators under all possible operating conditions.
From a methodological standpoint, the robustness of the reported conclusions could be further examined through structured sensitivity analyses on battery energy storage capacity, renewable-resource availability, demand magnitude, and interzonal transfer limits. Even without introducing additional simulations, the present benchmark results already suggest that these parameters play a qualitatively important role in shaping the observed coordinated-dispatch benefits. In particular, larger storage capability would be expected to enhance temporal energy shifting and renewable accommodation, whereas tighter storage limits would reduce the flexibility available to displace higher-cost thermal generation. Similarly, the admissible interzonal transfer capacities condition the extent to which lower-cost or cleaner generation can be reallocated among zones, and therefore directly influence the achievable economic and environmental gains of coordinated operation. Such complementary analyses would make it possible to determine more precisely how strongly the observed reductions in thermal generation, operating cost, emissions, and carbon intensity depend on the specific parameterization of the benchmark system. Although these additional experiments are beyond the scope of the present manuscript, they constitute a clearly defined extension of the proposed framework and would provide a more comprehensive characterization of the response of coordinated multi-zone dispatch to parameter variation.
5. Conclusions
This study developed and applied a nonlinear optimization framework for the hourly economic dispatch of interconnected multi-zone power systems integrating thermal, hydroelectric, wind, photovoltaic, and battery energy storage resources. The formulation explicitly represented zonal power balances, interzonal exchanges, thermal ramp-rate limits, battery state-of-charge dynamics, storage operating limits, and hydroelectric energy quotas, thereby enabling a technically consistent and economically meaningful comparison between autonomous zonal operation and coordinated interconnected operation with storage support.
The obtained results demonstrate that coordinated operation substantially improves system-wide performance with respect to autonomous zonal dispatch. Although the total daily supplied energy remains unchanged at 28.80 GWh in both scenarios, the interconnected strategy modifies the internal composition of the dispatch in a favorable manner: wind generation increases from 14.46 GWh to 16.44 GWh, while thermal generation decreases from 8.12 GWh to 6.08 GWh. This result confirms that interconnection and storage provide the flexibility required to exploit renewable resources more effectively and to reduce the dependence on higher-cost thermal generation without compromising hourly demand adequacy.
From the spatial perspective, the results show that interzonal coordination enables a more efficient geographical allocation of generation. Under interconnected operation, Zone 3 becomes the main exporting area, delivering 2.60 GWh to the rest of the system, while Zone 1 becomes the principal importing zone, receiving 1.87 GWh. This redistribution is fully consistent with the reduction of thermal dispatch in Zones 1 and 2 and with the increased utilization of the most economically competitive resources available in the interconnected network. Therefore, the principal technical value of the proposed framework lies in its ability to transform zonal diversity in generation portfolios into an operational advantage through coordinated energy exchange within transmission-capacity limits.
The participation of battery energy storage systems also proved to be technically relevant. The optimized schedules show that the storage units installed in Zones 2 and 3 operate within their admissible state-of-charge bounds during the full 24-h horizon, while charging and discharging in economically strategic periods. At the aggregate level, the BESS absorb 1.06 GWh and subsequently deliver 1.11 GWh, confirming that their contribution is not merely energetic but fundamentally operational, since they provide temporal flexibility, facilitate renewable integration, and reinforce the coordinated use of interzonal transfers. Thus, the study verifies that battery storage enhances the economic dispatch problem not only by shifting energy in time but also by improving the overall adaptability of the interconnected system.
From the economic standpoint, the interconnected strategy with storage support reduces the total operating cost from 8.23 to 6.60 million USD, which corresponds to a reduction of 19.8%. This improvement is mainly explained by the decrease in total thermal operating cost, from 7.27 to 5.52 million USD, which outweighs the localized increases in wind and thermal dispatch observed in the exporting zone. Consequently, the results confirm that the proposed model identifies a dispatch structure in which lower-cost generation and storage-supported flexibility displace a significant portion of the more expensive autonomous thermal supply. Based on the representative day analyzed in this study, the corresponding daily saving is 1.63 million USD, which yields an indicative annualized projection of approximately 595 million USD when extrapolated linearly over 365 days. This value should be interpreted with caution, since it does not account for seasonal demand variability, renewable-resource fluctuations, operational contingencies, or market-related changes over an actual yearly horizon.
The supplementary sustainability assessment further strengthens the relevance of the proposed methodology. In addition to the economic gains, coordinated operation increases the renewable share of supplied energy from 71.81% to 78.68%, reduces the thermal share from 28.19% to 21.11%, and raises the renewable-to-thermal generation ratio from 2.55 to 3.73. Under the adopted environmental assumptions, these changes are associated with a reduction in estimated carbon intensity from 189.4 to 146.3 kgCO2-e/MWh and with avoided emissions of approximately 1241.0 tCO2-e/day, equivalent to about 453.0 ktCO2-e/year. Therefore, the proposed framework is not only cost-effective but also consistent with sustainability-oriented operation, since it improves renewable utilization and reduces the environmental burden associated with thermal generation.
Overall, the results validate the technical, economic, and environmental value of coordinated hourly dispatch in interconnected multi-zone systems with battery energy storage. The proposed nonlinear programming framework provides a rigorous basis for determining generation schedules, interzonal exchanges, and storage trajectories in a unified manner, while preserving the physical feasibility of the system. At the same time, the computational analysis presented in this study should be understood within the scale of the three-zone benchmark system adopted for validation. Although the formulation is general in structure, its application to larger practical networks with a greater number of zones, generation assets, storage devices, and transmission corridors would increase the dimensionality of the optimization problem and would likely require more advanced computational strategies to maintain numerical tractability.
Future research may extend the present formulation by incorporating transmission losses explicitly, storage degradation costs, uncertainty in renewable generation and demand through stochastic or robust optimization approaches, and additional sustainability indicators related to emissions, resilience, and long-term planning. In addition, structured sensitivity analyses on demand levels, renewable availability, storage size, and transfer-capacity assumptions should be developed in order to quantify how strongly the reductions in operating cost, thermal-generation displacement, renewable utilization, estimated emissions, and carbon intensity depend on the benchmark parameterization adopted in this study. Future work should also include systematic benchmarking against alternative optimization methods such as metaheuristic, evolutionary, and decomposition-based approaches, as well as cross-solver numerical comparisons and validation on additional published test systems or real operational datasets. In this way, the internal benchmark validation developed in the present study could be complemented with stronger external validation, broader computational assessment, and a more comprehensive robustness evaluation under diverse operating conditions. In addition, future validation through hardware-in-the-loop testing and, when feasible, pilot-scale field implementation in actual power distribution networks would provide a valuable bridge between the benchmark formulation developed in this work and its practical engineering application. These extensions would further strengthen the applicability of the proposed framework to real large-scale interconnected systems operating under high renewable penetration.