Article

A Supply Chain Framework for Corn Products in Sumenep to Support Sustainable Ethanol Production
by
Sabarudin Akhmad
1,*,
Muhammad Azmi Alamsyah
2,
Rifky Maulana Yusron
3 and
Anis Arendra
3
1
Department of Industrial Engineering, Universitas Trunojoyo Madura, Bangkalan 69162, Indonesia
2
Department of Industrial Management, National Taiwan University of Science and Technology, Taipei 106, Taiwan
3
Department of Mechanical Engineering, Universitas Trunojoyo Madura, Bangkalan 69162, Indonesia
*
Author to whom correspondence should be addressed.
Sustainability 2026, 18(9), 4534; https://doi.org/10.3390/su18094534
Submission received: 26 February 2026 / Revised: 14 April 2026 / Accepted: 22 April 2026 / Published: 5 May 2026
(This article belongs to the Topic Advanced Bioenergy and Biofuel Technologies)

Abstract

Indonesia’s E10 blending mandate presents a strategic opportunity for decarbonization and inclusive rural development, contingent on a robust supply chain integrating smallholder farmers. This study developed a novel supply chain framework for corn products in Sumenep to facilitate sustainable ethanol production. Methods involved comprehensive data collection, mathematical modeling using the p-median method, and farmer clustering techniques. Findings reveal that Sumenep Regency’s substantial corn harvest of 8,475,914.5 tons, yielding 1,271,387.175 tons of kernels, can produce 381,416.1525 L of bioethanol. By applying a clustering supply chain model, the farmers’ group profit is IDR 205,693,725,826, while it is IDR 177,394,823,353 for the non-clustering model, meaning that the clustering supply chain model increases profit by 16% compared to the model without clustering. This localized production, enabled by a simplified, decentralized supply chain architecture, significantly enhances national energy security, reduces greenhouse gas emissions, and improves the economic stability of smallholder farmers through equitable value capture and minimized logistical costs. The framework offers a practical, implementable strategy for Indonesia’s energy transition, fostering environmental sustainability and inclusive socio-economic development.

1. Introduction

The transition toward low-carbon energy systems has intensified global interest in bioethanol as a renewable alternative to fossil fuels, particularly in the transportation sector [1]. Corn-based ethanol, supported by established agricultural systems and conversion technologies, offers significant potential to reduce greenhouse gas emissions while contributing to circular economy practices through the utilization of agricultural products [2]. Despite its environmental and technological feasibility, the sustainability of bioethanol production is not determined solely by feedstock availability or conversion efficiency, but critically depends on the design and performance of the supply chain [3]. Inefficiencies in feedstock collection, transportation, storage, and distribution can lead to increased costs, higher emissions, and reduced economic viability. As highlighted in prior studies, optimizing supply chain networks is essential to minimize logistical costs and carbon footprints while ensuring stable biomass supply for biofuel production [4]. Therefore, supply chain design emerges as the central issue in realizing the full sustainability potential of corn-based ethanol systems. Within this context, the role of smallholder farmers becomes particularly important, especially in developing countries such as Indonesia, where agricultural production is highly fragmented. Smallholders are often characterized by limited access to markets, infrastructure, and financial resources, which constrains their participation in emerging bioenergy value chains. Without deliberate integration into supply chain systems, these farmers risk being excluded from the economic benefits associated with bioethanol development [5]. Moreover, fragmented production structures increase transaction costs and complicate feedstock aggregation, further undermining supply chain efficiency. Previous research has shown that inclusive supply chain configurations such as farmer clustering, cooperative systems, and decentralized aggregation centers can improve coordination, reduce logistical inefficiencies, and enhance value capture at the farm level [6]. Consequently, integrating smallholders into supply chain design is not only a social imperative but also a technical requirement for ensuring reliable and cost-effective biomass supply. These challenges are particularly evident in Indonesia’s current energy transition strategy, which includes plans to expand ethanol blending in gasoline (E10) as part of its decarbonization and energy security agenda. While the country possesses significant potential feedstock resources, including corn, cassava, and sugarcane, the existing supply chain infrastructure remains underdeveloped and regionally fragmented [7,8]. This problem between resource potential and logistical capability highlights the need for localized, context-specific supply chain solutions. Sumenep Regency, located in Madura, represents a highly relevant case study in this regard. The region is characterized by a substantial corn production base alongside widespread rural poverty and limited market integration among smallholder farmers [9]. Many households face economic vulnerability due to low product prices, weak supply chain linkages, and restricted access to inputs and finance [10]. At the same time, the availability of agricultural feedstock presents an opportunity to connect local production systems with the emerging bioethanol market. Developing a simplified and decentralized supply chain model tailored to Sumenep is essential to facilitate a link between smallholder production and industrial bioethanol demand [11].
The strategic opportunity for decarbonisation and the potential pathway to inclusive rural development represented by Indonesia’s plan to increase ethanol blending into gasoline are predicated on supply chain design explicitly addressing smallholder readiness. Recent government and industry signals suggest that a national ethanol blending mandate of E10 is gaining momentum. This is driven by a combination of factors, including the need to enhance energy security and meet emissions targets, as well as the potential to substitute imported fuel with domestically produced bioethanol [12]. However, the current production and logistics capacity in Indonesia is both limited and regionally fragmented. A number of studies and policy reviews have highlighted the fact that, despite the existence of substantial theoretical feedstock options, such as cassava, sugarcane, corn, and waste alcohol streams [13]. Within the context of the national picture, the social dimension is of critical importance. In Madura’s Sumenep district, many rural households engaged in salt production, as well as smallholders and marginal farmers, encounter economic precariousness and constrained access to value-chain benefits. The pervasiveness of poverty is attributable to depressed product prices, inadequate market linkages, and constrained access to inputs and finance [10]. The judicious configuration of ethanol supply chains has the potential to generate novel off-take markets for feedstocks cultivated by smallholders (e.g., corn or cassava). However, this endeavor necessitates the implementation of deliberate measures to avert deleterious impacts between food and fuel competition and to guarantee that value capture is realized at the farm level [14]. A simplified, decentralized supply chain architecture is a promising route to facilitate the connection of farmers from Sumenep who are experiencing economic disadvantage to the emerging ethanol market. This approach has the potential to minimize logistical costs and ensure that benefits are not lost [15]. From a sustainability perspective, policy and industry interventions must couple the physical redesign of the chain with safeguards such as sustainable feedstock criteria, land-use planning to avoid indirect land use change, and technical assistance to raise yields without expanding cultivated area. The findings of research and modeling work on biofuel supply chains highlight the necessity of optimization across site selection, transport modes, and processing scale in order to achieve favorable outcomes with regard to greenhouse gases and the economy [16]. Environmentally, the conversion of corn kernels to bioethanol contributes tangibly to sustainability objectives. Bioethanol, particularly when derived from agricultural biomass, offers a renewable alternative to fossil fuels, thereby reducing greenhouse gas (GHG) emissions and mitigating the carbon footprint associated with conventional fuel consumption [17,18].
Despite the proliferation of research endeavors concerning bioethanol production and renewable fuel policies, a plethora of significant research opportunities remain. Firstly, the majority of studies on bioethanol supply chains have focused on large-scale industrial systems or national policy perspectives. However, there has been limited attention paid to feedstock supply chain structures at the smallholder level, particularly in developing countries. The Republic of Indonesia has explored the implementation of ethanol blending policies as part of its renewable energy transition; however, empirical studies examining regional feedstock logistics and farmer participation in ethanol supply chains are still scarce. Previous research rarely integrates facility location optimization with farmer clustering approaches to design efficient biomass aggregation systems that can simultaneously improve logistical efficiency and farmer income. Agricultural production in Sumenep Regency is dominated by smallholder farmers with fragmented supply structures, which poses a significant challenge to the efficient collection of feedstock for bioethanol development. In the absence of a meticulously designed supply chain, the capacity of corn-based ethanol to facilitate both the attainment of renewable energy objectives and the advancement of rural economic development may not be fully actualized. The objective of this study is to develop a model for optimizing the supply chain for corn. This will be achieved by employing a p-median clustering approach, with the aim of improving the efficiency of aggregation of feedstock and supporting sustainable ethanol production. The integration of supply chain optimization with rural agricultural systems is a novel contribution to the existing literature on sustainable bioenergy systems and inclusive rural development. The conceptual framework of this study is based on the interaction between agricultural production systems, supply chain logistics, and renewable energy development. Corn production from farmer groups represents the primary feedstock source for bioethanol production. However, fragmented production and inefficient logistics often lead to high transportation costs and supply instability. To address this issue, the study proposes a cluster-based supply chain structure, where farmer groups are aggregated into clusters and connected to optimal collection points using the p-median optimization model. This approach minimizes transportation distance while improving coordination between supply chain actors. The optimized network then supports ethanol production facilities, which convert corn feedstock into bioethanol for blended fuel applications. Through this framework, the research evaluates how optimized logistics networks can improve supply chain efficiency, increase farmer profitability, and support renewable energy targets simultaneously.
Nevertheless, such approaches may fail to consider critical socio-economic factors, including income distribution, market accessibility, and the inclusion of marginalized rural producers. Within the context of Sumenep Regency, where agricultural production is characterized by fragmented smallholder systems and limited access to formal markets, supply chain design plays a dual role: as a logistical mechanism, but also as a tool for rural economic empowerment. The proposed clustering-based supply chain model contributes to this integration by improving the spatial organization of farmer groups, thereby reducing transportation barriers and enhancing their access to centralized aggregation points. The establishment of connections between smallholders and the participation of these actors in structured value chains has the potential to enhance their bargaining power and income stability. Moreover, by reducing logistical inefficiencies, the model helps ensure that a greater share of value creation is retained at the farm level, addressing common issues of value leakage in traditional agricultural supply chains. These outcomes are consistent with broader findings in sustainable supply chain management, which emphasize that efficiency improvements should be aligned with equitable value distribution and inclusive development goals. It is important to acknowledge that the current model integrates socio-economic aspects implicitly through economic performance indicators, such as increased farmer profit and improved market access, rather than explicitly incorporating social variables into the optimization function.

2. Materials and Methods

The primary data utilized in this study is derived from direct interviews with the relevant parties. This includes data on crop prices, the location of farmer groups, warehouse capacity, and demand. The secondary data utilized in this study is sourced from various institutions or other reliable sources of information, which elucidate the necessary data for ascertaining the supply chain of corn product in Sumenep recency Madura island. This includes data from the Sumenep District Food Crops, Horticulture, and Plantation Service on the location/address of each farmer group, supplier, branch, and representative warehouse. The data was then utilized to ascertain the points of the corn supply chain by employing Google Maps version 25.44 (Google, Mountain View, CA, USA). The data types in this study are qualitative and quantitative. In this study, there are two types of qualitative data used as measurement scales, namely nominal data and ordinal data. Service satisfaction data uses a nominal scale, while corn quality grades use an ordinal scale. In addition, there are two types of quantitative data used as measurement scales, namely interval data for distance, using an interval scale, and ratio data for the amount of fertilizer and the amount of corn, using a ratio scale. This study employs a p-median model, a classical optimization approach in facility location problems, to determine optimal aggregation points in the corn supply chain. It is important to clarify that, although the term “clustering” is used in a practical sense to describe the grouping of farmers, the underlying method is not a statistical clustering technique but a location-allocation optimization model. The p-median model minimizes the total distance between supply points from farmers and selected facility locations, thereby improving logistical efficiency in feedstock collection.
In this research, the term sustainable supply chain refers to the efficient coordination of biomass flows from production points to processing or aggregation centers while minimizing economic and environmental costs. In Sumenep, the dispersed nature of farmer groups and reliance on small-scale transportation create logistical inefficiencies, reflected in long travel distances and high fuel consumption. Therefore, reducing transportation distance becomes a critical proxy for improving both cost efficiency and environmental performance. The dataset used in this study includes inter-location distances between farmer groups and potential aggregation points, which form the basis for evaluating supply chain performance before and after optimization. The term clustering, in this study, is therefore used in an operational sense, referring to the grouping of farmer groups based on optimized allocation results rather than similarity measures. Each cluster represents a service area of an aggregation center, where farmer groups deliver their corn harvest. This distinction is important as it clarifies that the clusters are derived from an optimization framework rather than conventional data clustering algorithms such as k-means. In addition, smallholder integration is a key consideration in the design of the supply chain. The 385 farmer groups in Sumenep represent small-scale producers who typically face constraints related to transportation access, market connectivity, and cost efficiency. Without an optimized aggregation system, these constraints can lead to higher logistics costs and reduced participation in emerging bioethanol value chains. By minimizing travel distance and improving accessibility to aggregation centers, the model directly supports the inclusion of smallholders in a more efficient and economically viable supply chain.

2.1. Model Formulation

To enhance clarity, the model is presented using a structured formulation consisting of indices, parameters, decision variables, an objective function, and constraints.
  • Indices:
  • i ∈ I: Set of supply points (corn farmers).
  • j ∈ J: Set of candidate facility locations (collection centers).
  • Parameters:
  • dij: Distance between supply point i and facility location j (km).
  • p: Number of facilities to be selected.
  • Decision Variables:
  • xij = 1 if supply point i is assigned to facility j; 0 otherwise.
  • yj = 1 if facility j is selected; 0 otherwise.
  • Assignment constraint function:
i = 1 n x i j = 1 i
x i j y j i , j
  • Facility selection constraint:
i = 1 n y j = p
  • Binary constraint:
x i j = 0 , 1 i , j
y j = 0 , 1 j
Binary constraint uses an index with notation i as the farmer group and j as the candidate center point of the farmer group. Once the points of each cluster and cluster members are known, the next step is to determine the objective function and constraint function. This equation is then used as the basis for creating a MATLAB R2019b 9.7 version (MathWorks, Natick, MA, USA) program to solve the issue of farmer group clustering, similarly to the work of [19,20]. The next step is to verify the model that has been created by declaring each unit in the model and checking that the final output results are as desired. The following is the mathematical model.
Objective function of breeders and farmer groups:
i k T D S i k . b p i k . d i k K a p i + b t p i k
Objective function fertilizer shops and farmer groups:
i k T D S j k . b p j k . d i k K a p i + b t p i k + i i T D S i k . b p i k . d i k
Objective functions of farmer groups and agricultural product collectors:
i k T D S k c . b p k c . d k c K a p c + b t p k c + i i T D S i k . b p i k . d i k

2.2. Model Interpretation in Supply Chain Context

The model minimizes the total logistical effort by assigning each farmer to the nearest selected aggregation center, weighted by production volume. This approach reflects real-world supply chain behavior, where transportation cost is influenced by both distance and the quantity transported. By optimizing facility locations, the model improves feedstock consolidation efficiency, reduces transportation burden, and enhances accessibility for smallholder farmers. Although the model focuses on logistical optimization, its outcomes also contribute indirectly to socio-economic improvements, such as reduced transportation costs for farmers and improved market access. However, infrastructure limitations (e.g., road conditions, storage capacity) and operational constraints are not explicitly modeled and are discussed as limitations of this study. The glossary equation and symbol used in this research shown on Table 1.

3. Result and Discussion

3.1. Observed Farmer Group Profile

The data collated in this study comprised information on farmer groups that cultivated corn in March 2025, data on subsidized corn seed breeders from the Sumenep District Food Crops, Horticulture, and Plantation Service, and fertilizer stores that received subsidized fertilizer. The data presented herein were collected through in-depth interviews with the heads of each farmer group. The subsequent section will present the results of the farmer group data and managed land in Supplementary Materials Table S1 Farmer group location and managed agricultural land.
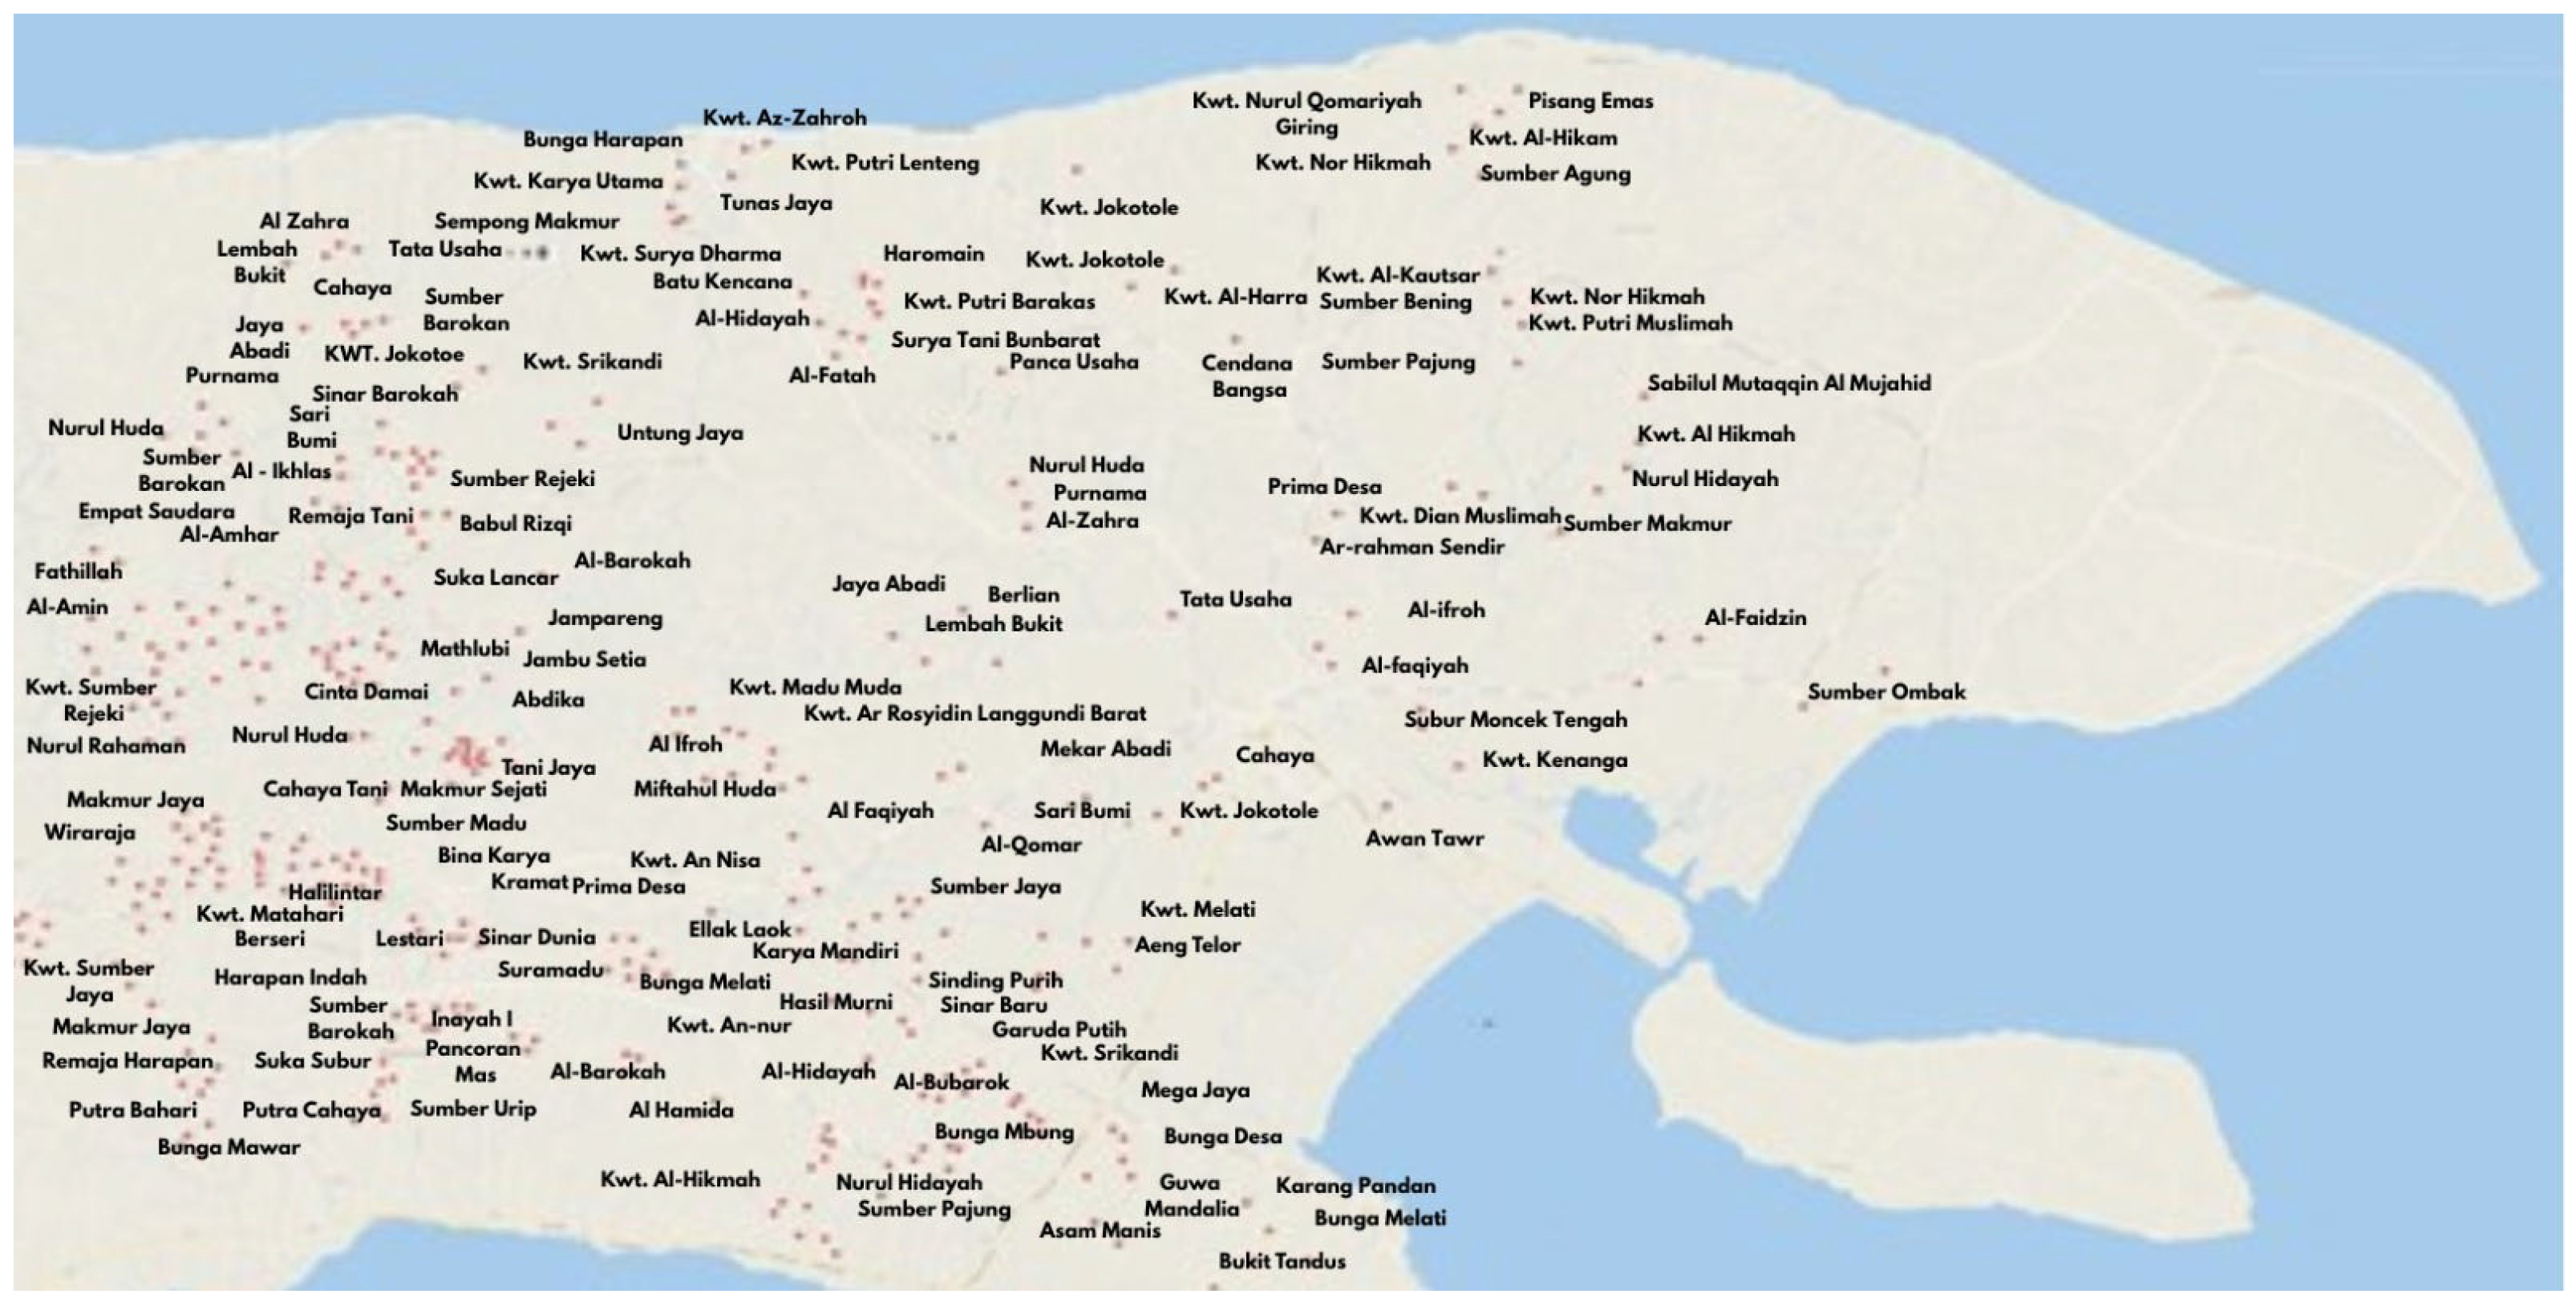
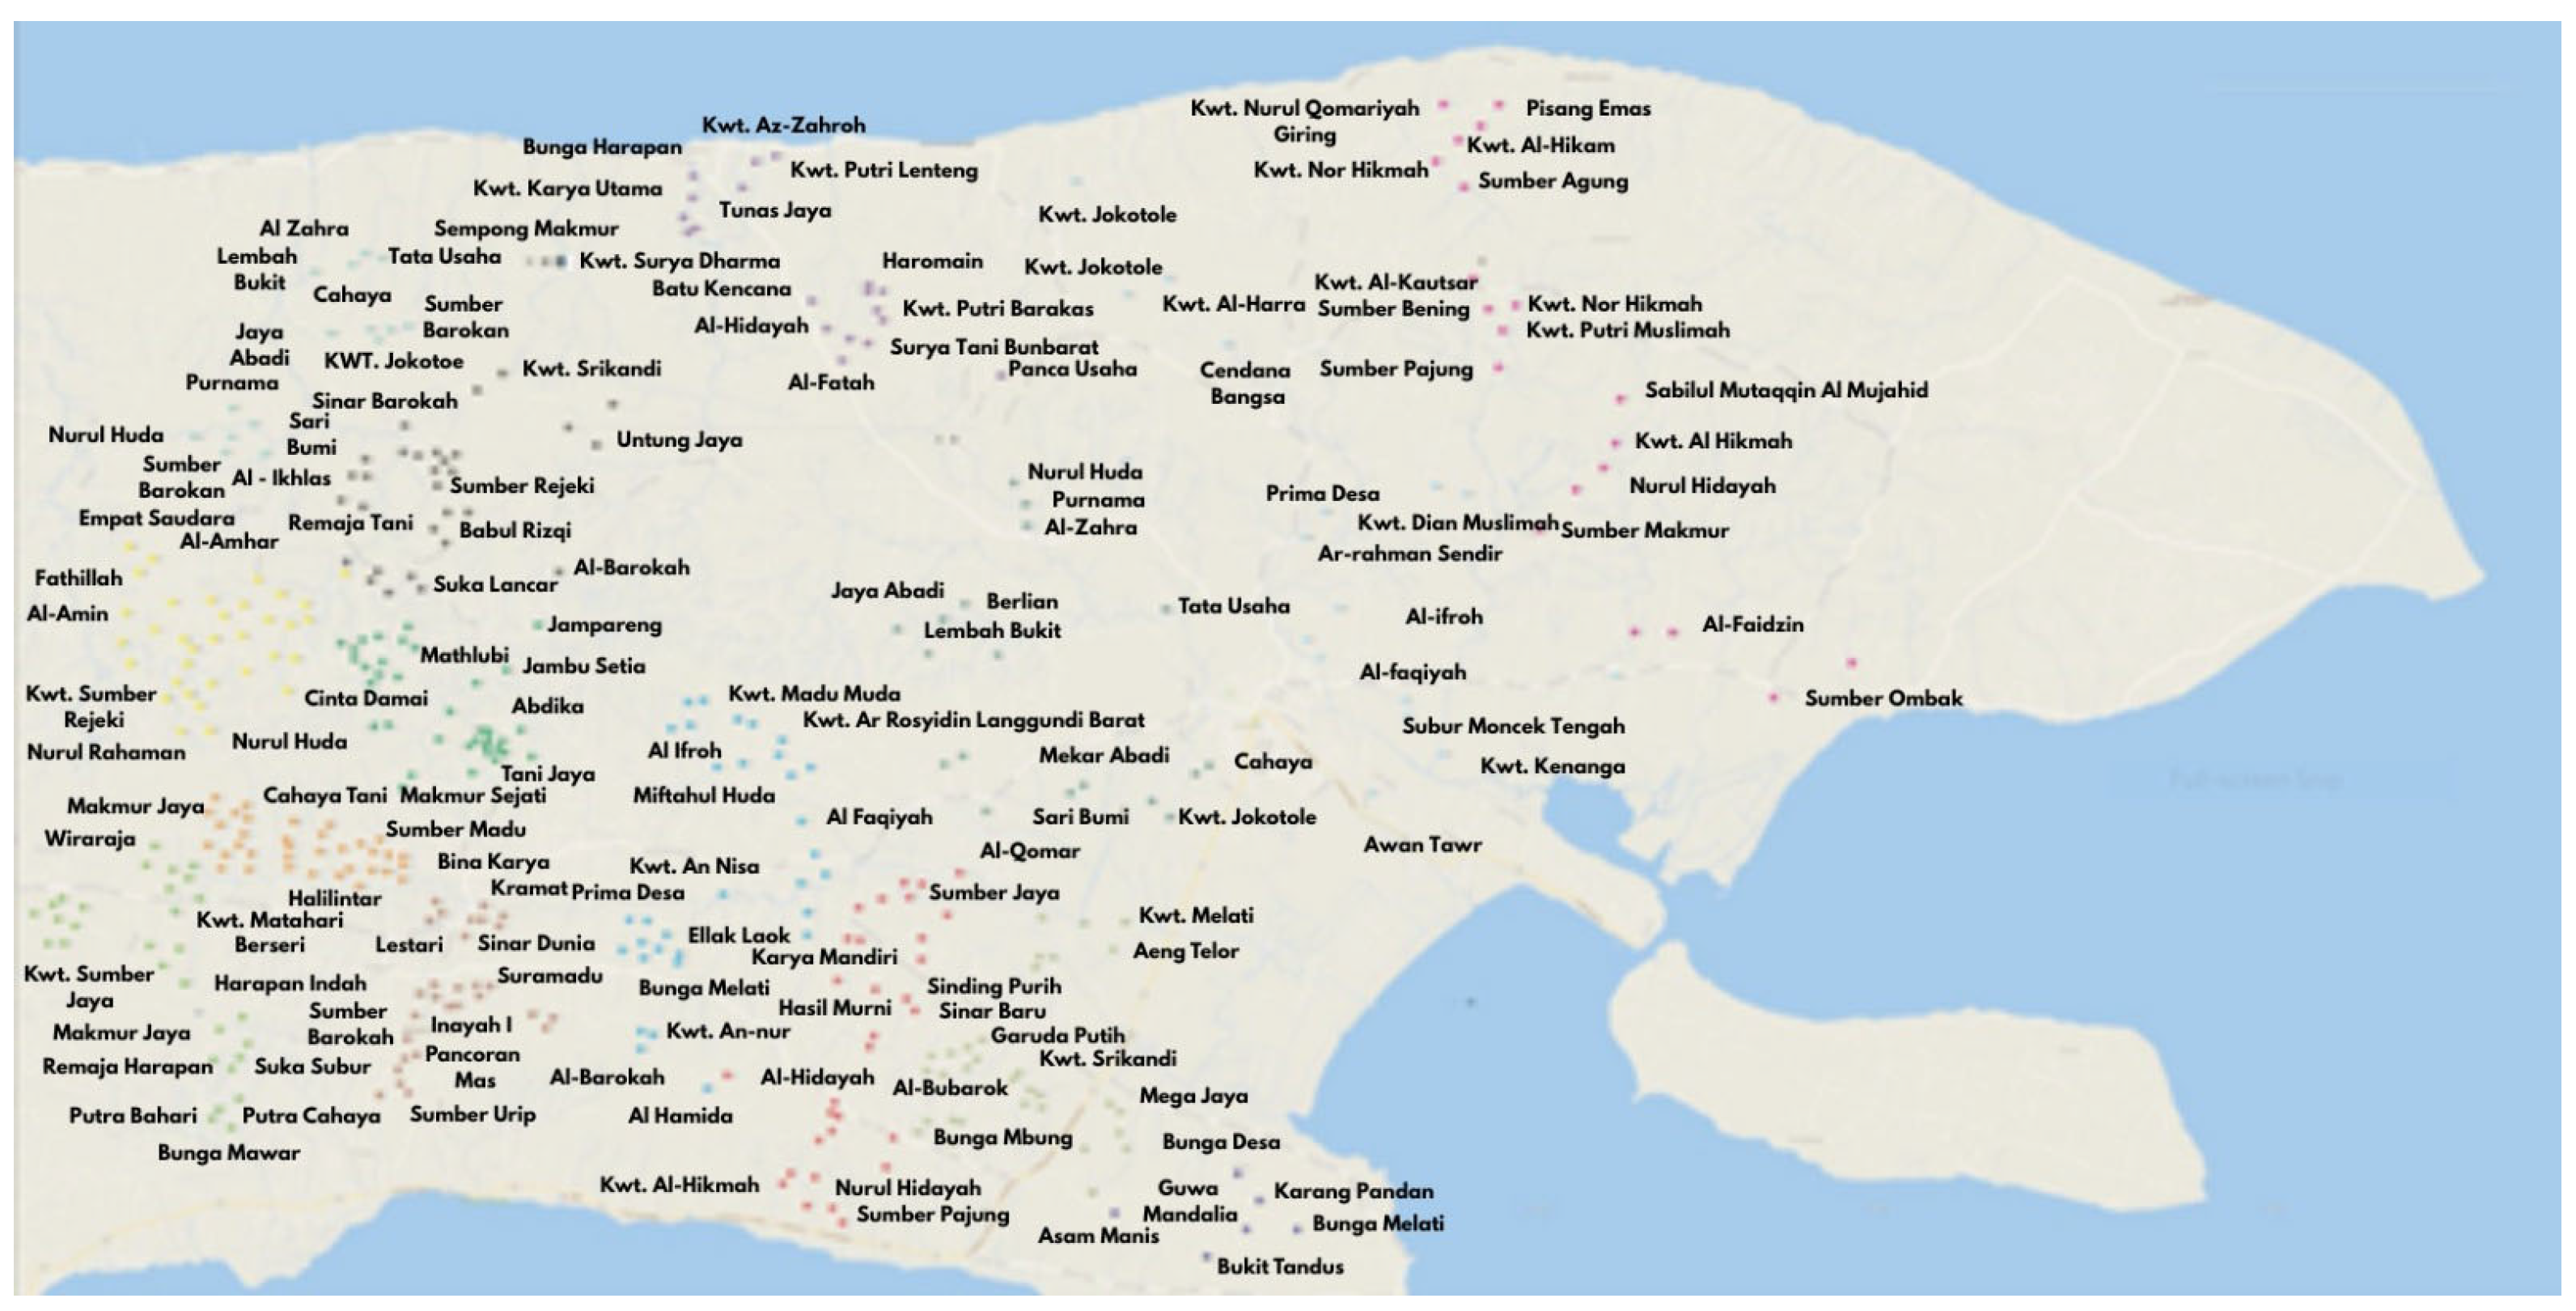
As illustrated in Supplementary Materials Table S1, the number of farmer groups intending to plant corn in 2024 is 385, which totals 9799 farmers. The cultivation areas are divided into three distinct categories: yards, fields, and farmland. Yards are privately owned land attached to houses. Fields are defined as dry land, the irrigation of which is dependent on precipitation. Farmland is comparable to fields in this regard; however, it is distinguished by the presence of a regular irrigation system. It is customary to plant rice during the rainy season, while corn and tobacco are planted during the dry season. The total area of cultivated land is 1630 hectares for yards, 7409 hectares for fields, and 1790 hectares for farmland. The agricultural land profiles of three distinct farmer groups, Lembah Bukit, Rahdatul Ihsan, and Al-Rohim, reveal varied land utilization patterns. Lembah Bukit, situated in Campaka subvillage, Panaongan village, possesses a total agricultural land area of 288.17 Ha. This land predominantly comprises 284.8 Ha of field land and 3.37 Ha of yard land, notably lacking any dedicated farmland. In contrast, RAHDATUL IHSAN, located in Platokan subvillage, Prancak village, manages a total of 284.76 Ha, with a more diversified allocation, including 8.85 Ha of farmland, 20.61 Ha of field land, and a substantial 255.3 Ha of yard land, supported by 75 members. Similarly, Al-Rohim, located similarly to Rahfatul Ihsan, is managed by 81 members and oversees 282.15 Ha of total land, distributed as 8.35 Ha of farmland, 17.65 Ha of field land, and 256.15 Ha designated as yard land. These variations in land type distribution and total area underscore the diverse agricultural contexts within which these groups operate, potentially influencing their farming practices and resource requirements. Such heterogeneity in land characteristics among farmer groups is a common feature in agricultural landscapes, often reflecting local ecological conditions, historical land use, and socio-economic factors influencing land management decisions [21]. The following map, Figure 1, illustrates the distribution of farmer groups engaged in the cultivation of corn in Sumenep Regency.

3.2. Observed Seed Breeder Profile in Sumenep

This study uses primary data obtained from direct interviews with the relevant parties. This includes information on crop prices, the location of farming groups, warehouse capacity, and demand. The secondary data used in this study were obtained from institutions or other sources of information needed to determine the corn supply chain, such as data from the Sumenep District Food Crops, Horticulture, and Plantation Service on the location and address of each farmer group, supplier, branch, and representative warehouse. This data was used to plot the locations of the corn supply chain on Google Maps.
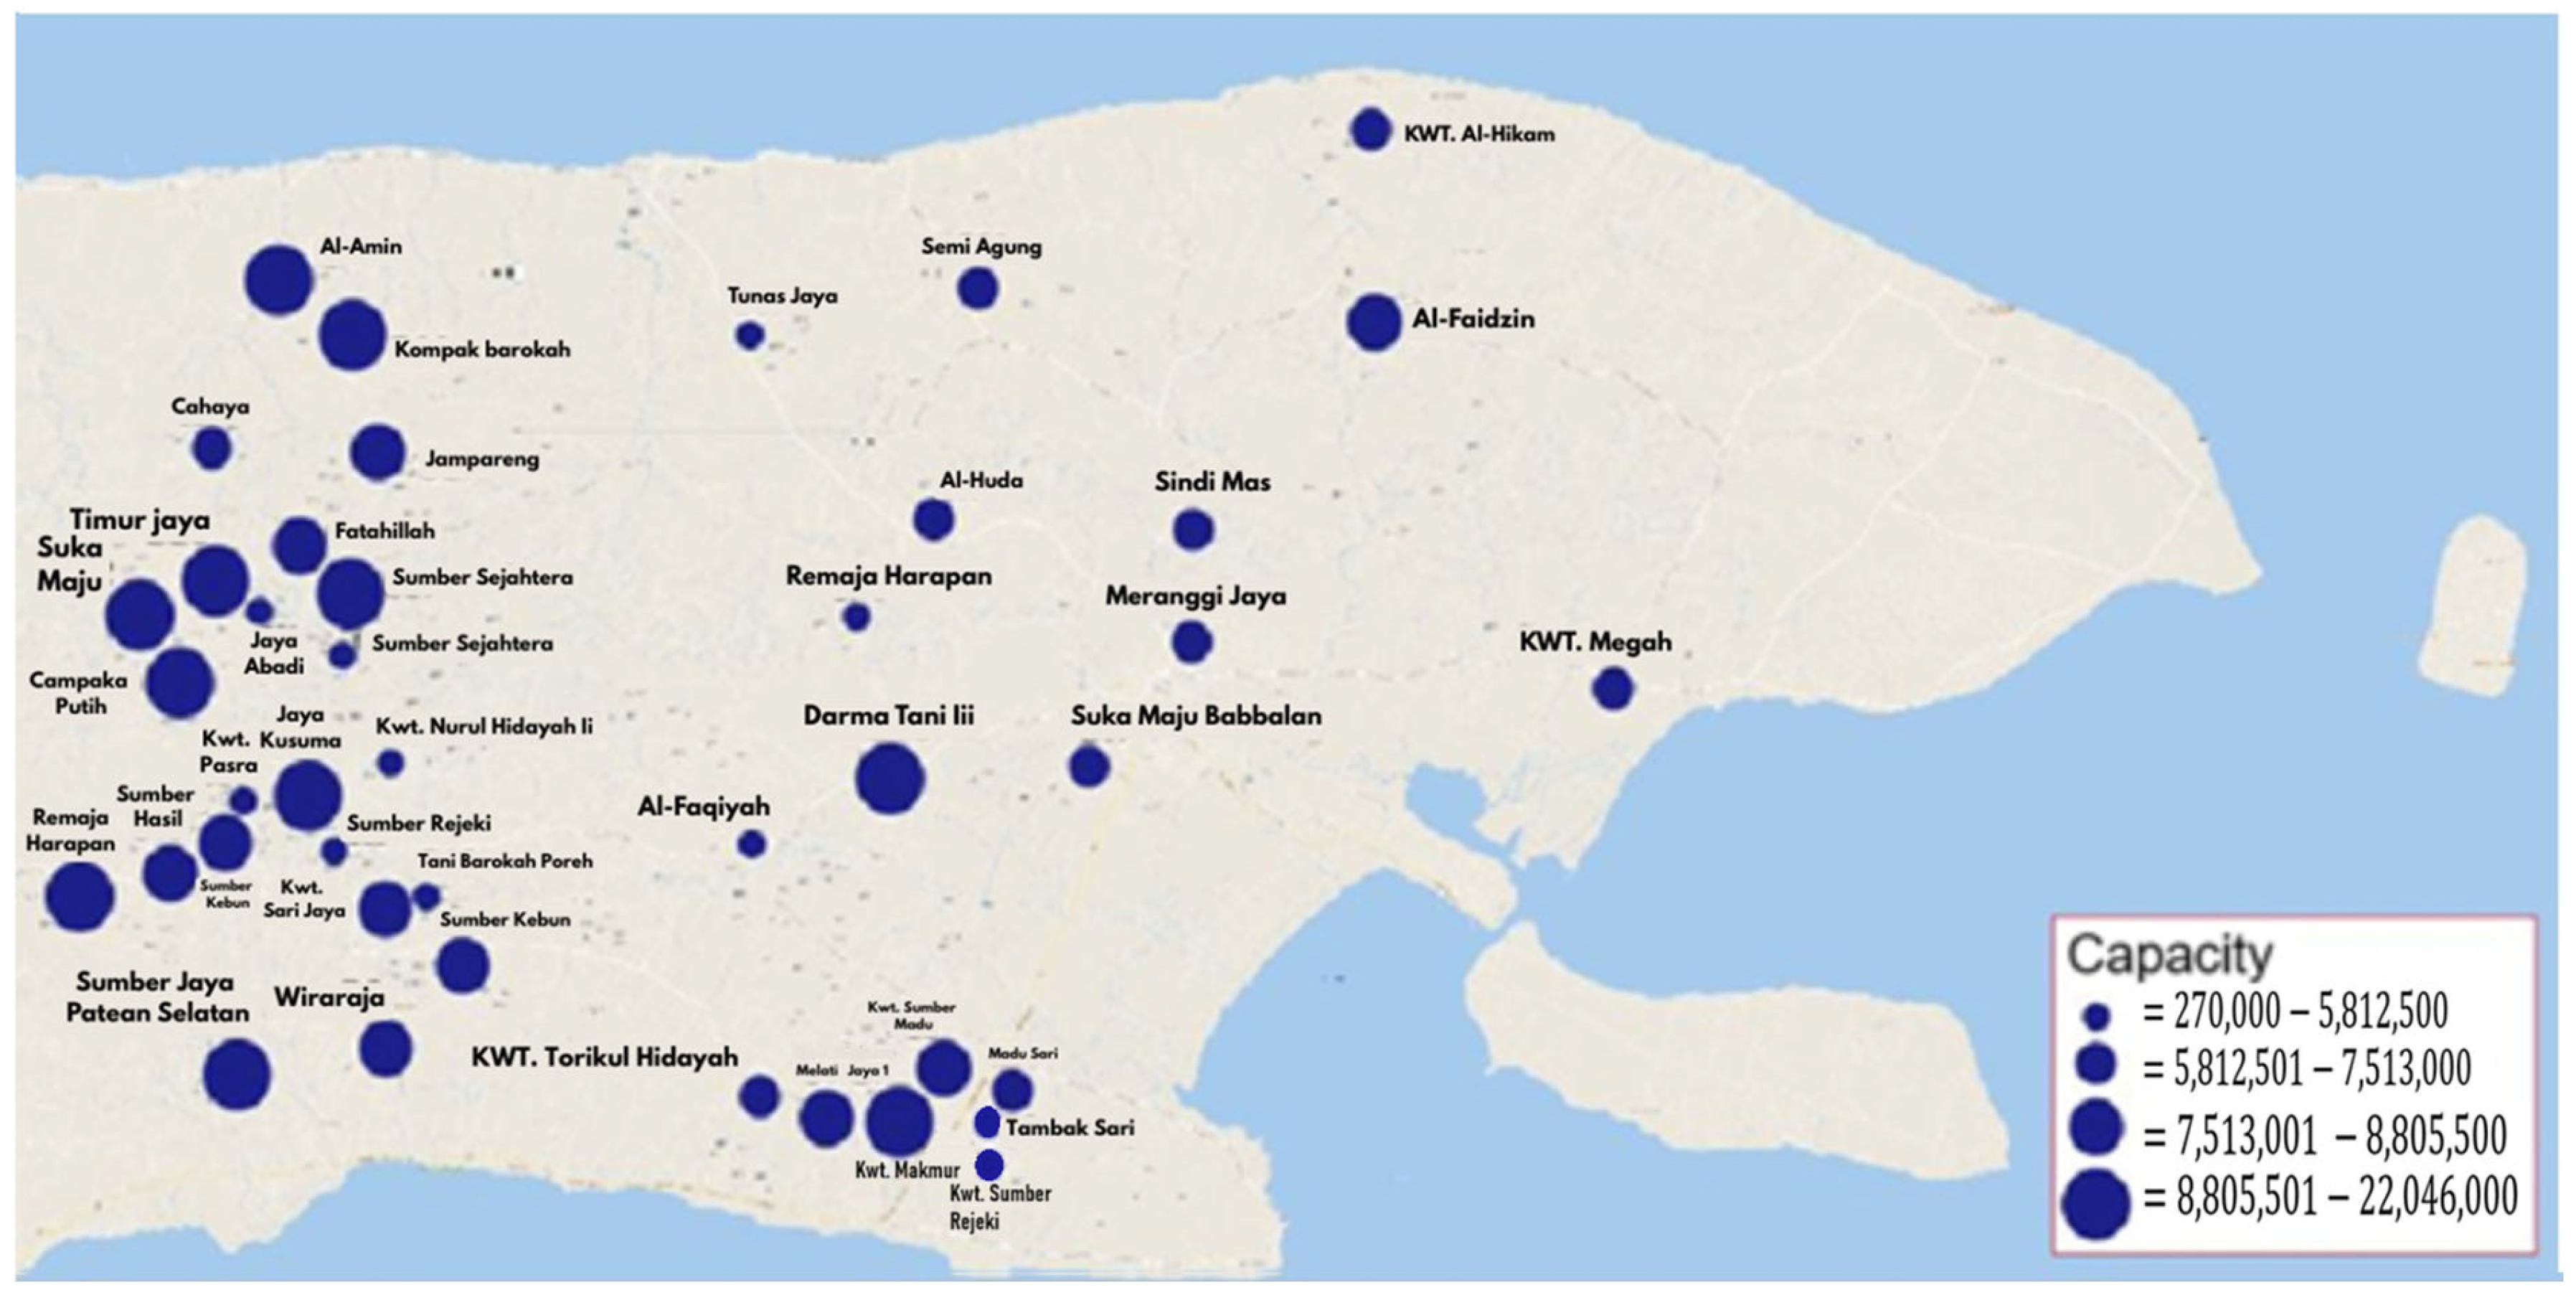
Table S1 shows that there are 42 seed breeders in the Sumenep district. The highest capacity is held by the Sumber Sejahtera farmer group, with a capacity of 18,995,000 seeds, while the lowest capacity is held by the KWT. Mawar Indah farmer group, with a capacity of 270,000 seeds. These seed breeders are entrusted by the Food Crops, Horticulture, and Plantation Service to cultivate the seeds provided, which are then distributed to farmer groups throughout Sumenep Regency. The following is a map of the distribution of seed nurseries in Sumenep Regency, illustrated in Figure 2.

3.3. Observed Fertilizer Store in Sumenep

These fertilizer stores are trusted by the Sumenep district government to distribute subsidized fertilizer to farmers. The following is data on fertilizer stores that receive subsidized fertilizer in the Sumenep district, as shown in Table 2.
Data of capacity subsidized fertilizer in Sumenep Regency district shown on Table 3.
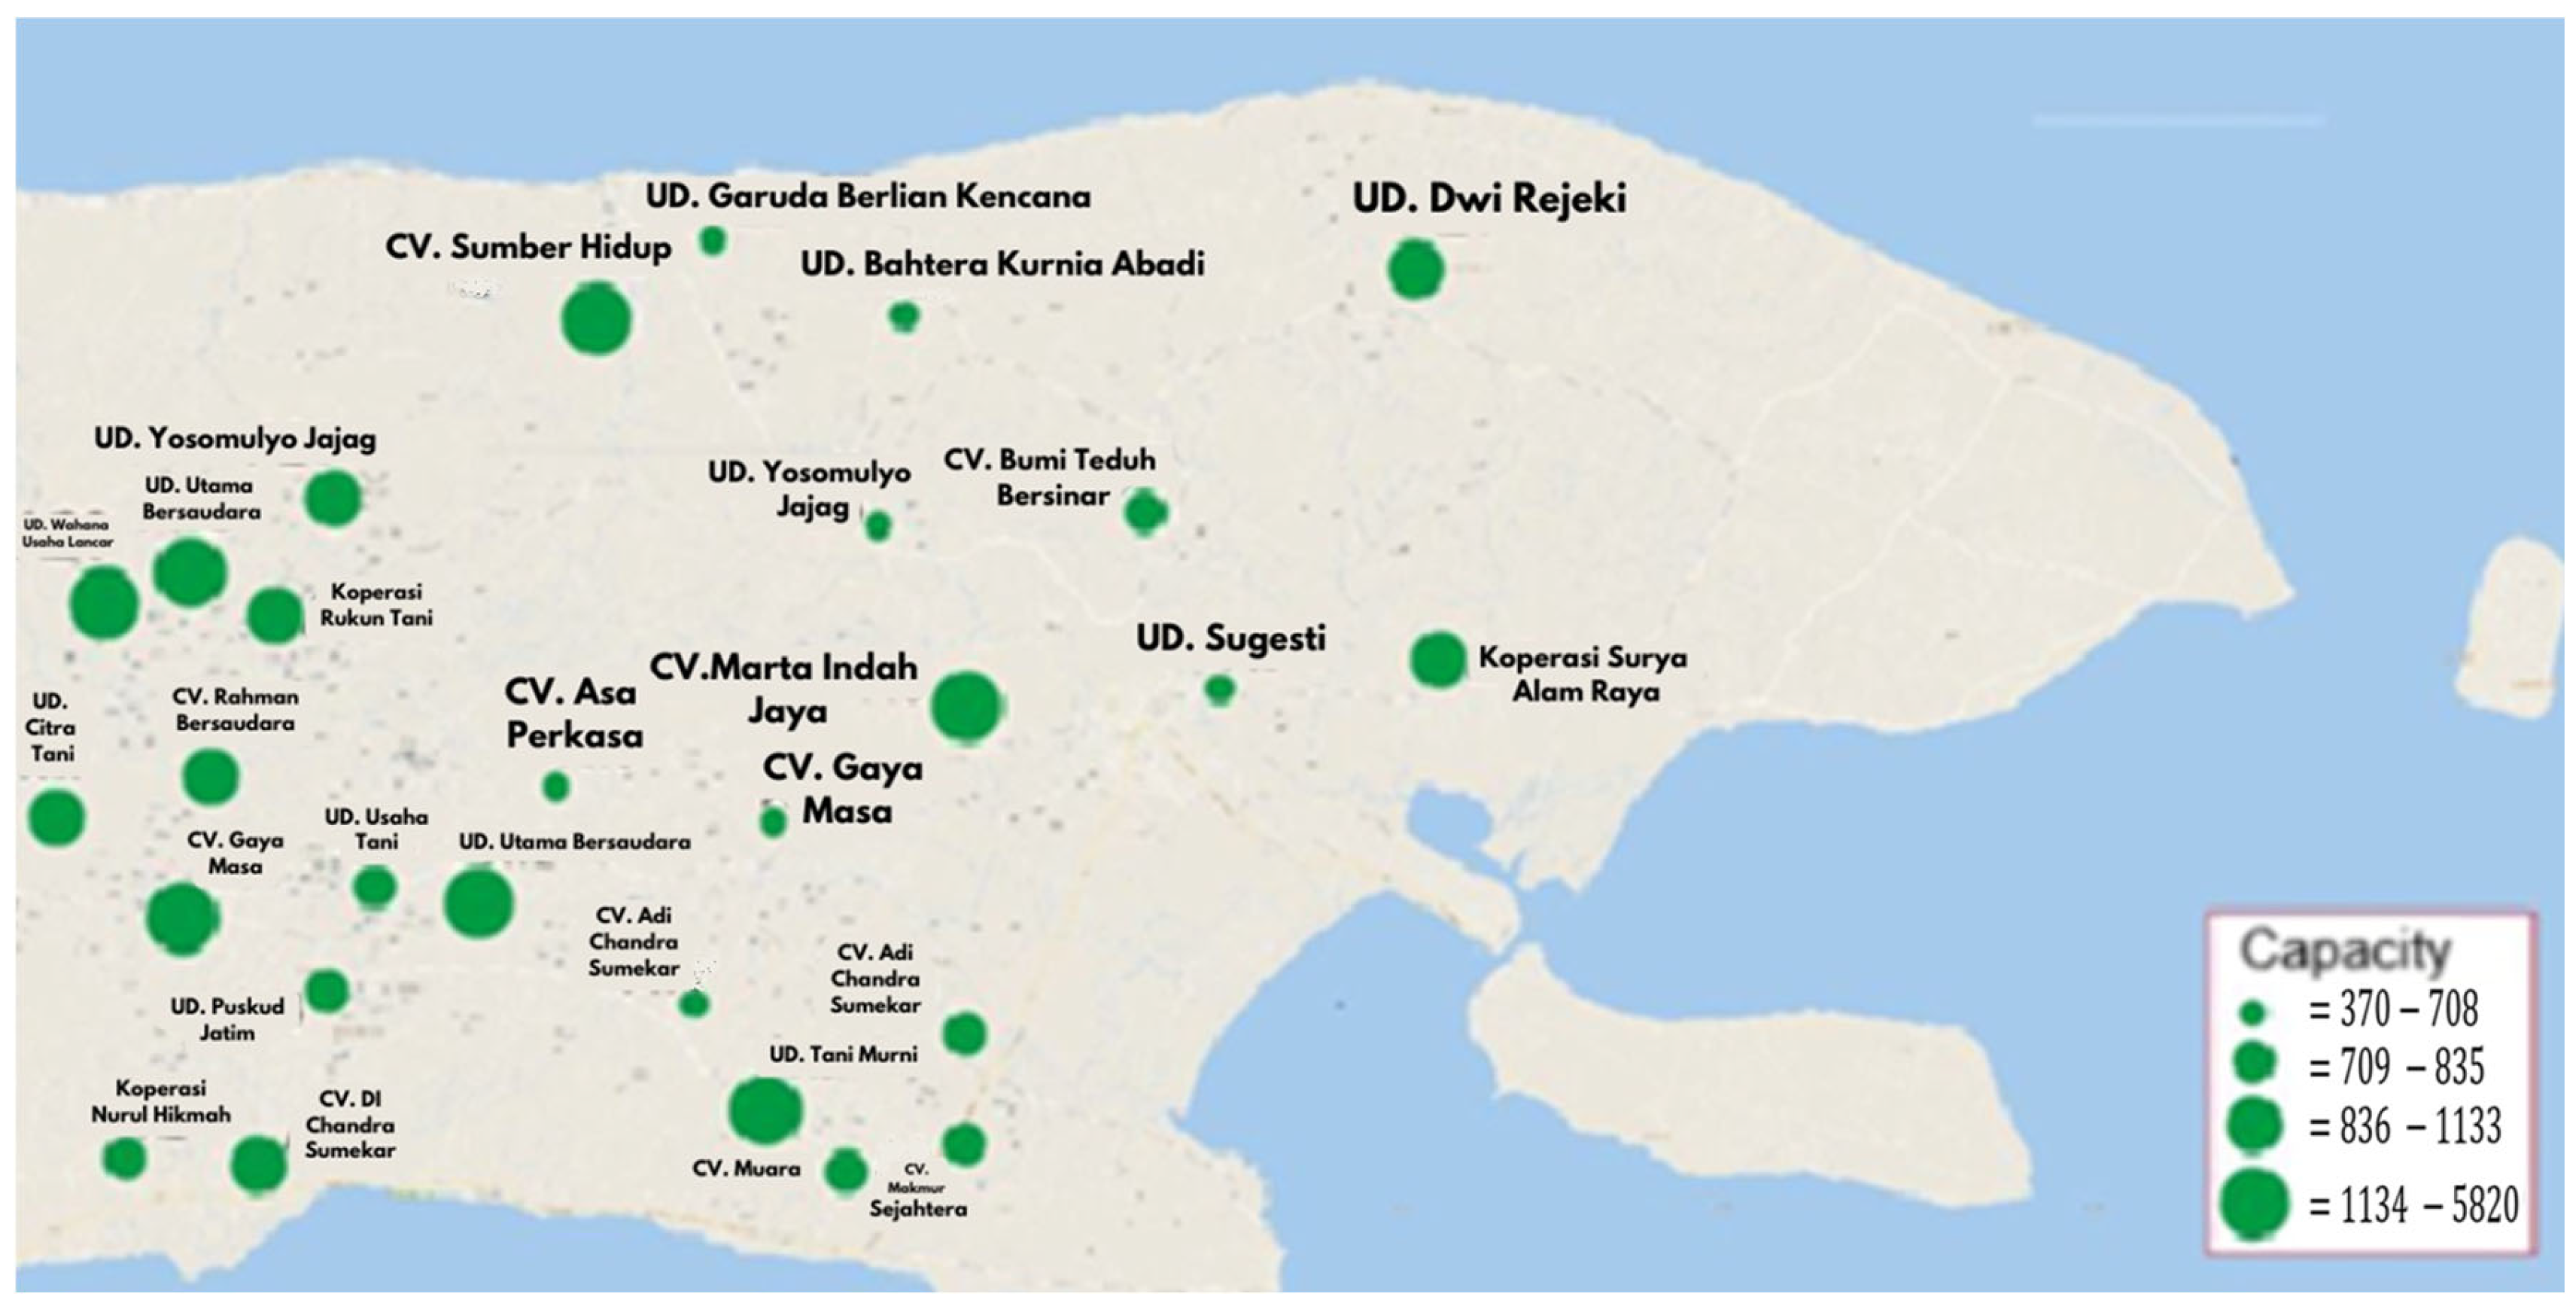
From the table above, it can be seen that there are 28 stores that distribute subsidized fertilizer, spread across the entire Sumenep district. The largest distributor is UD. Wahana Usaha Lancar, with a capacity of 5820 tons, while the smallest is UD. Garuda Berlian Kencana, with a capacity of 370 tons, and UD. Yosomulyo Jajag, with a capacity of 370 tons. Figure 3 shows a map of the distribution of fertilizer stores that receive subsidized fertilizer.

3.4. Observed Corn Storage Profile in Sumenep

Farmers sell their harvest to warehouses in Sumenep Regency. This is recommended so that farmers can obtain high prices for their corn and reduce the risk of price manipulation in sales. Farmers generally store part of their corn harvest to be used as feed for livestock in the future.
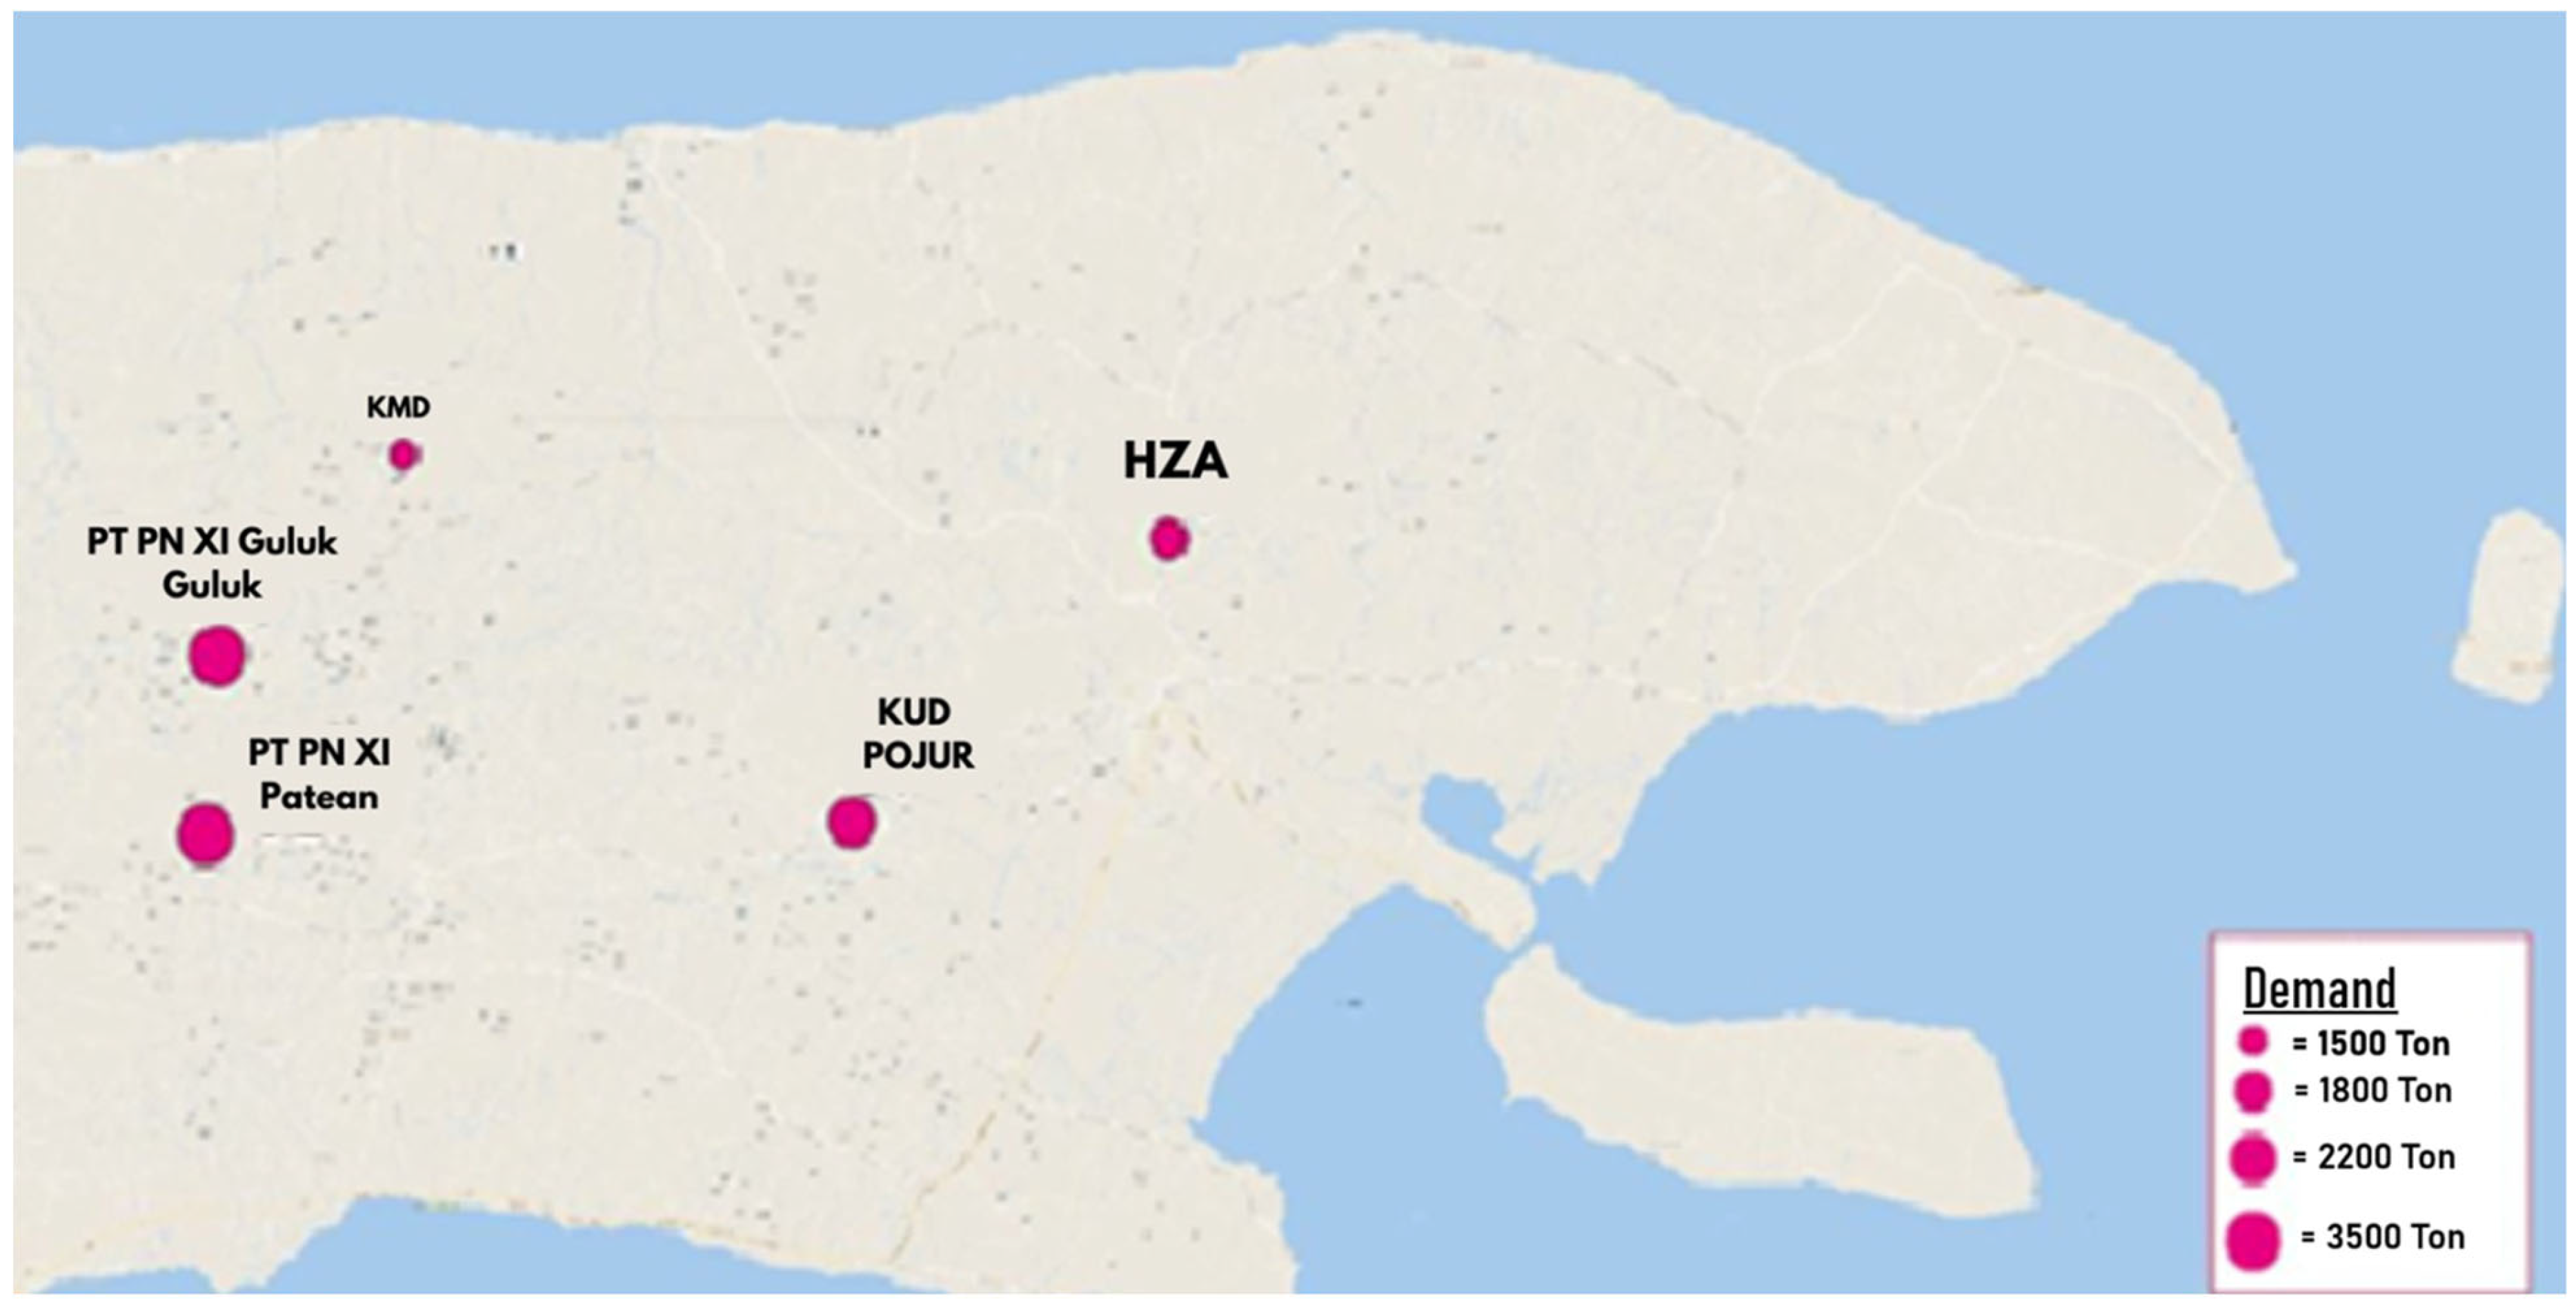
Table 4 shows data on warehouses and their capacity. Based on ownership, there are three types of warehouses in Sumenep Regency, namely company-owned warehouses, village cooperative-owned warehouses, and privately owned warehouses. Company-owned warehouses tend to purchase agricultural products from farmers at higher prices. The company-owned warehouses are PT PN XI, located in Patean Village, and Guluk Guluk. Warehouses owned by village cooperatives have purchase prices that are slightly lower than those of company-owned warehouses. In Sumenep, there is only one cooperative warehouse that stores corn, namely KUD POJUR, located in Lenteng. Two privately owned warehouses, named KMD and HZA, tend to purchase agricultural products at lower prices than company-owned or village warehouses. However, the KMD warehouse tends to purchase at higher prices than HZA, but its capacity is smaller. Figure 4 shows the location of these warehouses in Sumenep Regency.

3.5. Demand for Corn and Fertilizer to Support Bioethanol in Sumenep

Effective management of corn distribution within Sumenep Regency necessitates a comprehensive regulatory framework addressing critical inputs such as corn seeds, fertilizers, and the optimization of corn yields. The intricate nature of agricultural supply chains, particularly for staple crops like corn, involves a dynamic interplay between various stakeholders and environmental factors. Consequently, successful distribution hinges on meticulously addressing a specific set of demands and needs throughout the entire process, encompassing procurement, logistics, and market access. Understanding these multifaceted requirements is paramount for ensuring food security, enhancing farmer livelihoods, and fostering sustainable agricultural practices in the region, particularly given the challenges in managing agricultural inputs and outputs in developing economies. The results of the field observations are displayed in Supplementary Materials Table S2: Demand for seed and fertilizer of farmer group in Sumenep district.
Supplementary Materials Table S2 shows that the Lembah Bukit, Rahdatul Ihsan, and Al-Rohim farmer groups are the top farmer groups in corn seed and fertilizer demand, which shows a linear trend compared to Table S1. Cultivating corn over larger areas of land requires a proportional increase in agricultural inputs, such as corn seeds and fertilizers, to achieve optimal yields and maintain sustainable productivity [22]. This is due to corn’s inherent demand as a nutrient-intensive crop, requiring substantial quantities of essential nutrients throughout its growth cycle. Effective nutrient management scaled to the size of the cultivated area is therefore critical for replenishing soil fertility and supporting robust plant development. Among the various fertilizer types, NPK compounds are fundamental, providing a balanced supply of nitrogen (N), phosphorus (P), and potassium (K), which are crucial for overall plant health, vegetative growth, root development, and grain filling [23]. Nitrogen, often supplied by fertilizers such as ZA (ammonium sulphate), is essential for chlorophyll synthesis and protein formation, which directly influence leaf area and photosynthetic efficiency [24]. Phosphorus, which is commonly supplied by SP36 (superphosphate 36%), is essential for energy transfer, establishing the root system, and reproductive processes, particularly during the early stages of growth [25]. Potassium, a key component of NPK formulations, plays a significant role in water regulation, disease resistance, and overall plant vigor [26]. Therefore, the precise and appropriate application of these specific fertilizer types is essential for maximizing corn production efficiency and yield potential in extensive agricultural operations [27].

3.6. Clustering Distance of Farmer Group

The clustering stage of the farmer group analysis began with the recording of the distances between the groups. This was determined based on interviews about the routes they usually took and then verified using Google Maps. In the current research [28,29], Google Maps was utilized for distance calculations in service routing models, demonstrating how these platforms provide essential data and visualization capabilities that contribute to more efficient, cost-effective, and responsive supply chain operations. The results of the distance matrix of each farmer group are shown in Table 5.
A total of 532 data points are displayed in Table 5. FGN refers to Farmer Group Number. The longest route is 61.8 km, from 274 (Lembah Bukit) to 6 (Bina Karya II). An article on Digital Supply Chain Surveillance (DSCS) implicitly underscores the critical role of distance in supply chain management [30]. It emphasizes that effective DSCS, leveraging artificial intelligence, is essential for proactive monitoring and risk detection across geographically dispersed global networks. Managing the spatial dimension, or distance, is fundamental to maintaining visibility, ensuring real-time tracking, and mitigating risks such as unethical practices throughout complex, extended supply chains. Another article [31] proposes that leveraging artificial intelligence is essential for monitoring and analyzing data across geographically dispersed global networks. Managing this spatial dimension is crucial for maintaining visibility, enabling real-time tracking, and mitigating risks throughout extended supply chains. Following the acquisition of the distance matrix between farmer groups, the farmer groups were grouped using the p-median method. This was undertaken in accordance with the objective function and its constraints, as detailed in Equations (1)–(7). The result clustered farmer group shown on Table 6.
The provided data illustrates the clustering of farmer groups and their aggregated corn production volumes, offering crucial insights for optimizing the supply chain network. Across 15 identified clusters, corn production varies significantly, ranging from 180,267.5 tons in Cluster 1, to a substantial 1,113,646 tons in Cluster 3. The diverse composition of farmer groups within each cluster, indicated by numerous individual group names (e.g., “Asam Manis,” “Tani Jaya,” “KWT. Nurul Qomariyah”), underscores the localized and fragmented nature of corn cultivation in Sumenep. This clustering is instrumental for strategic supply chain design, as it allows for the identification of high-volume production hubs (e.g., Cluster 3, 5, 8) that may warrant dedicated collection points or direct transportation routes to processing facilities. Conversely, smaller clusters necessitate efficient aggregation strategies to consolidate feedstock, minimizing collection costs and ensuring viability. Effective networking within and between these clusters is paramount for establishing a robust and sustainable ethanol production supply chain, facilitating consistent feedstock flow, and maximizing the economic benefits for smallholder farmers. The visualized clustering of farmer groups in Sumenep is shown in Figure 5.
Figure 5 show visualization of clustered farmer group based on data in Table 6. Comparing to Figure 1, There are changes in how each farmer group is clustered by color. It can be seen that each cluster contains neighboring farmer groups, which simplifies the grouping process and makes it easier to identify farmer group distance. Each colored cluster on the right panel indicates that farmer groups within that cluster are now associated with a proximate central point, effectively “getting closer” to a designated hub. This strategic grouping inherently leads to a substantial reduction in the average and total travel distances within the supply chain [32]. Figure 6 provides a visual illustration showing a compelling transformation in the spatial organization of corn farmer groups, moving from a dispersed configuration to a more structured, clustered arrangement through the application of the p-median method. The left panel depicts the initial state, characterized by a seemingly random and widespread distribution of individual farmer groups represented by red dots in Figure 1. In contrast, Figure 6, representing post-clustering, reveals several distinct color-coded clusters, each representing a group of farmer entities assigned to a specific median point. This visual aggregation signifies a significant simplification of the distribution network. This fragmented layout inherently implies transportation distances for delivery of seeds breeder to clustered farmer group. This ensures that seed requirements of each farmer group are met with reduced delivery distance and times. However, from the perspective of seed breeder, the distribution of all seed is conducted in an effective manner without compromising their production capacity. The application of the p-median method, a classical facility location problem, aims to identify a predetermined number of facility locations as the medians that minimize the total distance or cost between demand points, such as the farmer groups and their assigned facilities [33].

3.7. Supply Chain Network

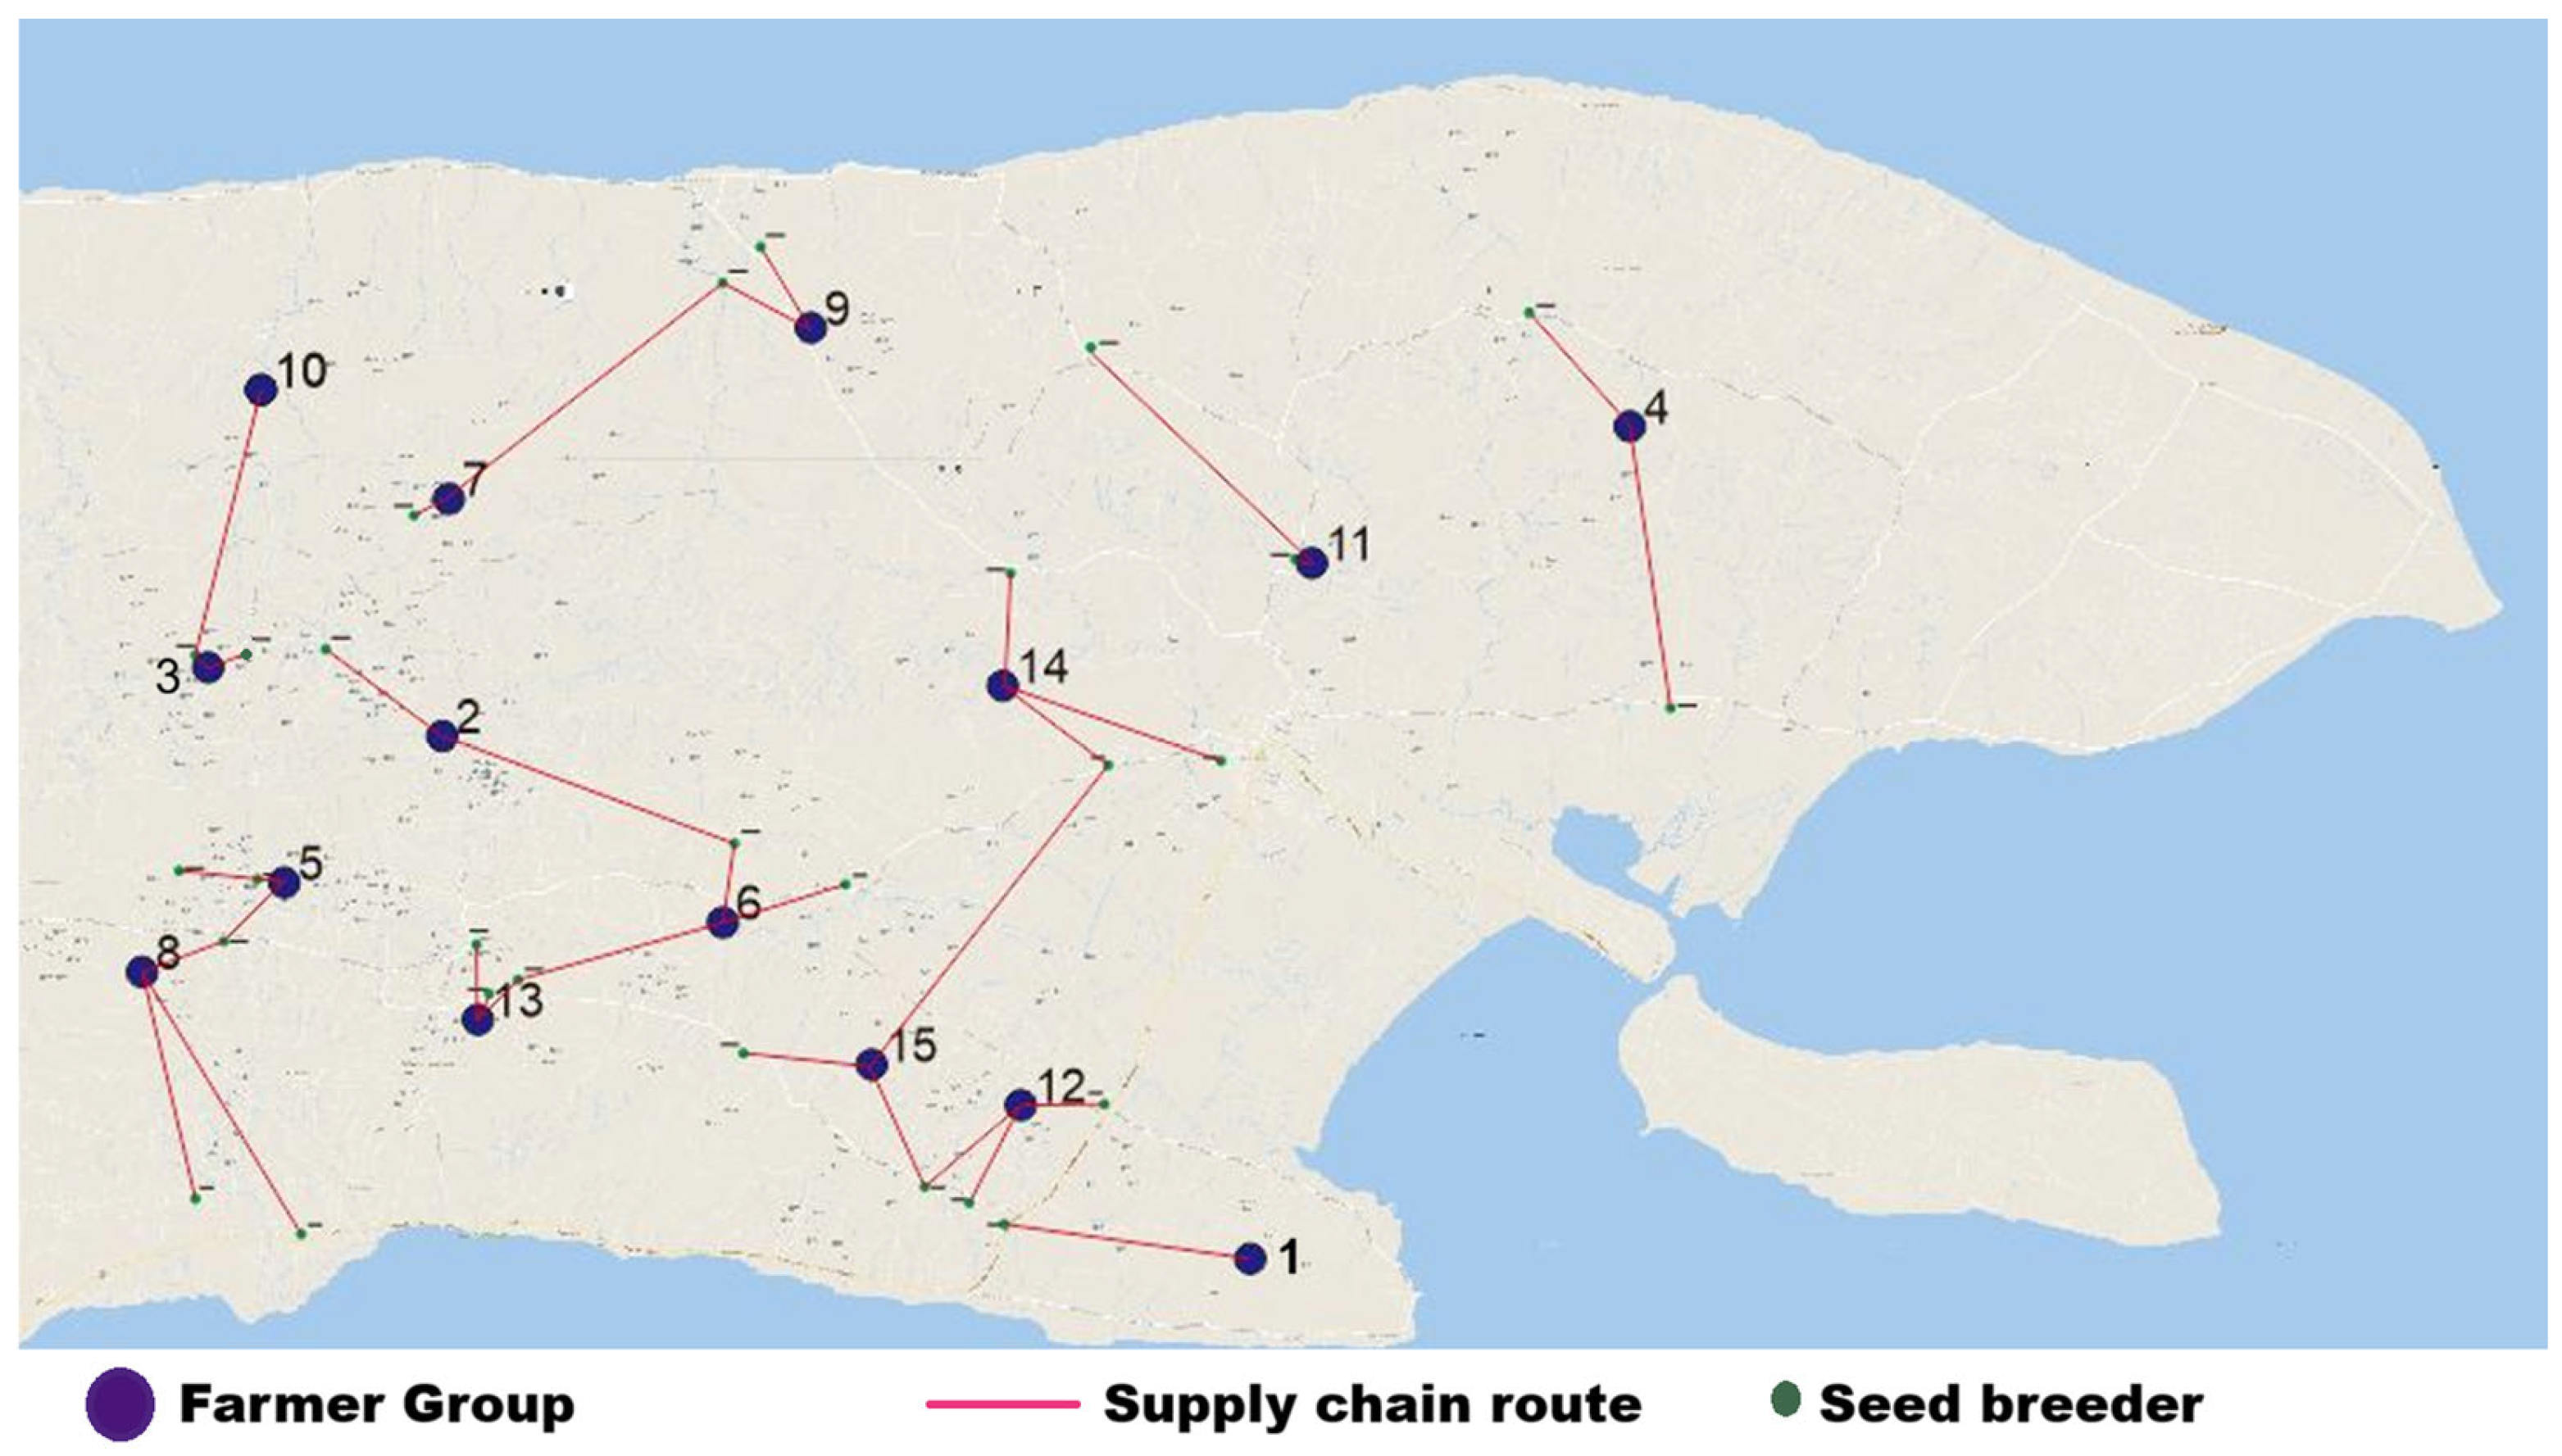
From a supply chain perspective, this simplification offers multifaceted benefits. Firstly, the reduction in distances leads directly to a decrease in transportation costs for delivering essential agricultural inputs, such as corn seeds and fertilizers, to farmer groups. This optimization has the potential to result in more frequent and timely deliveries, which may in turn improve the freshness of the input and reduce storage requirements at the farm level [34]. Another benefit can be seen in output logistics, as the clustered arrangement streamlines the collection of harvested corn. Instead of numerous disparate pick-up points, collection routes can now be optimized to serve concentrated areas, minimizing fuel consumption, vehicle wear, and labor hours. This efficiency can also contribute to reducing post-harvest losses by enabling faster aggregation and transport to processing facilities or markets [35]. Centralized collection or distribution points within each cluster can facilitate better inventory management, improved coordination between farmers and distributors, and more effective resource allocation. The minimized travel distances contribute to a more sustainable supply chain by reducing the carbon footprint associated with transportation activities [36]. In essence, the p-median clustering transforms a spatially complex distribution challenge into a manageable, cost-effective, and environmentally conscious network, fostering a more robust and responsive agricultural supply chain for corn farmers. The supply chain from corn seed breeders to farmer groups is shown in Figure 6.
The provided image delineates a critical segment of an agricultural supply chain, specifically illustrating the distribution network for corn seeds, from seed breeders to farmer group clusters. This visual representation, characterized by large blue numbered dots representing seed breeders, small green dots signifying farmer group clusters (the output of a prior p-median clustering process), and red lines depicting the supply routes, offers valuable insights into the logistical architecture designed for efficiency and optimization. The network structure evident in the image showcases a decentralized supply system where multiple seed breeders (15 distinct entities, numbered 1 through 15) are strategically positioned across the geographical expanse. Each breeder serves one or more farmer group clusters, forming a series of interconnected supply lines. This configuration suggests a deliberate design to minimize transportation distances and enhance the responsiveness of seed delivery to the clustered farmer groups. The prior application of p-median clustering to aggregate individual farmers into cohesive groups (the green dots) is fundamental to this network’s efficiency, as it consolidates demand points, thereby simplifying the routing problem for seed breeders [37,38]. From a supply chain perspective, this optimized network design offers several advantages. Firstly, cost efficiency is significantly improved. By minimizing the distances between breeders and their assigned farmer group clusters, transportation costs associated with fuel, labor, and vehicle maintenance are reduced [39]. This is particularly crucial for agricultural inputs, where margins can be tight, and efficient logistics directly impact farmer profitability and the overall cost of production. Secondly, enhanced service levels and lead time reduction are achieved. Shorter supply lines mean faster delivery of seeds, ensuring that farmers receive their inputs in a timely manner, which is critical for adherence to planting schedules and maximizing crop yield [40]. This responsiveness contributes to the reliability of the supply chain, a key factor in agricultural success. Furthermore, this network design contributes to risk mitigation and supply chain resilience. While some breeders appear to serve multiple clusters, indicating potential single points of failure if a breeder faces disruptions, the distributed nature of breeders across the region inherently provides a degree of redundancy. Should one breeder face issues, alternative breeders might be able to pick up the slack, albeit with potentially longer routes. The clustering of farmer groups also facilitates better communication and coordination, allowing for more agile responses to unforeseen events such as adverse weather conditions or sudden changes in demand [41]. On the other hand, optimized routing contributes to environmental sustainability by reducing the carbon footprint associated with seed distribution. Fewer kilometers traveled per unit of seed translates into lower greenhouse gas emissions, aligning with contemporary demands for greener supply chains in agriculture [42]. The depicted supply chain network, leveraging p-median clustering for farmer groups, represents a sophisticated approach to agricultural logistics. It underscores a strategic effort to optimize the flow of critical inputs by minimizing distances, enhancing cost-effectiveness, improving service delivery, and building resilience within the corn seed supply chain. Following the acquisition of the supply chain network from seed breeders to farmer groups, the distribution channels for corn production per farmer group, shown in Table 7, are to be optimized to align with the demand of corn storage warehouses shown in Table 4. This is to be achieved through the implementation of Equation (8) in MATLAB, utilizing objective and constraint functions in Equations (1)–(6). The results clustered supply chain distance are shown in Table 7.
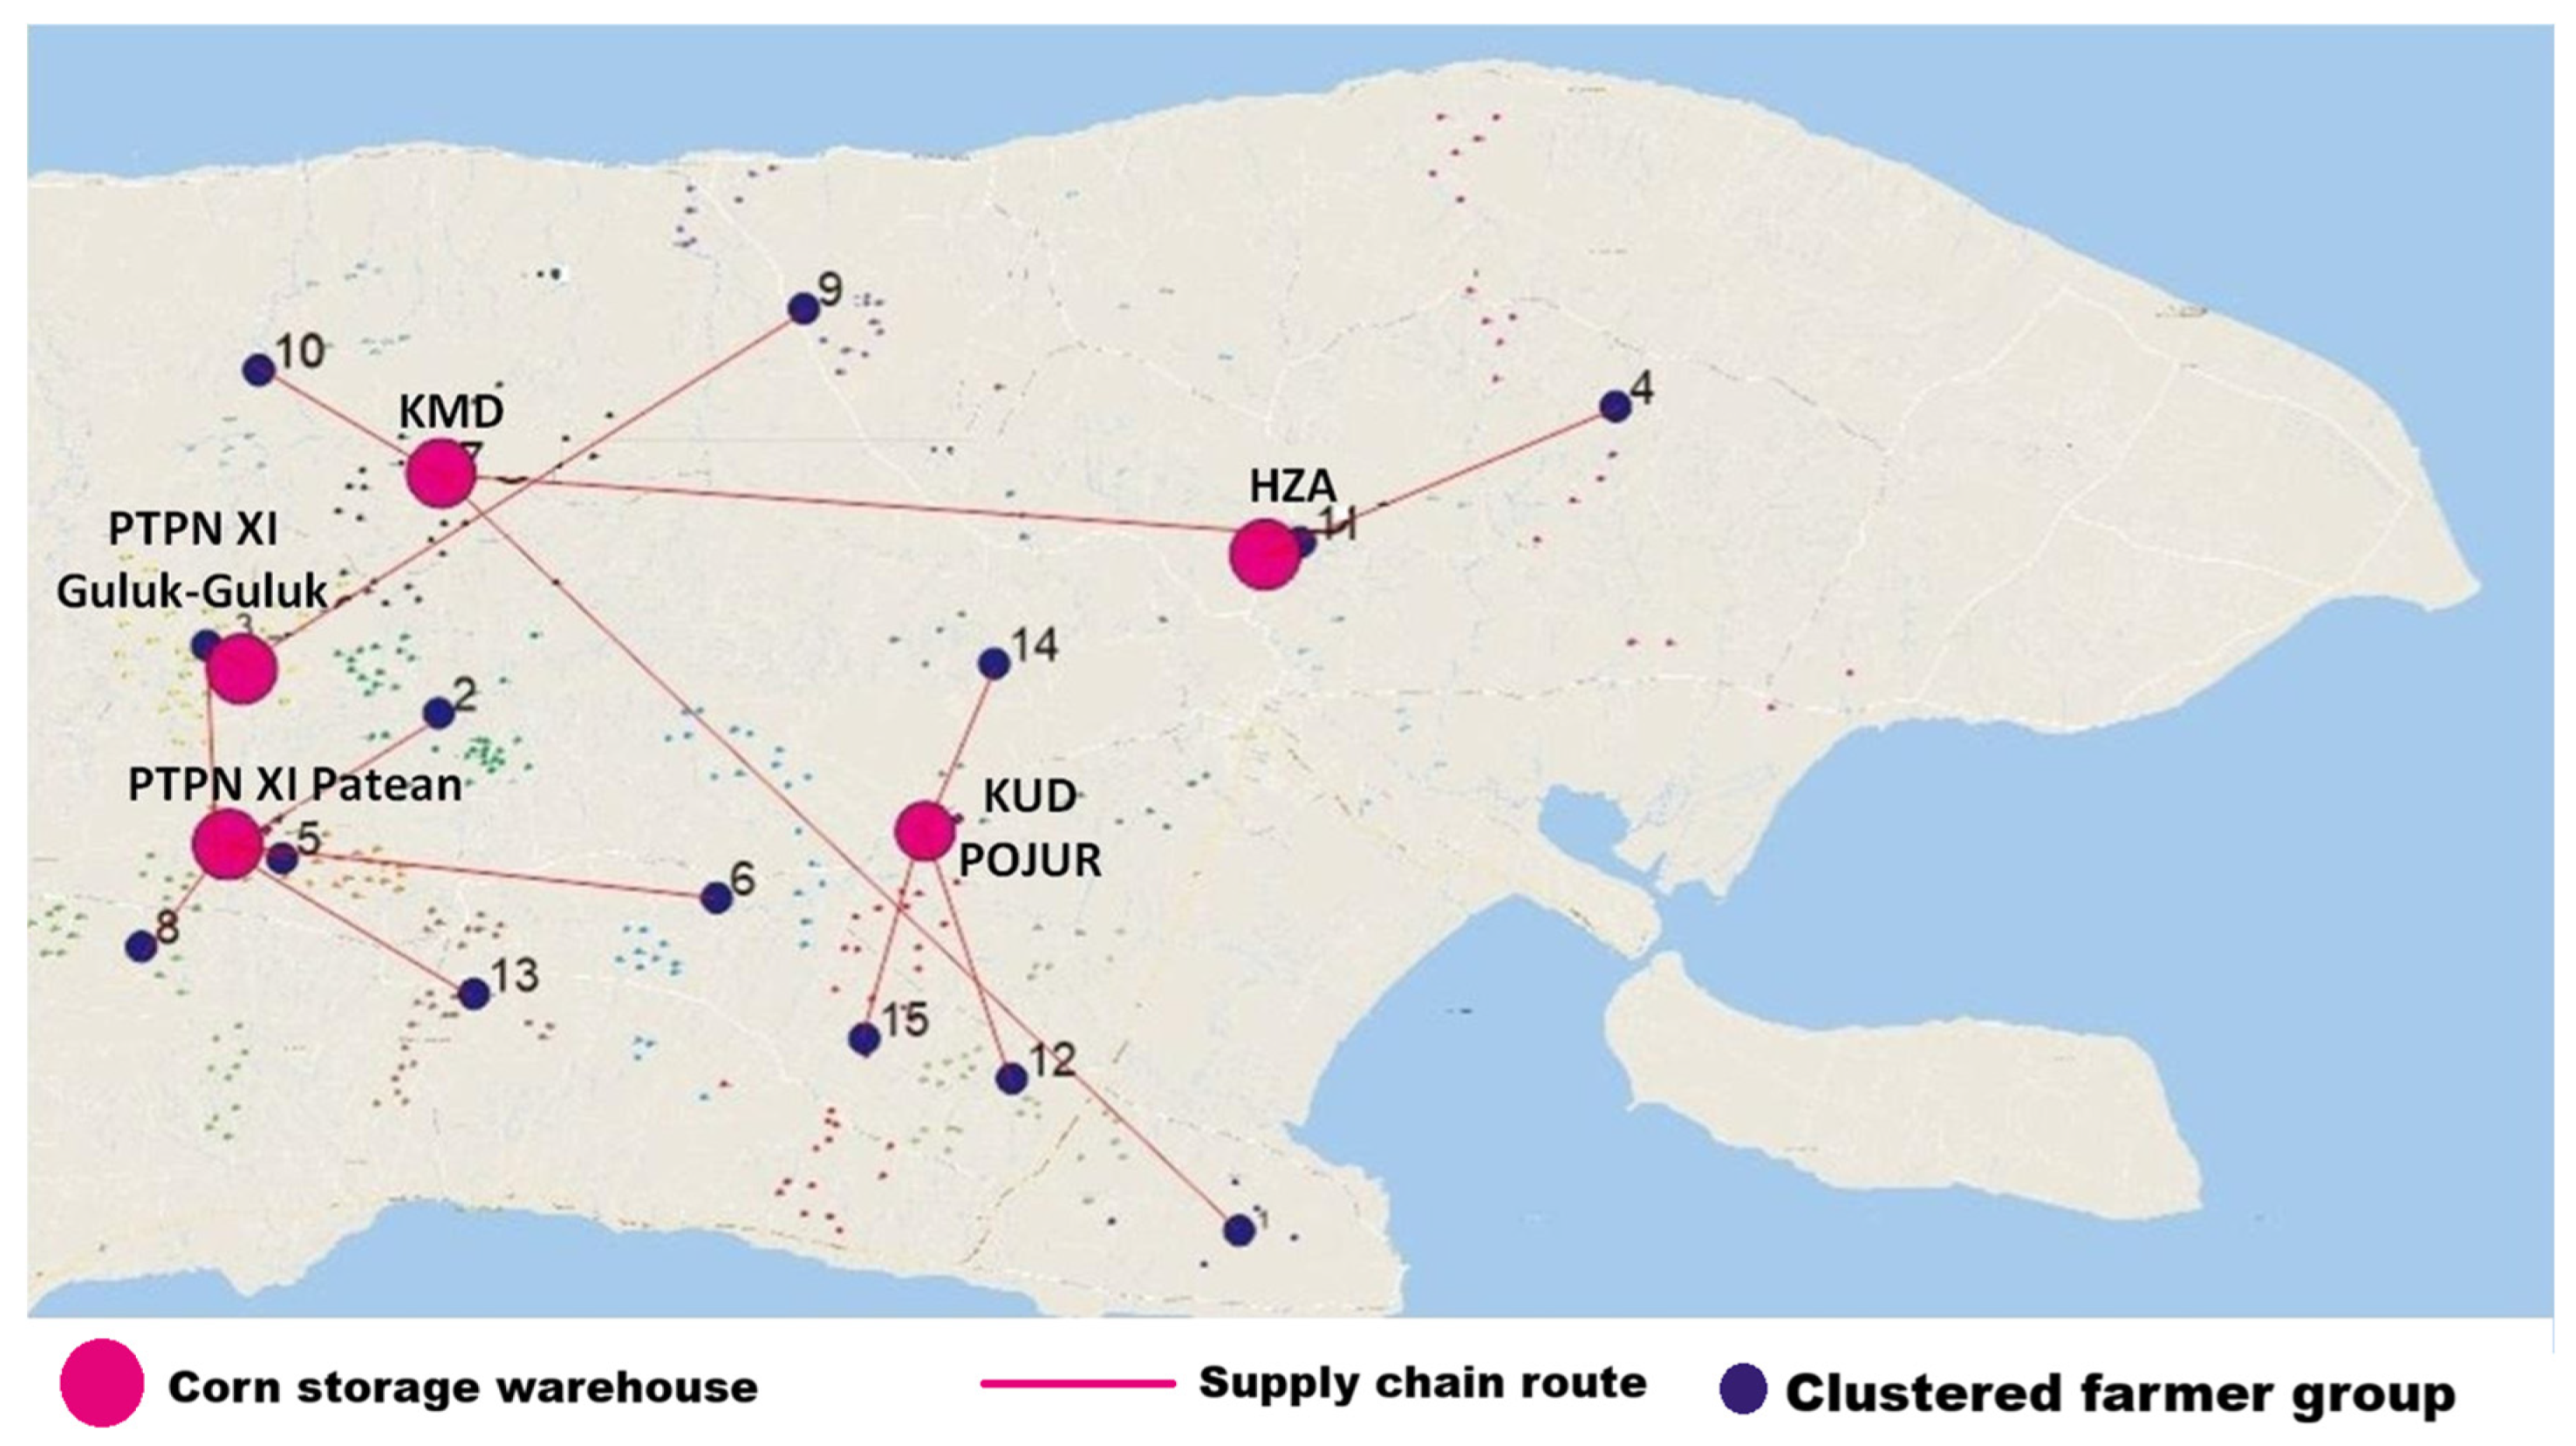
Table 7 presents the optimized supply chain network for corn farmer groups, detailing their production volumes, distances to two distinct corn storage warehouses (C1 and C5), and their assigned supply destinations. The data, generated using MATLAB, delineates the strategic allocation of corn produce from individual farmer groups to either C1 or C5. A total of 16 farmer groups are listed, with corn production volumes ranging from 302 tons (Farmer Group 381) to a substantial 1733 tons (Farmer Group 358), indicating a diverse range of production capacities within the network. A critical observation from the “Distance (km)” and “Supply (ton)” columns reveals that the assignment of farmer groups to warehouses is not solely dictated by the shortest geographical distance. For instance, Farmer Groups 74 through 357 consistently demonstrate shorter distances to warehouse C5 compared to C1 (e.g., Farmer Group 74 is 23.67 km from C1 and 6.73 km from C5), yet the majority of their production is allocated to C1. Conversely, Farmer Groups 358 through 384, which also exhibit shorter distances to C5, are predominantly assigned to supply C5. The implementation of the p-median-based clustering approach significantly improved the efficiency of the corn supply chain. Prior to optimization, the total delivery distance for farmer groups reached 346.29 km, reflecting dispersed and uncoordinated transportation patterns. After applying the clustering model, the total delivery distance was reduced to 74.26 km, resulting in a substantial decrease of 272.03 km. This reduction demonstrates the effectiveness of spatial optimization in minimizing logistical inefficiencies and improving accessibility to aggregation centers. From an operational perspective, this improvement also translates into tangible economic benefits. Assuming that pickup trucks commonly used by farmers have an average fuel consumption of 16 km per liter, the reduced travel distance leads to a significant decrease in fuel usage and associated transportation costs. Consequently, the optimized supply chain not only enhances logistical performance but also contributes to cost savings and improved economic outcomes for smallholder farmers. This discrepancy suggests that the MATLAB optimization model employs a more sophisticated objective function than simple distance minimization for individual farmer groups. Such assignments are characteristic of complex supply chain optimization problems, where factors like warehouse capacity constraints, specific demand requirements at each warehouse, overall network balancing, or varying operational costs (e.g., handling, storage, or differentiated transportation rates beyond mere distance) might influence the optimal allocation decisions [43,44]. The case of Farmer Group 357, which splits its production (419 tons to C1 and 31 tons to C5) despite C5 being closer (16.67 km to C1 vs. 6.66 km to C5), further underscores the multi-faceted nature of the optimization. This partial allocation could indicate an attempt to meet specific, smaller demand at C5 or to balance the load across warehouses, ensuring efficient utilization of resources and preventing bottlenecks [45,46]. This strategic assignment, moving beyond a greedy shortest-path approach, is crucial for achieving global optimality in a supply chain, minimizing total system costs, and enhancing overall network efficiency and resilience [47]. Therefore, the results in Table 7 illustrate a deliberate and optimized supply chain design that balances geographical proximity with other critical logistical and operational considerations to ensure effective corn distribution. The visualization of the supply chain distribution from farmer group clusters to corn storage warehouses is shown in Figure 7
The substantial corn harvest in Sumenep Regency, totaling 8,475,914.5 tons, presents a compelling opportunity for localized bioethanol production, offering multifaceted benefits across agricultural, environmental, and energy sectors. With 15% of this yield comprising kernels, an estimated 1,271,387.175 tons of feedstock become available, capable of generating 381,416.1525 L of bioethanol [48]. This localized production capacity holds significant implications for local farmers, as the increased demand for corn as a bioethanol feedstock can stimulate agricultural economic activity, enhance income stability, and foster rural development, aligning with findings that highlight biofuels’ role in creating employment and promoting sustainability [17,18,49,50,51]. Life cycle assessments consistently demonstrate that bioethanol production can significantly lower global warming potential and other environmental impacts compared to gasoline [52]. Furthermore, the produced bioethanol can be strategically integrated into the fuel supply chain, yielding positive impacts on vehicle performance. The 381,416.1525 L of bioethanol is sufficient to create 3,814,161.525 L of an E10 fuel blend, which is commonly used to enhance the octane rating of gasoline to 90 or higher [53]. Research indicates that ethanol-blended gasoline can improve engine power output, fuel efficiency, and significantly reduce harmful emissions such as carbon monoxide and hydrocarbons in various vehicle types, including two-wheelers and hybrid vehicles [54]. From the calculations using the new supply chain model, the farmers’ group profit is Rp 205,693,725,826, and for the old model, the profit is Rp 177,394,823,353. So, it is clear that the clustering supply chain model is better because the profit increases by 16% compared to the model without clustering. The average profit for members in the supply chain model without clustering is Rp 18,168,548, while in the new model, it is Rp 20,896,889. While the generated volume represents a fraction of the national subsidized fuel quota of 30.71 million kiloliters, it underscores a viable pathway for Sumenep Regency to contribute to national energy security, promote a circular economy in agriculture, and advance environmental stewardship through the strategic valorization of its corn harvest.

3.8. Number of Facilities (p-Median Parameter)

A key parameter in the p-median model is the number of facilities (p), which determines how many aggregation centers are established within the supply chain network. In this study, a configuration of p = 15 facilities is adopted. This value is not arbitrary but reflects a balance between logistical efficiency, spatial coverage, and practical considerations related to regional conditions. From a logistical perspective, increasing the number of facilities reduces the average transportation distance between supply points and assigned centers, thereby lowering transportation costs. However, a larger number of facilities may lead to higher infrastructure and operational costs, as each facility requires investment in land, storage, and management. Conversely, a smaller number of facilities may reduce infrastructure costs but increase transportation burden, particularly for geographically dispersed smallholder farmers. Therefore, the selection of p = 15 represents a compromise between these competing factors, ensuring reasonable accessibility for farmers while maintaining a manageable number of aggregation points.
In addition, the choice of p is informed by the spatial distribution of corn production in Sumenep Regency, where agricultural activities are dispersed across multiple sub-districts with varying production capacities. The selected number of facilities allows for effective clustering of production areas without excessively concentrating supply flows into a limited number of centers, which could create bottlenecks in logistics operations. To further evaluate the robustness of this assumption, a sensitivity analysis is conducted by varying the number of facilities across several scenarios, such as p = 10, 12, 15, 18, 20. The results indicate that while increasing p consistently reduces total weighted distance, the marginal improvement diminishes beyond a certain threshold. In particular, the reduction in total transportation distance becomes less significant when p > 15, suggesting diminishing returns in logistical efficiency. This finding supports the selection of p = 15 as a near-optimal solution that balances efficiency and practicality. It is important to note that the model does not explicitly incorporate infrastructure capacity constraints or investment cost functions. Therefore, the selection of p should be interpreted as a planning-level decision rather than a definitive operational recommendation. Future research could extend this analysis by integrating facility cost structures, capacity limitations, and multi-objective optimization to determine the optimal number of facilities under both economic and socio-economic criteria.

3.9. Research Limitations

Although the clustering-based approach used in this study provides a practical framework for optimizing the location of corn aggregation centers, it should be acknowledged that clustering techniques represent a classical method commonly applied in facility location and supply chain design problems. While the approach is effective at minimizing transportation distances and improving feedstock aggregation efficiency, the model assumes relatively stable supply and demand conditions. In real-world agricultural systems, however, supply chain stability can be affected by several external risk factors, including fluctuations in agricultural commodity prices, variations in crop yields, and disruptions caused by extreme weather events. These uncertainties may significantly influence feedstock availability, logistics costs, and the overall reliability of the bioethanol supply chain.
The people of Sumenep engage in the cultivation of corn during the dry season. The initiation of the planting season is invariably contingent on the involvement of community leaders, such as kyai (religious leaders) or klebun (village chiefs). The transition to a clustering model will present its own challenges, as members have historically based their planting decisions on the counsel of these leaders. In order to proceed, coordination with the local BABINSA (Village Supervisory Non-Commissioned Officer) is required. The implementation of this process necessitates the coordination of various elements within the community.

3.10. Policy Implications for Sustainable Bioethanol Development in Sumenep

The clustering-based model demonstrates that more efficient feedstock aggregation and transportation can increase farmer profits and strengthen the reliability of biomass supply for ethanol production. These results suggest that supply chain optimization is an important enabling factor for sustainable bioenergy development, particularly in regions dominated by smallholder farmers. Efficient agricultural logistics systems have been widely recognized as a key component in improving the viability of biofuel supply chains and reducing operational costs [55]. From a policy perspective, the development of decentralized biomass aggregation centers should be prioritized to reduce transportation distances and improve feedstock consolidation. Strategic placement of such facilities can enhance supply reliability for ethanol processing industries and support the implementation of ethanol blending policies. Strengthening farmer cooperatives and producer networks is also essential to improve coordination within the supply chain and increase farmers’ bargaining power in bioenergy markets [56]. Collective institutions have been shown to play a crucial role in improving market access and income stability among smallholder farmers involved in bioenergy feedstock production [57]. Integrating agricultural development policies with national renewable energy strategies will therefore be critical for Indonesia’s ethanol blending program. Such integrated approaches can simultaneously enhance rural livelihoods, improve energy security, and support greenhouse gas mitigation targets [58].

4. Conclusions

This study developed an optimized supply chain framework for corn products in Sumenep Regency, Indonesia, with the objective of supporting sustainable ethanol production and improving the economic participation of smallholder farmers. By integrating field data, farmer clustering techniques, and mathematical modeling using the p-median method, the research demonstrates that a decentralized and simplified supply chain architecture can significantly improve the efficiency of agricultural logistics and the economic outcomes of farmer groups. The results show that Sumenep’s corn production potential can generate approximately 381,416 L of bioethanol, which could contribute to the production of E10 blended fuel while strengthening local agricultural value chains. By applying a clustering supply chain model, the farmers’ group profit is Rp 205,693,725,826, while it is Rp 177,394,823,353 for the non-clustering model. The majority of this revenue increase came from savings in delivery distance; before applying the clustering model, the distance was 346.29 km, but after applying the clustering model, it was reduced to 74.26 km, resulting in a substantial reduction of 272.03 km in delivery distance.
The findings highlight that clustering farmer groups and optimizing supply routes can increase farmer group profit by approximately 16%, demonstrating that supply chain design plays a crucial role in ensuring that value creation from bioethanol feedstock reaches smallholder farmers. This outcome supports previous studies emphasizing that efficient biofuel supply chains can simultaneously enhance economic viability and environmental sustainability by reducing logistical costs, improving feedstock aggregation efficiency, and lowering carbon emissions associated with transportation activities [4,58]. From a broader sustainability perspective, the integration of corn-based bioethanol production into regional agricultural systems offers multiple benefits. Bioethanol derived from biomass has been widely recognized as a renewable alternative to fossil fuels that can reduce greenhouse gas emissions and support national decarbonization strategies [53]. Furthermore, ethanol–gasoline blends have been shown to improve engine performance and reduce harmful emissions such as carbon monoxide and hydrocarbons, making bioethanol an important component of cleaner transportation systems [54]. In the Indonesian context, the proposed supply chain framework contributes to ongoing efforts to implement bioethanol blending policies, which aim to enhance national energy security while reducing dependence on imported fossil fuels. Studies assessing Indonesia’s readiness for ethanol-blended fuels indicate that logistical infrastructure and feedstock supply chains are critical determinants of successful implementation [12]. Therefore, the decentralized clustering approach proposed in this study provides a practical mechanism for connecting smallholder farmers to emerging bioenergy markets while supporting inclusive rural development.
Despite these contributions, several limitations should be acknowledged. Firstly, the study relies on cross-sectional data obtained from interviews and secondary institutional sources, which may not fully capture dynamic fluctuations in corn production, transportation costs, or market prices over time. Secondly, the analysis focuses primarily on logistical optimization and economic outcomes, without conducting a comprehensive life-cycle environmental assessment of ethanol production and distribution. Thirdly, the proposed model assumes a relatively stable demand for ethanol feedstock and does not explicitly account for potential policy changes, market volatility, or climate-related agricultural risks that could influence feedstock availability. Future studies should extend this work by incorporating dynamic cost models and real-time logistics data to improve supply chain responsiveness under uncertain market conditions. Additionally, integrating life-cycle assessment (LCA) and environmental impact analysis would provide a more comprehensive evaluation of the sustainability performance of corn-based ethanol supply chains. Further research could also examine multi-feedstock systems, including cassava, sugarcane, or agricultural residues, to reduce the risk of food–fuel competition and diversify bioethanol production sources.

Supplementary Materials

The following supporting information can be downloaded at: https://www.mdpi.com/article/10.3390/su18094534/s1, Table S1: Farmer group location and managed agricultural land. Table S2: Demand for seed and fertilizer of farmer group in Sumenep district.

Author Contributions

Conceptualization, M.A.A.; methodology, R.M.Y. and A.A.; software, A.A.; validation, S.A.; formal analysis, S.A. and R.M.Y.; resources, A.A.; data curation, A.A.; writing—original draft, R.M.Y.; writing—review and editing, S.A.; visualization, M.A.A.; supervision, S.A.; project administration, S.A. and M.A.A. All authors have read and agreed to the published version of the manuscript.

Funding

This research received no external funding.

Institutional Review Board Statement

The study was conducted in accordance with the Declaration of Helsinki and approved by the Research Ethics Committee at Trunojoyo University (protocol code B/10311/UN46.4.1/PT.05/2025 and date of approval: 28 November 2025).

Informed Consent Statement

Informed consent was obtained from all subjects involved in the study.

Data Availability Statement

The original contributions presented in this study are included in the article. Further inquiries can be directed to the corresponding author.

Conflicts of Interest

The authors declare no conflicts of interest.

References

  1. Abdul Kareem Joyia, M.; Ahmad, M.; Chen, Y.-F.; Mustaqeem, M.; Ali, A.; Abbas, A.; Ashraf Gondal, M. Trends and Advances in Sustainable Bioethanol Production Technologies from First to Fourth Generation: A Critical Review. Energy Convers. Manag. 2024, 321, 119037. [Google Scholar] [CrossRef]
  2. Gandam, P.K.; Chinta, M.L.; Pabbathi, N.P.P.; Velidandi, A.; Sharma, M.; Kuhad, R.C.; Tabatabaei, M.; Aghbashlo, M.; Baadhe, R.R.; Gupta, V.K. Corncob-Based Biorefinery: A Comprehensive Review of Pretreatment Methodologies, and Biorefinery Platforms. J. Energy Inst. 2022, 101, 290–308. [Google Scholar] [CrossRef]
  3. Shekarian, E.; Ijadi, B.; Zare, A.; Majava, J. Sustainable Supply Chain Management: A Comprehensive Systematic Review of Industrial Practices. Sustainability 2022, 14, 7892. [Google Scholar] [CrossRef]
  4. Althuri, A.; Venkata Mohan, S. Emerging Innovations for Sustainable Production of Bioethanol and Other Mercantile Products from Circular Economy Perspective. Bioresour. Technol. 2022, 363, 128013. [Google Scholar] [CrossRef]
  5. Nunes, L.J.R.; Matias, J.C.O.; Loureiro, L.M.E.F.; Sá, L.C.R.; Silva, H.F.C.; Rodrigues, A.M.; Causer, T.P.; Devallance, D.B.; Ciolkosz, D.E. Evaluation of the Potential of Agricultural Waste Recovery: Energy Densification as a Factor for Residual Biomass Logistics Optimization. Appl. Sci. 2021, 11, 20. [Google Scholar] [CrossRef]
  6. Shi, Z.; Liang, F.; Pezzuolo, A. Renewable Energy Communities in Rural Areas: A Comprehensive Overview of Current Development, Challenges, and Emerging Trends. J. Clean. Prod. 2024, 484, 144336. [Google Scholar] [CrossRef]
  7. Masood, A.; Ahmed, U.; Hassan, S.Z.; Khan, A.R.; Mahmood, A. Economic Value Creation of Artificial Intelligence in Supporting Variable Renewable Energy Resource Integration to Power Systems: A Systematic Review. Sustainability 2025, 17, 2599. [Google Scholar] [CrossRef]
  8. Kheybari, S.; Davoodi Monfared, M.; Salamirad, A.; Rezaei, J. Bioethanol Sustainable Supply Chain Design: A Multi-Attribute Bi-Objective Structure. Comput. Ind. Eng. 2023, 180, 109258. [Google Scholar] [CrossRef]
  9. Al Farisyi, M.A.; Hidayati, D.R.; Qomariyah, N. Integrated Farming of Crops and Livestock: Effects on Cashew Farming Income in Sumenep Regency. Agriekonomika 2025, 14, 56–66. [Google Scholar]
  10. Hidayaturrahman, M.; Laily, N.; Agusrianto, E. Empowerment Salt Farmers to Alleviate Poverty. In Proceedings of the International Conference “Sustainable Development Goals 2030 Challenges and Its Solutions”, Malang, Indonesia, 11–12 August 2017; pp. 89–97. [Google Scholar]
  11. Maflahah, I.; Joko Utomo, S.; Farida Asfan, D.; Fathor, A.S. Analysis of Superior Agricultural Sector Commodities to Increase Economic Growth in Sumenep District. In Proceedings of the 7th International Conference on Food and Agriculture (ICoFA 2024), Banyuangi, Indonesia, 12 October 2025. [Google Scholar]
  12. Wirawan, S.S.; Setiapraja, H.; Mokhtar; Sugiyono, A.; Ibadurrohman, I.A.; Dian Nitamiwati, N.P.; Solikhah, M.D. Assessing the Readiness to Implement Bioethanol-Blended Fuel in Indonesia. Biomass Bioenergy 2025, 201, 108112. [Google Scholar] [CrossRef]
  13. Kazmi, A.; Sultana, T.; Ali, A.; Nijabat, A.; Li, G.; Hou, H. Innovations in Bioethanol Production: A Comprehensive Review of Feedstock Generations and Technology Advances. Energy Strategy Rev. 2025, 57, 101634. [Google Scholar] [CrossRef]
  14. Boly, M.; Sanou, A. Biofuels and Food Security: Evidence from Indonesia and Mexico. Energy Policy 2022, 163, 112834. [Google Scholar] [CrossRef]
  15. Kim, S.; Choi, Y.; Kim, S. Simulation Modeling in Supply Chain Management Research of Ethanol: A Review. Energies 2023, 16, 7249. [Google Scholar] [CrossRef]
  16. Zaimes, G.G.; Vora, N.; Chopra, S.S.; Landis, A.E.; Khanna, V. Design of Sustainable Biofuel Processes and Supply Chains: Challenges and Opportunities. Processes 2015, 3, 634–663. [Google Scholar] [CrossRef]
  17. Fansuri, H.; Purwandari, U.; Putra, S.; Adhiksana, A.; Junianto, I.D.; Oktavian, R.; Cordiner, J. A Review of the Technological Aspects and Process Optimization of Bioethanol Production from Corn Stover Biomass: Pretreatment Process, Hydrolysis, Fermentation, Purification Process, and Future Perspective. Environ. Qual. Manag. 2024, 34, e22336. [Google Scholar] [CrossRef]
  18. Correia, B.; Matos, H.A.; Lopes, T.F.; Marques, S.; Gírio, F. Sustainability Assessment of 2G Bioethanol Production from Residual Lignocellulosic Biomass. Processes 2024, 12, 987. [Google Scholar] [CrossRef]
  19. Adasme, P.; Viveros, A.; Dehghan Firoozabadi, A. Quadratic P-Median Problem: A Bender’s Decomposition and a Meta-Heuristic Local-Based Approach. Symmetry 2024, 16, 1114. [Google Scholar] [CrossRef]
  20. Pérez-Mesa, J.C.; Serrano-Arcos, M.M.; Jiménez-Guerrero, J.F.; Sánchez-Fernández, R. Addressing the Location Problem of a Perishables Redistribution Center in the Middle of Europe. Foods 2021, 10, 1091. [Google Scholar] [CrossRef]
  21. Dogaru, D.; Petrisor, A.-I.; Angearu, C.-V.; Lupu, L.; Bălteanu, D. Land Governance and Fragmentation Patterns of Agricultural Land Use in Southern Romania during 1990–2020. Land 2024, 13, 1084. [Google Scholar] [CrossRef]
  22. Rarun, G.B.; Kathiandagho, T.M.; Laoh, O.E. The Effect of Subsided Fertilizer Use and Land Area on The Total Corn Production in Watutambo Dua Village, Kauditan District. J. Agribus. Rural. Dev. 2023, 5, 22–32. [Google Scholar] [CrossRef]
  23. Rangaiah, K.M.; Nagaraju, B.; Kasturappa, G.; Nagendrachari, A.N.; Kadappa, B.P.; Narayanaswamy, U.K.S.; Sab, M.S.H.; Veerabadraiah, G.G.; Srivastava, S.; Dey, P. Inductive Cum Targeted Yield Model-Based Integrated Fertilizer Prescription for Sweet Corn (Zea mays L. Saccharata) on Alfisols of Southern India. PLoS ONE 2024, 19, e0307168. [Google Scholar] [CrossRef]
  24. Imani, R.; Samdeliri, M.; Mirkalaei, A.M. The Effect of Different Tillage Methods and Nitrogen Chemical Fertilizer on Quantitative and Qualitative Characteristics of Corn. Int. J. Anal. Chem. 2022, 2022, 7550079. [Google Scholar] [CrossRef] [PubMed]
  25. Kaya, E.; Putinella, J.A.; Puturuhu, F. The Soil Available P, Plant P Uptake, Growth, and Yield of Corn in Regosol Soil Treated with Ela Sago Compost and SP-36 Fertilizer. J. Trop. Soils 2024, 30, 1–8. [Google Scholar] [CrossRef]
  26. Sofyan, E.T.; Sara, D.S.; Agistin, A. The Effect of Granular KCl Fertilizer Dosage on K-Available, K-Uptake, and Yield of Sweet Corn (Zea mays Saccharata Sturt.) in Inceptisol from Jatinangor. J. Agric. Ecol. Res. Int. 2023, 24, 9–17. [Google Scholar] [CrossRef]
  27. Musa, Y.; Bdr, M.F.; Iswoyo, H.; Adzima, A.F.; Zaesar, N.Q.; Larasati, A. Growth and Production of Several Corn Varieties at Various NPK Fertilizer Dosages. Agrotech J. 2022, 7, 121–127. [Google Scholar] [CrossRef]
  28. Moğol Sever, M. Service Supply Chain Management (SSCM) in an Old Town of Mardin: Service Routing. J. Int. Lingual Soc. Educ. Sci. 2024, 10, 92–101. [Google Scholar] [CrossRef]
  29. Tian, S.; Luo, J. Enhancing International Logistics and Supply Chain Management: Deep Learning Strategies for Enhanced Route Planning and Warehouse Optimization. J. Mach. Comput. 2024, 4, 943–952. [Google Scholar] [CrossRef]
  30. Brintrup, A.; Kosasih, E.; Schaffer, P.; Zheng, G.; Demirel, G.; MacCarthy, B.L. Digital Supply Chain Surveillance Using Artificial Intelligence: Definitions, Opportunities and Risks. Int. J. Prod. Res. 2024, 62, 4674–4695. [Google Scholar] [CrossRef]
  31. Momena, A.F.; Gazi, K.H.; Rahaman, M.; Sobczak, A.; Salahshour, S.; Mondal, S.P.; Ghosh, A. Ranking and Challenges of Supply Chain Companies Using MCDM Methodology. Logistics 2024, 8, 87. [Google Scholar] [CrossRef]
  32. Khedr, A.M.; Sheeja, S.R. Enhancing Supply Chain Management with Deep Learning and Machine Learning Techniques: A Review. J. Open Innov. Technol. Mark. Complex. 2024, 10, 100379. [Google Scholar] [CrossRef]
  33. Sibuea, F.; Sibuea, M.H.D.; Rahman, A.; Hartanto, A. Supply Chain Performance Analysis of Corn Processed Animal Feed. Habitat 2023, 34, 203–212. [Google Scholar] [CrossRef]
  34. Reyana, A.; Kautish, S. Chapter Eight—Machine Learning Techniques for Route Optimizations and Logistics Management Description. In Computational Intelligence Techniques for Sustainable Supply Chain Management; Paul, S.K., Kautish, S., Eds.; Academic Press: London, UK, 2024; pp. 197–224. [Google Scholar]
  35. Tadić, S.; Krstić, M.; Stević, Ž.; Veljović, M. Locating Collection and Delivery Points Using the P-Median Location Problem. Logistics 2023, 7, 10. [Google Scholar] [CrossRef]
  36. Brintrup, A.; Kosasih, E.E.; MacCarthy, B.L.; Demirel, G. Chapter 22—Digital Supply Chain Surveillance: Concepts, Challenges, and Frameworks. In The Digital Supply Chain; MacCarthy, B.L., Ivanov, D., Eds.; Elsevier: Amsterdam, The Netherlands, 2022; pp. 379–396. [Google Scholar]
  37. Kinerja, M.; Rantai, M.; Jagung, P.; Lombok, D.I. Supply Chain Management Performance of Corn in East Lombok; ACADEMIA: San Francisco, CA, USA, 2015; Volume 16. [Google Scholar]
  38. Li, X.; Krivtsov, V.; Pan, C.; Nassehi, A.; Gao, R.X.; Ivanov, D. End-to-End Supply Chain Resilience Management Using Deep Learning, Survival Analysis, and Explainable Artificial Intelligence. Int. J. Prod. Res. 2025, 63, 1174–1202. [Google Scholar] [CrossRef]
  39. Aquino, Í.; Ferreira, J.; Guarnieri, P.; Silva, L. The Proposition of a Mathematical Model for the Location of Electrical and Electronic Waste Collection Points. Sustainability 2020, 13, 224. [Google Scholar] [CrossRef]
  40. Rangaiah, K.M.; Nagaraju, B.; Kasturappa, G.; Maragondanadibba Nanjundappa, S.; Sugaturu Narayanaswamy, U.K.; Srivastava, S.; Dey, P. Assessment of Fertilizer Prescription Equations, Crop and Soil Performance with Different Nutrient Management Practices for Green Gram (Vigna Radiata) in Southern India’s Alfisols. Sci. Rep. 2025, 15, 1–14. [Google Scholar] [CrossRef] [PubMed]
  41. Mulyana, E.; Rosyad, A.; Furqoni, H.; Khairullah, A.; Annas, S.; Suwarto, S. Growth and Production of Sweet Corn (Zea mays Var. Saccharata Sturt.) at Various Doses of Micro Inorganic Fertilizers (3.14% Zn–2.54% Cu). Bul. Agrohorti 2025, 13, 166–175. [Google Scholar] [CrossRef]
  42. Long, L.N.B.; Cuong, T.N.; Kim, H.-S.; You, S.-S. Sustainability and Robust Decision-Support Strategy for Multi-Echelon Supply Chain System against Disruptions. Int. J. Logist. Res. Appl. 2024, 27, 1953–1983. [Google Scholar] [CrossRef]
  43. Lim, K.Y.H.; Van Dang, L.; Chen, C.-H. Incorporating Supply and Production Digital Twins to Mitigate Demand Disruptions in Multi-Echelon Networks. Int. J. Prod. Econ. 2024, 273, 109258. [Google Scholar] [CrossRef]
  44. Boutmir, Y.; Bannari, R.; Fedouaki, F.; Bannari, A.; Touil, A. Integrated Production–Distribution Planning for Paper Manufacturing Under Fuzzy Uncertainty. Eng. Proc. 2025, 112, 66. [Google Scholar] [CrossRef]
  45. Batista, M.; Goyannes Gusmão Caiado, R.; Gonçalves Quelhas, O.L.; Brito Alves Lima, G.; Leal Filho, W.; Rocha Yparraguirre, I.T. A Framework for Sustainable and Integrated Municipal Solid Waste Management: Barriers and Critical Factors to Developing Countries. J. Clean. Prod. 2021, 312, 127516. [Google Scholar] [CrossRef]
  46. Foroozesh, N.; Karimi, B.; Mousavi, S.M. Green-Resilient Supply Chain Network Design for Perishable Products Considering Route Risk and Horizontal Collaboration under Robust Interval-Valued Type-2 Fuzzy Uncertainty: A Case Study in Food Industry. J. Environ. Manag. 2022, 307, 114470. [Google Scholar] [CrossRef]
  47. Ruan, Z.; Wang, X.; Liu, Y.; Liao, W. Chapter 3—Corn. In Integrated Processing Technologies for Food and Agricultural By-Products; Pan, Z., Zhang, R., Zicari, S., Eds.; Academic Press: London, UK, 2019; pp. 59–72. [Google Scholar]
  48. Muazu, M.; Rabi’u, I.; Issa, S.B. Biofuels for Sustainable Development in Nigeria: A Review. UMYU J. Microbiol. Res. (UJMR) 2020, 5, 86–92. [Google Scholar] [CrossRef]
  49. Elaine Trisna, T.; Jai, J.; Shirleen, D.; Matthew, R. A Review on Bioethanol Production through the Valorization of Food Waste in Indonesia. Indones. J. Life Sci. 2022, 4, 60–86. [Google Scholar] [CrossRef]
  50. Akdemir, Ş.; Miassi, Y.E.; Ismailla, I.S.; Dossa, K.F.; Oussou, K.F.; Zannou, O. Corn Production and Processing into Ethanol in Turkey: An Analysis of the Performance of Irrigation Systems at Different Altitudes on Energy Use and Production Costs. J. Agric. Food Res. 2023, 14, 100740. [Google Scholar] [CrossRef]
  51. Yin, T.; Huhe, T.; Li, X.; Wang, Q.; Lei, T.; Zhou, Z. Research on Life Cycle Assessment and Performance Comparison of Bioethanol Production from Various Biomass Feedstocks. Sustainability 2024, 16, 1788. [Google Scholar] [CrossRef]
  52. Gajewski, M.; Wyrąbkiewicz, S.; Kaszkowiak, J. Effects of Ethanol–Gasoline Blends on the Performance and Emissions of a Vehicle Spark-Ignition Engine. Energies 2025, 18, 3466. [Google Scholar] [CrossRef]
  53. Gupta, S.; Kanchan, S.; Kaur, R.; Sandhu, S.S. Investigation of Performance and Emission Characteristics Using Ethanol-Blended Gasoline Fuel as a Flex-Fuel in Two-Wheeler Vehicle Mounted on a Chassis Dynamometer. Clean Energy 2024, 8, 174–193. [Google Scholar] [CrossRef]
  54. Doliente, S.S.; Narayan, A.; Tapia, J.F.D.; Samsatli, N.J.; Zhao, Y.; Samsatli, S. Bio-Aviation Fuel: A Comprehensive Review and Analysis of the Supply Chain Components. Front. Energy Res. 2020, 8, 110. [Google Scholar] [CrossRef]
  55. Qorri, D.; Felföldi, J. Research Trends in Agricultural Marketing Cooperatives: A Bibliometric Review. Agriculture 2024, 14, 199. [Google Scholar] [CrossRef]
  56. Panoutsou, C.; Chiaramonti, D. Socio-Economic Opportunities from Miscanthus Cultivation in Marginal Land for Bioenergy. Energies 2020, 13, 2741. [Google Scholar] [CrossRef]
  57. Seuring, S.; Aman, S.; Hettiarachchi, B.D.; de Lima, F.A.; Schilling, L.; Sudusinghe, J.I. Reflecting on Theory Development in Sustainable Supply Chain Management. Clean. Logist. Supply Chain. 2022, 3, 100016. [Google Scholar] [CrossRef]
  58. Koh, S.C.L.; Jia, F.; Gong, Y.; Zheng, X.; Dolgui, A. Achieving Carbon Neutrality via Supply Chain Management: Position Paper and Editorial for IJPR Special Issue. Int. J. Prod. Res. 2023, 61, 6081–6092. [Google Scholar] [CrossRef]
Figure 1. Visualization of distribution of farmer groups in Sumenep district.
Sustainability 18 04534 g001
Figure 2. Distribution of seed breeders in Sumenep district.
Sustainability 18 04534 g002
Figure 3. Distribution of subsidized fertilizer stores in Sumenep district.
Sustainability 18 04534 g003
Figure 4. Location of agricultural warehouses in Sumenep.
Sustainability 18 04534 g004
Figure 5. Result of clustering using p-median for farmer groups visualization.
Sustainability 18 04534 g005
Figure 6. Visualization of supply chain network from seed breeder to farmer group clusters in Sumenep.
Sustainability 18 04534 g006
Figure 7. Visualization of supply chain network from farmer group clusters to corn storage warehouses in Sumenep.
Sustainability 18 04534 g007
Table 1. Equation symbol and description on this study.
SymbolDescriptionSymbolDescription
iIndex for identifying seed breedersTDSikNumber of seeds shipped from seed breeder i to farmer group k
jIndex for identifying fertilizer shopbpikCost of shipping corn seed raw materials from seed producer i to farmer group k
kIndex for identifying farmer group dikDemand for corn seeds in farmer group k
cIndex for identifying agricultural warehouseKapiMaximum vehicle capacity for transporting seeds
nTotal of farmer group pointsbtpik Fixed shipping cost from breeder i to farmer group k
xij1 if point i is a member of cluster point j; 0 for othersTDSikNumber of seeds shipped from seed producer i to farmer group k
iConstrain for every farmer groupTDSikNumber of seeds shipped from seed producer i to farmer group k
jConstrain for every candidate collection centerbpjkShipping cost of fertilizer raw materials from fertilizer store j to farmer group k
dijDistance between points i and jbtpkcFixed shipping cost from farmer group k to c agricultural warehouse
i , j The constraint must hold for every farmer group i and every potential fertilizer shop j bpikShipping cost of corn seed raw materials from seed producer i to farmer group k
pDemand of clusters∀i∀k The summation over all constrains values of i will set to all constrain of k
yj1 if the cluster point is located at point j; 0 for others
Table 2. Data on subsidized seed breeders in Sumenep Regency.
CodeFarmer GroupCapacityCodeFarmer GroupCapacity
B1Sumber Jaya Patean Selatan8,876,000 B22Sumber Rejeki700,000
B2Wiraraja7,800,000 B23KWT. Sari Jaya7,526,000
B3KWT. Torikul Hidayah6,853,000 B24Campaka Putih12,000,000
B4KWT. Melati8,575,000 B25Empat Saudara3,000,000
B5KWT. Sumber Rejeki7,500,000 B26Sumber Sejahtera18,995,000
B6Madu Sari3,000,000 B27Jampareng8,500,000
B7Makmur Jaya 19,800,000 B28Cahaya7,200,000
B8KWT. Sumber Madu8,073,000 B29Timur Jaya9,000,000
B9Tambak Sari4,726,000 B30Fatahillah8,186,000
B10Remaja Harapan6,000,000 B31Jaya Abadi2,000,000
B11Suka Maju Babbalan5,850,000 B32Suka Maju22,046,000
B12Al-Faqiyah5,800,000 B33Kompak Barokah8,806,000
B13Darma Tani Iii11,927,000 B34Al-Amin13,208,000
B14Sumber Kebun7,857,000 B35Tunas Jaya3,000,000
B15Tani Barokah Poreh5,774,000 B36Al-Huda6,850,000
B16KWT. Nurul Hidayah Ii1,000,000 B37KWT. Mawar Indah270,000
B17Remaja Harapan9,958,000 B38Semi Agung7,144,000
B18Sumber Hasil8,804,000 B39Sindi Mas7,265,000
B19Meranggi Jaya8,200,000 B40KWT. Al-Hikam6,500,000
B20KWT. Pasra5,800,000 B41Al-Faidzin8,500,000
B21Jaya Kusuma14,980,000 B42KWT. Megah7,053,000
Table 3. Data on subsidized fertilizer in Sumenep Regency.
CodeFarmer GroupCapacity (ton)CodeFarmer GroupCapacity
(ton)
A1CV. DI Chandra Sumekar930A15CV. Gaya Masa1780
A2Koperasi Nurul Hikmah790A16CV. Rahman BersaUDara840
A3CV. Makmur Sejahtera720A17UD. Citra Tani1090
A4CV. Muara830A18UD. Utama BersaUDara1690
A5CV. Tani Makmur710A19Koperasi Rukun Tani870
A6UD. Tani Murni1420A20UD. Wahana Usaha Lancar5820
A7UD. Sugesti410A21UD. Yosomulyo Jajag950
A8CV.Marta Indah Jaya1140A22UD. Garuda Berlian Kencana370
A9CV. Gaya Masa530A23CV. Sumber Hidup1820
A10CV. Asa Perkasa550A24UD. Yosomulyo Jajag370
A11CV. Adi Chandra Sumekar700A25UD. Bahtera Kurnia Abadi520
A12UD. Utama Bersaudara1270A26CV. Bumi Teduh Bersinar780
A13UD. Usaha Tani760A27UD. Dwi Rejeki1130
A14UD. Puskud Jatim750A28Koperasi Surya Alam Raya920
Table 4. Data on corn storage warehouses in Sumenep district.
CodeName of WarehouseCapacity (ton)
C1KMD1,500,000
C2PT PN XI Patean3,500,000
C3PT PN XI Guluk Guluk3,500,000
C4KUD POJUR2,200,000
C5HZA1,800,000
Table 5. Distance matrix of farmer groups.
FGN12387121197274292293321345382383384385
10.01.61.715.32.75.241.615.614.927.214.644.237.632.236.9
24.40.07.823.47.19.646.020.019.331.619.053.546.939.446.2
31.71.70.015.93.35.819.311.19.727.815.244.838.237.837.6
40.31.91.515.02.45.018.710.79.226.924.344.037.332.036.7
51.72.81.315.93.35.819.511.49.927.815.244.838.226.737.5
64.10.91.222.56.89.319.511.29.831.318.752.646.038.545.3
76.26.810.426.013.211.418.99.69.033.420.856.149.542.048.8
86.37.08.027.59.011.518.89.48.933.520.957.550.943.350.2
95.86.59.018.96.58.917.78.47.831.418.847.941.335.940.6
105.25.96.920.47.910.418.08.78.232.419.857.550.943.450.2
116.97.411.126.79.612.118.39.18.434.121.556.750.142.749.5
126.57.110.726.39.211.718.69.48.733.721.156.449.842.349.1
135.78.99.324.918.214.619.610.39.736.624.055.048.440.947.7
1411.59.810.315.313.115.619.910.510.037.625.055.949.341.948.7
1510.18.48.923.411.714.220.311.010.436.223.654.547.940.547.2
1610.79.09.415.92.714.820.110.810.336.719.655.148.541.047.8
7434.835.934.517.129.327.238.136.035.227.928.418.311.64.211.0
7528.536.429.114.426.624.535.233.332.525.125.616.610.04.69.4
7630.740.031.316.628.826.737.435.534.727.327.814.78.15.67.4
7730.740.031.316.628.826.737.435.534.727.327.814.78.15.67.4
7828.536.329.114.426.524.535.233.332.525.025.517.110.55.19.9
7923.930.524.59.822.019.935.428.727.924.424.923.516.911.516.2
8024.230.824.810.122.220.235.628.928.224.625.123.717.111.716.4
8125.432.726.011.323.421.433.730.229.422.823.221.815.29.314.5
8225.333.125.911.223.221.333.630.129.322.723.121.715.19.714.4
8326.733.227.312.624.822.735.031.530.724.124.523.116.510.115.8
27441.646.042.242.039.615.40.022.324.515.326.050.944.338.943.6
29210.710.811.116.010.08.59.70.02.59.48.439.635.430.034.5
2939.19.49.713.58.16.49.92.50.08.46.237.233.027.532.1
38039.348.539.925.232.132.136.237.835.431.729.52.02.98.03.7
38132.341.632.918.225.925.830.031.329.025.423.08.34.22.23.4
38244.253.544.812.634.034.137.739.637.233.331.30.04.310.05.2
38332.246.938.223.530.130.033.535.433.029.027.04.30.06.20.9
38432.239.437.818.124.124.129.230.027.524.521.710.06.20.05.4
38536.946.237.622.929.229.132.634.532.128.126.15.20.95.40.0
Table 6. Results of clustered farmer groups in MATLAB using p-median.
ClusterColorFarmer Group MemberCorn Production (ton)
1 Asam Manis, Bukit Tandus, Bunga Desa, Bunga Melati, Guwa Mandalia, Karang Pandan180,267.5
2 Tani Jaya, Miftahul Jannah, Makmur Sejati, KWT. Arrahman I, KWT. Sekar Arum, Mekar Sari Ellak Daya, Mekar Sejati, Harapan Maju, Bahagia Ellak Daya, Albarokah Ii, Pajer Laggu, Pasra Pojur, Al-Mubarok, Tani Subur Ellak Daya, Abdika, Mathlubi, Hosnul Hotimah, Jambu Setia, Al-Mawaddah Jambu, Intani, Cinta Damai, Sumber Makmur, Mutiara Tani, KWT. Babussalam, Pesona, Campaka Putih, Al-Fallah, KWT. Cempaka Putih, Al–Jalali, KWT. Jati Emas, Putra Madura, Jampareng, Putra Kemala, KWT. Bintang Sembilan, Citra Pemuda599,611
3 Empat Saudara, Nurul Rahaman, Nurul Huda, KWT. Sumber Rejeki, Bangsoka, Fatahillah, Putra Madura, Sumber Makmur, Suka Tani, Hasil Bumi, Baiturrahman, Al-Amin, Rahdatul Ihsan, Al-Rohim, KWT. Murah Rejeki, Subur Rejeki, Al-Amhar I, Al-Azhar Ii, Sejati, KWT. Al-Muntaha, As–Sijar, Sinar Makmur, Al–Ikhwan, Sumber Urip, Karang Anom, Bunga Mawar, KWT. Arrohmah, Sumber Mas, Sumber Barokah, Sakinah, KWT. Sinar Barokah, Bunga Nusa Indah. KWT. Bintang Sari, Al-Amhar1,113,646
4 KWT. Nurul Qomariyah Giring, Pisang Emas, KWT. Al-Hikam, KWT. Al-Kautshar, KWT. Putri Muslimah, Sabilul Muttaqin
Al Mujahid, KWT. Al Hikmah, Sumber Pajung, Nurul Hidayah, Al Hidayah, Sumber Ombak, Sumber Makmur, Al-Faidzin, KWT. Sumber Bening, Sumber Agung, KWT. Nor Hikmah
534,964
5 KWT. Bunga Tani, KWT. Rahayu Indah Meranggi Jaya, KWT. Bunga Teratai, Sumber Bahagia, Harapan Indah, KWT. Pasra, Bima Sejahtera, Bina Karya, Cahaya Tani, Jaya Kusuma, KWT. Juwar Sari, Ar Rohmah, Bunga Sumekar 2, Halilintar, Indah Jaya Tanjung, Karunia Alam, Karya Usaha, KWT. Sari Jaya, KWT. Tanjung Sari, Sekar Wangi, Bumi Rahayu, KWT. Puspita Mitra, Sumber Hikmah, Sumur Razim, Sumber Taman, Sumber Usaha, Makmur Jaya, Karya Bersama, Rukun Muda II, KWT. Sumber Cemara, Maju Jaya, Sumber Hasil, Tunas Sampurna, KWT. Sumber Madu792,070.3
6 Kwt. Madu Muda, Kwt. Ar Rosyidin Langgundi Barat, Kwt. Melati Putih Lembung Timur, Miftahul Huda, Kwt. An Nisa, Al-Faqiyah, Bunga Melati, Al-Hamida, Al-Barokah, Kwt. An-Nur, Bunga Harapan, Ellak Laok, Kwt. Ar-Rohmah, Makmur Jaya, Sumber Baru Ellak Laok, Sangkuriang, Kwt. Sumber Hasil Desa Lembung Timur, Margo Rukun Moncek Tengah, Prima Desa, Al-Ifroh
Kwt. Dian Muslimah, Kwt. Al-Khoiriyah, Ar-Rahman Sendir, Karya Makmur, Kwt. Nurul Hidayah II, Suka Maju Moncek Tengah, Awan Tawar, Kwt. Al-Harra, Cendana Bangsa, Arjuna Moncek Tengah, Darul Amin Poreh Tengah, Kwt. Kenanga, Subur Moncek Tengah
454,171
7 Babul Rizqi, Al-Barokah, Dirgahayu, Sumber Jaya, Sumber Sejahtera, KWT. Darul Ulum, Untung Jaya, Al–Ikhlas, KWT. Surya Dharma, Remaja Tani, KWT. Srikandi, Timur Jaya, Den Timur, Sempong Makmur, KWT. Bunga Melati, Magar Sare, Suka Maju, Sinar Barokah, Berkat Mufakat, Sumber Rejeki, Suka Lancar
Kompak Barokah, Subur Makmur, Sumber Raya, Baru Muncul, Nurul Hikmah II, Al–Huda, Calming, Subur Jaya, KWT. Mukarromah
574,343
8 Mekkar Melati, Bunga Mawar, Putra Bahari, Wiraraja, Nurul Jadid, Bumi Sumekar, Suka Maju, Al-Ijtima, Dempa Abang, Karya Bhakti, Pertani, Putra Cahaya, Remaja Harapan, Sinar Bumi Putra, Suka Subur, Sumber Barokah, Sumber Hasil, Jaya Abadi, KWT. Melati, Cinta Damai, Harapan Indah, KWT. Sari Bunga, Makmur Jaya, Sumber Rejeki, Sumber Tani, Surya Tani, Usaha Jaya, Mahkota Jaya, Sari Subur, KWT. Sumber Jaya, KWT. Matahari Berseri728,607.5
9 KWT. Putri Barakas, KWT. Putri Lenteng, Tunas Jaya, KWT. Karya Utama, Bunga Harapan, KWT. Az–Zahroh, Haromain, Panca Usaha
Sumber Bumi, Al–Fatah, Surya Tani Bunbarat, Batu Kencana, KWT. Nurus Shobah, Al-Hidayah, Adi Rasa, Al Jihad, Anugerah, KWT. Putri Barokah, Sumber Rizki
304,749
10 Nurul Huda, Purnama, Al–Zahra, Tata Usaha, Cahaya, Berlian, Lembah Bukit, Jaya Abadi, Mekar Abadi, Sumber Mekar, KWT. Jokotole, Sari Bumi, Jaya Abadi, Sumber Bakonan524,874
11 Prima Sakti, Putra Cahaya, Remaja Harapan, Sinar Bumi Putra, Suka Subur, Semi Agung, Sumber Tani, Kalabang, Aman Jaya, Subur Jaya, Sakera Jaya, Lor Polor, Putra Mahkota, Kenanga II, Kuda Terbang, Al Mustofa418,226.5
12 KWT. Melati, Aeng Telor, Garuda Putih, Bunga Mbung, Al-Bubarok, KWT. Srikandi, Tembakau Indah, KWT. As-Syifa’, Asshobar, KWT. Sumber Rejeki, Ar–Rohman, KWT. Al-Hidayah, Sinar Pusaka, Zakila
Madu Sari, Mega Jaya, Sejahtera, Sumber Hasil, Al-Firdaus, KWT. Sumber Madu, KWT. Tunjung Biru, Sinar Utama, Sumber Sari, Ikhtisar, KWT. Bunga Seroja, Sumber Barokah, Makmur Tani, Sumber Urip, Rukun Muda, Tambak Sari
700,697.2
13 KWT. Mekar Sari, KWT. Melati, Sumber Jaya Patean Selatan, Rizqi Indah, KWT. Mawar Merah, Bina Karya II, KWT Flamboyan
Sumber Kebun
Suramadu, Gema Tani Jaya, Sumber Usaha I, Tani Maju I, Karya Daleman, Nurul Hikmah, Tani Barokah Poreh, KWT Putri Kano’, Sinar Dunia, KWT Nurul Amin Ii Poreh Tengah, Karya Makmur, Palapa, Risqi Indah Solok Barat, Kramat, Inayah I, KWT. Sakinah, Lestari, Pancoran Mas, Sumber Barokah, Sumber Harapan, Berkat Usaha, Sumber Rejeki, Sumber Urip
587,871
14 KWT. Karya Bersatu Torbang, Karya Usaha Tani, Sumber Jaya Dusun Toros, Suka Maju Babbalan, Barokah, KWT. Larasati, KWT. Nurul Hasanah, Assasul Muttaqin, KWT. Hidayah, Gotong Royong, KWT. Al Maslahah, Rampak Naong, KWT. Mawar Indah, KWT. Al–Hidayah, Al-Mu’in, Pandawa Lima, KWT. Drupadi, Sindi Mas356,492
15 KWT. Al Hikmah, Sumber Pajung, Nurul Hidayah, Al Hidayah, KWT. Torikul Hidayah, Hasil Murni, KWT. Nurussibyan, Al-Qomar, Harapan Jaya, Sumber Jaya, Bunga Melati, Moga Jaya, Arjuna, KWT. Arjuna, Dewi Fortuna, Harapan Jaya, Karya Mandiri, KWT. Karya Abadi, Makmur Jaya 1, Putra Harapan, Tunas Karya, Karya Buana, Nurul Hidayah Banaresep Timur, Darma Tani Iii, Mulya Tani, Al–Ikhlas, KWT. Al-Mawadah, Nurul Yaqin, Al-Barokah Moncek Timur, Siding Purih Al-Faizin Desa Poreh, Sinar Baru605,324.5
Color on this table refer to clustered farmer group it visualized in Figure 5.
Table 7. Results of calculation of supply chain network from farmer group 11 to corn storage warehouse using MATLAB.
Farmer GroupCorn
Production (ton)
Distance (km)Supply (ton)
C1C5C1C5
7439623.676.733960
7535521.613.343550
7630823.815.073080
7754423.955.415440
7838521.152.883850
35495216.289.559520
35538917.716.423890
35664118.834.406410
35745016.676.6641931
358173320.700.5001733
35951521.100.660515
36033824.444.060338
36132523.703.360325
36431921.752.350319
38130225.966.320302
38441824.966.550418
Disclaimer/Publisher’s Note: The statements, opinions and data contained in all publications are solely those of the individual author(s) and contributor(s) and not of MDPI and/or the editor(s). MDPI and/or the editor(s) disclaim responsibility for any injury to people or property resulting from any ideas, methods, instructions or products referred to in the content.