1. Introduction
One of the most common tools for governments is the environmental policy stringency (EPS) index developed by the OECD to monitor environmental quality changes. The EPS indicator is a composite index. The index is obtained by collecting information on specific environmental policy instruments related primarily to climate and air pollution. This indicator focuses on upstream sectors such as energy and transportation because these sectors, which have similar importance among countries, are also of primary importance from an environmental perspective. Within this framework, strict environmental rules and regulations mainly rely on environmental taxes, renewable energy, and support for energy efficiency [
1].
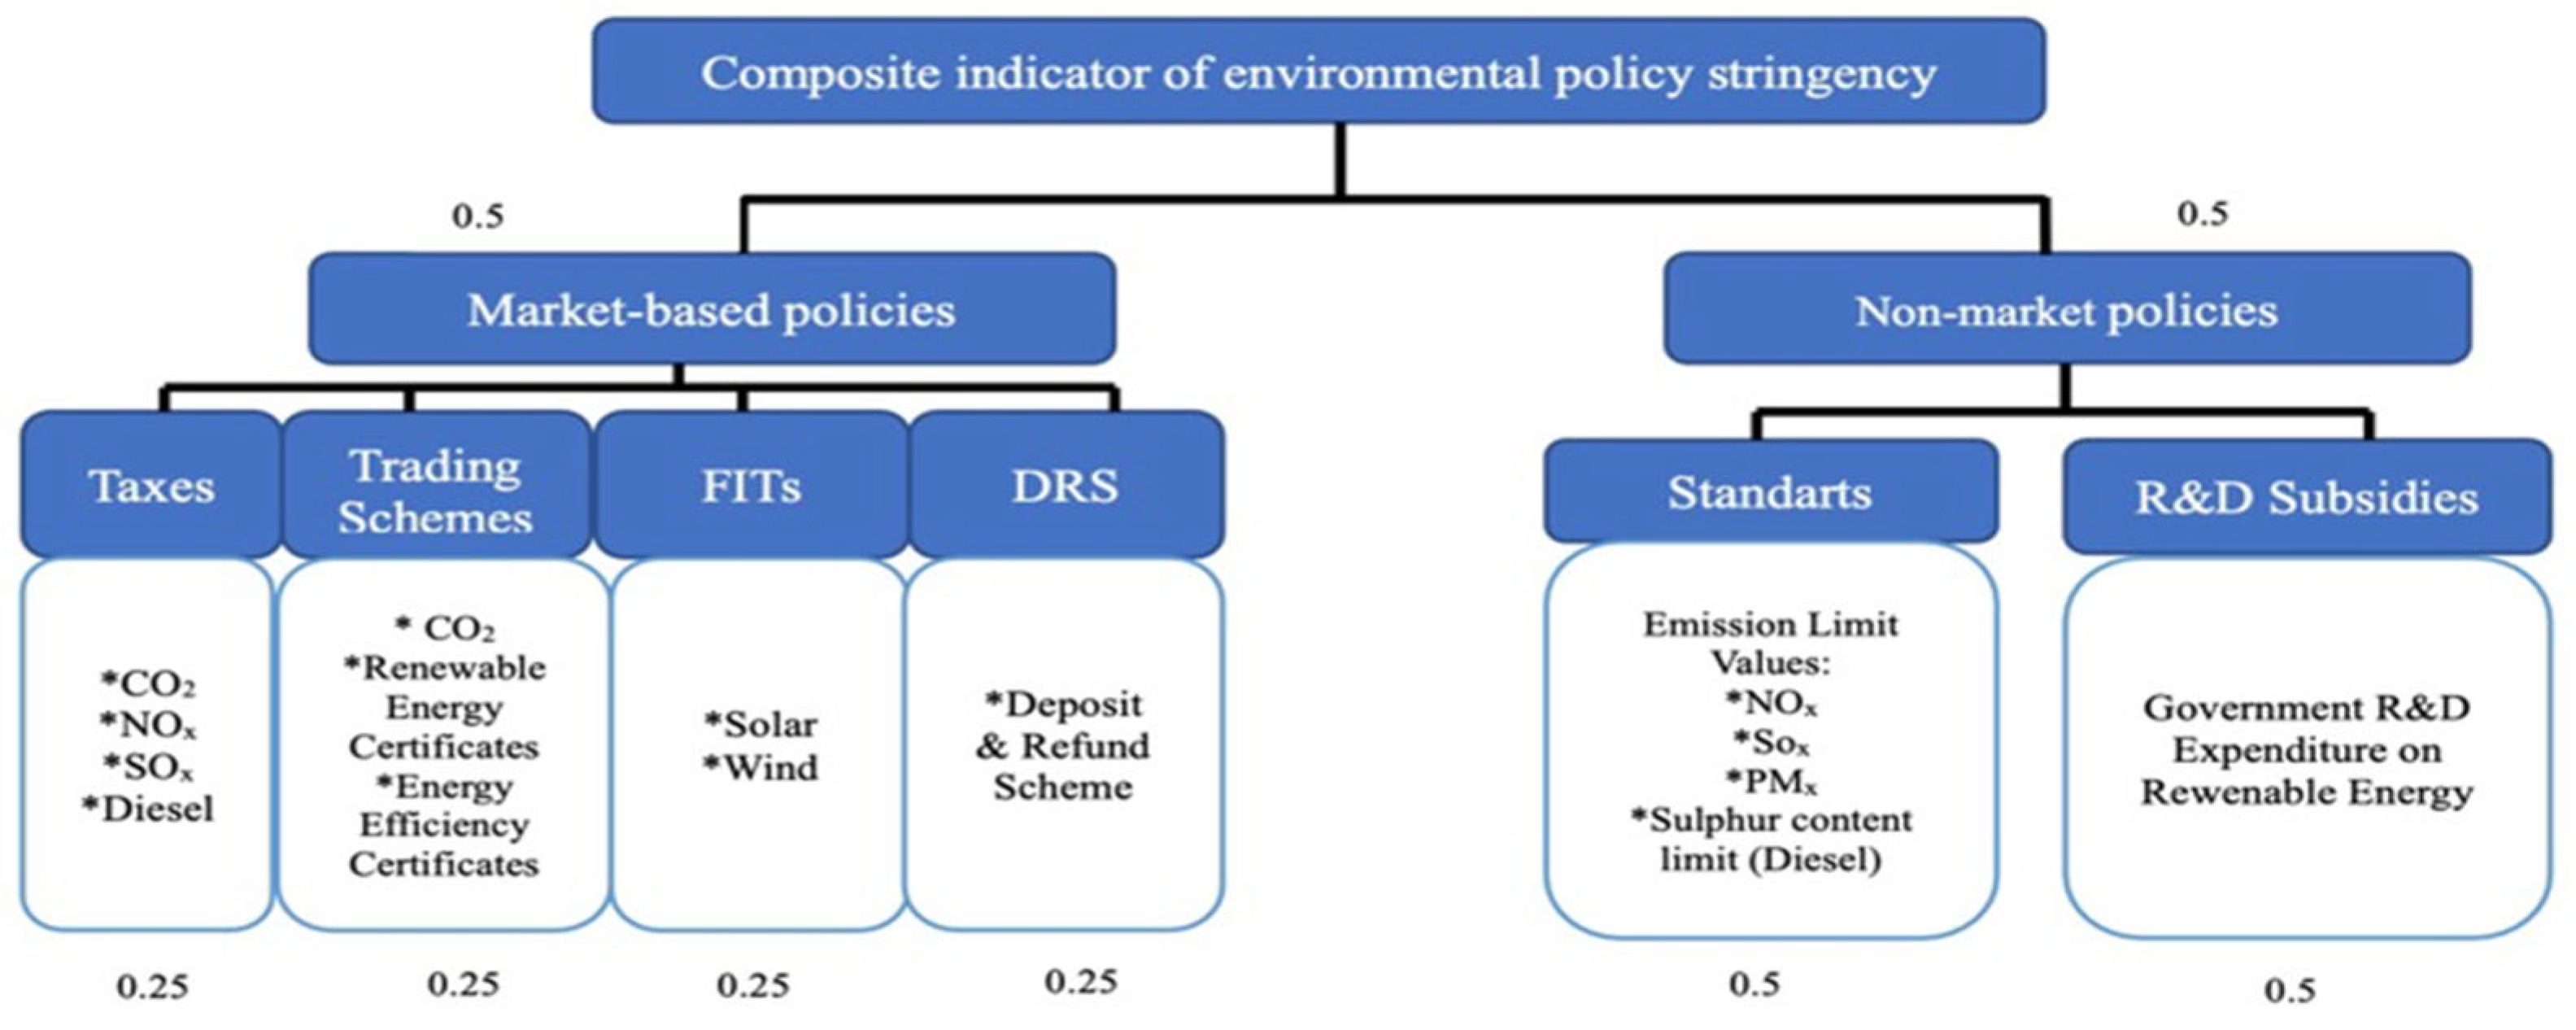
Figure 1 shows the components that generate the environmental policy stringency index. The aggregation procedure for both energy and broader indicators follows two steps. First, instrument-specific indicators (e.g., taxes on SOx, NOx, and CO
2) are combined into mid-level indicators by type (e.g., environmental taxes). Second, these are grouped into market-based and non-market instruments. Subcomponents can also be aggregated into “stick” (penalizing) and “carrot” (rewarding) policies. At each level of aggregation, equal weights are applied [
2]. The EPS index takes a value between 0 and 6. Policies become stricter from 0 to 6.
The structure of the EPS index indicates that CO
2 emissions contribute as a variable in taxation and trading plans. Therefore, the variation in CO
2 emissions could be directly related to the stringency and effectiveness of environmental policies. Monitoring and analyzing these emissions are critical in determining whether environmental policies are successfully implemented and affect the evaluation of EPS. While the common wisdom is that stringent environmental policies lead to a decrease in CO
2 emissions, inadequate policies can also result in augmenting emissions. It should be noted that reducing CO
2 emissions does not solely depend on the policies’ success but also on a well-operated implementation. Thus, a legally stringent environmental policy requires support from the implementation stage [
3].
In environmental policies, the most common issue that has been stressed is the reduction of fueling carbon emissions. A milestone policy document, The Paris Climate Agreement, was signed by 197 countries in 2015 as a precautionary or proactive policy paper addressing the global climate crisis. Through the agreement, governments have willingly made novel domestic regulations regarding carbon emissions in line with the targets specified in the agreement. The anticipated impact of those regulations is pioneering the enhancement of environmental quality, especially in reducing CO2 emissions.
Reducing carbon emissions not only improves countries’ environmental quality but is also crucial for economic growth and development. Governments have the opportunity to strike an optimal balance between economic growth, development, and carbon emissions. The Paris Climate Agreement supports determining this balance based on each country’s priorities and characteristics [
4]. The expectations from the Paris Agreement’s regulations indeed caught the attention of researchers worldwide, which led to the rising numbers of studies on CO
2 emissions and EPS. However, few studies investigate whether there is a relationship between CO
2 emissions and the stringency of environmental policies. Ref. [
5] contributes to this scarce literature by examining the asymmetric causality between CO
2 and EPS. However, their sample covering the top five carbon emission producer countries provides limited results in this global case. There is also other research that focuses on analyzing the symmetric relationship between the stringency of environmental policies and CO
2. In this strand of the literature, there are few studies covering OECD countries in their data [
6,
7,
8,
9,
10]. The vast majority of the current research [
11,
12,
13], however, primarily considers China due to its high carbon emissions levels.
This study, with its sample spanning numerous countries, directly contributes to overcoming the generalizability problem encountered in previous studies with limited sample sizes. Furthermore, this study’s asymmetry aspect contributes to the global EPS literature. Specifically, OECD data show that EPS has increased over time in many countries and that differences persist across countries. Therefore, the policy–emission relationship may not respond in the same way to both negative and positive shocks. Consequently, examining positive and negative shocks separately strengthens the methodological approach to uncovering hidden relationships emphasized in the literature.
This research investigates whether there is causality between CO2 and EPS in OECD countries. In this respect, our research’s main motivation point is that we identify a gap in the literature regarding the global impact of environmental degradation and attempt to fill this gap with a new sample in our analysis. This paper attempts to contribute to the current studies by diverging itself by methodology and sample selection. Utilizing an asymmetrical analysis on a larger scale, we aim to thoroughly explain the relationship between the stringency of environmental policies and carbon emissions. The key contribution of this study lies in its combined use of both symmetric and asymmetric causality approaches. Furthermore, the Dumitrescu–Hurlin and Yılancı–Aydın tests are applied to differentiate between positive and negative shocks. This methodological approach adds depth to the analysis by revealing not only average relationships but also different effects depending on the direction of the shocks. In addition to the distinction between symmetric and asymmetric causality, the country-specific findings presented in this study enable a clearer and more comparative assessment of the heterogeneous effects of environmental policies. In these respects, this study contributes to the literature through its global scope, methodological novelty, and asymmetric analysis.
Our research investigates the period from 1991 to 2020, covering 23 OECD countries. We utilize panel causality and asymmetric causality tests in the analysis. Furthermore, we also test the positive and negative shocks of the stringency of environmental policies on CO2 emissions to improve the robustness of policy recommendations on enhanced environmental quality. Our results are twofold. On the one hand, the symmetric causality test documents a bidirectional relationship between EPS and CO2. On the other hand, the asymmetric causality test reports significant one-way causality from EPS to CO2. This impact is observed only for the USA under a negative shock. We then test the positive and negative shocks for the asymmetric causality between EPS and CO2. In this analysis, we document one-way and bidirectional causality for different countries.
2. Literature Review
While extracting the current literature, we identified that the vast majority of the studies have used the EPS index in their analysis. Yet, the overall number of studies that use EPS and CO2 as variables is limited. The findings of the studies in the literature are summarized below. The literature review suggests three strands of research. In the first group, there are studies documenting the negative impact of EPS on environmental degradation. The second group consists of reporting positive effects. The last group, however, indicates ambiguous results.
A recent study by [
14] explores the effect of the stringency of environmental policies on renewable energy consumption. In the analysis for the period covering 1990–2019 and for 32 OECD countries, they employ the GMM estimator and Driscoll–Kraay standard errors technique. The study reveals that increasing environmental policy stringency encourages renewable energy. Hence, this result could be pivotal in achieving the net-zero CO
2 emission target of OECD governments by 2050. Ref. [
15] assessed the impact of environmental policy practices on carbon emissions in the industrial sector by panel PMG and QARDL models. Considering the Eurozone, China, South Korea, Japan, the UK, and the US from 1997 to 2020, they present that the stringency of environmental policies has a significant negative impact on carbon emissions.
Ref. [
16] examined the regulatory effect of environmental policy stringency between technological innovation and CO
2 emissions using DOLS, FMOLS, CCR, and MMQR estimation approaches. The study covered the period between 1990 and 2020 and G7 countries. According to the findings, technological innovation leads to an increase in environmental quality by reducing CO
2 emissions, and the implementation of stricter environmental rules increases the positive effects of green technologies, such as using environmentally friendly technologies to achieve the carbon neutrality target.
There are also wider perspectives on research on this topic. The relationship between green innovations, imports, exports, environmental policy stringency, and consumption-based CO
2 emissions in high-income OECD economies for the period between 1990 and 2020 is analyzed by [
9] using the MMQR method. According to the findings, a one-unit increase in the stringency of environmental policies reduces CO
2 emissions by 0.32–0.39 units. Examining the asymmetric effects of stringency of environmental policies on CO
2 emissions in high-emitting countries (China, USA, India, Russia, and Japan), ref. [
5] utilizes a nonlinear panel ARDL approach using 1990–2019 data. Their results indicate that increases in the stringency of environmental policies improve environmental quality by reducing CO
2 emissions in the long run and document a one-way symmetric causality from EPS to CO
2 emissions. Regarding asymmetric panel causality, a positive shock to EPS does not affect CO
2 emissions, but CO
2 emissions cause a negative shock to EPS.
Ref. [
17] investigated the effectiveness of environmental taxes and the stringency of environmental policies in reducing CO
2 emissions. They utilized the AMG test for a panel of seven developing economies from 1994 to 2015 and documented an inverted U-shaped relationship between CO
2 emissions and the stringency of environmental policies. Indeed, they state that the stringency of environmental policies requires time to become effective. Their robustness checks by FMOLS also document the stringency of environmental policies and taxes that could effectively reduce CO
2 emissions. In another approach, ref. [
18] analyzed the long-run impact of environmental policies and human development on CO
2 emissions in Group of Seven and BRICS economies from 1995 to 2015 through panel cointegration and causality tests. The causality analysis presents a bidirectional causality between environmental tightening policies (EPS) and CO
2 emissions for Germany, Japan, the United Kingdom, and the United States and unidirectional causality from CO
2 emissions to EPS for Canada, China, and France. Furthermore, according to the cointegration analysis, both environmental tightening policies and human development have a decreasing impact on CO
2 emissions.
Widening the sample, ref. [
19] scrutinized the relationship between the stringency of environmental policy and CO
2 emissions in BRIICTS (Brazil, Russia, India, Indonesia, China, Turkey, and South Africa) from 1993 to 2014. By applying the PMG-ARDL estimator, they documented an inverted U-shaped relationship between environmental policy stringency and CO
2 emissions. The outcomes indicate that stringent ecological policy initially does not lead to environmental improvements, but stringent environmental policy still improves environmental quality after a threshold. In their PMG analysis, ref. [
8] examined the role of strict environmental regulations on environmentally friendly technological innovation, carbon emissions, GDP, exports, and imports for 20 OECD countries between 1999 and 2015. They document strict environmental policies, and imports reduce CO
2 emissions in the long run.
Accordingly, ref. [
7] utilized the fixed effects model and investigated the relationship between economic growth and environmental quality in the context of the Kuznets curve for 32 countries in the period covering 1992 and 2012. Their findings show that environmental policies are effective in reducing environmental damage associated with economic growth. Ref. [
11] conducted panel data analysis (fixed effects–random effects and OLS) using data from 35 industrial sectors in China from 2006 to 2014. Their results yield a negative relationship between environmental regulations and carbon efficiency. Their explanation relies on the argument that environmental regulations on carbon efficiency led to inconsistency and inefficiency of the measures related to the regulations.
The relationship between the EPS and CO
2 is generally negative. However, rare studies have also found a positive impact between the two variables. The research by [
10] inquired into the relationship between EPS and CO
2 using the dose–response function econometric approach for 37 OECD countries and the years 1990–2020. Their results suggest that environmental policies implemented at low levels initially increased carbon intensity, while environmental policies implemented at stricter levels reduced the amount of carbon emissions per capita. Ref. [
13] scrutinized the effects of the shadow economy and strictness of environmental policy on economic growth and energy consumption in China during the period from 1993 to 2019. Using the nonlinear ARDL approach, their outcomes yielded a boost in energy consumption despite the increase in the strictness of environmental policies. This situation was interpreted as EPS not being as effective as it should be in China, where non-renewable energy is used to a large extent. According to the asymmetric Granger causality test results, there is one-way causality from energy consumption to EPS.
The number of studies that yield inconclusive results is also limited. In their research on the USA, ref. [
20] documents that much of the reduction in air pollution (NO) emissions experienced by the country over the period between 1990 and 2008 was due to changes in environmental policies. Investigating the effects of environmental regulations on environmental performance, ref. [
12] utilized the GMM method for 283 Chinese cities from 2003 to 2010 and four different indicators for environmental quality. Their estimations show that the current environmental control measures and regulations do not achieve the goal of controlling and reducing pollution. There is also research focusing on nonlinear impacts in this matter. Ref. [
6], examining the nonlinear effects of environmental regulations and economic growth on PM2.5 in 30 OECD countries over 1998–2015, revealed an initial boost in PM2.5 emissions in line with environmental policy stringency, whereas there is no significant correlation otherwise.
4. Results
To document our results, we first perform the cross-sectional dependency, homogeneity, and unit root tests. We utilized Breusch–Pagan’s (1980) LM [
26] and Pesaran’s (2004) [
24] CD tests to check the existence of cross-sectional dependency. The Breusch–Pagan–LM test is used in cases where the unit size (N) of the panel is small and the time dimension (T) is large (N < T). Breusch–Pagan–LM test statistics are obtained by the following equation [
25]:
Pesaran developed the CD test for both the case where the unit dimension is larger than the time dimension (N > T) and the case where the time dimension is larger than the unit dimension (T > N). The equation is as follows [
24]:
The cross-sectional dependency test results are given in
Table 2. According to
Table 2, the null hypothesis is rejected since the probability value for both tests was less than 0.05 (0.000). These results allow us to state that there is cross-sectional dependency in the series. The fact that the results indicate a significant level of cross-sectional dependence is important for interpreting causality analyses. The presence of cross-sectional dependence suggests common shocks across countries (global economic developments, environmental policies, energy prices, etc.). This situation may require careful interpretation of causality test results.
In the second step, we use the homogeneity test developed by Pesaran and Yamagata (2008) [
25]. This test checks whether the slope coefficients are homogeneous or not. The Pesaran and Yamagata (2008) [
25] test is based on the Swamy (1970) [
27] homogeneity test model as an improved version. The Delta test (Δ) is calculated with the following formula [
25]:
The test results are given in
Table 3. According to the Delta test results, the H
0 hypothesis was rejected at the 1% significance level, and heterogeneity was revealed.
We then utilize the second-generation unit root test due to the cross-sectional dependency between the series. The rationale behind using the second-generation tests derives from providing more reliable and consistent results than the unit root tests to be applied with panel data. As there is cross-sectional dependency, it is more appropriate to use the second-generation unit root tests that consider the cross-sectional dependency. The CIPS statistic (Cross-sectionally Augmented Version of IPS), proposed by Pesaran (2007) [
28] and based on the test of Im, Pesaran, and Shin (2003) [
29], controls the stationarity of the cross-sectional units as a whole. The CIPS statistic is calculated using the following equation [
28]:
The test results are given in
Table 4.
Table 4 shows EPS and CO
2 as the variables for which no difference was taken; d(EPS) and d(CO
2) are the variables for which the first difference was taken. Examining the table, it is seen that both EPS and CO
2 variables are not statistically significant at the level values (constant and constant + trend below) (
p ≥ 0.10), meaning that the series contain a unit root and are not stationary. In contrast, the series for which the first differences were taken (d(EPS) and d(CO
2)) are statistically significant at the 1% significance level. This finding shows that both variables have an I(1) process, meaning they become stationary when their first differences are taken. Therefore, using series for which first differences were taken in the causality analysis yields more reliable and consistent findings.
Additionally, we first test the causality between CO
2 and EPS for 1991–2020 in 23 OECD countries utilizing the Dumitrescu and Hurlin causality test. The results are reported in
Table 5. According to the results of the analysis, we document bidirectional causality between EPS and CO
2.
After the Dumitrescu and Hurlin causality test, we investigate the causality between CO
2 and EPS with the Yılancı and Aydın asymmetric causality test. The test results are presented in
Table 6. Looking at the findings on negative shocks, only in the USA is there significant, unilateral causality from EPS to CO
2. In the other countries included in the analysis, there is no significant causal relationship between EPS and CO
2 or between CO
2 and EPS. We can express this in two ways. Firstly, when examining OECD policy documents, it is stated that the stringency of environmental policies generally increases. Therefore, the negative shock channel includes a limited number of observations in many countries. This reduces statistical power and may lead to spurious causality being detected in fewer countries. Secondly, the fact that environmental policies are mostly sticky, or in other words, permanent, suggests that this finding is consistent with the increasing stringency of environmental policies [
1]. Another notable finding in
Table 6 is specific to the USA, where there is significant unidirectional causality from EPS to CO
2. In asymmetric causality tests, significant negative shocks for the independent variable indicate that a decrease in the independent variable will affect the dependent variable. Accordingly, a decrease (relaxation) in environmental policies in the United States affects carbon emission levels—either the decrease stops or carbon emissions drop to a low level. This effect may stem from the effective implementation of environmental policies in the United States and the binding nature of environmental regulations. The United States Environmental Protection Agency (EPA) is an independent agency of the US government that addresses environmental protection issues [
30]. It is responsible for maintaining and enforcing national environmental standards under various US laws (such as the Clean Air Act). It has the authority to impose fines, sanctions, and other measures. The existence of an independent agency responsible for environmental protection, rather than relying solely on existing environmental laws in the US, contributes to the effective implementation of environmental policies. Therefore, individual and corporate behavior is sensitive to environmental policies in the United States. The fact that similar results are not obtained in other countries outside the US in our empirical findings may be due to different environmental policies adopted by those countries or the lack of sensitivity in the behavior of individuals and companies.
Later, we also tested the causality between EPS and CO
2 with positive shocks. The test results are given in
Table 7. We present bidirectional causality for Belgium, Germany, Ireland, Korea Rep., Portugal, Spain, Sweden, Switzerland, and Türkiye, whereas there is unidirectional causality for Greece, Hungary, Italy, Japan, Netherlands, and Norway. When we investigated the reverse causality from CO
2 to EPS, our outcomes presented a unidirectional relationship for Australia, Canada, France, the United Kingdom, and the United States.
5. Conclusions
This study investigates the interaction between EPS and CO2 through symmetric and asymmetric causality. First, we analyzed the symmetric causality between EPS and CO2 for 23 OECD countries for 1991–2020 by utilizing the Dumitrescu–Hurlin panel causality test. In this context, the use of both symmetric and asymmetric causality tests and the sole scrutinizing of the interaction between EPS and CO2 with positive and negative shocks distinguish our study from the current literature.
The findings of the symmetric causality test reveal that there is bidirectional causality between EPS and CO2. However, as we suspected a hidden causality, we further checked for positive and negative shocks. Therefore, in estimating an asymmetric causality test, we document the following results: According to the negative shocks of the asymmetric panel causality, there is significant one-way causality between EPS and CO2 only in the USA, although no significant causality is reported between CO2 and EPS. However, we do not report any significant causality from CO2 to EPS. This is an expected outcome. Even if carbon emissions decrease, it is not rational to expect countries to relax their environmental policies. This is because the fundamental aim of global environmental policies is not only to maintain current emission levels but also to ensure the continuous protection and improvement of all environmental factors, especially air quality.
Secondly, we tested the causality between EPS and CO2 with positive shocks. We then presented bidirectional causality for Belgium, Germany, Ireland, Korea Rep., Portugal, Spain, Sweden, Switzerland, and Türkiye, whereas the causality is unidirectional for Greece, Hungary, Italy, Japan, Netherlands, and Norway. The results of the reverse causality from CO2 to EPS yield a unidirectional relationship for Australia, Canada, France, the United Kingdom, and the USA.
We evaluated the symmetric and asymmetric results separately with other studies in the literature. Our results for the symmetric causality test are in line with the results of [
18], while they are contradictory to [
5]’s outcomes. However, in terms of asymmetric causality, as the USA is the only country affected by the negative shocks, our results are in compliance with [
5]. Yet, there are other research documented various results. While ref. [
11] found a negative relationship between environmental regulations and carbon efficiency, refs. [
12,
13] revealed that the stringency in environmental policies could be more effective.
The mutual interaction between EPS and CO
2 is a remarkable finding. Therefore, based on the empirical findings, effective implementation and tightening of environmental policies are critical in reducing CO
2 emissions. The findings of this study are directly related to SDG 13, particularly in terms of integrating climate policies into national policies and increasing resilience to climate risks. Specifically, the findings highlight the importance of reducing policy lag in countries where emissions are triggered by expanded polymer emissions, as well as increasing the reliability of policy signals in countries where EPS drives emissions. This two-pronged approach aligns with the implementation goals under SDG 13 [
31,
32]. Strict environmental policies should not be limited to legal regulations; economic incentives, awareness campaigns, and clean technology investments should also support them. In addition, using carbon capture and storage technologies in industrial facilities and power plants, encouraging the use of electric vehicles to replace fossil fuel vehicles, and increasing green bond issuances to finance environmental projects can reduce the amount of CO
2 released into the atmosphere. Finally, this study focuses only on the relationship between EPS and CO
2. Future research should focus on new variables, countries, and methods to enrich the literature and provide new policy recommendations.