Article

Springs as Natural Sensors for Sustainable Groundwater Monitoring: Bridging Hydrodynamics, Telemetry and System Constraints

by
Małgorzata Jarosz
1,2,*,
Agnieszka Operacz
2 and
Karolina Migdał
2
1
Polish Geological Institute, National Research Institute, Carpathian Branch in Cracow, 1 Skrzatów St., 31-560 Cracow, Poland
2
Department of Sanitary Engineering and Water Management, Faculty of Environmental Engineering and Land Surveying, University of Agriculture in Krakow, 21 Mickiewicza Av., 31-120 Cracow, Poland
*
Author to whom correspondence should be addressed.
Sustainability 2026, 18(9), 4293; https://doi.org/10.3390/su18094293
Submission received: 19 March 2026 / Revised: 21 April 2026 / Accepted: 23 April 2026 / Published: 26 April 2026

Abstract

Groundwater is a key strategic resource underpinning water security, and its effective management requires reliable, high-frequency monitoring data. In mountainous regions such as the flysch Carpathians in southern Poland, natural springs are particularly sensitive indicators of aquifer system dynamics. This study analyzes the role of springs in the national groundwater observation and research network and identifies barriers to the implementation of automated monitoring of spring discharge. The research covered 28 springs operating within the regional monitoring network of the Polish Geological Institute—National Research Institute in the Carpathian region. Classical hydrogeological spring classifications were applied and complemented with proprietary criteria addressing formal-legal, technical, and environmental conditions affecting the feasibility of automation. The results show that all of the analysed springs exhibited a Meinzer’s variability index (V) exceeding 100%, and numerous objects showed a coefficient of variation (CV) above 150%, providing quantitative evidence that standard weekly manual measurements statistically fail to capture rapid flow dynamics and peak discharge events. To bridge the gap between hydrodynamic observations and monitoring logistics, this study introduces a novel methodological contribution: the F-T-S-N screening framework. This proprietary, multi-criteria classification quantifies Formal-legal, Technical, Structural, and Nature-environmental barriers to telemetry implementation. The application of this framework demonstrates that the main obstacles to modernization are non-technological. The proposed classification serves as a practical, transferable tool that supports the rational planning of monitoring network automation in other mountainous regions with similar hydrogeological conditions.

1. Introduction

Groundwater constitutes a strategic freshwater resource upon which the water security of more than half of the global population depends [1]. In the era of climate instability and increasing anthropogenic pressure on water resources, groundwater has attracted growing attention in the field of water resources management due to its crucial role in sustaining water supply systems and ecosystems [2,3]. Recent studies highlight that climate change significantly affects groundwater recharge processes, evapotranspiration patterns, and hydrological extremes, thereby increasing uncertainty in the availability and long-term sustainability of groundwater resources [4,5,6].
Groundwater springs are exceptionally valuable observation and research points, often referred to as ‘natural windows’ into aquifer systems. They provide integrated information on the state of the entire recharge and discharge system, and their response to climatic and anthropogenic changes is usually faster than that of conventional observation points based on boreholes. For this reason, the monitoring of springs plays a significant role in assessing groundwater storage, forecasting the hydrogeological situation and planning rational water management.
In Central Europe, including Poland, the increasing frequency of extreme weather events—from rapid floods to prolonged droughts—poses new challenges for water resource management systems [7,8]. With the increasing frequency of extreme weather events the traditional approach to groundwater monitoring must be re-evaluated. Climate variability directly affects aquifer recharge and storage dynamics, necessitating the shift towards high-frequency monitoring. High-resolution temporal data are essential to capture rapid hydrological responses and to develop reliable predictive models for sustainable water management in a changing environment.
Across most of Europe, the structure of precipitation has changed, with a significant increase in the number of days characterized by high-intensity rainfall [9,10]. However, these changes do not alter the fact that Poland is still classified as a country with relatively limited water resources. Therefore, rational management and sustainable use of groundwater resources are of key importance, as groundwater constitutes a stable source of drinking water supply and water available for agriculture, significantly more resilient to climate variability and extreme events than surface water resources. Moreover, under the hydroclimatic conditions of Central Europe, groundwater is generally characterized by higher physicochemical quality compared with surface waters [11]. In contrast, under the semi-arid climatic conditions of the Iberian Peninsula, the opposite relationships are often observed [12]. Although surface water dominates in the overall water balance, groundwater resources supply more than 70% of drinking and domestic water demand in Poland [13], highlighting their strategic importance for national water security.
Famiglietti [14] emphasizes that groundwater depletion may pose a much greater threat to water security than is commonly assumed, which necessitates a transition from traditional management approaches toward modern monitoring systems capable of reducing high levels of data uncertainty. In recent years, increasing attention has been paid to the development of advanced monitoring networks and integrated observation systems enabling continuous assessment of groundwater dynamics and more effective resource management [15,16,17]. On a global scale, groundwater monitoring networks operate in most countries across all continents, not only in Europe but also, for example, in Korea [18], Egypt [19], New Zealand [20], the United States [21], Brazil [22], and South Africa [23]. However, these networks show considerable variability in terms of monitoring point density, measurement accuracy, and the level of institutional supervision. Despite these differences, their efficient functioning is of critical importance because groundwater constitutes a key strategic reserve that allows societies to withstand periods of precipitation deficit and hydrological drought. Without systematic monitoring and sustainable management of these resources, global water security may be threatened to a much greater extent than is currently widely recognized [14].
In Poland, a stationary groundwater observation network was established as early as 1969 [24]. The Polish observation and research network is characterized by a long tradition and a multi-level institutional structure. The monitoring network currently includes various types of observation points, such as drilled hydrogeological wells (including monitoring wells and piezometers), dug wells—gradually being phased out and replaced by drilled wells—as well as natural springs. In this context, natural springs serve as invaluable “natural sensors”. Discrete points of groundwater discharge provide integrated information about the state, pressure, and quality of the entire aquifer system. As natural windows into the subsurface, springs respond dynamically to changes in the water table and recharge rates. Monitoring spring discharge allows for a real-time assessment of aquifer health, making it an ideal focal point for regional hydrogeological observations. However, long-term experience with the monitoring network indicates that traditional methods for measuring spring discharge based on periodic manual readings are insufficient in regions characterized by highly dynamic hydrogeological conditions, such as the Carpathian Mountains. Monitoring in mountainous regions, such as the flysch Carpathians in southern Poland, presents a set of significant ‘system constraints’ that distinguish these areas from lowland hydrogeological systems. The complex geology of the flysch characterized by alternating layers of permeable sandstones and impermeable shales and mountainous areas dominated by fractured aquifers and complex hydrogeological systems typically exhibit very rapid responses to precipitation infiltration. Consequently, conventional monitoring approaches with low temporal resolution may fail to capture short-term fluctuations in spring discharge and groundwater levels [25,26]. Capturing this variability through traditional fieldwork is often impossible due to steep terrain and limited seasonal accessibility, which makes manual measurements both costly and hazardous. Beyond physical terrain, logistical hurdles such as the lack of power infrastructure and ‘communication shadows’ (areas without GSM/LTE coverage) pose substantial technical barriers to standard sensor deployment. Furthermore, the high environmental value of the Carpathians means that many springs are situated within National Parks or Natura 2000 sites. In these sensitive zones, legal regulations demand that any technical intervention be non-invasive and aesthetically discreet to protect groundwater-dependent ecosystems (GDEs) and maintain landscape integrity. These multifaceted challenges necessitate a specialized screening process to ensure that monitoring infrastructure is both technically viable and legally compliant. However, recent studies emphasize that high-frequency automated spring monitoring significantly improves the understanding of groundwater recharge processes, hydrological variability, and the early detection of hydrological extremes [27].
While the importance of springs is well-recognized, there is a clear research gap regarding the practical aspects of spring discharge automation and telemetry implementation in difficult terrain. Most existing studies focus on the hydrochemical or geological characteristics of springs, while the logistical, technical, and legal barriers to establishing a modern, automated monitoring network remain under-explored. There is a lack of a standardized screening tool that accounts for non-hydrogeological factors in the deployment of the automation of measurements of spring discharge.
This study aims to address this gap by proposing a multi-criteria classification system for evaluating spring monitoring potential: a network of 28 springs in the Carpathians to demonstrate why traditional manual measurements fail to capture the high-frequency dynamics of these systems. The novelty of this work lies in the introduction of the F-T-S-N classification framework, which integrates hydrogeological dynamics with legal and technical feasibility. This approach provides a practical roadmap for the transition from manual observations to sustainable, automated telemetry systems. According to the authors of this study, the implementation of automated monitoring systems enabling high-frequency measurements of spring discharge is essential for accurate drought forecasting and for protecting groundwater resources from overexploitation and degradation. Only reliable and systematically collected measurement data enable effective management of water resources under conditions of increasing climatic variability and growing anthropogenic pressure [6,14,28]. Continuous monitoring of groundwater levels and groundwater abstraction is also fundamental for the effective management of groundwater resources, particularly in transboundary basins where the lack of reliable and comparable data may hinder rational water management and international cooperation. Furthermore, well-functioning monitoring networks allow early detection of groundwater overexploitation, which may lead to irreversible depletion of aquifer resources, land desiccation, and degradation of groundwater-dependent ecosystems such as springs and wetlands.

Definition of Key Terms

To ensure a consistent understanding of the transition from traditional to modern hydrogeological observations, the following terms are central to this study:
Natural Sensors: This term refers to springs viewed as integrated indicators of aquifer health. Unlike man-made boreholes, springs act as natural points of discharge that provide real-time, aggregated data on groundwater storage, pressure, and hydrochemical signatures of the contributing catchment.
System Constraints: These are the multi-faceted barriers including difficult terrain (steep slopes, inaccessibility), technical limitations (lack of power, communication shadows), and legal-environmental regulations (protected areas) that dictate the feasibility and design of monitoring infrastructure.
Spring Discharge Automation: The process of replacing discrete, manual volumetric measurements with continuous data logging. This typically involves the installation of pressure transducers or ultrasonic sensors within stabilized measuring cross-sections to provide high-resolution temporal data.
Telemetry Implementation: The integration of wireless communication technologies (e.g., GSM, LTE, or satellite links) into the monitoring stations. This allows for the remote transmission of data from the field to a central database, enabling real-time detection of hydrological events and sensor health monitoring.
Regional Monitoring Network: A structured and spatially distributed set of observation points (in this study, 28 selected springs within the national SOBWP framework) designed to provide a representative assessment of groundwater dynamics across a specific geological region, such as the flysch Carpathians.

2. Materials and Methods

2.1. Structure and Short History of Groundwater Monitoring Network

The origins of groundwater monitoring in Poland, carried out by the Polish Geological Institute—National Research Institute (PIG-PIB), date back to the late 1950s and early 1960s. The basic observation network was officially established in 1972, with its main objective being to monitor natural fluctuations in water levels and to protect resources from overexploitation and degradation.
The factor that necessitated a major reorganization of the network was Poland’s accession to the European Union in 2004 and the need to implement the Water Framework Directive 2000/60/EC (WFD), both in the management of surface waters [29] and the groundwater bodies (GWBs) in question.
The current structure of the network comprises nearly 2000 monitoring points, divided into quantitative status monitoring, qualitative (chemical) status monitoring and research monitoring. In the Polish groundwater monitoring system, observation and research points are classified according to their rank and the scope of the research carried out; the most important role is played by first-order hydrogeological stations, whose design and equipment allow for a full range of observations to be carried out across all exploitable aquifers present in a given region. Second-order points consist of wells, piezometers and cased springs, which play a supplementary role and are used mainly for regular measurements of the water table or yield, as well as for taking samples for physico-chemical analysis.

Quantitative Monitoring

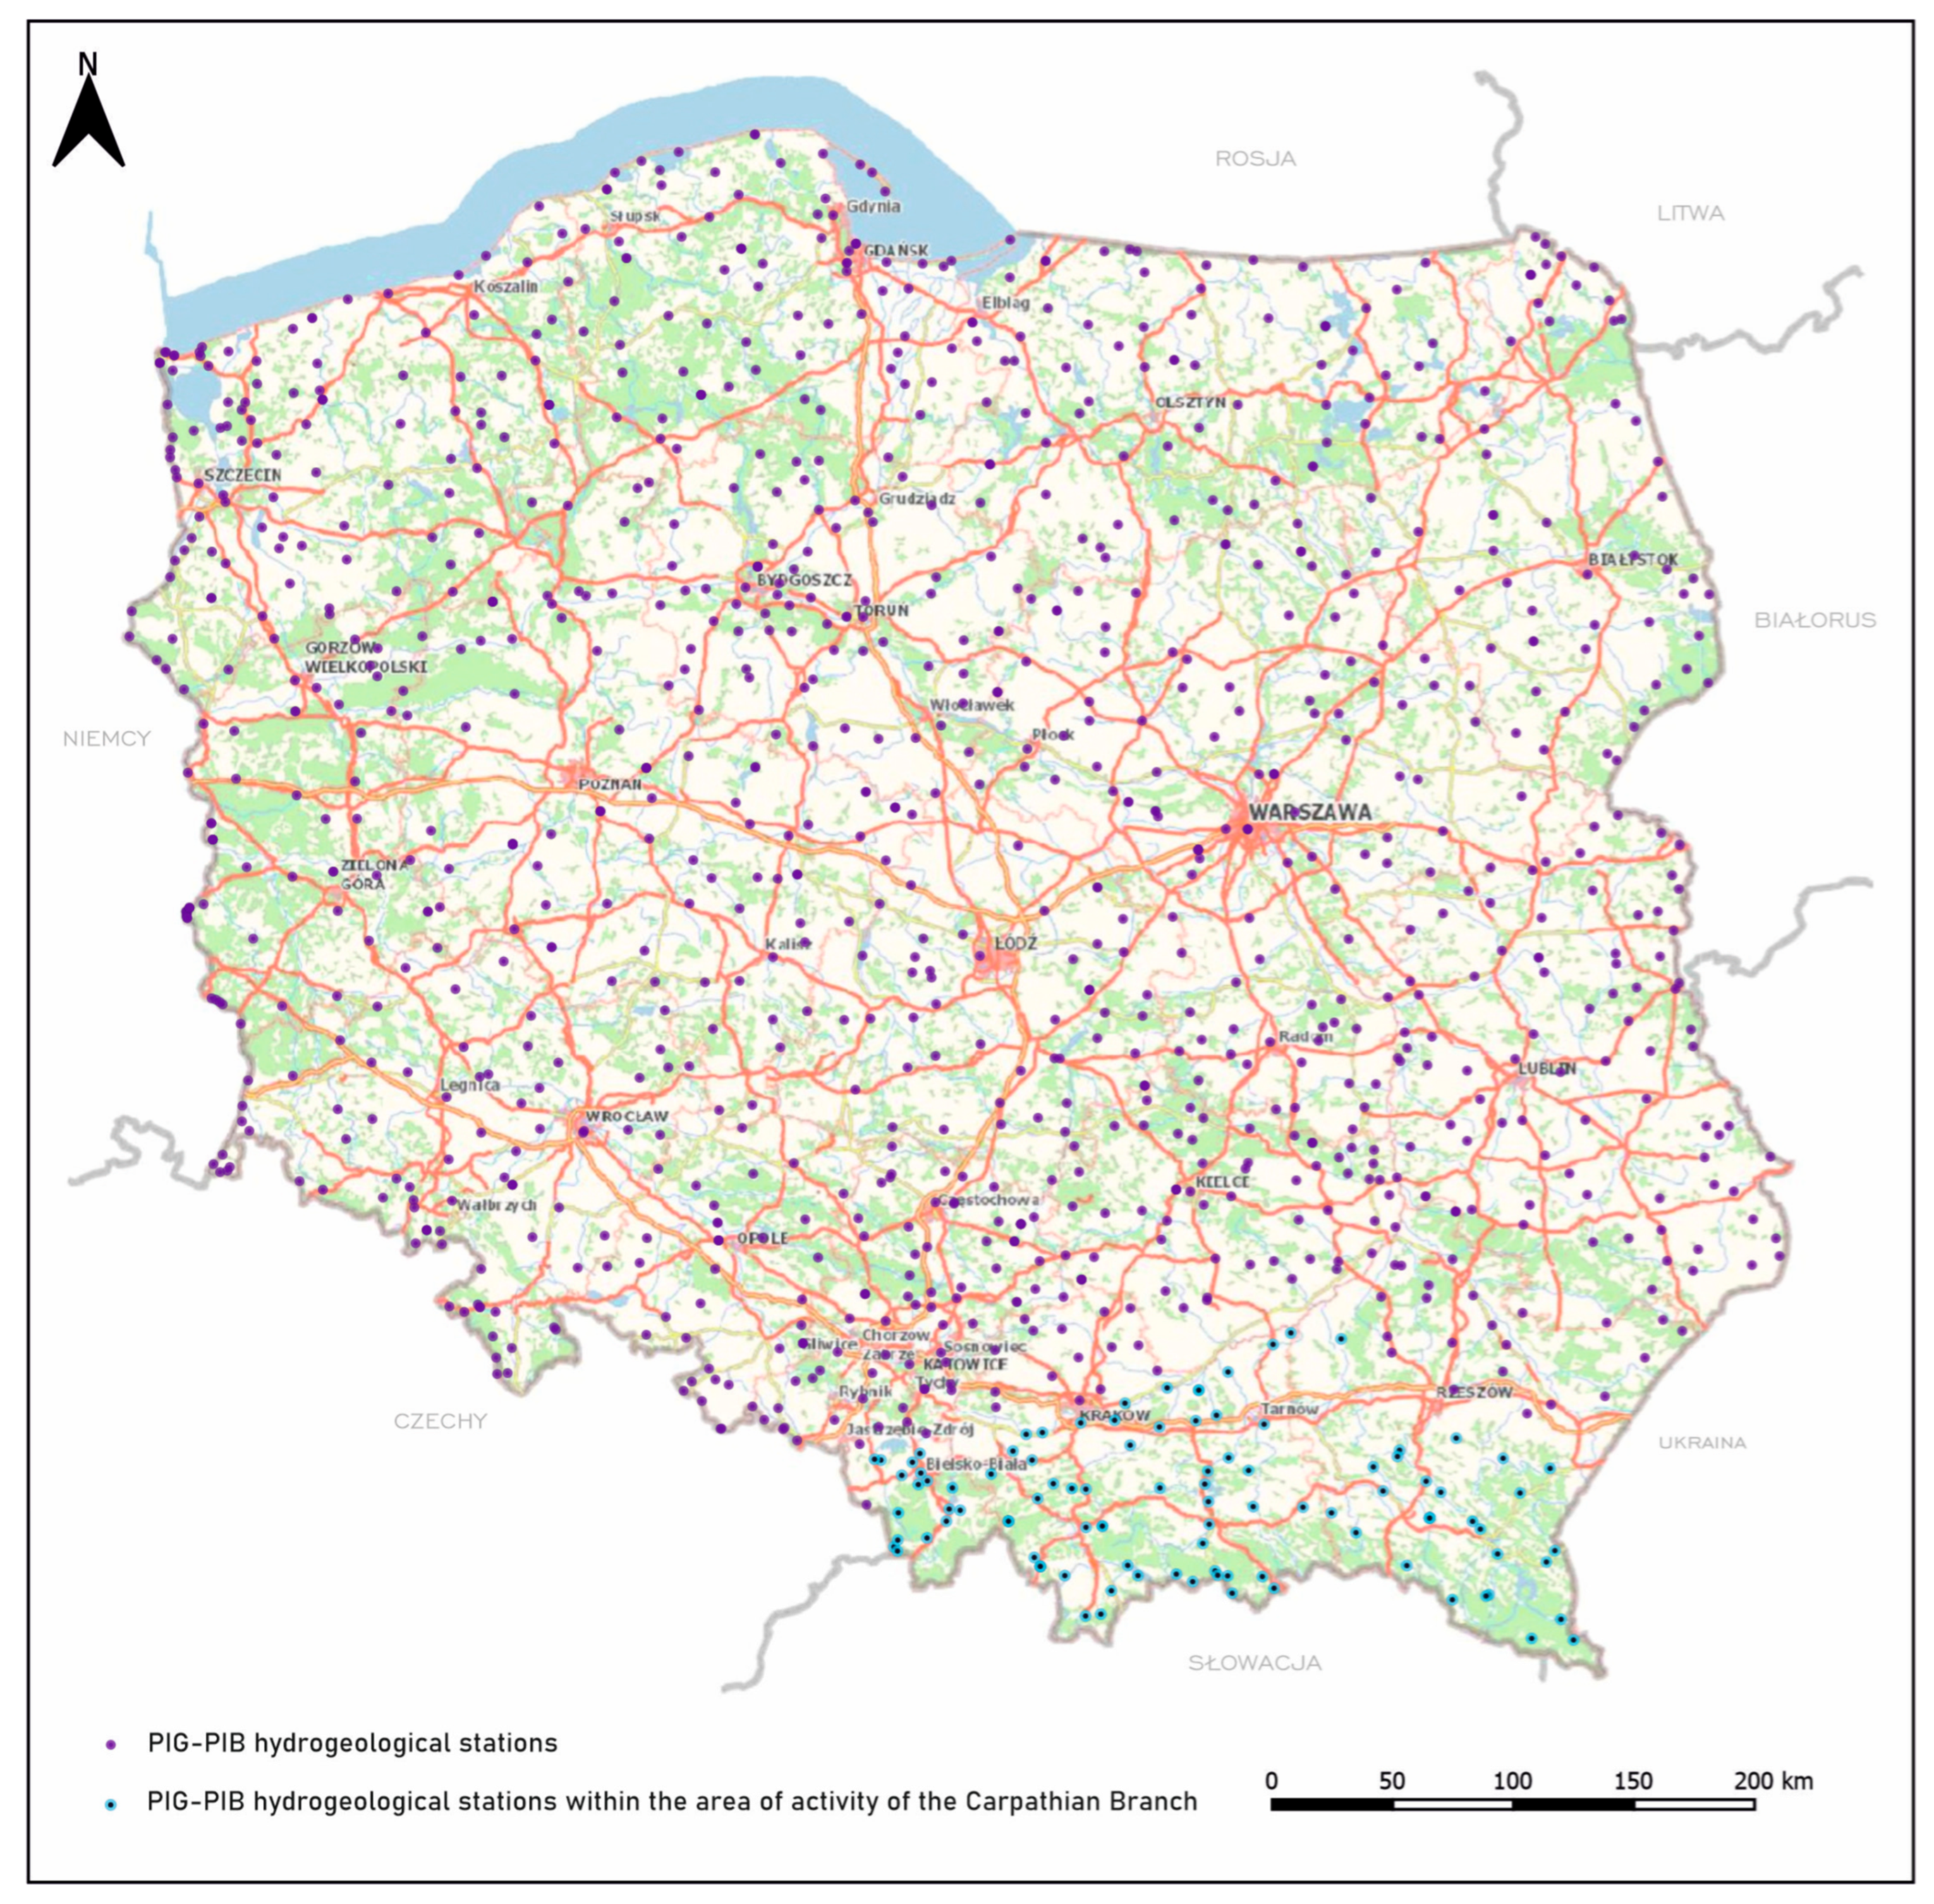
Quantitative monitoring in Poland is based on just under 1200 stations in the hydrogeological observation system (Figure 1).
The monitoring process is based on regular measurements of the water table depth and spring discharge, which allows for tracking natural variability and the effects of human pressure [30,31,32]. The collected data is used to balance available resources and assess their utilization, as well as to forecast threats such as hydrogeological droughts. Since 2013, the system has been gradually modernized through the implementation of equipment for automatic measurement and data transmission, which increases the effectiveness of crisis management and reporting to the European Commission. In 2019, telemetry systems were already operational at 366 locations, transmitting data on water level and temperature to the servers of the State Hydrogeological Service.
It is extremely important to note that the use of telemetry in quantitative groundwater measurements described above applies exclusively to hydrogeological boreholes, i.e., drilled wells and piezometers. To date, natural springs serving as active observation and research points in Poland’s groundwater network have not been equipped with devices capable of continuously recording variations in discharge. This therefore poses a challenge for the organizers of the national groundwater observation and research network in Poland.
Because Poland’s groundwater monitoring network has undergone a thorough evolution to align with European standards, it has become compatible with the systems of other EU countries, enabling data reporting to the European Environment Agency. Within the European context, Poland’s groundwater monitoring network shows the greatest structural, density and geological similarity to the systems in operation in the Czech Republic and Slovakia. This similarity stems from the fact that these countries, like Poland, base their monitoring on the principle of representativeness for GWBs within river basins, maintaining a similar density of the core network. Particularly in the Carpathian belt, the Polish spring monitoring network is almost identical in character to the Slovak network, where highly dynamic hydrogeological fractured aquifers of the Carpathian flysch dominate. This fact determines the necessity of monitoring natural groundwater discharges, i.e., springs, as key indicators of the state of water retention [33]. Springs form the core of this publication

2.2. Reference Area in Groundwater Monitoring Network

The study area covers the Outer Carpathians in southern Poland. Groundwater in this region is characterized by unique features resulting from its geological structure and topography. The geological structure is dominated by the Carpathian flysch, rhythmically alternating layers of sandstone, mudstone and clay shale, which, as a result of orogenic processes, have been strongly folded and thrust upon one another in the form of nappes. This specific structure determines the hydrogeological conditions of the entire region, which is additionally rich in geothermal waters [34]. There are geothermal springs in the study area, which present certain difficulties in terms of sampling [35]; nevertheless, they are not included in the national monitoring network. Sandstones typically act as aquifers, whilst impermeable shales form isolating barriers. In the western part of the study area, coarse-grained sandstones dominate, whereas towards the east the flysch becomes more diverse, which directly influences the circulation of groundwater. The hydrogeodynamic properties of the Carpathian region are characterized by high dynamics, manifested in a very rapid response of the water table and spring yields to precipitation.
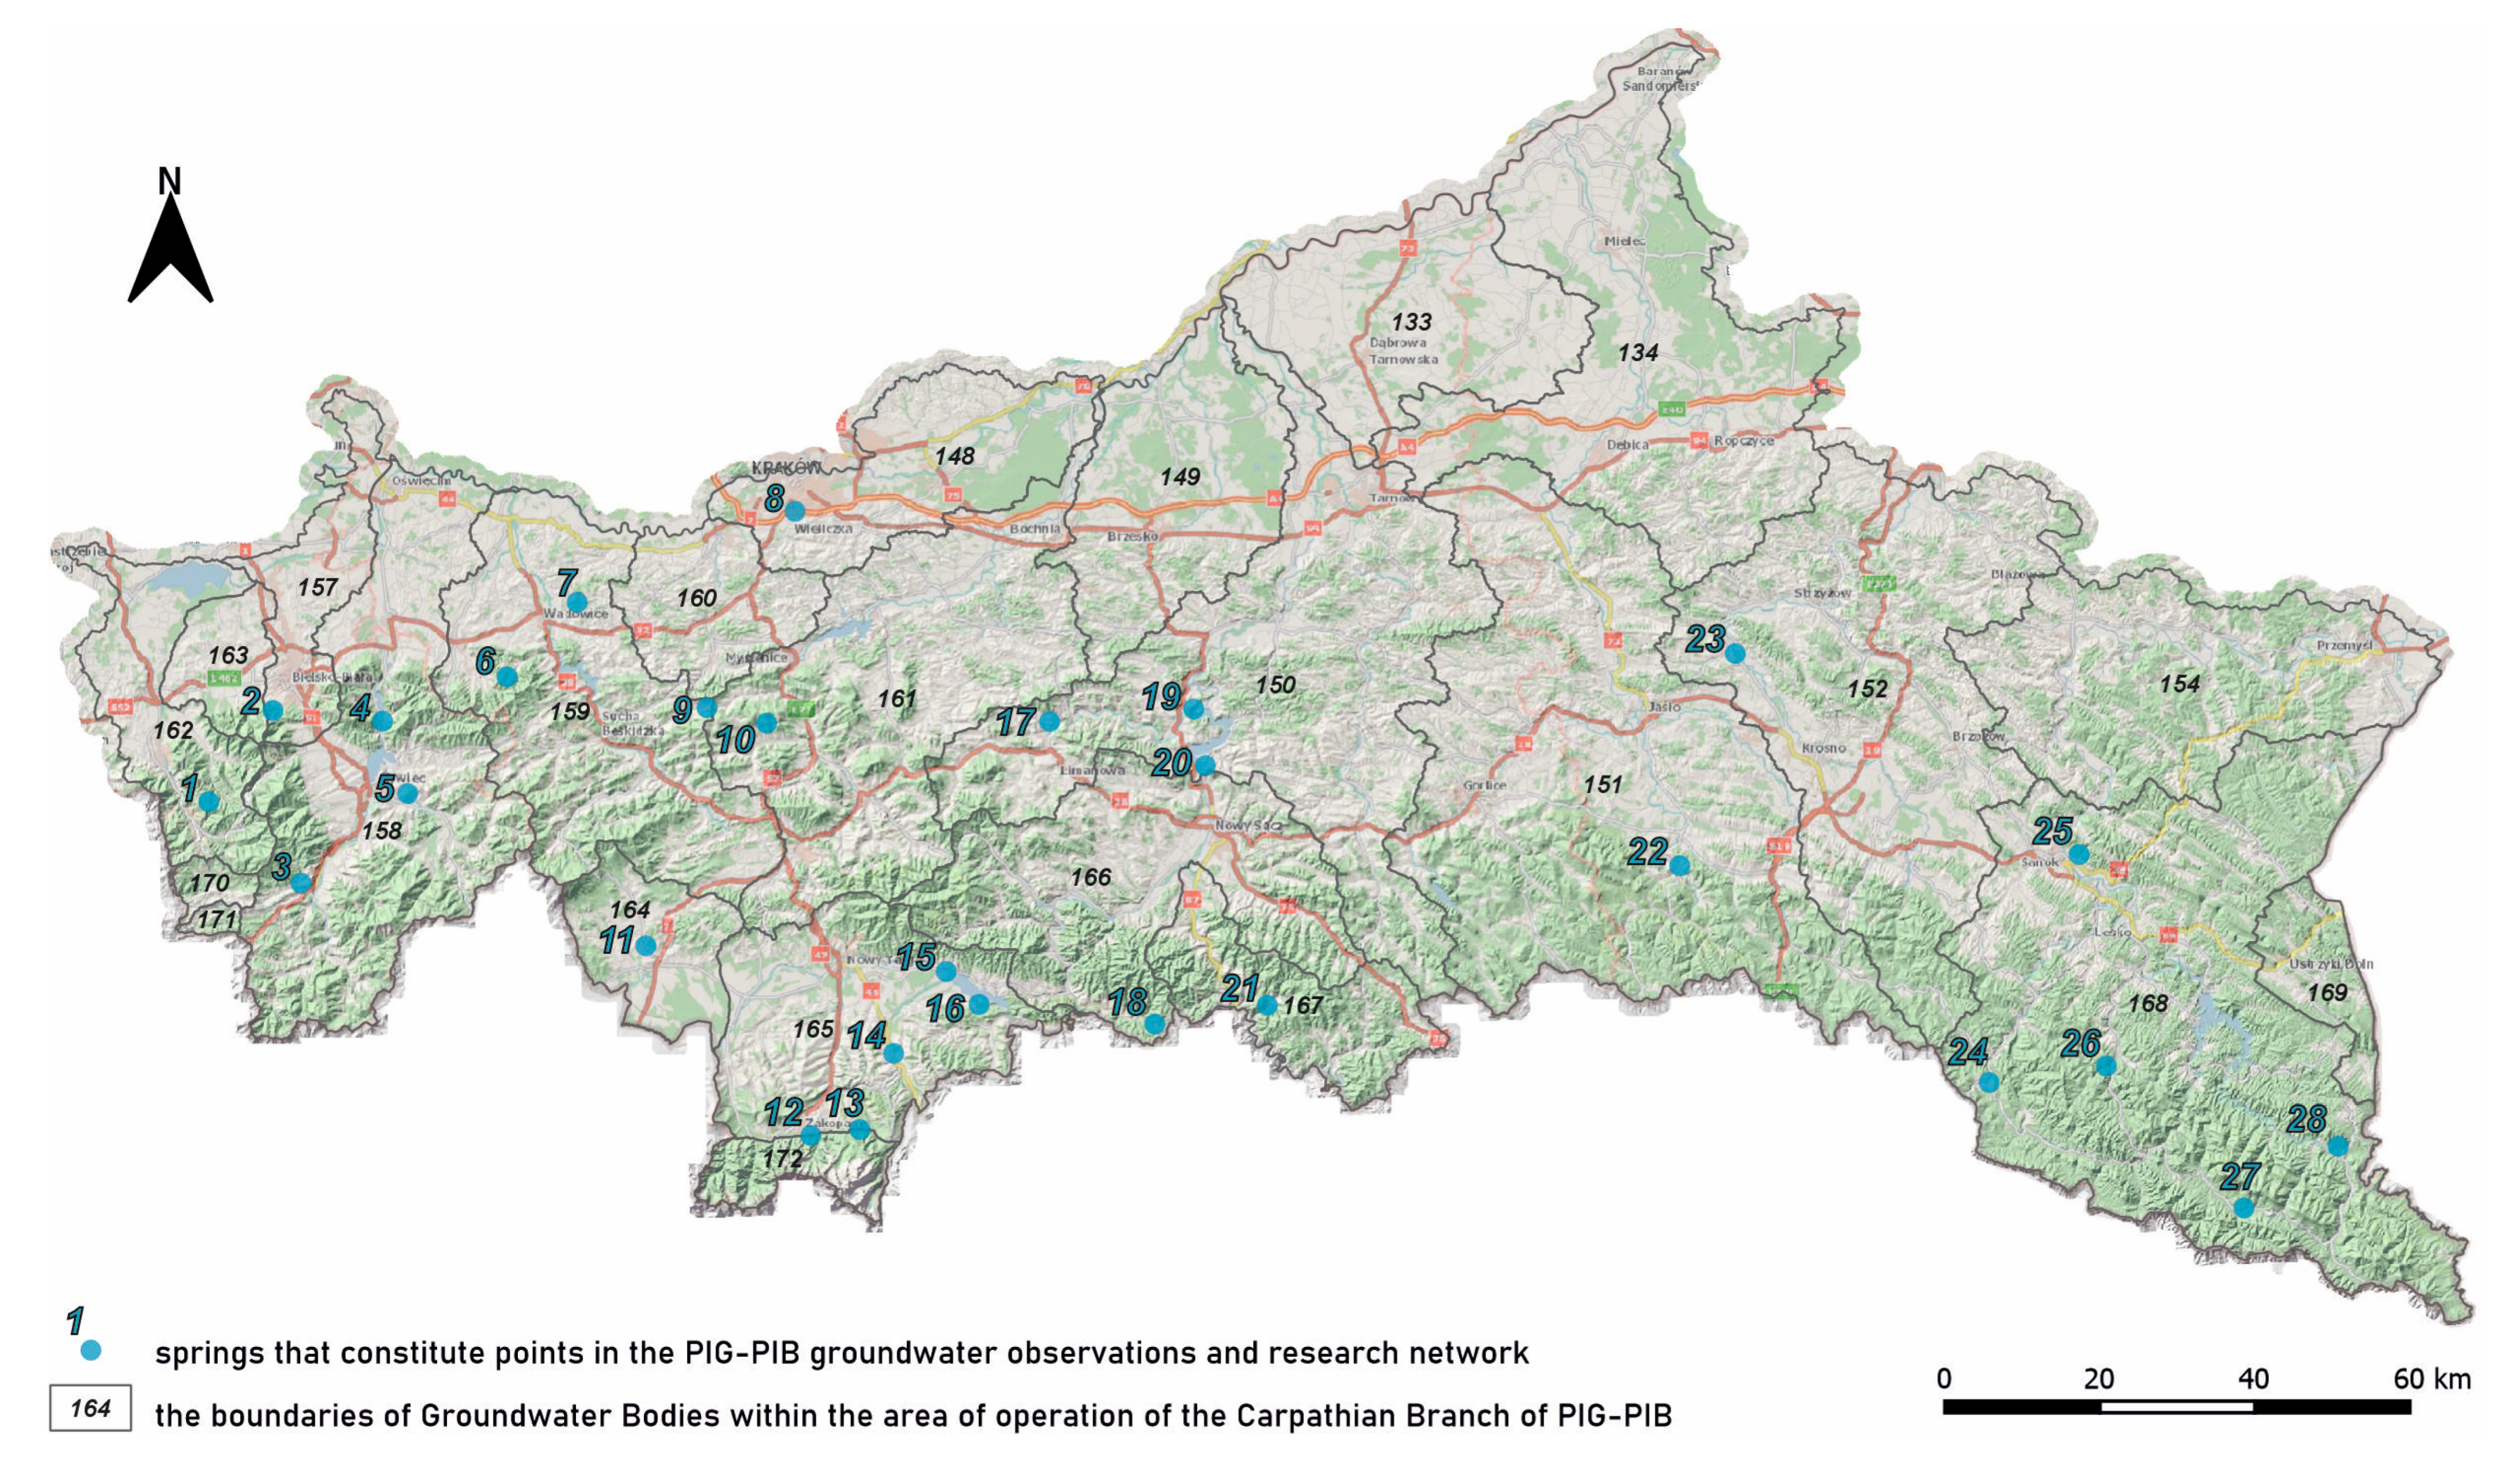
The groundwater monitoring network in the Carpathian region is operated by the Carpathian Branch of the PIG-PIB and is integrated into the national observation and research network. The network comprises 103 observation and research points, 28 of which are springs (Figure 2).
Springs in the Carpathians are the most common and natural manifestation of groundwater discharge. In contrast to lowland areas, the Carpathians exhibit an exceptionally high density of springs, which locally exceeds 10 sites per km2. This is undoubtedly a feature that sets the Carpathian network apart from the rest of the country, as monitoring elsewhere relies almost exclusively on boreholes. Currently, springs account for as much as 27% of all observation and research points within the Carpathian regional network, reflecting their importance in groundwater circulation in mountainous areas. The Carpathians are the only region in the country where springs play such a significant role in the monitoring system. The sites with the longest measurement series, spanning 38 years, are the publicly accessible flysch springs of Żywiec-Koleby and Babica (Table 1). The site that was most recently incorporated into the Carpathian regional observation and research network is the Tatra spring at Koziarczyska. It has been monitored for 8 years.
The use of springs—as spontaneous, natural and concentrated outflows of groundwater to the surface, representing a direct manifestation of the natural drainage of aquifers—is an effective and economically viable alternative to costly drilling work carried out as part of monitoring surveys. From a research perspective, the contribution of springs to the Polish observation and research network is significant; however, the potential of springs appears to remain untapped.

2.3. Measurement Methods

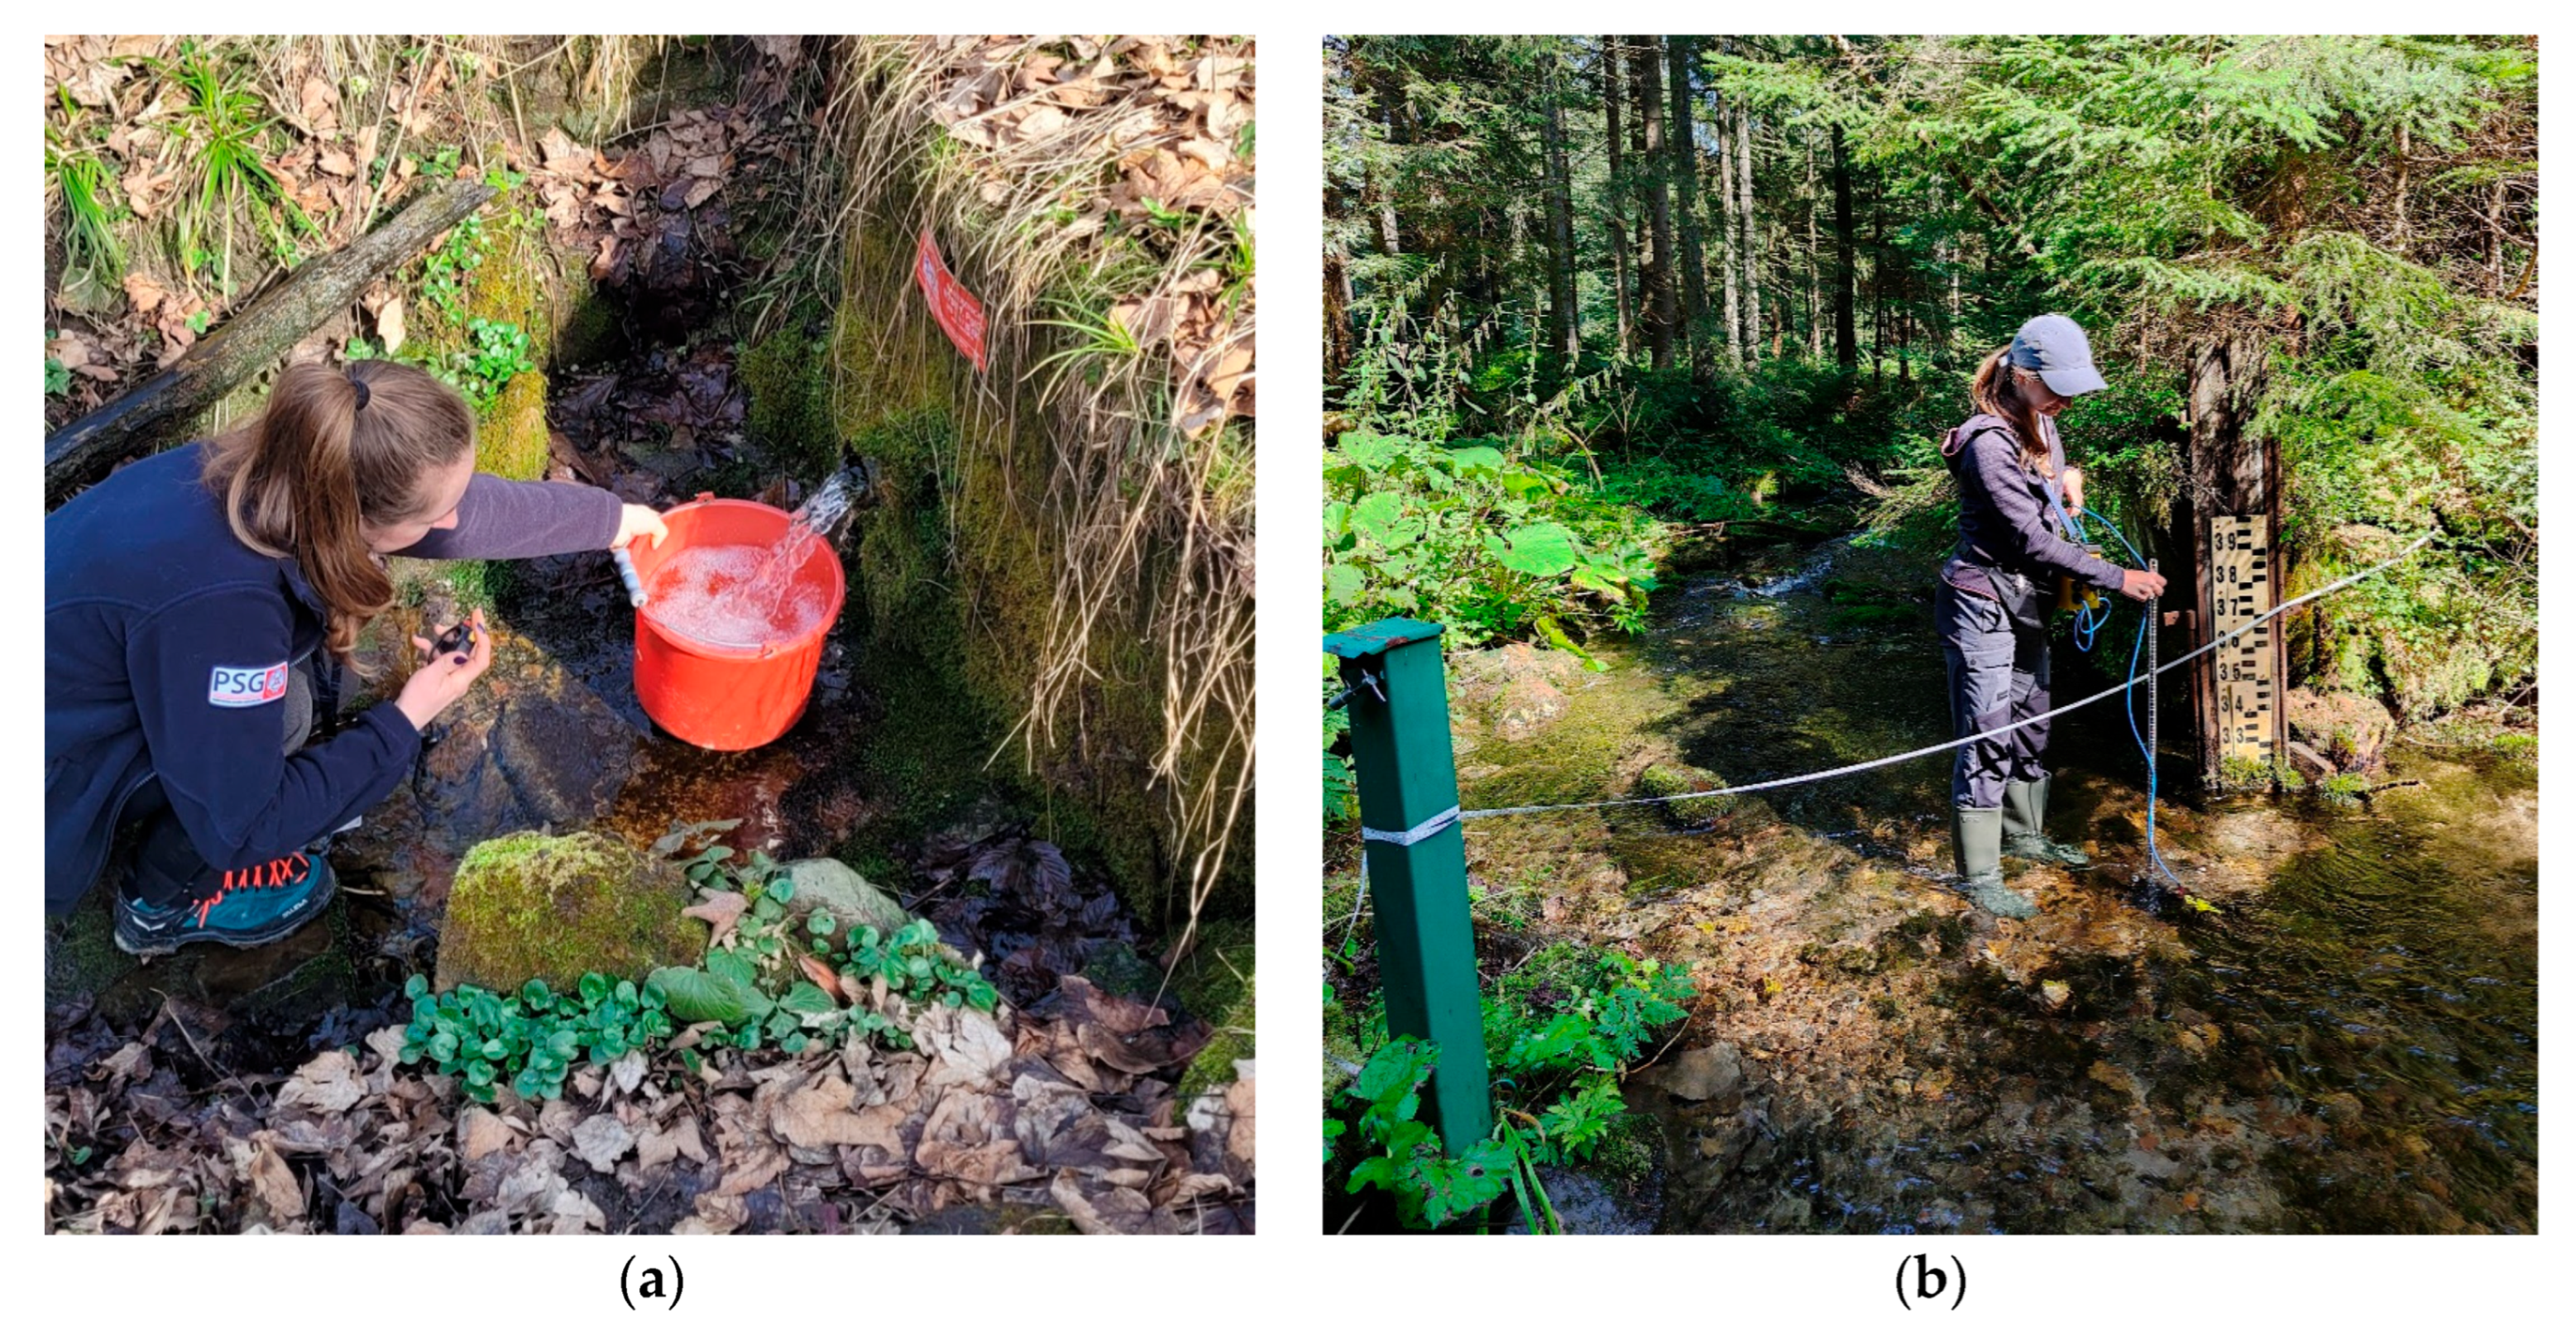
Quantitative groundwater monitoring in Poland focuses primarily on determining the location of the water table and the yield of natural springs. At first-order hydrogeological stations, these measurements are carried out daily (at 06:00 UTC), whilst at second-order stations they are carried out once a week, on Mondays (also at 06:00 UTC). Manual measurements are carried out by trained field observers. In the case of groundwater springs, the methodology for measuring discharge is selected on a case-by-case basis, taking into account the morphology of the outflow and the existing infrastructure. For captured springs, the volumetric method (Figure 3a) or the measuring weir method is most commonly used. At only one point in the Carpathian observation and research network in question, namely at the Koziarczyska spring in the Tatra Mountains, the hydrometric wheel method is used to measure yield (Figure 3b). The selection of the appropriate measurement method is of particular importance in the flysch Carpathians region, where the monitoring of natural groundwater discharges forms the basis for understanding water dynamics in complex fissured systems. The reliability of the data obtained is a prerequisite for maintaining the continuity and comparability of long-term yield data series.
Regarding measurement uncertainty, the volumetric method is generally characterized by high precision under stable conditions (estimated error margin of ±5%). However, during extreme weather events or massive peak flows, the inherent human factor and the physical difficulty of capturing the entire turbulent outflow significantly increase this uncertainty. For the hydrometric wheel method applied at the Koziarczyska spring, standard hydrometric uncertainties associated with velocity-area methods apply. These inherent uncertainties of manual field measurements under harsh mountain conditions further emphasize the necessity of transitioning to standardized, automated sensor deployment.
The basis for the descriptive statistical calculations (Table 1) and the interpretation of discharge hydrographs (Figure 4a–d) is provided by raw hydrological datasets for 28 selected sources, obtained through the national monitoring network. To ensure full transparency and enable independent verification of the results, it should be noted that the duration of the analysed observation series for individual sites varies and ranges from 8 to 50 years (the longest measurement series were recorded for the Dębno and Falsztyn sources). The sample size ranges from 399 to 2557 recorded measurements per source. A detailed summary of the duration of measurements and sample size for each site is provided in Table 1.
The time series under analysis naturally contains measurement gaps resulting from the nature of long-term manual observations. Most often, these are gaps lasting from a few weeks to a maximum of several months, caused by the temporary absence of the observer (e.g., illness) or difficulties in accessing measurement sites. In such cases, the missing data were not taken into account in the statistical estimates. It should be noted here that most of the ongoing observations began in the 1980s or 1990s, but for various reasons, the observations were interrupted for several years. This situation applies, among others, to the spring in Zubrzyca Dolna. Due to the lack of archival information, the causes of such measurement gaps are difficult to determine unequivocally. In cases where measurements taken after a long break did not differ in characteristics from historical values, and the measurement methodology had not changed, these data were combined into a single observation series.
A rigorous methodological approach was adopted when preparing the descriptive statistics: all reported means, medians, and measures of variability were calculated exclusively on the basis of actual raw measurements. No mathematical interpolation or artificial imputation of missing observations was used. This approach is clearly reflected in the presented hydrographs (Figure 4a–d), which accurately depict the actual sampling density over time. This ensures that the presented drainage dynamics indicators are free from modelling error and constitute a reliable, empirical basis.
The rules for recording monitoring data are based on the central groundwater monitoring database, which collects quantitative measurement results (dating back to 1966) and chemical composition data. Data from manual measurements are entered into the database system, whilst for hydrogeological boreholes equipped with automatic instruments (e.g., pressure sensors/loggers), data are transmitted via telemetry. For the purposes of early warning against hazards such as hydrogeological drought, a special data collection procedure has been introduced, enabling the database to be updated more quickly with results from the previous month. Unfortunately, no automated measurement systems have yet been implemented for the springs forming part of the monitoring network.
All collected data are verified and published once a year, presenting statistical summaries and an assessment of the hydrogeological situation for the given hydrological year. This information is made publicly available via dedicated government web applications [36,37].

2.4. The Aim of the Research

Despite the importance of springs in water resource management, traditional manual methods of measuring spring discharge—based on weekly readings—have critical limitations when it comes to accurately capturing the dynamics of groundwater discharge. Infrequent measurement intervals make it impossible to capture the rapid response of springs to rainfall (so-called peak flows) and to accurately determine drawdown curves, leading to a significant underestimation or misinterpretation of dynamic resources, particularly in areas with high porosity [38,39,40]. A similar issue applies to aquifers with complex hydrodynamics around the world, e.g., spatial-temporal behavior of precipitation-driven karst spring discharge in a mountain terrain [41,42,43,44]. In the Carpathian flysch region, where aquifer systems are characterized by an exceptionally short response time to infiltration, automated systems capable of continuously recording the full range of flow variations have yet to be implemented.
While the limitations of traditional manual monitoring in dynamic mountainous aquifers are generally recognized, there is a lack of quantitative assessment of data loss and standardized protocols for modernizing such networks. Therefore, the primary aim of this study is to evaluate the adequacy of the current spring monitoring network and to provide a structured methodology for its transition to automated telemetry. To achieve this, two specific, testable objectives were defined:
  • To quantify the discharge variability and impulsivity of 28 Carpathian springs using established hydrogeological indices (Meinzer’s V, Maillet’s R, and CV) in order to statistically test the hypothesis that low-frequency (weekly) manual measurements are inadequate for capturing peak flow dynamics.
  • To develop, apply, and validate a novel, multi-criteria F-T-S-N (Formal-legal, Technical, Structural, and Nature-environmental) screening framework to objectively quantify the barriers to telemetry implementation across the monitoring network.
By fulfilling these objectives, this study bridges the gap between hydrodynamic theory and the practical, logistical requirements of establishing a modern, automated groundwater observation system.
To our knowledge, this is the first application of a comprehensive framework for analyzing the implementation of automatic spring discharge measurements within the Polish national network context, encompassing not only technological aspects but also organizational, legal, and technical barriers.
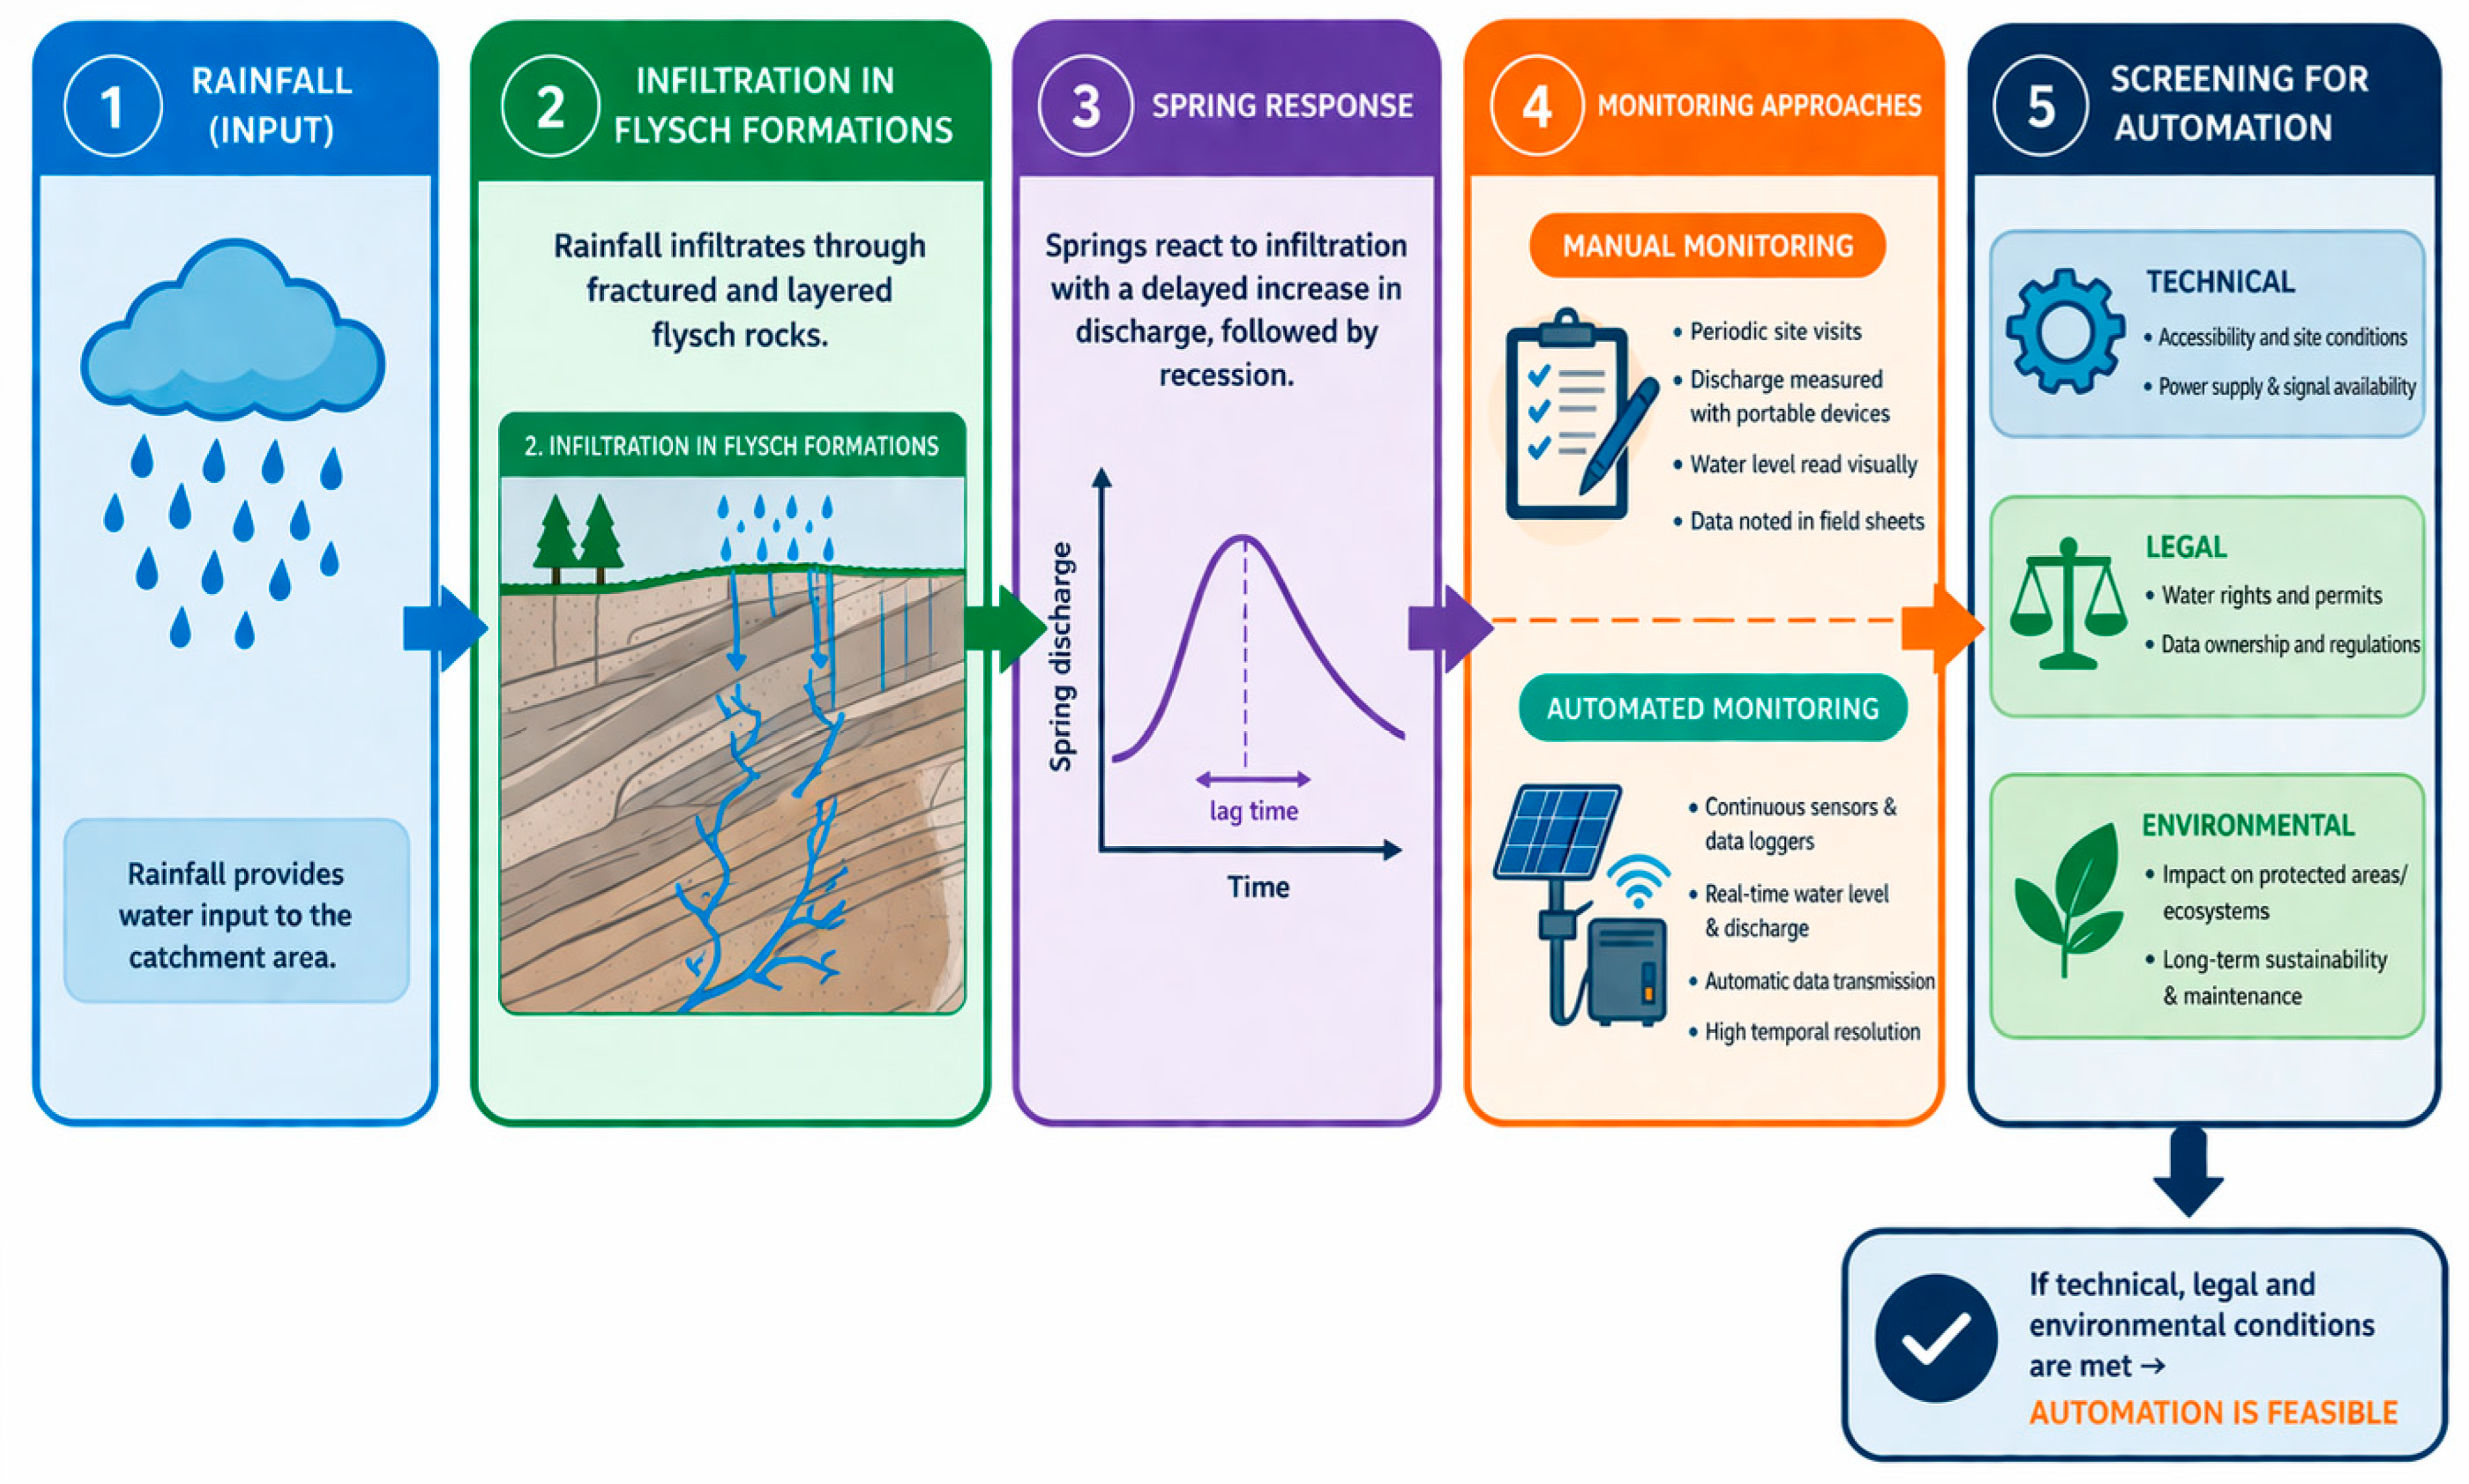
To better illustrate the overarching concept of this study and make the interdisciplinary approach more accessible to a broader audience, a comprehensive conceptual framework was developed (Figure 5). This schematic encapsulates the entire pathway analysed in this paper: from the climatic forcing (rainfall) and rapid infiltration through fractured flysch formations, to the highly dynamic spring response. Furthermore, it highlights the critical methodological gap between traditional manual measurements and high-frequency automated telemetry, culminating in the proposed F-T-S-N screening process for a modern monitoring network.

3. Results

3.1. Spring Discharge Within the Monitoring Network

Basic statistical analysis of the discharge of the 28 monitored springs (Table 1) reveals a significant diversification of hydrogeological conditions in the study area. The vast majority of the objects in the network are characterized by relatively low yields. For 23 springs, the mean discharge does not exceed the value of 1.0 L/s. However, the drainage system also includes structures with very high potential, among which the Koziarczyska (No. 13) and Zakopane-Capki (No. 12) springs distinctly stand out. Their mean discharges are 137.16 and 111.89, respectively, while the maximum recorded flows reach values in the range of several hundred units. In the case of objects with such a high amplitude of fluctuations, it was observed that the median, rather than the arithmetic mean, constitutes a much more reliable indicator of the typical recharge state, as it effectively eliminates the impact of short-term, extreme high-flow events on the overall picture of the spring regime.
The parameter for assessing the dynamics of aquifer systems is the coefficient of variation (CV%), which allowed for the classification of the studied objects in terms of the stability of their regime. As many as seven of the monitored springs exhibit extremely high variability (CV > 100%, e.g., Żywiec-Koleby—178.14%, Ponikiew—171.79%), which indicates these springs are recharged from shallow groundwater circulation systems, making them respond almost immediately to meteorological events. At the opposite extreme are objects with a stable regime (CV < 50%), such as Zubrzyca Dolna (28.88%), Babica (32.55%), or Koziarczyska (32.75%). Such low variability proves the high retention capacity of deeper aquifers, which are significantly less susceptible to short-term weather fluctuations.
From the perspective of sustainable water resource management, the high percentage of springs with high variability and episodic cessation of drainage highlights the vulnerability of shallow groundwater systems to hydrogeological droughts and progressive climate change. Under the conditions of growing climate pressure and increasing precipitation deficits, it is the deep aquifer structures with stable yields that play an important role.
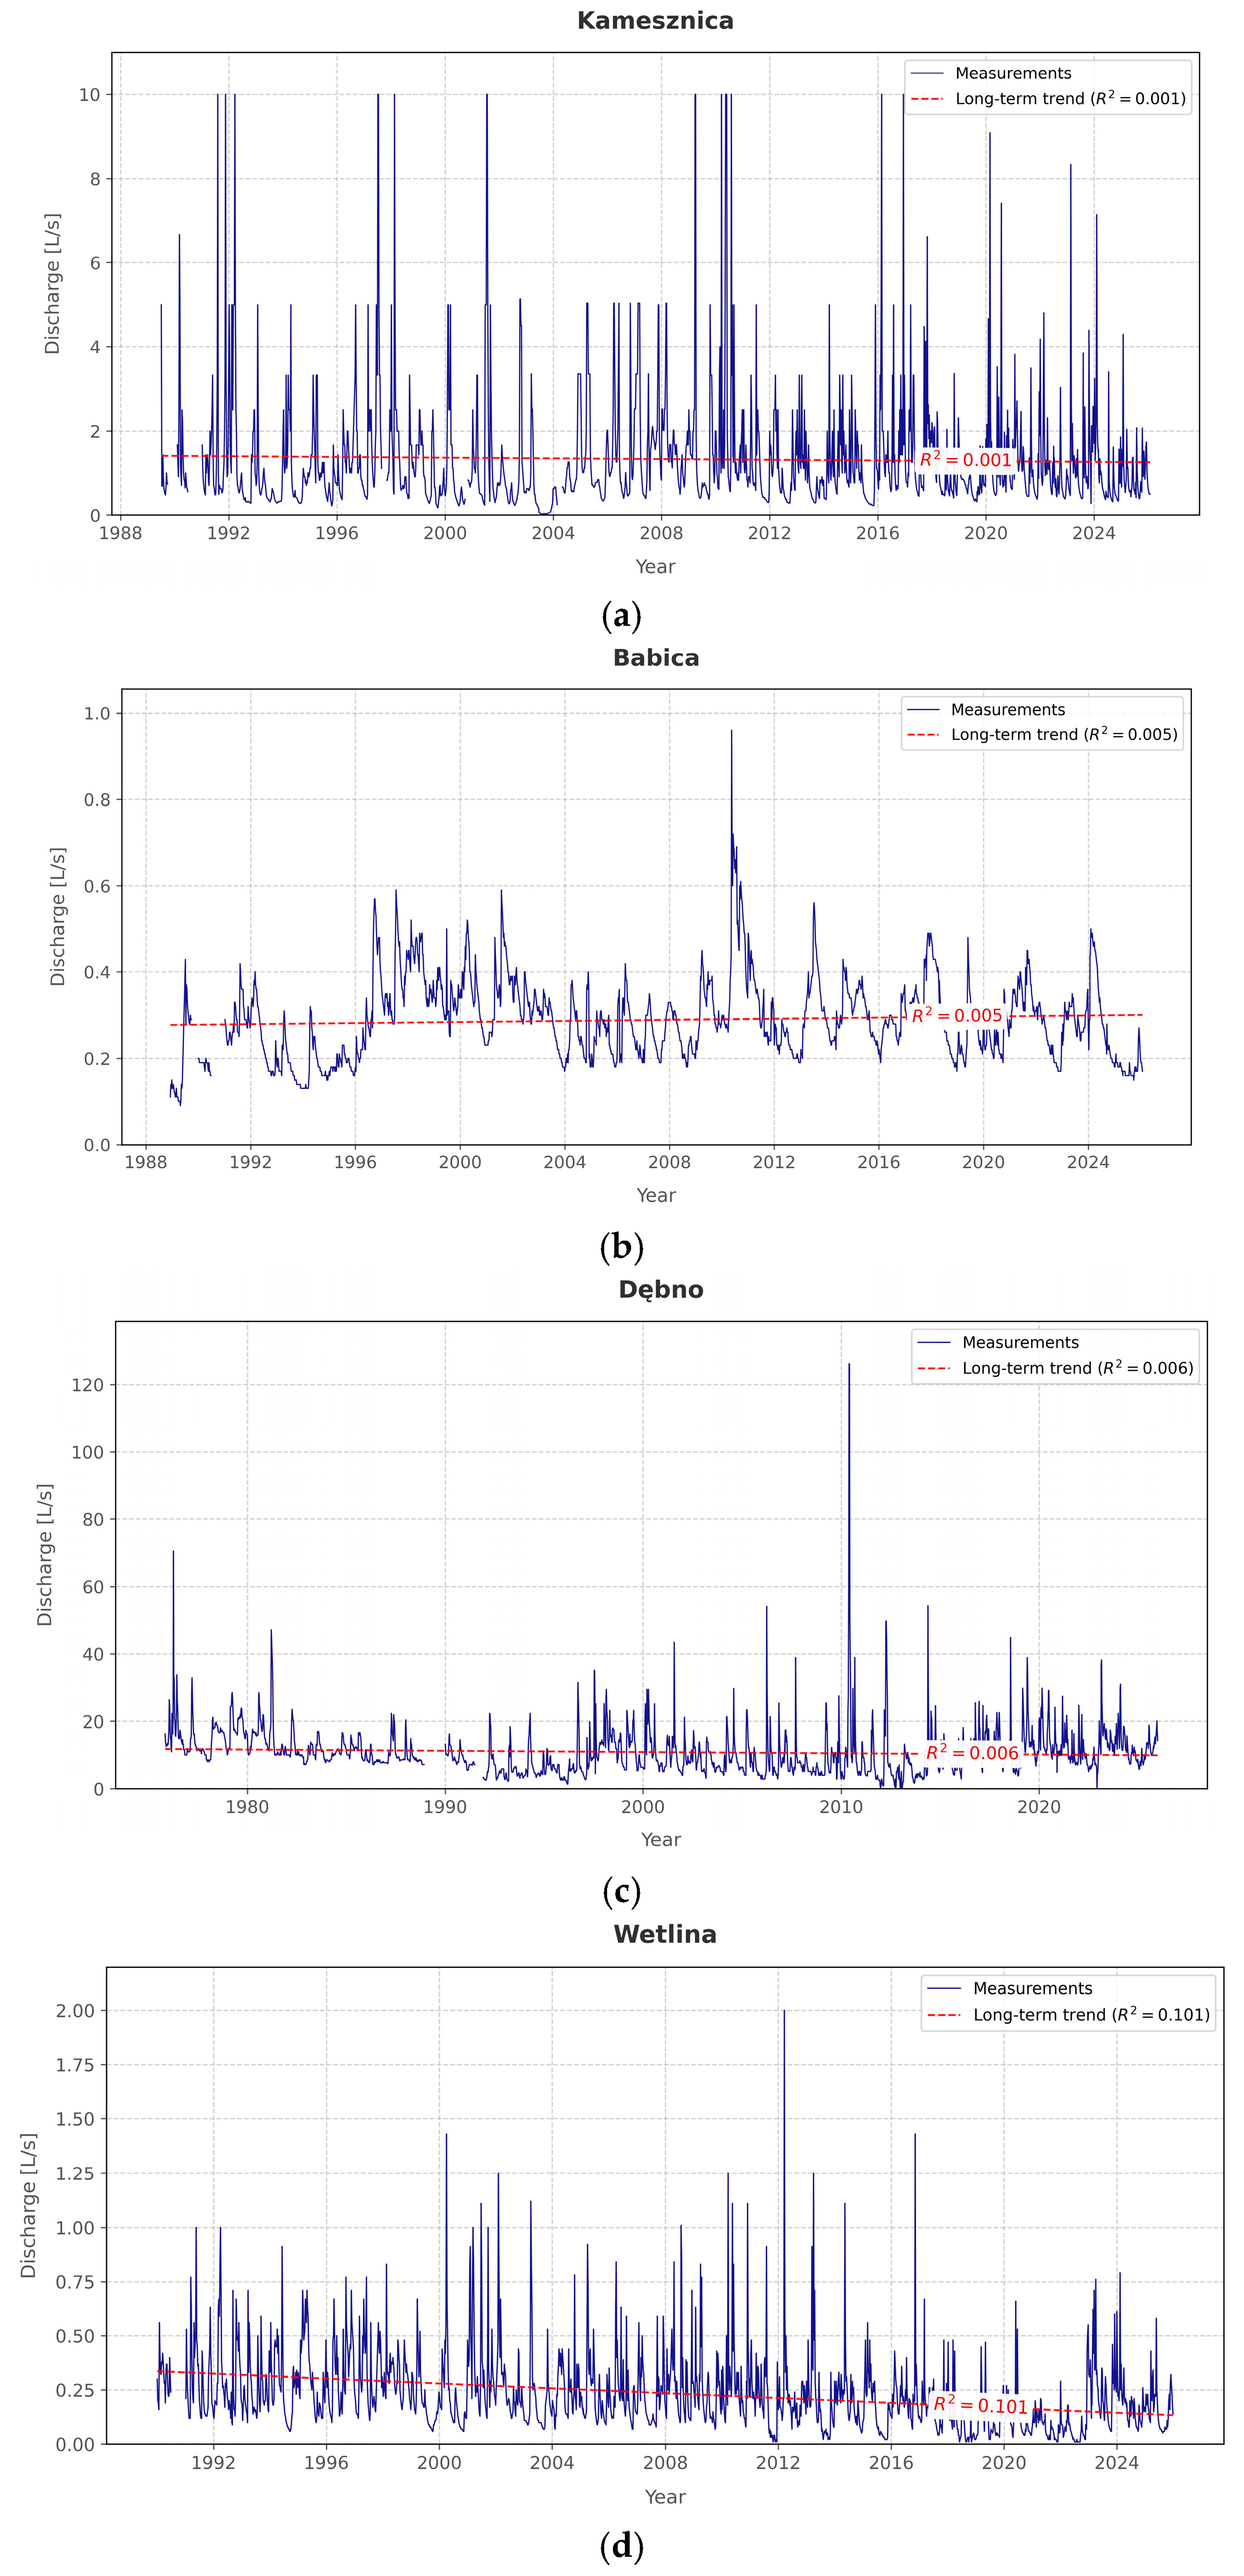
The visual analysis of long-term hydrograms (Figure 4a–d) provides crucial insights into the temporal dynamics of the studied springs, particularly regarding peak flows and episodic recharge events. For instance, the Kamesznica (Figure 4a) and Wetlina (Figure 4d) springs exhibit highly impulsive drainage patterns, characterized by abrupt discharge spikes reaching 10.00 L/s and 2.00 L/s, respectively, despite their relatively low base flows. Conversely, the Babica spring (Figure 4b) demonstrates a stable regime (0.09–0.96 L/s), while Dębno spring (Figure 4c) shows extreme, rapid variations up to 126.18 L/s in response to meteorological events.
The long-term trend lines (Figure 4a–d) are significantly smoothed, thereby failing to reflect the true magnitude of these hydrodynamic processes. Consequently, assessing groundwater resources based solely on generalized trends is insufficient. A robust hydrogeological evaluation must prioritize temporal variability and cyclicity across seasonal and multiannual scales. These shorter-term fluctuations, which are largely masked by long-term trends, contain information for example rapid response of fractured systems to precipitation.
Given the strong cyclicality and the absence of steep long-term trends, the coefficient of variation (CV) becomes the optimal indicator for characterizing the nature of the sources under study. Very high values of this parameter, which directly correspond to the sharp peaks recorded on the hydrographs (Figure 4a–d), indicate high drainage impulsivity and shallow water circulation. T In the context of ongoing climate anomalies, changes in the regime of these sources may manifest not so much as a shift in the average trend line, but rather as a drastic increase in the extremes themselves, even deeper lows and higher, harder-to-capture peaks. In summary, the extreme dynamics and cyclicality shown in the hydrographs (Figure 4a–d) unequivocally demonstrate that relying on infrequent, manual measurements leads to the loss of key data. Ultimately, the observed amplitudes and frequency of discharge fluctuations expose the critical limitations of conventional, low-frequency manual monitoring. The inability of weekly measurements to accurately capture peak flow durations and the exact shape of recession curves robustly justifies the necessity of implementing automated telemetry systems. High-frequency data logging is essential to record the full spectrum of flow dynamics, thereby supporting reliable predictive modeling and the sustainable management of groundwater resources under increasing climate pressure.
The study demonstrates that low-frequency manual measurements are methodologically inadequate for dynamic mountainous aquifers. To ensure data reliability, we propose the following actionable thresholds for network modernization based on the coefficient of variation (CV):
Springs with CV > 100% strictly require continuous (sub-hourly) telemetry to capture high-frequency hydrodynamic pulses and peak flows.
Springs with CV 50–100% necessitate at least daily automated logging.
Traditional weekly manual sampling should be restricted solely to stable base-flow systems with CV < 25% (which represented 0% of the analysed Carpathian population).

3.2. Classification of the Springs Acc. To Standard Criteria

The complex nature of the springs under investigation and the need for a precise interpretation of the hydrodynamic processes occurring within them make it essential to classify them according to strictly defined criteria [45]. Proper identification of the specific characteristics of these discharges and the potential for adapting them to modern monitoring systems therefore requires reference to established spring classifications that allow for their systematization in geological, hydraulic and regime terms. Focusing on the specific characteristics of drainage in the Flysch Carpathians, this publication synthesizes classical categorizations with a modern analytical approach geared towards the needs of monitoring network automation. The complexity of the hydrogeological conditions in the Carpathians and the diversity of the structural and locational characteristics of the springs within the monitoring network of the Carpathian Branch of PIG-PIB necessitate the use of a multi-criteria assessment system. Only by combining the classical quantitative classifications according to Meinzer [46] with the genetic-structural classifications according to Pazdro [47] can a full understanding of the dynamics of the studied springs be achieved. Taking into account morphological features according to Keilhack [48], the type of bedrock and the lithology of the spring site are important for identifying technical barriers, such as ground instability or spring migration, which directly affect the feasibility of permanently installing telemetry equipment.
In order to organize the wide range of spring parameters within the studied monitoring network and to indicate the research potential of individual sites, a classification of 28 springs in the Carpathian monitoring network was carried out, classified according to the most common criteria mentioned above. The results of the analysis are summarized in Table 2.
It should be emphasized that the primary objective of applying these well-known classification schemes (such as Meinzer or Maillet) is not to discover new hydrogeological properties of the Carpathian flysch, which are generally well understood. Rather, they are applied here as a quantitative, diagnostic tool for decision-making relevance. By formalizing the expected high variability and specific hydraulic pathways of these springs, we establish the undeniable hydrodynamic necessity for automation, which directly justifies the subsequent application of the proprietary F-T-S-N screening framework.

3.2.1. Spring Discharge Criterion

Internationally, the most widely used classification of springs based on discharge rate is the Meinzers’ classification [46], which divides springs into eight size classes, ranging from giant springs to trace springs (Table 3).
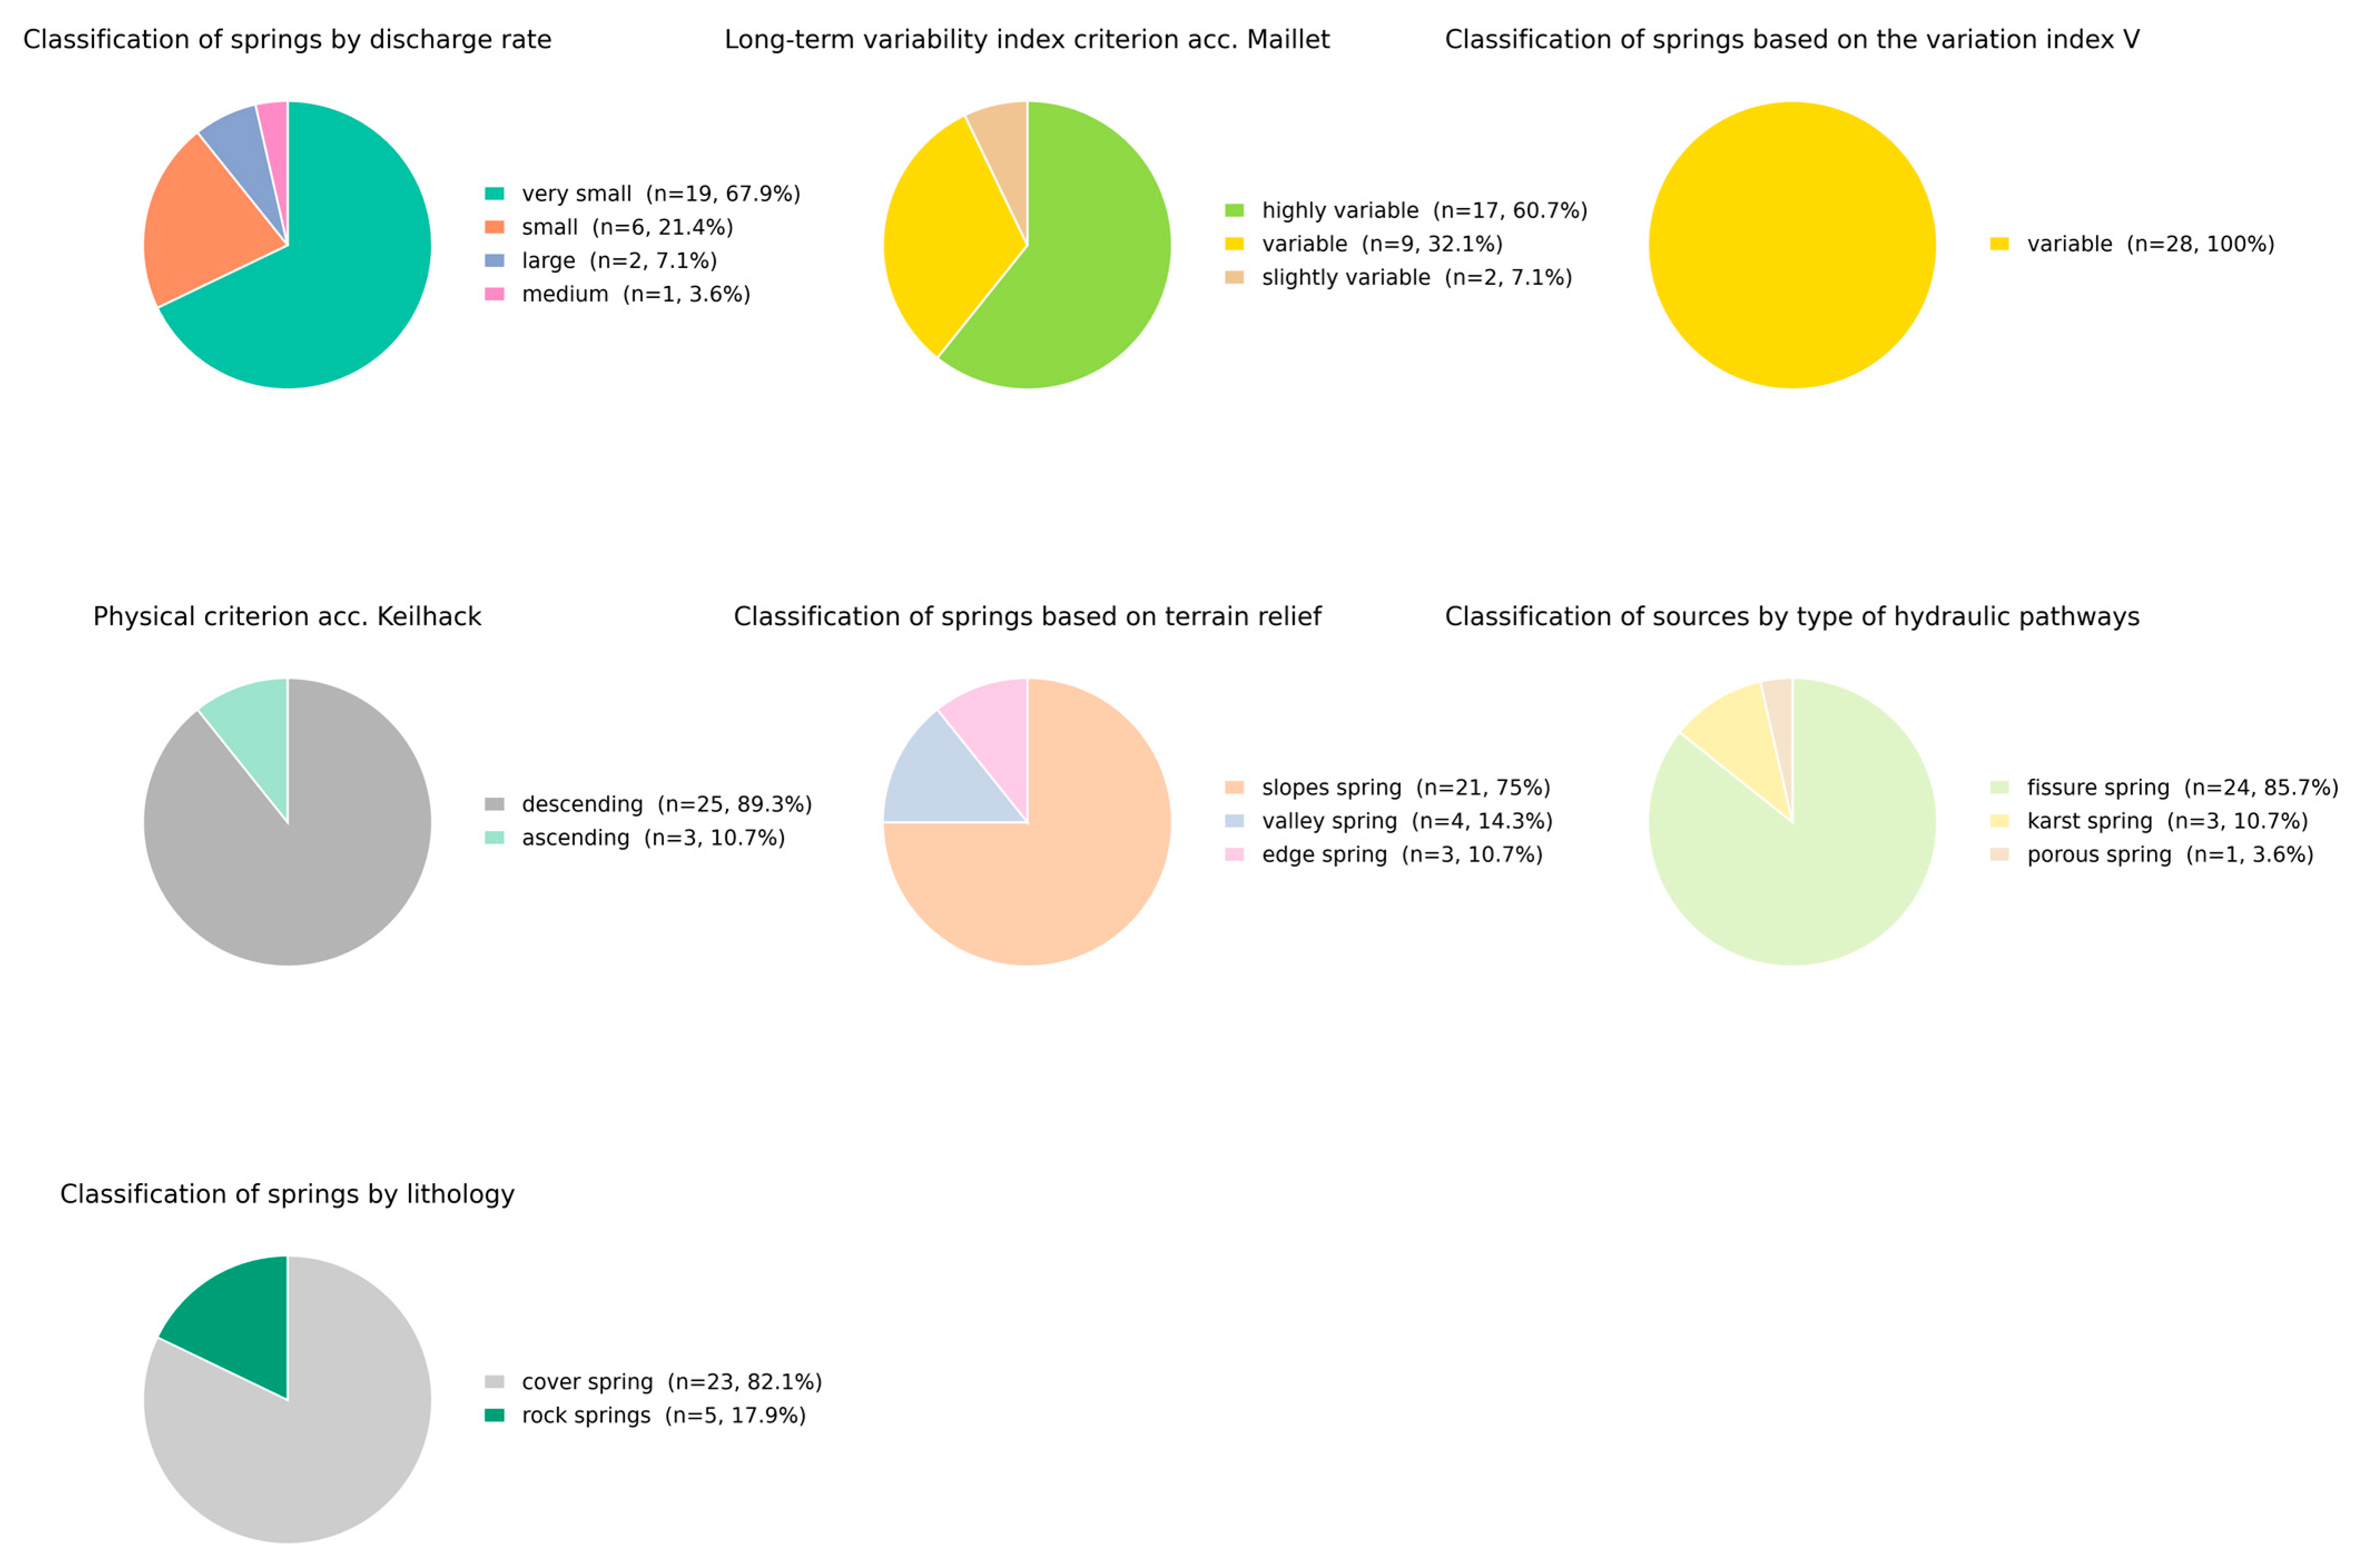
In order to assess the classification of springs within the monitored network, a comparison was made between the average long-term flow rates and the categories listed in Table 1. This analysis revealed that, in the Flysch Carpathians, spring size classes VI and VII, as defined in [46], with the exception of the Tatra karst springs, which periodically achieve parameters qualifying them for the highest classes on this scale (Table 2). Of the springs analysed in this study, as many as 68% are very small springs, whilst only 7% are large springs. Small and medium-sized springs account for 25%. Such a wide range of sizes necessitates the use of varied measurement methods.

3.2.2. Long-Term Variability Index Criterion Acc. Maillet [49]

For the Carpathian region, the classification based on the long-term variability index R according to Maillet [49] was considered particularly significant. The classification of the studied springs was carried out on the basis of a comparison of the obtained value of the R index, representing the ratio of extreme flow rates, i.e., the maximum flow rate Qmax to the minimum flow rate Qmin, observed over the long-term study cycle, with reference to Table 4.
An analysis of 28 springs operating within the Carpathian groundwater observation and research network, conducted on the basis of Maillet’s classification of long-term variability [49], revealed a clear predominance of sites with high yield variability, as over 60% were classified as highly variable springs (R > 50), and 9 as variable (R = 10–50). These results fully correlate with the hydrogeological characteristics of the flysch Carpathians, where springs that react rapidly to precipitation and snowmelt recharge predominate. Only two sites in the analysed group showed low variability (R = 2–10), suggesting a connection to more voluminous reservoirs or deeper circulation systems characterized by slower water exchange.
The widespread occurrence of high variability indices therefore provides a strong substantive argument for the need to automate measurements, as traditional manual observations are insufficient to capture extreme fluctuations in the spring regime.

3.2.3. Long-Term Variability Index Criterion Acc. Meinzer [46]

Next, the variability of the studied springs was assessed using Meinzers’s variability index V [46], which is an extension of Maillet’s simple ratio (R) and determines the percentage deviation of the extreme yields from the long-term average yield according to Equation (1):
V = 100 · (Qmax − Qmin)/Qmean,
The classification of analysed springs was based on the classification presented in Table 5.
This analysis yielded an even more consistent description of the drainage dynamics of the studied springs than when using Maillet’s R-index. All 28 of the analysed springs (100% of the studied population) were classified as variable springs, i.e., highly sensitive to rainfall, snowmelt and droughts. Thus, the results of this analysis confirmed and reinforced the view that it is necessary to automate spring discharge measurements within the studied monitoring network. Only by increasing the frequency of spring yield measurements and conducting an advanced analysis of the data collected over a long period of time will it be possible to make a realistic assessment of the nature of the spring and its regime, and to produce reliable forecasts.

3.2.4. Physical Criterion Acc. Keilhack [48]

A classification of springs based on physical criteria takes into account the driving force that causes groundwater to emerge at the earth’s surface. The main driving forces are considered to be the force of gravity and hydrostatic pressure. On this basis, two main types are distinguished: descending (gravitational) springs, in which water flows downwards under the influence of gravity from the recharge area, and ascending (artesian) springs, where water moves upwards under the influence of hydrostatic pressure. This is the basic classification adopted, amongst others, by Keilhack [48].
In the case of the analysed springs in the Carpathian part of the monitoring network, ascending springs account for a mere 11%. Gravity springs predominate, which is largely due to their morphological location.

3.2.5. Morphological Criterion

The classification of springs according to morphology is based on their location in relation to various landforms and constitutes one of the fundamental elements of hydrogeological description. The significance of this classification, which links morphology to geological structure, has been recognized in research practice for a century [47], and contemporary researchers of the Carpathians also demonstrate that the location of a spring (e.g., on a slope or in a valley) determines not only its yield, but above all its resistance to anthropogenic pressure and the dynamics of its response to precipitation [50]. The classification according to morphological criteria was carried out based on the types of springs listed in Table 6.
An analysis of the 28 springs studied as part of the Carpathian monitoring network revealed a clear predominance of slope springs, which accounted for as much as 75% of all cases studied. Such a high proportion of this type of outflow is a direct reflection of the specific geological structure and morphology of the Flysch Carpathians, where alternating layers of permeable sandstone and impermeable shale are cut by the ground surface on sloping hillsides. In accordance with the commonly used classification [48], these features most often function as descending springs, where water flows freely under the influence of gravity at the points of contact between layers of varying permeability.

3.2.6. Criterion Regarding the Type of Hydraulic Hoses

In Polish hydrogeology, it is common practice to classify springs according to the type of hydraulic pathways through which groundwater flows [47]. This classification is regarded as one of the most important, as it is the nature of these water pathways that determines the flow rate, chemical composition and stability of drainage yield. According to this classification, three main types of springs are distinguished: porous (stratiform), fissure and karst (Table 7).
In the network of 28 Carpathian springs studied, fissure springs are by far the most common (24 cases). This group is supplemented by three karst springs and just one pore spring. This configuration of genetic types is closely linked to the lithology of the flysch Carpathians, where the pathways of groundwater circulation consist primarily of fractures in solid rock. The dominance of fissure and karst conduits (27 sites in total) provides direct justification for the previously demonstrated extreme drainage dynamics.

3.2.7. Rock Type Criterion

In lithological classification, the primary criterion is the type of rock matrix through which groundwater flows (Table 8—[47]). Rock springs occur in solid rock, where drainage takes place via systems of fissures, fractures or karst channels, which generally favors the concentration of the outflow. In contrast, cover springs, also referred to as springs in debris and weathered material, are located within Quaternary slope formations, landslide colluvial or alluvial cones. These features are characterized by a shallow circulation system within highly permeable material, which means that their yield is extremely variable and directly dependent on current weather conditions.
Of the springs analysed in this study, which form part of the national groundwater observation and research network, as many as 23 are surface springs (approx. 82%). This predominance indicates that groundwater drainage in the study area occurs mainly within Quaternary cover consisting of loose formations, such as slope clays, rock debris or landslide colluvium, which is typical of the heavily denuded slopes of the Flysch Carpathians. The shallow circulation system in these formations means that water travels a short distance from precipitation infiltration to outflow, and the springs themselves are characterized by limited storage capacity.

3.2.8. Summary of the Application of Traditional Spring Classification Methods

The results of the classification of the monitored springs presented above, carried out in accordance with methodologies commonly used in similar analyses, are summarized in Table 2. To summarize the calculations and analyses performed, it was found that the lithological characteristics correspond closely with the morphological and hydraulic conditions of the study area. As many as 75% of the analysed sites (i.e., 21 springs) are slope-based (slope) sites, which, combined with the fact that 27 out of 28 springs have fissure or karst-type conduits (Figure 6), defines their dynamic regime. The characteristics of drainage from shallow weathered cover are directly reflected in the results of the analysis. All 28 springs (100% of the studied population) were classified as variable springs according to Meinzera’s classification [38], which constitutes substantive evidence of the inadequacy of traditional and, consequently, infrequent manual measurements. Under these conditions, the automation of the spring monitoring network is essential to reliably document rapid drainage responses to recharge and capture the actual dynamics of groundwater resources in the region.
In terms of decision-making, these standard classifications successfully prove why the monitoring network must be automated. However, they do not answer how to implement it in practice. This operational gap logically necessitates the introduction of the novel F-T-S-N framework (Section 3.3), transitioning the focus from hydrodynamic theory to practical implementation barriers.

3.3. An Innovative, Proprietary Classification of the Springs Within the Monitoring Network

The implementation of the necessary automation of yield measurements for springs operating within the Polish groundwater monitoring network, as proposed in this publication, absolutely requires consideration of technical, logistical and administrative factors that are not analysed in traditional studies. For this reason, this paper proposes four new, original classifications that bridge the gap between the theoretical characteristics of a spring and the practical feasibility of implementing telemetry systems in them. The proposed classifications allow for an objective assessment of the degree of difficulty of installation work and the identification of formal and legal barriers, resulting, among other things, from conflicts with protected areas.
The following table presents an innovative and original example of a classification scheme in which all springs monitored within the Polish groundwater monitoring network of the Outer Carpathians have been assessed for their potential to implement automated measurements. This is of paramount importance in the studied region of the flysch Carpathians, where aquifers are characterized by an exceptionally short response time to infiltration; as indicated earlier, the potential implementation of automated systems capable of recording the full range of yield variability in continuous mode (or with a high measurement frequency) will enable the effective recording of these changes. This will thus enable advanced data analysis, taking into account seasonal or even daily variations, as well as the formulation of forecasts.
In order to optimize the implementation processes of modern measurement methods, this paper proposes four innovative and original classifications of springs that take into account ‘non-hydrogeological’ barriers.

3.3.1. The Proposed ‘F’ Classification Based on Formal, Legal and Ownership Criteria

The first classification concerns formal, legal and ownership conditions; designated as ‘Classification F’, it will form the basis for planning a long-term monitoring strategy, based on the criteria of durability and safety of the research infrastructure. Within this framework, three levels of stability for the location of a measuring point have been proposed (Table 9).
Category F1 (high stability) should include springs located on state-owned land, or alternatively within the administration of authorized bodies (national parks, state forests), where a regulated legal status and transparent administrative procedures guarantee a minimal risk of sudden interruption to the continuity of observations.
The proposed Category F2 (limited stability) presents a significantly greater operational challenge and covers springs located on private land made available for monitoring on the basis of fixed-term lease or loan agreements. Such locations require periodic renegotiation; moreover, in this case, unforeseen changes in ownership are possible.
The highest level, i.e., category F3 (outdoor use), applies to facilities that serve a practical purpose for their owners and/or local communities; this necessitates adapting automation technology to its primary supply function, sometimes limiting the scope for intervention in the design and infrastructure of the monitoring spring in question.

3.3.2. The Proposed ‘T’ Classification Based on Criteria for Readiness to Implement Measurement Automation

The proposed innovative classification, denoted by the symbol ‘T’, is based on an assessment of the technical and structural readiness for the automation of spring performance measurements. The application of this classification will enable an objective assessment of the existing infrastructure (Table 10) and, consequently, will allow for an estimation of the necessary investment expenditure and the scope of adaptation work required for the effective implementation of automated systems at a given point in the monitoring network.
The innovative T classification introduces three categories, where T1 (fully ready) covers sites with stable and secure technical infrastructure that provides sufficient space for the installation of recorders and antennas and ensures effective protection of the equipment against external factors (pre-modernized sites). Category T2 (requires adaptation) refers to poorly secured sites where there is no stable measurement cross-section. At these locations, engineering and technical work is required (e.g., construction of a measurement platform) and a secure installation site must be provided to protect the equipment from vandalism and the effects of weather conditions. Category T3 (not ready) covers springs with the lowest implementation potential, situated in unfavorable terrain conditions, on steep slopes, directly in stream beds, on steep, unstable embankments, or in areas with a complete lack of GSM coverage (in so-called communication dead zones). Implementing telemetry in these locations precludes a standard approach.

3.3.3. The Proposed ‘S’ Classification Based on the Method of Capturing Them and Technical Infrastructure

The third proposed innovative classification of springs based on the method of capturing them is based on the type of technical infrastructure currently in place at the spring, which directly influences the selection and applicability of flow measurement methods and telemetry technology (Table 11).
The following five methods of capturing the spring were identified: pipe intake (the outflow is captured directly by a discharge pipe), weir intake (a concrete barrier erected across the outflow to dam up the water, which is discharged through a pipe), an intake chamber (various types of tanks and boxes collecting water from the spring with a discharge pipe), a measuring weir (springs with a permanent barrier built in, featuring a cut-out measuring opening), and a ring casing (a spring enclosed within a vertical series of concrete rings with a discharge pipe).

3.3.4. The Proposed ‘N’ Classification Based on Criteria Relating to Conflicts with Protected Areas

The latest proposed, innovative and hitherto unused ‘N’ classification is based on an assessment of nature conservation regimes and environmental constraints relating to potential conflicts arising from the implementation of spring automation in light of the objectives of designated protected areas. Given the location of the sites under study in regions of high natural value, it seems essential to introduce the proposed separate classification based on forms of nature conservation. The regime of protected areas directly determines the scope of possible engineering works, the type of equipment masking used, and the timeframe for administrative processes related to obtaining permits for infrastructure modernization. Within this classification system, four categories have been identified: N1, N2, N3 and N4 (Table 12).
Category N1—high protection level; this covers springs located within national parks and nature reserves, where the installation of automatic flow measurement devices requires individual consent from nature conservation authorities and is often subject to restrictions on equipment (prohibition of visible antennas, requirement for natural casings) and limitations on the use of photovoltaic panels.
Category N2—medium protection level, covering springs located within landscape parks, NATURA 2000 sites and protected landscape areas, where the focus is on protecting groundwater-dependent ecosystems (GDE). The implementation of automated measurements of spring flow rates requires consultation with regional environmental protection authorities, although the forms of protection usually necessitate non-invasive methods of sensor installation that do not disrupt the natural drainage regime.
Category N3—point protection—applies to situations where the spring itself is a legally protected site, i.e., most commonly a natural monument. Any interference with the spring basin or the concreting of the spring thresholds is prohibited, which directly dictates the choice of a non-contact measurement method (e.g., radar loggers suspended above the water surface).
The final category, N4—areas with standard environmental conditions—covers sites located outside designated protected areas, where the development process is subject to general legal provisions regarding environmental protection, water use and the conduct of construction works.

3.3.5. Summary of the Proposed Innovative Classifications of Springs

To address the subjective nature of expert-based classifications and provide a structured validation of the F-T-S-N framework Automation Readiness Index (ARI) was developed. The ARI transforms the descriptive categories into a weighted ranking system to evaluate the practical feasibility of telemetry implementation. Scores were assigned to the barriers that directly dictate implementation success: Formal (F1 = 3, F2 = 2, F3 = 1), Technical (T1 = 3, T2 = 2, T3 = 1), and Nature/Environmental (N4 = 4, N3 = 3, N2 = 2, N1 = 1). The S category (infrastructure) dictates the choice of sensor type rather than acting as an absolute implementation barrier, and was thus excluded from the numerical scoring. By summing the assigned points, each spring receives a cumulative ARI score (ranging from 3 to 10), where higher values indicate fewer implementation barriers. This scoring system demonstrates the practical usefulness of the framework as a decision-making tool, allowing water authorities to objectively prioritize network modernization (e.g., targeting springs with the highest ARI for initial pilot deployments).
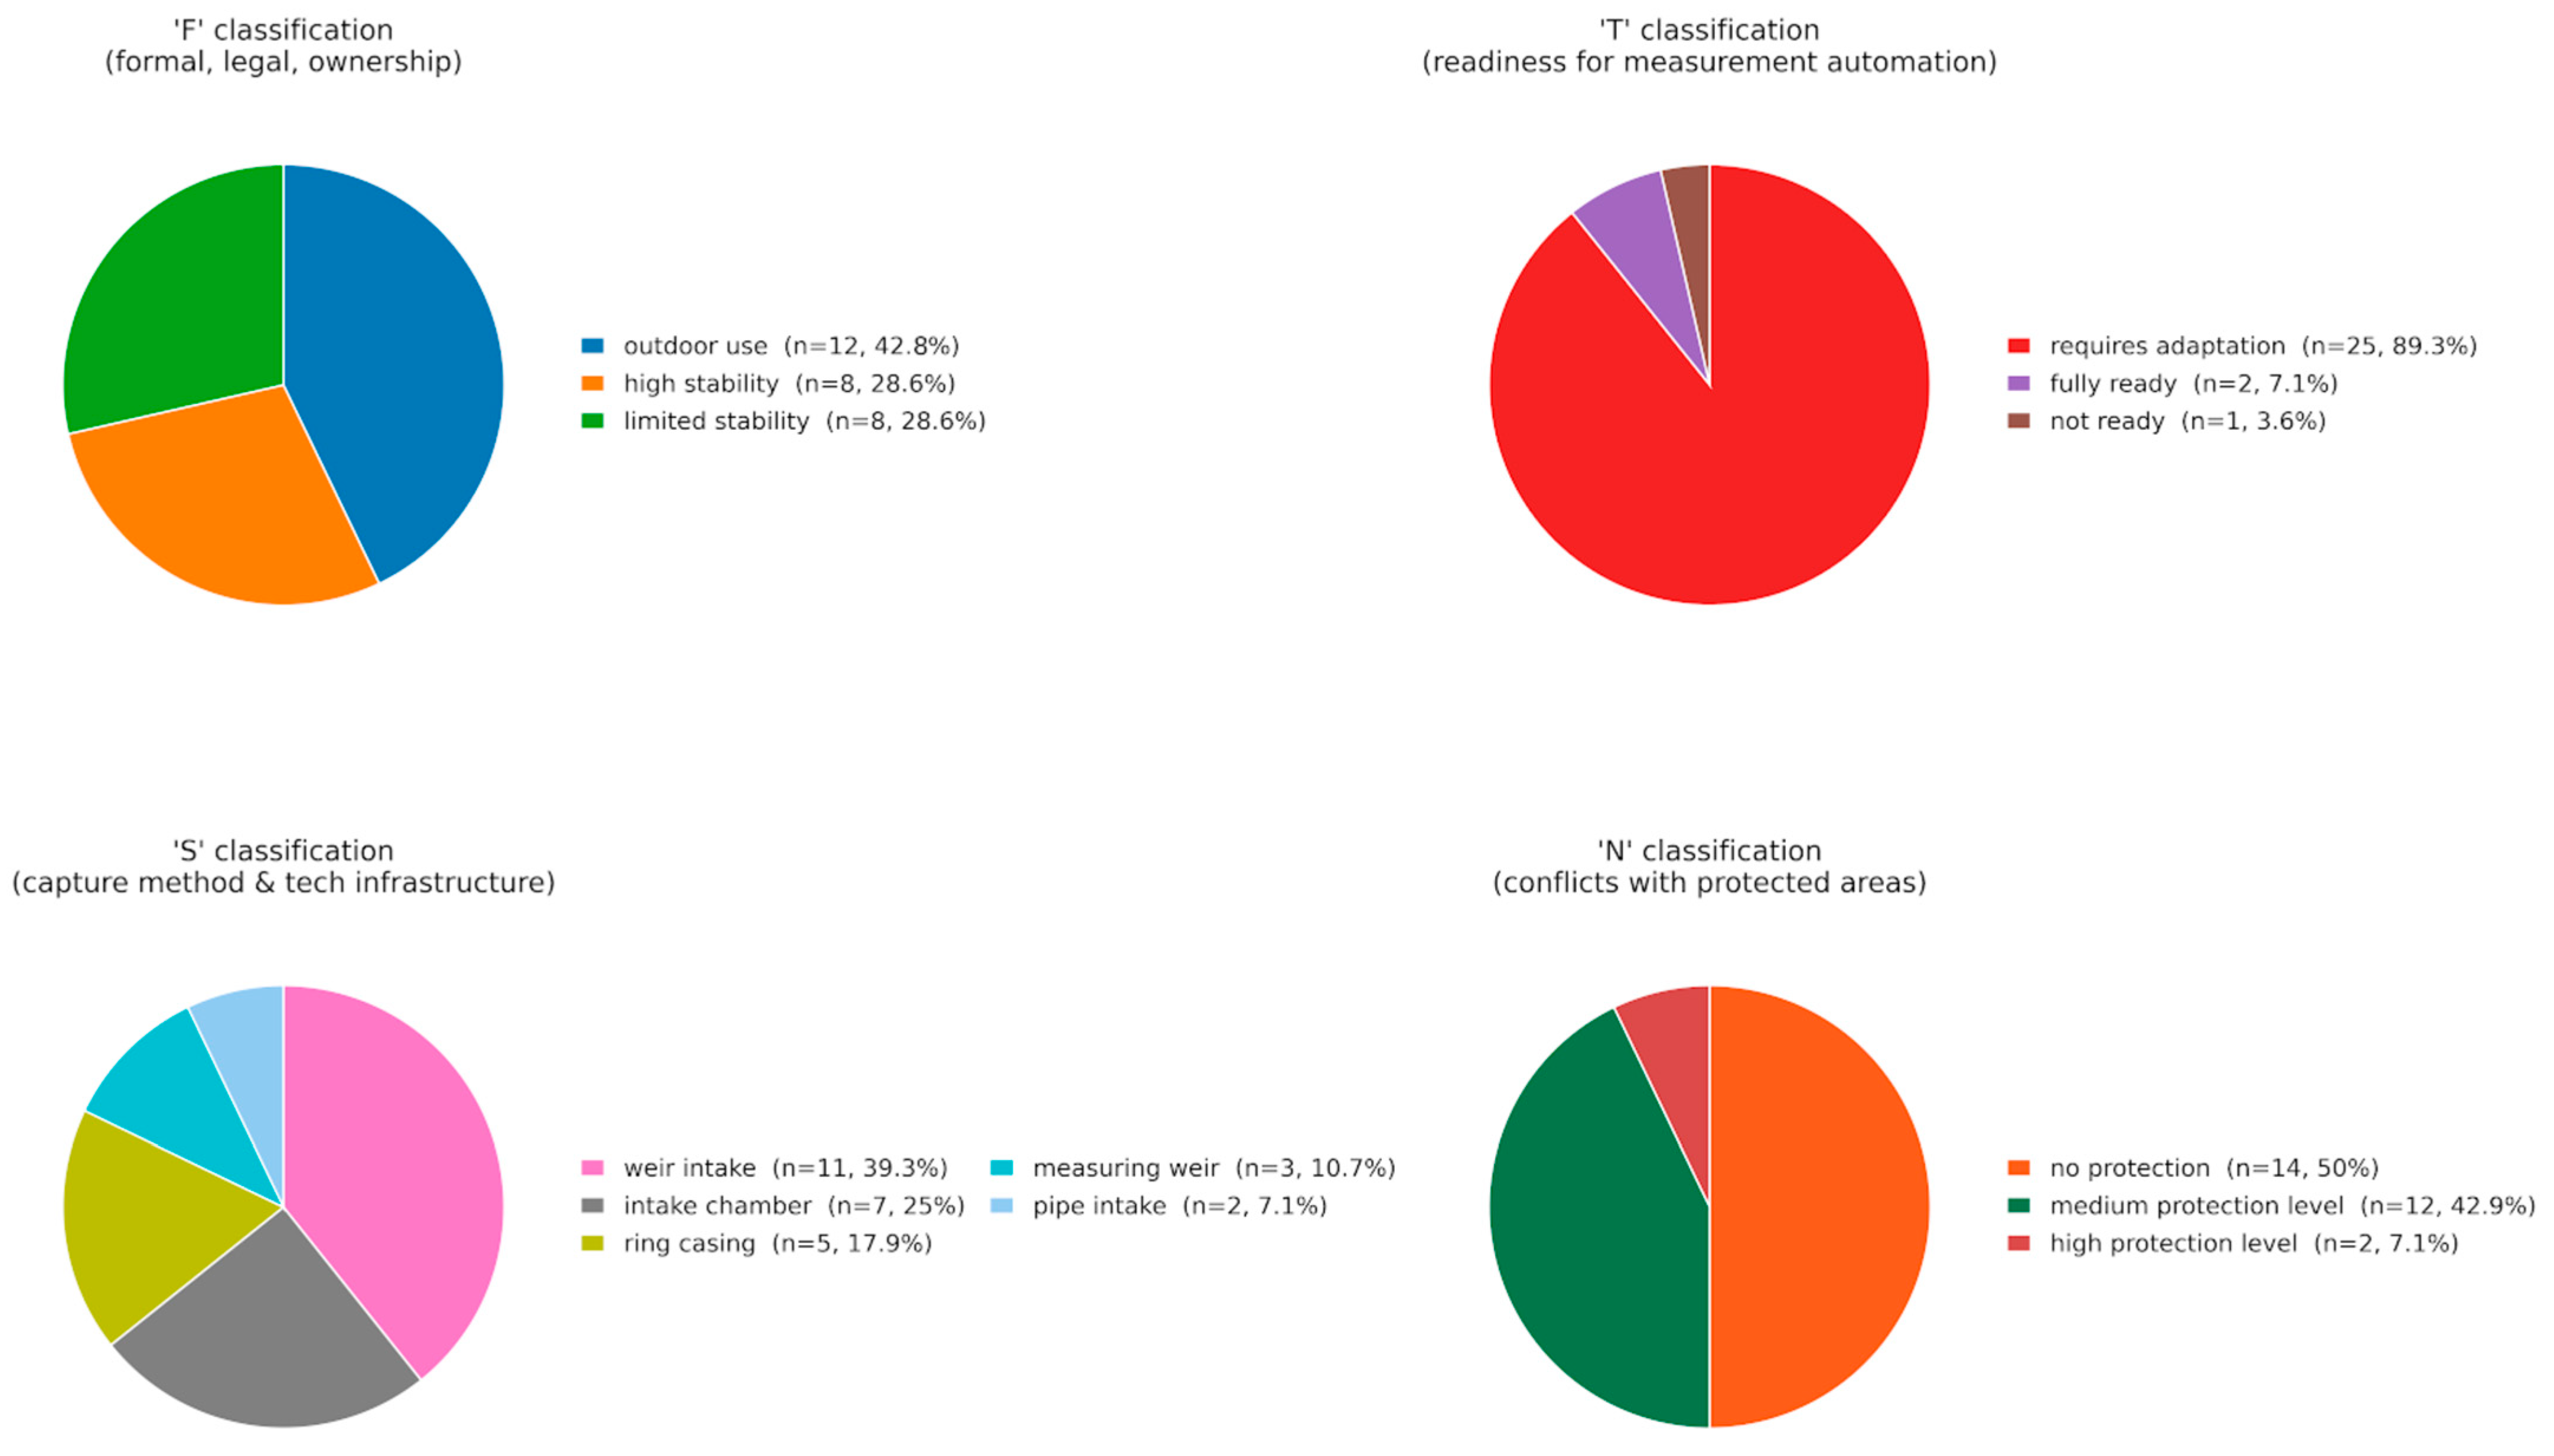
The proposed proprietary classifications F, T, S and N are highly versatile, allowing for their widespread implementation beyond the scope of the Polish groundwater spring monitoring network. These classifications can be successfully used in the design of automation systems for any springs forming the basis of water supply for local waterworks, testing points or springs of environmental importance. Given that the proposed classification criteria focus on objective technical, ownership and site-specific barriers, this classification system has significant potential for international implementation. Only classification S (based on nature conservation regimes and environmental restrictions) would require minor adaptations to the legislative conditions and nomenclature of protection measures in force in other countries. Nevertheless, whilst maintaining the same gradation of protection levels, the proposed criterion could serve as a universal tool in the process of automating spring discharge measurements, with the aim of increasing their frequency and thereby enabling the conduct and analysis of real-time, comprehensive observations covering the full range of their natural variability. The results of the proposed proprietary classifications of the monitored springs presented above are summarized in Table 13 and Figure 7.

4. Discussion

The results obtained in this study clearly demonstrate that springs located within the flysch Carpathians represent highly dynamic hydrogeological systems, characterized by rapid responses to precipitation and limited storage capacity. This behaviour is consistent with previous studies conducted in mountainous and fractured aquifers, where groundwater circulation is dominated by shallow flow systems and short residence times, resulting in highly variable discharge regimes [41,42,43,44,50].
From a theoretical hydrogeological perspective, the extreme discharge variability documented in this study reflects the specific recharge-discharge dynamics of the Carpathian flysch. Fractured mountain aquifers inherently function as “high-pass filters” for climatic forcing. Due to limited matrix storage and high fracture transmissivity, precipitation events trigger rapid pressure propagation rather than gradual mass transport. Consequently, recharge pulses are translated almost immediately into discharge peaks. While we cannot arbitrarily generalize these specific flow amplitudes to all mountain ranges without direct comparative analysis, the underlying hydrodynamic process whereby highly impulsive systems cause “signal aliasing” (data loss) when monitored at low frequencies (weekly) is firmly grounded in hydrogeological theory. Therefore, our findings demonstrate that continuous telemetry is not merely a technological upgrade, but a methodological necessity to avoid the systematic underestimation of dynamic resources in structurally comparable fractured or karstic aquifers.
The dominance of highly variable springs (R > 50) identified in this study confirms that traditional monitoring approaches based on weekly manual measurements are insufficient to capture the full spectrum of discharge fluctuations. This limitation has been widely recognized in recent hydrological research, which emphasizes that low-frequency datasets may lead to substantial underestimation of peak flows and misinterpretation of recharge processes [51,52]. In highly dynamic systems such as fissured and karst aquifers, hydrological responses to precipitation may occur on timescales of hours to days, rendering conventional observation intervals inadequate [38,40]. The results of the Meinzer variability index (V), which classified all analysed springs as variable, further reinforce the necessity of implementing automated monitoring systems. Comparable findings have been reported in studies of karst and mountain aquifers, where continuous monitoring has proven essential for identifying recession characteristics, storage properties, and recharge dynamics [41,42]. Moreover, high-frequency monitoring has been shown to significantly improve the understanding of hydrological processes and reduce uncertainty in water balance assessments [53,54].
In order to fully characterize the complex drainage regime of the Flysch Carpathians, this study uses two different indices: the classic coefficient of variation (CV; Table 1) and the hydrogeological Meinzera coefficient of variation (V). The CV index, based on the standard deviation, describes the overall dispersion of data around the mean. It allows for the identification of springs with a more stable base regime (CV < 50%), indicating deeper circulation and higher rock mass retention, as their discharge does not undergo sudden fluctuations most of the time. In contrast, the V index is based on historical flow extremes: the absolute maximum (Qmax) and minimum (Qmin). Even if a spring is stable most of the time (low CV), a single massive, one-day surge in discharge following a downpour (flood peak) will push the V index well above 100%.
A situation in which a source with a relatively low CV simultaneously achieves a V index > 100% is not a contradiction. This means that the aquifer system functions stably on a daily basis, but occasionally responds to extreme meteorological events with massive, very short-lived floods. The fact that all 28 studied springs (100%) were classified as ‘variable’ according to the rigorous Meinzera index (V > 100%) provides strong evidence of the impulsive nature of Carpathian springs.
The results of the Meinzer variability index (V), which classified all analysed springs as variable, further reinforce the necessity of implementing automated monitoring systems. Comparable findings have been reported in studies of karst and mountain aquifers, where continuous monitoring has proven essential for identifying recession characteristics, storage properties, and recharge dynamics [41,42]. Moreover, high-frequency monitoring has been shown to significantly improve the understanding of hydrological processes and reduce uncertainty in water balance assessments [53,54]. In this context, the Carpathian springs can be considered representative of a broader class of hydrogeological systems requiring modernization of monitoring strategies.
The results of the discharge variability analysis clearly indicate that the flysch Carpathian springs are characterized by an extremely impulsive regime. The dataset under analysis provides empirical evidence for the inadequacy of standard monitoring protocols. The analysed springs showed an average coefficient of variation (V) exceeding 100%, with extreme cases reaching much higher values. As part of standard weekly measurements, more peak flow events (crucial for calculating groundwater recharge) would be statistically omitted. Specifically, for flashy springs in flysch formations, the time to peak after intensive rainfall is often shorter than 24 h. Frequency is unattainable for manual fieldwork but easily captured by the proposed automated telemetry systems. Consequently, the transition to automated telemetry is not merely a technical upgrade but a methodological necessity for accurate groundwater assessment. However, it should be noted that the current conclusions regarding peak flow omission are based primarily on statistical estimations. A precise, empirical comparison of data quality and its practical utility will be determined using the results from a planned pilot implementation of continuous automated measurements on a selected spring belonging to the national groundwater monitoring network in southern Poland.
From a cost-effectiveness perspective, the implementation of automated telemetry systems involves significant initial capital expenditures (CAPEX) for the purchase of equipment (loggers, transmission modules) and its professional installation, including the technical adaptation of outflow points. However, in the long term, operating costs (OPEX) drop drastically. Given the high frequency of recording (e.g., hourly vs. once a month), the unit “cost of acquiring a single data record” in an automated system is a fraction of the cost of manual measurement, which requires qualified personnel to travel to difficult terrain each time. Furthermore, the quantitative value of the automated system lies in its ability to capture extreme peaks without loss (which are critical for resource balancing), whereas in the traditional model, these are irretrievably lost.
The final implementation costs do not depend solely on the selection of specific measuring equipment. They are strictly determined by the current technical and environmental condition of the chosen spring, the financial outlays required to physically adapt the site for device installation, and various other local factors. Due to the high variability of geological, topographical, and formal conditions, each spring requires an individual approach. Consequently, the total cost of site adaptation and subsequent automation will be unique for every single monitoring point. A precise economic evaluation will only be possible following the planned pilot implementation of automated measurements on a selected spring within the national groundwater monitoring network.
An important contribution of this study is the identification of non-technological barriers as the primary limitation to the implementation of telemetry systems. While recent technological developments, including low-cost sensor networks and automated data transmission, have significantly increased the feasibility of high-frequency monitoring [55], their practical implementation is often constrained by legal, administrative, and environmental factors. Similar challenges have been identified in groundwater governance studies, which highlight the role of institutional complexity, land ownership, and regulatory frameworks as key limiting factors [7,56]. This finding underscores the need to move beyond purely technical solutions and adopt integrated approaches to monitoring network development.
The proprietary classification system proposed in this study (F, T, S, N) represents a novel methodological contribution that extends traditional hydrogeological classifications. By incorporating formal-legal, technical, and environmental criteria, the proposed framework addresses a critical gap in existing approaches, which typically focus exclusively on physical characteristics of springs. This aligns with broader trends in hydrogeology and water resource management, emphasizing the importance of integrating scientific, technical, and governance dimensions [3,6]. Comparable integrative approaches have been proposed mainly in the context of surface water monitoring system design [57], highlighting the innovative nature of applying such concepts to groundwater spring monitoring.
From a broader perspective, the findings of this study are highly relevant in the context of climate change and increasing hydrological variability. Recent studies indicate that shifts in precipitation patterns and the growing frequency of extreme events significantly affect groundwater recharge and discharge dynamics [5,8]. Springs, due to their integrative character, may serve as early indicators of both drought development and rapid recharge events, providing valuable information for adaptive water resource management. In this regard, the role of springs as “natural sensors” of aquifer response is increasingly recognized in contemporary hydrogeological research.
Furthermore, the results highlight that optimizing monitoring networks should focus not only on increasing the number of observation points but primarily on improving data quality and temporal resolution. This conclusion is consistent with recent recommendations advocating the development of “smart monitoring networks” that integrate high-frequency measurements, remote sensing data, and advanced analytical tools [17,58]. In such systems, springs may complement borehole-based monitoring by providing cost-effective and hydrologically representative observation points.
The integration of high-frequency monitoring data with advanced modeling techniques, including machine learning approaches, represents a promising direction for future research. Recent studies demonstrate that data-driven models can significantly enhance the prediction of groundwater dynamics, particularly in complex and data-scarce environments [59]. In combination with automated monitoring systems, such approaches may substantially improve the forecasting of hydrological extremes and support more effective groundwater management.
Future research should focus on the practical implementation of automated monitoring systems at selected representative springs, particularly those characterized by favorable technical and legal conditions (e.g., F1 and T1 categories). It is also recommended to integrate spring discharge data with meteorological observations and satellite-based datasets to improve the understanding of recharge processes and system responses. Finally, the applicability of the proposed classification framework should be tested in other hydrogeological settings, including karst regions and lowland aquifers, to assess its universality and potential for broader implementation.
To provide a clear perspective on the practical and methodological implications of the proposed transition, Table 14 presents a simplified comparison between current traditional manual monitoring methods and the automated telemetry strategy advocated in this study. This juxtaposition highlights the critical trade-offs between initial investments, long-term operational costs, and the scientific value of the acquired data, particularly in the context of capturing the highly dynamic responses of Carpathian springs.

4.1. Mitigation Strategies for F-T-N Implementation Barriers

Identifying multidimensional implementation barriers using the proprietary F-T-N classification is an essential step in planning a modern monitoring network. However, from the perspective of practical water resource management, simply diagnosing these constraints is insufficient. To fully exploit the potential of springs as automated “natural sensors” in the demanding environment of the Carpathian Flysch, it is necessary to implement integrated mitigation strategies. The following subsection presents a set of selected recommended, pragmatic mitigation strategies and technological compromises. These strategies allow for the effective overcoming of some of the identified formal-legal, technical, and environmental obstacles, thereby demonstrating that the proposed transition from traditional manual measurements to high-frequency systems is not only methodologically justified but also operationally feasible.
Overcoming formal and legal barriers (F) related to the complex status of land ownership and lease agreements requires a systemic approach at the institutional level. Instead of individually negotiating each agreement for a single water source, it is recommended to develop standardized agreement templates (e.g., based on the principle of “measurement easement”) with the main managers of mountain areas, such as the State Forests or local government units. Early engagement of local stakeholders and transparent communication of the research objective as an initiative for the sustainable management of shared water resources significantly shortens the processing time for administrative permits.
On the other hand, technical and structural limitations (T), such as lack of access to the power grid or the “communication dead zones” (areas without GSM/LTE coverage) common in deep valleys, necessitate a flexible approach to equipment selection. An effective way to circumvent the power supply issue is to use highly energy-efficient (low-power) sensors, coupled with discrete photovoltaic panels and gel batteries. In areas completely devoid of cellular coverage, local radio networks (e.g., LoRaWAN) or satellite modules can be deployed. However, in the deepest “communication shadows,” where real-time transmission is technically impossible or economically unfeasible, the use of autonomous data loggers becomes necessary. These devices record measurement results in their internal memory at a preset, high frequency without transmitting them remotely. While this solution does require scheduling periodic field visits to manually download the data, the frequency of these inspections can be flexibly adjusted to the specific characteristics, dynamics, and research importance of a particular source (e.g., once a quarter or following a period of intense snowmelt). This drastically reduces costs and labour compared to frequent, traditional manual measurements, while ensuring loss-free continuity of hydrograph recording and maintaining the appropriate technical standard of the station. The necessity of physical presence at the site can be an advantage in this case, as it necessitates periodic field visits, which allow for ongoing monitoring of the environmental condition of the source itself and an assessment of the technical condition of the intake infrastructure and measuring equipment.
The most sensitive aspect of implementation is environmental barriers (N), which are typical of areas with the highest level of protection, such as national parks or Natura 2000 sites. To minimize interference with the ecosystem and preserve landscape values, it is essential to use extremely compact measuring devices and to camouflage them precisely and aesthetically using local, natural materials (e.g., local stone or wood), which prevents visual disruption and acts of vandalism. Furthermore, all infrastructure work must be rigorously scheduled according to the natural calendar, using only minimally invasive installation techniques that do not disrupt the natural drainage regime of the spring or the structures of groundwater-dependent ecosystems (GDEs).

4.2. Limitations and Uncertainties

Despite the robust empirical basis and the clear implications of the results, several limitations and sources of uncertainty must be explicitly acknowledged to ensure a balanced interpretation of the findings.
The analysis is based on long-term monitoring datasets characterized by relatively low temporal resolution, as discharge measurements were conducted at weekly intervals. Such sampling frequency inherently limits the ability to capture short-lived hydrological events, particularly rapid peak flows and recession dynamics typical for highly responsive mountain aquifers. In addition, the time series contains gaps resulting from the nature of manual observations, including temporary inaccessibility of sites or observer absence. Although these gaps were not artificially filled to preserve data integrity, they introduce discontinuities that may affect statistical representativeness. Furthermore, the absence of high-frequency (automated) validation datasets prevents direct benchmarking of the magnitude of information loss associated with manual monitoring.
The study relies primarily on descriptive statistical indicators (CV, V, and R) to characterize discharge variability and system dynamics. While these indices are well-established in hydrogeology and provide a transparent and reproducible basis for interpretation, they do not capture the full complexity of temporal processes. In particular, no time-series modeling (e.g., spectral analysis, autocorrelation, or event-based modeling) was applied, which limits the ability to quantify system memory, lag times, or recharge mechanisms in detail. Moreover, due to the lack of high-resolution data, it is not possible to directly quantify the exact magnitude and duration of missed peak flow events; their occurrence is inferred indirectly from variability indices rather than observed explicitly.
The proposed F-T-S-N classification framework and the derived Automation Readiness Index (ARI) constitute a novel methodological contribution; however, they are subject to inherent limitations. The classification is partly based on expert judgment, particularly in the assignment of categories related to technical readiness, legal conditions, and environmental constraints. This introduces a degree of subjectivity that may influence the final ranking of sites. In addition, the framework has not yet been subjected to independent validation or formal sensitivity analysis, and the weighting scheme used in the ARI remains heuristic. Finally, the study represents a case-study approach focused on a single hydrogeological region (the flysch Carpathians), which may limit the direct transferability of the scoring system without prior regional adaptation.
Given the above limitations, the results presented in this study should not be interpreted as a fully quantitative assessment of groundwater system dynamics. Instead, they should be understood as a structured, evidence-based indication of the inadequacy of low-frequency monitoring and as a decision-support framework for the prioritization of monitoring network modernization. The primary strength of the study lies in identifying systemic gaps and operational constraints rather than in providing exact numerical quantification of hydrological processes.

5. Conclusions

Springs within the Carpathian sector of the national groundwater monitoring network are characterized by high discharge variability and rapid responses to precipitation, making weekly manual measurements insufficient for capturing flow dynamics and assessing groundwater resources. This limitation leads to underestimation of extreme events and reduces the reliability of hydrogeological interpretations.
The study highlights that effective and sustainable monitoring of dynamic mountainous aquifers requires a transition toward automated systems. However, the key barriers to implementation are predominantly non-technological, including legal constraints related to land ownership and environmental restrictions in protected areas.
To support evidence-based decision-making, this study introduces the F-T-S-N framework and the Automation Readiness Index (ARI), which enable objective prioritization of monitoring sites for telemetry deployment. This approach improves the efficiency of resource allocation and facilitates the gradual modernization of monitoring networks.
Although developed for the Polish Carpathian context, the proposed methodology is transferable and can support the sustainable, cost-effective upgrading of groundwater monitoring systems in other regions with complex hydrogeological conditions.

Author Contributions

Conceptualization, M.J. and A.O.; methodology, M.J. and A.O.; formal analysis, M.J. and A.O.; investigation, M.J., K.M. and A.O.; resources, M.J., K.M. and A.O.; data curation, M.J., K.M. and A.O.; writing—original draft preparation, M.J. and A.O.; writing—review and editing, M.J. and A.O.; visualization, M.J.; supervision, A.O.; funding acquisition, M.J. and A.O. All authors have read and agreed to the published version of the manuscript.

Funding

This research was funded by Ministry of Science and Higher Education, grant number DWD/9/0002/2025.

Institutional Review Board Statement

Not applicable.

Informed Consent Statement

Not applicable.

Data Availability Statement

The original contributions presented in this study are included in the article. Further inquiries can be directed to the corresponding author.

Conflicts of Interest

The authors declare no conflicts of interest.

Abbreviations

The following abbreviations are used in this manuscript:
PIG-PIBPolish Geological Institute—National Research Institute
GWBsGroundwater bodies
WFDWater Framework Directive

References

  1. Rodella, A.-S.; Zaveri, E.; Bertone, F. (Eds.) The Hidden Wealth of Nations: The Economics of Groundwater in Times of Climate Change; World Bank: Washington, DC, USA, 2023. [Google Scholar] [CrossRef]
  2. Davamani, V.; John, J.E.; Poornachandhra, C.; Gopalakrishnan, B.; Arulmani, S.; Parameswari, E.; Santhosh, A.; Srinivasulu, A.; Lal, A.; Naidu, R. A Critical Review of Climate Change Impacts on Groundwater Resources: A Focus on the Current Status, Future Possibilities, and Role of Simulation Models. Atmosphere 2024, 15, 122. [Google Scholar] [CrossRef]
  3. Mukherjee, A.; Jha, M.K.; Kim, K.W.; Pacheco, F.A.L. Groundwater resources: Challenges and future opportunities. Sci. Rep. 2024, 14, 28540. [Google Scholar] [CrossRef]
  4. Cuthbert, M.O.; Gleeson, T.; Moosdorf, N.; Befus, K.M.; Schneider, A.; Hartmann, J.; Lehner, B. Global patterns and dynamics of climate–groundwater interactions. Nat. Clim. Change 2019, 9, 137–141. [Google Scholar] [CrossRef]
  5. Rusli, S.R.; Bense, V.F.; Mustafa, S.M.; Weerts, A.H. The impact of future changes in climate variables and groundwater abstraction on basin-scale groundwater availability. Hydrol. Earth Syst. Sci. 2024, 28, 5107–5131. [Google Scholar] [CrossRef]
  6. Gleeson, T.; Cuthbert, M.; Ferguson, G.; Perrone, D. Global groundwater sustainability, resources, and systems in the Anthropocene. Annu. Rev. Earth Planet. Sci. 2020, 48, 431–463. [Google Scholar] [CrossRef]
  7. Petersen-Perlman, J.D.; Aguilar-Barajas, I.; Megdal, S.B. Drought and groundwater management: Interconnections, challenges, and policy responses. Curr. Opin. Environ. Sci. Health 2022, 28, 100364. [Google Scholar] [CrossRef]
  8. Barendrecht, M.H.; Matanó, A.; Mendoza, H.; Weesie, R.; Rohse, M.; Koehler, J.; de Ruiter, M.; Garcia, M.; Mazzoleni, M.; Aerts, J.C.J.H.; et al. Exploring drought-to-flood interactions and dynamics: A global case review. WIREs Water 2024, 11, e1726. [Google Scholar] [CrossRef]
  9. Wałęga, A.; Cebulska, M.; Ziernicka-Wojtaszek, A.; Młocek, W.; Wałęga, A.; Nieróbca, A.; Caloiero, T. Spatial and temporal variability of meteorological droughts including atmospheric circulation in Central Europe. J. Hydrol. 2024, 642, 131857. [Google Scholar] [CrossRef]
  10. Rutkowska, A.; Willems, P.; Mendoza Paz, S.; Ziernicka-Wojtaszek, A. Changes in Precipitation Patterns in Poland Derived From Projected Downscaled Future Climate Data From CMIP5 and CMIP6. Int. J. Climatol. 2025, 45, e8822. [Google Scholar] [CrossRef]
  11. Kitterød, N.-O.; Kværner, J.; Aagaard, P.; Arustienė, J.; Bikše, J.; Dagestad, A.; Gundersen, P.; Hansen, B.; Hjartarson, Á.; Karro, E.; et al. Hydrogeology and groundwater quality in the Nordic and Baltic countries. Hydrol. Res. 2022, 53, 958–982. [Google Scholar] [CrossRef]
  12. Operacz, A.; Kurek, K.; Bugajski, P.; Pardal, A.; Simões, I.; Imaginário, M.J.; Castanheira, I.; Raposo, M.; Almeida, A. The physio-chemical conditions of surface and groundwater resources in water scarce areas—How droughts affect ions migration. Desalin. Water Treat. 2020, 207, 122–136. [Google Scholar] [CrossRef]
  13. Winid, B.; Chruszcz-Lipska, K.; Maruta, M.; Solecki, M.L. Water resources and climate change-groundwater as an alternative source of water supply. AGH Drill. Oil Gas 2020, 37, 5–14. [Google Scholar]
  14. Famiglietti, J.S. The global groundwater crisis. Nat. Clim. Change 2014, 4, 945–948. [Google Scholar] [CrossRef]
  15. Calderwood, A.J.; Pauloo, R.A.; Yoder, A.M.; Fogg, G.E. Low-cost, open source wireless sensor network for real-time, scalable groundwater monitoring. Water 2020, 12, 1066. [Google Scholar] [CrossRef]
  16. Babaei, M.; Ketabchi, H. Determining groundwater recharge rate with a distributed model and remote sensing techniques. Water Resour. Manag. 2022, 36, 5401–5423. [Google Scholar] [CrossRef]
  17. Dari, J.; Filippucci, P.; Brocca, L.; Quast, R.; Vreugdenhil, M.; Miralles, D.G.; Morbidelli, R.; Saltalippi, C.; Flammini, A. A novel approach for estimating groundwater recharge leveraging high-resolution satellite soil moisture. J. Hydrol. 2025, 652, 132678. [Google Scholar] [CrossRef]
  18. Lee, J.Y.; Yi, M.J.; Yoo, Y.K.; Ahn, K.H.; Kim, G.B.; Won, J.H. A review of the national groundwater monitoring network in Korea. Hydrol. Process. 2007, 21, 907–919. [Google Scholar] [CrossRef]
  19. Dawoud, M.A. Design of national groundwater quality monitoring network in Egypt. Environ. Monit. Assess. 2004, 96, 99–118. [Google Scholar] [CrossRef]
  20. Baalousha, H. Assessment of a groundwater quality monitoring network using vulnerability mapping and geostatistics: A case study from Heretaunga Plains, New Zealand. Agric. Water Manag. 2010, 97, 240–246. [Google Scholar] [CrossRef]
  21. Bhat, S.; Motz, L.H.; Pathak, C.; Kuebler, L. Geostatistics-based groundwater-level monitoring network design and its application to the Upper Floridan aquifer, USA. Environ. Monit. Assess. 2015, 187, 4183. [Google Scholar] [CrossRef]
  22. Renna Camacho, C.; Getirana, A.; Rotunno Filho, O.C.; Mourão, M.A.A. Large-scale groundwater monitoring in Brazil assisted with satellite-based artificial intelligence techniques. Water Resour. Res. 2023, 59, e2022WR033588. [Google Scholar] [CrossRef]
  23. Mokoena Fuku, P.; Lalumbe, L.; Chetty, T.; Ramusiya, F.; Maswuma, Z. Overview of the Limpopo regional groundwater level monitoring network, South Africa. Hydrogeol. J. 2025, 33, 2023–2039. [Google Scholar] [CrossRef]
  24. Kazimierski, B.; Sadurski, A. Monitoring wód podziemnych w świetle nowych zadań państwowej służby hydrogeologicznej. Prz. Geol. 2002, 50, 671–679. [Google Scholar]
  25. Podlasek, A.; Jakimiuk, A.; Vaverková, M.D.; Koda, E. Monitoring and assessment of groundwater quality at landfill sites: Selected case studies of Poland and the Czech Republic. Sustainability 2021, 13, 7769. [Google Scholar] [CrossRef]
  26. Dąbrowska, D.; Witkowski, A.; Sołtysiak, M. Representativeness of the groundwater monitoring results in the context of its methodology: Case study of a municipal landfill complex in Poland. Environ. Earth Sci. 2018, 77, 266. [Google Scholar] [CrossRef]
  27. Rozemeijer, J.; Jordan, P.; Hooijboer, A.; Kronvang, B.; Glendell, M.; Hensley, R.; Rinke, K.; Stutter, M.; Bieroza, M.; Turner, R.; et al. Best practice in high-frequency water quality monitoring for improved management and assessment; a novel decision workflow. Environ. Monit. Assess. 2025, 197, 353. [Google Scholar] [CrossRef]
  28. Operacz, A.; Jóźwiakowski, K.; Rodziewicz, J.; Janczukowicz, W.; Bugajski, P. Impact of Climate Conditions on Pollutant Concentrations in the Effluent from a One-Stage Constructed Wetland: A Case Study. Sustainability 2023, 15, 13173. [Google Scholar] [CrossRef]
  29. Operacz, A.; Tomaszewska, B. The review of Polish formal and legal aspects related to hydropower plants. Environ. Sci. Pollut. Res. 2016, 23, 18953–18959. [Google Scholar] [CrossRef]
  30. Przytuła, E.; Mikołajczyk, A.; Gidziński, T.; Kuczyńska, A.; Palak-Mazur, D.; Prażak, J.; Woźnicka, M.; Wyszomierski, M.; Cabalska, J.; Galczak, M.; et al. Historia monitoringu wód podziemnych w Państwowym Instytucie Geologicznym. Prz. Geol. 2019, 67, 982–994. [Google Scholar]
  31. Minister Środowiska. Rozporządzenie Ministra Środowiska z Dnia 13 Maja 2009 r. w Sprawie Form i Sposobu Prowadzenia Monitoringu Jednolitych Części Wód Powierzchniowych i Podziemnych. Poland. 2009. Available online: https://isap.sejm.gov.pl/isap.nsf/DocDetails.xsp?id=WDU20170001566 (accessed on 28 February 2026).
  32. Kazimierski, B.; Pilichowska-Kazimierska, E. Monitoring i ocena stanu wód podziemnych. Monit. Środowiska Przyr. 2006, 7, 9–19. [Google Scholar]
  33. Freiwald, P.; Owsiak, P.; Witek, K. Specyfika sieci monitorujących wody podziemne na obszarze Karpat. Biul. Państwowego Inst. Geol. 2013, 456, 139–144. [Google Scholar]
  34. Operacz, A.; Zachora-Buławska, A.; Strzelecka, I.; Buda, M.; Bielec, B.; Migdał, K.; Operacz, T. The standard geothermal plant as an innovative combined renewable energy resources system: The case from South Poland. Energies 2022, 15, 6398. [Google Scholar] [CrossRef]
  35. Wątor, K.; Dobrzyński, D. Towards a better practice in water sampling: Case studies on used in practice geothermal waters. Chemosphere 2022, 303, 134913. [Google Scholar] [CrossRef]
  36. Państwowy Instytut Geologiczny. EPSH. Available online: https://epsh.pgi.gov.pl/epsh/ (accessed on 18 March 2026).
  37. Państwowy Instytut Geologiczny. Geolog. Available online: https://geolog.pgi.gov.pl/ (accessed on 18 March 2026).
  38. Song, X.; Hao, H.; Liu, W.; Wang, Q.; An, L.; Yeh, T.C.J.; Hao, Y. Spatial-temporal behavior of precipitation driven karst spring discharge in a mountain terrain. J. Hydrol. 2022, 612, 128116. [Google Scholar] [CrossRef]
  39. Zhou, R.; Zhang, Y. Linear and nonlinear ensemble deep learning models for karst spring discharge forecasting. J. Hydrol. 2023, 627, 130394. [Google Scholar] [CrossRef]
  40. Hartmann, A.; Goldscheider, N.; Wagener, T.; Lange, J.; Weiler, M. Karst water resources in a changing world: Review of hydrological modeling approaches. Rev. Geophys. 2014, 52, 218–242. [Google Scholar] [CrossRef]
  41. Tóth, Á.; Kovács, S.; Kovács, J.; Mádl-Szőnyi, J. Springs regarded as hydraulic features and interpreted in the context of basin-scale groundwater flow. J. Hydrol. 2022, 610, 127907. [Google Scholar] [CrossRef]
  42. Kadić, A.; Denić-Jukić, V.; Jukić, D. Exceeding turbidity versus karst spring discharge during single rainfall events: The case of the Jadro spring. Water 2023, 15, 2589. [Google Scholar] [CrossRef]
  43. Gizzi, M.; Mondani, M.; Taddia, G.; Suozzi, E.; Lo Russo, S. Aosta valley mountain springs: A preliminary analysis for understanding variations in water resource availability under climate change. Water 2022, 14, 1004. [Google Scholar] [CrossRef]
  44. Medici, G.; Lorenzi, V.; Sbarbati, C.; Manetta, M.; Petitta, M. Structural classification, discharge statistics, and recession analysis from the springs of the Gran Sasso (Italy) carbonate aquifer; comparison with selected analogues worldwide. Sustainability 2023, 15, 10125. [Google Scholar] [CrossRef]
  45. Stevens, L.E.; Schenk, E.R.; Springer, A.E. Springs ecosystem classification. Ecol. Appl. 2021, 31, e2218. [Google Scholar] [CrossRef]
  46. Meinzer, O.E. The Occurrence of Ground Water in the United States: With a Discussion of Principles; US Government Printing Office: Washington, DC, USA, 1923; Volume 489.
  47. Pazdro, Z.; Kozerski, B. Hydrogeologia Ogólna; Wydawnictwa Geologiczne: Warszawa, Poland, 1990. [Google Scholar]
  48. Keilhack, K. Lehrbuch der Grundwasser-und Quellenkunde für Geologen, Hydrologen, Bohrunternehmer, Brunnenbauer, Bergleute, Bauingenieure und Hygieniker; Gebrüder Borntraeger: Berlin, Germany, 1912. [Google Scholar]
  49. Maillet, E. Essais d’Hydraulique Souterraine et Fluviale; Herman: Paris, France, 1905. [Google Scholar]
  50. Chełmicki, W. Woda: Zasoby, Degradacja, Ochrona; PWN: Warszawa, Poland, 2001. [Google Scholar]
  51. Kirchner, J.W.; Neal, C. Universal fractal scaling in stream chemistry and its implications for solute transport and water quality trend detection. Proc. Natl. Acad. Sci. USA 2013, 110, 12213–12218. [Google Scholar] [CrossRef]
  52. McMillan, H.K.; Coxon, G.; Sikorska-Senoner, A.E.; Westerberg, I.K. Impacts of observational uncertainty on analysis and modelling of hydrological processes: Preface. Hydrol. Process. 2022, 36, e14481. [Google Scholar] [CrossRef]
  53. Rode, M.; Wade, A.J.; Cohen, M.J.; Hensley, R.T.; Bowes, M.J.; Kirchner, J.W.; Arhonditsis, G.B.; Jordan, P.; Kronvang, B.; Halliday, S.J.; et al. Sensors in the stream: The high-frequency wave of the present. Environ. Sci. Technol. 2016, 50, 10297–10307. [Google Scholar] [CrossRef]
  54. Blume, T.; van Meerveld, I.; Weiler, M. The role of experimental work in hydrological sciences–insights from a community survey. Hydrol. Sci. J. 2017, 62, 334–337. [Google Scholar] [CrossRef]
  55. Veness, W.A.; Butler, A.P.; Ochoa-Tocachi, B.F.; Moulds, S.; Buytaert, W. Localizing hydrological drought early warning using in situ groundwater sensors. Water Resour. Res. 2022, 58, e2022WR032165. [Google Scholar] [CrossRef]
  56. Quevauviller, P. (Ed.) Water System Science and Policy Interfacing; Royal Society of Chemistry: Cambridge, UK, 2009. [Google Scholar]
  57. Ward, R.C.; Loftis, J.C.; McBride, G.B. Design of Water Quality Monitoring Systems; John Wiley & Sons: New York, NY, USA, 1991. [Google Scholar]
  58. Tauro, F.; Selker, J.; Van De Giesen, N.; Abrate, T.; Uijlenhoet, R.; Porfiri, M.; Manfreda, S.; Caylor, K.; Moramarco, T.; Benveniste, J.; et al. Measurements and observations in the XXI century (MOXXI): Innovation and multi-disciplinarity to sense the hydrological cycle. Hydrol. Sci. J. 2018, 63, 169–196. [Google Scholar] [CrossRef]
  59. Shen, C. A transdisciplinary review of deep learning research and its relevance for water resources scientists. Water Resour. Res. 2018, 54, 8558–8593. [Google Scholar] [CrossRef]
Figure 1. Locations of hydrogeological stations the PIG-PIB National Groundwater Observation and Research Network.
Sustainability 18 04293 g001
Figure 2. Springs serving as monitoring hydrogeological stations within the operational area of the Carpathian Branch of PIG-PIB (details of the points shown in Table 1).
Sustainability 18 04293 g002
Figure 3. Measuring discharge of a spring using (a) the volumetric method, (b) hydrometric wheel method.
Sustainability 18 04293 g003
Figure 4. Charts showing the variability in discharge of selected Carpathian springs (a) no. 3 * Kamesznica (b); no. 7 * Babica (c); np. 15 * Dębno (d); no. 27 * Wetlina (* points details shown in Table 1).
Sustainability 18 04293 g004
Figure 5. Conceptual diagram illustrating springs as natural sensors linking climatic forcing, flysch hydro-geology, monitoring approaches, and multi-criteria screening.
Sustainability 18 04293 g005
Figure 6. Summary distribution of the monitored springs according to traditional classification criteria acc. Table 2.
Sustainability 18 04293 g006
Figure 7. Summary distribution of the monitored springs according of the proposed classifications acc. Table 13.
Sustainability 18 04293 g007
Table 1. Descriptive statistics of the springs discharge under study.
Spring
No. Per Figure 2
NameLength of the Measurement Run
[Years]
Number of DataMin
[L/s]
Max
[L/s]
Mean
[L/s]
Median [L/s]SDCV%
1Ustroń-Dobka3719070.0312.820.750.500.93123.65
2Szyndzielnia126480.005.410.220.110.37170.26
3Kamesznica3718510.0210.001.330.911.36102.58
4Czernichów3618640.017.690.490.330.60122.21
5Żywiec-Koleby229980.004.500.170.080.30178.14
6Ponikiew3719210.002.630.120.060.21171.79
7Babica3719120.090.960.290.280.0932.55
8Kraków-Kurdwanów137150.062.630.960.870.4849.99
9Bieńkówka157580.001.560.260.180.2595.36
10Zawadka-Tokarnia157840.015.000.220.130.35163.81
11Zubrzyca Dolna198990.030.150.070.060.0228.88
12Zakopane-Capki83990.00284.15111.89150.6677.5069.26
13Koziarczyska840121.62426.46137.16134.8044.9232.75
14Białka Tatrzańska2612570.111.050.240.230.0833.28
15Dębno5025570.00126.1810.869.807.1465.79
16Falsztyn4925130.053.431.000.830.6766.35
17Młynne3618560.025.000.350.270.3392.89
18Jaworki-Biała Woda3617530.000.870.100.080.0987.42
19Rożnów136930.020.250.090.080.0441.17
20Zbyszyce-Kurów2711870.011.000.240.230.1250.38
21Wierchomla3618450.104.500.660.670.3451.60
22Kąty3316840.010.170.080.080.0338.68
23Widacz157780.030.350.100.080.0663.21
24Radoszyce3618710.002.520.630.450.5994.73
25Sanok-Olchowce3718430.061.250.190.150.1365.45
26Bystre-Rabe2713270.354.420.920.840.3841.18
27Wetlina3618630.012.000.230.190.1877.71
28Dwerniczek3618090.0510.200.380.300.44115.56
Table 2. Summary of the classification of springs in the Carpathian Groundwater Observation and Research Network (PIG-PIB).
Spring No. Per Figure 2NameClassification of Springs by Discharge RateLong-Term Variability Index Criterion Acc. MailletClassification of Springs Based on the Variation Index VPhysical Criterion Acc. KeilhackClassification of Springs Based on Terrain ReliefClassification of Sources by Type of Hydraulic PathwaysClassification of Springs by Lithology
1Ustroń-Dobkasmallhighly variablevariabledescendingslopes spring fissure springcover spring
2Szyndzielniavery smallhighly variablevariabledescendingslopes springfissure springrock springs
3Kamesznicasmallhighly variablevariabledescendingedge springfissure springcover spring
4Czernichówvery smallhighly variablevariabledescendingslopes spring fissure springcover spring
5Żywiec-Kolebyvery smallhighly variablevariabledescendingslopes spring fissure springcover spring
6Ponikiewvery smallhighly variablevariabledescendingslopes spring fissure springcover spring
7Babicavery smallvariablevariabledescendingslopes spring fissure springcover spring
8Kraków-Kurdwanówsmallvariablevariabledescendingedge springkarst springrock springs
9Bieńkówkavery smallhighly variablevariabledescendingslopes springfissure springcover spring
10Zawadka-Tokarniavery smallhighly variablevariabledescendingslopes spring fissure springcover spring
11Zubrzyca Dolnavery smallslightly variablevariabledescendingslopes spring fissure springcover spring
12Zakopane-Capkilargehighly variablevariabledescendingslopes spring karst springrock springs
13Koziarczyskalargevariablevariabledescendingedge springkarst springcover spring
14Białka Tatrzańskavery smallslightly variablevariabledescendingslopes springfissure springcover spring
15Dębnomediumhighly variablevariableascendingvalley springporous springcover spring
16Falsztynsmallhighly variablevariabledescendingslopes spring fissure springrock springs
17Młynnevery smallhighly variablevariabledescendingslopes spring fissure springcover spring
18Jaworki-Biała Wodavery smallhighly variablevariabledescendingvalley springfissure springrock springs
19Rożnówvery smallvariablevariabledescendingslopes spring fissure springcover spring
20Zbyszyce-Kurówvery smallhighly variablevariabledescendingslopes spring fissure springcover spring
21Wierchomlasmallvariablevariabledescendingslopes spring fissure springcover spring
22Kątyvery smallvariablevariableascendingslopes spring fissure springcover spring
23Widaczvery smallvariablevariableascendingslopes spring fissure springcover spring
24Radoszycevery smallhighly variablevariabledescendingslopes spring fissure springcover spring
25Sanok-Olchowcevery smallvariablevariabledescendingvalley springfissure springcover spring
26Bystre-Rabesmallvariablevariabledescendingvalley springfissure springcover spring
27Wetlinavery smallhighly variablevariabledescendingslopes spring fissure springcover spring
28Dwerniczekvery smallhighly variablevariabledescendingslopes spring fissure springcover spring
Table 3. Classification of springs by discharge rate.
Size ClassFlow Rate [L/s]Characteristics
I>2800Giant springs (often karstic)
II280–2800Very large springs
III28–280Large springs
IV6.3–28Medium springs
V0.63–6.3Small springs
VI0.06–0.63Very small springs
VII0.01–0.06Faint (seeping) springs
VIII<0.01Trace springs
Table 4. Classification of springs based on the long-term variability index R.
Long-Term Variability Index RCharacteristics
1–2Stable springs
2–10Slightly variable springs
10–50Variable springs
>50Highly variable springs
Table 5. Classification of springs based on the variation index V.
V Index ValueVariability ClassCharacteristics
<25%SteadyVery stable, with a deep circulation system. Little or no sensitivity to precipitation, etc.
25–100%Sub-constantModerately variable. Typical of Polish highlands and foothills.
>100%VariableHighly sensitive to precipitation, snowmelt, and droughts. Karst springs (caves) or “shallow” springs.
Table 6. Classification of springs based on terrain relief.
Spring TypeMorphological
Location
Characteristics
Ridge and sub-ridge springsThe highest parts of hills and ridges.They are often characterized by a small but steady discharge from the drainage of aquifers.
Slopes springsThe inclined surfaces of valley slopes and mountain slopes.The most common type in mountainous areas; their dynamics depend heavily on the thickness of the weathered material and the slope of the terrain.
Valley springsThe bottoms of river valleys and depressions in the terrain.They often drain deeper aquifers; they may take the form of channel outflows that feed directly into the river.
Edge springsAt the base of distinct steps and morphological edges.They form in areas where the slope of the terrain changes abruptly; a variant of these are cliff springs found along coastlines.
Terraces springsThe edges and surfaces of river terraces.They drain water from terrace alluvium; they often occur at the interface between permeable gravel and the impermeable terrace substrate.
Underwater springsThe bottoms of water bodies and rivers.Outflows occurring below the water surface; the best-known types are channel springs (in riverbeds), lake springs, and submarine springs.
Landslide springsNiches, channels, or landslide fronts; often found within colluvial deposits.Water circulates through displaced rock masses; these systems are characterized by highly variable flow rates and are prone to rapid contamination.
Moraine springsLandscapes shaped by ice sheets or mountain glaciers; primarily valley-floor, terminal, and lateral moraines.Formed from gravelly-sandy or stony moraines left behind by mountain glaciers and ice sheets.
Table 7. Classification of sources by type of hydraulic pathways.
Spring TypeCharacteristicsRegime and Discharge Variability
Porous (stratiform)
springs
Water circulates in the intergranular pores of sedimentary rocks (e.g., sand, gravel).It is characterized by high inertia and a stable flow rate; it is most often classified as a constant or nearly constant springs.
Fissure springsThe flow paths consist of weathering fissures, joints in compact igneous, metamorphic, and certain sedimentary rocks, as well as tectonic fractures in solid rock.They exhibit high dynamics; their yield often increases sharply after rainfall, which classifies them as variable or highly variable springs.
Karst springsWater flows through systems of channels, fissures, caves, and voids formed by karstification (rock dissolution).They are characterized by the most dynamic flow regime and very high discharge rates (springs); they respond almost immediately to atmospheric precipitation.
Table 8. Classification of springs by lithology.
Spring TypeLithologyCharacteristics of Outflow and Drainage
Rock springsCompact rocks: sandstones, limestones, crystalline rocks.Concentrated (point) discharge from unweathered rocks through systems of fractures, fissures, or karst channels.
Cover springsLoose materials: slope clays, rock debris, gravel, sand.Often diffuse drainage (puddles, seepage) within weathered material; highly dependent on current precipitation, snowmelt, and drought.
Table 9. ‘F’ classification based on formal, legal and ownership criteria.
Category FDescription
F1High stability
F2Limited stability
F3Outdoor use
Table 10. ‘T’ classification based on criteria for readiness to implement measurement automation.
Category TDescription
T1Fully ready
T2Requires adaptation
T3Not ready
Table 11. ‘S’ classification based on the method of capturing them and technical infrastructure.
Category ‘S’Description
S1Pipe intake
S2Weir intake
S3Intake chamber
S4Measuring weir
S5Ring casing
Table 12. ‘N’ classification based on criteria relating to conflicts with protected areas.
Category NDescription
N1High protection level
N2Medium protection level
N3Point protection
N4No protection
Table 13. Summary of the proposed proprietary classifications of springs in the Carpathian Groundwater Observation and Research Network (PIG-PIB).
Spring No. Per Figure 2Name‘F’ Classification
Based on Formal, Legal and Ownership Criteria
‘T’ Classification
Based on Criteria for
Readiness to Implement Measurement
Automation
‘S’ Classification Based on the Method of Capturing Them
and Technical
Infrastructure
‘N’ Classification Based on Criteria Relating to Conflicts
with Protected Areas
Automation Readiness Index (ARI)
1Ustroń-Dobkahigh stabilityrequires adaptationweir intakemedium protection level7
2Szyndzielniaoutdoor userequires adaptationpipe intakemedium protection level5
3Kamesznicahigh stabilityrequires adaptationintake chamberno protection9
4Czernichówhigh stabilitynot readyweir intakeno protection8
5Żywiec-Kolebyhigh stabilityrequires adaptationintake chamberno protection9
6Ponikiewlimited stabilityrequires adaptationweir intakemedium protection level6
7Babicalimited stabilityrequires adaptationring casingno protection8
8Kraków-Kurdwanówoutdoor userequires adaptationintake chamberno protection7
9Bieńkówkaoutdoor userequires adaptationintake chamberno protection7
10Zawadka-Tokarniaoutdoor userequires adaptationintake chamberno protection7
11Zubrzyca Dolnalimited stabilityrequires adaptationweir intakeno protection8
12Zakopane-Capkilimited stabilityrequires adaptationmeasuring weirno protection8
13Koziarczyskahigh stabilityfully readymeasuring weirhigh protection level7
14Białka Tatrzańskalimited stabilityrequires adaptationweir intakeno protection8
15Dębnolimited stabilityfully readymeasuring weirmedium protection level7
16Falsztynoutdoor userequires adaptationintake chambermedium protection level5
17Młynneoutdoor userequires adaptationweir intakeno protection7
18Jaworki-Biała Wodahigh stabilityrequires adaptationweir intakehigh protection level6
19Rożnówhigh stabilityrequires adaptationring casingmedium protection level7
20Zbyszyce-Kurówoutdoor userequires adaptationintake chamberno protection7
21Wierchomlalimited stabilityrequires adaptationring casingmedium protection level6
22Kątyoutdoor userequires adaptationring casingmedium protection level5
23Widaczoutdoor userequires adaptationpipe intakeno protection7
24Radoszycelimited stabilityrequires adaptationring casingno protection8
25Sanok-Olchowceoutdoor userequires adaptationweir intakemedium protection level5
26Bystre-Rabehigh stabilityrequires adaptationweir intakemedium protection level7
27Wetlinaoutdoor userequires adaptationweir intakemedium protection level5
28Dwerniczekoutdoor userequires adaptationweir intakemedium protection level5
Table 14. Comparison of current manual monitoring methods and the proposed springs automated telemetry strategy.
CriterionTraditional Manual Monitoring
(Current Method)
Automated Monitoring
(Proposed Strategy)
Data Temporal ResolutionLow (typically weekly or monthly).High (continuous or hourly intervals).
Capture of Peak FlowsPoor. Statistically omits short-term, extreme flood events crucial for water balance.Excellent. Captures the full spectrum of
discharge fluctuations without data gaps.
Initial Investment (CAPEX)Low. Requires basic measuring tools (e.g., volumetric vessels, stopwatches).High. Requires purchase of data loggers,
sensors, transmission modules, and power supply.
Operational Costs (OPEX)High. Generates continuous costs for
personnel travel and time in difficult terrain.
Low. Remote data access reduces field visits to occasional maintenance and calibration.
Fieldwork Safety/RiskHigh risk. Requires regular access to remote areas, often in severe winter weather.Low risk. Field visits can be scheduled
flexibly, avoiding extreme weather conditions.
Implementation ComplexityLow. Minimal formal or environmental
constraints.
High. Requires navigating the F-T-S (Formal, Technical, Environmental) barrier framework.
Disclaimer/Publisher’s Note: The statements, opinions and data contained in all publications are solely those of the individual author(s) and contributor(s) and not of MDPI and/or the editor(s). MDPI and/or the editor(s) disclaim responsibility for any injury to people or property resulting from any ideas, methods, instructions or products referred to in the content.