1. Introduction
The global climate has undergone unprecedented shifts, characterised by the increased frequency and intensity of extreme weather events. According to the World Meteorological Organisation’s State of the Global Climate report [
1], record-breaking temperatures and volatile atmospheric patterns are no longer outliers but part of a definitive trend [
2]. These climatic changes affect critical infrastructure, with the electrical system being among the most vulnerable systems [
3].
The electrical grid serves as the backbone of modern society, essential for sustainable development, healthcare, and daily communication. Conversely, the intersection of ageing infrastructure, increasing demand, distributed generation, and escalating climate risks, such as wildfires, floods, and heatwaves, poses a significant threat to energy security. When the electrical system fails, cascading effects affect every sector, highlighting a dangerous dependence in an era of environmental instability [
4].
The recent literature on power system risk assessment has shifted from traditional N-1 contingency analysis toward more sophisticated probabilistic frameworks. Contemporary studies have employed fragility functions to quantify the vulnerability of substations and transmission lines to physical damage from external hazards [
5]. For instance, research in highly urbanised regions has integrated Monte Carlo simulations with spatial hazard mapping to predict the probability of unserved energy during extreme events [
6]. Furthermore, complex network theory has been increasingly applied to identify “critical nodes” within the grid that, if compromised by localised flooding, could jeopardise the stability of the entire regional network [
7]. More recently, research has focused on the cascading failure dynamics triggered by urban flood events in interconnected critical infrastructure systems [
8], as well as on probabilistic frameworks that integrate hydrodynamic models, fragility curves and socio-economic damage models to comprehensively quantify power grid flood risk [
9]. The fragility of power grid assets under multiple climate-driven hazards, including flooding, has also been systematically reviewed, highlighting the need for updated vulnerability models in a changing climate [
10]. Despite these advances, there remains a gap in assessing the combined impact of pluvial and coastal hazards on urban distribution networks, particularly in quantifying consumer disruption and economic losses. To address this, the presented methodology integrates risk assessment with socio-economic valuation to support sustainable infrastructure planning.
To bridge this gap, this study establishes specific objectives aligned with its core findings. First, it applies the flood risk assessment methodology developed within the ICARIA project to simulate pluvial and coastal flooding future SSP5-8.5 scenarios for the Barcelona Metropolitan Area. Second, the research evaluates the physical vulnerability of specific electrical installations under these combined hazard conditions. Third, it quantifies the cascading effects on electricity consumers and calculates the associated economic losses. These focused aims provide a clear roadmap for the subsequent analysis and ensure that the conclusions directly address both technical asset resilience and socio-economic impacts, thereby connecting the study’s methodology to its broader policy implications.
The area of study for this research is the Metropolitan Area of Barcelona (AMB), a densely urbanised coastal region of 636 km
2 comprising 36 municipalities and approximately 3.3 million inhabitants. The area is characterised by steep peri-urban terrain draining toward highly developed riverine and coastal plains, which promotes rapid runoff concentration during short-duration, high-intensity Mediterranean rainfall events. Specifically, the region is highly susceptible to pluvial flooding and combined flooding hazards, where the interaction between drainage systems and coastal water levels exacerbates the impact [
11]. These localised hazards are responsible for extensive damage to urban infrastructure and represent significant economic losses in Mediterranean “climate hot spots” [
12]. In this article, the effects of such floods on the AMB are analysed through a risk assessment of the electrical systems.
2. Materials and Methods
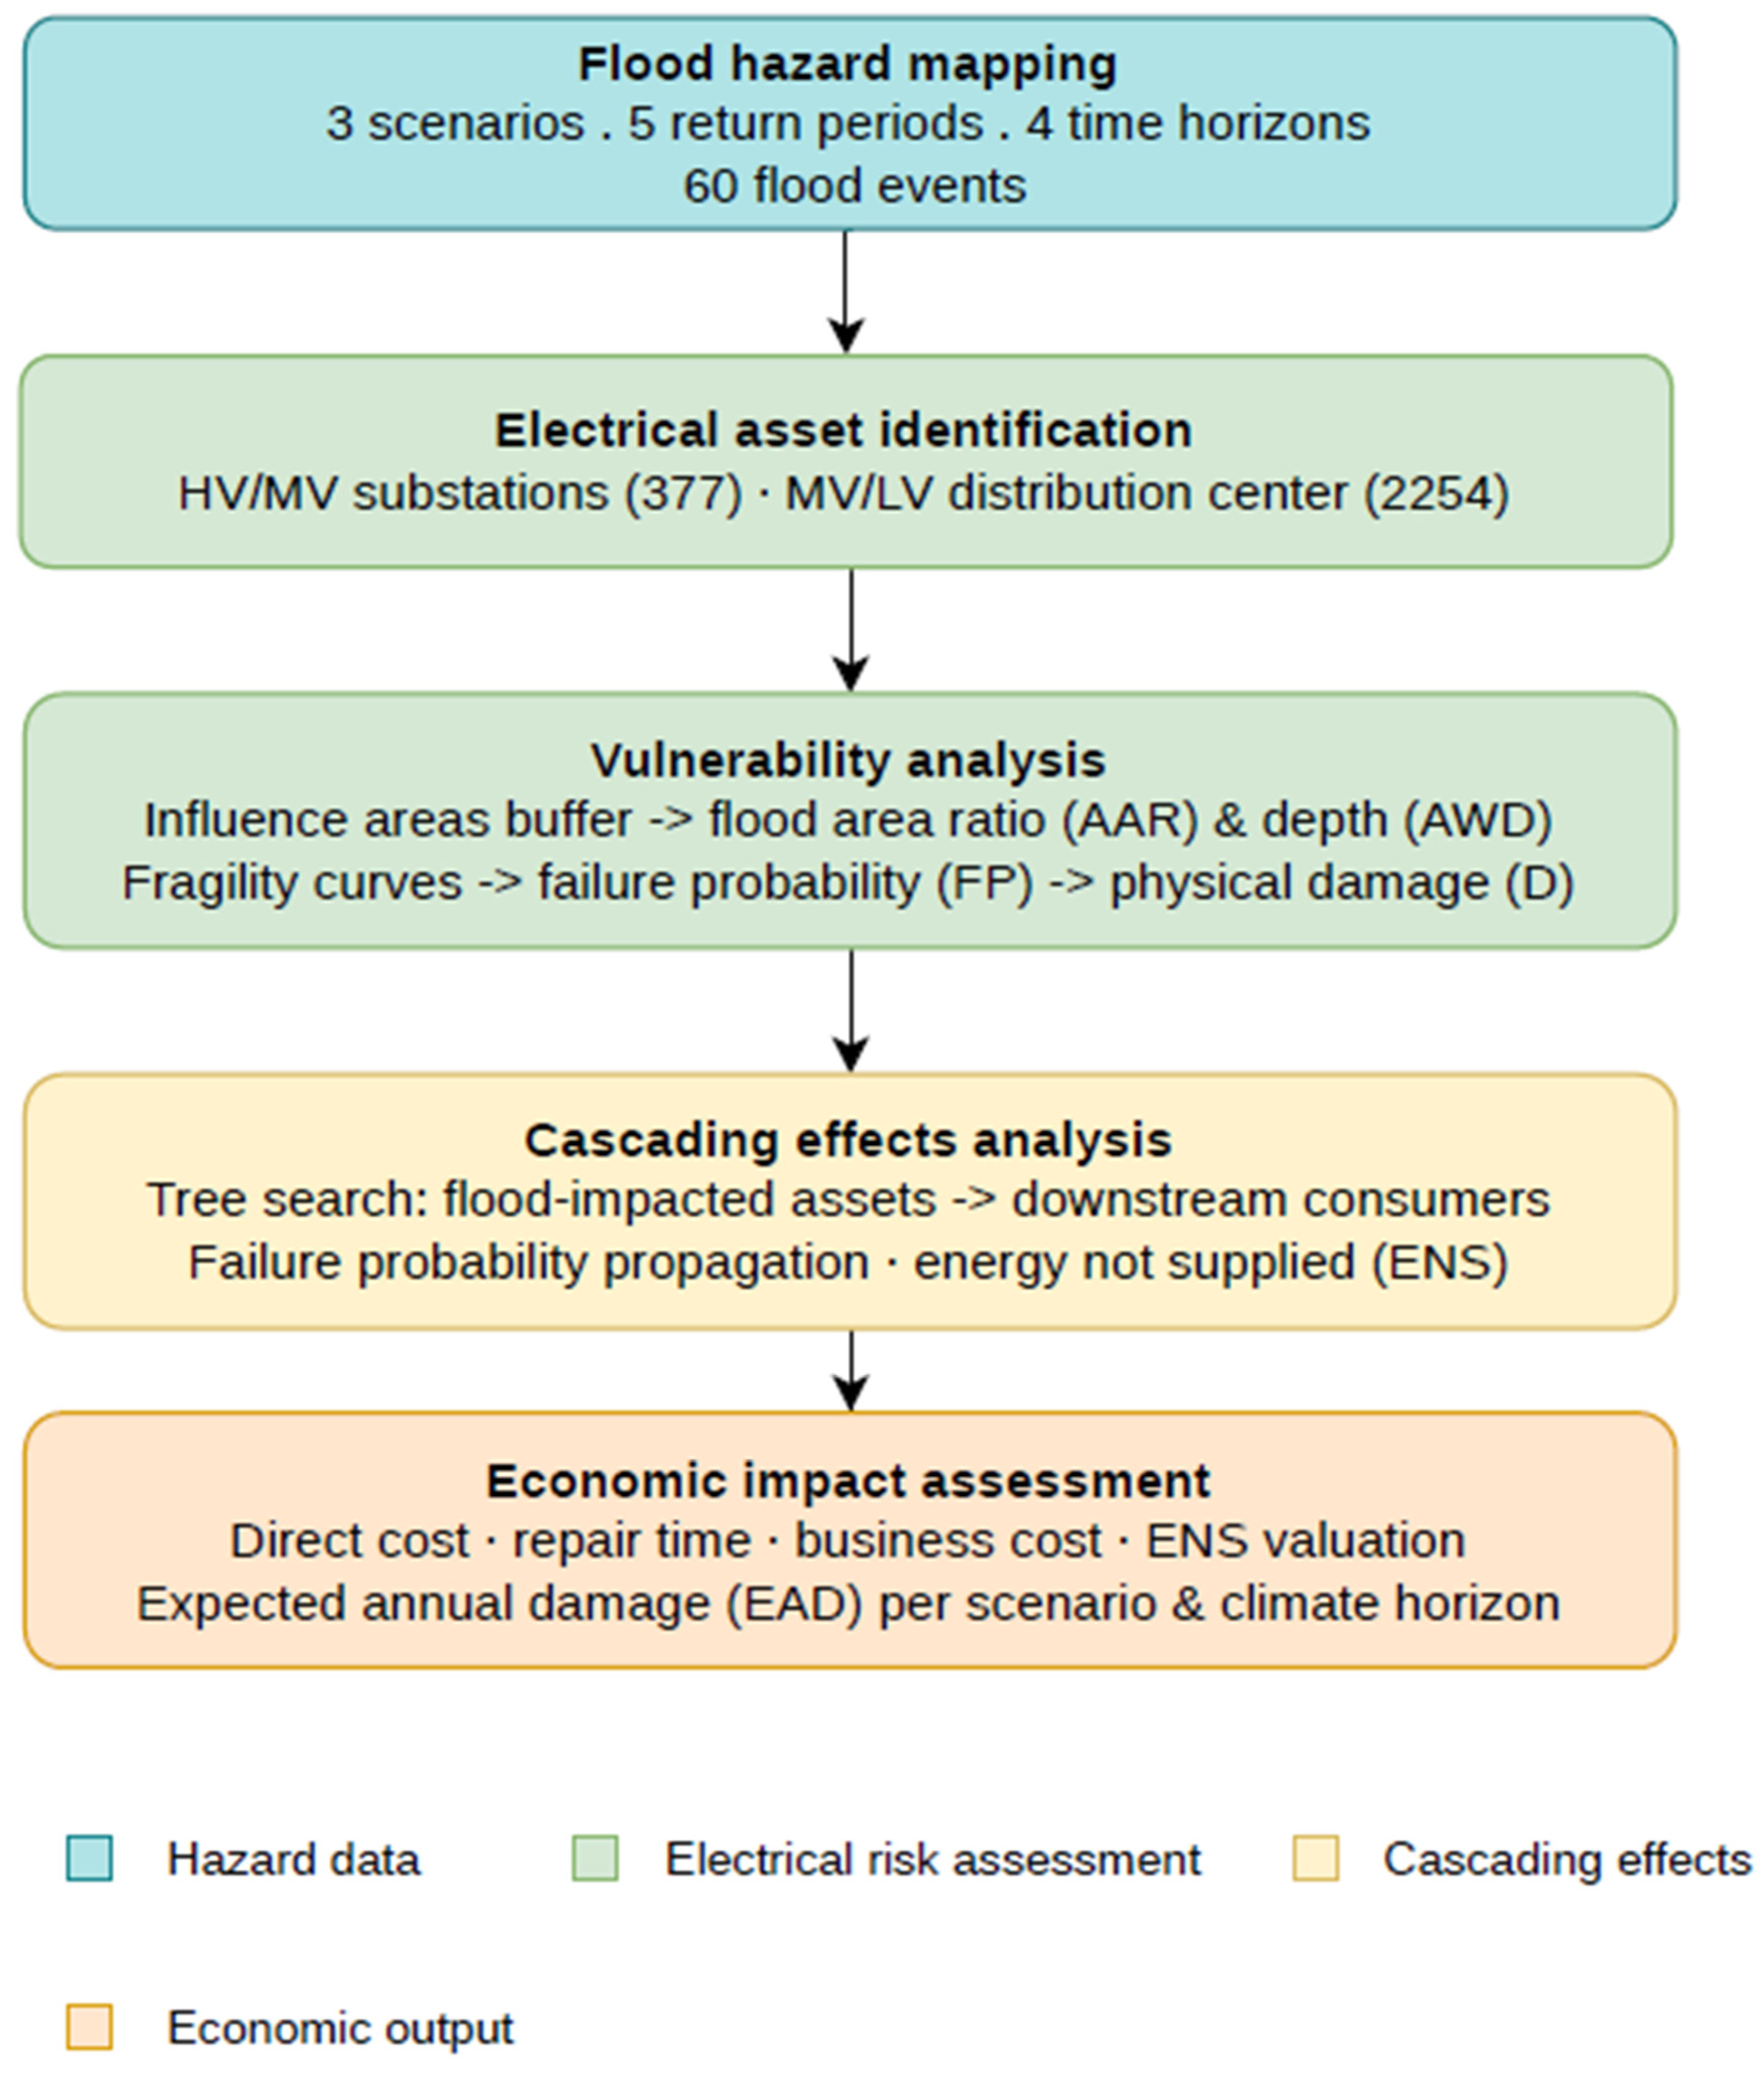
The methodology, showed in
Figure 1, employed in this research follows a multi-stage geospatial and structural framework designed to quantify the impact of floods on critical power infrastructure. This section first describes the acquisition and processing of high-resolution flood hazard maps, followed by a detailed spatial identification of the electrical assets exposed to these risks. Subsequently, the electrical network topology is modelled, providing the basis for a comprehensive electrical vulnerability analysis. By integrating these components, the proposed approach enables a robust assessment of how varying flood intensities translate into systemic risks for both the distribution infrastructure and the end users they serve.
2.1. Hazard Data
2.1.1. Metropolitan Flood Models
The flood hazard data were obtained from a metropolitan-scale flood model covering the entire AMB. To represent the interactions between surface runoff, sewer hydraulics and coastal boundary conditions, a fully coupled 1D/2D hydrodynamic model was developed in the commercial software InfoWorks ICM (Ultimate v2026.2). This modelling approach is acknowledged as the most adequate approach for flood hazard assessment in urban areas [
1,
2]. It simultaneously simulates flow on the surface (2D domain), within the sewer network (1D domain), and—crucially—the dynamic water exchange between both domains. Importantly, this exchange is modelled according to the location of key elements of the sewer network such as inlets and outfalls discharging to the receiving water body. This modelling architecture allows the representation of complex urban morphology and the generation of hazard maps (depth and velocity) required for asset-level risk qualification [
13].
The AMB metropolitan flood model was conceived as a tool capable of simulating pluvial flooding under present and future climate conditions, as well as compound events involving storm surge.
The 2D surface domain was based on a 2 × 2 m digital terrain model covering the entire AMB. A variable-resolution unstructured triangular mesh was implemented to balance spatial detail and computational demand: urbanised areas were discretized with elements ranging from 25 to 100 m
2, while peri-urban areas were represented with larger elements between 500 and 1000 m
2. The final mesh had approximately 6.8 million elements. Previous models developed for Barcelona found this meshing density adequate for urban flood assessment purposes [
13].
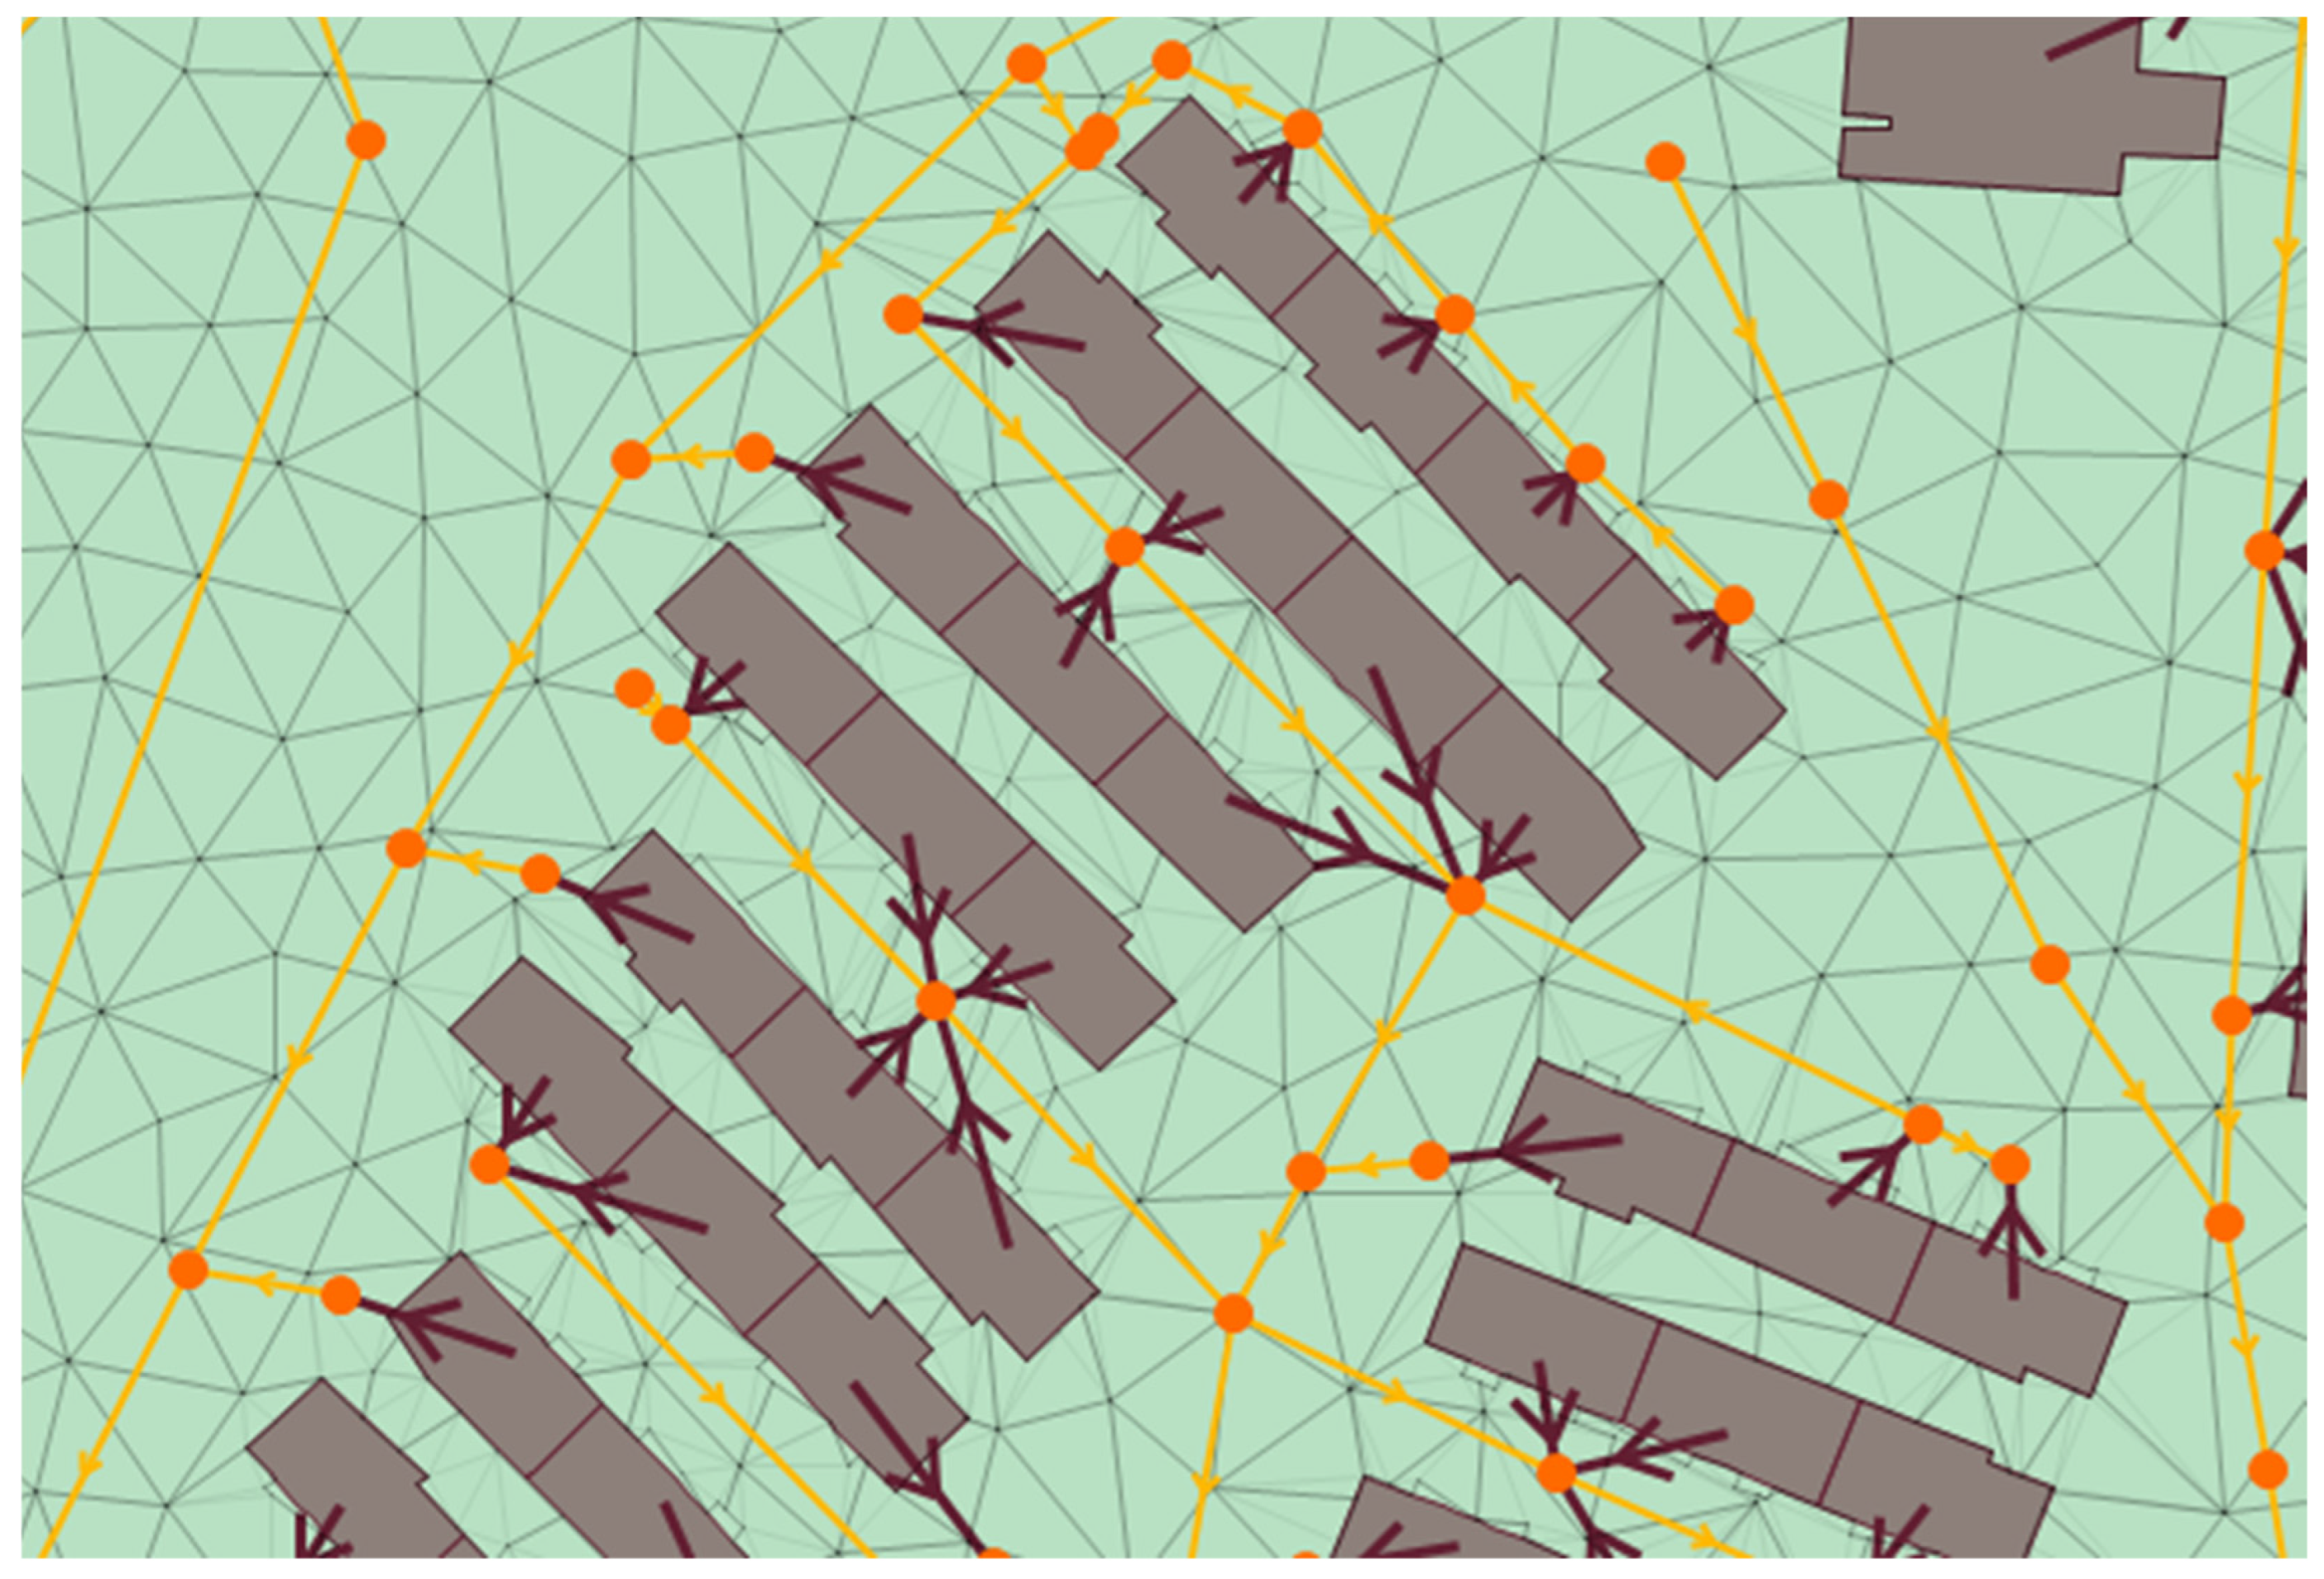
Importantly, a hybrid modelling approach was adopted. This means that building footprints in the whole domain were removed from the 2D mesh. These areas were represented as individual sub-catchments. Runoff generated on roofs was routed directly to the nearest sewer node, whereas rainfall over streets and open areas was simulated within the 2D domain. This configuration preserves both the hydraulic obstruction induced by buildings and the realistic hydrological response of rooftops.
Figure 2 presents the hybrid model setup where the green triangles represent the 2D mesh. Hydrological parameterization was defined through an 11-class land use scheme combining soil type and land cover.
Table 1 presents the parameters used for the hydrological model. Permeable surfaces were simulated using Horton infiltration functions with class-specific initial and asymptotic rates, while impervious areas were assigned fixed initial losses. Manning roughness coefficients were defined according to land use class. The soil classification used in this study followed a four-group system (A–D) derived from a local geological and cartographic map published by the “Institut Cartogràfic i Geològic de Catalunya”. Soil type A represented highly permeable materials, typically sandy or coarse-textured soils, characterised by high infiltration rates and low runoff potential. Soil type B included moderately permeable soils with balanced infiltration and runoff behaviour, often corresponding to loamy textures. Soil type C referred to soils with lower permeability, such as clay loams, where infiltration was limited and surface runoff was larger. Finally, soil type D represents very low permeability conditions, typically associated with clay-rich or shallow soils.
The 1D domain integrated all municipal sewer systems and the metropolitan interceptor network, resulting in a continuous drainage model of approximately 4950 km of pipes, about 175,000 nodes, storage tanks, pumping stations, weirs, valves and 1300 outfalls. Data from 25 municipalities were standardised and harmonised, while synthetic sewer networks were generated for the remaining municipalities based on terrain, street layout and hydraulic similarity criteria [
3]. Surface–network interaction was represented through detailed inlet modelling: each manhole was associated with a number of inlets defined from geospatial matching, and bidirectional head–discharge relationships derived from experimental studies were implemented. This allowed the simulation of limited capture under intense rainfall and reverse flow during sewer surcharge.
The model was calibrated and validated using four historical rainfall events with 5 min precipitation and water level records from the Barcelona monitoring network. Calibration focused on hydrological losses, roughness coefficients and inlet performance, ensuring the reliable reproduction of observed water levels and flood dynamics.
Table 2 shows the used calibration data; more details on the model setup and calibration are available [
14].
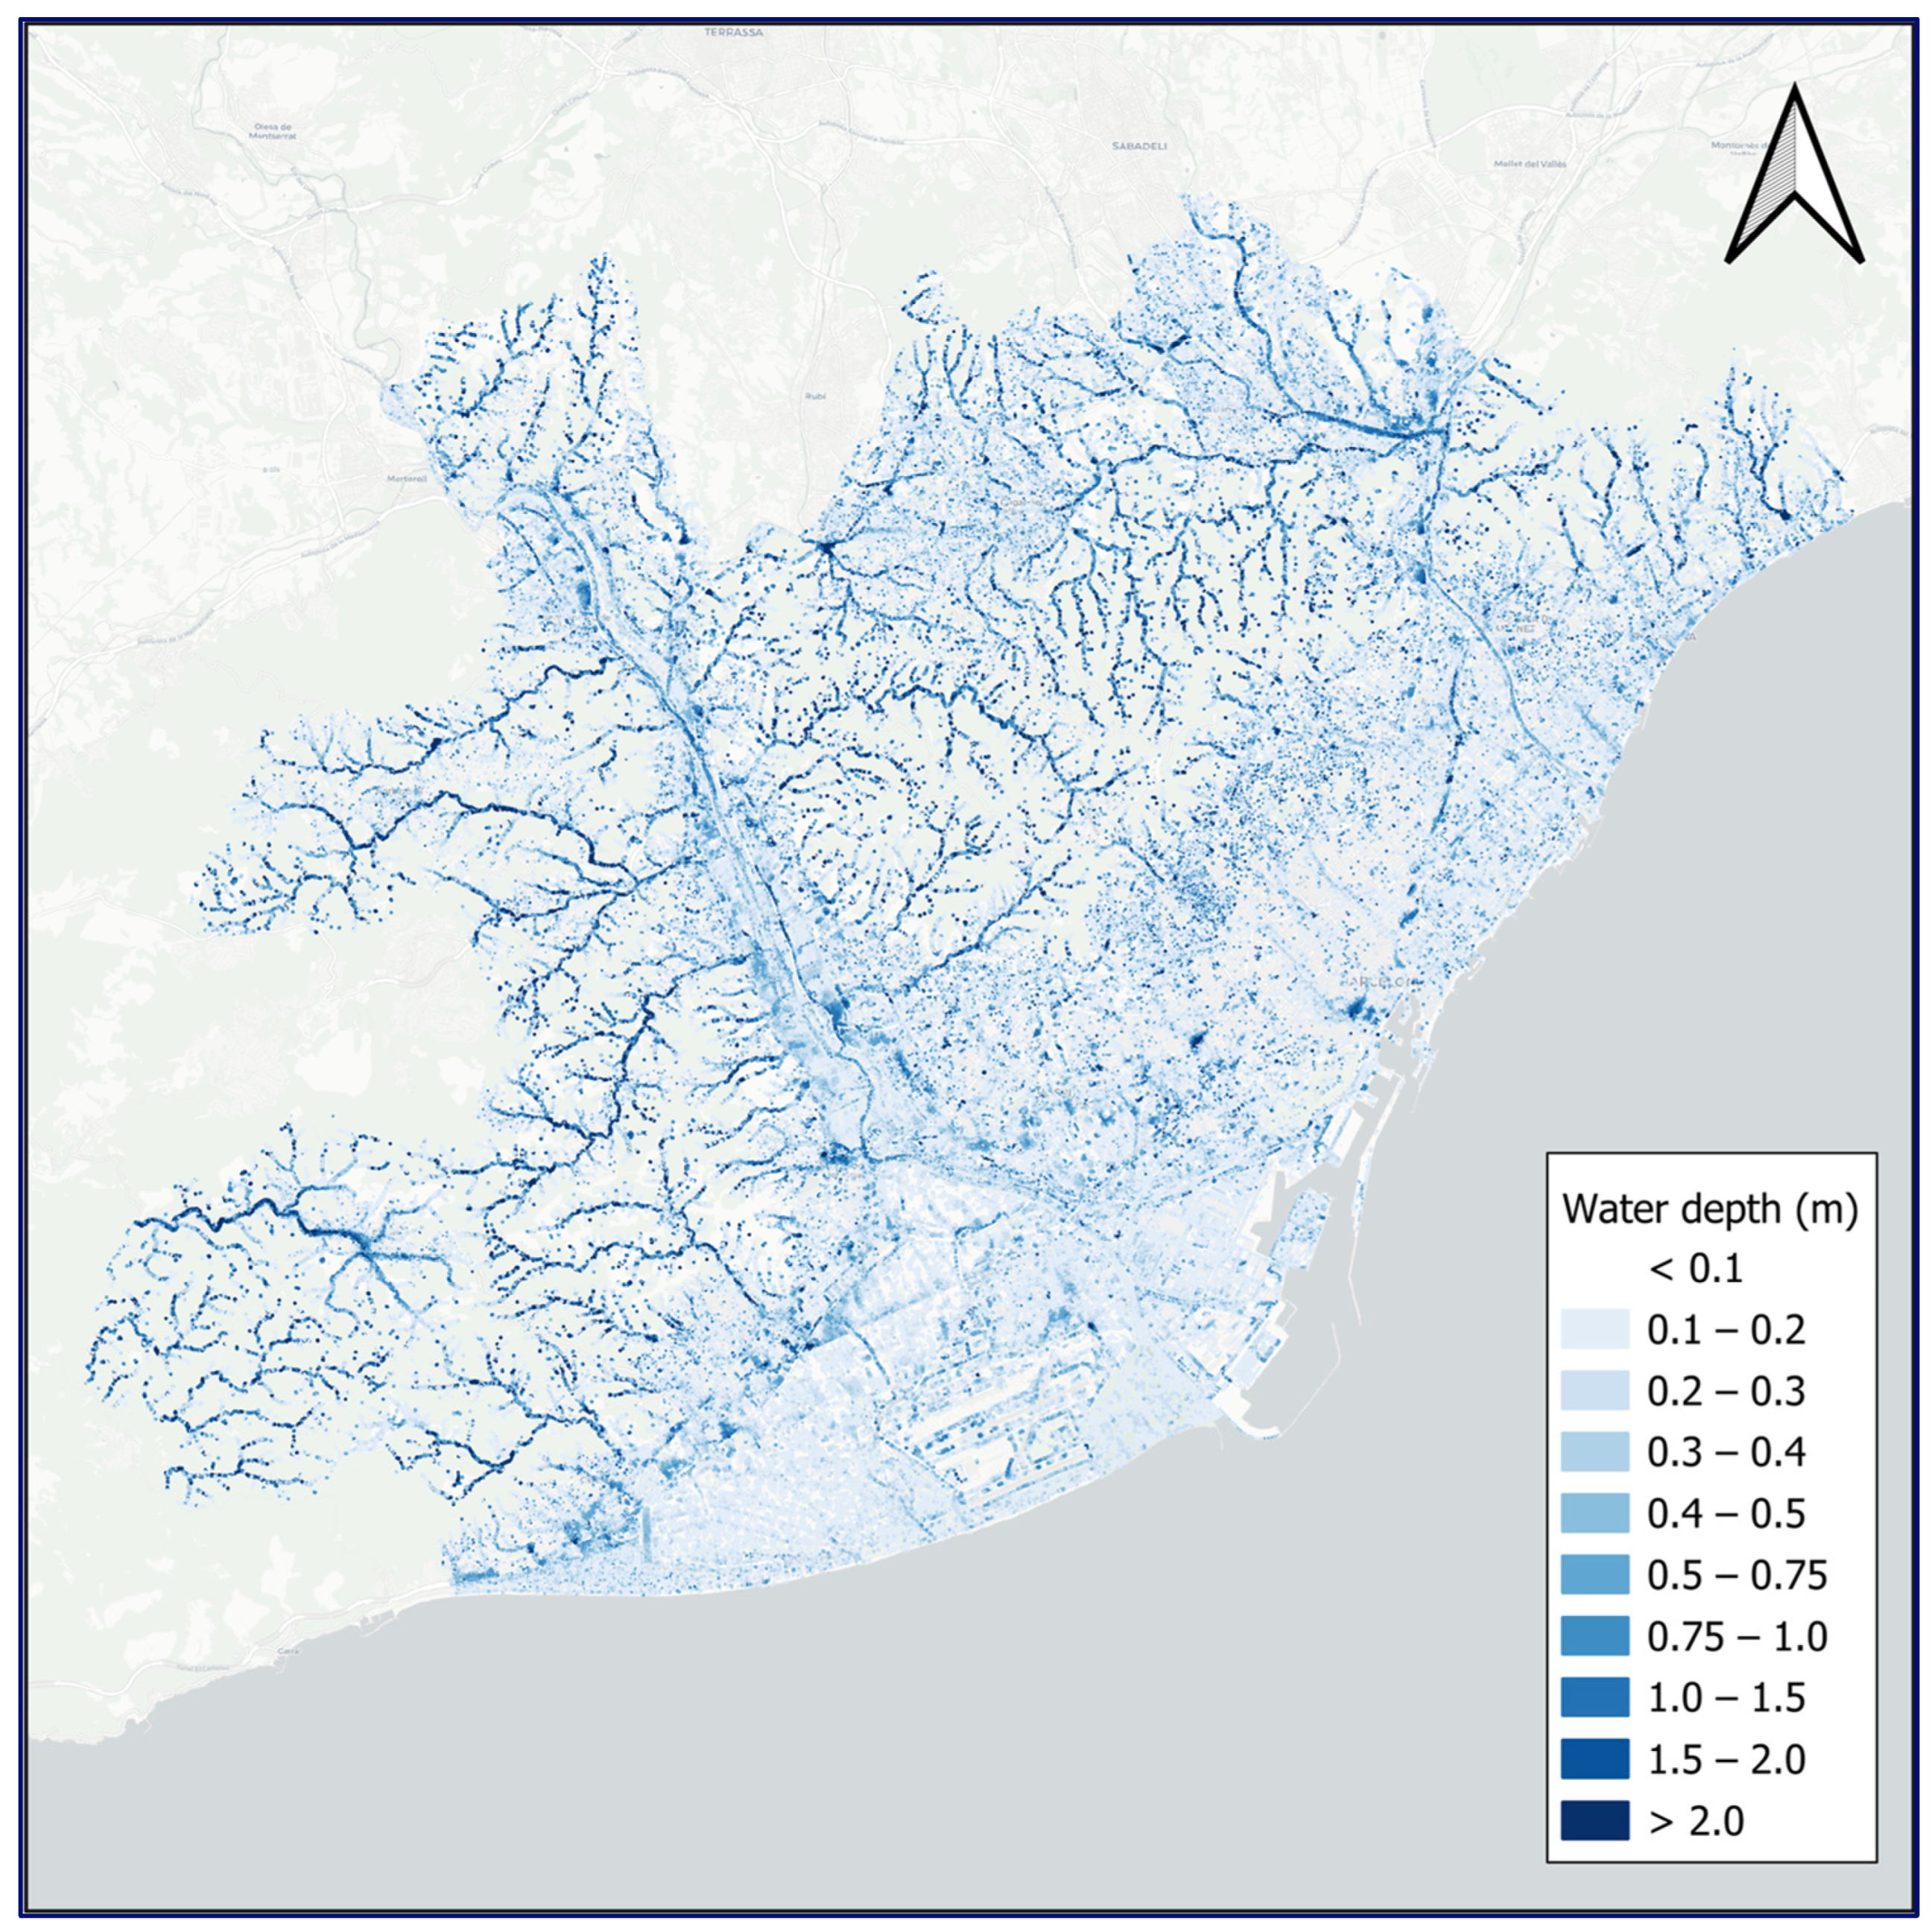
Importantly, outputs of the model were high-resolution flood maps of the maximum water depth and velocity in each cell of the mesh. These hazard parameters were key for the subsequent steps in the risk assessment methodology.
Figure 3 shows a flood map of the AMB obtained with the developed model.
2.1.2. Modelling Scenarios
Three modelling scenarios were defined: single-hazard (pluvial), multi-hazard (compound pluvial–coastal), and adaptation.
The single-hazard scenario considered rainfall as the only hazard driver. A total of 20 synthetic design storms were simulated. Five baseline events corresponded to return periods of 1, 10, 50, 100 and 500 years (T1–T500) and were derived from the intensity–duration–frequency curves adopted in the Urban Drainage Master Plan of Barcelona [
4]. Fifteen additional storms represented future climate conditions. These were obtained by multiplying historic intensities by Climate Change Factors derived from statistically downscaled projections under the SSP5–8.5 emission scenario [
5]. Three projection periods were considered: 2015–2040 (short-term), 2041–2070 (mid-term), and 2071–2100 (long-term). For each period, the five return periods were adjusted accordingly, resulting in 5 return periods per 3 future horizons: 15 future rainfall events in total.
It is acknowledged that the AR6 report provided other climate change projections besides SSP5–8.5 [
15]. In this study, the mentioned SSP was taken as the reference future climate change scenario representing a worst-case condition. The multi-hazard scenario evaluated the interaction between extreme precipitation and storm surge. Because the available historical record did not allow a robust estimation of joint probability distributions [
6], a simplifying assumption was adopted: rainfall and storm surge events with the same return period were simulated concurrently (e.g., T10 rainfall combined with T10 extreme sea level). Storm surge severity was characterised using extreme sea level (ESL), defined as the maximum sea surface elevation during coastal storm events, including mean sea level, surge, wave setup and tidal effects [
7].
Compound interaction was implemented through a one-way coupling approach. Storm surge did not directly inundate the 2D surface domain; instead, its effect was transmitted to the pluvial model through time-varying water level boundary conditions imposed at 98 coastal outfalls connected to the open sea. The ESL boundary condition was represented as a normally distributed time series whose peak coincided with the maximum rainfall intensity, representing the most critical scenario. Elevated sea levels reduced discharge efficiency and could induce backflow into the sewer system, amplifying surface flooding in low-lying coastal areas. The multi-hazard simulations consisted of the same 20 rainfall events combined with their corresponding ESL values.
The adaptation scenario assessed the potential risk reduction achieved through distributed nature-based solutions (NbS) and sustainable urban drainage (SUDS). The events simulated were the same 20 as in the multi-hazard case (20 compound events). Three measures were represented in the model:
Porous pavements applied to bike lanes and “Zone 30” streets;
Green roofs on 10% of public buildings;
Conversion of inner patios into bioretention areas.
In total, 60 flood events were assessed in this study, including 20 precipitation events across three scenarios: single-hazard (pluvial only), multi-hazard (combined pluvial and storm surge), and adaptation (compound events with mitigation measures). Further details about the simulated events and the modelling setup of the adaptation measures are provided in [
14].
Table 3 reflects precipitation and sea level parameters considered in each simulation.
2.2. Exposure Data
The exposure analysis identifies the critical components of the electrical system that are exposed to flooded zones. The primary assets considered in this study are:
Primary Substations (HV/MV): These are the most critical nodes due to their role in regional energy distribution. Exposure is assessed based on the elevation of sensitive equipment, such as power transformers, busbars, and protection and control units. In these facilities, even low-depth flooding can cause catastrophic damage to the auxiliary services (battery banks and chargers) required for safe manoeuvrability.
Distribution centres or secondary substations (MV/LV): Distributed extensively throughout the study area, these assets are often located at ground level or in basements within urban environments. Their exposure is characterised by proximity to flood zones and high density, which directly correlates with the number of affected end users.
Other components are also affected, such as electrical towers and underground wires, but in the AMB, these elements are not relevant because there is no detailed information available about them, and the possible causes are smaller than those of the studied components. For these reasons, the study focuses only on substations and distribution centres, and on their effects on electrical consumers. An important task is to obtain a model of the electrical system. The next section details how the data were obtained.
Electrical System Modelling
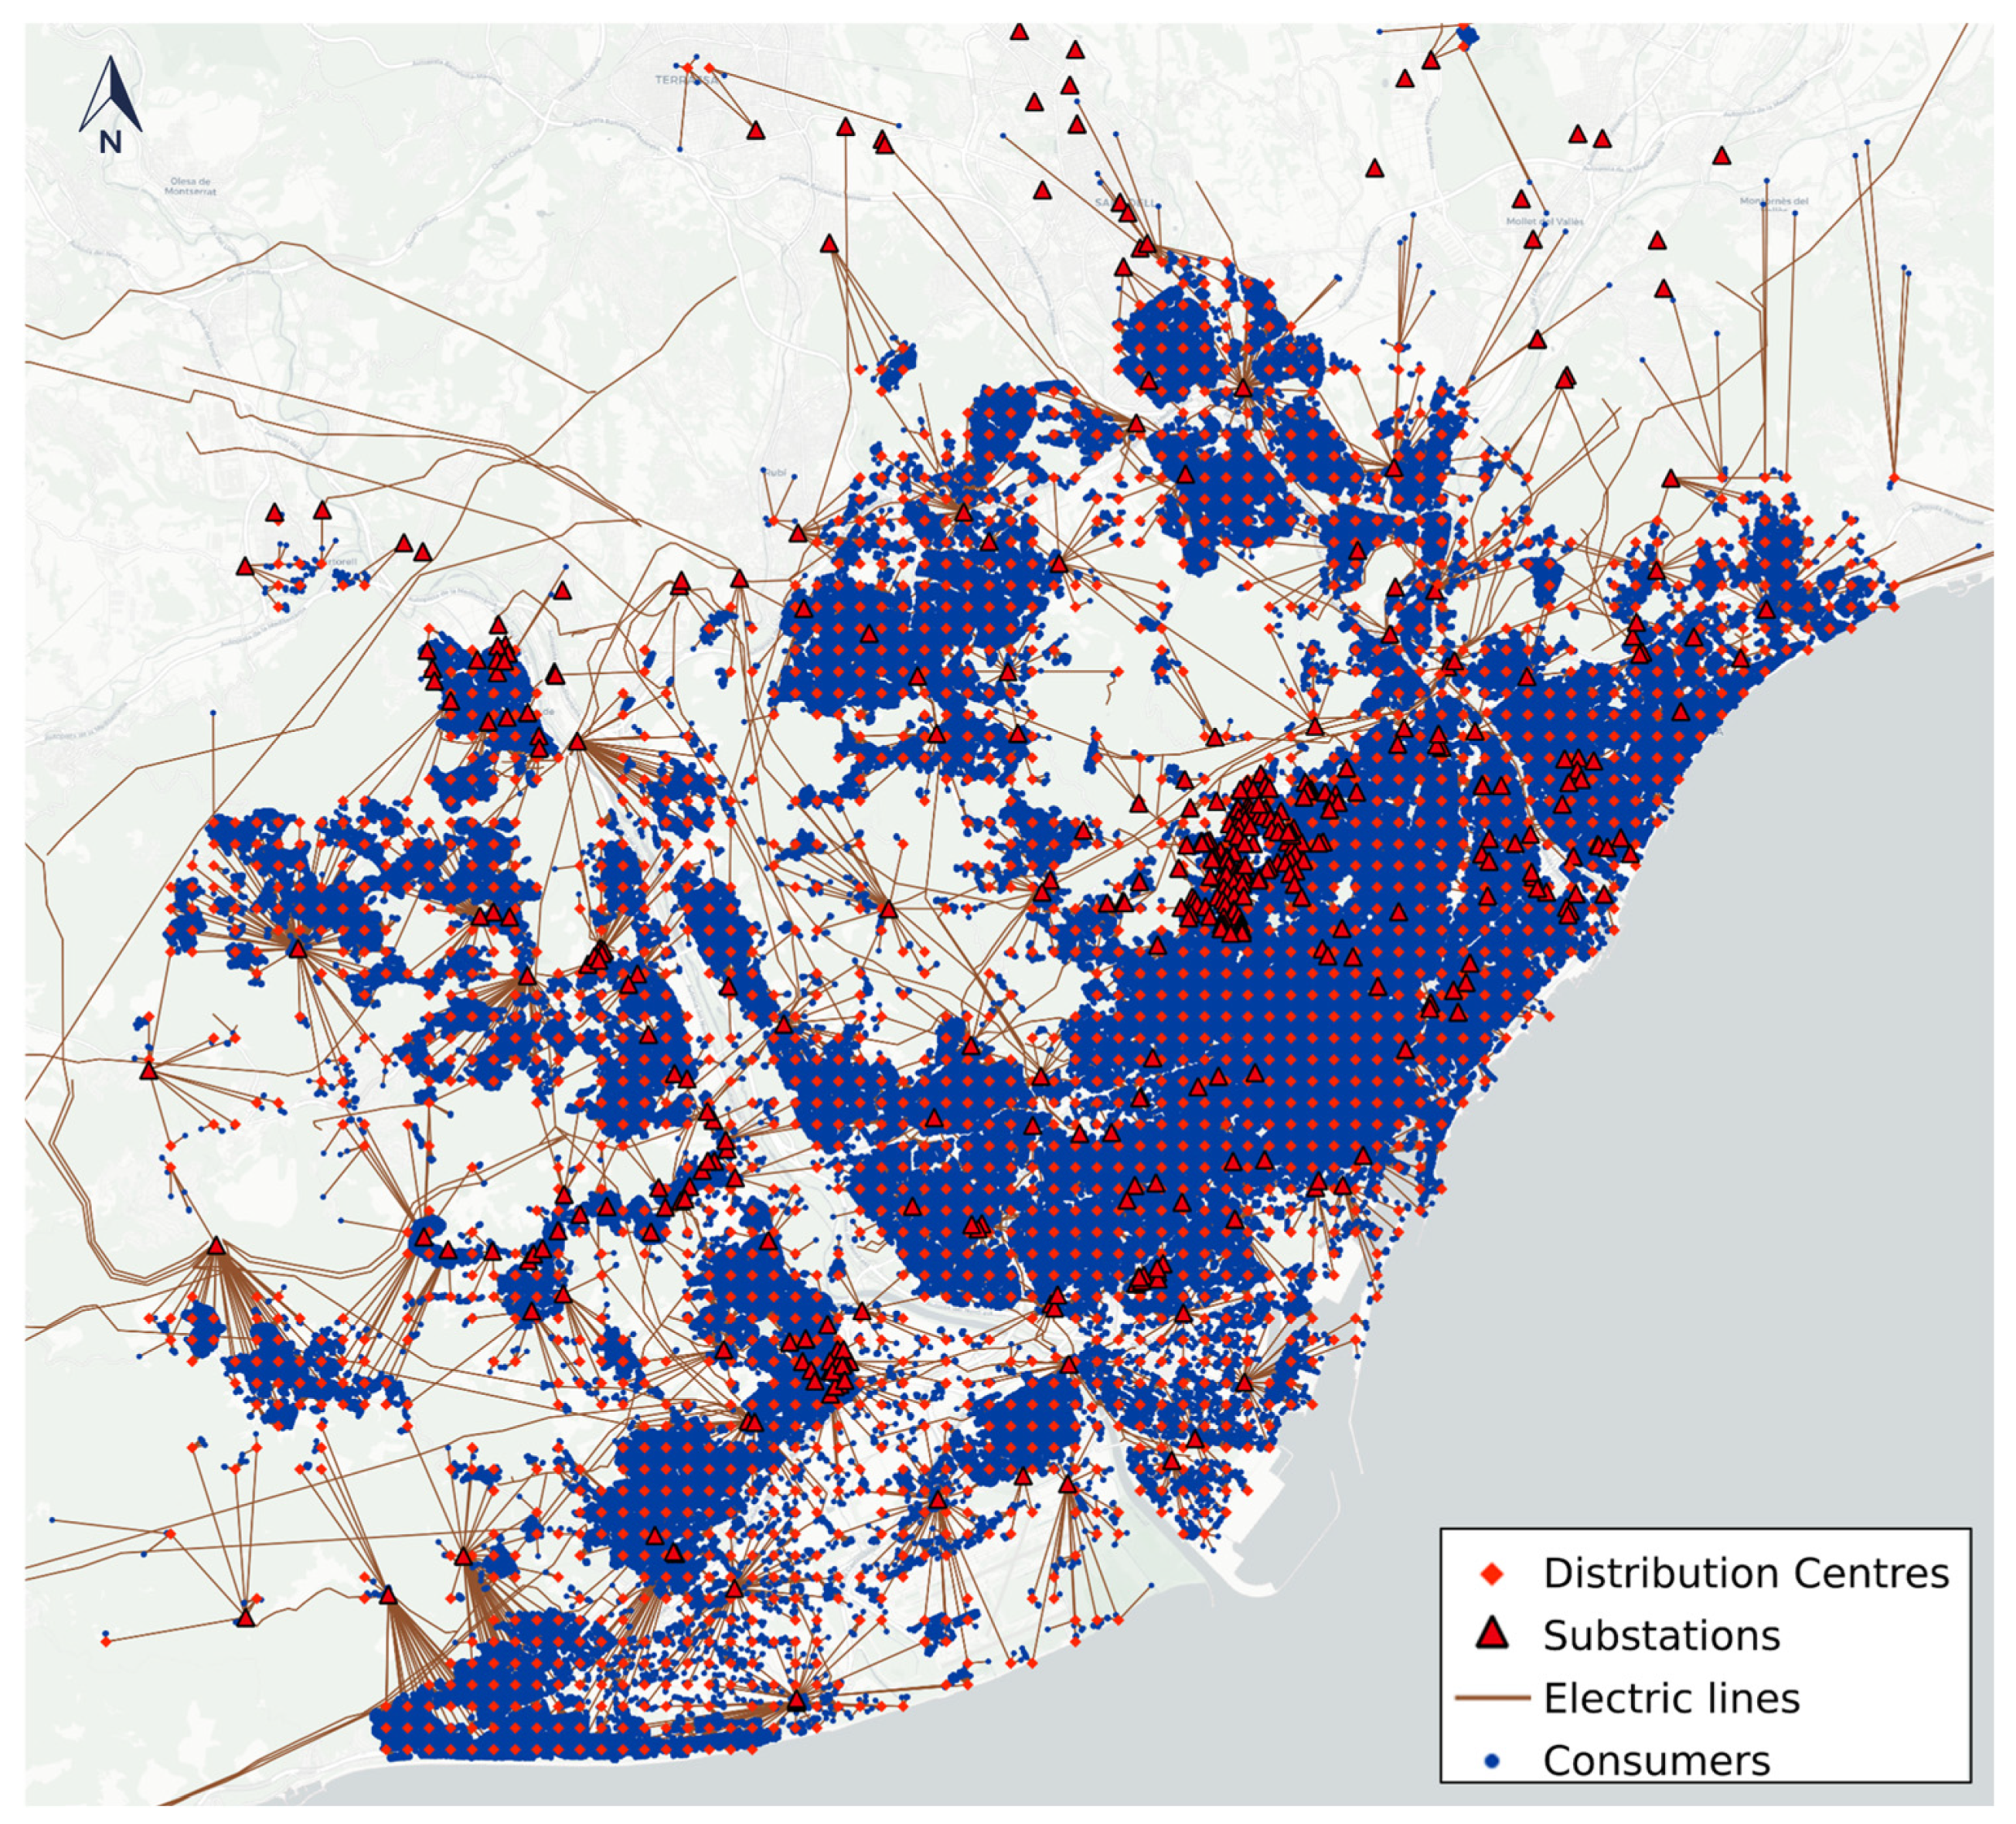
Due to security-related restrictions on access to official critical infrastructure datasets, the electrical network topology for the AMB has been estimated using a combination of open-source data, cadastral information, and expert knowledge of the regional energy landscape. In
Figure 4, there is a representation of the modelled electrical network.
The network was modelled as a multi-tier radial system. To locate energy demand with high precision, the Spanish Cadastre [
16] was utilised to identify and geolocate 920,721 electrical consumers, including residential, commercial, and industrial units. These consumers were topographically linked to the nearest distribution nodes to simulate realistic supply paths. The resulting estimated topology for the AMB consisted of the following assets:
High-Voltage Layer: 295 lines connecting 377 substations (ranging from 220 kV to 20 kV).
Medium-Voltage Layer: 2327 lines supplying 2254 distribution centres (20 kV to 230 V).
Low-Voltage Layer: 921,100 segments delivering power to the final consumption points.
For this risk assessment, a standardised 20 kV distribution voltage was adopted across the entire medium-voltage network. While the real-world grid may exhibit minor variations in voltage levels, a single reference was defined to maintain computational efficiency without compromising the integrity of the flood-impact analysis. The model assumed that the complexity of multi-voltage simulations did not significantly alter the macro-scale results of energy disruption and cascading failures.
2.3. Vulnerability Analysis
The vulnerability analysis, based on [
17], quantifies the physical susceptibility of assets to flood-induced failure. This study transitions from a simple location-based assessment to a geometric, voltage-dependent exposure model, structured in four distinct phases: influence zone calculations, Area Affected Ratio, fragility curve, and physical damage estimation.
2.3.1. Assets Influence Area
For each substation and distribution centre, an area of influence is defined through a radial buffer. This approach was used to determine the shape of the buildings. Equation (1) defines the technical safety requirements and physical footprint associated with different voltage levels. The buffer radius (R) was calculated as a function of the asset’s nominal voltage (V).
where:
This ensures that high-voltage assets (e.g., 220 kV) are assigned a larger critical area than medium-voltage distribution centres, reflecting their greater physical complexity and safety perimeters.
2.3.2. Flood Area Affected Ratio and Depth Analysis
The flood exposure was evaluated within each asset’s influence area using two specific metrics:
Area Affected Ratio (AAR): This represents the percentage of the asset’s buffer occupied by flood depths exceeding a technical threshold of 0.1 m. This threshold filter eliminates minor puddles that do not pose a risk to industrial electrical equipment.
Asset Weighted Depth (AWD): The AWD was defined as the maximum flood depth recorded within the asset’s buffer, representing the worst-case scenario for water ingress into sensitive components.
2.3.3. Fragility Curve and Failure Probability
The probability of failure (FP) is modelled as a function of depth, intensity, and spatial extent. The fragility curve used for this case is presented in [
18]. The standard flooding fragility curve is used for HV, MV and LV electrical substations and distribution centres. The standard fragility curve (which provides the conditional probability based on AWD) was weighted by the AAR to reflect that an asset is more likely to fail if a larger portion of its perimeter is submerged, as shown in Equation (2).
where:
FP = failure probability;
fc(AWD) = fragility curves as a function of the Average Water Depth;
AWD = Average Water Depth [m];
AAR = Asset Area Ratio.
This approach prevents overestimating risk when a high depth affects only a negligible fraction of the asset’s area.
2.3.4. Physical Damage Estimation
Finally, the physical damage (D) to the infrastructure is expressed as the percentage of affected installations relative to the AWD. This estimation follows the damage-depth functions proposed in the specialised literature for urban infrastructure in [
18].
where:
D = physical damage [%];
AAR = Asset Area Ratio.
By applying Equation (3), the model provides a concrete value for flood-induced damage, which serves as the primary input to the direct cost category in the final economic framework.
2.4. Cascading Effect Analysis
The transition from physical asset damage to system-wide service disruption is modelled through a cascading failure analysis. Due to the inherent complexity of power system dynamics and the scarcity of real-time operational data for long-term projections (2100), this study adopts a topological search algorithm based on two deterministic assumptions:
Infinite Supply Reliability: Electrical generation is assumed to be centralised and decoupled from local substation availability. This treats the upstream energy source as an infinite-bus source, thereby focusing the risk exclusively on the delivery infrastructure.
Strict Radial Topology: The network is modelled as a directed acyclic graph where energy flows downstream from transmission to distribution. It is assumed that no redundant paths or automated reconfigurations (mesh operations) are available during the event. Consequently, the failure of a parent node inevitably de-energises all descendant nodes.
Under these premises, the cascading effect is treated as a connectivity problem. The grid hierarchy is structured as shown in
Figure 5.
A failure triggered at any point in this chain, due to the vulnerability thresholds defined in
Section 2.3, initiates a recursive failure path. If an asset is compromised, the set of affected consumers is defined as the union of all leaf nodes reachable from i in the network graph.
The total impact is quantified by performing a topological search (typically via a tree search algorithm [
19]) starting from each flood-impacted asset passing its failure probability. This method ensures that the analysis captures the full “downstream footprint” of the flood, even for consumers located in dry areas whose supply lines pass through inundated substations.
By reducing electrical interaction to a structural dependency, the model provides a conservative yet comprehensive estimate of the Energy Not Supplied Cost (ENSC), which serves as the primary input for subsequent economic valuation.
2.5. Economic Impact Analysis Framework
The economic assessment translates physical damage and topological disruptions into monetary terms. The financial cost is measured using three different approaches: direct, cascading, and indirect socio-economic impacts. Furthermore, these metrics are integrated into a long-term risk framework through the calculation of the Expected Annual Damage (EAD). This parameter allows for the consolidation of costs across all analysed return periods and climate horizons, providing a singular, comprehensive metric to quantify the average annual fiscal exposure and the incremental risk driven by climate change.
2.5.1. Direct Damage Cost
The calculation begins by estimating the Direct Damage Cost (DC), which represents the capital expenditure required to restore the electrical system. This value was modelled using Equation (4). The IC is the installation cost; this value is obtained from historical installation costs classified by maximum rated voltage, and this value can be extracted from the ACER report [
20]. Then, D is the damage calculated as a percentage, and PF is the probability of failure calculated previously.
where:
2.5.2. Repair Time
The repair time estimation uses Equation (5); it is a quadratic formula extracted from [
17], where RT is the repair time in hours, and a, b and c are constant values extracted from the source, where the values are 689.88, 322.9 and 1.1466, respectively. D denotes the damage as a percentage of the installation.
where:
RT = repair time [h];
a, b, and c = constant coefficient (689.88, 322.9, and 1.1466);
D = physical damage [%].
2.5.3. Cascading Effect: Energy Not Supplied and Auxiliary Generation Cost
The cascading effects result in two primary operational costs for the utility provider: the energy not supplied and the auxiliary generation required to maintain supply to consumers.
The Energy Not Supplied (ENSC), as shown in Equation (6), represents the lost revenue from energy that could not be delivered to consumers during the repair period. It is calculated as the product of the interrupted load in kW (P), the outage duration in hours (RT), the probability of failure (PF) and the prevailing energy tariff (ET) using a fixed value of the mean of 2025 [
21] resulting in 0.15 €/kWh.
where:
ENSC = Energy Not Supplied Cost [€];
P = interrupted load [kW];
RT = repair time [hours];
PF = probability of failure;
ET = energy tariff [€/kWh].
To mitigate the impact on critical customers, as described in [
22], the utility may deploy mobile generators. The auxiliary generation cost (AGC) includes equipment rental, logistics, and the fuel price differential. Since the electricity produced by these units is sold to consumers, the net cascading cost is the overcost (i.e., the difference between the cost of expensive diesel generation and the cost of standard grid procurement).
The cost of deploying auxiliary generation is determined by a dynamic function that accounts for logistics, fuel consumption, and rental duration, with these inputs weighted by the asset’s failure probability. The calculation follows three functional stages:
- 1.
Sizing of the Auxiliary Fleet (nAG). As shown in Equation (7), the number of required auxiliary generators (nAG) is determined by the ratio of the total power of the affected substation (SP) and the standard active power capacity of a single mobile unit (AP).
- 2.
Fuel Consumption Cost (FCC). As shown in Equation (8), the model calculates the fuel cost only for the period where the repair time (RT) is non-zero. And PFC is the price of fuel consumption per kWh. Following the methodology established in [
23], considering a lower heating value for diesel of 10.2 kWh/L and an average electrical efficiency of 33% for emergency reciprocating engines, the effective energy yield is approximately 3.36 kWh/L. At a localised fuel price of €0.77/L (pre-tax/subsidised), the resulting operational cost aligns with the €0.23/kWh threshold used in this study for the PFC.
FC = Fuel Consumption Cost [€];
PFC = price of fuel consumption [€/kWh];
SP = affected power substations [kW];
RT = repair time [hours].
- 3.
Total AGC Formulation and Rental Degressivity. The total cost, as shown in Equation (9), is the sum of transport logistics, fuel consumption, and daily rental fees, all adjusted by the failure probability (FP). To reflect market reality, the model applies a degressive rental rate based on the duration of the repair in days (d = ⌈RT/24⌉):
Short term (d ≤ 7 days): high daily rate (100 €/day per unit).
Medium term (7 < d ≤ 21 days): discounted rate (~57.14 €/day per unit).
Long term (d > 21 days): maximum volume discount (40 €/day per unit).
The final equation for the total cost is expressed in Equation (9), where Ctransp is a fixed transport fee per unit (20 €).
where:
AGC = auxiliary generation cost [€];
FP = failure probability;
Ctransp = fixed transport fee per generator unit [€/unit];
FCC = Fuel Consumption Cost [€];
d = repair duration [days];
Crent = degressive daily rental rate [€/day per unit];
nAG = number of auxiliary generators in the fleet.
2.5.4. Business Cost
While direct and cascading costs affect the utility provider, the business cost (BC) captures the broader economic loss to society. This study quantifies the impact on the regional Gross Domestic Product (GDP) by assessing productivity loss during the service interruption.
The business cost, shown in Equation (10), is calculated by dividing the total annual GDP of the study area by the affected population and the outage duration. The model assumes that economic activity is linearly dependent on the availability of electrical supply for the affected demographic. Where FP is the failure probability of the asset, GDP
total is the total annual Gross Domestic Product of the region, Pop
total is the total population of the region served, and Pop
aff is the affected population.
where:
BC = business cost [€];
FP = failure probability;
GDPtotal = total annual Gross Domestic Product of the region [€/year];
Poptotal= total population of the region [inhabitants];
Popaff = affected population [inhabitants];
RT = repair time [hours].
2.5.5. Expected Annual Damage Estimation
The quantitative assessment of flood risk is expressed through the Expected Annual Damage (EAD), which integrates the damage incurred across the full spectrum of flood probabilities. The EAD provides a comprehensive metric of the long-term average damage per year, facilitating the comparison between historical conditions and future climate projections.
To estimate the EAD, a vulnerability–probability curve was constructed for each time horizon (historical, 2015–2040, 2041–2070, and 2071–2100). The EAD is mathematically defined as the integral of the damage function over the probability of exceedance as shown in Equation (11). Since the assessment is based on discrete return periods (T), where the probability is defined as P = 1/T,
where:
EAD = Expected Annual Damage [€/year];
D = total economic damage as a function of flood probability [€];
P = annual exceedance probability [year − 1].
Given the discrete nature of our flood scenarios (T1, T10, T50, and T100), the integral was approximated using the trapezoidal rule, a widely accepted numerical integration method in flood risk analysis [
24]. This method computes the area under the risk curve by summing the trapezoids formed between consecutive return periods; the formula is exposed in Equation (12).
where:
EAD = Expected Annual Damage [€/year];
D(Ti) = total economic damage associated with return period Ti [€];
Ti = return period of flood scenario [years].
Ti and Ti+1 are the consecutive return periods, 1/Ti represents annual exceedance probability for each scenario and D(Ti) is the total economic damage associated with that probability.
This numerical integration ensures that the risk profile captures the transition from frequent, lower-impact events to rare, high-magnitude disasters. For each future projection, the specific damage calculated for T1 was incorporated as the lower bound of the integration, allowing the model to reflect how climate change shifts the threshold at which economic disruptions begin.
3. Results
Using the explained flood scenarios and the electrical risk assessment methodology, this section presents the results obtained, comparing the affected installations and consumers first, then showing the socio-economic costs of the analysed events, and finally presenting a summary of the results with the Expected Annual Damage (EAD). Finally, a comparison with the previous project is conducted, analysing the different results.
3.1. Affected Assets and Clients
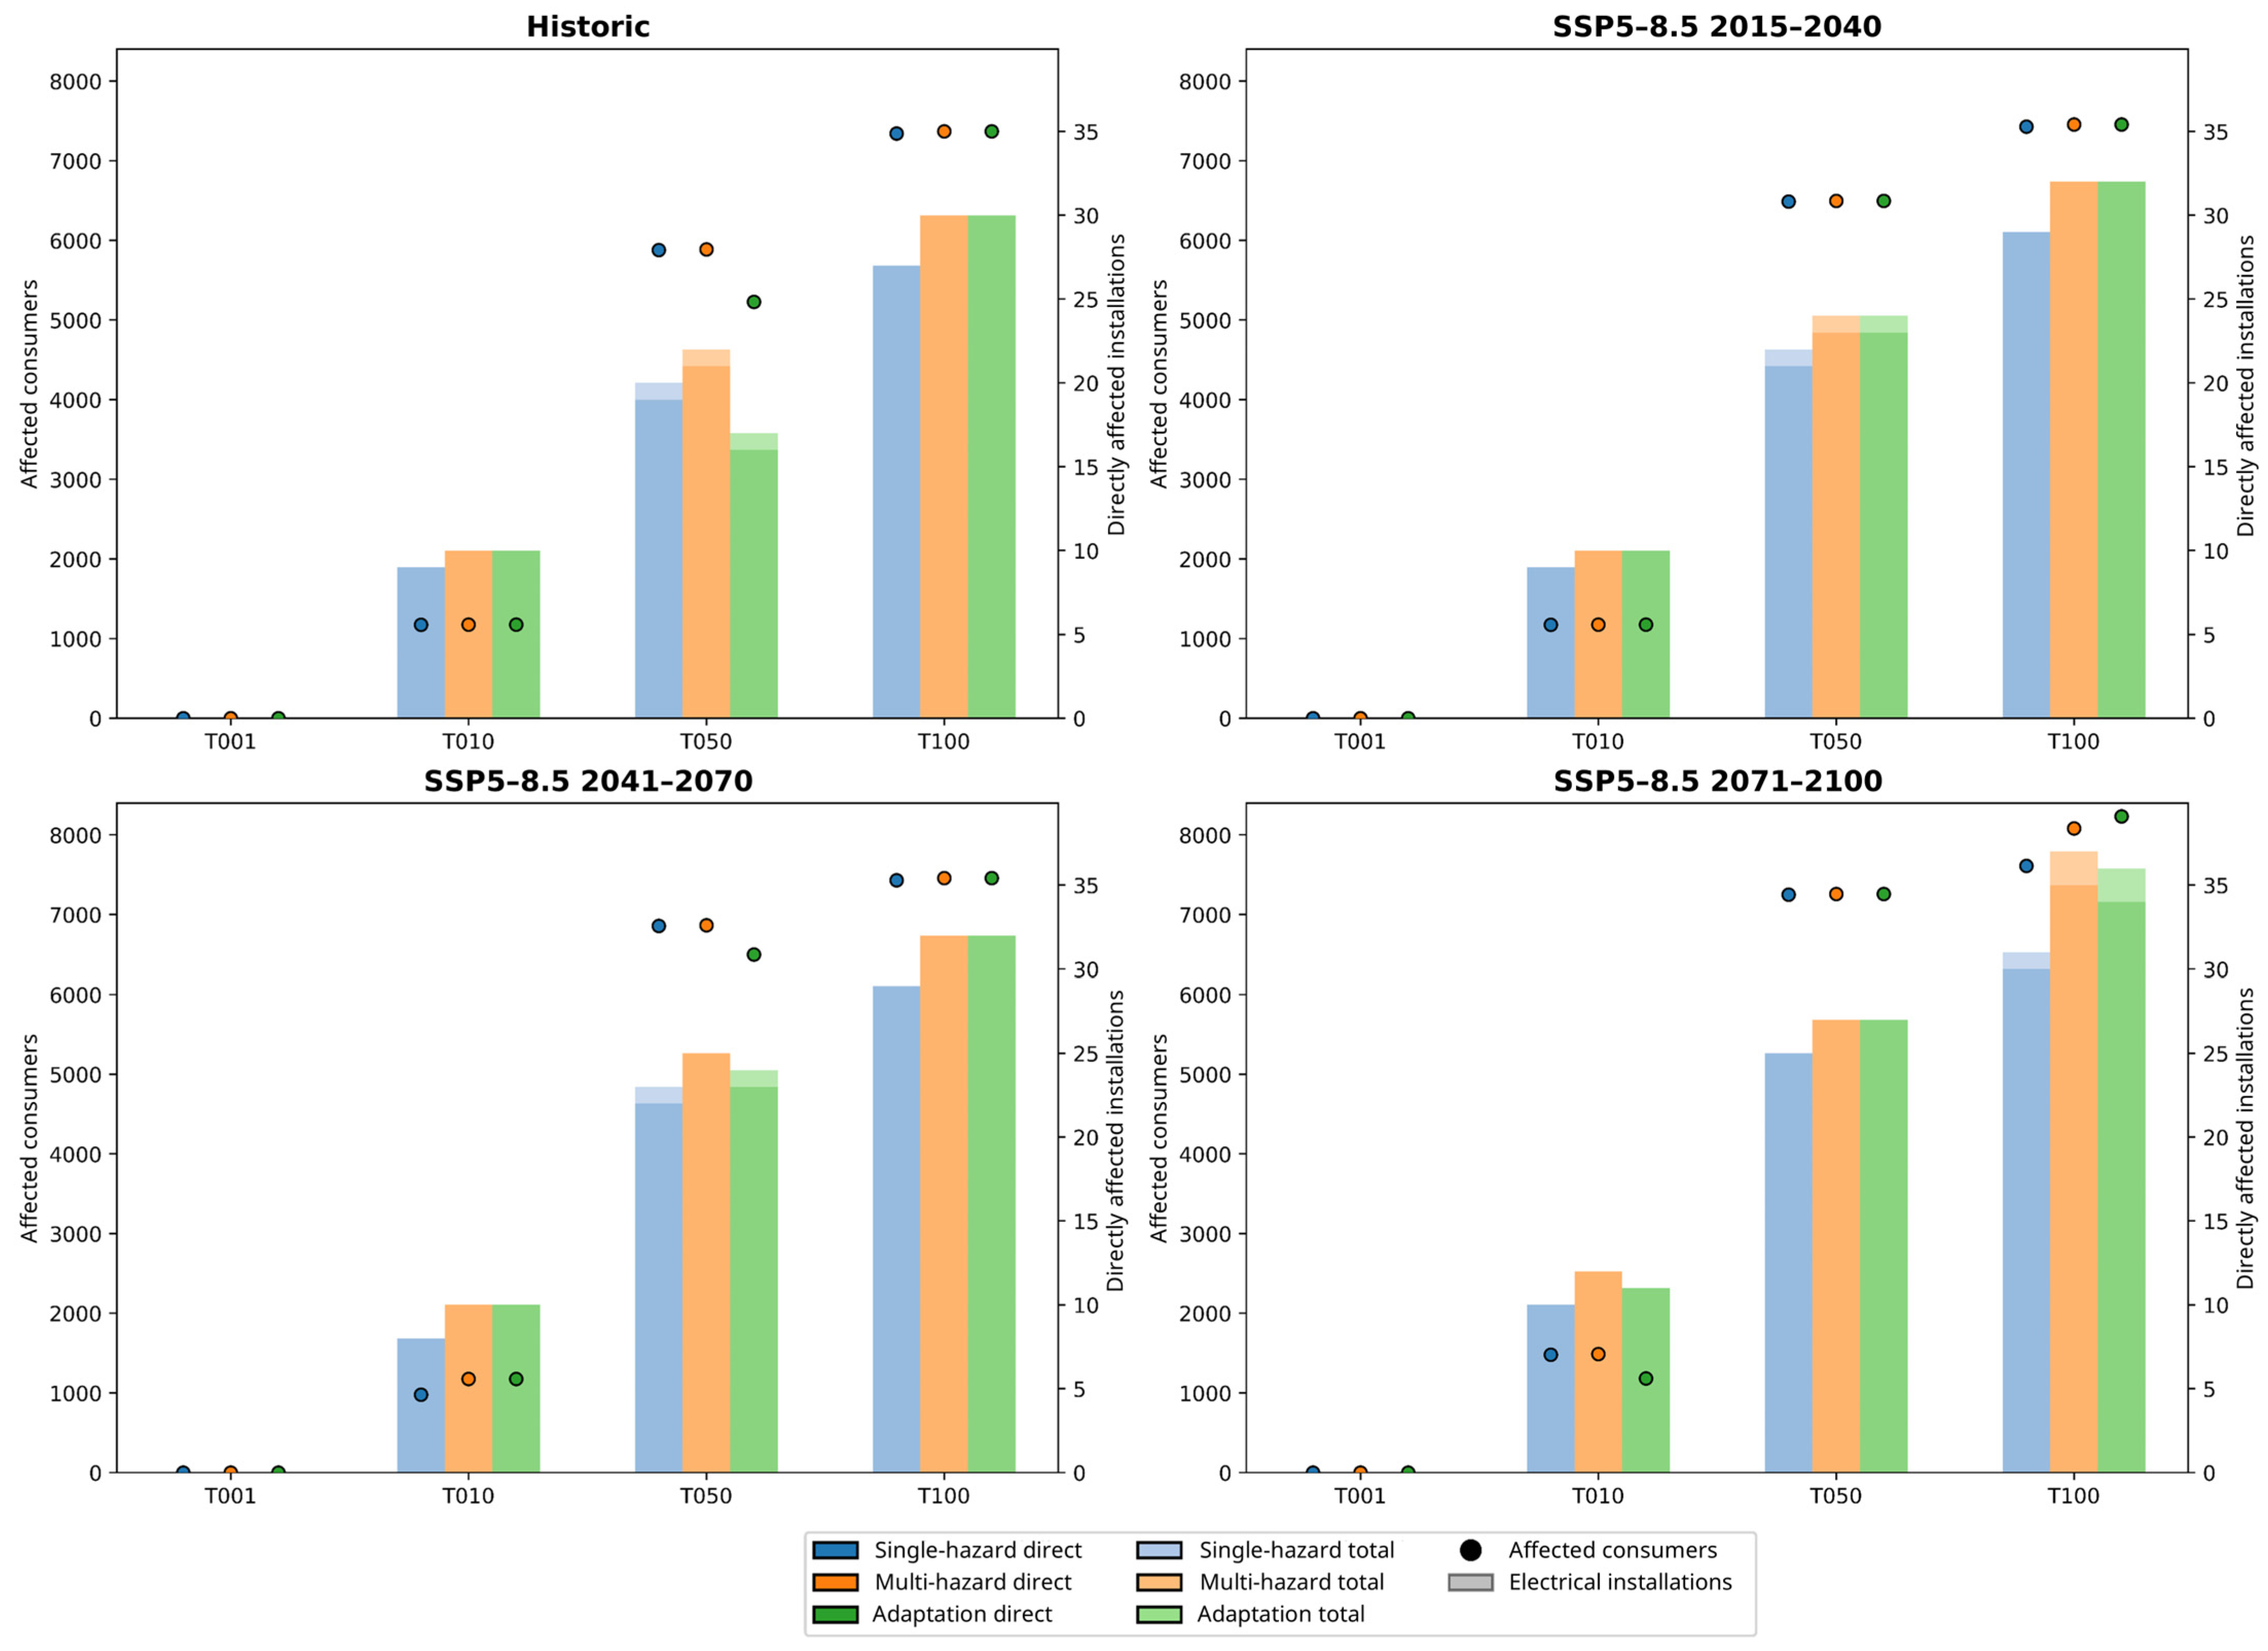
Figure 6 shows that the analysis of affected assets reveals distinct patterns across hazard approaches and temporal scales. Under historic conditions, the number of affected consumers remains minimal for low return periods (T001 and T010), with significant increases observed at T050 and beyond. At T100, all three approaches converge on approximately 7500 affected consumers and a few more than 35 directly affected installations, suggesting that extreme events overwhelm localised differences in hazard characterisation.
Under climate change projections (SSP5-8.5), a temporal positive trend is evident. For the 2015–2040 period, the T100 scenario shows approximately 7500 affected consumers, comparable to historic conditions. However, by 2071–2100, the multi-hazard and adaptation approach indicates slightly higher impacts, reaching approximately 8000 consumers, compared to the single-hazard approach, which results in approximately 7600.
Notably, the adaptation approach consistently shows fewer installations directly affected than in the baseline across all timeframes, particularly for high-return-period events. At T50 for historical, the adaptation scenario reduces the number of installations directly affected by approximately 30% compared to the multi-hazard baseline, demonstrating that strategic infrastructure protection measures can significantly mitigate exposure. However, there are other cases where the adaptation has the same result as multi-hazard, meaning that the measures did not have the expected effect. Finally, one last case: at T100 in 2071–2100, the installations affected are lower than in the multi-hazard scenario, but the affected consumers increase because the installations serving more consumers are affected.
3.2. Economic Impact Assessment
The economic analysis, in
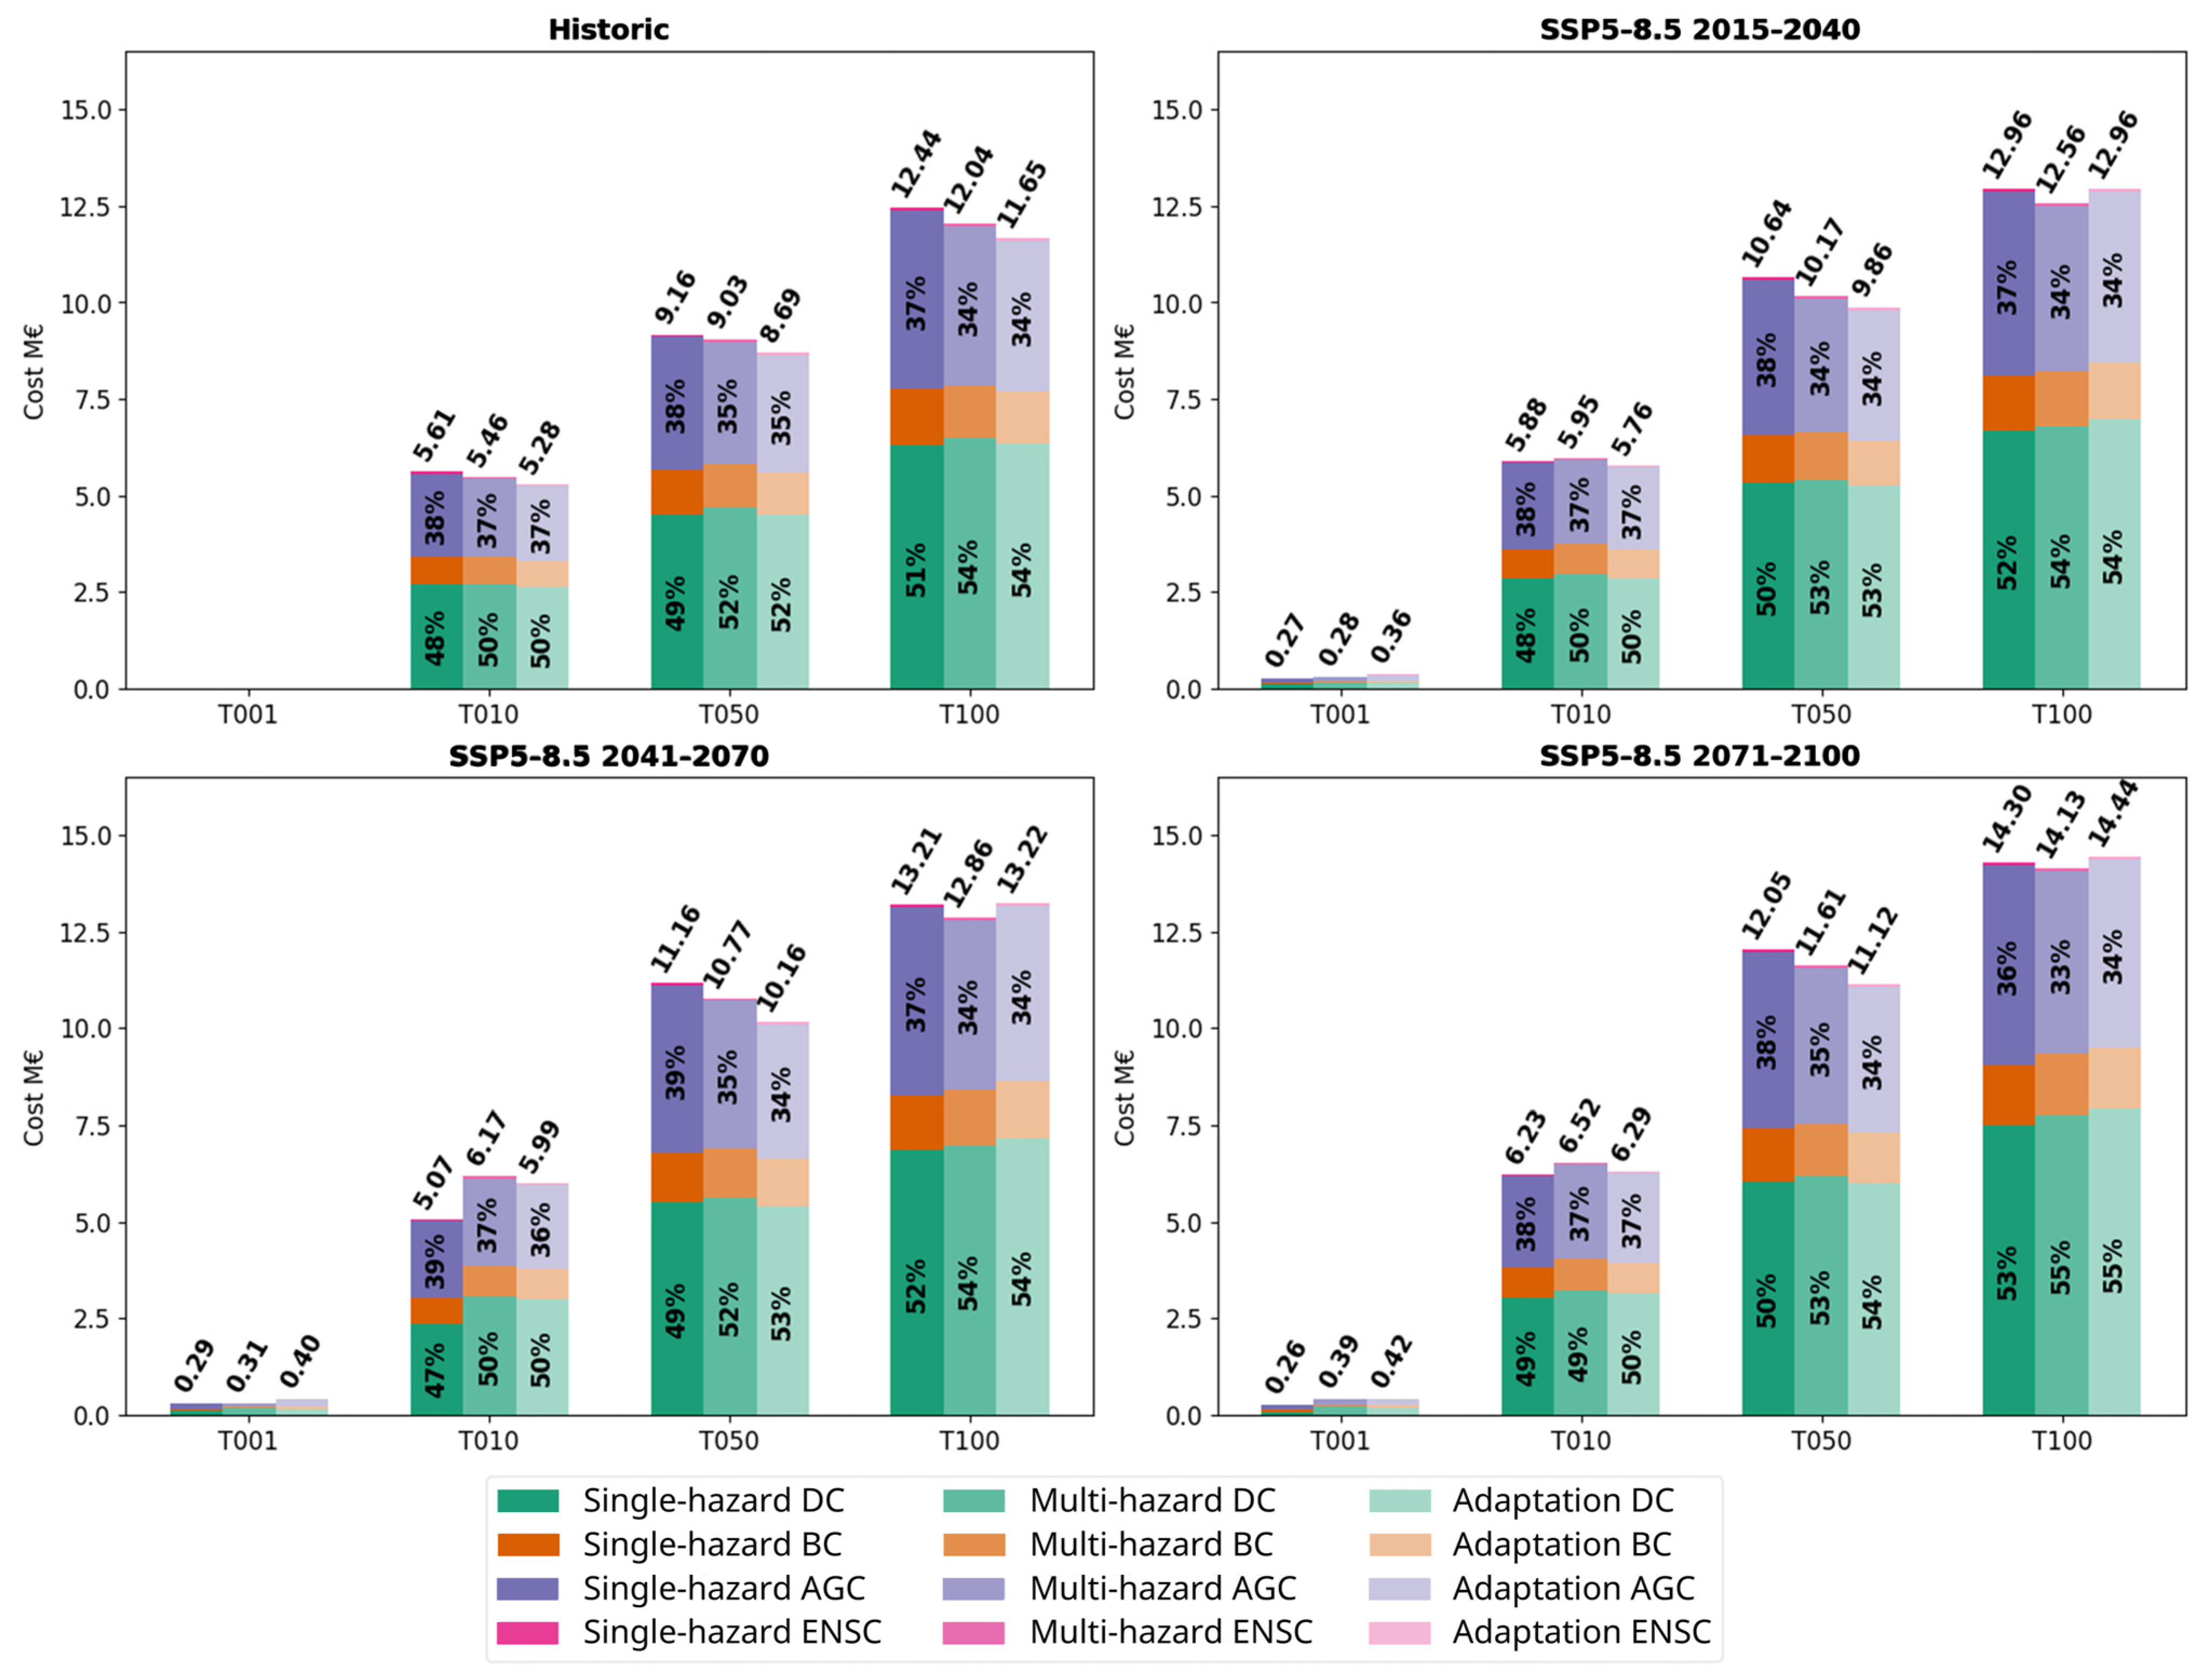
Figure 7, reveals the cost structure across different hazard scenarios, disaggregated into direct costs (DC), business continuity costs (BC), asset damage costs (AGC), and environmental/social costs (ENSC).
A clear increase in intensity pattern emerges across future timeframes. In the following list, there is an analysis of each projection:
Historic Period: Total costs at T100 reach approximately 12.4 M€ across all approaches. Direct costs constitute the largest proportion, around 50–55%, for all cases, followed by the auxiliary generator costs, which are close to 33%. Business continuity costs represent 10–12%, while environmental/social costs remain minimal (1–2%). The similarity across approaches suggests that under historic climate conditions, the additional complexity of multi-hazard assessment does not significantly alter total economic exposure. Comparing single-hazard, multi-hazard and adaptation, an interesting pattern appears, where the direct damage slightly increases in multi-hazard compared to single-hazard. This pattern is not followed in the indirect costs; it decreases because the flooded consumers are not considered for this indirect damage, as there is nothing to supply.
2015–2040: Costs at T100 increase to almost 13 M€, with direct costs maintaining dominance (50–54%). In this case the same pattern of direct costs versus indirect costs is observed.
2041–2070: Total costs at T100 peak at approximately 12.9 M€ for multi-hazard, compared to 13.2 M€ for single-hazard and 13.2 M€ for adaptation.
2071–2100: The cost gap widens further. Multi-hazard projects 20.3 M€ at T500, while adaptation limits costs to 18.1 M€—a reduction of approximately 11%. The single-hazard approach (20.3 M€) aligns closely with multi-hazard in this period, suggesting that by the late century, individual extreme flood events may approach the severity of combined hazards under high-emission scenarios.
In summary, across all timeframes, direct costs consistently account for 48–55% of total costs, asset damage costs 34-39%, and business continuity costs 11–13%. However, the absolute magnitude of each component increases significantly.
3.3. Expected Annual Damage Estimation
The results in
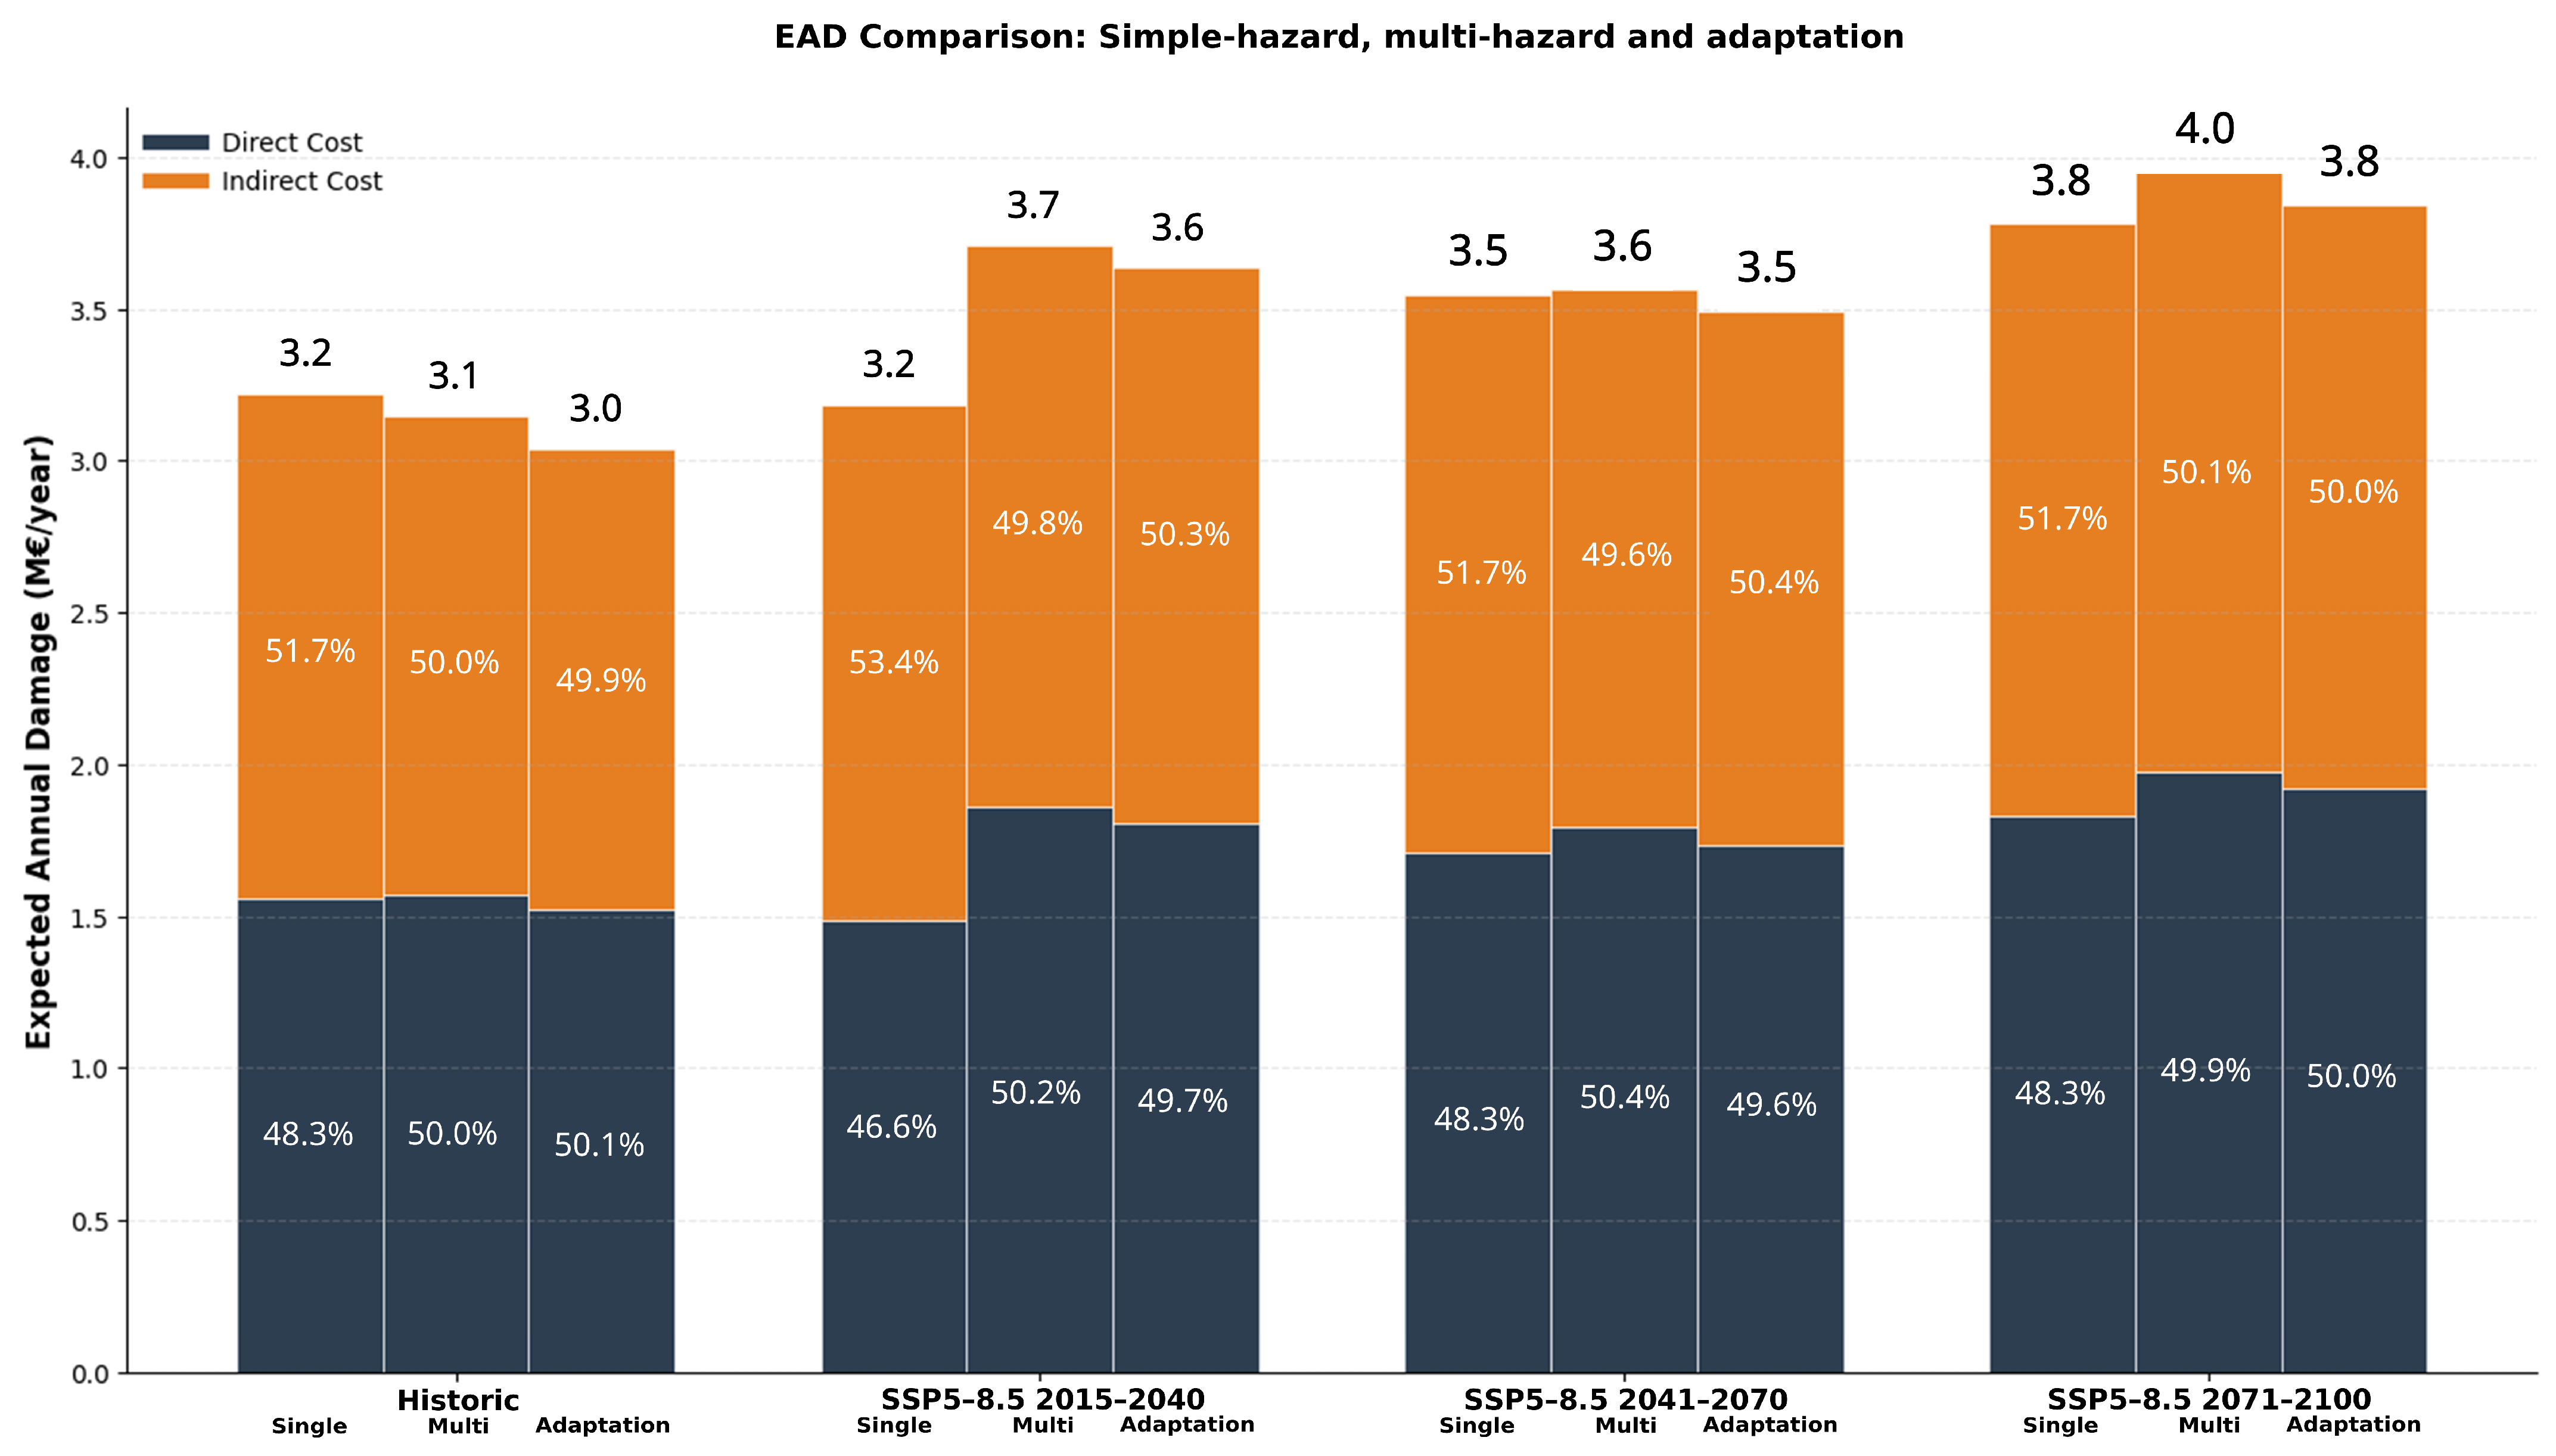
Figure 8 reveal a clear increase in expected annual damages under climate change scenarios. Under historic conditions, total EAD ranges from 3.0 to 3.2 M€/year, with minimal variation between approaches. The adaptation scenario shows the lowest total EAD (3.0 M€/year), followed by multi-hazard (3.1 M€/year) and single-hazard (3.2 M€/year).
Under SSP5-8.5 projections, total EAD increases across all timeframes:
2015–2040 (Near Future): EAD rises to 3.2–3.7 M€/year. Notably, the multi-hazard approach shows the highest EAD (3.7 M€/year), exceeding single-hazard (3.2 M€/year) by 16%.
2041–2070 (Mid-Century): EAD stabilises at 3.5–3.6 M€/year across all approaches, with minimal divergence between single-hazard (3.5 M€/year), multi-hazard (3.6 M€/year), and adaptation (3.5 M€/year).
2071–2100 (Late Century): EAD peaks at 3.6–4.0 M€/year. The multi-hazard approach again shows the highest values (4.0 M€/year), representing a 29% increase relative to the historic multi-hazard baseline (3.1 M€/year). The adaptation scenario achieves 3.8 M€/year, demonstrating a 5% reduction compared to multi-hazard.
Analysing the direct costs, the multi-hazard approach consistently generates the highest direct costs across all timeframes, reflecting the compounded physical damage from simultaneous flood mechanisms. The adaptation scenario successfully reduces direct costs relative to multi-hazard by 5–9% (0.08–0.17 M€/year), confirming the efficacy of protective infrastructure measures in limiting physical asset exposure.
The pattern observed in the direct costs aligns with theoretical expectations: adaptation measures (elevation, flood-proofing, and relocation) directly reduce the probability and severity of physical infrastructure damage, thereby lowering the direct cost component of risk.
Conversely, the indirect cost behaviour reflects the non-homogeneous spatial distribution of the AMB electrical system and the cascading failure dynamics of network infrastructure. From the observation of these results, four observations can explain this behaviour:
Critical Node Concentration: The electrical distribution network is characterised by concentrated critical infrastructure (high-voltage substations and primary distribution centres) in specific geographic zones, particularly coastal municipalities and the Llobregat River corridor. When adaptation measures protect these critical nodes, they may inadvertently shift failure risk to secondary infrastructure that serves different consumer populations.
Consumer Density Variability: Indirect costs depend on the number and type of consumers affected by infrastructure failure. Protected zones (under adaptation) may have different consumer densities than exposed zones. For example, protecting a coastal substation serving high-density commercial areas may reduce direct costs but shift failures to inland distribution centres serving lower-density residential zones, altering the indirect cost profile non-linearly.
Cascading Path Dependencies: The electrical network exhibits path-dependent cascading behaviour. Multi-hazard scenarios generate correlated failures across multiple infrastructure types (substations + distribution centres), potentially affecting redundant pathways and disproportionately amplifying indirect costs. Adaptation measures may interrupt some but not all cascading pathways, resulting in indirect cost reductions that do not scale linearly with direct cost reductions.
Temporal Dynamics of Recovery: Indirect costs incorporate business interruption duration. Multi-hazard events may damage multiple infrastructure layers simultaneously, extending recovery times and increasing indirect costs per affected consumer. Adaptation measures that protect primary infrastructure but leave secondary networks exposed may reduce immediate failure probability while leaving recovery dynamics unchanged.
3.4. Detailed Analisis of Relevant Scenarios
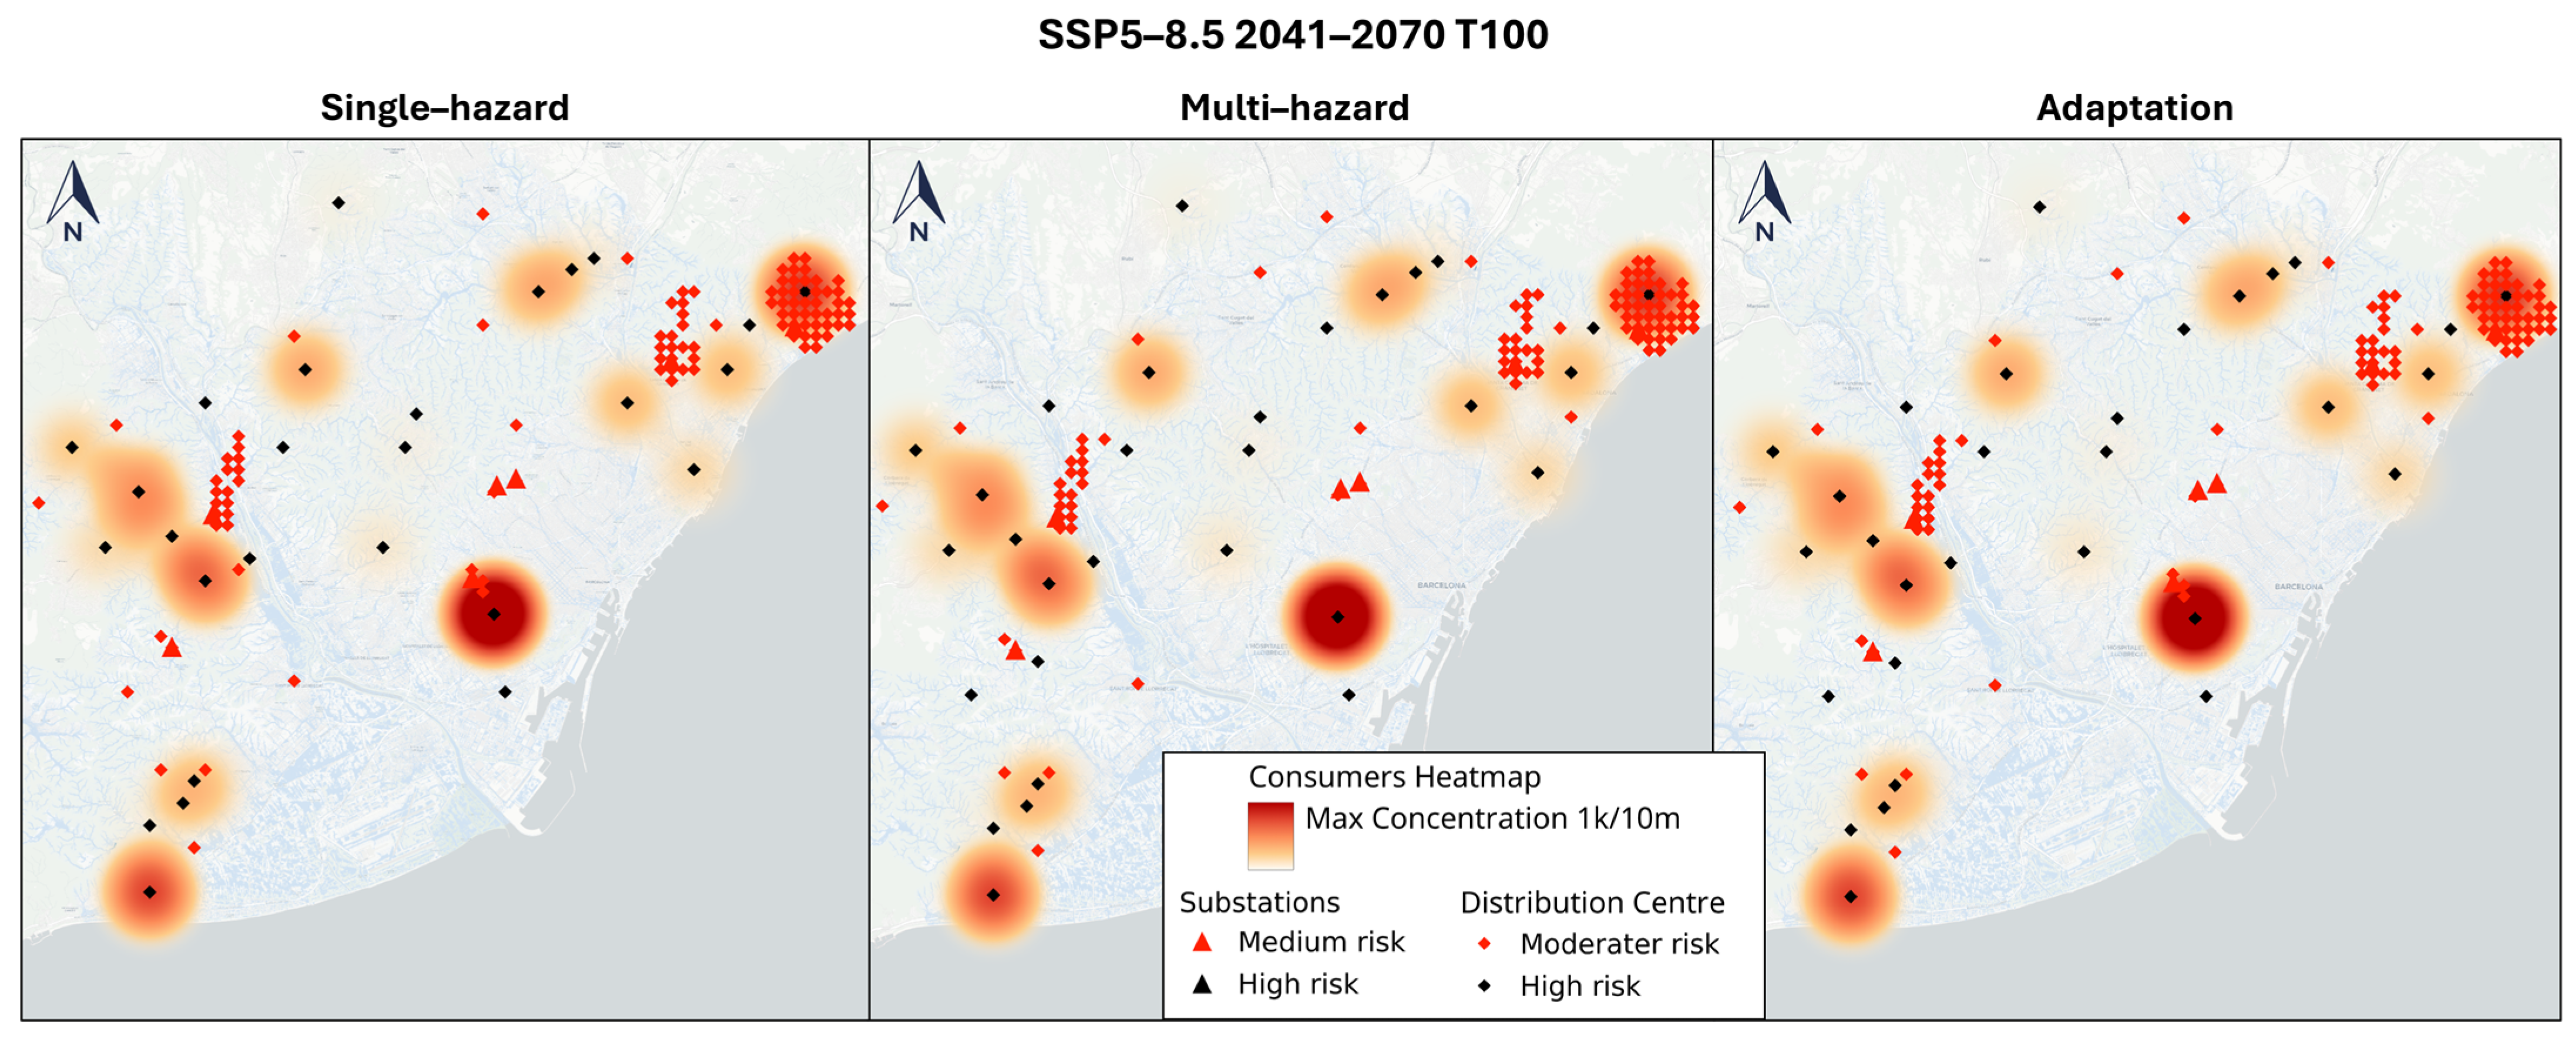
The comparative analysis between the multi-hazard baseline and the adaptation scenarios reveals that, in most cases, the adaptation measures yield results that are not highly relevant or distinctively different from the baseline, particularly regarding the maximum water depth. As in the case of SSP5-8.5 2041–2070 T100, in specific zones containing critical installations, the adaptation measures were insufficient to significantly reduce flood depth, with the maximum depth decreasing only marginally from 24.22 m to 24.19 m. Furthermore, this slight reduction coincides with the redistribution of water to other zones where such depth was previously lower.
Figure 9 presents a visual comparison of the three cases (single-hazard, multi-hazard, and adaptation). The figure depicts substations as triangles and distribution centres as rhombuses, colour-coded to indicate risk levels (moderate risk vs. high risk). It also displays the concentration of affected consumers within a specific radius, where the maximum concentration reaches 1000 consumers per 10 m increment. These minor numerical differences suggest that while adaptation measures can shift the impact profile, they do not always result in a substantial net reduction in flood depth for high-intensity events. This aligns with observations that adaptation measures may interrupt some but not all cascading pathways, resulting in indirect cost reductions that do not scale linearly with direct cost reductions. The spatial layout of these measures does not always align with specific vulnerability nodes, highlighting that under the SSP5-8.5 climate scenario static adaptation strategies may face limitations in efficacy without dynamic upgrades.
3.5. Comparative Analysis with Previous Barcelona Risk Assessment
This study represents a significant advancement over the previous flood risk assessment conducted for the Barcelona electrical system [
17]. While both studies employ comparable hazard characterisation and climate scenarios (RCP 8.5/SSP5-8.5), five key methodological differences distinguish the current analysis and provide enhanced insights for metropolitan-scale risk management.
First, the spatial scope has been substantially expanded. The previous study was limited to the municipality of Barcelona, whereas the current assessment encompasses the entire Àrea Metropolitana de Barcelona (AMB), comprising 36 municipalities and approximately 5.8 million inhabitants. This expansion more than triples the geographic coverage and incorporates diverse flood regimes across coastal, fluvial, and pluvial systems that were not captured in the city-limited analysis.
Second, the effects of cascading failures have been explicitly incorporated. The previous assessment considered only direct infrastructure impacts, neglecting the network propagation of failures through the electrical distribution system. The current study implements a cascading failure model that traces how direct damage to critical nodes (substations and distribution centres) propagates through the network, affecting downstream infrastructure and consumers. This represents a fundamental shift from asset-based to system-based risk assessment.
Third, the affected elements metric has been refined. The previous study reported aggregated counts of affected infrastructure without distinguishing between direct and indirect impacts. The current analysis explicitly differentiates between directly affected installations (those experiencing physical flood damage) and indirectly affected installations (those failing due to network cascading effects). Additionally, the number of affected consumers has been introduced as a complementary impact indicator, providing a human-centred perspective on the consequences of infrastructure failures that were absent from the previous assessment.
Fourth, the temporal scope has been extended. While the previous study relied exclusively on historical climate conditions with RCP 8.5 as the sensitivity scenario, the current assessment uses full transient climate projections across four timeframes: historic, 2015–2040, 2041–2070, and 2071–2100. This enables the characterisation of risk-evolution trajectories rather than static snapshots, capturing the time-dependent intensification of flood hazards under high-emission pathways.
This comparison demonstrates that risk assessment is not merely a technical exercise but a scale-dependent, methodologically contingent practice in which scope expansion and analytical refinement can fundamentally reframe the understanding of system vulnerability. The current AMB consumer-sensitive assessment provides the necessary foundation for climate-resilient planning of electrical infrastructure in the AMB region.
5. Conclusions
This study has developed a comprehensive, multi-layered framework to assess the long-term flood risk to the electrical grid in the Barcelona Metropolitan Area (AMB). By integrating climate projections for the year 2100 with micro-scale spatial modelling, several key findings have been established that directly address the study objectives.
5.1. Summary of Key Findings
First, the model’s methodological robustness is confirmed even under data scarcity. The use of open-source data enables the localisation of over 920,000 consumers across cadastral units, enabling high-resolution estimates of service disruption impacts that conventional macro-scale models often overlook. Second, the analysis reveals that socio-economic indirect impacts, calculated using a GDP-proportionality approach, constitute the largest share of total risk, underscoring the vulnerability of metropolitan productive activity to power outages. Third, the multi-hazard approach reveals that compound flood mechanisms, combining coastal level rise, generate higher impacts than single-hazard assessments, particularly in future climate scenarios. Under high-emission scenarios (SSP5-8.5), the number of affected consumers for extreme events (T100) could reach 7600–8000 by the late century, with associated economic costs exceeding 14.4 M€ per event.
5.2. Policy Implications and Recommendations
The findings suggest that climate-resilient infrastructure planning must move beyond static, single-hazard approaches to address the complex, evolving nature of climate risks. These insights support sustainable development goals by integrating dynamic, multi-hazard risk assessment frameworks into electrical infrastructure planning:
Prioritisation of Key Grid Nodes: Protection efforts should prioritise specific grid nodes identified in this study (e.g., substations and distribution centres in high-risk zones) rather than uniform grid-wide upgrades.
Optimisation of Adaptation Spatial Layout: The spatial layout of adaptation measures should be optimised to align with the locations of critical assets. Given that adaptation measures in high-risk zones may only redistribute water depth rather than fully reduce it, nature-based solutions must be strategically placed to avoid unintended consequences.
Enhancing Meshed Electrical Grid: Enhancing power grid supply paths can help mitigate cascading failures, ensuring that localised flood events do not trigger system-wide effects.
CAPEX over OPEX: Early investment in physical hardening should be prioritised over continuous emergency response, as the long-term cost of temporary mitigation escalates rapidly under high-emission scenarios. This aligns with the sustainable development principles of proactive adaptation rather than reactive response.
These measures provide a practical framework for guiding infrastructure planning in coastal urban regions. While climate change will inevitably increase flood risks, proactive adaptation and targeted reinforcement can substantially moderate these impacts, offering a template for electrical utility risk management globally. Further investigations are needed, working with electrical systems operators, to identify the critical elements of the system and develop additional adaptation measures to mitigate the risks.