Article

Agent-Based Modeling of Pedestrian Crossing Behavior in Commercial Streets: Seven Actionable Strategies for Safe and Sustainable Urban Mobility

Department of Urban Design and Planning, Faculty of Engineering, Ain Shams University, Cairo 11517, Egypt
*
Author to whom correspondence should be addressed.
Sustainability 2026, 18(8), 4122; https://doi.org/10.3390/su18084122
Submission received: 20 March 2026 / Revised: 12 April 2026 / Accepted: 17 April 2026 / Published: 21 April 2026
(This article belongs to the Special Issue Sustainable Urban Green Transport and Mobility: Lessons from Practice)

Abstract

Despite extensive research on sustainable urban mobility, non-designated crossings remain underexplored, particularly in low- and middle-income countries where they are highly prevalent. This study applies agent-based simulation to analyze pedestrian crossing behavior in commercial streets. We adopted a mixed-methods approach, combining video recordings, field observations, and structured questionnaires to capture physical conditions and user perceptions in a case in Cairo. The collected data were spatially analyzed using a Geographic Information System (GIS) to identify key spatial and behavioral variables influencing crossing decisions. These variables were then incorporated into an Agent-Based Model developed using the GAMA platform to simulate pedestrian–vehicle interactions. The simulation assessed pedestrian flow, non-designated crossing rates, average vehicle speed, and traffic volume. Results indicate strong relationships between pedestrian flow and non-designated crossings, and moderate associations between increased pedestrian activity and reduced vehicle speeds, while traffic volume shows weak correlations with pedestrian-related indicators. The model reveals distinct patterns of pedestrian crossing behavior, shaped by street configuration and traffic dynamics, and highlights critical risk points in commercial streets. Based on these findings, the study proposes seven actionable strategies to enhance pedestrian safety while supporting a more sustainable urban mobility.

1. Introduction

Pedestrian movement is a fundamental human activity for urban sustainability, characterized by its inherent simplicity and with key implications for the environment, public health, social cohesion, and the local economy [1,2,3,4]. Previous studies have documented safety challenges in pedestrian movement in some cities of low- and middle-income countries (LMICs), including traffic calming, crowding, and user well-being [5,6,7]. Various studies discuss pedestrian safety from diverse perspectives, including urban design and infrastructure planning, traffic management, human behavior, and policy interventions [8,9,10,11,12].
Research in urban planning and design emphasizes the role of street geometry, crosswalk placement, and sidewalk continuity in influencing pedestrian risk exposure [13,14,15]. From a behavioral standpoint, studies highlight the significance of pedestrian decision-making, perception of safety, and interactions with vehicular traffic as critical determinants of accident likelihood [2,16,17,18,19]. Traffic engineering research further explores the effects of signal timing, vehicle speed regulation, and visibility on pedestrian safety outcomes [20,21,22]. In addition, policy-oriented analyses examine the impact of regulatory policies, public awareness campaigns, and enforcement mechanisms on the promotion of safer pedestrian environments [23,24,25]. These approaches underscore the multifaceted nature of pedestrian safety, arising from the complex interplay among spatial design, behavioral factors, and systemic governance [26,27,28,29].
This article examines the challenges that influence pedestrian movement across urban streets, focusing on factors such as crossing behaviors, streetscape quality, street furniture, and the design of pedestrian crossings. It argues that these challenges collectively influence pedestrians’ physical comfort, sense of safety, and overall well-being. Understanding these interrelated factors is essential for creating pedestrian-friendly environments that encourage walking as a sustainable mode of transport and promote social inclusion [30,31]. By analyzing the spatial and perceptual dimensions of street design, the study argues that poorly integrated elements—such as inconsistent paving materials, obstructive furniture placement, or insufficient crossing facilities—can deter walking and reduce street vitality [2,32,33]. Conversely, well-designed streetscapes that prioritize legibility, accessibility, and visual coherence can significantly enhance the pedestrian experience and contribute to urban livability [16,34,35].
Although pedestrian safety and well-being are challenging worldwide, few studies address these issues in LMICs, and even fewer discuss street-crossing safety [36]. Activities associated with road safety during street-crossing improvements in LMICs, such as traffic enforcement and post-crash response, are limited. Moreover, pedestrian safety remains the foremost challenge in LMICs, with limited data-driven, rigorous studies to map pedestrian safety and the risks they face [24,37,38]. Among the goal targets was target 3.6, a universal call to halve road traffic deaths and injuries by 2020 and, by 2030, ensure that all people enjoy peace and prosperity. In addition to target 11.2, which focuses on providing safe, affordable, accessible, and sustainable transport systems for all and improving road safety [39,40].
In LMICs, pedestrians frequently cross urban streets at non-designated locations, exposing themselves to significant safety risks [41,42]. While numerous studies have explored pedestrian behavior at signalized and designated crossings, limited research has focused on understanding pedestrian decision-making and behavior at non-designated crossing points [43,44,45]. These informal crossings often occur due to inadequate crossing facilities, poor urban design, or user preference, creating unsafe conditions that contribute to high pedestrian injury and fatality rates [41,46]. In addition, accessibility is highlighted as a central concern, ensuring that urban streets are navigable and usable by people of all abilities. These aspects underscore the importance of evaluating pedestrian interactions within urban environments and justify the relevance of the present study in supporting human-centered, equitable, and sustainable urban mobility [47,48].
The research question is: how does agent-based simulation realistically model pedestrian behavior at crossings in commercial urban streets, and what insights can it provide into pedestrian flow and its implications for safer, sustainable street design? By seeking answers within the discourse of urban research, these questions can facilitate an exploration of the design standards for urban street-crossing facilities, along with road-safety factors and measurement indicators in LMICs, to ensure the development of safer urban streets. Through this investigation, valuable insights into urban planning and design practices can be uncovered, shedding light on the transition towards more human-centered design in urban development to create safer streets for all users.
This study aims to develop and apply a simulation-based analytical framework to investigate the interrelationships among factors influencing pedestrian behavior and safety in urban street environments. The study also attempts to equip urban planners, transport engineers, and policymakers with an accessible tool to optimize street design and prioritize pedestrian safety. It can also help planners simulate how modifying crossing design or vehicle speed limits would affect pedestrian behavior. In doing so, it supports advancing more inclusive, safe, and sustainable urban mobility, reinforcing the shift toward community-centered development practices.
To investigate pedestrian behavior while street crossings, we adopted a mixed-methods approach combining observational and videographic recordings in a case study in Cairo to capture both real-time pedestrian behavior and user perceptions. The collected data was analyzed using Geographic Information Systems (GIS), which support spatial analysis of crossing locations and identify key factors influencing crossing decisions. The GIS and Agent-Based Modeling Architecture (GAMA) platform was employed to validate behavioral patterns, ensuring the model reflects realistic urban dynamics. This simulator was used to model pedestrian dynamics, contributing to more context-sensitive and behavior-informed urban street design strategies that enhance pedestrian safety and mobility.
This study advances the field of urban design by introducing a novel simulation-based analytical framework that systematically quantifies the interrelationships among key factors influencing pedestrian behavior and safety. Unlike prior studies that primarily relied on observational or descriptive methods, this research integrates an agent-based modeling (ABM) approach with quantitative correlation and regression analyses, providing empirical equations that link pedestrian flow, non-designated crossing activity, vehicle traffic, and vehicle speed. These equations provide a predictive understanding of how variations in independent variables affect pedestrian movement and flow dynamics in a real urban street segment.
Furthermore, the study offers a replicable methodology for implementing the ABM simulation in other urban contexts. This combination of modeling, quantitative analysis, and practical replication procedures represents a significant contribution, enabling both researchers and practitioners to design more people-oriented, safe, and evidence-based urban streets. The framework not only produces actionable insights into urban interventions but also provides a methodological template for future studies seeking to bridge empirical observation and simulation-based analysis.

2. Materials and Methods

This research employed a mixed-methods approach, comprising a survey and spatial analysis, as well as an agent-based simulation of a case study in Cairo, Egypt. The purpose of our field study was to validate the research questions. The case study examined the impact of the area’s street-crossing design on pedestrians’ behavior.

2.1. The Case Study

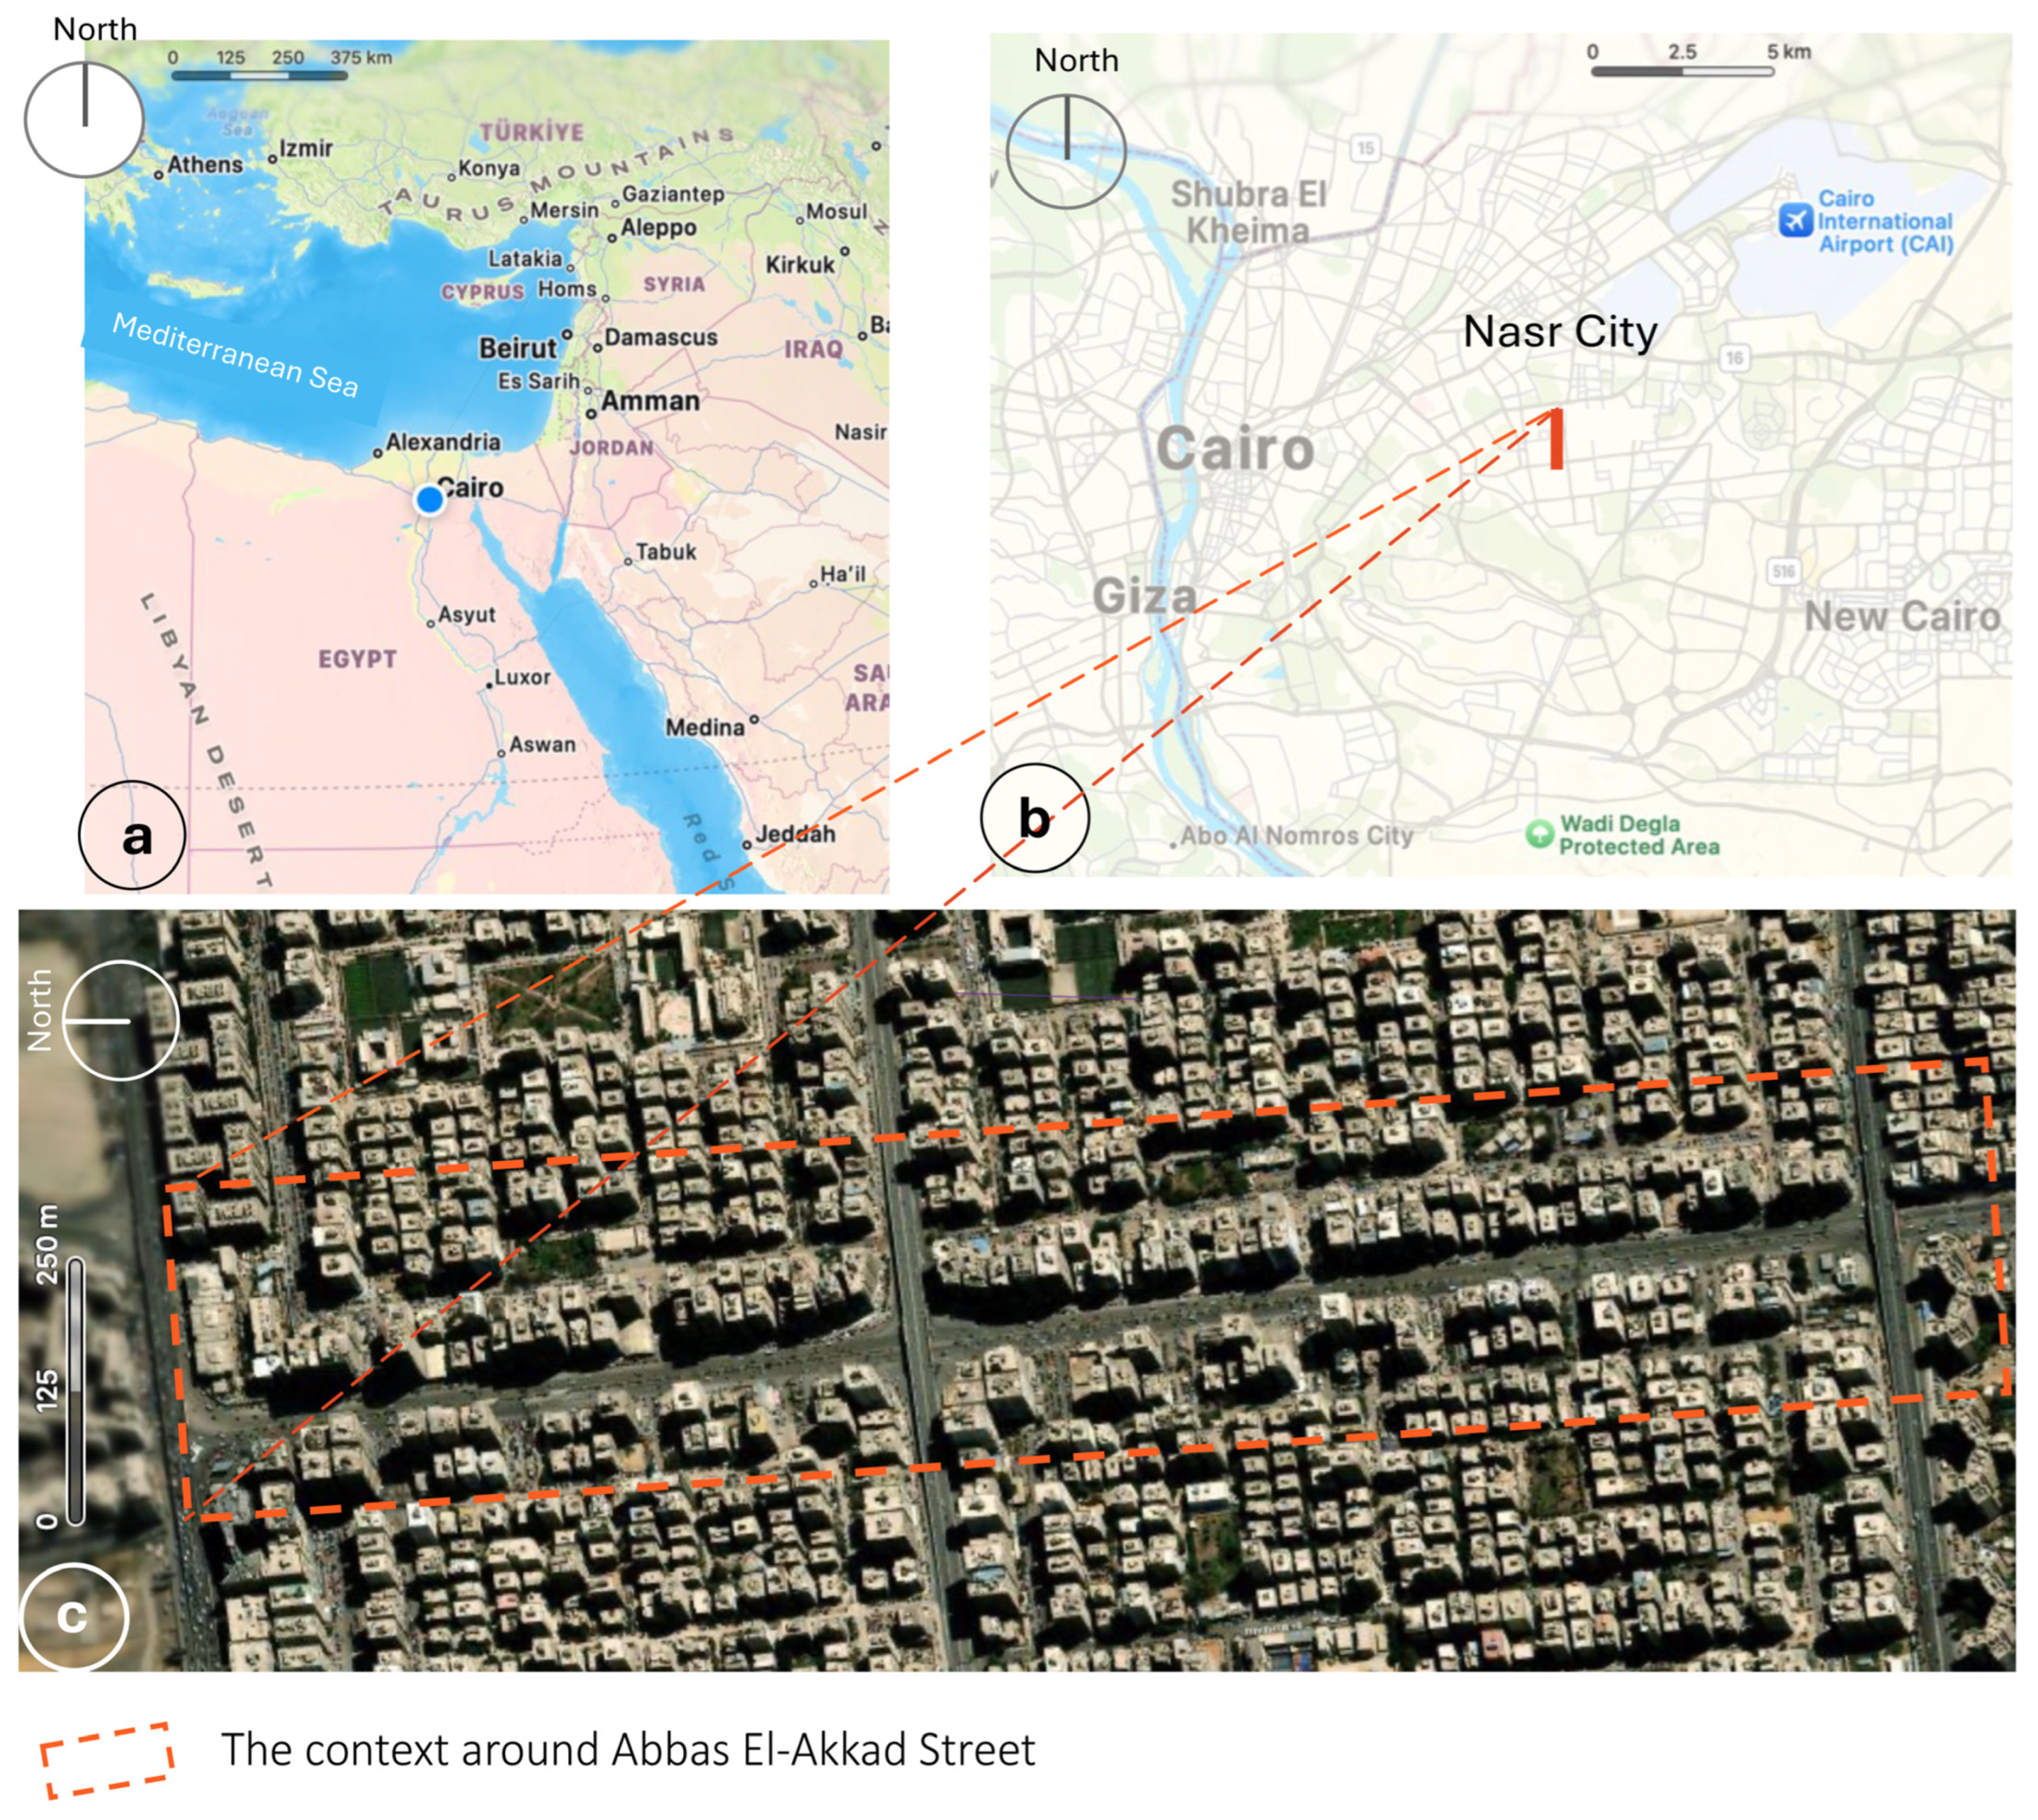
This study adopts a commercial street in Cairo as a case study (Figure 1). Abbas El-Akkad Street in Nasr City, Cairo, Egypt, was selected due to its high pedestrian and vehicular activity, diverse land uses, and its role as a major commercial corridor. These characteristics make it a representative example of rapidly developing urban streets in the Egyptian context, where informal pedestrian crossing behaviors frequently emerge. In addition, the site provides suitable conditions for observing interactions between pedestrians and vehicles across different spatial and temporal settings. The availability and accessibility of detailed field data further supported its selection as an appropriate case for in-depth analysis.
Abbas El-Akkad Street is a vital and recognizable urban corridor in the Egyptian capital. Originally developed during the 1960s and 1970s as part of the state-led expansion eastward. Over the decades, the street organically evolved beyond its original function, transforming into a dense, mixed-use urban axis with high pedestrian and vehicular activity. However, this rapid growth was accompanied by significant urban challenges, including traffic congestion, informal parking, deteriorating sidewalks, and limited pedestrian safety infrastructure. In response to these issues, a major urban upgrade project was launched and completed in 2018 under the supervision of the Cairo Governorate, with a considerable investment.
The refurbishment in Cairo involved a comprehensive upgrade of the area’s infrastructure and public realm [49,50]. The street width was widened from twelve to seventeen meters in both directions to improve traffic flow and reduce congestion. Central islands and sidewalks were redesigned, with island widths reduced to accommodate additional lanes while preserving greenery and pedestrian access. Sidewalks were also expanded to enhance accessibility and comfort [51]. Public amenities underwent significant improvement, including the installation of new street lighting, benches, landscaped elements, and accessible pedestrian crossings [52]. Moreover, a new irrigation network and storm drainage systems were introduced to strengthen environmental and infrastructural sustainability [53,54]. The project also implemented modern urban management tools, including regulated parking bays, standardized commercial façades, Closed-Circuit Television (CCTV) surveillance, and upgraded traffic control signage, to ensure safety, efficiency, and visual coherence.
The recent upgrades to Abbas El-Akkad Street have addressed several key urban issues, including traffic congestion, informal parking, and streetscape coherence. However, challenges related to pedestrian safety, accessibility, and mobility integration persist. This study discusses these remaining issues in its analysis, highlighting the need for more comprehensive, people-centered urban interventions that extend beyond physical upgrades to include behavioral and regulatory dimensions.

2.2. Data and Analysis

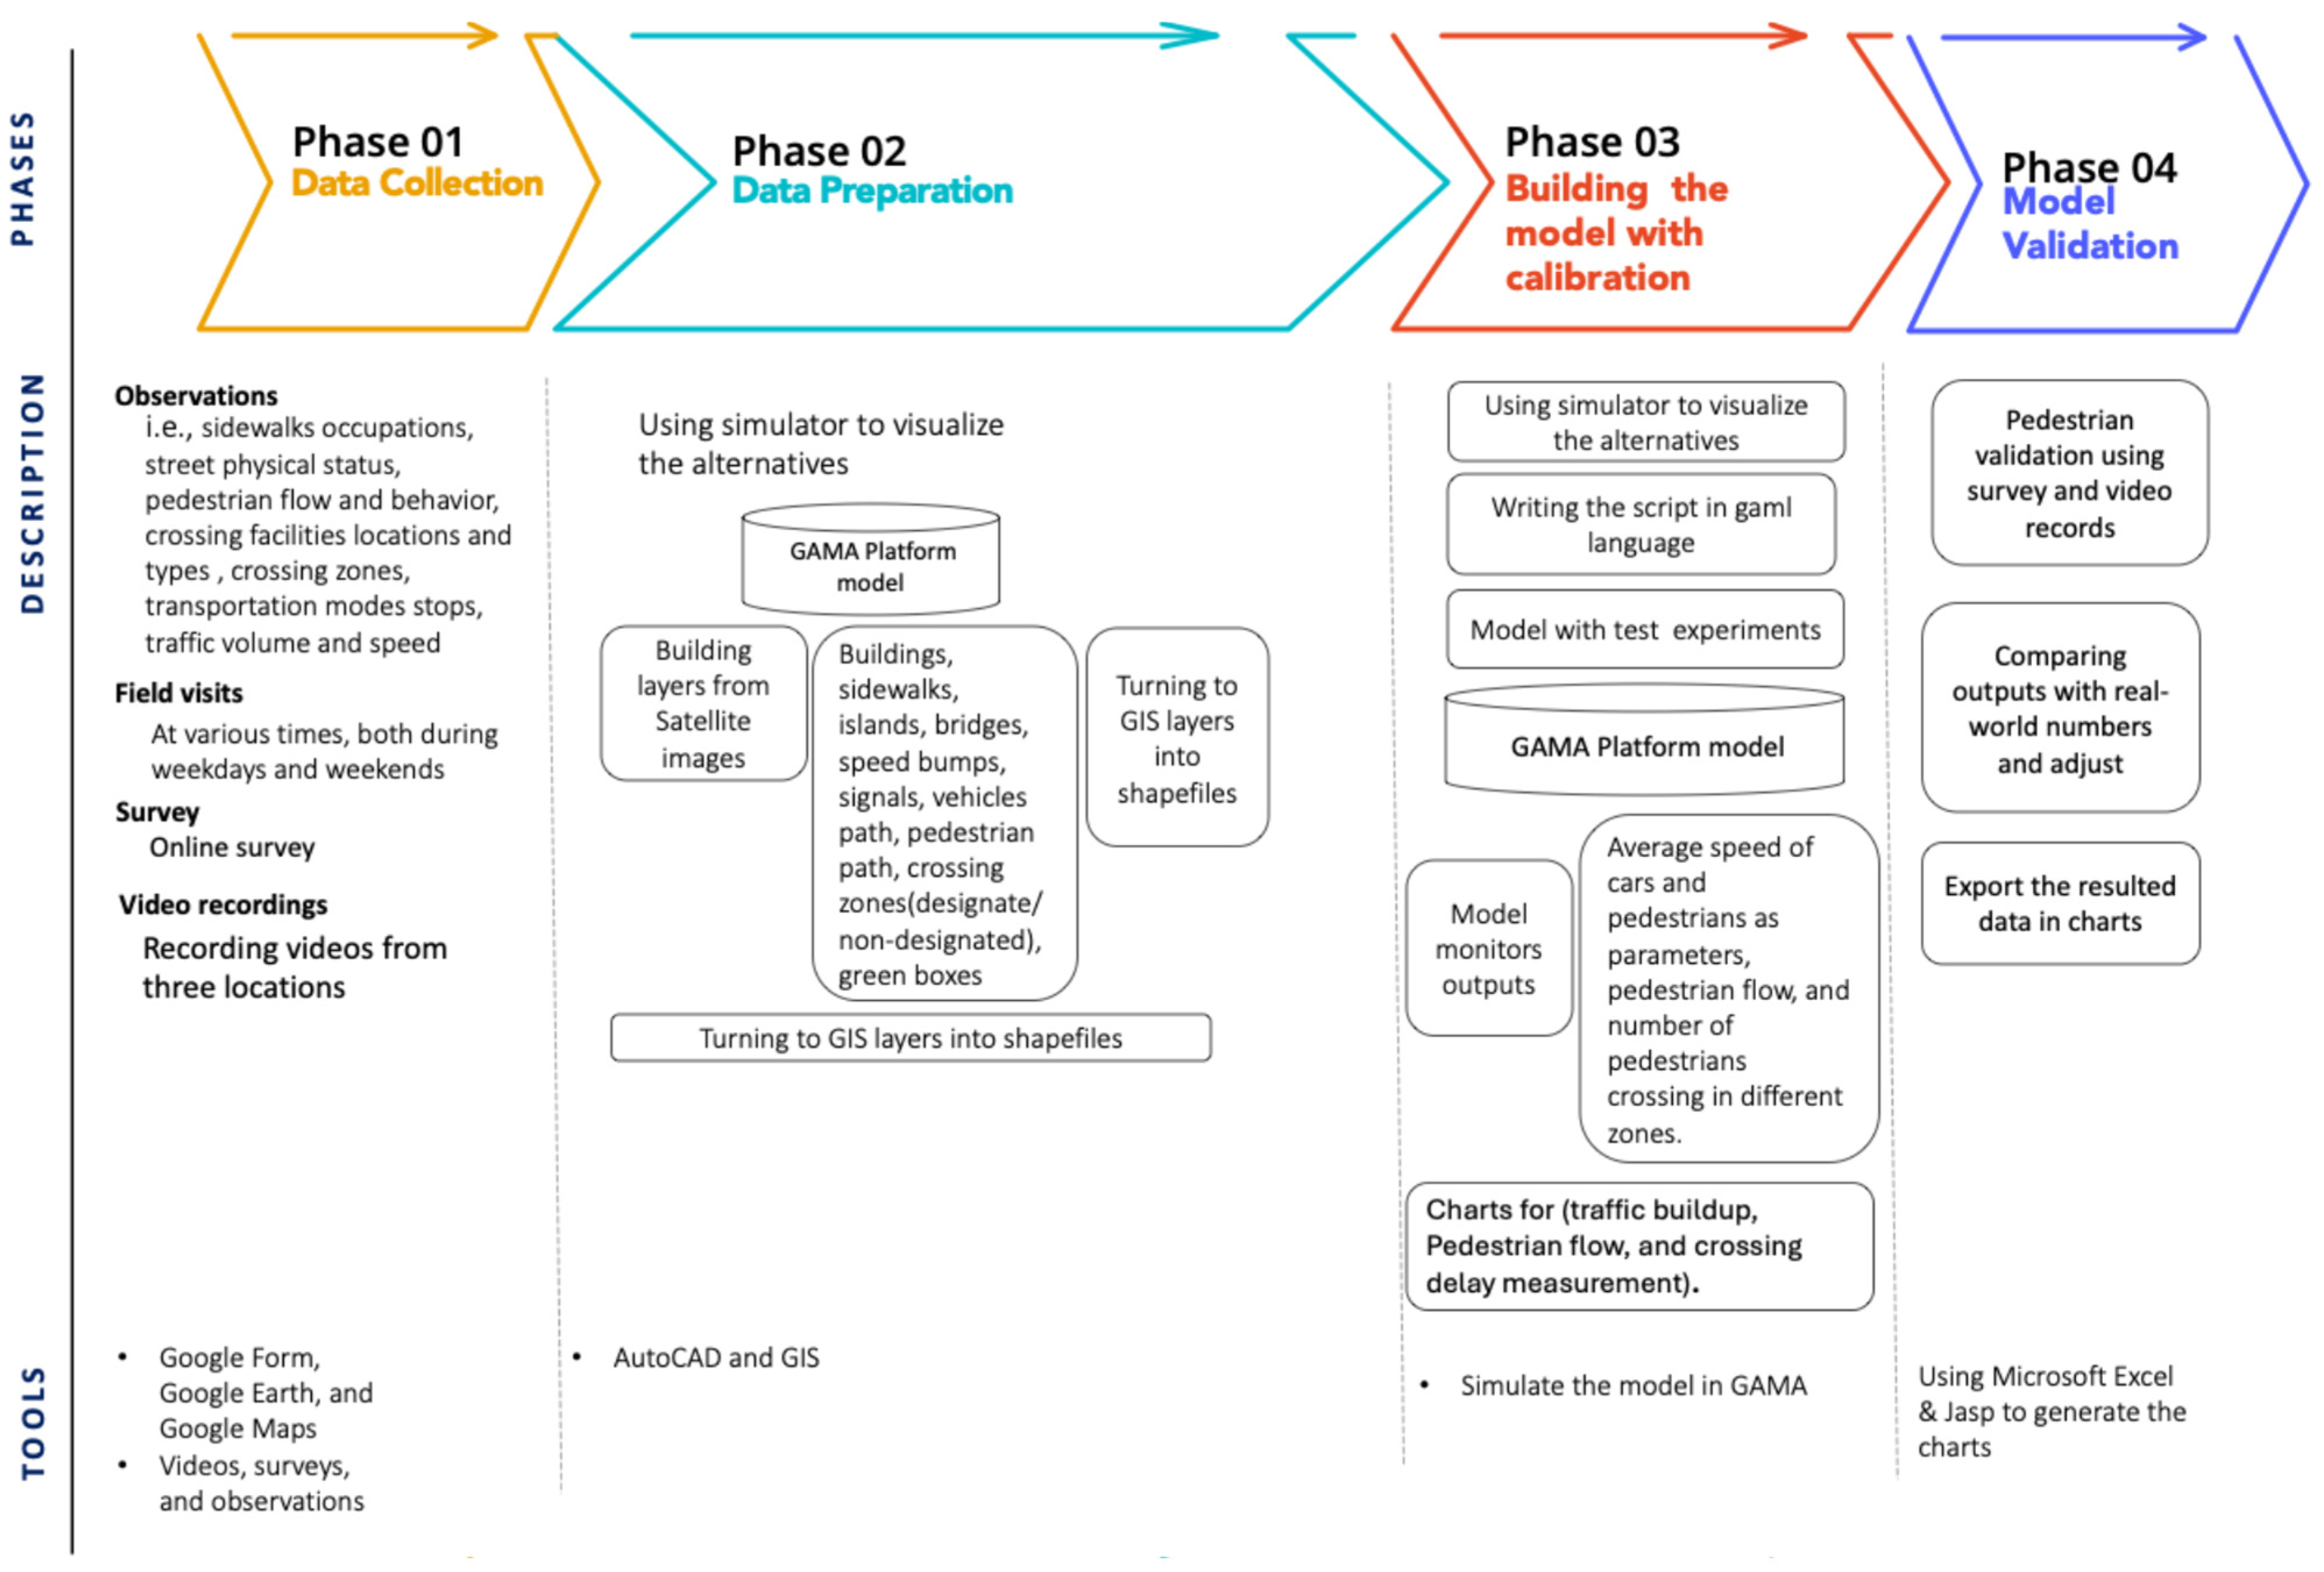
We selected a pedestrian crossing model influenced by multiple parameters, each comprising distinct variables [2,8,34,55]. To facilitate the analysis of relationships within the simulation, these variables were classified into dependent and independent categories. The selection of variables was guided by their ability to realistically represent the actual context. Accordingly, the simulation framework was focused on examining the interactions between these dependent and independent variables. This study’s pedestrian crossing model was divided into four phases (Figure 2). These phases were data collection, data preparation, model building, and model validation. The following subsections provide a description of each phase.
The independent variables were manipulated to observe their effects, including crossing facilities and their spacing, use/attraction spots, street design, and vehicle speed limits [56,57]. The dependent variables are measured to study how they are affected, such as risk tendencies and pedestrian flow [58,59,60].

2.2.1. Data Collection—The First Phase

Data collection constituted the first phase of the study and involved a combination of video recordings, an online survey, and systematic on-site observations. These methods were employed to document the physical and design characteristics of the street and to capture real-time interactions between pedestrians and vehicles at multiple locations. Data collection included three tracks: observation during site visits, an online survey, and video recording.
During on-site observations and field visits, Abbas El-Akkad Street was visited repeatedly at different times of day to capture the street and its surroundings, including variations in pedestrian and traffic behavior, and to ensure the validity of the simulation inputs. Visits were conducted during both morning and evening peak hours, as well as in- and off-peak periods, on weekdays and weekends, to ensure a comprehensive understanding of the street’s activity patterns. The peak and most active pedestrian times were identified through on-site observations and Google Maps (2026 Google: Satellite view, accessed date 1 January 2026) data, occurring from June to September 2025 twice a month during 10:00 a.m.–12:00 p.m. and 5:00 p.m.–7:00 p.m. (summertime in Cairo), as determined from daytime field observations.
The observations focused on recording pedestrian movement, crossing spots and behavior, vehicle flow, and areas of congestion or conflict between road users. Notes were systematically documented during each visit, accompanied by photographs to visually support and verify the recorded observations. These visual and written records provided valuable insights into the dynamic use of the street and served as a key reference for the later stages of data analysis and simulation development.
The second data collection track was the online survey. The survey consisted of two questions distributed via Google Forms to pedestrians to capture perceptions, crossing preferences, and decision-making factors along Abbas El-Akkad Street. The survey ensured the anonymity of the data collected. The questions were:
-
Which locations do you most frequently cross from?
-
How do you usually cross this street?
To determine the required sample size, we applied the Equation (1) [61,62,63]:
n = z 2 × p × 1 p E 2
where n is the minimum sample size, Z is the Z-score (1.28 for an 80% confidence level), p is the estimated proportion of the population (0.5 was used to maximize variability in the absence of prior data), and E is the margin of error (0.05). Based on this calculation, the minimum required sample size was 164 respondents.
A total of n = 164 responses were collected. All responses were complete for Question 1, while 96% of respondents provided complete answers to Question 2.
The analysis was conducted by exporting Google Forms responses into a spreadsheet for systematic processing. The data were coded into categorical variables representing crossing locations and crossing strategies. Descriptive statistical analysis (frequencies and percentages) was used to identify dominant behavioral patterns. These results were further interpreted to derive pedestrian decision-making rules, which were subsequently translated into agent behaviors and parameters within the GAMA simulation platform. (version: GAMA 1.9.3). This process ensured a direct linkage between empirical observations and the behavioral logic embedded in the simulation model.
Another track for collecting data from the site was the video recording to obtain objective, detailed observations of pedestrian and vehicular behavior along Abbas El-Akkad Street. It was also used as a validation validate the simulation results, along with the online survey. This approach enabled the capture of real-time movement patterns, crossing behaviors, and interactions between pedestrians and vehicles, providing a reliable empirical basis for subsequent analysis and simulation modeling. Accordingly, video recording sessions were scheduled to capture both peak and non-peak periods, ensuring variability in observed behaviors.
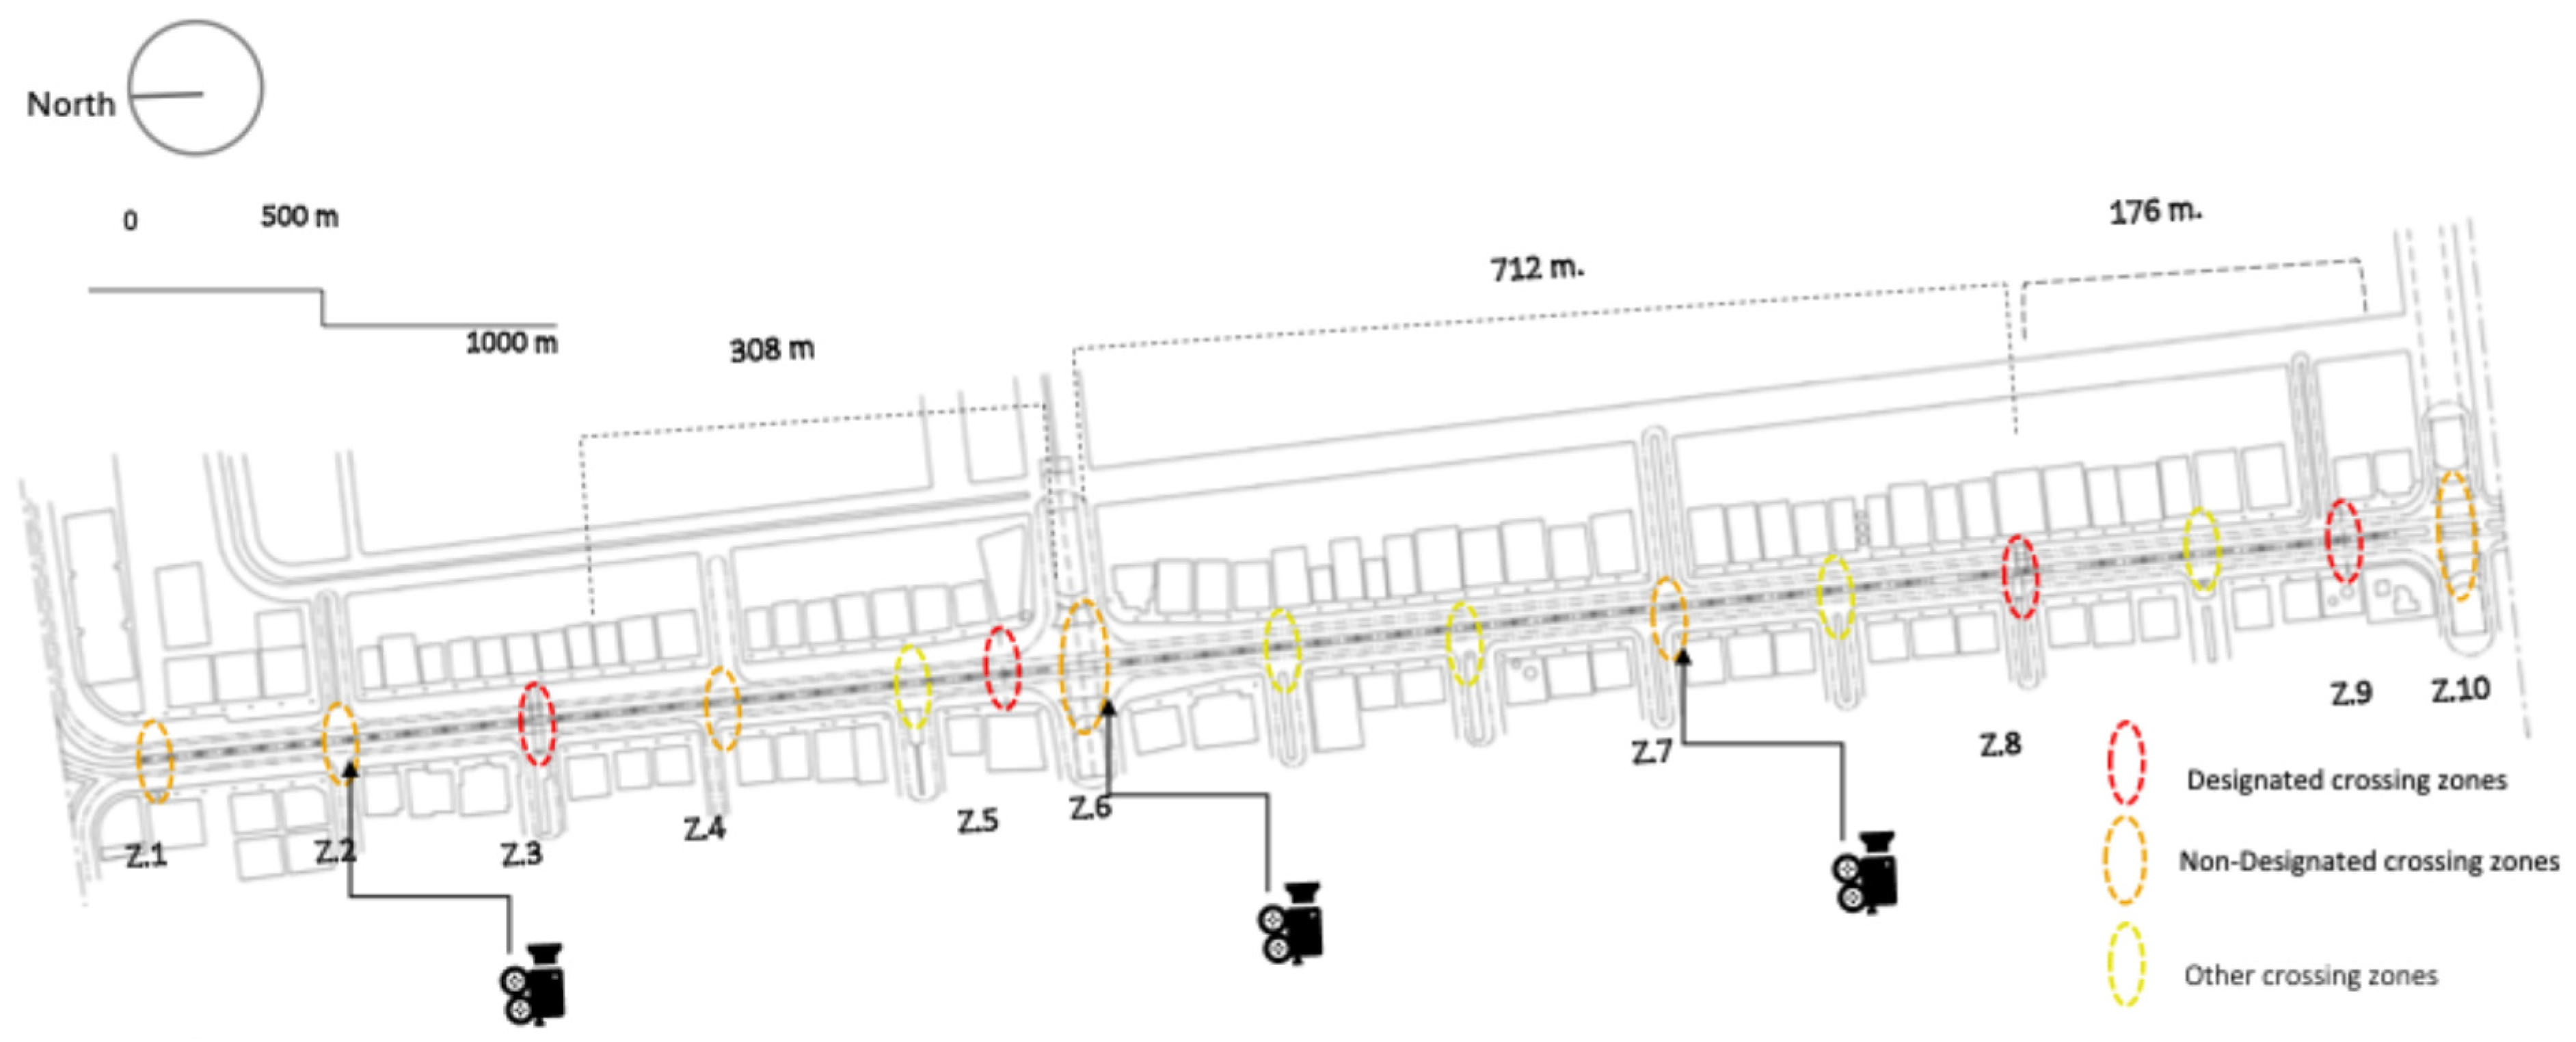
Recordings were conducted at three selected locations along the street, including intersections, mid-block crossings, and high-activity areas identified during preliminary observations. Each session lasted approximately 30 min. Attention was given to identifying pedestrian crossing zones, especially informal and non-designated crossing points, to interpret their spatial distribution and frequency of use. Figure 3 illustrates the locations of crossing roads and camera recording sites.
The recorded footage was systematically reviewed and manually coded to extract quantitative indicators, including pedestrian crossing frequency, waiting times, walking speeds, and the use of formal versus informal crossing locations. In addition, the analysis focused on identifying areas of traffic conflict and congestion, as well as recurring behavioral patterns. These findings were used to inform and calibrate the behavioral rules embedded in the Agent-Based Model (ABM), ensuring consistency between observed and simulated dynamics.
Several practical and ethical limitations were encountered during the recording process. The availability of elevated public viewpoints suitable for comprehensive street observation was limited; therefore, recordings were conducted from first-floor windows of nearby cafés, which constrained the field of view. Furthermore, to address privacy considerations, care was taken to avoid capturing identifiable facial features of pedestrians, which influenced camera positioning and angles.

2.2.2. Data Preparation—The Second Phase

The second phase involved data preparation, GIS (version QGIS 3.40.6) processing, and spatial data analysis. In this phase, the study translated the data gathered and constructed a comprehensive spatial database focused on a selected urban street. This database, after defining the main parameters, behaviors, and relations, includes variables such as traffic volume, pedestrian counts, types and locations of existing crossings (both designated and non-designated), and environmental and infrastructural characteristics (e.g., road width, speed limits, visibility, and nearby land uses). The selection of the specific street and the included variables was justified to ensure they captured factors influencing pedestrian behavior in areas without designated crossing facilities.
Based on these observations, a detailed street layout was drawn using AutoCAD (version 2021). This drawing process was supported by satellite imagery from Google Maps and Google Earth, which facilitated accurate representation of the built environment (road alignments, sidewalks, medians, buildings, crossing zones, and crossing facilities). The resulting layout was exported and processed in GIS software (version: QGIS 3.40.6), where attribute data was added, and the layers were structured as shapefiles to ensure compatibility with the simulation platform.

2.2.3. Building the Model with Calibration—The Third Phase

The third phase was dedicated to developing and implementing the Agent-Based Model (ABM). ABM emerged as a powerful tool for this study’s purpose. It is a computational modeling approach in which individual entities—referred to as agents—operate according to a set of rules, interact with each other and their environment, and evolve [64,65,66,67]. In urban contexts, agents can represent pedestrians, vehicles, or infrastructure components. The main strength of ABM lies in its bottom-up structure, enabling researchers to observe how localized behaviors and interactions produce emergent patterns at the macro level [11,68,69]. This makes ABM particularly suitable for analyzing informal pedestrian crossings, where signals or crosswalks do not strictly regulate individual choices [70].
Although several studies have applied ABM to model pedestrian dynamics, they often focus on crowd behavior, evacuation scenarios, or movement in controlled environments [71,72,73]. However, modeling pedestrian behavior at non-designated urban crossings remains underexplored, especially in cities with complex traffic ecosystems like Cairo. The process of identifying a suitable simulation platform for modeling urban mobility was both extensive and iterative. A wide range of tools was explored, each offering unique strengths and limitations. The literature reveals a variety of simulation tools developed for urban mobility analysis, such as Space Syntax (Depth Map: version 0.8.0 released 8 November 2020), Net Logo (version 7.0.3 released 10 December 2025), Simulation of Urban Mobility (SUMO) (version 1.26.0 released 29 January 2026), and Multi-Agent Transport Simulation (MAT Sim) (version 2024.0). A comparison table was developed in Appendix B, which offers ABM capabilities but lacks robust GIS integration or flexibility in spatially complex urban settings [74,75,76].
After an extensive review, the GIS Agent-based Modeling Architecture (GAMA) platform was identified as the most appropriate tool for this study. GAMA enables the integration of real-world GIS data (e.g., shapefiles for roads, sidewalks, and buildings) and supports heterogeneous agents with distinct behavioral rules using the GAML language to write scripts [77]. This combination allows for a realistic simulation of pedestrian decisions—such as choosing informal crossings—while interacting with traffic signals and vehicle agents in a shared environment [78]. The platform’s capacity to import shapefiles and simulate spatially explicit agent interactions made it a highly suitable choice for modeling realistic street-crossing behaviors and evaluating urban design interventions [74,77].
The model follows a rule-based (reflex-driven) approach, a commonly used approach in agent-based modeling to represent reactive behavior [79,80]. However, agent behavior can be conceptualized within a Belief–Desire–Intention (BDI) framework, in which agents perceive their environment, pursue target-based intentions, and adapt their movement accordingly [80,81].
The development of the ABM followed an empirical, iterative process that combined field observations, digital modeling, and behavioral calibration [82]. The scenario simulated pedestrian and vehicular dynamics under real-world conditions along Abbas El-Akkad Street. The process was organized into four iterative steps:
  • Initial field framing and model preparation: the prepared street layout, including roads, sidewalks, elevated crosswalks/speed bumps, islands, and informal crossing zones, was manually drawn as shapefiles in GIS and exported to GAMA. A scale-correction step was later introduced to better match real-world dimensions, with a 0.05% downscaling.
  • Building the simulation environment in GAMA: The physical environment was built using the GAMA platform, chosen for its integration of GIS data and agent-based behavior scripting. Shapefiles were imported to define the physical environment, and species were created for:
    -
    Buildings, sidewalks, islands, speed bumps, car paths, greenery, pedestrian areas, crossing zones, and traffic signals.
    -
    Dynamic agents: people and cars (car drivers) as shown in Table 1.
    Table 1. Model agents and assigned skill/behaviors implemented. Source: The authors.
    Table 1. Model agents and assigned skill/behaviors implemented. Source: The authors.
    Agent TypeSkill\Behaviors Implemented
    PeopleRandom waypoint walking, network-based movement, speed variation, street crossing using facilities in crossing zones, and locations of non-designated crossing zones, avoiding obstacles such as flower boxes
    CarsRoute following, response to signals, speed bump slowing, lane spacing, and avoiding pedestrian
    SignalLight toggles between red and green based on cycle timer
    GreeneryWorks as obstacles to be avoided by pedestrian
    Speed bumpWorks as a designated crossing facility for pedestrians and as a tool to slow vehicle traffic
    All agentsGIS-based spatial logic, movement inside designated areas (sidewalks, islands,)
  • Defining pedestrian agent behavior: To build pedestrian and vehicular networks, a pedestrian network and a car network was generated using GAMA’s as_edge_graph () function, connecting sidewalk nodes, medians, and speed bumps, and then using pedestrian paths to move. Pedestrians were assigned basic mobility skills with randomized speeds from 0.2 to 1.0 m/s, based on the literature review. Their movement was governed by a reflex that allowed them to navigate to randomly selected points on the pedestrian network. The model settings in pedestrian agents should be capable of (walking within sidewalks, medians, and bump zones, responding to spatial constraints, and redirecting to new destinations upon reaching current targets, crossing along the street on both sides). As such, the physical settings were conducted, such as:
    -
    Ensuring movement inside sidewalks, not along the edges. This was resolved by generating 300 intermediate nodes (nodes_in_sidewalk) within sidewalk geometries and including them in the network, along with creating a pedestrian path to avoid obstacles, such as greenery boxes.
    -
    Achieving visible pedestrian flow. Speeds were reduced and animation intervals adjusted to improve traceability.
  • Modeling vehicle agents and traffic signal interactions: The number of pedestrians was randomly sampled from 500 to 3000, varying over time and increasing during peak hours. Pedestrians were distributed along the street, on the sidewalks around the buildings, and crossing from different zones to the other sidewalk. Vehicles were implemented with behaviors that accounted for:
    -
    Speed variation in response to road infrastructure (20–60 km/h) based on the traffic agency, following Egyptian guidelines, particularly slowing near speed bumps and intersections [83].
    -
    Dynamic response to traffic signals, halting when red and resuming when green.

Each car was given a base speed and a target, and it moved along the car path network using a ‘move’ reflex. An adaptive speed reflex was introduced to improve realism. Cars were distributed across four logical lanes, each with a slight spatial offset. However, this involved challenges in maintaining lane alignment, car spacing, and avoiding congestion near traffic signals. While a solution for exact turning and orientation (azimuth-based rotation) was explored, full rotation with respect to path curvature remained limited due to GAMA’s facet constraints.
To ensure the simulation realistically reflects pedestrian behavior along Abbas El-Akkad Street, the decision-making process for crossing was presented in the simulation code. Crossing zones were digitized from GIS and classified into three categories: designated (with or without signals), non-designated, and others. Each pedestrian agent in the model identifies the type of crossing zone they are in and applies the associated probability to decide whether to cross. This spatial-probabilistic approach was further adjusted to reflect contextual factors observed in the study area, such as street vendors, points of interest, and traffic calming measures, which were found to influence pedestrian crossing choices [84].
Through iterative testing and feedback, the model was refined both visually and analytically to improve its accuracy and alignment with observed pedestrian and vehicle behaviors. Several issues related to vehicle movement were identified during the process. Cars initially exhibited incorrect orientation and occasionally overlapped with sidewalks and buildings, requiring refinement of the spatial layout by adjusting lane offsets and using the at: function to correctly position vehicles within designated lanes. In addition, unrealistic vehicle acceleration was addressed by modifying speed parameters and step refresh rates.
The simulation was further calibrated using observed traffic conditions derived from field observations and video recordings. These empirical inputs informed the development of traffic rules within the model, including the street’s speed limit of 60 km/h, vehicle deceleration at speed bumps and signalized intersections, and pedestrian interaction behaviors within defined proximity ranges.
Cars avoid pedestrians by slowing down when they are within two meters to prevent hitting people crossing the street. The 2 m threshold was defined as a proximity-based behavioral trigger for vehicle deceleration, consistent with studies indicating that driver–pedestrian interactions are governed by distance-dependent responses [85,86]. This value represents a simplified assumption within the model. This threshold was chosen as a simplified behavioral rule to ensure simulation consistency, acknowledging that in real-world conditions, this distance may vary with vehicle speed and driver response. Vehicle speed was not explicitly incorporated into this threshold; instead, the 2 m distance reflects an assumption of low to moderate urban driving speeds, under which such proximity typically prompts driver deceleration.
Pedestrian-related issues were also identified during the simulation process. Some pedestrians remained static due to pathfinding errors and incomplete network integration, which were resolved through debugging and improved network connectivity. In addition, pedestrian movement behavior was refined, as agents were initially distributed unrealistically or exhibited unexpected stopping patterns. This required defining a dedicated pedestrian path network (derived from shapefiles) and adjusting the behavior to ensure that agents followed realistic waypoints—object overlap or walking outside the network refined via spatial node generation and agent path constraints, obstacle avoidance; here, visual inspection revealed that agents intersected with green areas, which were intended to be obstacles (e.g., planted zones or inaccessible medians). Conditional logic was introduced to ensure that both pedestrians and cars detected and avoided these zones by recalculating their targets if they were within a defined proximity to these obstacles.
Model issues were encountered during the simulation process, including non-functional zoom and display inconsistencies, which were resolved by verifying coordinate extents and replacing faulty shapefiles. Another key analytical challenge was the asynchrony between pedestrian and vehicle movements. This issue became evident through discrepancies in movement rates observed during the initial simulation steps. In response, a unified execution strategy was implemented in which both pedestrian and vehicle behaviors operate concurrently without strict priority ordering, thereby ensuring synchronized agent activation and more realistic interaction dynamics.

2.2.4. Model Validation–Fourth Phase

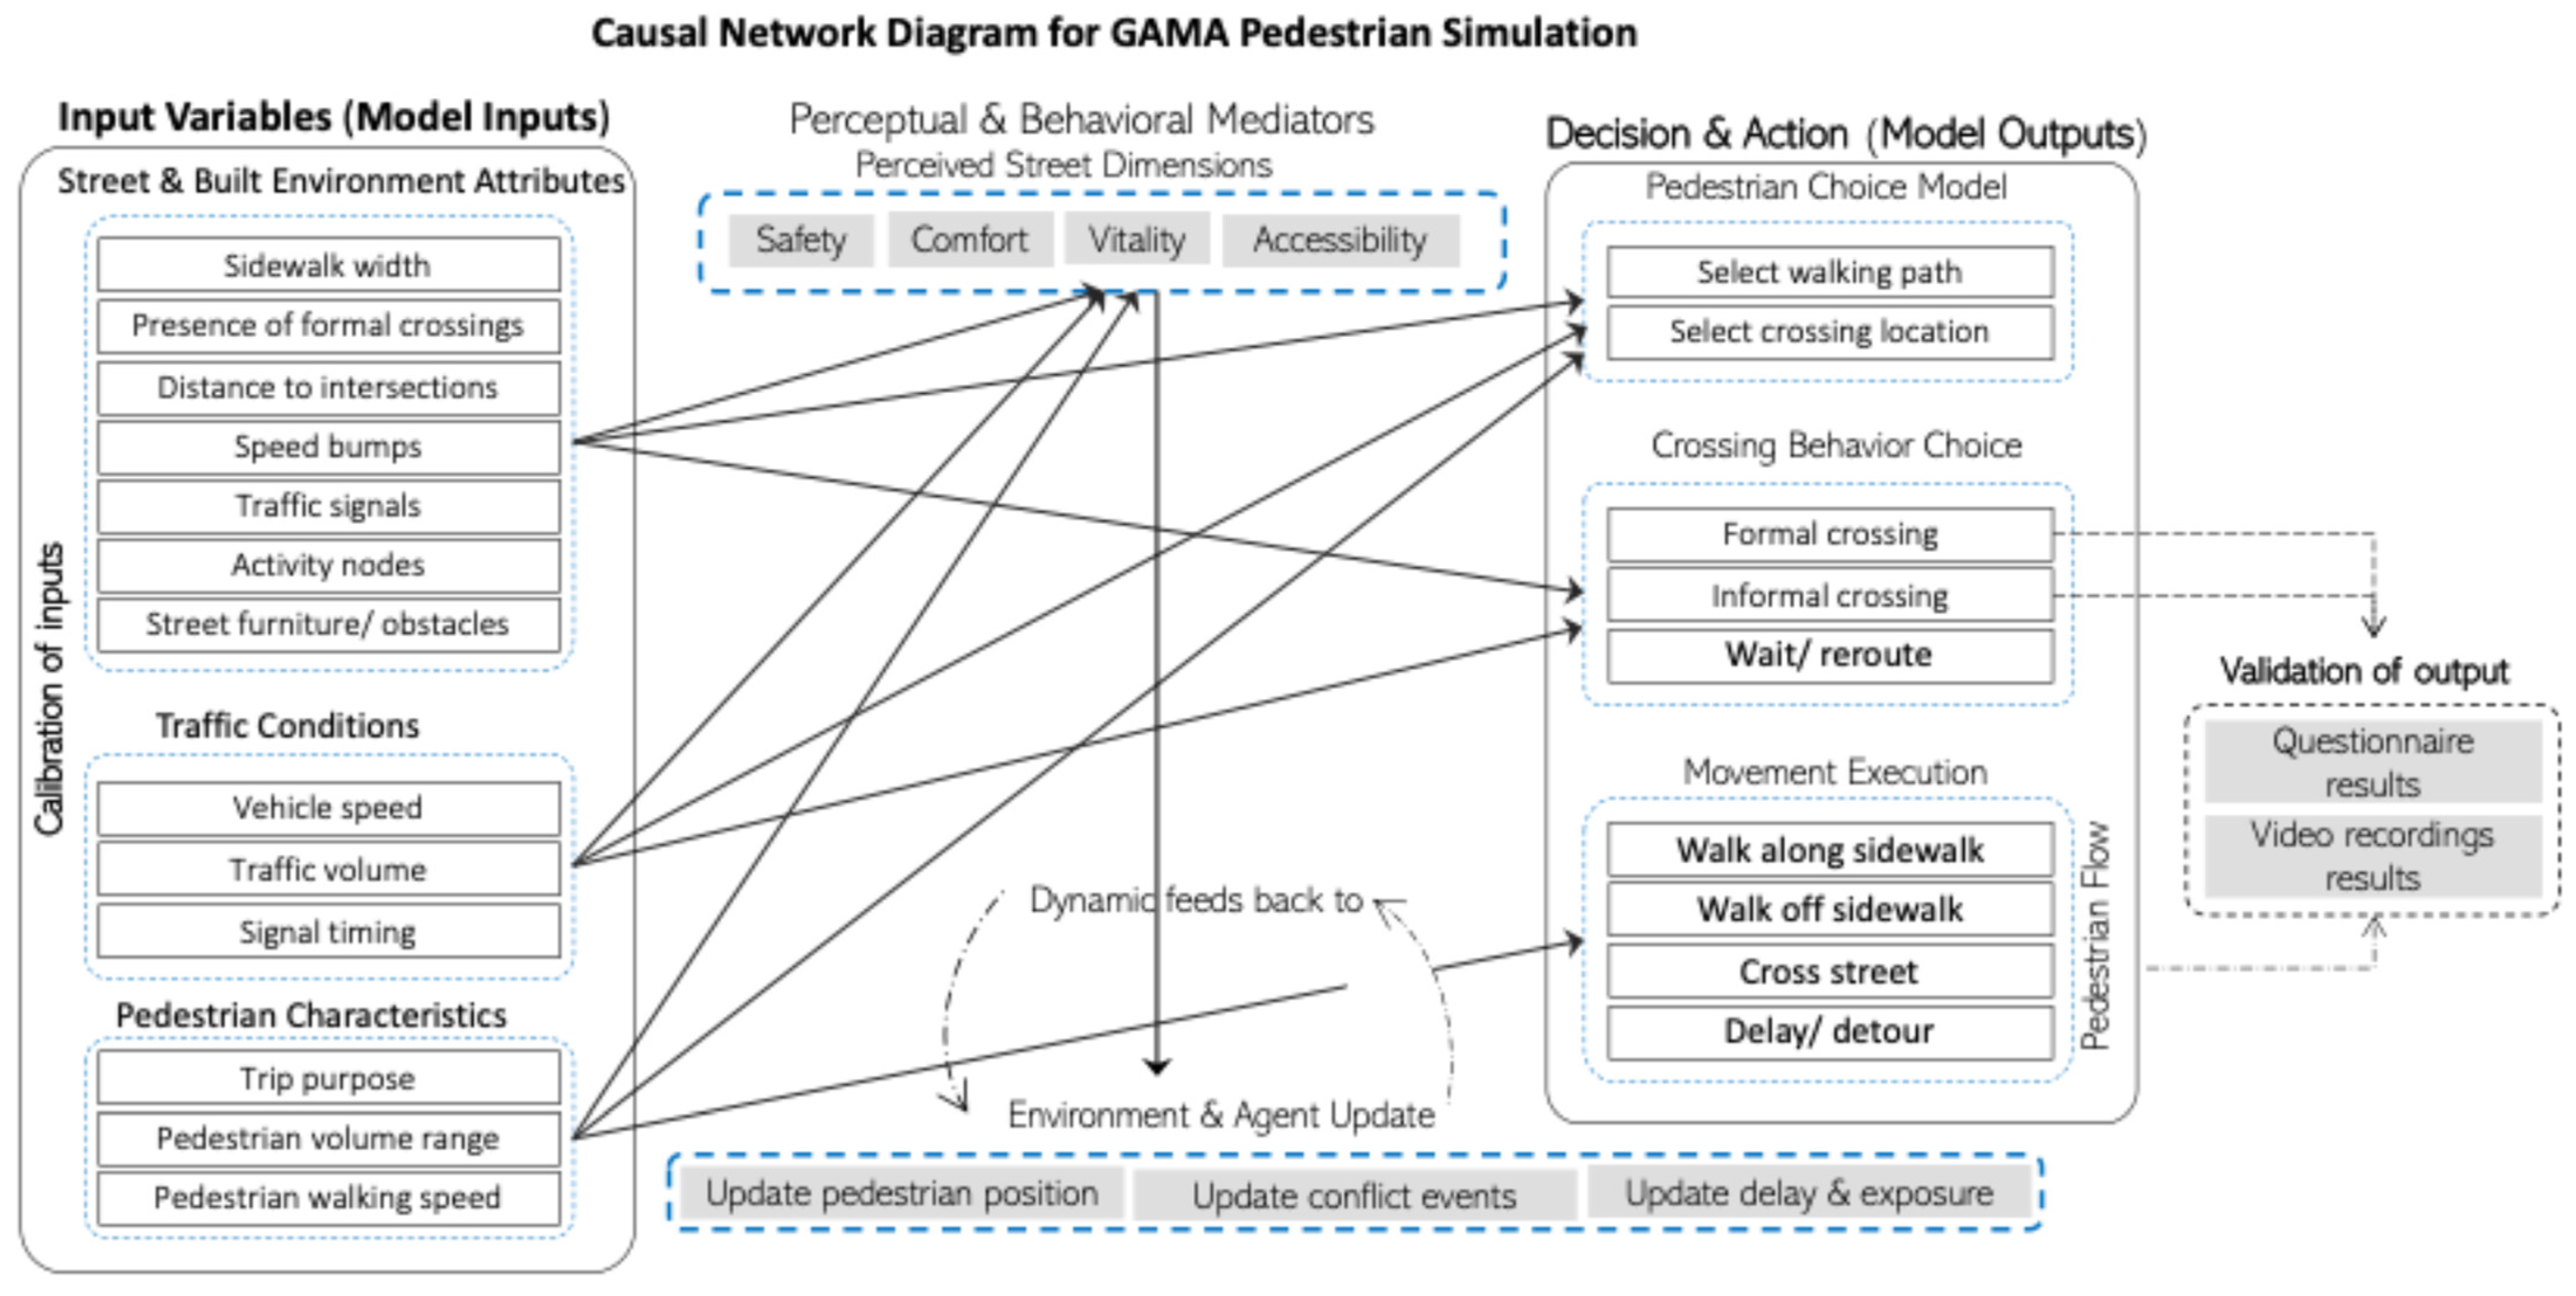
In the fourth phase—validation—key parameters influencing pedestrian crossings were prioritized, including pedestrian flow rate and vehicle traffic flow [74,87]. Multiple data sources were used for validation, such as video recordings, survey data, and site observations. Video analysis software installed on-site calculated pedestrian counts, flow, and density, allowing an analytical comparison between real-world and simulation outputs [21]. Figure 4 illustrates the entire workflow of this ABM simulation.
The validation process in this study primarily relied on macro-level indicators, including overall pedestrian flow and the proportions of different crossing types. These indicators were selected to verify that the simulation reproduces the general dynamics observed in the study area. Within the agent-based model, pedestrian behavior is represented through decision-making rules governing individual agents, such as the choice between designated and non-designated crossings and interactions with vehicular traffic. Consequently, the aggregate indicators used for validation are interpreted as emergent outcomes of these behavioral processes rather than independent statistical measures.
This cross-validation ensured that the model not only replicated aggregate flow numbers but also captured the spatial and behavioral dynamics of both pedestrians and vehicles in the study area. As a result, it provided a more reliable basis for analyzing human-centered street design interventions and understanding pedestrian safety dynamics in urban environments.

3. Results

This section presents results from simulations of pedestrian crossing behavior along Abbas El-Akkad Street, integrating designated and non-designated crossing zones. The data outputs were combined from the agent-based model in GAMA with field survey data and spatial observations to examine pedestrian flows, crossing distribution, and their relationships with the surrounding urban environment and other influencing factors.
By comparing simulated movement flows with survey-based crossing preferences, the results highlight the extent to which actual pedestrian behavior aligns with or deviates from planned infrastructure. Furthermore, spatial correlations between pedestrian flow intensity and the concentration of adjacent services are examined to assess potential influences on crossing decisions. For validation using pedestrian flow parameters, the video analysis software was used to count pedestrians crossing on both sides of the street. The resulting values were compared to the outputs from the simulation model in the same street section.

3.1. Results from Observations and Field Visits

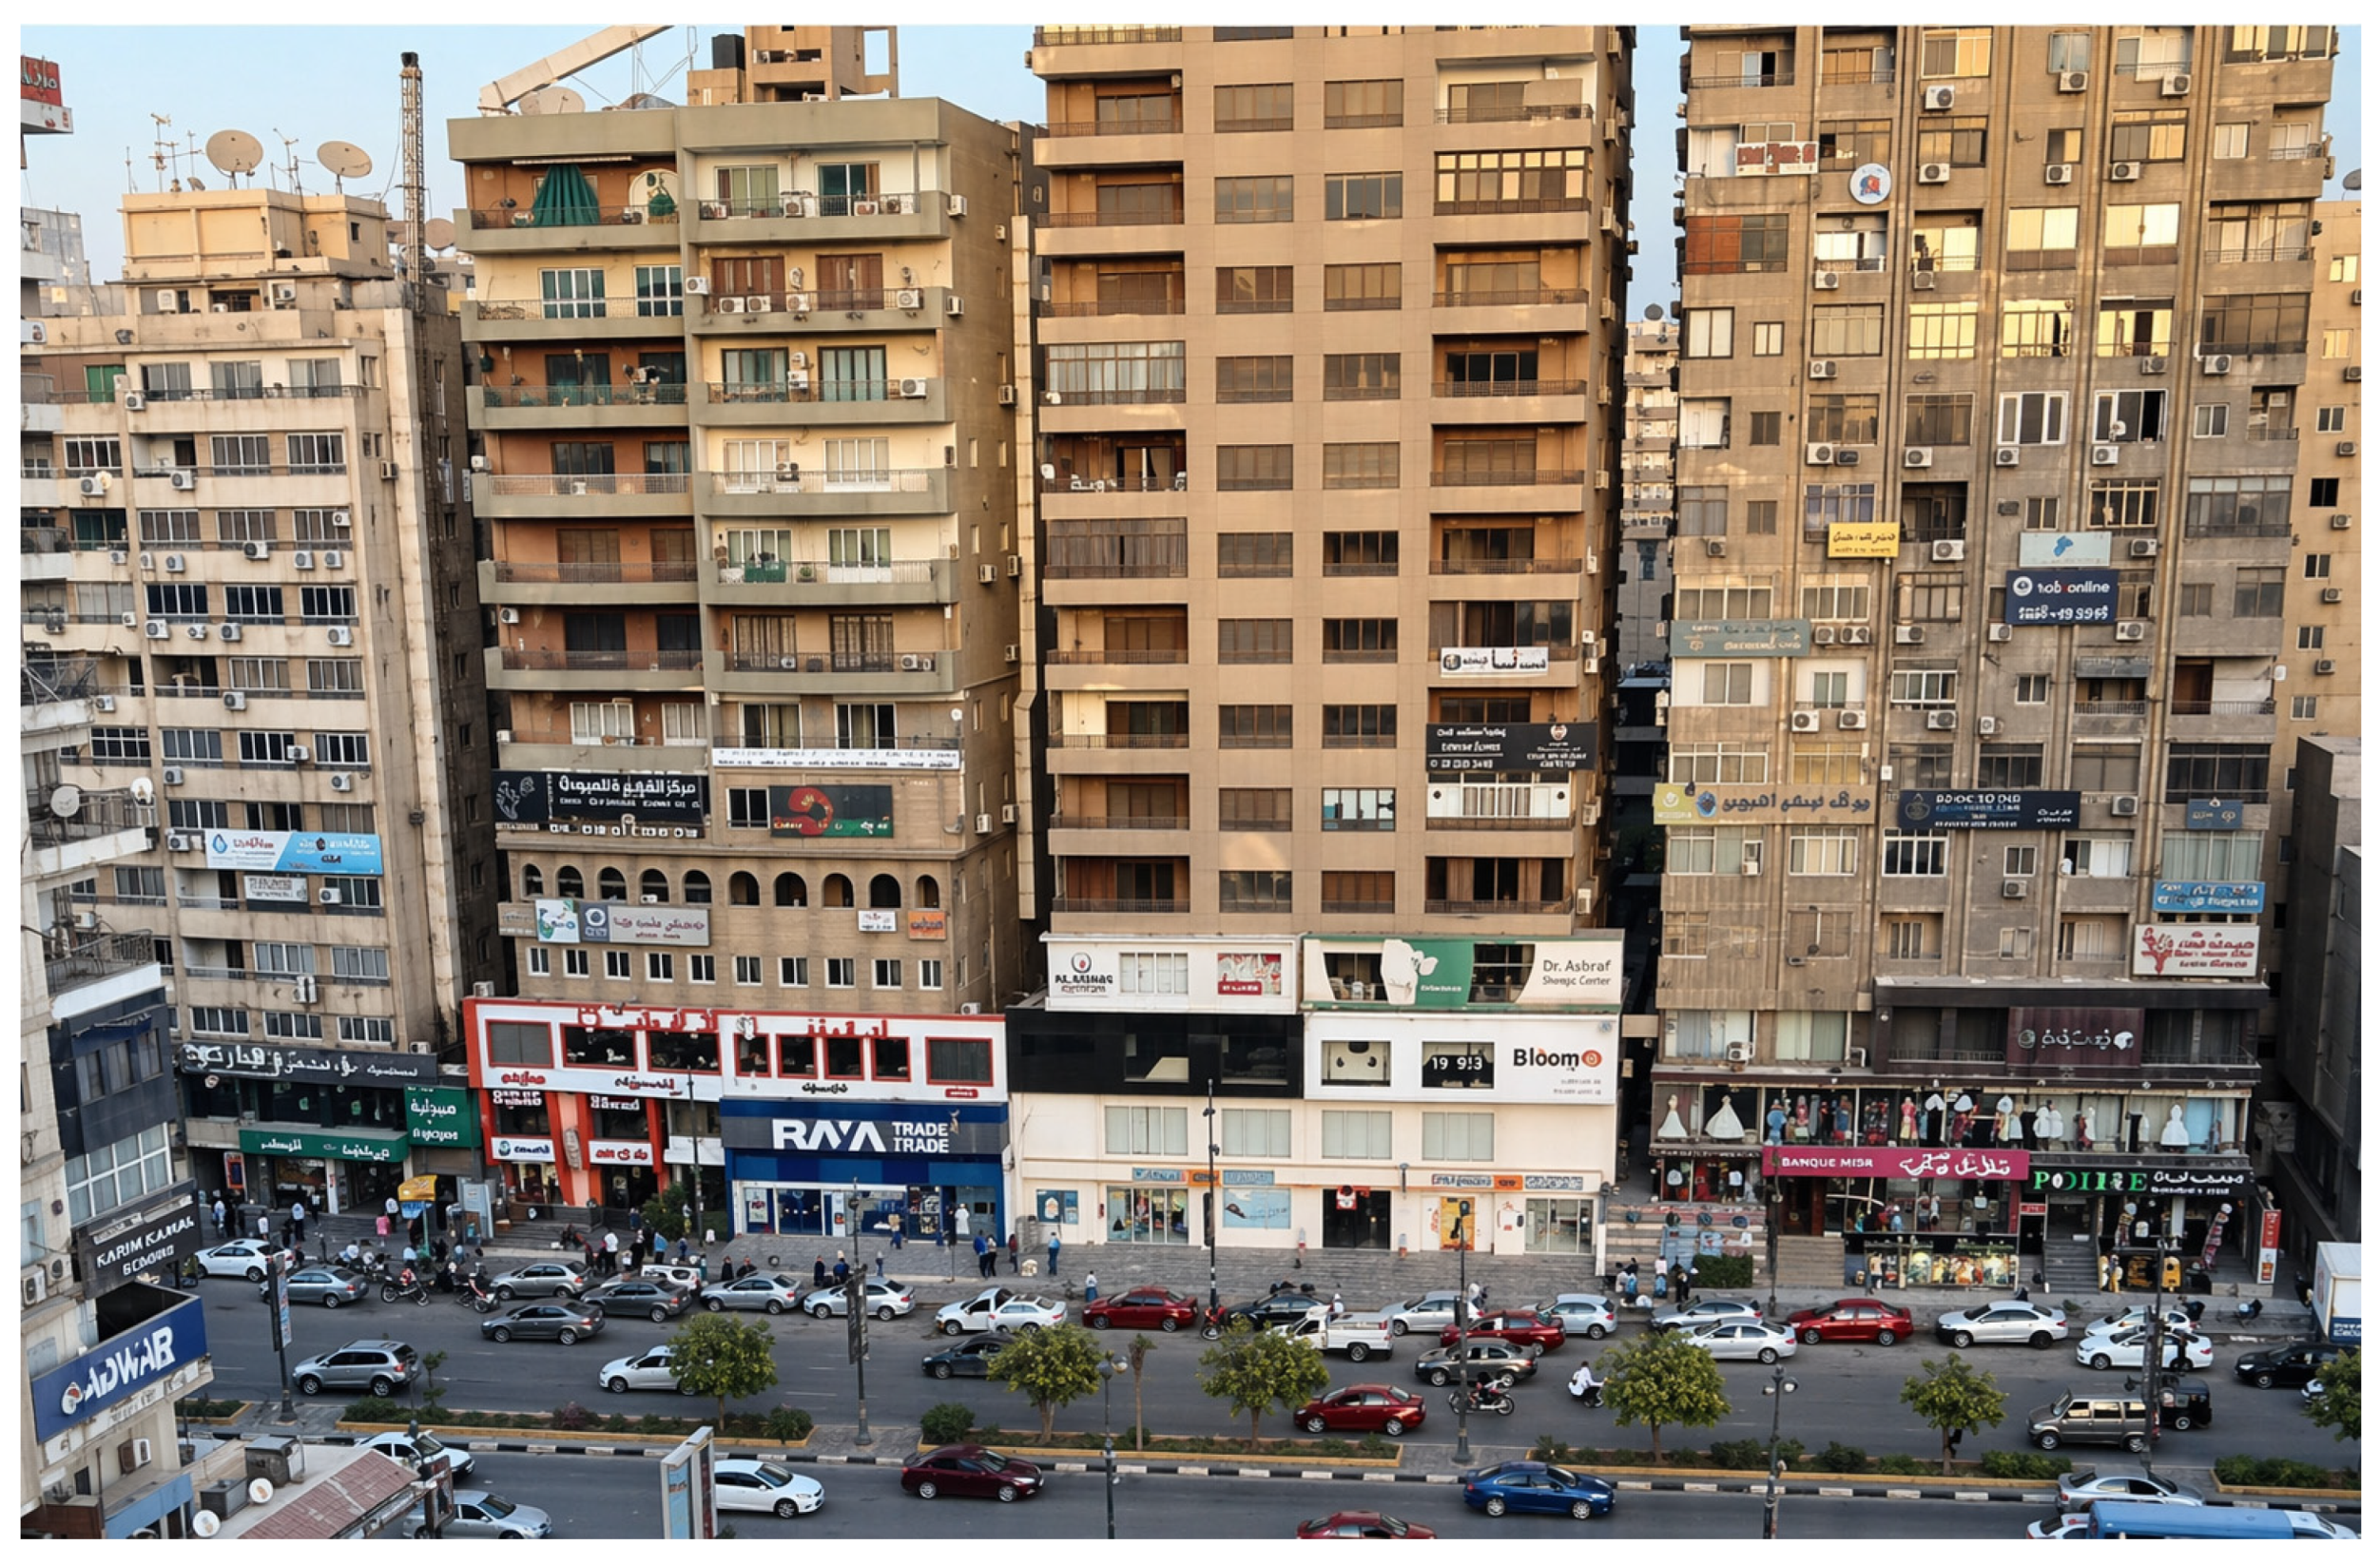
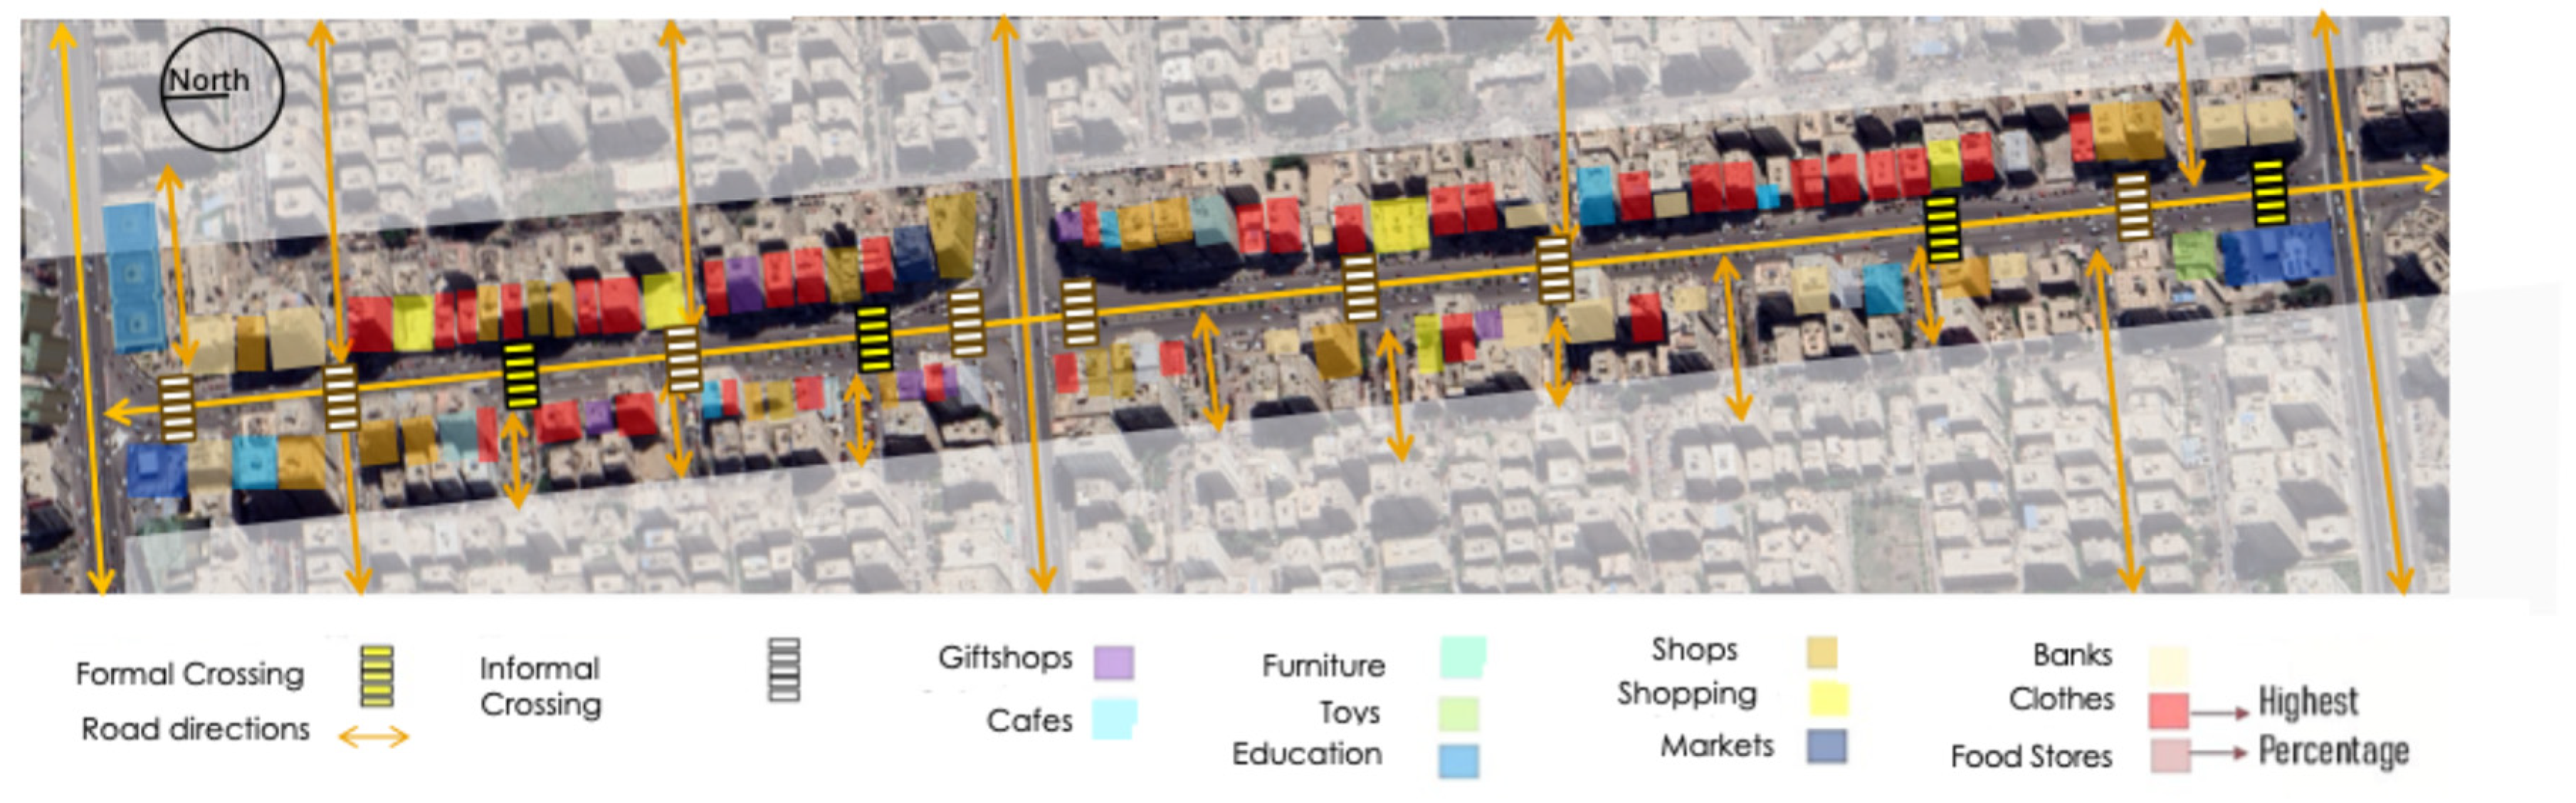
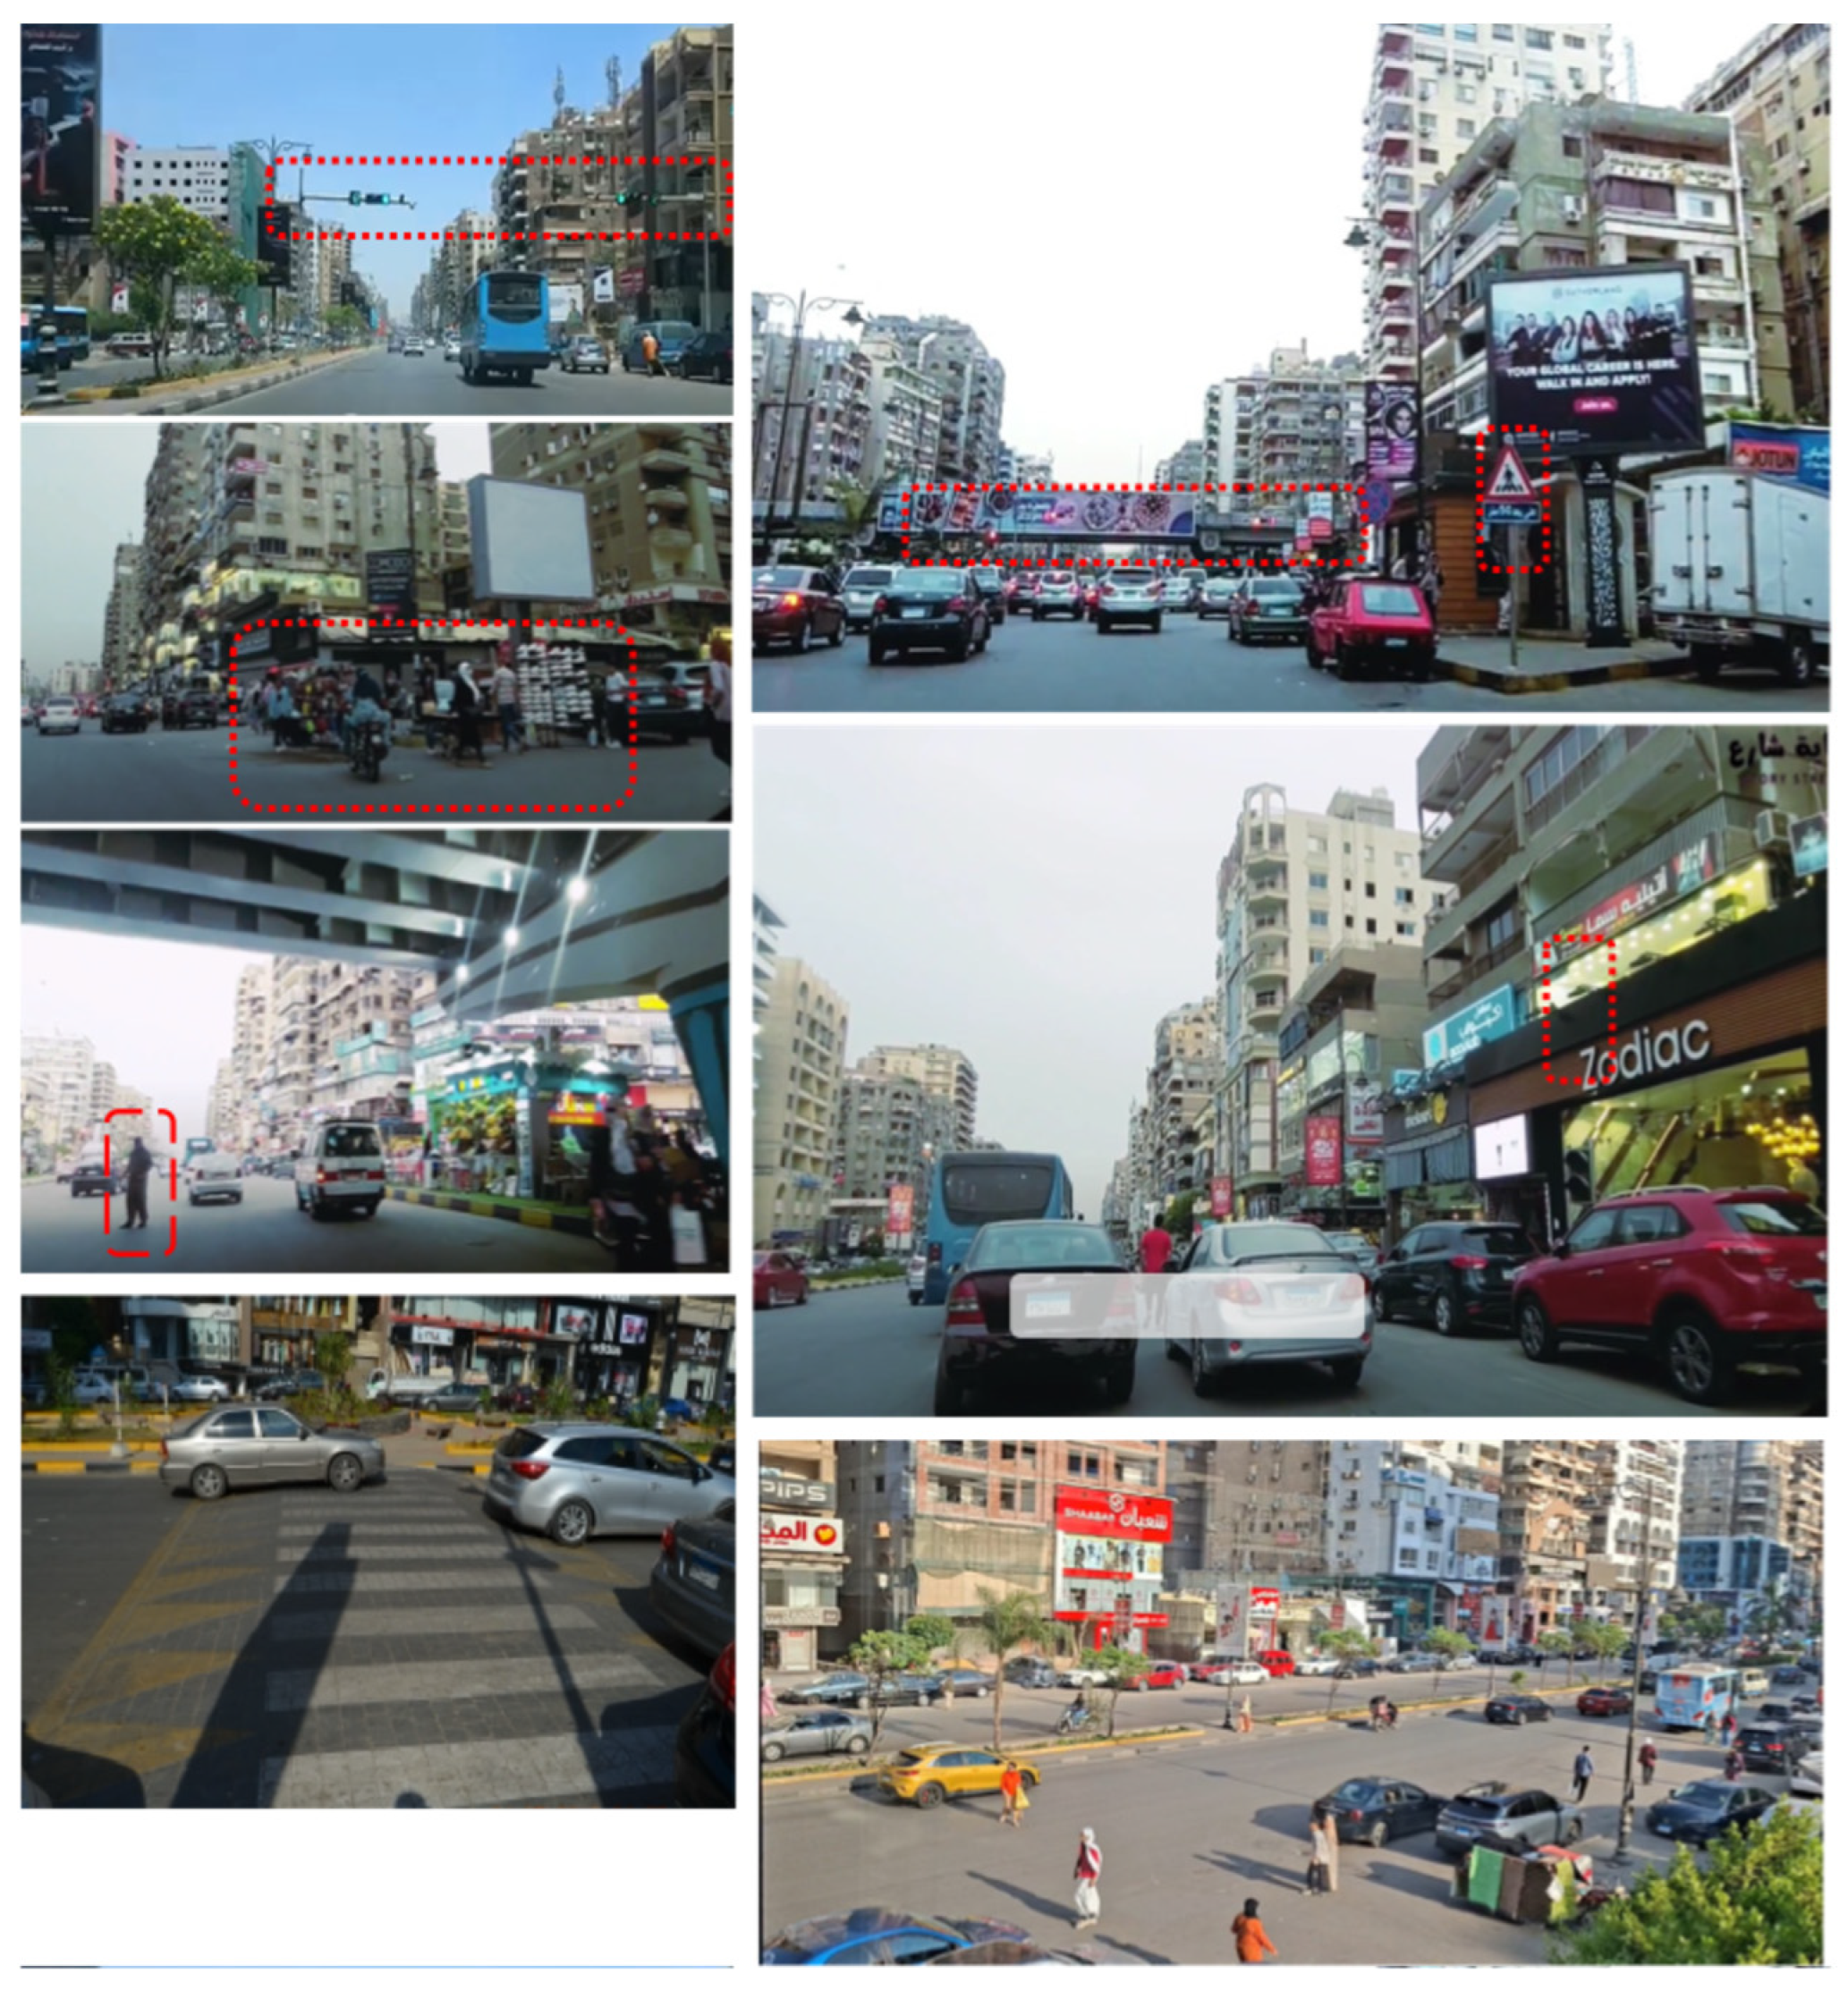
Field observations and site visits reveal that ground-floor uses are predominantly commercial, including retail shops, cafés, restaurants, banks, pharmacies, and small service providers. These activities attract a high volume of pedestrians and contribute to the street’s role as a social and economic hub for both residents and visitors. The upper floors are mainly residential and administrative, with some retail, which further increases daily pedestrian movement, especially during peak hours for work, shopping, and leisure activities (Figure 5).
The observed land-use diversity and activity patterns highlight Abbas El-Akkad Street as a highly active urban environment (Figure 6). Accordingly, this was reflected in the simulation stage by identifying and integrating pedestrian gathering nodes and attraction points within the study area. The physical condition of the street revealed pedestrian signage indicating formally designated crossings at speed bumps, as well as signalized traffic lights installed in the street, which contribute to traffic calming near major intersections.
Additionally, a significant number of street vendors were observed, predominantly occupying the street during the afternoon and evening hours, as shown in Figure 7. It was also revealed that most shops on the street typically open between 11:00 a.m. and 12:00 p.m. Although the official government closing time is 10:00 p.m., many shops remain open until 11:00 p.m. or even midnight when there are no police patrols.

3.2. Survey Results

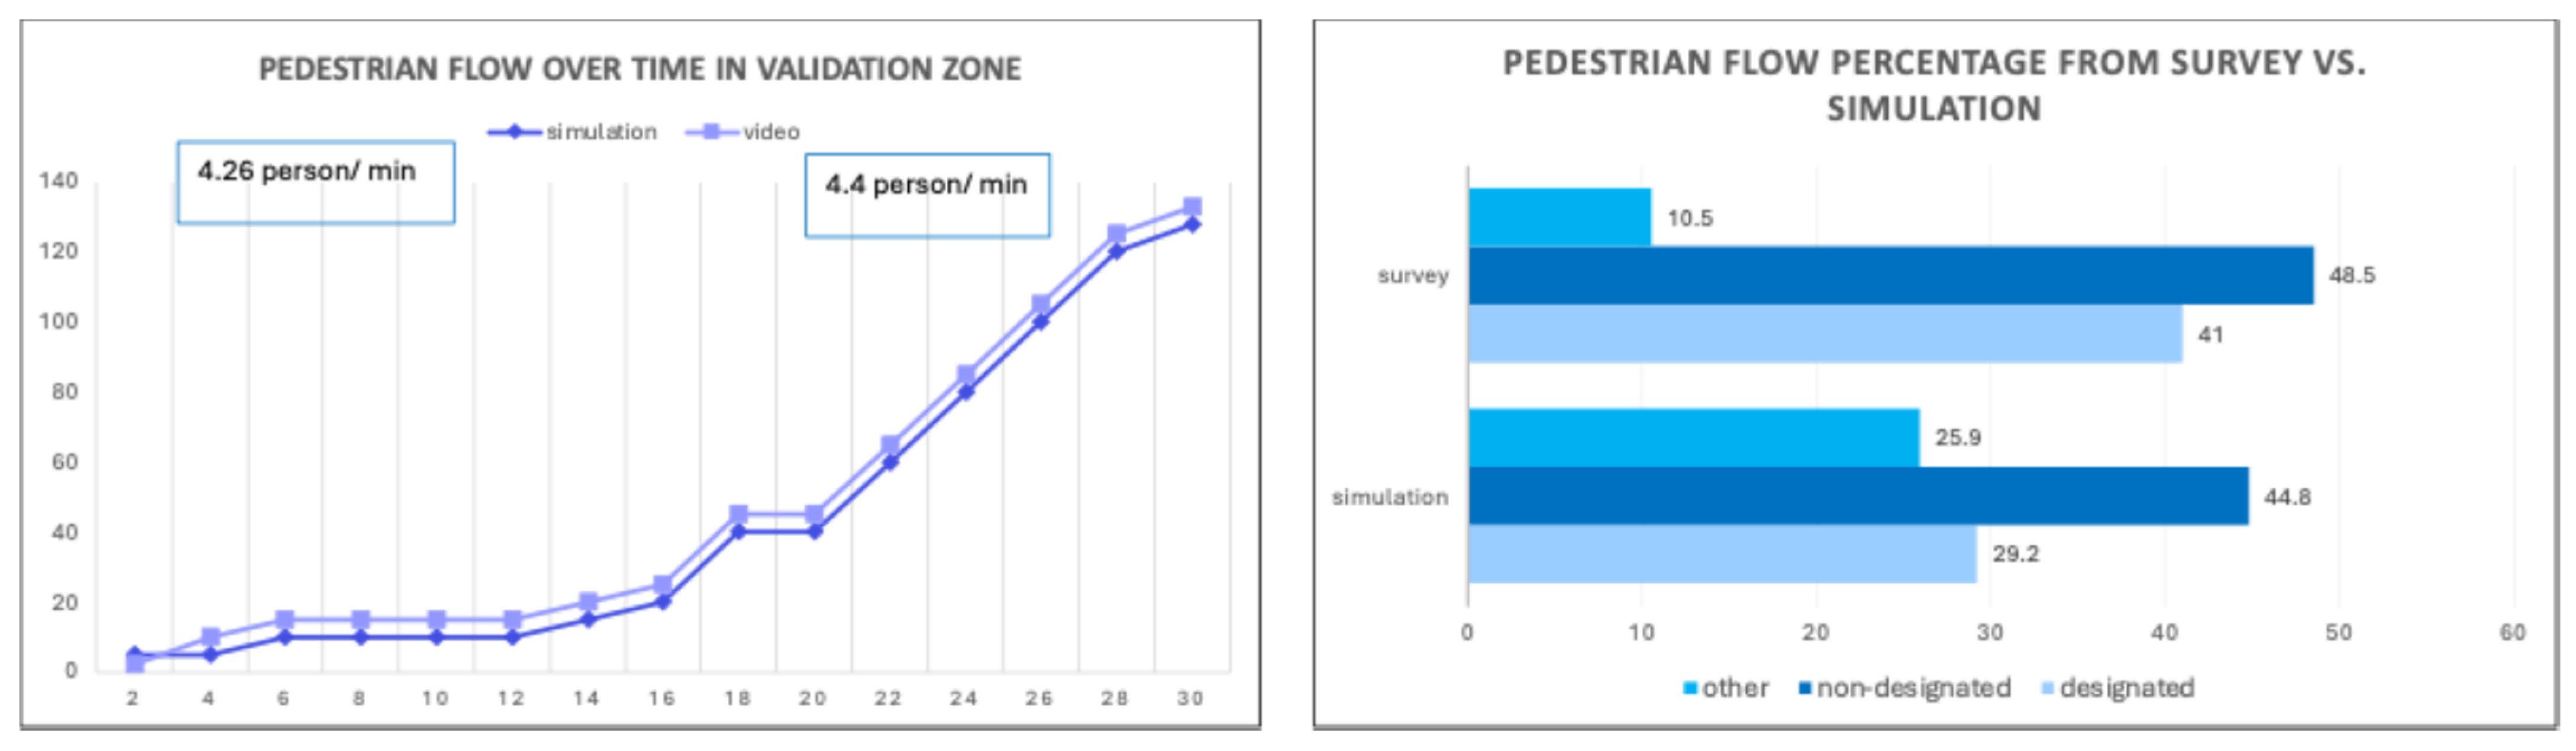
The survey data served as reference parameters for calibrating pedestrian crossing weights within each zone category in the simulation model, as monitored during simulation. Specifically, the survey indicated that 27.6% of pedestrians use designated crossings with signals, 13.4% use designated crossings without signals, with a total number 41% to 29.2% in the simulation, 48.5% cross at non-designated locations to 44.8% in the same zones in the simulation, and 10.5% utilize other crossing types to 25.9% in the simulation. These percentages informed the model’s weighting and behavioral rules for pedestrian agents.
This multi-step validation ensured that the model not only replicated aggregate flow numbers but also captured the spatial and behavioral dynamics of both pedestrians and vehicles in the study area. As a result, it provided a more reliable basis for analyzing human-centered street design interventions and understanding the dynamics of pedestrian safety in urban environments.
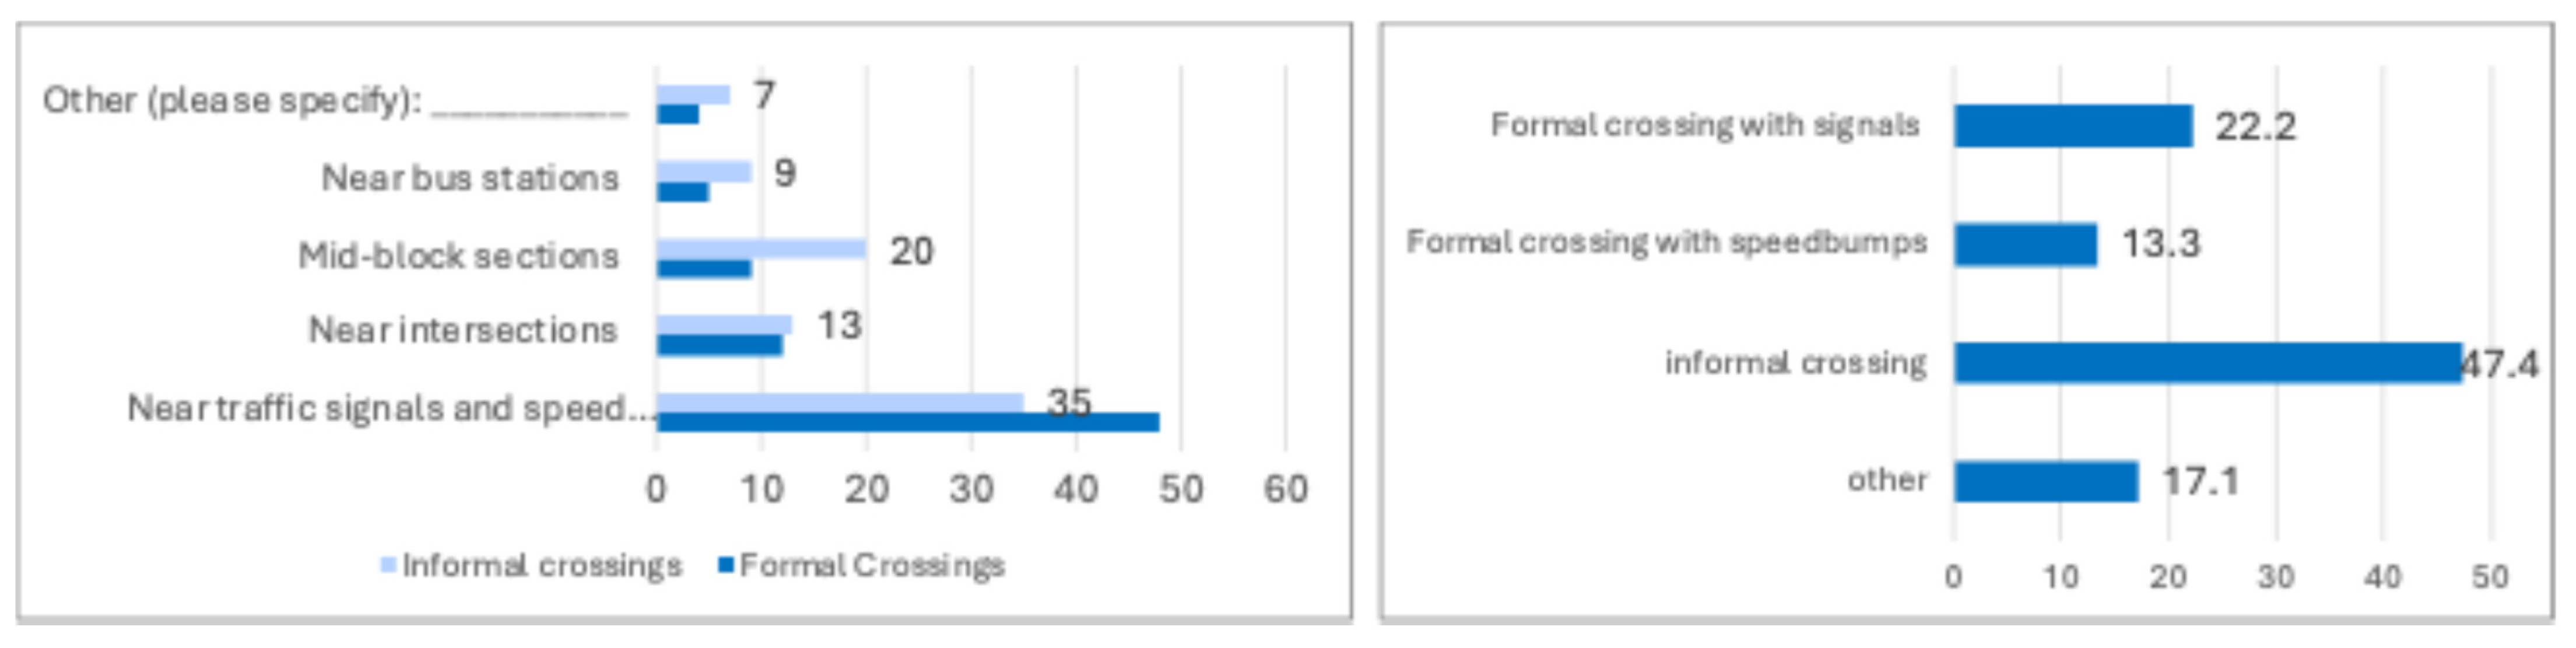
Figure 8 presents the survey results regarding pedestrian crossing preferences and behaviors. The left chart illustrates respondents’ preferred crossing locations, indicating a higher tendency toward informal crossings, particularly near traffic signals and mid-block sections. The right chart shows the types of crossing facilities used, with informal crossings more frequently reported than formally designated crossings. These findings highlight a mismatch between available crossing infrastructure and pedestrian behavior, underscoring the need for further analysis and simulation of pedestrian movement patterns.

3.3. Video Recordings Results

One of the most prominent behaviors observed from the video recordings is informal crossing outside designated crosswalks. Pedestrians often choose the shortest or most convenient crossing path, even when nearby formal crossings are available. This behavior affected the ABM simulation rules for pedestrian crossings. Video recordings show that pedestrians tend to cross at locations with visual gaps in traffic flow rather than at officially marked crossings, indicating a mismatch between provided infrastructure and actual user needs. In uncongested sidewalk sections, pedestrians generally maintain steady walking speeds and follow linear paths. In contrast, in areas with high activity density or sidewalk encroachments, pedestrians exhibit frequent lateral movements, sudden stops, and route deviations.
The result from the videos was approximately 4.4 people per minute, while the initial simulation result was around 1.28 people per minute. After adjusting the initial number of people in the simulation from 300 to 3500, we obtained the closest result to the video’s, which was 4.26 people per minute, providing a level of confidence of approximately 96.7%. Figure 9 presents both the spatial layout of the video recording locations and calibration sections and the validation results of pedestrian flow over time. The street map shows where pedestrian data were collected to calibrate the simulation model, while the charts on the right compare observed pedestrian flow with the simulated output. The alignment between observed and simulated flows confirms the model’s internal consistency. This combined visual representation provides a clear understanding of how validation was conducted and supports the reliability of the pedestrian crossing simulation.

3.4. Results from the Model

As for pedestrian crossing zones, the street crossing zones were classified into three types, the designated zones, whether they were with signalized control or an elevated crosswalk (speed bump), the non-designated zones where pedestrians cross to the other side of the street-to-street intersections with no crossing facilities, and the different zones where people use to cross without crossing facilities and no intersections. The current distances between designated crossing facilities along the street range from 176 to 712 m, exceeding the recommended standard of 80 to 120 m. As a result, many street users are compelled to cross at undesignated locations without proper crossing facilities.
Upon closer examination, there were areas with a high density of pedestrian crossings in the designated zones (Figure 10 and Figure 11). In pedestrian crossing flow, simulation results show that pedestrian counts crossing in non-designated zones and in other zones without crossing facilities were the highest, indicating a high risk to pedestrian crossing safety. In the simulation results, the counts of the designated zone are 29.2%, the non-designated zone is 44.8%, and the other zone is 25.9% in 30 min.
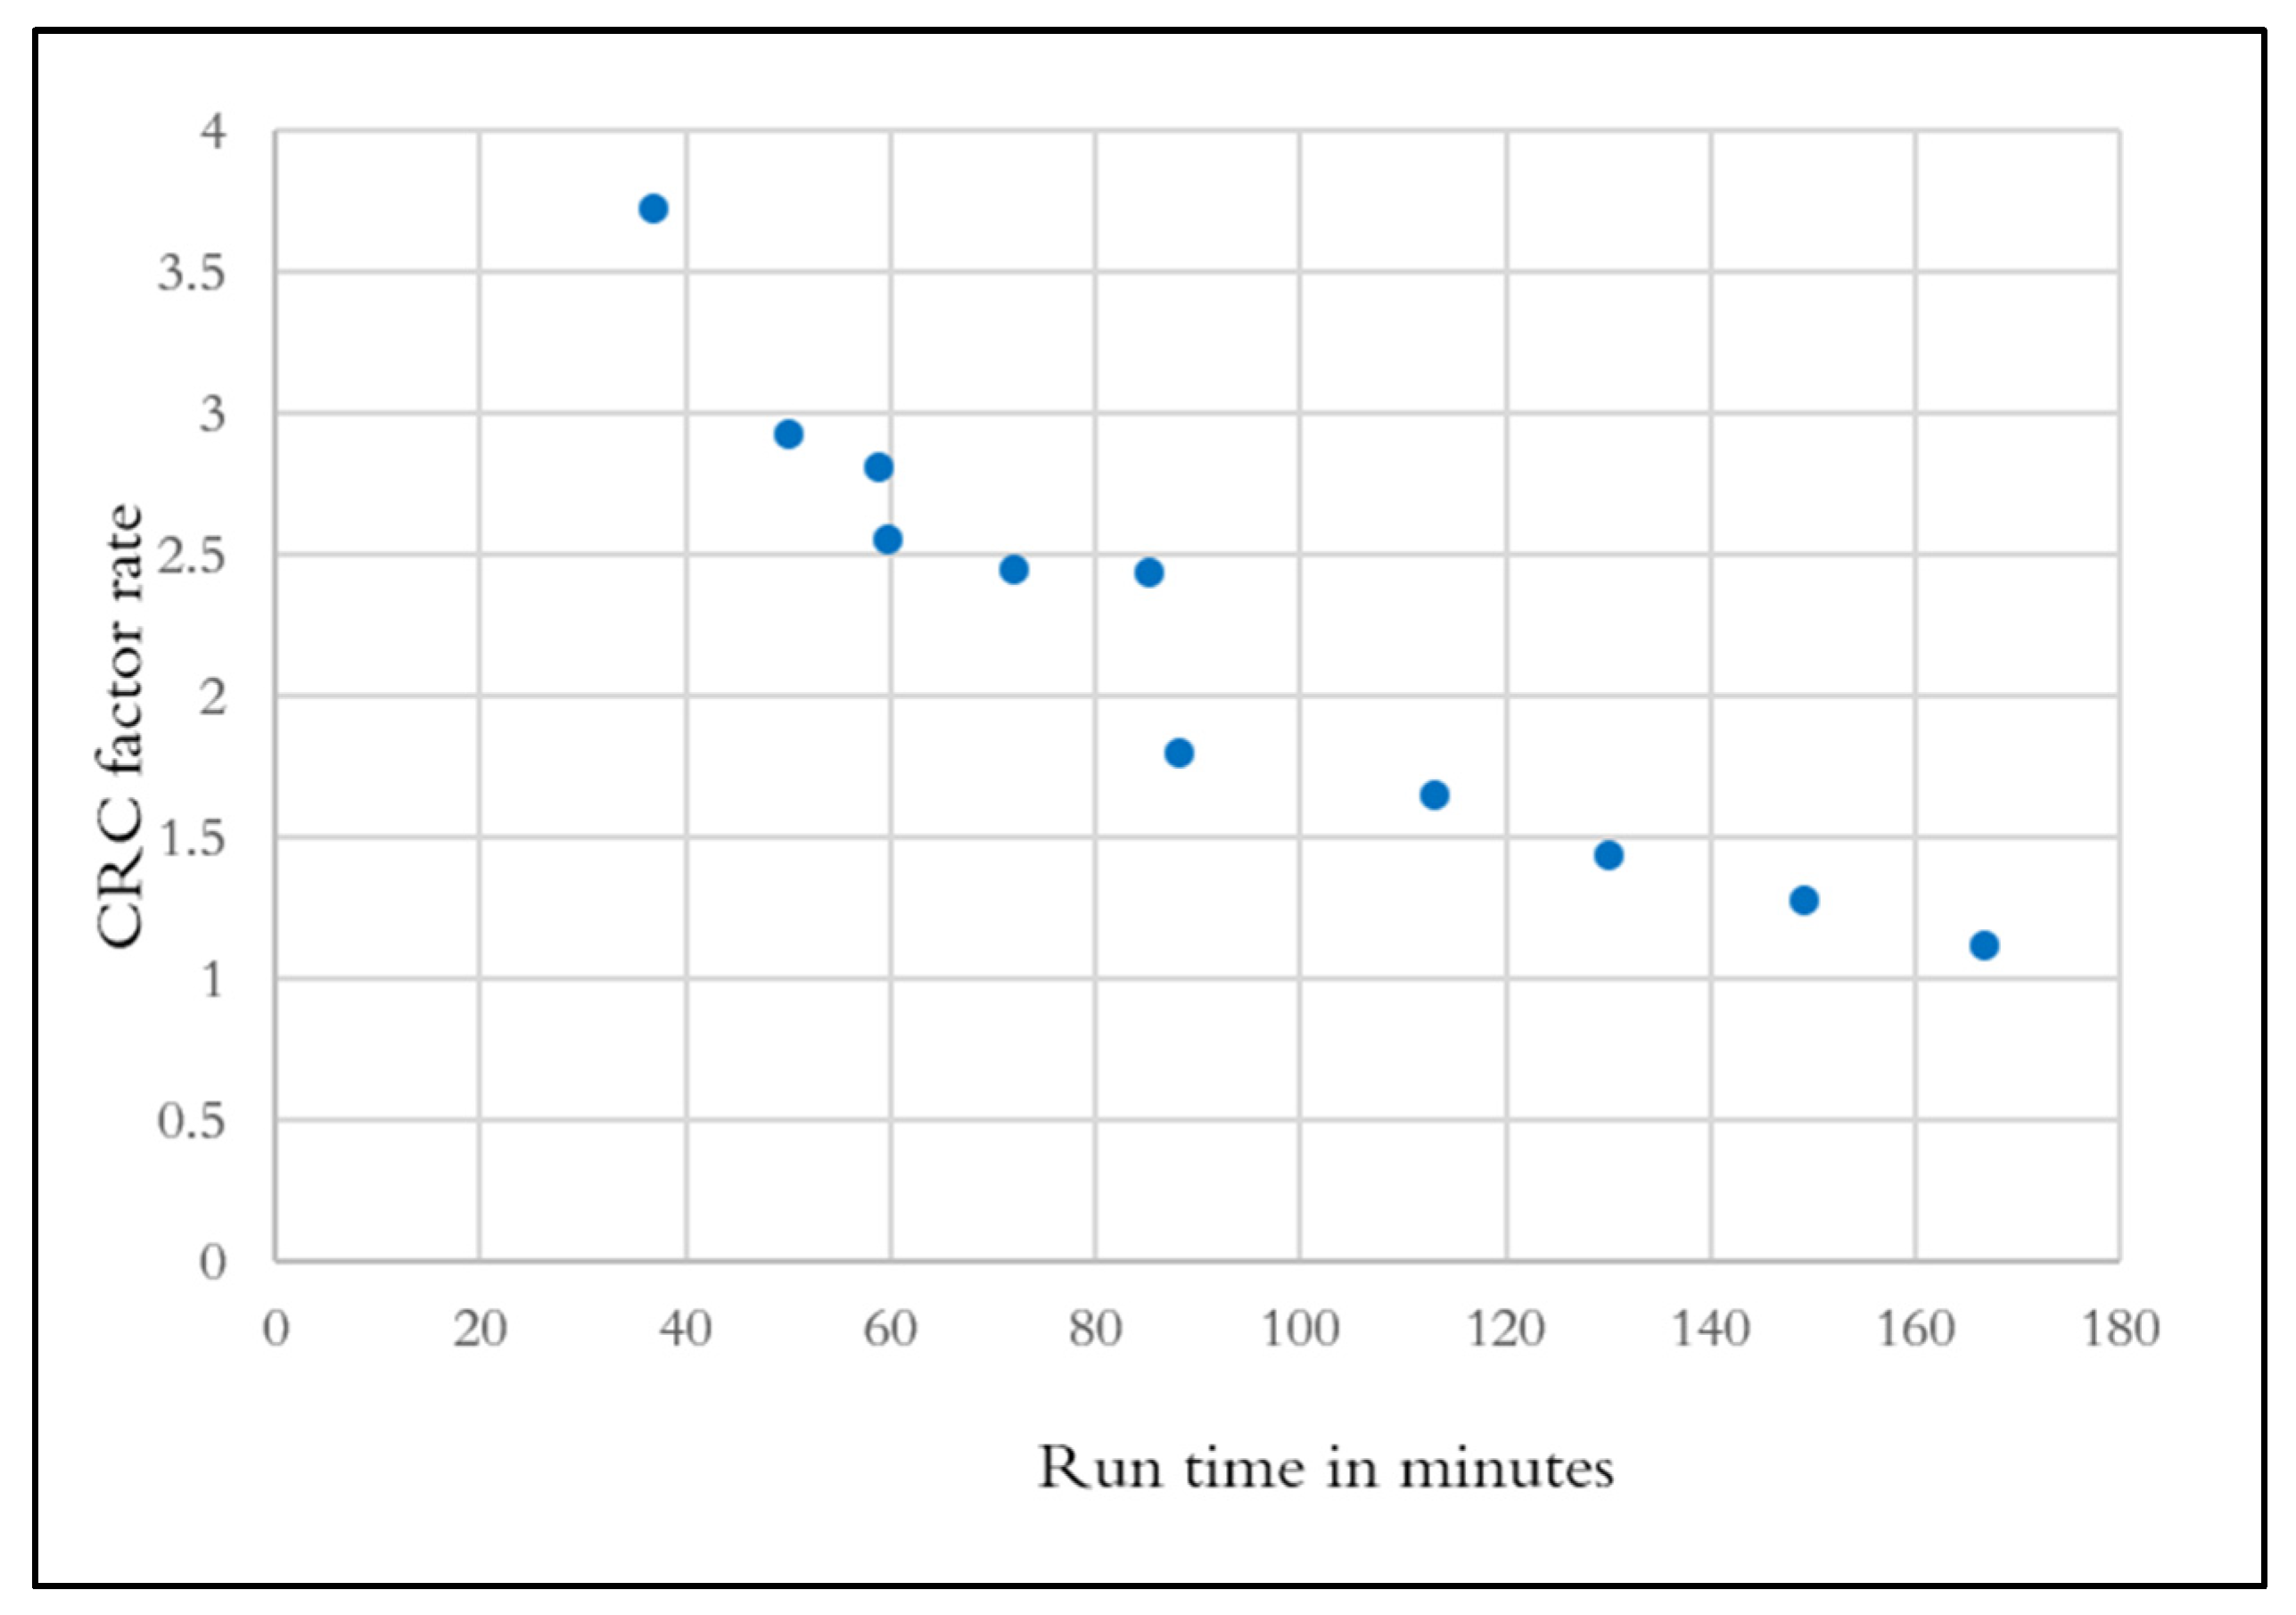
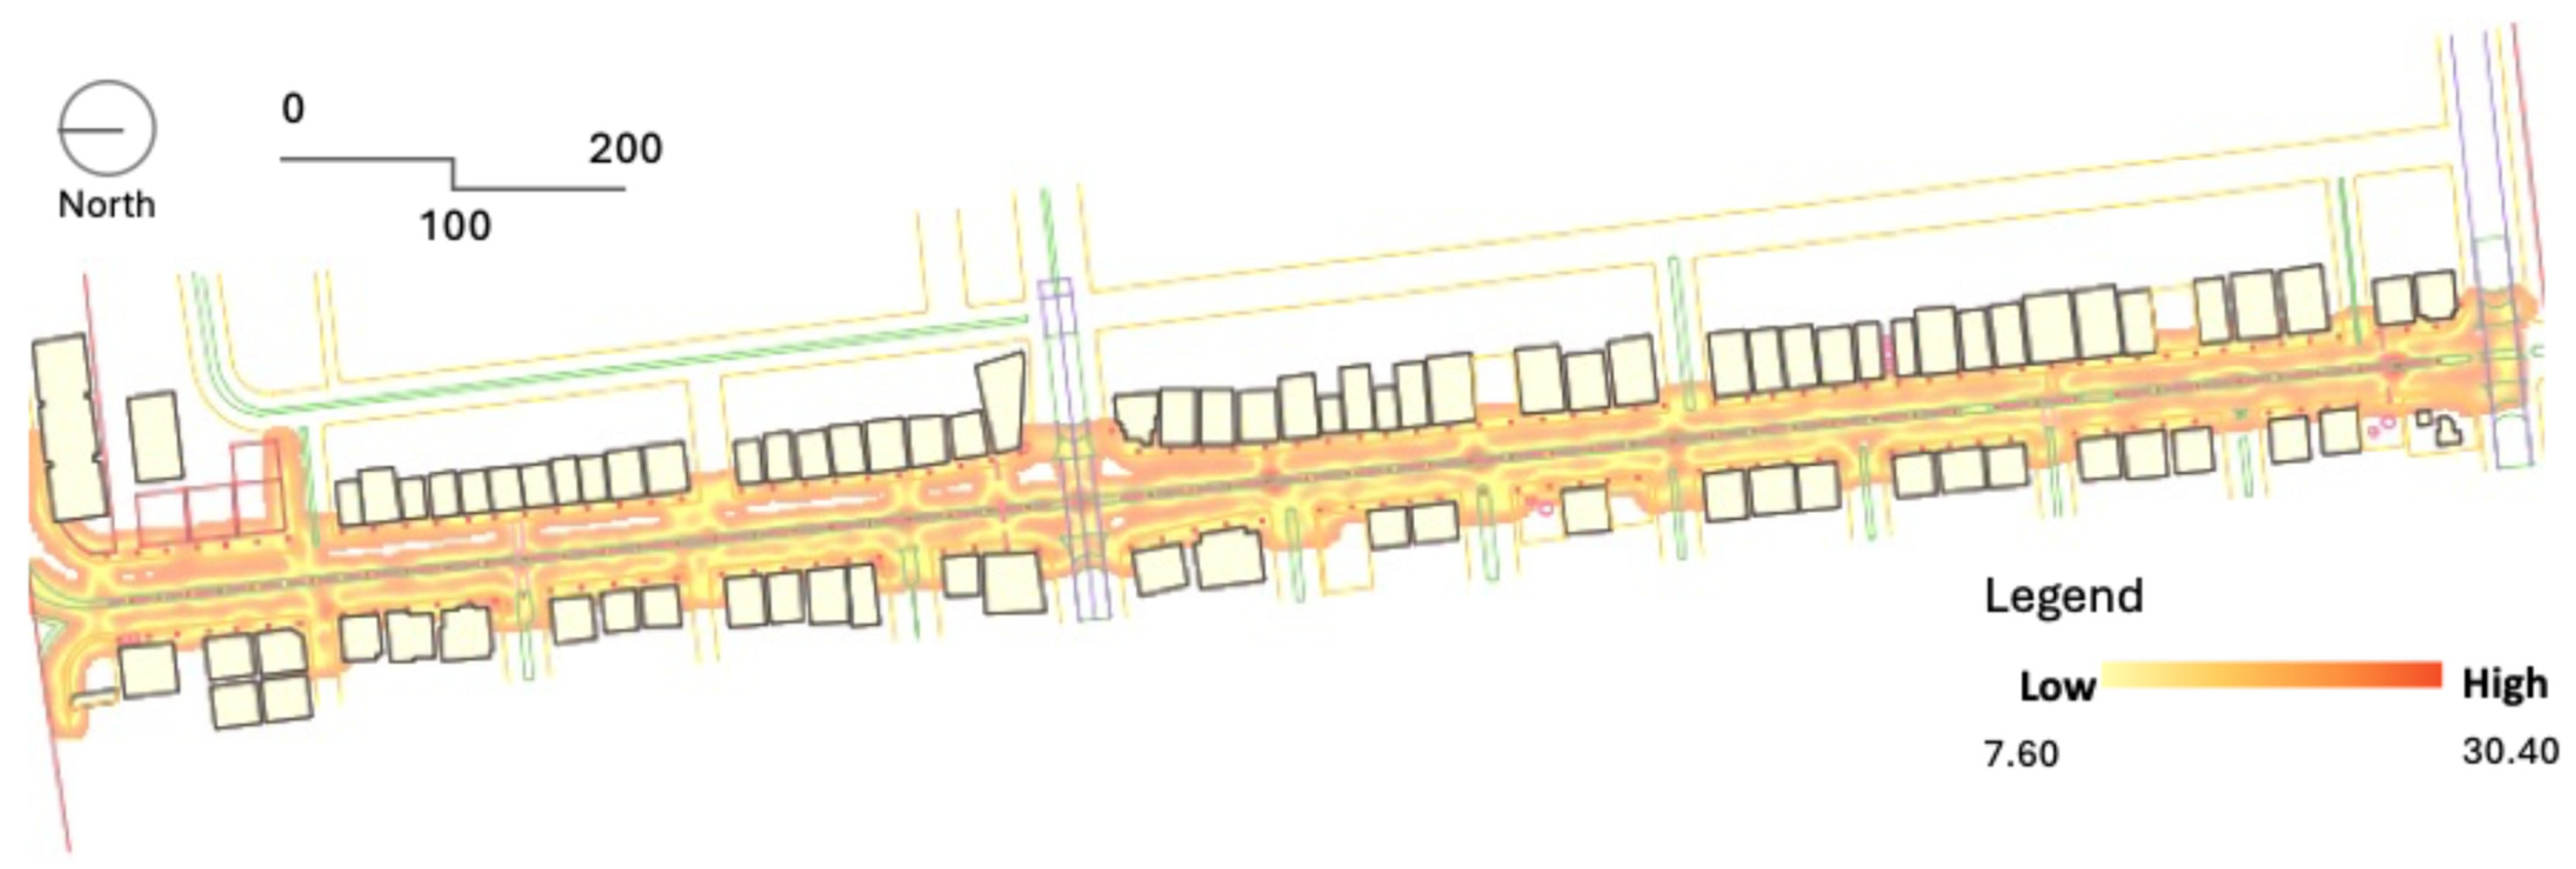
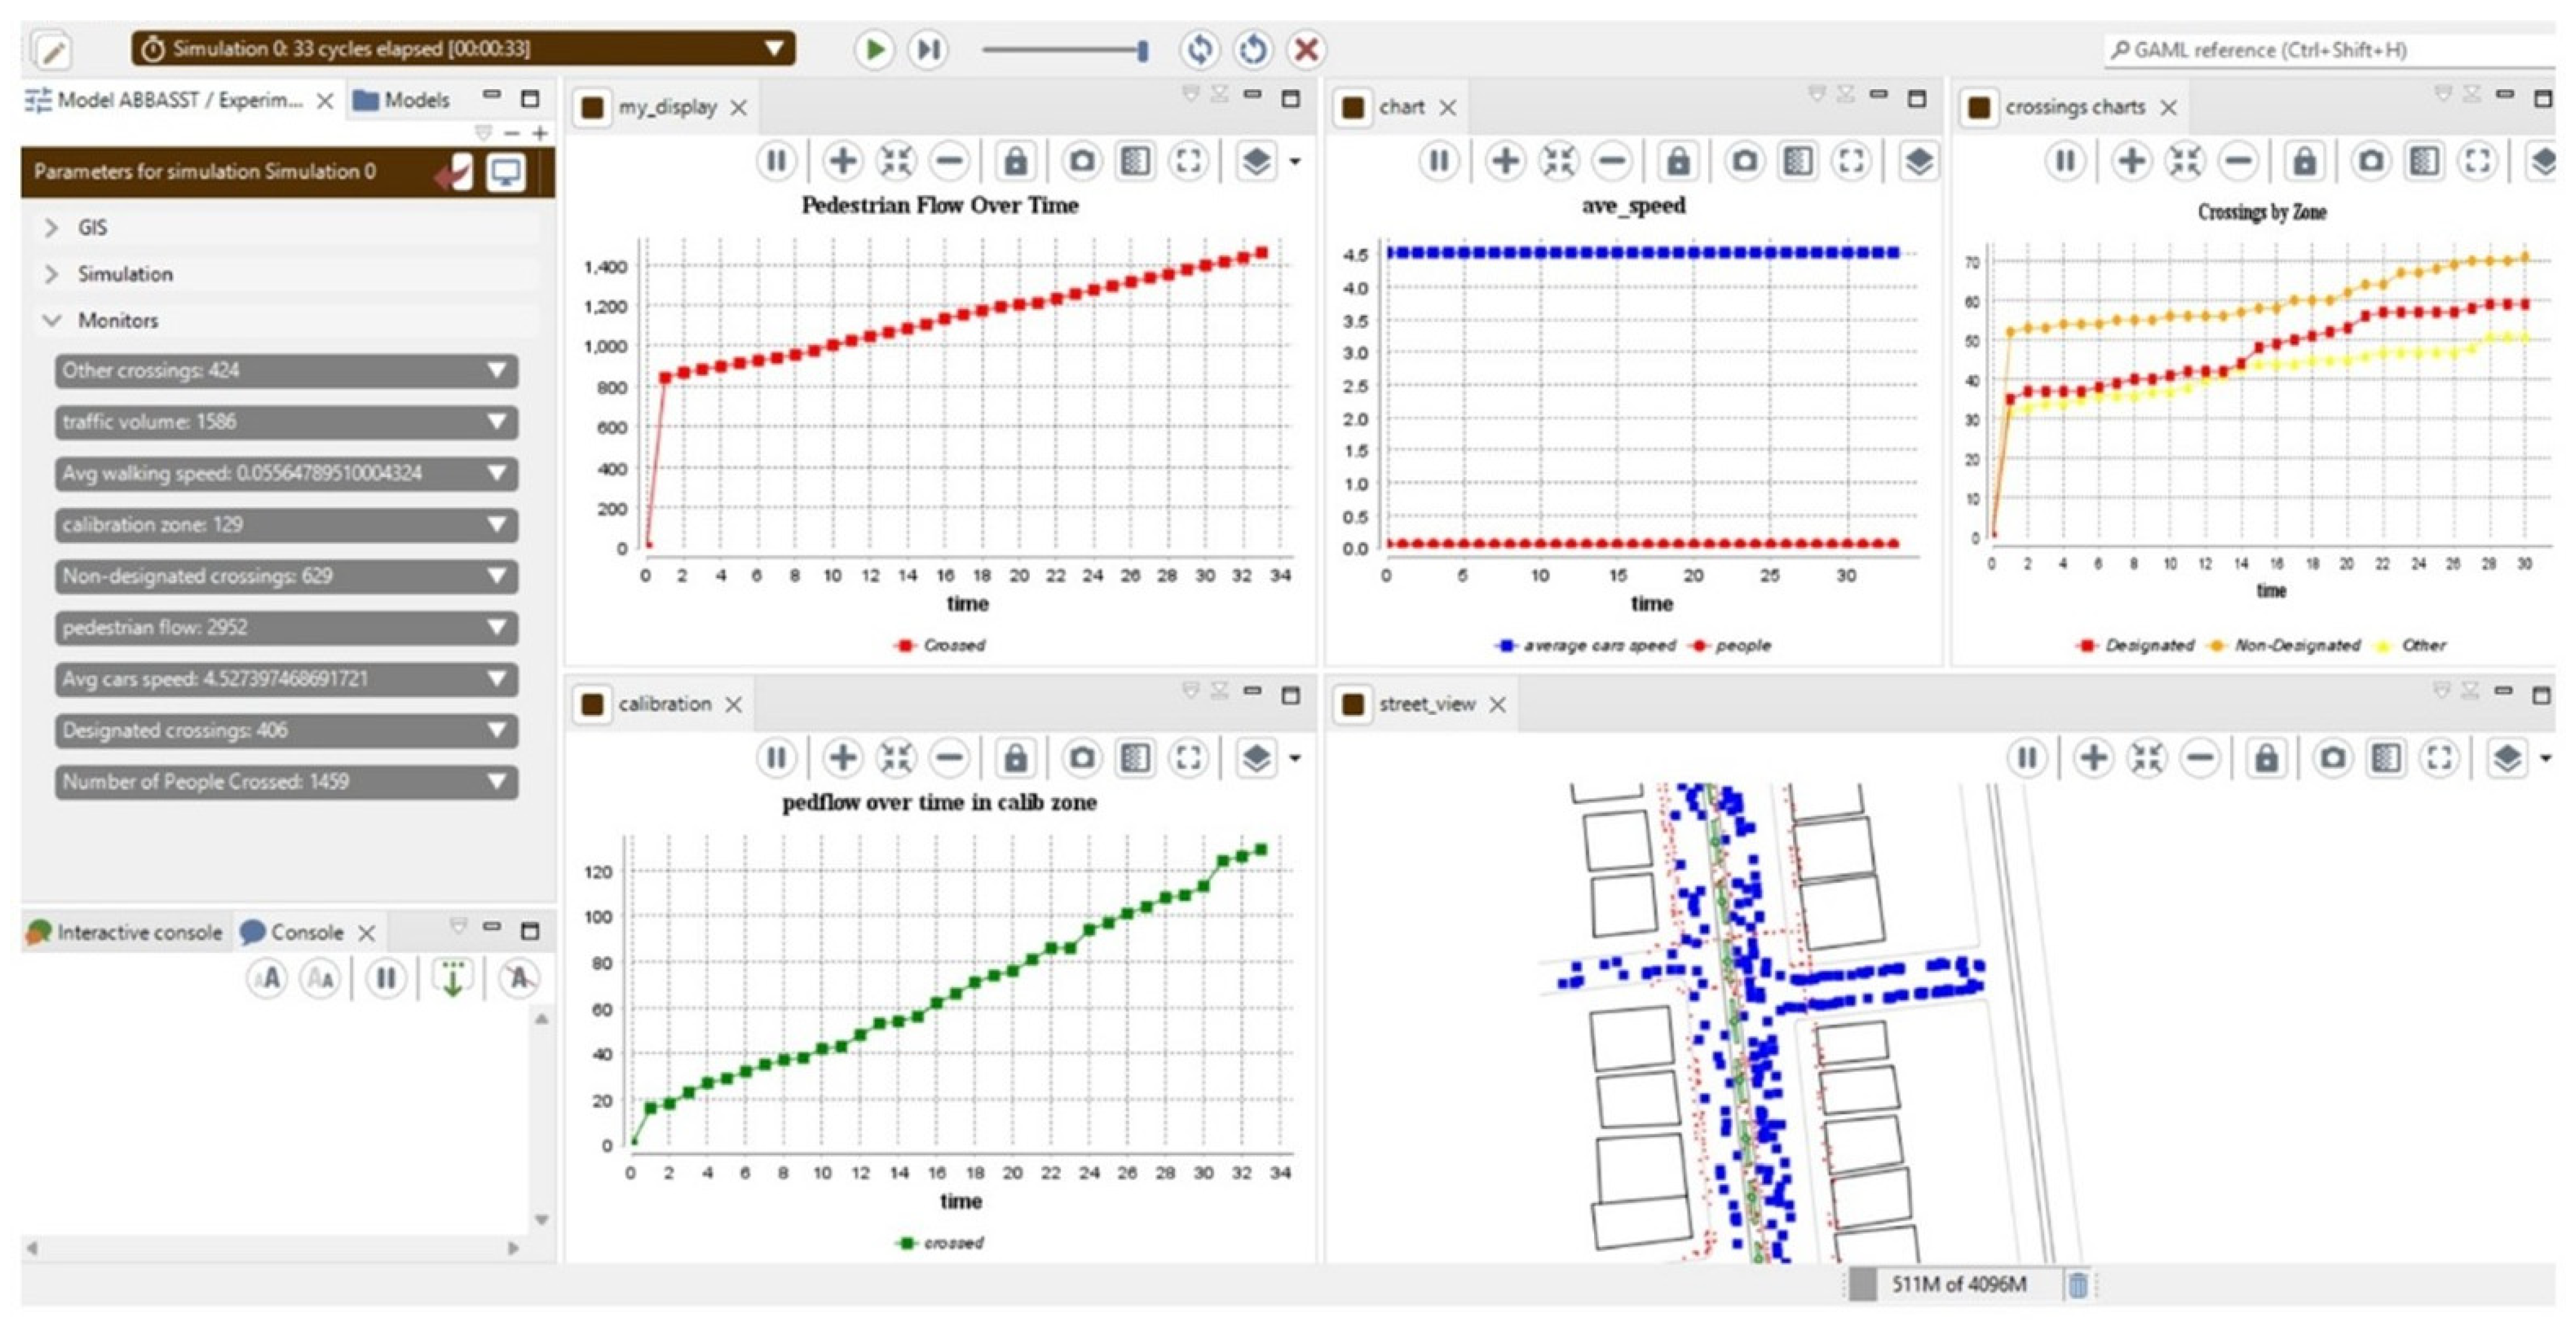
Charts were generated from the simulation. The pedestrian flow distribution was studied along the entire street, and it was found that the highest flow was observed in the non-designated zones. The heat map shows pedestrian flow intensity along the street segment, with values ranging from 7.6 to 30.4 based on kernel density. The Conflicts Rate per Crossing (CRC) represents the average number of pedestrians–vehicle conflicts per crossing event (Figure 12). Simulation results indicate an average CRC value of 2.199, suggesting that pedestrians typically experience more than two interactions with vehicles during each crossing attempt along Abbas El-Akkad Street. The distribution presented in the figure also shows variability in conflict rates across different crossing situations.
Higher CRC values tend to occur in areas with dense traffic flow or frequent informal crossings, while lower values appear where traffic gaps are larger or vehicle speeds are reduced. The relatively high CRC value reflects the intense interaction between pedestrians and vehicles within this commercial corridor, highlighting the need for improved crossing infrastructure and traffic management measures to enhance pedestrian safety and reduce conflict frequency.
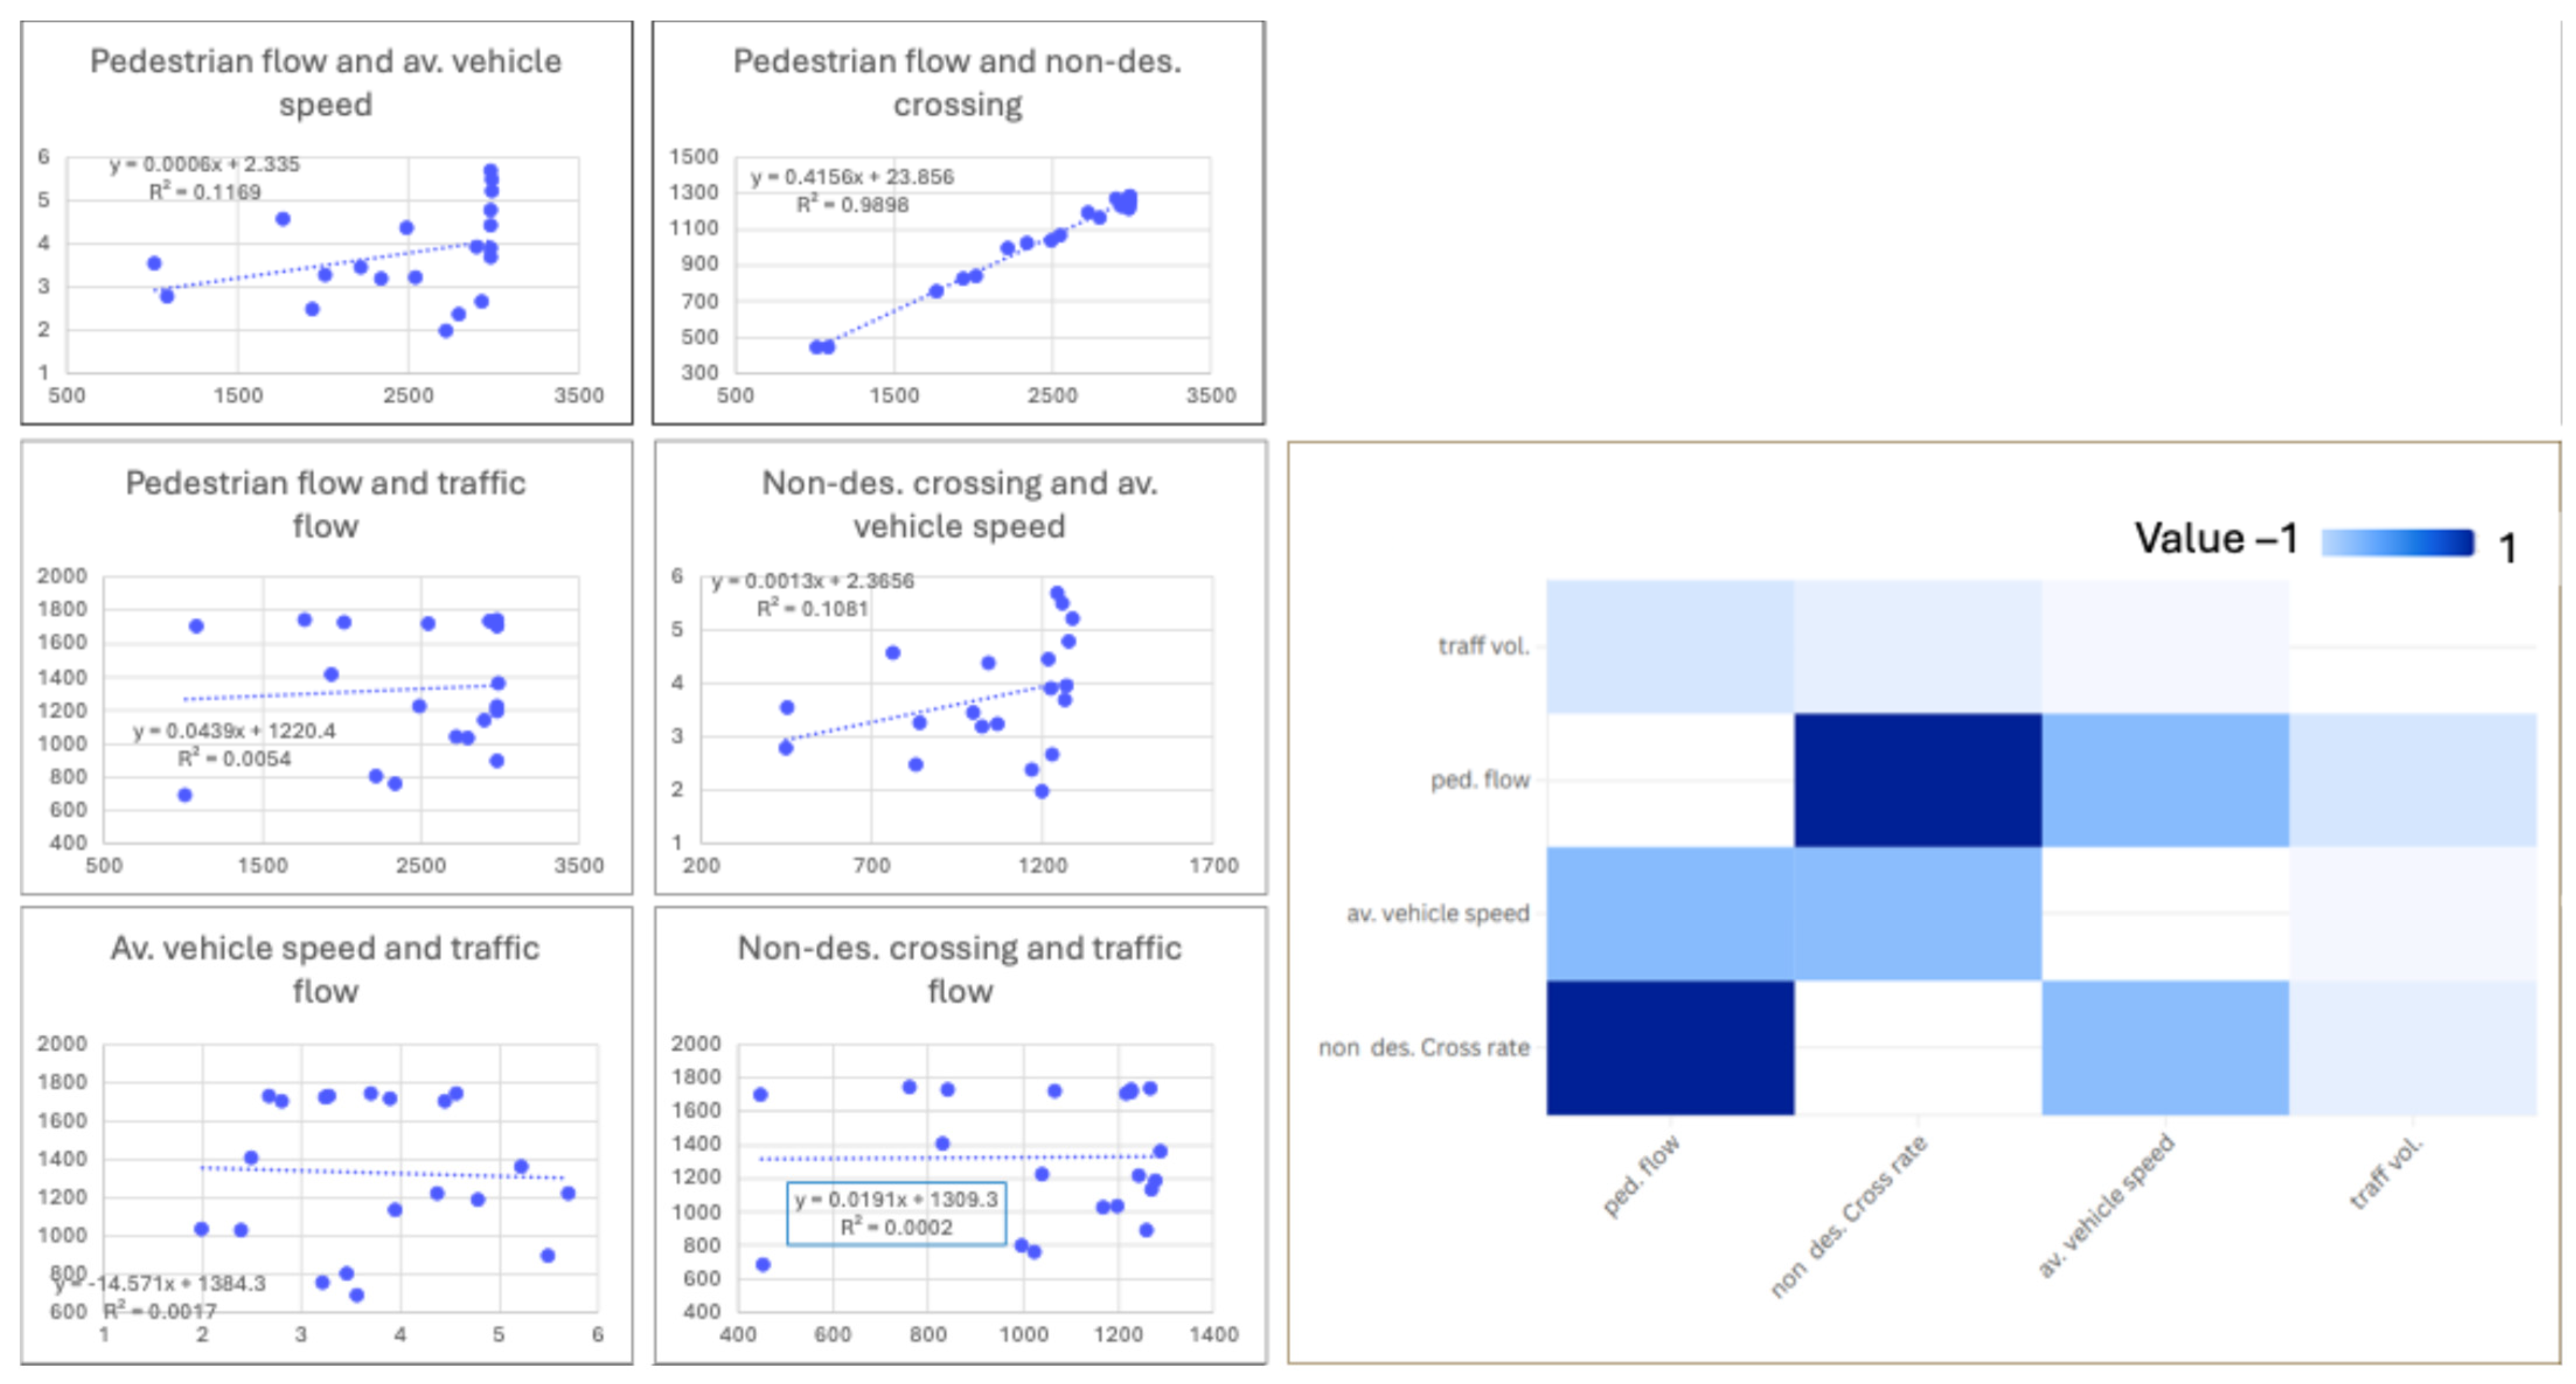
A correlation analysis was conducted among the core simulation parameters, including pedestrian flow, vehicle speed, and vehicle traffic flow. Assuming the control variables are constant, such as street width, sidewalk width, and other secondary variables. The correlation analysis reveals meaningful relationships between pedestrian and vehicle dynamics in the case study. A strong positive correlation was observed between pedestrian flow and the rate of non-designated crossings (R = 0.99), which aligns with expectations. Higher pedestrian volumes increase the likelihood of crossing outside designated facilities, especially given the extremely wide spacing between them.
The model does not explicitly impose a direct functional relationship between pedestrian flow and non-designated crossing behavior. Instead, the observed correlation arises from interactions among pedestrian agents, vehicles, and the spatial characteristics of the street environment under varying conditions. Nevertheless, it is acknowledged that certain behavioral rules embedded in the model may reinforce this relationship. For example, higher pedestrian densities increase the likelihood of interactions with traffic conditions and available crossing opportunities, which may lead to a greater occurrence of informal crossing behaviors.
Therefore, while the strong correlation highlights a meaningful association between pedestrian flow and non-designated crossings, it may partially reflect the behavioral assumptions incorporated in the simulation framework. This limitation has been taken into account in interpreting the results and indicates the need for further validation through empirical observations and additional simulation scenarios in future research (Figure 13).
Pedestrian flow also shows a moderate correlation with average vehicle speed (R = 0.3419), indicating that increased pedestrian activity tends to reduce vehicle speed as pedestrians cross at any time and from different spots rather than designated crossings. Similarly, the non-designated crossing rate is moderately associated with lower vehicle speeds (R = 0.013), suggesting that frequent informal crossings disrupt traffic flow.
In contrast, traffic volume shows weak correlations with the other parameters, which may be attributed to the fixed or limited variability in vehicle numbers during the simulations. These findings are consistent with real-world dynamics; however, greater variation in traffic volume inputs may be necessary to capture stronger relationships in future experiments.

4. Discussion

4.1. Deductive Argument

This study answered the question of how agent-based simulation can realistically reflect pedestrian behavior at crossings in commercial urban streets by integrating empirical data, behavioral rules, and contextual street parameters. By calibrating the simulation using observed pedestrian flow and correlating it with key influencing variables such as vehicle speed, non-designated crossing rates, and traffic volume. The correlation and regression analyses provide a robust empirical foundation for understanding pedestrian crossing dynamics and support the subsequent discussion on model implications and urban design recommendations. The model provided a dynamic and data-driven representation of real-world interactions between pedestrians and vehicles. It was validated using real-world data driven from video recordings and observations. It offered valuable insights into how subtle spatial and operational adjustments can enhance safety and walkability in dense commercial corridors.
The simulation along Abbas El-Akkad Street yielded insights into the dynamics of pedestrian crossings in designated and non-designated areas of a commercial urban street with mixed uses. The model successfully replicated pedestrian flows across non-designated crossing areas, particularly in segments characterized by limited formal infrastructure and higher pedestrian-vehicle interaction. The simulation results revealed that pedestrian flow patterns are highly sensitive to crossing design and traffic conditions, underscoring the importance of people-oriented planning to mitigate unsafe crossing behaviors.
The correlation analysis yielded a set of empirical equations linking variables in the pedestrian-crossing model. The correlation analysis of the simulation variables revealed several relationships, expressed by linear regression equations. These equations quantify how changes in independent variables influence pedestrian behavior and flow dynamics within the studied street segment. The strongest correlation was found between pedestrian flow and non-designated crossings, indicating that increased pedestrian movement directly increases the tendency to cross outside designated areas. The other relationships indicate minimal or no statistical significance, reinforcing the idea that pedestrian decisions to cross informally are more influenced by pedestrian density and crossing facility design than by vehicular parameters.
The findings from the ABM simulation underline a critical disconnect between existing urban infrastructure and actual pedestrian behavior. By translating continuous pedestrian monitoring into dynamic simulation metrics, this study shows that existing street layouts in high-density commercial corridors fail to accommodate natural walking patterns, resulting in severe safety compromises.
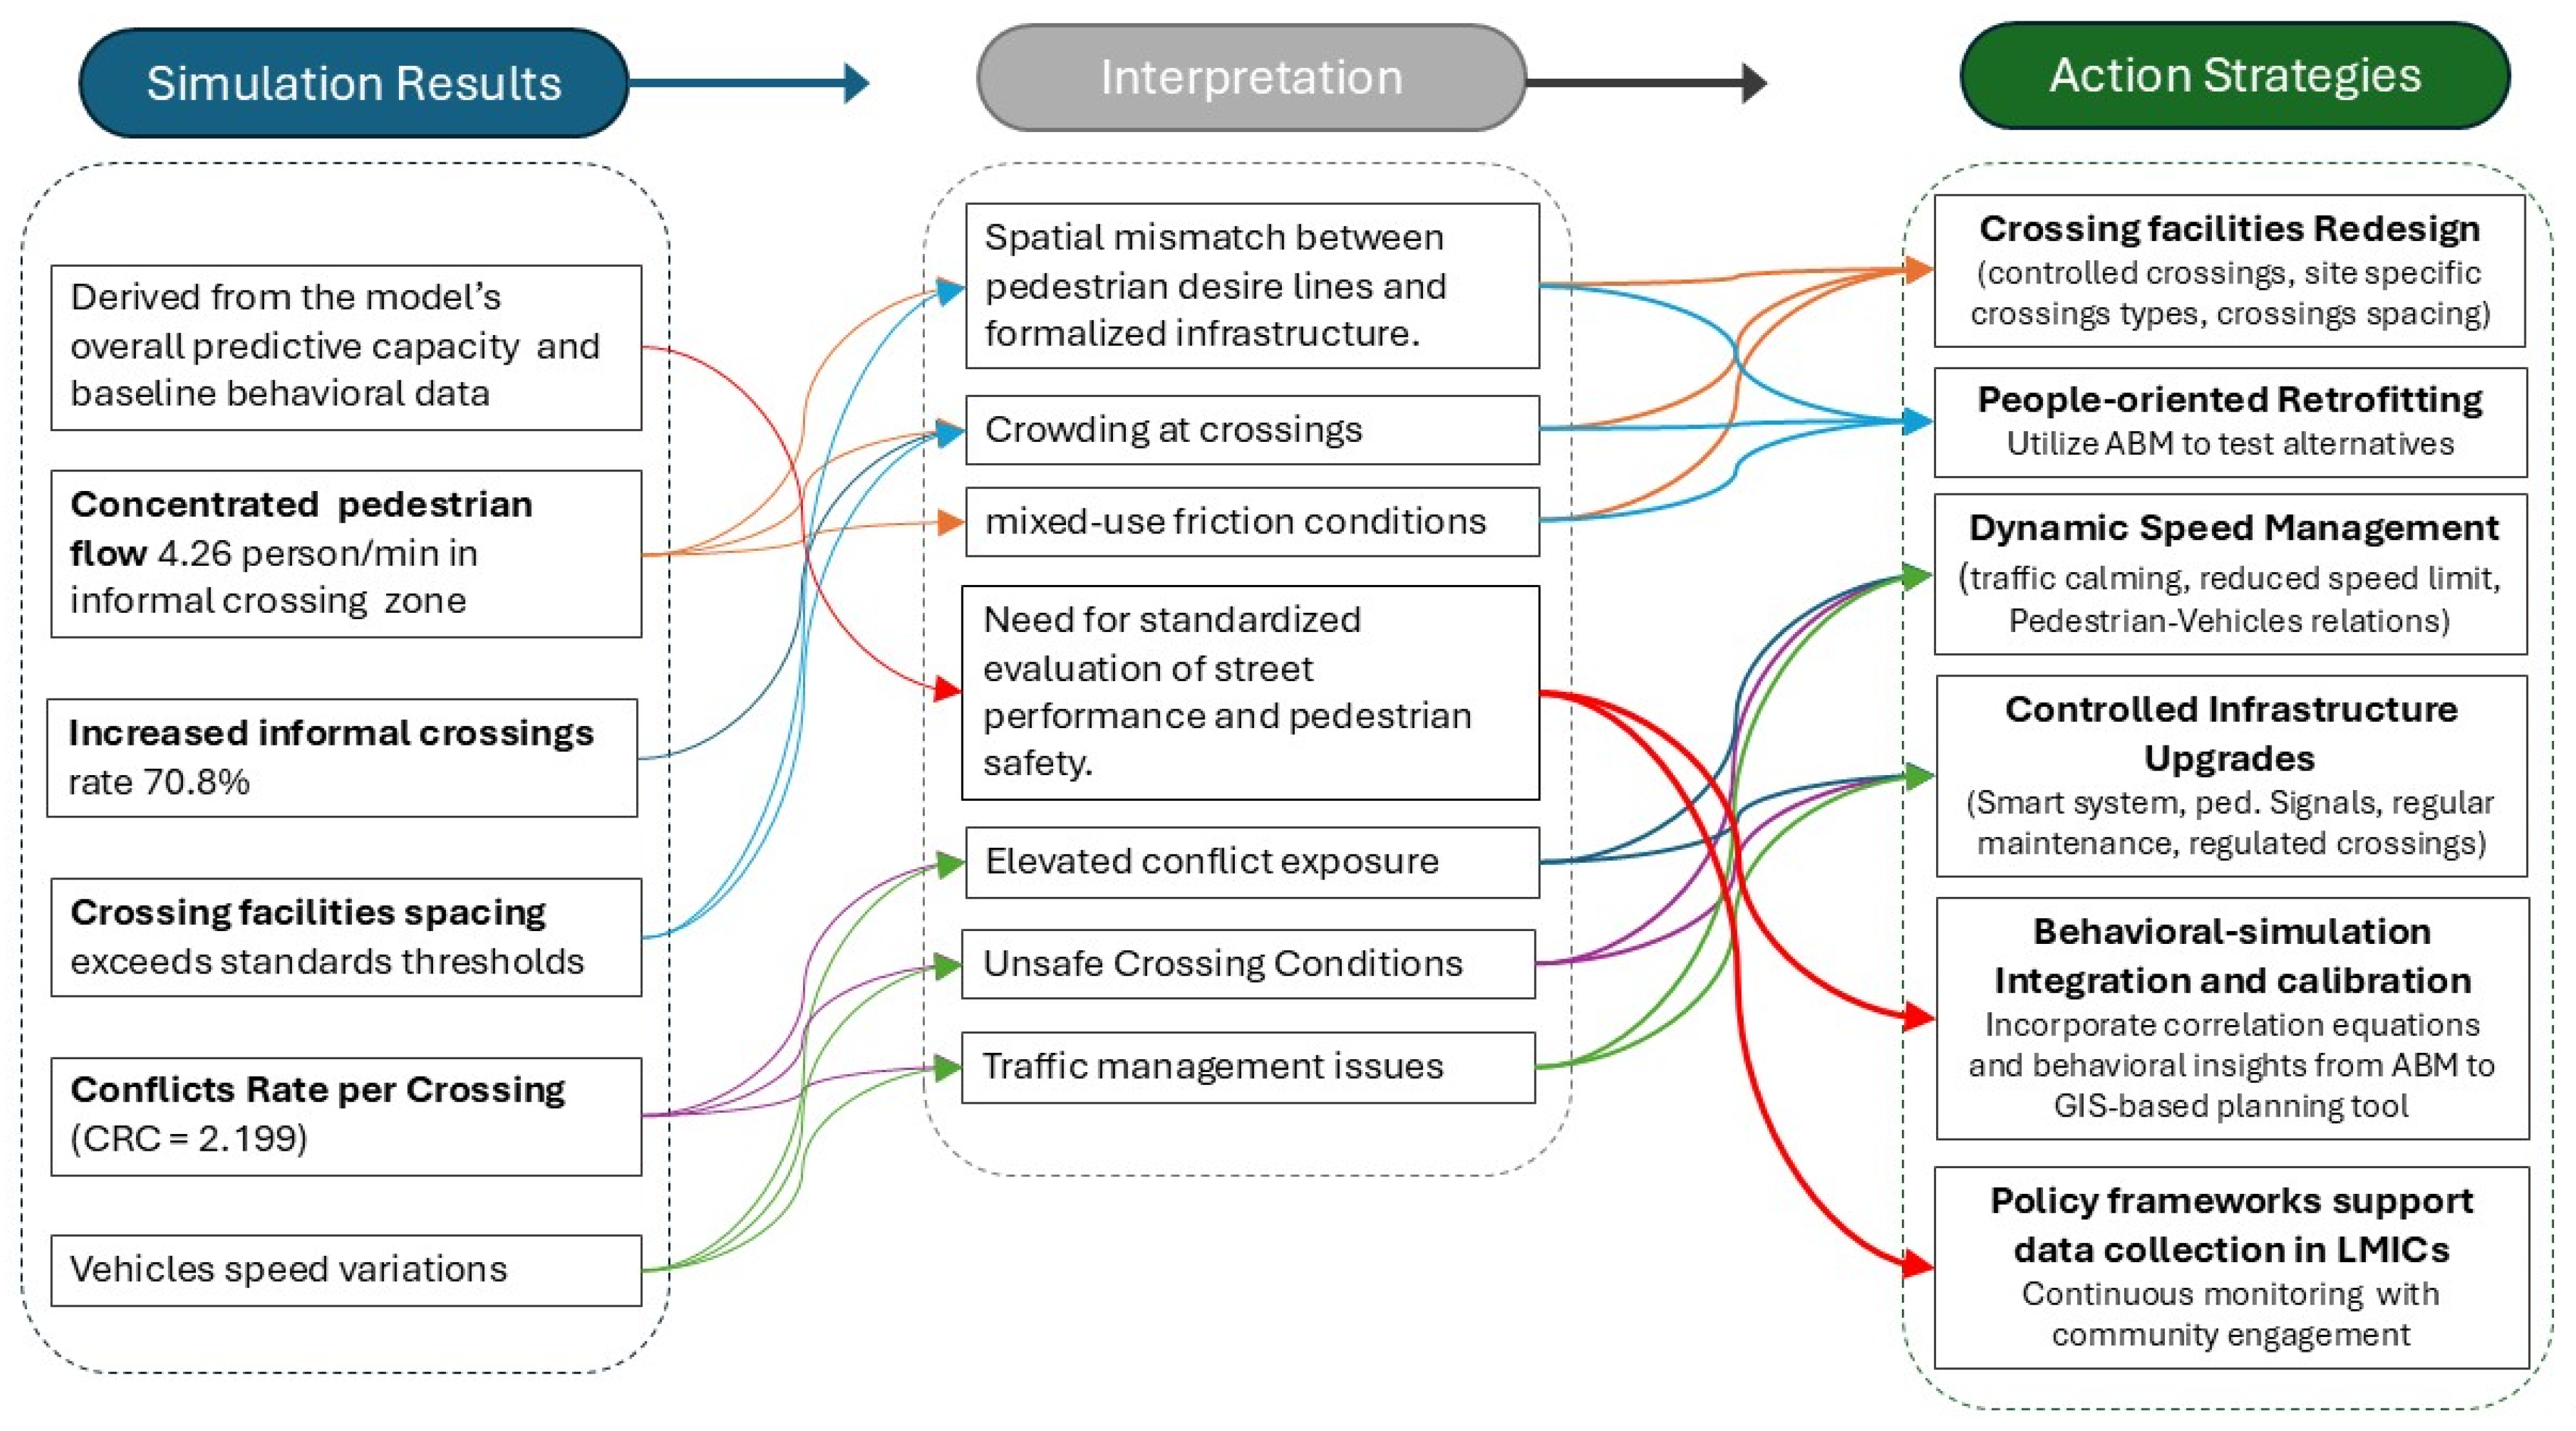
The ABM simulation also revealed a clear mismatch between the existing spatial configuration of crossing facilities and observed pedestrian movement patterns. The recorded informal crossing rate (70.8%) and the concentration of pedestrian flows in non-designated areas (4.26 persons/min) should not be interpreted as random or unsafe behavior, but rather as an adaptive response to inadequate infrastructure provision. This indicates that the current spacing of formal crossing facilities exceeds acceptable walkability thresholds, compelling pedestrians to prioritize directness over compliance. Consequently, pedestrians engage in opportunistic crossings, creating continuous interaction zones with vehicular traffic. The results were distilled into main points to inform the actions framework.
To address this spatial mismatch, the results suggest that reducing the spacing between controlled crossings to approximately 100–120 m as standard measures would better align with observed pedestrian desire lines. In addition, the type and design of crossing facilities should be context-sensitive, particularly in high-density commercial corridors, where pedestrian volumes and activity patterns require more responsive and flexible design solutions.
The simulation further demonstrates that informal crossing zones are associated with elevated interaction intensity, reflected in a Conflict Rate per Crossing (CRC = 2.199). However, these conflicts should be interpreted within the context of actual traffic dynamics rather than assumed ideal conditions. During peak evening hours (18:00–00:00), the traffic system operates under congested conditions where sustained high speeds (e.g., 60 km/h) are rarely maintained. Instead, the dominant characteristic is significant variation in vehicle speed, driven by repeated pedestrian–vehicle interactions, stop-and-go behavior, and localized friction effects.
This variability represents a critical safety concern, as it reduces driver predictability and increases the likelihood of conflict in mixed-use environments. Therefore, the findings highlight the need for targeted traffic management strategies that focus not only on speed reduction but also on stabilizing vehicle flow (Figure 14).
Potential interventions include implementing traffic calming measures, optimizing signal timing, and introducing controlled pedestrian crossing phases. These strategies can be further evaluated using the simulation model to assess their effectiveness in reducing speed variability and conflict exposure. Beyond localized design interventions, the results point to a broader need to integrate behavioral insights into urban planning policies, particularly in rapidly growing commercial corridors in LMICs. The methodological approach adopted in this study—linking simulation outputs with observed behavioral patterns—demonstrates the potential of agent-based modeling as a decision-support tool. By incorporating empirical data derived from video-based observation into simulation environments, planners can better understand the dynamic interaction between pedestrians and vehicles.
This approach supports the development of adaptive planning frameworks that move beyond static design standards. It also underscores the importance of interdisciplinary collaboration between urban planners, transport engineers, and local authorities to ensure that street design guidelines are continuously updated based on real-world evidence.
To enhance the practical applicability of the findings, the simulation outputs can be translated into operational indicators that directly support decision-making. Key variables, such as the informal crossing rate, variation in vehicle speed, and conflict rate, can serve as measurable thresholds for intervention. For instance, an informal crossing rate exceeding 50% may indicate inadequate crossing provision, necessitating a reduction in crossing spacing or the introduction of additional controlled facilities. Similarly, high vehicle speed variability can signal unstable traffic conditions, requiring traffic calming measures or signal optimization. Elevated conflict rates further highlight priority zones for immediate intervention.
These relationships provide a practical decision-support tool for assessing the potential impacts of design and policy interventions on pedestrian dynamics. The outcomes are particularly relevant for LMICs, where limited data availability and resource constraints often impede evidence-based planning.
By translating complex simulation results into applicable metrics, the study equips urban planners, transport engineers, and policymakers with an accessible tool to optimize street design and prioritize pedestrian safety. It can also help planners simulate how modifying crossing design or vehicle speed limits would affect pedestrian behavior. In doing so, it supports the advancement of more inclusive, safe, and sustainable urban environments, reinforcing the shift toward community-centered development practices.

4.2. Actionable Strategies for Implementing a Safer, Sustainable Urban Form

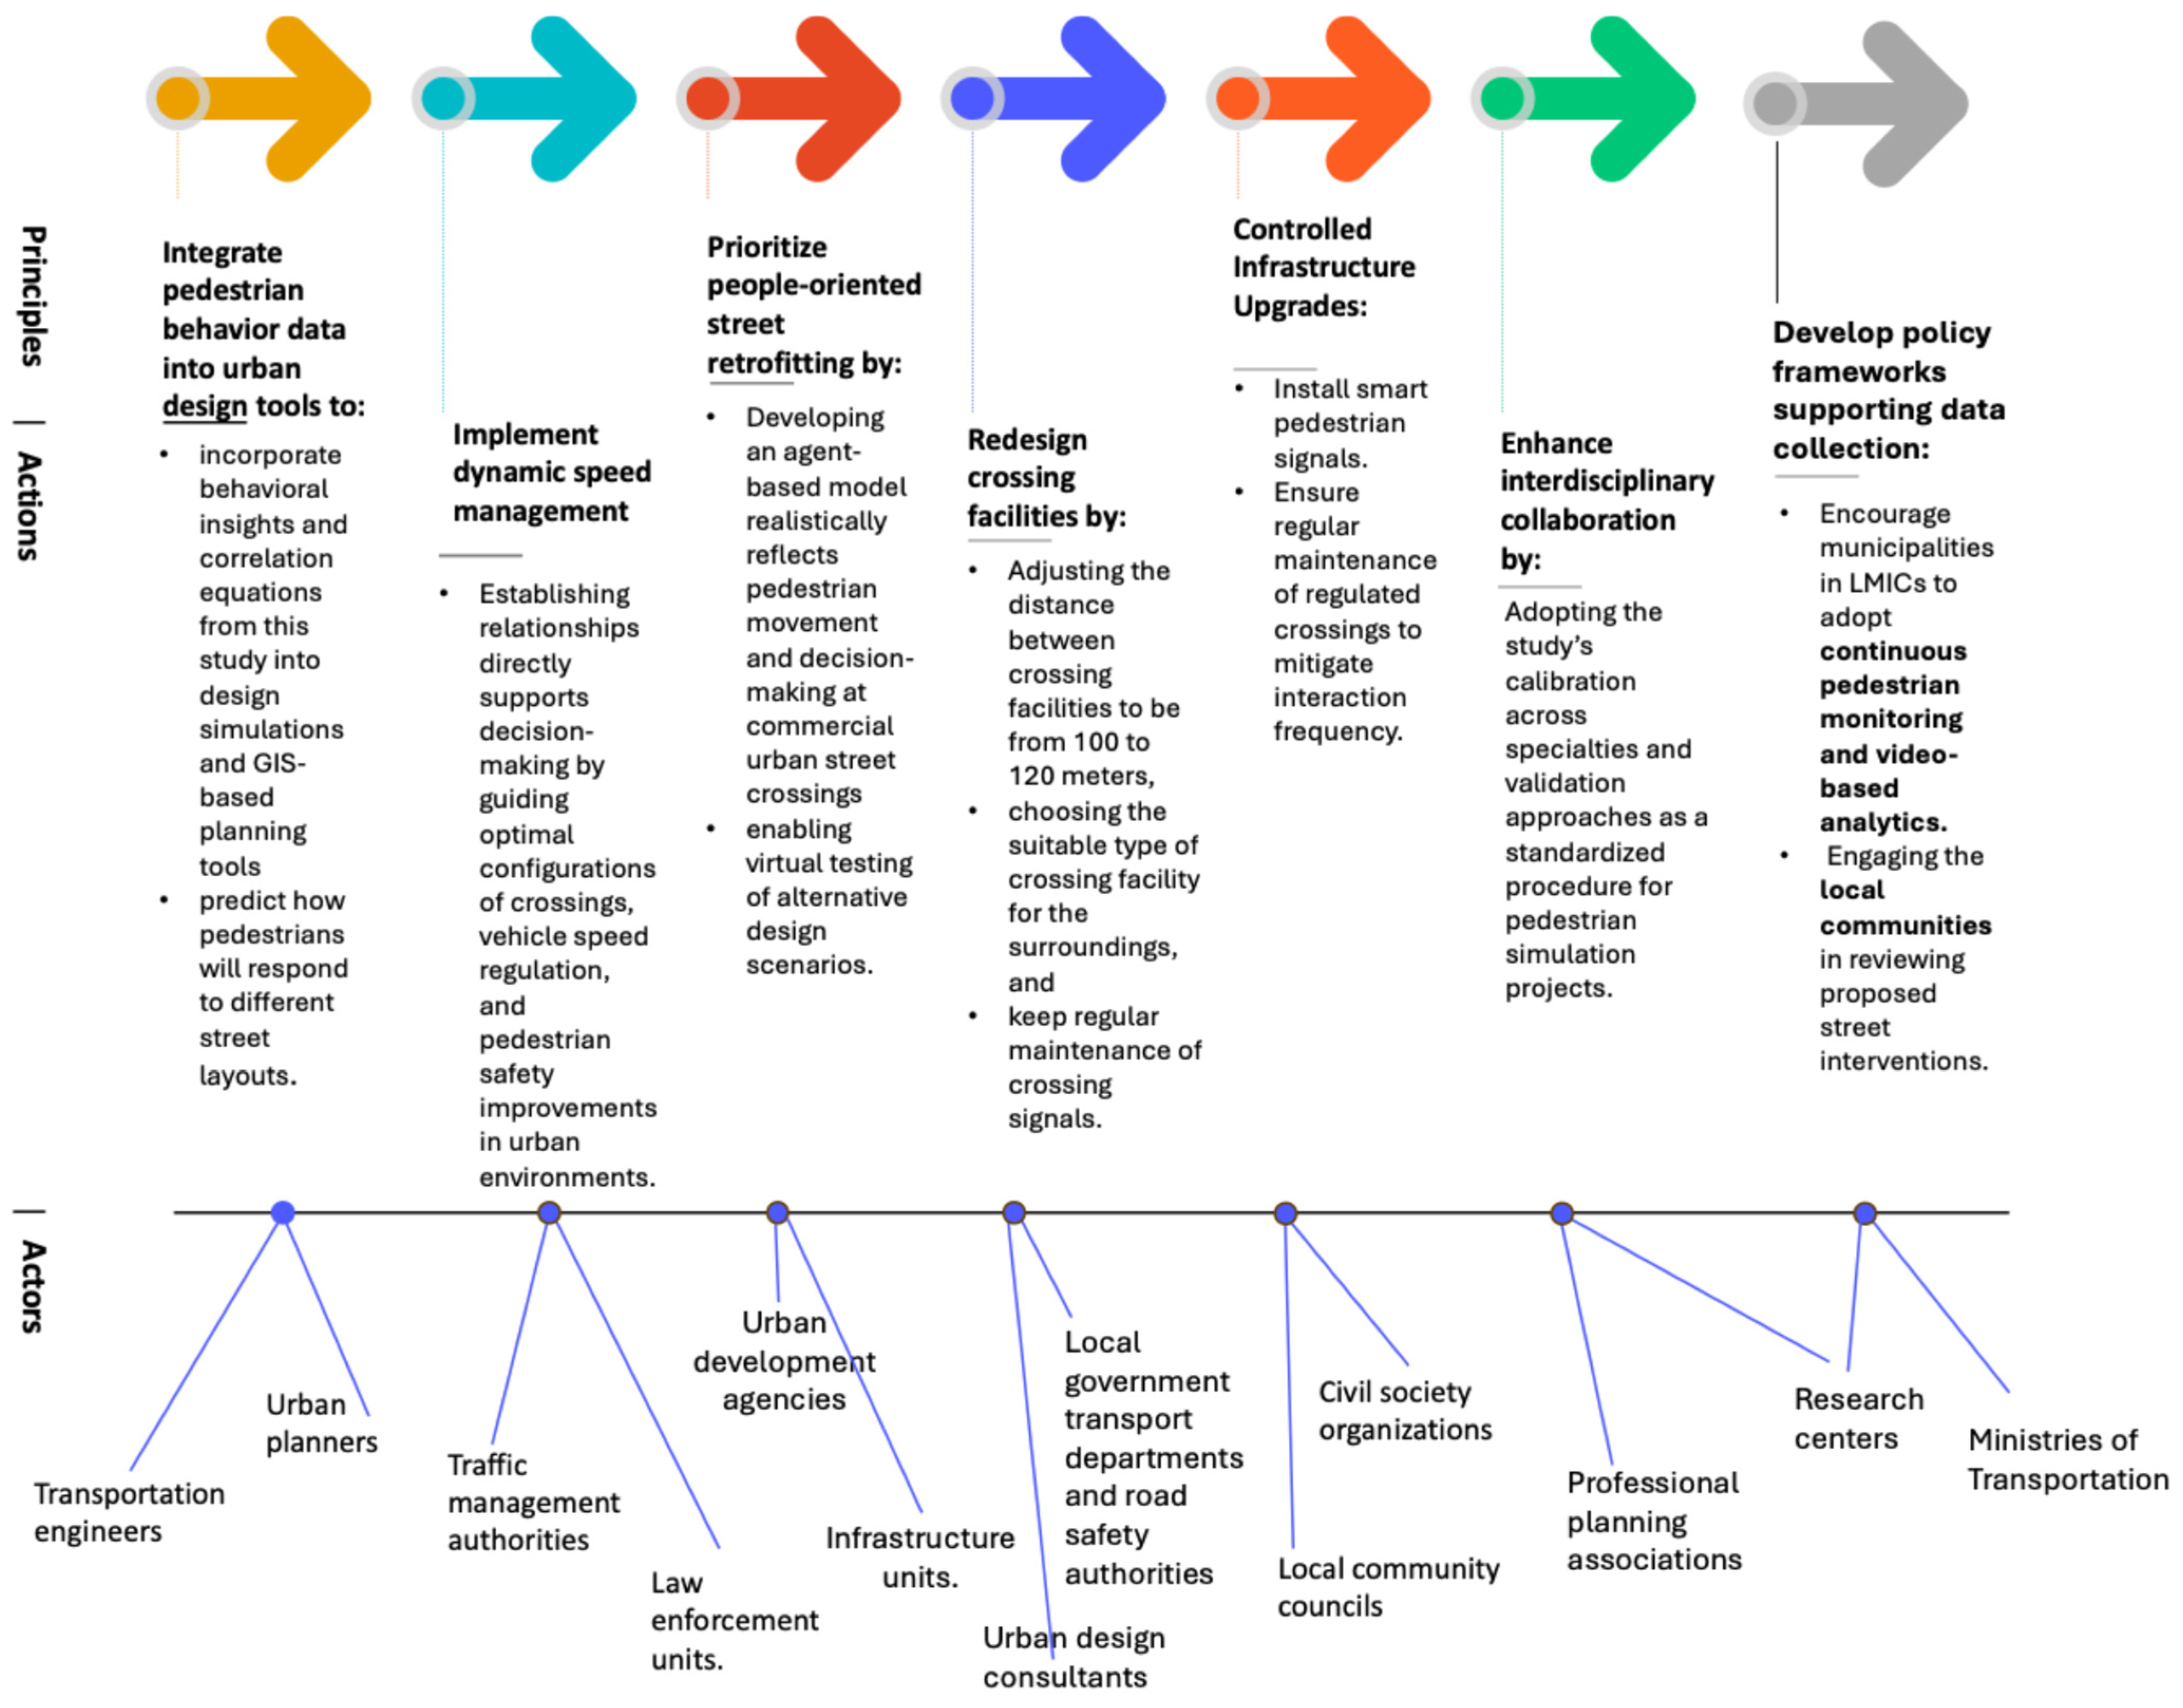
This study provided procedures for replicating the simulation in a similar urban context. It also grouped the key findings into seven actionable strategies for implementation. These actions summarize the practical implications derived from the simulation and correlation analysis, providing a bridge between analytical results and on-ground applications.
Each proposed action is accompanied by a concise description and the identification of the responsible authorities or stakeholders involved in its realization, including urban planners, transport engineers, policymakers, and local municipalities. This framework serves as a practical roadmap for transforming analytical insights into context-specific design interventions that enhance pedestrian safety and promote more people-oriented street environments, particularly in LMICs, where street design challenges are often complex and resource-constrained.
By linking scientific evidence to policy and planning responsibilities, the proposed actions aim to ensure sustainable, coordinated implementation across multiple governance levels. While the simulation framework demonstrates robustness and contextual relevance, several limitations must be acknowledged regarding the research’s scope and methodological design. The representation of the street network and urban elements relied on field observations, satellite imagery, and manual digitization in AutoCAD and GIS.
Our actional strategies present a structured framework that connects principles, actions, and actors to improve pedestrian-oriented urban design. It highlights how multiple stakeholders collaborate to ensure that streets are designed based on real human behavior. Key actors at this overarching level include ministries of transport, research centers, and professional planning associations, which guide strategy, knowledge production, and policy direction. Figure 15, alongside the following, illustrates the seven actionable strategies.
  • The first principle is integrating pedestrian behavior data into urban design tools. The action involves incorporating behavioral insights and correlation models into simulation platforms and GIS-based planning tools to better predict pedestrian responses to different street configurations. The main actors responsible for this are urban planners and transportation engineers, who operationalize data into design and planning decisions.
  • The second principle is implementing dynamic speed management. The action focuses on establishing clear relationships among pedestrian activity, crossing design, and vehicle speed regulation to guide safer, more efficient traffic conditions. This is primarily led by traffic management authorities, with strong support from law enforcement units to ensure enforcement and compliance.
  • The third principle is prioritizing people-oriented street retrofitting. The action involves developing and applying agent-based models that realistically simulate pedestrian movement and decision-making, enabling virtual testing of alternative design scenarios. Urban development agencies and infrastructure units are key actors, integrating these models into redevelopment strategies and street upgrades.
  • The fourth principle is redesigning crossing facilities. The action includes adjusting the spacing between crossings, selecting appropriate crossing types for specific contexts, and maintaining crossing infrastructure to ensure safety and usability. Local government transport departments and road safety authorities are the main actors, often collaborating with urban design consultants.
  • The fifth principle is controlled infrastructure upgrades. The action focuses on installing smart pedestrian signals and ensuring the regular maintenance of regulated crossings to better manage pedestrian–vehicle interactions. Civil society organizations and local community councils are important actors, contributing through advocacy, feedback, and ensuring that interventions respond to community needs.
  • The sixth principle is enhancing interdisciplinary collaboration. The action involves adopting standardized, validated approaches across the disciplines involved in pedestrian simulation and urban design, ensuring consistency and integration in practice. Professional planning associations and research centers are the primary actors, facilitating collaboration, validation, and knowledge sharing.
  • The seventh principle is to develop policy frameworks that support data collection. The action includes encouraging municipalities to adopt continuous pedestrian monitoring systems and video-based analytics and engaging local communities in evaluating proposed interventions. Ministries of transport, alongside research centers and local communities, are the central actors responsible for shaping, implementing, and sustaining these policy frameworks.
Although our suggested strategies enabled an accurate depiction of key spatial components, certain simplifications were inevitable during the conversion of features into simulation-compatible formats, particularly for non-polygon elements such as green spaces and building outlines. The behavioral modeling of pedestrians and vehicles incorporated fundamental aspects such as speed variation, signal response, and obstacle avoidance; however, more intricate psychological and social dynamics were beyond the scope of the current framework, which instead prioritized agent-based mobility logic.
The methodological framework proposed in this study was designed to be transferable to other urban contexts beyond the selected case study. The modeling process follows a structured sequence that includes collecting field observations, extracting key traffic and pedestrian parameters, translating these parameters into behavioral rules within the agent-based model, and calibrating the simulation using observed data. These steps can be replicated in other streets or urban corridors by adjusting input parameters to reflect the specific characteristics of the study area, such as pedestrian flow levels, traffic volumes, street geometry, and crossing infrastructure.

4.3. Prior Studies and Research Limitations

The deductive argument derived from our results is aligned with previous studies [26,30,37,65,84,88,89]. Consistent with the literature, our findings underscore the importance of integrating behavioral data into urban design practices, reinforcing its role in producing context-sensitive and responsive interventions [73,88]. Furthermore, the results confirm the need to prioritize safety and to advance people-oriented street planning, particularly in rapidly developing urban environments [88,90,91,92].
In this regard, our study supports the implementation of intermediate interventions—such as mid-block crossings and raised zebra crossings—strategically distributed along commercial corridors [18,93]. As in prior research, the case study highlights the importance of identifying specific hotspot locations and adhering to appropriate spacing standards between crossing facilities [89]. Such measures can contribute to a more even distribution of pedestrian movement and reduce the concentration of risk, ultimately enhancing overall street safety and functionality [7,18,19,91,94].
While the present study focuses on a commercial street environment, the same modeling procedure can be applied to different urban settings by modifying contextual variables and behavioral assumptions. Our results support this process by documenting the model structure and implementation steps, facilitating the replication and adaptation of the simulation framework for future research and planning applications.
This study is subject to several limitations that should be acknowledged. First, the model was developed under stable environmental conditions, assuming that temporal and weather variables were constant. While these factors are recognized as influential in real-world scenarios, their exclusion was intended to isolate and examine spatial and behavioral interactions under standard conditions. Second, due to constraints in empirical data availability, the simulation was not calibrated using real-world tracking datasets. Its validity, therefore, rests primarily on the internal consistency of behavioral dynamics and spatial logic within a realistically mapped urban context.
This study has an additional limitation. Not all potentially relevant variables were included in the simulation. Factors such as socio-demographic differences, individual decision-making variability, and dynamic environmental conditions were not fully represented. Their exclusion may limit the depth and realism of the simulated behaviors. These limitations do not undermine the overall reliability of the findings but rather delineate the boundaries of the present study and indicate potential directions for refinement through empirical validation, the integration of additional behavioral dimensions, and the inclusion of dynamic environmental factors in future research.
A key limitation of this study lies in the limited comparative analysis between the empirical traffic data and the simulation outputs. Although the model is informed by real-world inputs, including pedestrian flows, vehicular volumes, and general speed conditions, it lacks a systematic validation process to quantitatively assess the alignment between observed and simulated behaviors. As a result, the findings should be interpreted as exploratory, focusing on interaction dynamics rather than precise replication of real-world conditions.

5. Conclusions

This research demonstrates the potential of simulation-based analysis for understanding pedestrian–vehicle interactions in commercial urban streets. By modeling Abbas El-Akkad Street as a digital twin in the GAMA platform, the study identified key relationships between street design variables and pedestrian behavior. The strong correlation between pedestrian flow and non-designated crossing rates underscores the need for well-distributed, accessible crossing facilities.
Furthermore, the observed reduction in vehicle speed with increasing pedestrian activity highlights the influence of human-scale street design on traffic performance towards more sustainable street design. Although traffic volume showed weaker correlations with pedestrian indicators, this finding underlines the importance of diversifying simulation scenarios to capture broader behavioral patterns. Our results conclude that adopting people-oriented planning and sustainable street design principles that prioritize pedestrian safety and comfort is essential. The results of our case study recommend aligning crossing facility types and locations with surrounding activity intensity to create safer, more inclusive, and sustainable urban environments.
To develop the design of commercial urban streets and ensure safer pedestrian crossings, it is recommended that designated crossing zones be strategically distributed around major attractions. Additionally, the spacing between crossing facilities should be maintained within the standard range to promote accessibility and safety. The selection of crossing facility types should also align with surrounding uses and street activities to ensure their suitability and effectiveness.
Building on current research limitations, future research could investigate weather conditions, vegetation elements, and the use of trajectories to trace people flow in a larger context, thereby overcoming data issues. Moreover, expanding the digital twin approach beyond a single case study could enable more comprehensive calibration using multi-source data, including pedestrian behavior at designated and non-designated crossings and vehicle spatial distribution. Addressing these aspects would enhance the robustness of human-centered street simulations and provide more substantial evidence for urban planning decisions.
Future research should strengthen the model’s empirical grounding by integrating a more rigorous validation framework that directly compares simulation outputs with observed traffic and pedestrian movement data. This could include incorporating speed-dependent behavioral rules, calibrating model parameters using field measurements, and statistically validating conflict patterns. Such advancements would enhance the model’s predictive accuracy and support its application in real-world urban planning and traffic management contexts.

Author Contributions

Conceptualization, N.A. and A.E.; methodology, N.A., A.E. and S.A.; software, N.A.; validation N.A.; formal analysis, N.A.; investigation, A.E. and N.A.; resources, N.A., A.E., S.A. and W.M.E.; data curation, N.A. and W.M.E.; writing—original draft preparation, N.A. and A.E.; writing—review and editing, N.A., A.E., S.A. and W.M.E.; visualization, N.A. and A.E. All authors have read and agreed to the published version of the manuscript.

Funding

This research received no funding.

Institutional Review Board Statement

This study has received approval from the IRB unit at the Faculty of Engineering, Ain Shams University, Cairo, under the code IRB-ASU-26-022, which can be tracked: https://eng.asu.edu.eg/public/irb/inquiry (access date: 26 March 2026). For clarity, this study complies with the principles of the Declaration of Helsinki regarding the conduct of research involving human participants outside the medical field. In addition, the study adhered to the ethical guidelines established by the Faculty of Engineering at Ain Shams University, Cairo, available at: https://eng.asu.edu.eg/2064442 (access date: 26 March 2026). According to these guidelines, Institutional Review Board (IRB) approval in the Faculty of Engineering, Ain Shams University, is not mandatory for this type of survey-based research (as this study is an exempt survey) prior to submission to any journal, and remains optional if the journal requires it.

Informed Consent Statement

Informed consent was obtained from all subjects involved in the study. We obtain consent while filling out the online survey. Consent has been obtained from the participants to publish the results of their responses in this manuscript.

Data Availability Statement

All data and associated materials with this study are in Appendix A and Appendix B.

Acknowledgments

The authors express their gratitude to the guest editors and reviewers for their dedication to the review of this study.

Conflicts of Interest

The second author (A.E.), co-founder and manager of the IRB unit at the Faculty of Engineering, Ain Shams University, confirms that she was not involved in the review or evaluation of the research proposal submitted via the institutional IRB system. The authors declare no conflicts of interest.

Abbreviations

The following abbreviations are used in this manuscript:
ABMAgent-Based Modeling
BDIBelief–Desire–Intention
CCTVClosed-Circuit Television
CRCConflicts Rate per Crossing
GAMAGIS Agent-Based Modeling Architecture
GISGeographic Information System
LMICsLow- Middle-Income Countries
MAT SimMulti-agent transport simulation
SUMOSimulation of urban mobility
SDGsSustainable Development Goals

Appendix A

Appendix A describes the parameters correlation table, which can be tracked from the following link: https://www.mediafire.com/file/woxlr6edbzpgdo4/variables_correlation.xlsx/file (access date: 1 April 2026).

Appendix B

Appendix B represents a comparison table between different software tools used in agent-based modeling.
Table A1. Comparison of agent-based modeling platforms. Source: The authors.
ToolModeling ApproachMain ApplicationStrengthsLimitationsSuitability for This Research
GAMA PlatformAgent-Based Modeling (ABM) with GIS integrationUrban systems, pedestrian–vehicle interaction, environmental simulationsStrong GIS integration, supports complex agent behaviors, handles large datasets, open-source, customizable modeling environmentRequires programming knowledge; moderate learning curveHighly suitable. Enables modeling of pedestrian–vehicle interactions, integration of spatial data, and simulation of behavioral dynamics relevant to people-oriented street analysis.
VISSIMMicroscopic traffic simulationTraffic flow, vehicle operations, signal control analysisHigh accuracy for vehicle traffic simulation, widely used in transportation engineering, strong visualization toolsLimited behavioral modeling of pedestrians; less flexible for custom agent behaviorsSuitable mainly for vehicle traffic analysis, but less appropriate for integrated pedestrian behavior modeling.
Depth MapSpace syntax analysisSpatial configuration analysis, pedestrian movement predictionStrong spatial analysis capabilities, useful for accessibility and movement patternsNot an ABM platform; cannot simulate dynamic interactions between pedestrians and vehiclesUseful for spatial configuration analysis, but unsuitable for behavioral simulation.
Net LogoAgent-Based ModelingSocial systems, educational simulations, behavioral modelsEasy to learn, good for conceptual models, extensive community supportLimited GIS capabilities, less efficient for large-scale spatial modelsSuitable for simple ABM experiments, but less effective for complex urban spatial modeling.
MAT SimMulti-agent transport simulationLarge-scale transportation systems and travel demand modelingEfficient for large transportation networks, strong for policy and mobility scenariosFocuses mainly on travel demand and network flows rather than detailed pedestrian interactionsSuitable for regional mobility modeling, but less appropriate for micro-scale pedestrian behavior analysis.
Any LogicMulti-method simulation (ABM, system dynamics, discrete event)Logistics, transportation systems, business simulationsPowerful modeling environment with multiple simulation approachesCommercial software, limited accessibility for academic research without licenseUseful for complex simulations, but less accessible and less specialized for urban pedestrian analysis.

References

  1. Baeza, J.L.; Carpio-Pinedo, J.; Sievert, J.; Landwehr, A.; Preuner, P.; Borgmann, K.; Avakumović, M.; Weissbach, A.; Bruns-Berentelg, J.; Noennig, J.R. Modeling pedestrian flows: Agent-based simulations of pedestrian activity for land use distributions in urban developments. Sustainability 2021, 13, 9268. [Google Scholar] [CrossRef] [Scilit]
  2. Abusaada, H.; Elshater, A. Revisiting urban street planning and design factors to promote walking as a physical activity for middle-class individuals with metabolic syndrome in Cairo, Egypt. Int. J. Environ. Res. Public Health 2024, 21, 402. [Google Scholar] [CrossRef] [Scilit] [PubMed]
  3. Zhang, J.; Li, Y.; Fukuda, T.; Wang, B. Urban safety perception assessments via integrating multimodal large language models with street view images. Cities 2025, 165, 106122. [Google Scholar] [CrossRef] [Scilit]
  4. Abusaada, H.; Elshater, A. Decoding near synonyms in pedestrianization research: A numerical analysis and summative approach. Urban Sci. 2024, 8, 45. [Google Scholar] [CrossRef] [Scilit]
  5. Tzouras, P.G.; Batista, M.; Kepaptsoglou, K.L.; Vlahogianni, E.I.; Friedrich, B. Can we all coexist? An empirical analysis of drivers’ and pedestrians’ behavior in four different shared space road environments. Cities 2023, 141, 104477. [Google Scholar] [CrossRef] [Scilit]
  6. World Health Organization (WHO). Global Status Report on Road Safety; World Health Organization: Geneva, Switzerland, 2018. [Google Scholar]
  7. Hagos, K.G.; Adnan, M.; Yasar, A.U.H. Effect of sidewalk vendors on pedestrian movement characteristics: A microscopic simulation study of Addis Ababa, Ethiopia. Cities 2020, 103, 102769. [Google Scholar] [CrossRef] [Scilit]
  8. Anciaes, P.R.; Jones, P. The mismatch between street design and pedestrian preferences: Insights for equitable transport planning. J. Urban Des. 2021, 26, 1025–1044. [Google Scholar]
  9. Ayoush, P.; Dorina, P. Barriers to the pedestrianization of city centres: Perspectives from the Global North and the Global South. J. Urban Des. 2018, 23, 142–160. [Google Scholar]
  10. Zhu, Y. Assessment of the stopping for right-turning large vehicles policy in Nanjing: Effectiveness and determinants. PLoS ONE 2025, 20, e0319115. [Google Scholar] [CrossRef] [Scilit]
  11. Poon, J.; Wong, Y.D. Attitudes and behaviour of elderly in cognisance of transport safety when navigating pedestrian facilities. Accid. Anal. Prev. 2025, 209, 107807. [Google Scholar] [CrossRef] [Scilit]
  12. Ahmed, N.; Elshater, A.; Afifi, S. The Community Participation in the Design Process of Livable Streets. In Proceedings of the Innovations and Interdisciplinary Solutions for Underserved Areas, Cairo, Egypt, 14–15 February 2019. [Google Scholar]
  13. Yadav, A.; Kumari, R. Gender safety perspective in urban planning: The case of pedestrian mobility in Kanpur city. Cities 2024, 147, 104845. [Google Scholar] [CrossRef] [Scilit]
  14. Qi, Z.; Li, J.; Yang, X.; He, Z. How streetscape shapes affect visitor emotions: An experimental analysis based on large-scale street view images in Xi’an, China. Cities 2026, 168, 106424. [Google Scholar] [CrossRef] [Scilit]
  15. Rui, J.; Othengrafen, F. Examining the Role of Innovative Streets in enhancing urban mobility and livability for sustainable urban transition: A review. Sustainability 2023, 15, 5709. [Google Scholar] [CrossRef] [Scilit]
  16. Naseri, H.; Ciari, F.; Cloutier, M.-S.; Patwary, A.U.Z. Barriers to car-free streets: Identifying opponents of pedestrianization in Montreal. Cities 2025, 165, 106178. [Google Scholar] [CrossRef] [Scilit]
  17. Wang, Y.; Srinivasan, A.R.; Jokinen, J.P.; Oulasvirta, A.; Markkula, G.M. Pedestrian crossing decisions can be explained by bounded optimal decision-making under noisy visual perception. Transp. Res. Part C Emerg. Technol. 2025, 171, 104963. [Google Scholar] [CrossRef] [Scilit]
  18. Szagala, P.; Brzezinski, A.; Kiec, M.; Budzynski, M.; Wachnicka, J.; Pazdan, S. Pedestrian safety at midblock crossings on dual carriageway roads in Polish cities. Sustainability 2022, 14, 5703. [Google Scholar] [CrossRef] [Scilit]
  19. Saleh, W.; Grigorova, M.; Elattar, S. Pedestrian road crossing at uncontrolled mid-block locations: Does the refuge island Increase risk? Sustainability 2020, 12, 4891. [Google Scholar] [CrossRef] [Scilit]
  20. El-Bardisy, N.; Elshater, A.; Afifi, S.; Alfiky, A. Predicting traffic sound levels in Cairo before, during, and after the COVID-19 lockdown using Predictor-LimA software. Ain Shams Eng. J. 2024, 14, 102088. [Google Scholar] [CrossRef] [Scilit]
  21. Wael, S.; Elshater, A.; Afifi, S. Mapping user experiences around transit stops using computer vision technology: Action priorities from Cairo. Sustainability 2022, 14, 11008. [Google Scholar] [CrossRef] [Scilit]
  22. Perel, P.; Ker, K.; Ivers, R.; Blackhall, K. Road safety in low- and middle-income countries: A neglected research area. Inj. Prev. 2007, 13, 227–233. [Google Scholar] [CrossRef] [Scilit]
  23. Elsayed, M.; Elshater, A.; Shehayeb, D.F.M.; Afifi, S. Exploring the restorative environments in Bratislava using EEG and VR: A neuro-urbanism approach. Archnet-IJAR Int. J. Archit. Res. 2025, 19, 666–688. [Google Scholar] [CrossRef] [Scilit]
  24. Godthelp, H.; Wesemann, P.; Stipdonk, H.L.; King, M. Capacity building for road safety in LMICs: The need for a sustainable local knowledge and research infrastructure. Traffic Saf. Res. 2024, 8, e000063. [Google Scholar] [CrossRef] [Scilit]
  25. Staton, C.; Vissoci, J.; Gong, E.; Toomey, N.; Abdelgadir, R.; Zahou, J.; Liu, C.; Pei, F.; Zick, B. Road traffic injury prevention Initiatives: A systematic review and meta summary of effectiveness in low and middle income countries. PLoS ONE 2016, 11, e0150150. [Google Scholar] [CrossRef] [Scilit] [PubMed]
  26. Flannigan, S.; Khayesi, M. Content analysis of reported activities of the United Nations Road Safety Collaboration Members during the decade of action for road safety 2011–2020. BMJ Open 2021, 5, e042409. [Google Scholar] [CrossRef] [Scilit]
  27. Panahi, N.; Tavakoli, N.; Sarvestani, K.K. Women’s walking behavior: Investigating contributing factors in urban contexts. Cities 2026, 168, 106467. [Google Scholar] [CrossRef] [Scilit]
  28. Muley, D.; Kharbeche, M.; Downey, L.; Saleh, W.; Al-Salem, M. Road users’ behavior at marked crosswalks on channelized right-turn lanes at intersections in the State of Qatar. Sustainability 2019, 11, 5699. [Google Scholar] [CrossRef] [Scilit]
  29. Ahmed, N.; Elshater, A.; Afifi, S.; El-Bardisiy, W.M. Scoping review for people-oriented development reaching planning and design factors in urban streets. Al-Qadisiyah J. Eng. Sci. 2026, 19, 1–13. [Google Scholar]
  30. Yao, S.; Wang, N.; Wu, J. How does the built environment affect pedestrian perception of road safety on sidewalks? Evidence from eye-tracking experiments. Transp. Res. Part F Traffic Psychol. Behav. 2025, 110, 57–73. [Google Scholar] [CrossRef] [Scilit]
  31. Yang, Y.; Wang, Y.; Easa, S.M.; Zheng, X. Analyzing pedestrian behavior at unsignalized crosswalks from the drivers’ perspective: A qualitative study. Appl. Sci. 2022, 12, 4017. [Google Scholar] [CrossRef] [Scilit]
  32. Gerike, R.; Koszowski, C.; Schröter, B.; Buehler, R.; Schepers, P.; Weber, J.; Wittwer, R.; Jones, P. Built environment determinants of pedestrian activities and their consideration in urban street design. Sustainability 2021, 13, 9362. [Google Scholar] [CrossRef] [Scilit]
  33. Angulo, A.V.; Robartes, E.; Guo, X.; Chen, T.D.; Heydarian, A.; Smith, B.L. Evaluating current and future pedestrian mid-block crossing safety treatments using virtual reality simulation. Accid. Anal. Prev. 2024, 206, 107715. [Google Scholar] [CrossRef] [Scilit]
  34. Abusaada, H.; Elshater, A. Improving visitor satisfaction in Egypt’s Heliopolis historical district. J. Eng. Appl. Sci. 2021, 68, 19. [Google Scholar] [CrossRef] [Scilit]
  35. Yassin, H.H. Livable city: An approach to pedestrianization through tactical urbanism. Alex. Eng. J. 2019, 58, 251–259. [Google Scholar] [CrossRef] [Scilit]
  36. Raida, A.; Hosseini, A.; Cárdenas, C.D.; Heydarian, A.; Chen, T.D. What affects pedestrian street crossing decisions in day and night scenarios? A case study in Charlottesville, Virginia. Transp. Res. Part F Traffic Psychol. Behav. 2025, 115, 103362. [Google Scholar] [CrossRef] [Scilit]
  37. Rashed, R. From concept to action: Active mobility cards for collective spaces in block-system urban neighborhoods. Ain Shams Eng. J. 2025, 16, 103771. [Google Scholar] [CrossRef] [Scilit]
  38. Yendra, D.; Watson-Brown, N.; Haworth, N. A comparison of factors influencing the safety of pedestrians accessing bus stops in countries of differing income levels. Accid. Anal. Prev. 2024, 207, 107725. [Google Scholar] [CrossRef] [Scilit]
  39. United Nations. Transforming Our World: The 2030 Agenda for Sustainable Development (Resolution A/RES/70/1); United Nations: New York, NY, USA, 2015. [Google Scholar]
  40. Pechteep, P.; Luathep, P.; Jaensirisak, S.; Kronprasert, N. Analysis of factors influencing driver yielding behavior at midblock crosswalks on urban arterial roads in Thailand. Sustainability 2024, 16, 4118. [Google Scholar] [CrossRef] [Scilit]
  41. Sabi Boun, S.; Janvier, R.; Jean Marc, R.E.; Paul, P.; Senat, R.; Demes, J.A.E.; Burigusa, G.; Chaput, S.; Maurice, P.; Druetz, T. Environmental measures to improve pedestrian safety in low- and middle-income countries: A scoping review. Glob Health Promot 2024, 31, 44–55. [Google Scholar] [CrossRef] [Scilit]
  42. Altwaijri, S.; Alotaibi, S.; Alosaimi, F.; Almutairi, A.; Alauany, A. A multi-model machine learning framework for predicting and ranking high-risk urban intersections in Riyadh. Sustainability 2026, 18, 3651. [Google Scholar] [CrossRef] [Scilit]
  43. Mukherjee, D.; Mitra, S. What affects pedestrian crossing difficulty at urban intersections in a developing country? IATSS Res. 2022, 46, 586–601. [Google Scholar] [CrossRef] [Scilit]
  44. Loo, B. Walking towards a happy city. J. Transp. Geogr. 2021, 93, 103078. [Google Scholar] [CrossRef] [Scilit]
  45. Gitelman, V.; Sharon, A. An Examination of pedestrian crossing behaviors at signalized intersections with bus priority routes. Sustainability 2025, 17, 457. [Google Scholar] [CrossRef] [Scilit]
  46. McIlroy, R.C.; Nam, V.H.; Bunyasi, B.W.; Jikyong, U.; Kokwaro, G.O.; Wu, J.; Hoque, M.S.; Plant, K.L.; Preston, J.M.; Neville, A. Stanton, Exploring the relationships between pedestrian behaviours and traffic safety attitudes in six countries. Transp. Res. Part F Traffic Psychol. Behav. 2020, 68, 257–271. [Google Scholar] [CrossRef] [Scilit]
  47. Densu, S.N.; Brijs, K.; Polders, E.; Janssens, D.; Brijs, T.; Pirdavani, A. Bus stop environment and pedestrian crash risk in Kumasi, Ghana: Implications for safe and sustainable urban mobility. Sustainability 2026, 18, 3437. [Google Scholar] [CrossRef] [Scilit]
  48. Song, L.; Wang, W.; Liu, Q.; Bi, R.; Xu, X. Towards sustainable urban mobility: An experimental study on vibration and noise of elevated rail Transit at different train speeds. Sustainability 2026, 18, 3296. [Google Scholar] [CrossRef] [Scilit]
  49. Abusaada, H.; Elshater, A. Cairenes’ storytelling: Pedestrian scenarios as a normative factor when enforcing street changes in residential areas. Soc. Sci. 2023, 12, 278. [Google Scholar] [CrossRef] [Scilit]
  50. El-Sherbiny, Y.M. Design of urban traffic areas. J. Eng. Appl. Sci. 2011, 6, 1–7. [Google Scholar]
  51. Maarouf, N.M.; El-Alfy, A.H. An approach towards solving pedestrian problems in modern Cairo. J. Appl. Sci. Res. 2012, 8, 144–156. [Google Scholar]
  52. Hamad, S.; El Din, H. Towards Sustainable Cities and Communities: Right of Use of Sidewalks in Cairo. In Design for Resilient Communities: UIA 2023; Sustainable Development Goals Series; Springer: Cham, Switzerland, 2023; pp. 3–14. [Google Scholar]
  53. El-Razik, M.A.; Hafez, Y.; Hendy, A.; Fawzy, M. Methodology for microclimatic urban canyon design case study surrounding MUST university campus in Cairo. HBRC J. 2024, 20, 589–603. [Google Scholar] [CrossRef] [Scilit]
  54. Abdullah, M.; Shafik, Z.; El-Kerdany, D. General theory of walkability as criteria for regenerating Maadi as a walkable neighborhood. J. Eng. Res. 2019, 162, 60–75. [Google Scholar] [CrossRef] [Scilit]
  55. Banerjee, A.; Maurya, A.K.; Lämmel, G. A review of pedestrian flow characteristics and level of service over different pedestrian facilities. Collect. Dyn. 2018, 3, 1–52. [Google Scholar]
  56. Ezzati Amini, R.; Katrakazas, C.; Antoniou, C. Negotiation and decision-making for a pedestrian roadway crossing: A literature review. Sustainability 2019, 11, 6713. [Google Scholar] [CrossRef] [Scilit]
  57. Abusaada, H.; Elshater, A. Effects of urban atmospheres on changing attitudes of crowded public places: An action plan. Int. J. Community Well-Being 2020, 3, 109–159. [Google Scholar] [CrossRef] [Scilit]
  58. Crooks, A.; Castle, C.E.; Batty, M. Key challenges in agent-based modelling for geo-spatial simulation. Comput. Environ. Urban Syst. 2008, 32, 417–430. [Google Scholar] [CrossRef] [Scilit]
  59. Sadeek, S.N.; Rahman, M.H.; Rifaat, S.M. Understanding pedestrian bridge usage considering perception and socio-demographic characteristics of the road users in Dhaka city. Transp. Res. Interdiscip. Perspect. 2025, 31, 101384. [Google Scholar] [CrossRef] [Scilit]
  60. Sheng, Q.; Jiao, J.; Pang, T. Understanding the impact of street patterns on pedestrian distribution: A case study in Tianjin, China. Urban Rail Transit 2021, 7, 209–225. [Google Scholar] [CrossRef] [Scilit]
  61. Cochran, W.G. Sampling Techniques; John Wiley & Sons: New York, NY, USA, 1977. [Google Scholar]
  62. Megahed, G.; Elshater, A.; Afifi, S.M. Competencies urban planning students need to succeed in professional practices: Lessons learned from Egypt. Archnet-IJAR 2018, 14, 267–287. [Google Scholar] [CrossRef] [Scilit]
  63. Elshater, A.; Abusaada, H.; Tarek, M.; Afifi, S. Designing the socio-spatial context urban infill, liveability, and conviviality. Built Environ. 2022, 48, 341–363. [Google Scholar] [CrossRef] [Scilit]
  64. Bonabeau, E. Agent-based modeling: Methods and techniques for simulating human systems. Proc. Natl. Acad. Sci. USA 2002, 99, 7280–7287. [Google Scholar] [CrossRef] [Scilit]
  65. Lakmali, R.G.N.; Genovese, P.V.; Abewardhana, A.A.B.D.P. Evaluating the efficacy of agent-based modeling in analyzing pedestrian dynamics within the built environment: A comprehensive systematic literature review. Buildings 2024, 14, 1945. [Google Scholar] [CrossRef] [Scilit]
  66. Wu, H.; Liu, L.; Yu, Y.; Peng, Z.; Jiao, H.; Niu, Q. An Agent-based Model Simulation of Human Mobility Based on Mobile Phone Data: How Commuting Relates to Congestion. ISPRS Int. J. Geo-Inf. 2019, 8, 313. [Google Scholar] [CrossRef] [Scilit]
  67. Yang, S.; Dane, G.Z.; Arentze, T.A. An agent-based model to simulate pedestrians’ affective experiences and activities for evaluating urban public space design. Cities 2025, 166, 106292. [Google Scholar] [CrossRef] [Scilit]
  68. Crooks, A.T.; Heppenstall, A.J. Introduction to agent-based modeling. In Agent-Based Models of Geographical Systems; Springer: Dordrecht, The Netherlands, 2012; pp. 85–105. [Google Scholar]
  69. Chauhan, S.; Dave, S.; Shah, J.; Kedia, A. Assessing Traffic Characteristics for Safe Pedestrian Crossings: Developing Warrants for Sustainable Urban Safety. Sustainability 2024, 16, 4182. [Google Scholar] [CrossRef] [Scilit]
  70. Serena, L.; Marzolla, M.; D’Angelo, G.; Ferretti, S. A review of multilevel modeling and simulation for human mobility and behavior. Simul. Model. Pract. Theory 2023, 127, 102780. [Google Scholar] [CrossRef] [Scilit]
  71. Ma, L.; Brandt, S.A.; Seipel, S.; Ma, D. Simple agents–complex emergent path systems: Agent-based modelling of pedestrian movement. Environ. Plan. B Urban Anal. City Sci. 2023, 51, 479–495. [Google Scholar] [CrossRef] [Scilit]
  72. Yannis, G.; Golias, J.; Papadimitriou, E. Modeling crossing behavior and accident risk of pedestrians. J. Transp. Eng. 2007, 133, 634–644. [Google Scholar] [CrossRef] [Scilit]
  73. Viale, R. Behavioral city. Front. Built Environ. 2025, 10, 1501853. [Google Scholar] [CrossRef] [Scilit]
  74. Uthpala, N.; Hansika, N.; Dissanayaka, S.; Tennakoon, K.; Dharmarathne, S.; Vidanarachchi, R.; Alawatugoda, J.; Herath, D. Analyzing transportation mode interactions using agent-based models. SN Appl. Sci. 2023, 5, 357. [Google Scholar] [CrossRef] [Scilit]
  75. Krajzewicz, D.; Erdmann, J.; Behrisch, M.; Bieker, L. Recent development and applications of SUMO–Simulation of Urban Mobility. Int. J. Adv. Syst. Meas. 2012, 5, 128–138. [Google Scholar]
  76. Burdzik, R.; Simiński, D.; Kruszewski, M.; Niedzicka, A.; Gąsiorek, K.; Zabieva, A.; Mamala, J.; Dębicka, E. Designing and Planning of Studies of Driver Behavior at Pedestrian Crossings Using Whole-Vehicle Simulators. Appl. Sci. 2024, 14, 4217. [Google Scholar] [CrossRef] [Scilit]
  77. Taillandier, P.; Vo, D.A.; Amouroux, E.; Drogoul, A. GAMA: A simulation platform that integrates GIS, agent-based modeling and multi-scale control. In Complex Systems Modeling and Simulation in Infrastructure and Environmental Engineering; Springer: Berlin/Heidelberg, Germany, 2019. [Google Scholar]
  78. Saval, A.; Minh, D.P.; Chapuis, K.; Tranouez, P.; Caron, C.; Daudé, É. Dealing with mixed and non-normative traffic. An agent-based simulation with the GAMA platform. PLoS ONE 2023, 18, e0281658. [Google Scholar] [CrossRef] [Scilit]
  79. Gilbert, N.; Troitzsch, K. Simulation for the Social Scientist; Open University Press: London, UK, 2005. [Google Scholar]
  80. Taillandier, P.; Gaudou, B.; Grignard, A.; Huynh, Q.-N.; Marilleau, N.; Caillou, P.P.; Philippon, D.; Drogoul, A. Building, composing and experimenting complex spatial models with the GAMA platform. Geoinformatica 2019, 23, 299–322. [Google Scholar] [CrossRef] [Scilit]
  81. Caillou, P.; Gaudou, B.; Grignard, A.; Truong, C.Q.; Taillandier, P. A Simple-to-Use BDI Architecture for Agent-Based Modeling and Simulation. In Advances in Social Simulation 2015; Springer: Berlin/Heidelberg, Germany, 2017. [Google Scholar]
  82. Sparnaaij, M.; Duives, D.C. Chapter Nine-Calibration, validation & verification. Adv. Transp. Policy Plan. 2025, 15, 297–348. [Google Scholar]
  83. Bank, W. Cairo Traffic Congestion Study; World Bank: Cairo, Egypt, 2011. [Google Scholar]
  84. Tian, K.; Tzigieras, A.; Wei, C.; Lee, Y.M.; Holmes, C.; Leonetti, M.; Merat, N.; Romano, R.; Markkula, G. Deceleration parameters as implicit communication signals for pedestrians’ crossing decisions and estimations of automated vehicle behaviour. Accid. Anal. Prev. 2023, 190, 107173. [Google Scholar] [CrossRef] [Scilit] [PubMed]
  85. Helbing, D.; Molnár, P. Social force model for pedestrian dynamics. Phys. Rev. E 1995, 51, 4282–4286. [Google Scholar] [CrossRef] [Scilit] [PubMed]
  86. Yannis, G.; Papadimitriou, E.; Theofilatos, A. Pedestrian gap acceptance for mid-block street crossing. Transp. Plan. Technol. 2013, 36, 450–462. [Google Scholar] [CrossRef] [Scilit]
  87. Hussein, M.; Sayed, T. Validation of an agent-based microscopic pedestrian simulation model in a crowded pedestrian walking environment. Transp. Plan. Technol. 2018, 42, 1–22. [Google Scholar] [CrossRef] [Scilit]
  88. Khogali, M.M.E.; Ali, E.A.M.; Ramdani, A. Integrating behavioral science into urban planning: A framework for human-centered spatial design. Front. Psychol. 2025, 16, 1632523. [Google Scholar] [CrossRef] [Scilit]
  89. Kim, Y.; Choi, B.; Choi, M.; Ahn, S.; Hwang, S. Enhancing pedestrian perceived safety through walking environment modification considering traffic and walking infrastructure. Front Public Health 2024, 11, 1326468. [Google Scholar] [CrossRef] [Scilit]
  90. Silva, C.; Xue, S. Situating spatial determinism in urban design and planning for sustainable walkability: A simulation of street morphology and pedestrian behaviour. Discov. Sustain. 2024, 5, 212. [Google Scholar] [CrossRef] [Scilit]
  91. Hamidi, S.; Moazzeni, S. Examining the relationship between urban design qualities and walking behavior: Empirical evidence from Dallas, TX. Sustainability 2019, 11, 2720. [Google Scholar] [CrossRef] [Scilit]
  92. Mu, X.; Mu, L.; Zhang, J. The impact of street elements on pedestrian stopping behavior in commercial pedestrian streets from the perspective of commercial vitality. Sustainability 2024, 16, 7727. [Google Scholar] [CrossRef] [Scilit]
  93. Lawrence, P.J.; Pellacini, V.; Blackshields, D. The Development of Pedestrian Gap Acceptance and Midblock Pedestrian Road Crossing Behavior Utilizing SUMO. In Proceedings of the SUMO User Conference 2021, Online, 13–15 September 2021. [Google Scholar]
  94. Soares, F.; Pereira, F.; Faria, S.; Sousa, E.; Almeida, R.; Freitas, E. Pedestrian behavior in static and dynamic virtual road crossing experiments. Appl. Syst. Innov. 2024, 7, 94. [Google Scholar] [CrossRef] [Scilit]
Figure 1. The geographical location of the case area at multiple spatial scales: (a) Egypt, (b) Cairo, and (c) Abbas El Akkad Street. Source: The authors based on Apple Inc. Maps of its Version 3.0 (2911.20.7.24.5).
Sustainability 18 04122 g001
Figure 2. The four phases of data collection, preparation, modeling, and validation. Source: The authors.
Sustainability 18 04122 g002
Figure 3. Street map showing pedestrian crossing zones along Abbas El-Akkad Street with video recording spots. Source: The authors.
Sustainability 18 04122 g003
Figure 4. ABM simulation for pedestrian safety workflow. Source: The authors.
Sustainability 18 04122 g004
Figure 5. Abbas El-Akkad Street has mixed uses. Source: The authors.
Sustainability 18 04122 g005
Figure 6. Street uses and activities on the ground floor level. Source: The authors.
Sustainability 18 04122 g006
Figure 7. Observations images show signalized traffic lights on both sides of the street, a speed bump, a crossing signal, and street vendors in Abbass El-Akkad Street. The red-dotted rectangle shows the informal activities involved in crossing the street. Source: The authors.
Sustainability 18 04122 g007
Figure 8. Survey results showing respondents’ preferred crossing locations in formal and informal zones (left), and the types of street crossing facilities used (right). Values represent the percentage of responses. Source: The authors.
Sustainability 18 04122 g008
Figure 9. Validating the simulation by comparing pedestrian flow over time with video recording data (left) and with survey data (right). Source: The authors.
Sustainability 18 04122 g009
Figure 10. Heatmap of pedestrian flow generated using GIS from GAMA results. Pedestrian flow intensity (range: 7.6–30.4 ped/min). Source: The authors.
Sustainability 18 04122 g010
Figure 11. The ABM pedestrian mobility model in the GAMA interface for the experiment in Abbas El-Akkad Street. Source: The authors.
Sustainability 18 04122 g011
Figure 12. Conflict Rate per Crossing (CRC) generated from the ABM simulation in Abbas El-Akkad Street between pedestrians and vehicles (Y-axis) and simulation run time (X-axis, per minute). Source: The authors.
Sustainability 18 04122 g012
Figure 13. Scatter charts show the relationships among pedestrian crossing variables, including correlation coefficients and regression equations, aligned with the correlation heat map. Source: The authors.
Sustainability 18 04122 g013
Figure 14. The simulation results, interpretation, and actions framework. Source: The authors.
Sustainability 18 04122 g014
Figure 15. Seven actionable strategies for implementing a safer, sustainable urban form. Source: The authors.
Sustainability 18 04122 g015
Disclaimer/Publisher’s Note: The statements, opinions and data contained in all publications are solely those of the individual author(s) and contributor(s) and not of MDPI and/or the editor(s). MDPI and/or the editor(s) disclaim responsibility for any injury to people or property resulting from any ideas, methods, instructions or products referred to in the content.