1. Introduction
The rapid growth in resource consumption, coupled with escalating environmental pressures, has intensified global interest in sustainable cascade utilization. Cascade utilization refers to the sequential reuse of products, components, or materials across multiple life cycles, in which each subsequent use requires lower performance while still retaining residual value [
1]. As a key strategy within the circular economy and closed-loop supply chains (CLSCs), cascade utilization plays an important role in reducing environmental burdens and improving resource efficiency. In the battery sector, for instance, remanufacturing based on recovered modules and casings can reduce lifecycle carbon emissions by more than 90% compared with the production of new batteries [
2], while hydrometallurgical recycling can decrease the global warming potential of battery production by approximately 39% [
3]. These findings underscore the substantial environmental benefits of recovery activities. However, achieving higher levels of sustainability requires not only increasing collection volumes but also improving the allocation of recovered products toward higher-value utilization pathways, such as remanufacturing, rather than direct material recycling.
Despite its environmental and economic advantages, remanufacturing within cascade utilization remains strategically complex. Heterogeneity in the quality of returned products, together with the interaction between remanufacturing activities and original equipment manufacturers’ (OEMs) market interests, creates significant operational challenges. As remanufacturing scales up, an increasing proportion of low-quality returns enters the system, leading to higher and more uncertain quality restoration costs. This raises important questions regarding the incentives for remanufacturers to expand recovery activities under cost heterogeneity, market competition between new and remanufactured products, and the availability of alternative recovery options such as material recycling within CLSCs. At the same time, the growing involvement of third-party remanufacturers (TPRs) introduces additional strategic considerations. Prior studies have shown that remanufactured products may cannibalize new product sales, thereby influencing the decisions of both OEMs and TPRs [
4,
5]. In response, some OEMs strategically restrict remanufacturing by controlling the collection of used products. For example, Bosch retrieves end-of-use products and either disposes of or recycles them to limit third-party remanufacturing [
4]. While the existing research has examined the role of different collection agents, the combined effects of collector heterogeneity and restoration cost heterogeneity on cascade utilization decisions and sustainability performance remain underexplored. In particular, when cascade utilization is explicitly incorporated into CLSCs, the optimal strategic interactions between OEMs and TPRs warrant further investigation.
Government policy plays a pivotal role in supporting CLSCs. In China, both central and local governments have introduced a range of subsidy schemes to promote the proper treatment of vehicle batteries. For example, Jingmen (Hubei) provides a subsidy of 50 yuan per ton for the collection of used new-energy vehicle battery packs [
6]. Several provinces and municipalities also offer financial incentives to support the development of a remanufacturing industry for spent batteries [
7]. At the national level, the State Council has actively promoted the cascade utilization of power batteries, emphasizing the reuse of retired batteries across multiple life cycles [
8]. Despite these policy efforts, the effectiveness of different subsidy instruments in shaping cascade utilization decisions within CLSCs remains unclear. Against this backdrop, it is increasingly important to systematically evaluate and compare these policies from the perspective of cascade utilization. Building on the above discussion, this study addresses the following research questions:
(1) When cascade utilization is feasible, what are the optimal strategies for the manufacturer and the TPR within the CLSC?
(2) How does the type of collector influence the TPR’s cascade utilization strategy under constant versus heterogeneous quality restoration costs, and under what conditions are environmental outcomes optimized across different indicators?
(3) How do collection and remanufacturing subsidies affect the cascade utilization ratio, and through what mechanisms do their impacts differ?
To address these gaps, this study endogenizes cascade utilization decisions within a CLSC framework. By incorporating third-party remanufacturing, we examine three channel structures: a centralized (OC/TC) model, a manufacturer-led collection (OMC/TMC) model, and a third-party collection (OPC/TPC) model. For each structure, we further consider two scenarios that capture differences in quality restoration costs: a constant restoration cost scenario (O) and a heterogeneous restoration cost scenario (T). While the electric vehicle battery sector provides an important motivating context, the analytical framework developed in this study is general and applicable to a broad class of CLSCs with cascade utilization. The electric vehicle battery example is primarily used to illustrate environmental parameter settings and highlight the environmental relevance of remanufacturing and recycling. Therefore, the insights derived from the model extend beyond the electric vehicle battery industry to other products with similar recovery and reuse characteristics.
The results show that the relative performance of different structures depends on key economic conditions, such as material recycling revenue and the comparative advantage of remanufacturing. No single structure dominates across all operational and environmental dimensions. Manufacturer-led collection tends to promote new product sales, whereas third-party collection enhances remanufacturing and recovery levels, particularly under cost heterogeneity. Moreover, restoration cost heterogeneity plays a critical role in shaping collection incentives, recycling patterns, and overall environmental performance, and may alter the relative advantages of different collection structures. Policy analysis further reveals that both collection and remanufacturing subsidies generally increase recovery and remanufacturing levels but through distinct mechanisms. The collection subsidy expands return volumes while potentially reducing cascade utilization efficiency, whereas the remanufacturing subsidy promotes higher-value utilization pathways and is more effective—particularly in centralized systems—although its effectiveness diminishes under cost heterogeneity.
This study provides important managerial and policy insights into the design of sustainable collection and recovery systems. The effectiveness of collection strategies depends critically on restoration cost structures: cost heterogeneity weakens the incentives for manufacturer-led and centralized collection, while enhancing the resilience of third-party collection due to its volume-driven nature. Moreover, collection structures involve a fundamental trade-off between promoting new product sales and enhancing remanufacturing performance, implying that firms should align recovery strategies with both market priorities and cost conditions. From a policy perspective, the results indicate that different subsidy instruments operate through distinct mechanisms. This suggests that relying solely on collection incentives may be insufficient to achieve high-value circular economy outcomes, and that a balanced policy mix is more effective. Overall, the findings highlight the importance of jointly considering supply chain structure, cost uncertainty, and policy design to enhance resource efficiency and support sustainable consumption and production.
The remainder of this paper is organized as follows.
Section 2 reviews the relevant literature.
Section 3 presents the model assumptions and analytical framework, followed by a discussion of key parameter effects.
Section 4 compares the outcomes across different models and scenarios.
Section 5 evaluates environmental outcomes using three indicators.
Section 6 analyzes and compares the impacts of two subsidy schemes on the cascade utilization ratio.
Section 7 concludes.
2. Literature Review
This study is closely related to three literature streams, including CLSC management considering cascade utilization, third-party remanufacturing, and subsidy influence.
2.1. CLSC Management Considering Cascade Utilization
A variety of game-theoretic models have been formulated from different research perspectives to investigate interactions and strategic choices in CLSCs. Savaskan and Van Wassenhove [
9] examine the interaction between product recovery and pricing decisions in a competitive market setting. Qiu and Huang [
10] develop a CLSC model in which both the manufacturer and the retailer participate in product collection, assuming the roles of leader and follower, respectively. Atasu et al. [
11] explore two distinct cost structures that reflect economies and diseconomies of scale, and demonstrate that when collection costs exhibit diseconomies of scale, in-house recycling becomes the manufacturer’s optimal choice. Subsequent research has extended this framework to a wide range of contexts, such as consumer behavior [
12], recycling policies [
13], price competition [
14], transaction modes and recycling channels [
15], different channel leadership structures [
16], convenience investment strategies, and so forth [
17,
18].
From a product lifecycle perspective, resource recovery in closed-loop supply chains involves multiple pathways, including reuse, remanufacturing, and recycling. Among these, cascade utilization emphasizes the sequential allocation of recovered products to different value-retention stages, where higher-value options such as remanufacturing are preferred over lower-value material recycling [
19]. Cascade utilization significantly influences the revenue and environmental performance of CLSCs, thereby playing a critical role in the design of collection channels. Considering cascade utilization, Narang et al. [
20] develop a CLSC model in which retailers procure EV batteries from manufacturers and sell them to end consumers in the forward channel, while in the reverse channel, retired batteries are collected by retailers, third-party recyclers, and echelon firms, or through collaborative arrangements among them. Wen et al. [
21] develop a game-theoretic framework to analyze the recycler’s optimal design of collection channels and explore the interaction between channel configuration and government subsidy policies. Specifically, they examine subsidies that promote cascade utilization and mitigate online collection costs. Moreover, Zhang et al. [
1,
22] investigate power battery collection strategies by integrating carbon emissions and cascade utilization considerations. However, the literature has largely treated cascade utilization as an exogenous process and has paid limited attention to how product lifecycle considerations, such as quality degradation and recovery pathways, interact with supply chain structures and decision-making. In particular, the roles of collector heterogeneity and restoration cost heterogeneity in shaping lifecycle allocation decisions remain underexplored. This motivates the need for an integrated framework that explicitly links cascade utilization decisions with CLSC structures from a lifecycle perspective.
2.2. Third-Party Remanufacturing
Third-party remanufacturing has emerged as a predominant mode of remanufacturing due to various advantages, including economies of scale and the fact that original equipment manufacturers (OEMs) often lack the necessary infrastructure and technical expertise [
23,
24]. However, remanufactured products can erode the market share of new products, thereby affecting the decisions and performance of both OEMs and independent remanufacturers (IRs). Majumder and Groenevelt [
25] construct a game-theoretic framework to examine the interaction between an OEM and an IR, and conclude that the OEM benefits when the remanufacturing cost borne by the IR is higher. Ferguson and Toktay [
4] examine how a manufacturer can design its product recovery approach when facing potential competition in the remanufactured goods market and argue that the OEM can forestall competitor entry by proactively reclaiming end-of-life products. Bulmus et al. [
26] show that manufacturers tend to reduce new product output in the initial period when the cost advantage of remanufacturing diminishes. Wu and Zhou [
5] assess how the entry of remanufacturers affects OEM profitability, showing that OEMs without remanufacturing capabilities may actually benefit from such an entry, especially as the number of remanufacturers increases. Qiao and Su [
27] study pricing and quality decisions for remanufactured products serving two distinct customer groups. Wang et al. [
28] examine a retailer’s decision between in-house and outsourced remanufacturing, revealing that differences in variable remanufacturing costs are the key determinant. Fang et al. [
29] conclude that IRs are preferred when repair costs or quality expectations are high, with quality advantages playing a decisive role. They further examine environmental and consumer welfare impacts and identify conditions under which remanufacturing improves both. Xiao et al. [
30] analyze how green consumption subsidies influence OEM remanufacturing incentives and conclude that when green consumers are few, excessively high subsidies can trigger cannibalization and reduce OEMs’ total profits. Recognizing power asymmetries between OEMs and IRs, Cheng et al. [
31] develop a game-theoretic model based on three power structures and explore their effects on pricing decisions and coordination in authorized remanufacturing supply chains. Zhu et al. [
32] employ an authorized remanufacturing model to examine how OEMs and IRs adjust their production and sales strategies under differentiated and progressive tax systems. By incorporating third-party remanufacturing into the framework, this study evaluates CLSC performance under two conditions: constant versus heterogeneous quality restoration costs. It further examines how third-party remanufacturing strategies influence manufacturers’ collection decisions when cascade utilization is determined by the remanufacturer.
2.3. Influence of Subsidy on CLSC
Extensive research has examined the role of government policies in steering the behavior of CLSC actors and affecting environmental performance. Mitra and Webster [
33] evaluate how government subsidies can stimulate the remanufacturing industry in a two-period competition between a manufacturer and a remanufacturer. Toshimitsu [
34] develops a differentiated-product Cournot framework to analyze subsidy choices that balance environmental and welfare outcomes. Esenduran et al. [
35] examine OEM–remanufacturer competition under take-back regulations. Pazoki and Samarghandi [
36] explore how take-back regulations influence an OEM’s choice between remanufacturing and eco-design when consumers assign different values to new versus remanufactured products. Xu et al. [
37] analyze an OEM’s remanufacturing decisions under government take-back policies, emphasizing the need for effective end-of-life product management to reduce environmental impacts. Fang et al. [
38] examine how subsidizing the fixed costs of processing spent power batteries influences the optimal reverse channel configuration. Other studies compare different policy instruments. Shi et al. [
39] demonstrate that the strength of incentives and penalties affects firms’ willingness to cooperate. Sarabi et al. [
40] investigate consumer distrust regarding pricing and product greenness, as well as how carbon taxes and subsidies affect the performance of a CLSC. Guo et al. [
41] study how two types of subsidy schemes influence overall welfare and the earnings of supply chain participants, while Tang et al. [
42] compare scenarios without intervention, with subsidies, and with reward–penalty schemes, highlighting their respective environmental and socioeconomic impacts. Chu et al. [
43] explore coordination in a power battery CLSC involving manufacturers, automakers, and consumers, and analyze how four government subsidy schemes affect supply chain decisions. Zhang et al. [
44] find that subsidies improve profitability and consumer surplus, deposit–refund mechanisms ease fiscal burdens, and the effectiveness of reward–penalty policies hinges on their enforcement intensity. Distinct from prior work, this study examines and compares how two subsidy schemes influence cascade utilization strategies and outcomes in a CLSC involving different types of collectors.
In summary, this study makes three main contributions. First, it advances the CLSC literature by endogenizing cascade utilization decisions, which are typically treated as exogenous. By incorporating third-party remanufacturing into a unified analytical framework, the study reveals how different collection structures interact with decentralized remanufacturing decisions to shape cascade utilization outcomes. Second, the study introduces restoration cost heterogeneity by comparing constant and heterogeneous quality restoration cost settings. This extension captures more realistic remanufacturing conditions and provides new insights into how cost structures influence collection strategies and cascade utilization decisions. Third, the study systematically evaluates the effects of collection and remanufacturing subsidies across different collection structures. In doing so, it uncovers distinct policy mechanisms and provides novel insights into how subsidy design influences cascade utilization and environmental performance in CLSCs.
3. Model Assumptions and Development
Assumption 1. Only one collection channel is considered in this study, and consumers’ utility of returning a product depends on the offering price (v) and the residual value (r) (Table 1). Similar to Feng et al. [12], consumer utility is denoted by , and the residual value is in the range of [0, 1]. When , the consumers will return products, and the highest residual value of the collected products is equal to . Therefore, the collection quantity is derived as . And the collection cost is therefore given by . Assumption 2. Cascade utilization is considered for the collected products. The collected products will be provided for remanufacturing first at a transferring price ; then the remaining volumes will be all sent to material recycling at a revenue of R. Considering that the remanufacturing occupies a higher hierarchy, should always hold, and we set in the following analysis. represents the comparative revenue advantage of transferring products to remanufacturing over material recycling in cascade utilization.
Assumption 3. New and remanufactured products compete in price in the same market. Following the studies of [12,14,17,20,21,22,23,27,28,29,32,37,38,39] et al., we derive consumers’ utility function for new products as , and is the consumers’ willingness to pay that is uniformly distributed in the interval [0, 1]. Similarly, a discount rate () is assigned to the remanufactured products, and therefore, the utility function for remanufactured products is written as . When , and , consumers prefer to purchase the new products. When , and , the remanufactured products will be consumers’ preferred choice. In summary, the sales quantities of new and remanufactured products are denoted as , and respectively. Note that, should be held. Assumption 4. A third-party player undertakes the remanufacturing business solely, and decides the remanufactured quantity by setting the lowest residual value that is required for remanufacturing. Combining Assumption 1, the remanufacturing quantity is denoted as , and the quantity of collected products left for material recycling is . Given Assumption 3, we obtain . Combining with , it is derived that and .
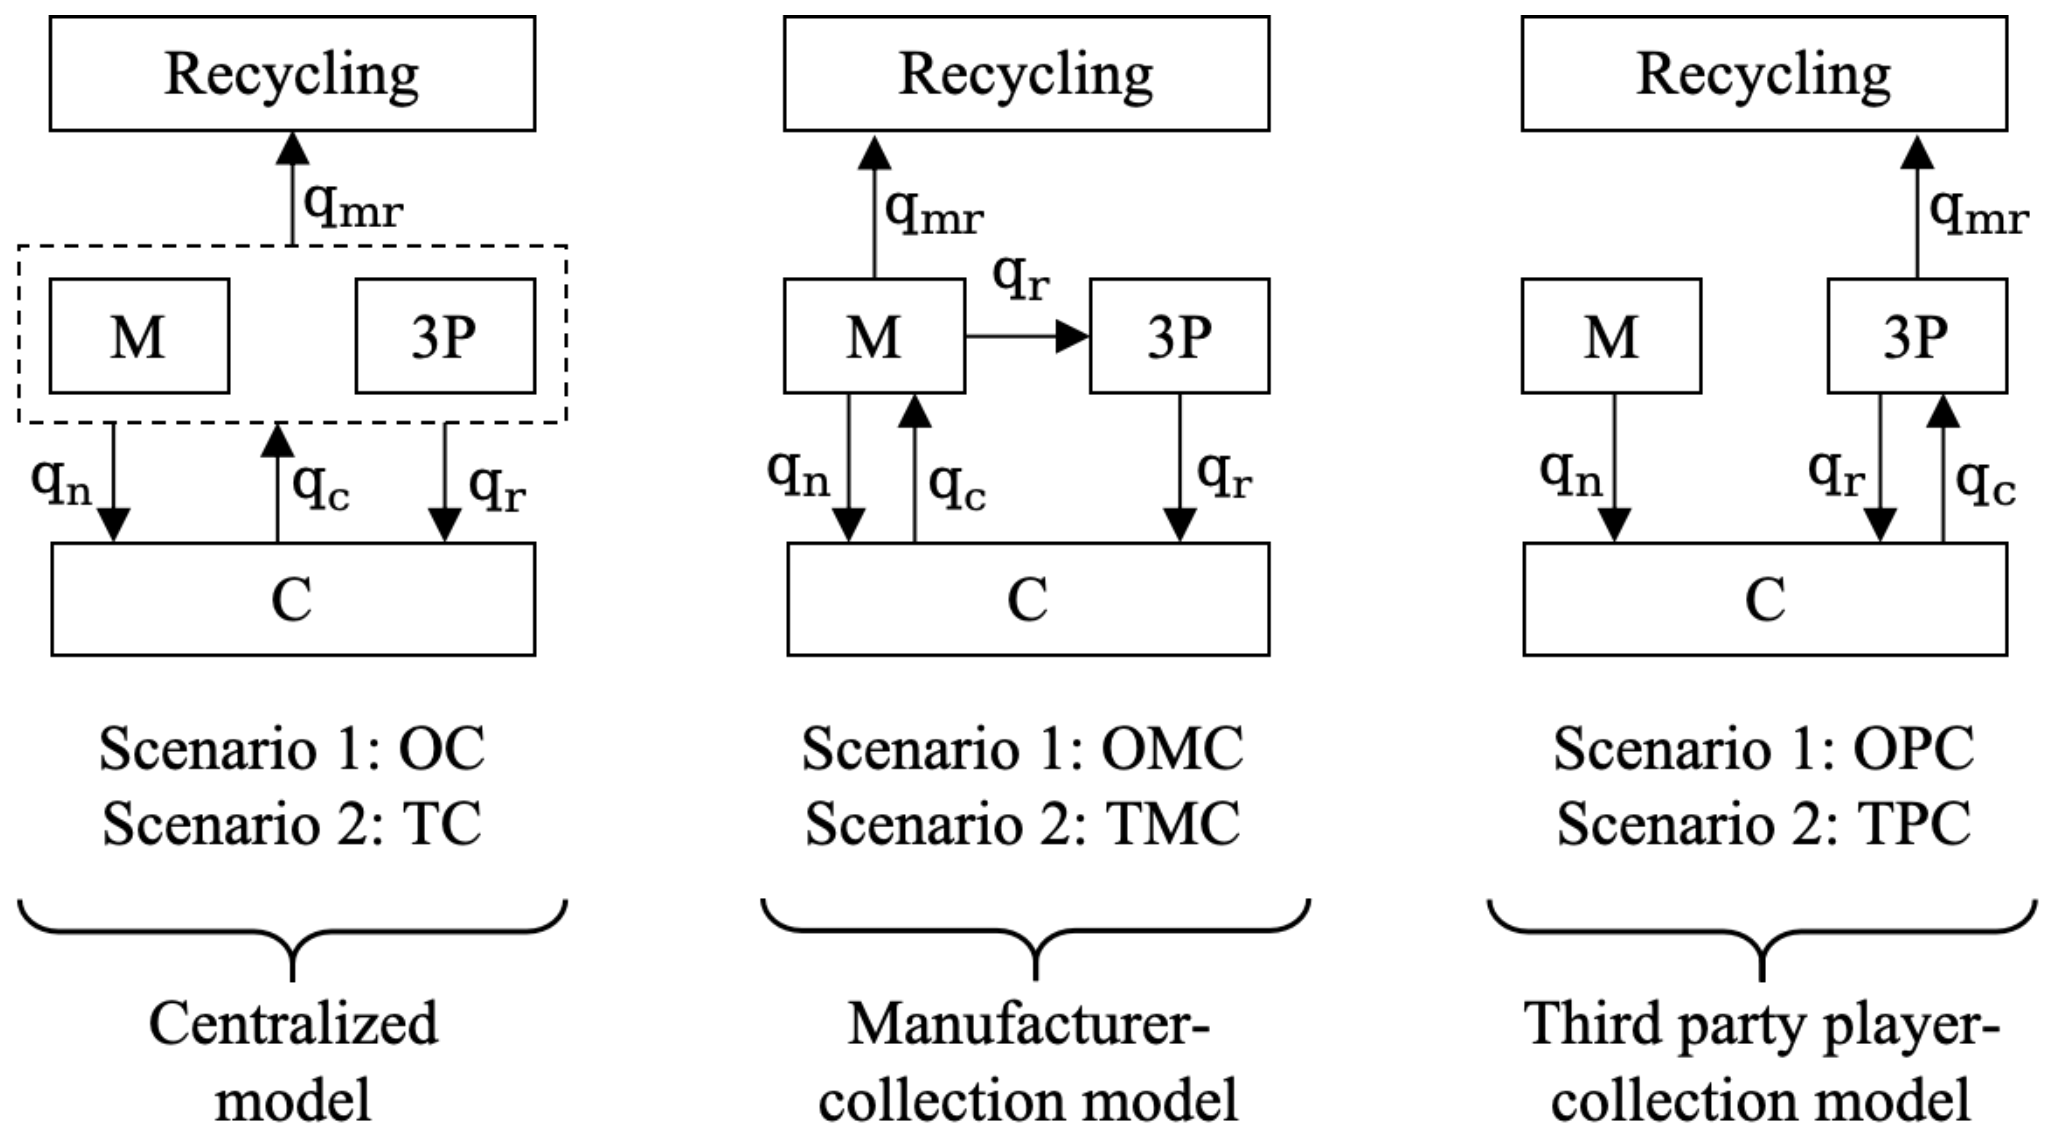
Assumption 5. All the remanufactured products are sold at the same quality. We consider two scenarios in the benchmark model of this study. In Scenario 1, the quality restoration cost for all the remanufactured products are the same and are denoted as . Similar to the studies of Nie et al. [45], Jin et al. [46], and Lv et al. [47], the quality restoration cost is normalized to zero without loss of generality. In Scenario 2, the quality restoration cost varies depending on the residual value of the collected products. To improve the quality of collected products to a certain level, the quality restoration cost is necessary and varies depending on the residual value. Given that the quality of a remanufactured product meeting the sales requirements is t (t > v), then the difference between the quality of a remanufactured product that meets the requirements and the residual value of a collected product is (t − r). t is normalized to 1 without the loss of generality. In this study, we assume a linear relationship between quality restoration cost and the residual value. Then, the quality restoration cost of one collected product with residual value r is denoted as n(1 − r), and n is the cost coefficient (n > 0). Apparently, a lower (higher) residual value will require a higher (lower) quality restoration cost. According to Assumption 1, it is known that the highest residual value of the collected products is v. According to Assumption 4, the lowest residual value that is required for remanufacturing is . Then, the average quality restoration cost for remanufactured products with a residual value between and v is . Given that the manufacturing cost of a new product is , then should hold. Building on these assumptions, this study examines three CLSC channel structures: a centralized model, a manufacturer-collection model, and a third-party player-collection model (
Figure 1). Each structure is evaluated under two scenarios that reflect constant versus heterogeneous quality restoration costs. To maintain analytical generality, the model is not restricted to a specific product category, although parameter values are partly informed by evidence from the electric vehicle battery industry.
3.1. Centralized Model
In the centralized model, the manufacturer and the third-party remanufacturer (3P) make decisions as a whole to decide the collection quantity and the sales quantities of new and remanufactured products.
OC model: Without heterogeneous quality restoration cost (Scenario 1)
TC model: With heterogeneous quality restoration cost (Scenario 2)
Then, the equilibrium results of model OC and TC are derived and listed in
Table 2 (details in the
Supplementary Materials). Unless otherwise specified, the symbols “
”, “
”, and “
” are used to indicate an “increase”, a “decrease”, and “no change”, respectively, in the following analysis. The superscripts “OC”, “TC”, “OMC”, “TMC”, “OPC”, and “TPC” respectively refer to the optimal solutions to these six models (OC, TC, OMC TMC, OPC, and TPC) at equilibrium.
Proposition 1. (1) When , ① , , , , , ; ② , , , , , .
(2) When , ① , , , , , ; ② , , , , , .
Proposition 1(1) reveals that material recycling revenue () exerts a consistent influence regardless of whether heterogeneous quality restoration costs are considered. In detail, it positively affects the collection quantity, the sales quantity of new products, the recycling quantity, and the sales price of remanufactured products but decreases the sales quantity of remanufactured products. Its impact on the sales price of new products remains unchanged. Proposition 1(2) shows that the manufacturing cost () negatively influences the recycling quantity and the sales quantity of new products but positively affects the sales quantity of remanufactured products and the sales price of new products. Notably, the collection quantity and the sales price of remanufactured products increase under the TC model but remain unchanged under the OC model when increases.
3.2. Manufacturer-Collection Model
In the manufacturer-collection model, the manufacturer and the 3P make decisions independently and simultaneously. The manufacturer is responsible for product collection and determines both the collection quantity and the sales quantity of new products. Meanwhile, the 3P determines the sales quantity of remanufactured products. Any collected products that are not sold as remanufactured items are subsequently sent for material recycling.
OMC model: Without heterogeneous quality restoration cost (Scenario 1)
TMC model: With heterogeneous quality restoration cost (Scenario 2)
Then, the equilibrium results of model OMC and TMC are derived and listed in
Table 3.
Proposition 2. (1) When , or , ① , , , , , ; ② , , , , .
(2) When , ① , , , , , ; ② , , , , , .
Proposition 2 reveals that material recycling revenue () and the comparative revenue advantage of transferring products to remanufacturing () exert consistent directional effects regardless of whether heterogeneous quality restoration costs are considered. Specifically, an increase in () enhances the collection quantity, the sales quantity of new products, the recycling quantity, and the sales prices of both new and remanufactured products, while reducing the sales quantity of remanufactured products. Regarding the manufacturing cost (), it positively influences the collection quantity, the sales quantity of remanufactured products, and the sales prices of both new and remanufactured products but decreases the sales quantity of new products and the recycling quantity.
3.3. Third-Party Player-Collection Model
In the third-party collection model, the manufacturer and the 3P also make decisions independently and simultaneously. The manufacturer determines the sales quantity of new products, while the 3P undertakes collection activities and determines both the collection quantity and the sales quantity of remanufactured products. Similarly, any collected products that are not sold as remanufactured items are directed to material recycling.
OPC model: Without heterogeneous quality restoration cost (Scenario 1)
TPC model: With heterogeneous quality restoration cost (Scenario 2)
Then, the equilibrium results of model OPC and TPC are derived and listed in
Table 4.
Proposition 3. (1) When , ① , , , , , ; ② , , , , , .
(2) When , ① , , , , , ; ② , , , , , .
Proposition 3(1) reveals that material recycling revenue () exerts a consistent influence regardless of whether heterogeneous quality restoration costs are considered. Specifically, positively affects the collection quantity, the sales quantity of new products, the recycling quantity, and the sales prices of both new and remanufactured products, while decreasing the sales quantity of remanufactured products. Proposition 3(2) shows that the manufacturing cost () positively influences the sales quantity of remanufactured products and the sales prices of both new and remanufactured products but negatively affects the recycling quantity and the sales quantity of new products in both models. Counterintuitively, the collection quantity increases under the TPC model but remains unchanged under the OPC model when increases.
4. Comparative Analysis of Different Models
In the following analysis,
,
, and
are applied as the base case in the numerical simulation unless otherwise specified throughout the study (four sensitivity analysis cases are considered—Case 1:
,
; Case 2:
,
; Case 3:
,
,
; Case 4:
,
,
—and details and results are displayed in the
Supplementary Materials).
Proposition 4. When , ; when , .
Proposition 4 reveals that the collection quantity is not necessarily maximized under the centralized model given the same quality restoration cost. Instead, the optimal collection outcome depends critically on a threshold of the comparative revenue advantage of transferring products to remanufacturing over material recycling (). When is sufficiently high, the model in which the manufacturer undertakes collection (model OMC) generates the largest collection quantity. Otherwise, the collection quantity is the smallest in model OMC. Moreover, the collection quantities in models OC and OPC are identical. A higher implies that the independent remanufacturer (3P) is willing to allocate a larger share of the surplus to the manufacturer under the OMC model, thereby strengthening the manufacturer’s incentive to improve collection quantities. Consequently, when exceeds a certain threshold, the manufacturer-led collection model with an independent remanufacturer (OMC) yields the highest collection quantity.
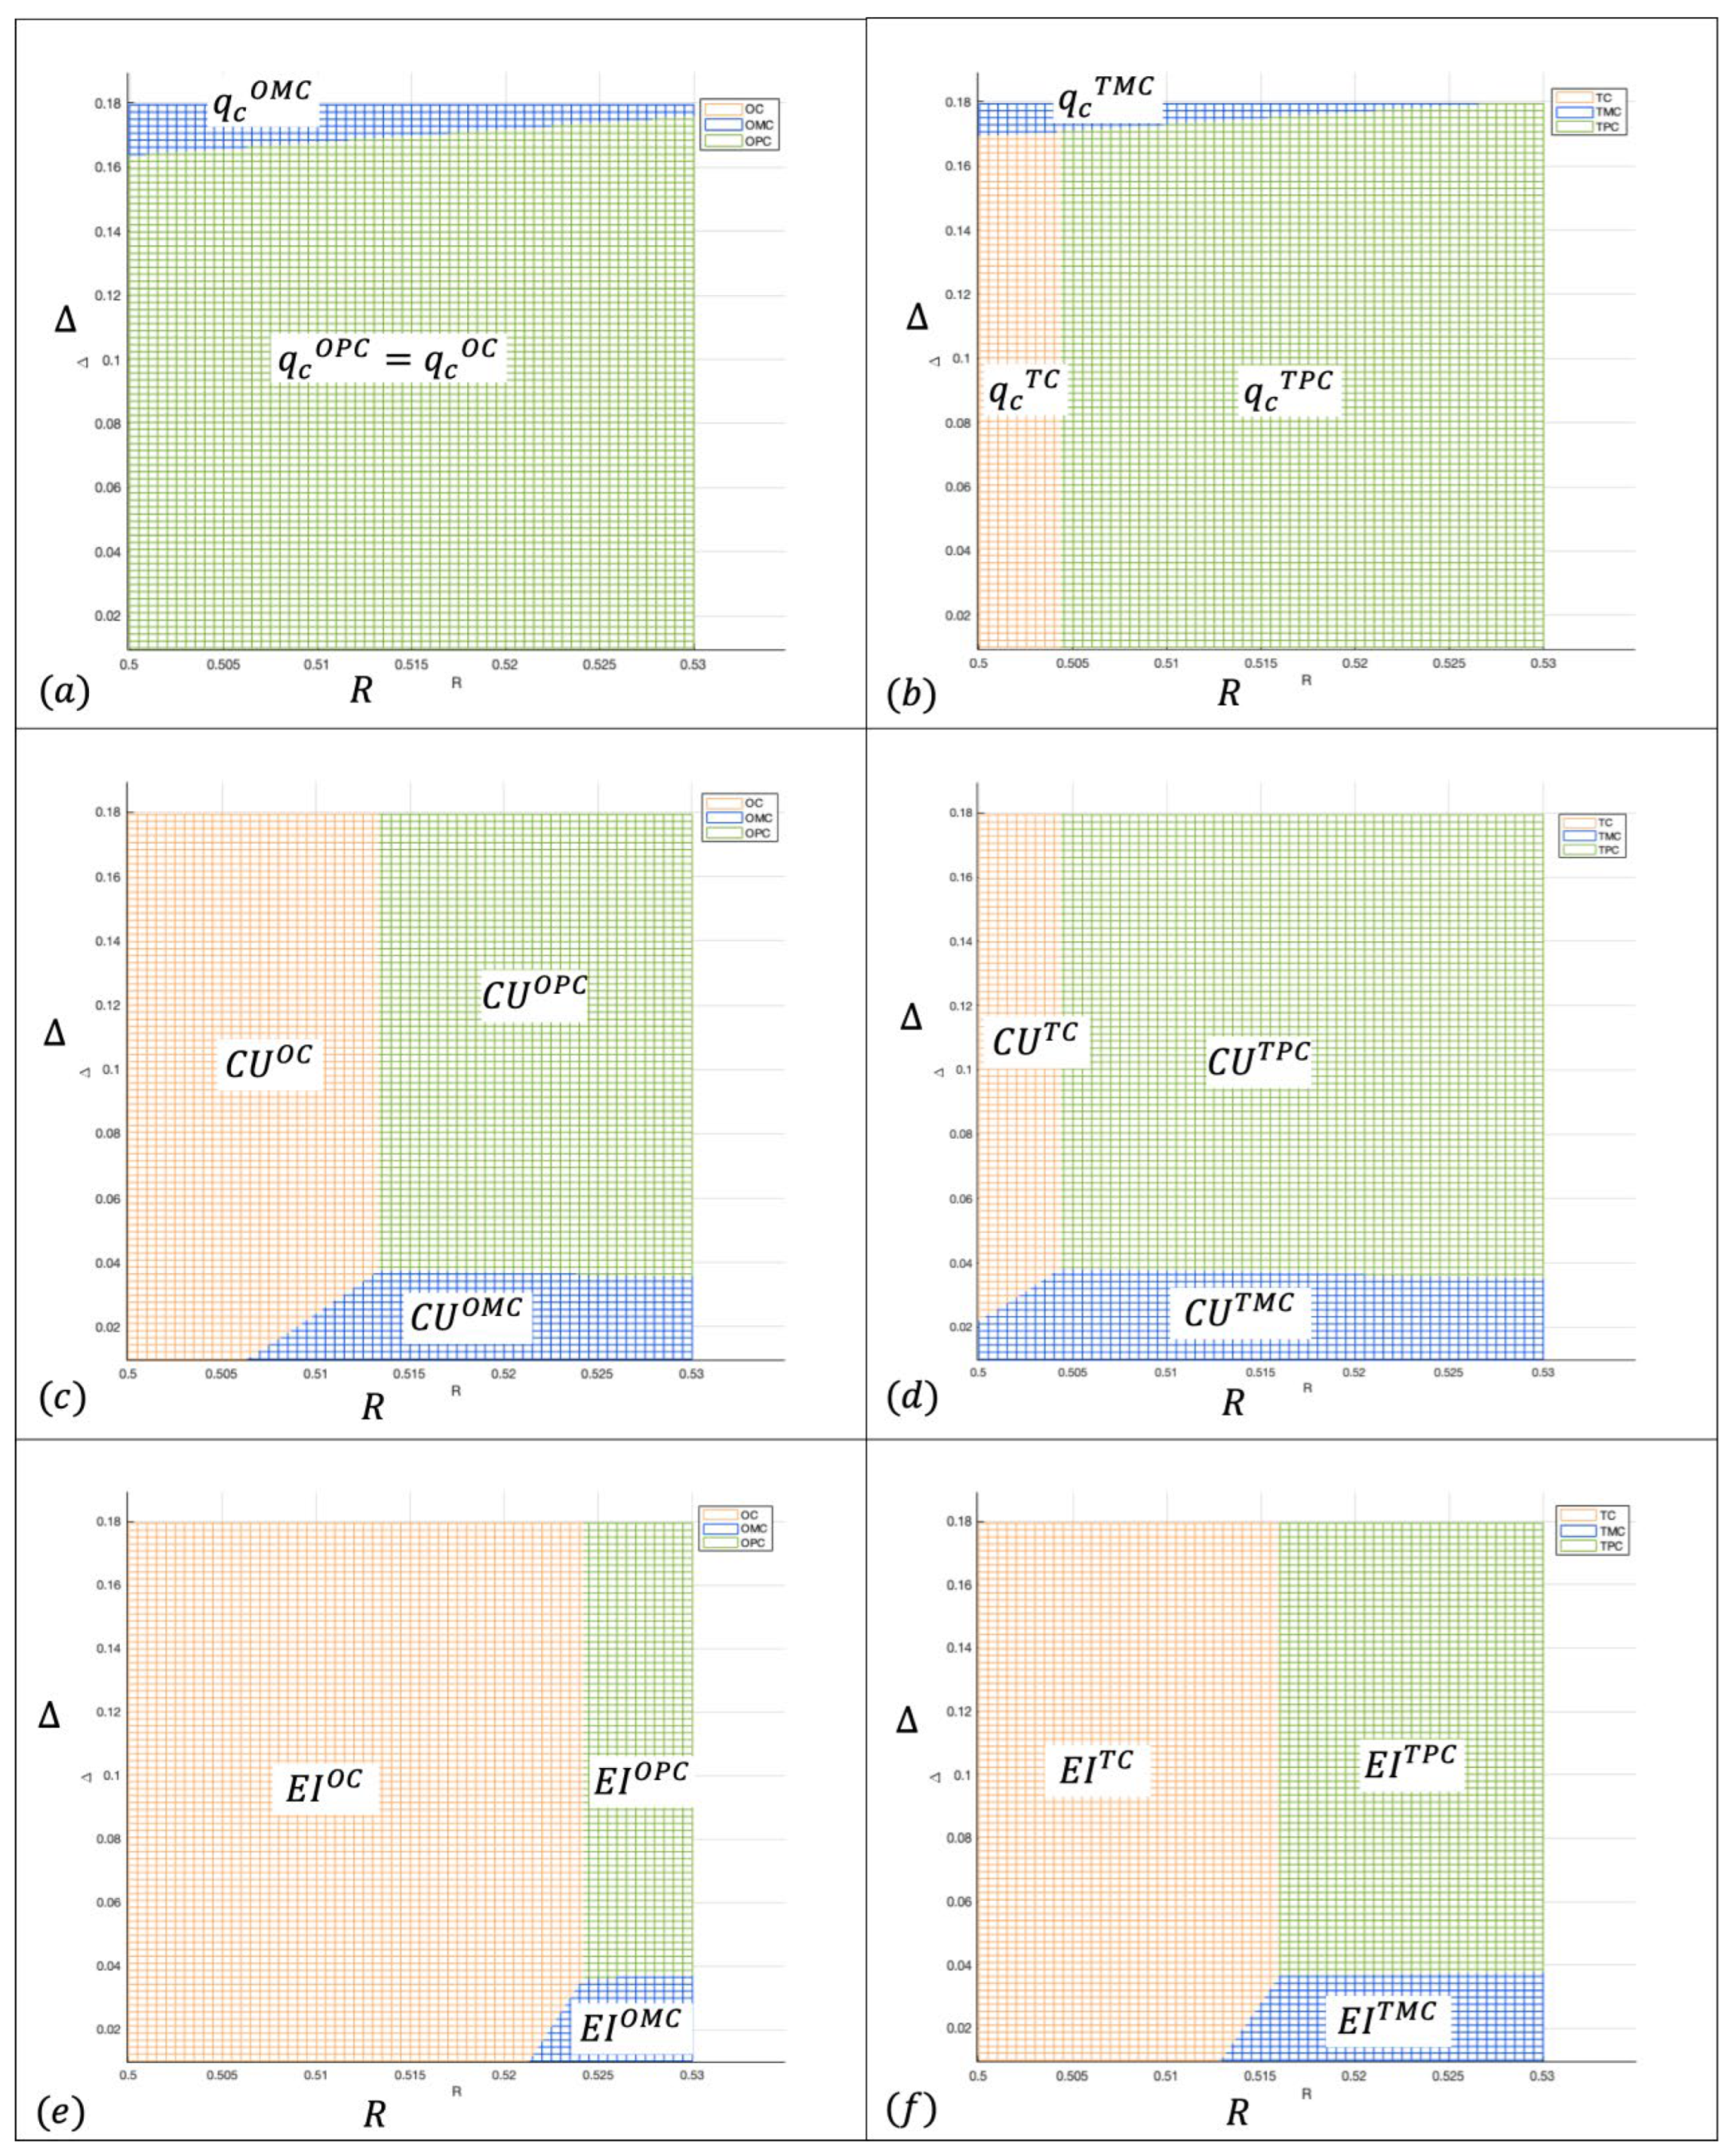
Due to the analytical intractability of the model under heterogeneous quality restoration costs, we employ numerical simulations to examine the comparative results. The findings indicate that, unlike the case with fixed quality restoration costs, the collection quantities differ across the TC, TMC, and TPC models (see
Figure 2a,b and
Figures S6–S9a,b). In particular, the manufacturer-led collection (TMC) model generates the highest collection quantity only when
is sufficiently large, and this threshold is higher than that under fixed cost setting. This result can be explained by the fact that heterogeneous restoration costs weaken the marginal profitability of remanufacturing. As a result, stronger economic incentives (i.e., a higher
) are required to induce the manufacturer to intensify collection activities. Therefore, the structure of restoration costs plays a critical role in shaping the relative performance of different collection models. From a managerial perspective, this finding suggests that firms should carefully consider the cost structure of quality restoration when designing collection strategies, as higher cost heterogeneity may dampen the effectiveness of manufacturer-led collections.
Proposition 5. (1) When , ; when , ; when , .
(2) When , ; when , ; when , .
Proposition 5 shows that the sales quantity of new products is consistently higher under the manufacturer-led collection (OMC) model than under the third-party collection (OPC) model, whereas the opposite holds for remanufactured products ( and ). This result reflects the inherent trade-off between promoting new product sales and encouraging remanufacturing across different collection structures. The relative performance of the centralized model further depends on two key thresholds: the material recycling revenue () and the comparative revenue advantage of transferring products to remanufacturing over material recycling (). Specifically, when is sufficiently high and is relatively low, the centralized model yields the highest level of new product sales. In contrast, when is sufficiently low, the centralized model generates the highest remanufactured product quantity.
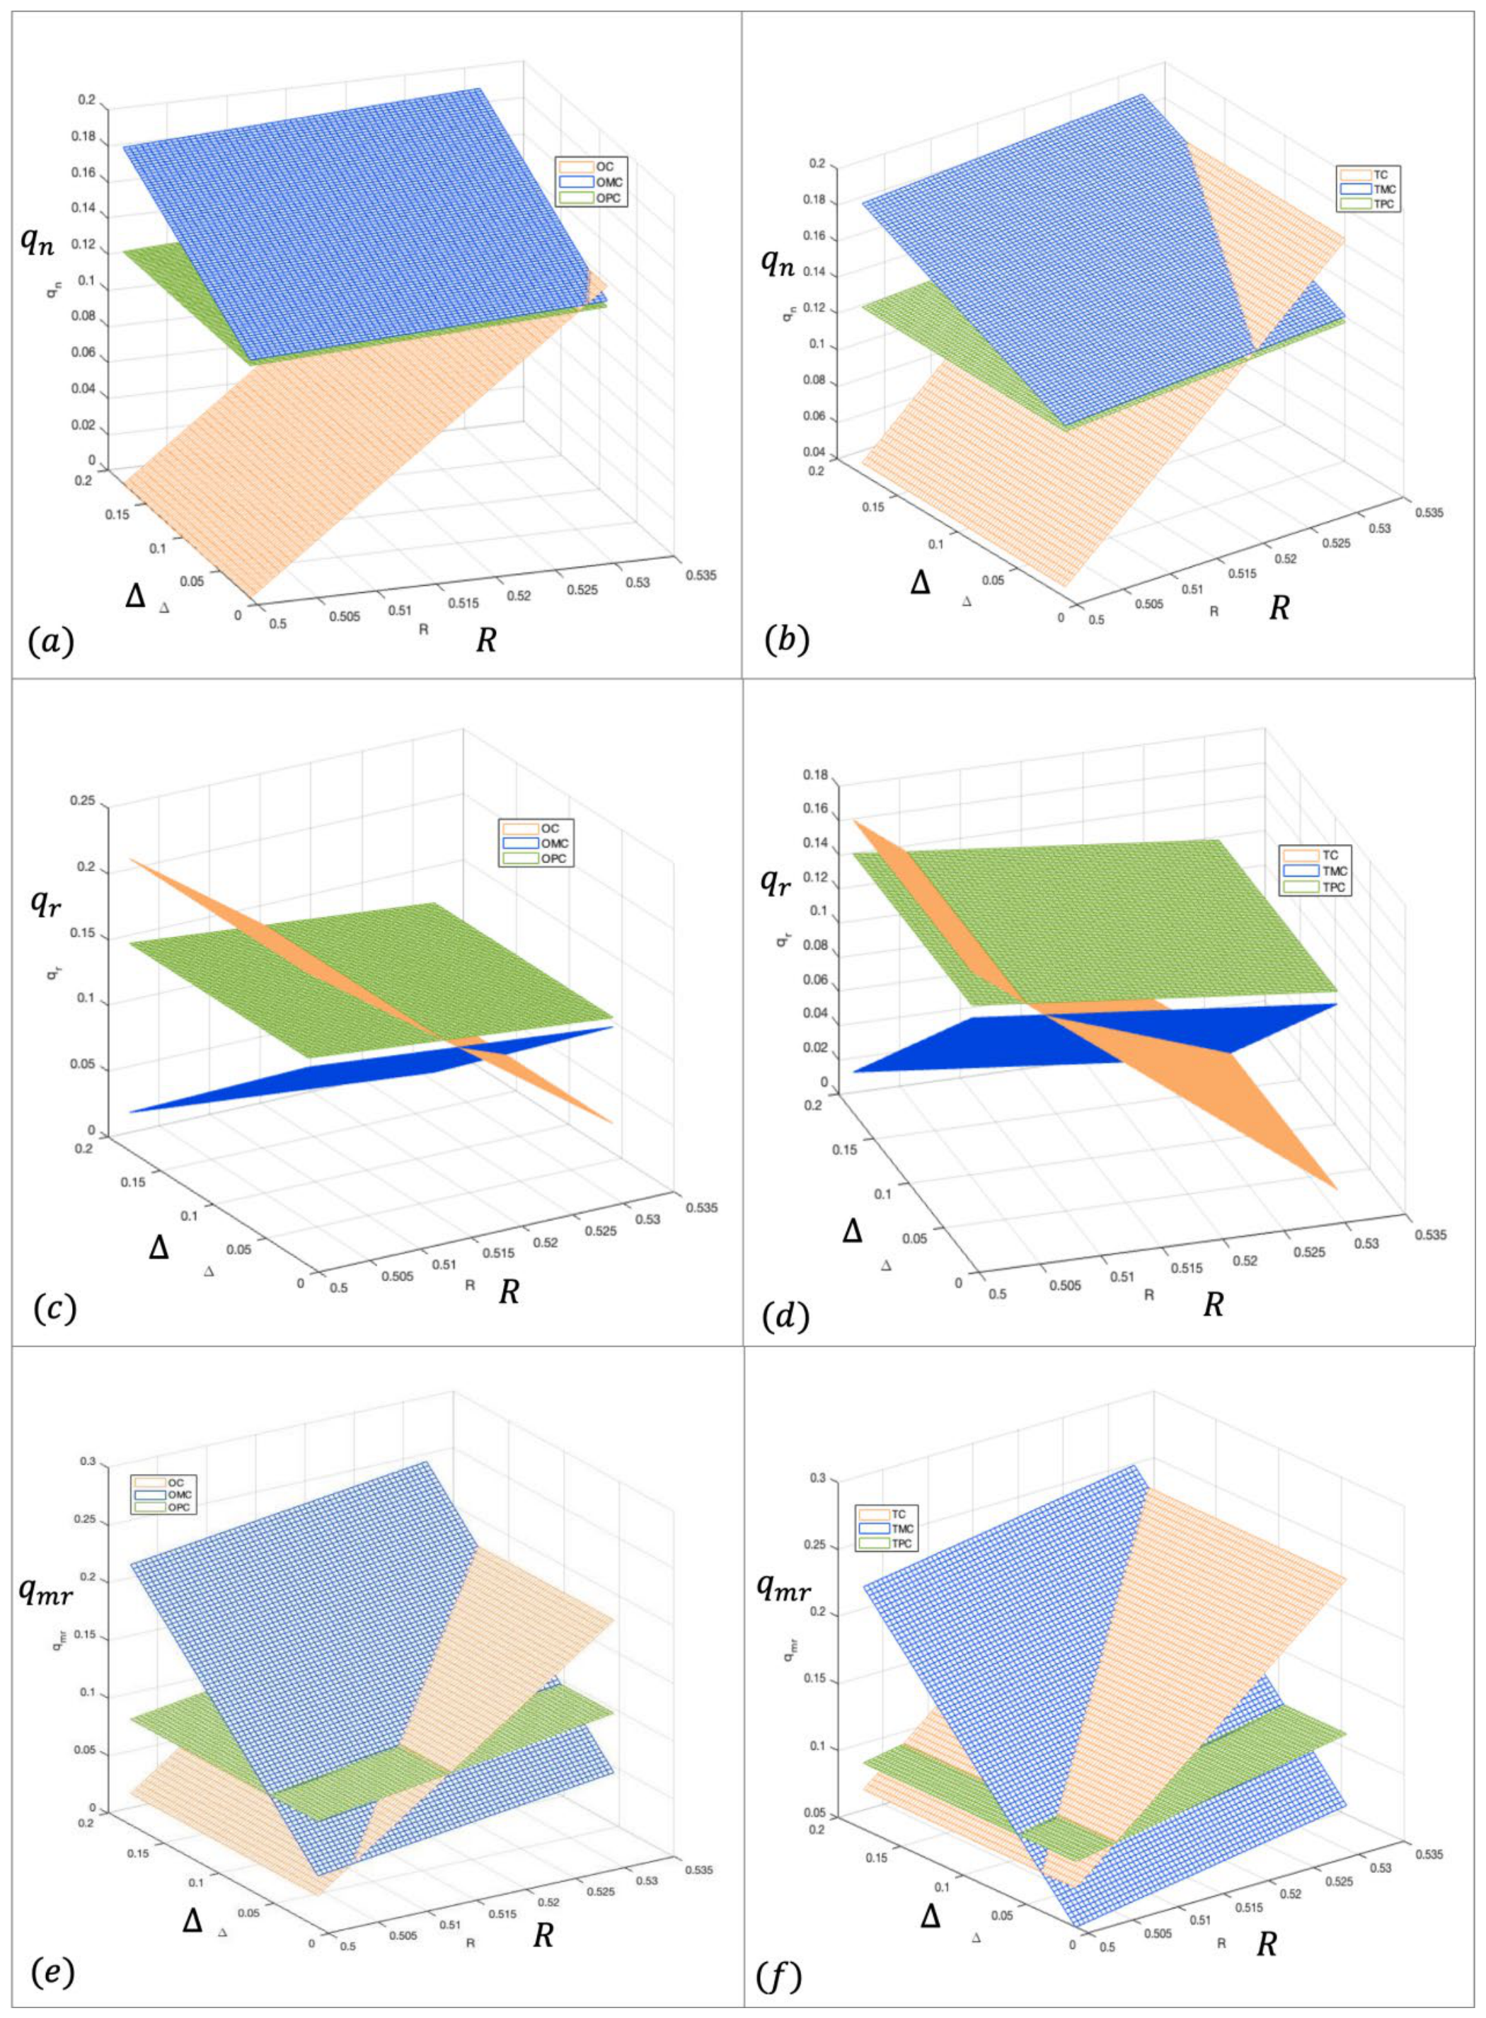
The numerical simulations indicate that the qualitative trends remain robust when heterogeneous quality restoration costs are introduced into the model. Specifically, the relationships (
,
) continue to hold when comparing Scenario 1 and Scenario 2 (see
Figure 3 and
Figures S2–S5 a vs. b, c vs. d). However, the introduction of heterogeneous restoration costs alters the relative optimality of collection structures to some extent. This is because heterogeneous restoration costs introduce heterogeneity into processing efficiency, making the profitability of remanufacturing more sensitive to product quality and channel incentives. Consequently, different collection structures exhibit varying performances in balancing new product sales and remanufactured output.
From a managerial perspective, these findings suggest that firms should align their choice of collection structure with their strategic priorities. Manufacturer-led collection is more suitable for firms seeking to prioritize new product markets, whereas third-party collection is more effective in promoting remanufacturing activities, particularly under significant cost heterogeneity.
Proposition 6. When , . When
, . When , . Therefore, the following conclusion are derived and listed in Table 5. A numerical simulation is conducted to visualize the result of Proposition 6 (see
Figure 3a). Proposition 6 indicates that the performance of material recycling quantity (
) among the three models is complicated. Specifically, when both
and
are low, the third-party collection (OPC) model yields the highest material recycling quantity. In contrast, when both
and
are sufficiently high, the manufacturer-led collection (OMC) model generates the largest material recycling quantity.
The numerical simulations further indicate that the introduction of heterogeneous restoration costs alters the relative optimality of collection structures (see
Figure 3 and
Figures S2–S5 e vs. f). In particular, the performance ranking between the centralized and third-party collection (OC and OPC) models differs from that under heterogeneous cost settings (TC and TPC). This suggests that cost heterogeneity affects not only the level of collection activities but also the comparative advantages of different organizational structures.
From a managerial perspective, these findings imply that firms should carefully evaluate both revenue conditions ( and ) and restoration cost structures when designing recycling and collection strategies.
5. Environmental Outcomes
Following Yang et al. [
48] and Zhang et al. [
49], environmental performance is modeled as a function of production and recovery activities and is expressed as
. Here,
,
and
denote the unit environmental impacts associated with manufacturing new products, remanufacturing, and material recycling, respectively. These parameters capture the relative environmental burdens (or benefits) across different processing pathways. The parameterization is informed by lifecycle assessment (LCA) evidence from the battery industry. Existing studies show that remanufacturing with reused battery modules and casings can reduce carbon footprints by more than 90% compared with production using virgin materials [
2], while hydrometallurgical recycling can lower global warming potential (GWP) by approximately 39% [
3]. Based on these findings, and by normalizing the environmental impact of production to
using virgin resources, we set
and
to reflect their relative environmental advantages from a cradle-to-gate perspective. It should be noted that the environmental impact function does not constitute a full LCA, but rather provides a simplified and tractable representation aligned with LCA principles. The model captures key environmental dimensions such as carbon emissions reduction, while omitting factors typically included in comprehensive LCA analyses (e.g., transportation, multi-stage processing, and use-phase impacts).
In addition to the environmental impact score (), this study employs two operational indicators (collection quantity () and cascade utilization ratio () to approximate environmental performances from complementary perspectives. These indicators are interpreted as proxies rather than direct measures of environmental impact. Specifically, the collection quantity reflects the extent of waste diversion, while cascade utilization ratio captures the efficiency of allocating recovered products to higher-value reuse pathways, consistent with the waste hierarchy principle.
All three indicators are defined such that higher values correspond to improved environmental performances. A higher indicates a lower overall environmental burden, while a higher reflects greater diversion of end-of-life products from disposal. Similarly, a higher implies enhanced resource efficiency through extended product life cycles. Among these, the cascade utilization ratio is emphasized because it preserves more embedded value and energy than material recycling, thereby contributing more to circular economy objectives.
The numerical simulations demonstrate that, within the same model structure, whether the quality restoration cost is constant or heterogeneous alters the results for all three environmental indicators. Moreover, no single model structure consistently performs best across all environmental indicators (
Figure 2 and
Figures S6–S9). Specifically, when the quality restoration cost is constant, the third-party collection model generally achieves the highest collection quantity (
), whereas the centralized model yields superior environmental performance in terms of the environmental impact (
) score and cascade utilization (
) ratio. However, this pattern changes when restoration costs vary. Cost heterogeneity amplifies the advantage of third-party collection in terms of collection volume and further strengthens its relative performance in
and
relative to centralized and manufacturer-led models.
This result can be explained by differences in incentive structures across collection channels. Under third-party collection structures, the third-party player exhibits strong incentives to expand both collection and remanufacturing activities, as their revenues primarily depend on collection volume and remanufacturing sales. In contrast, the centralized structure internalizes the trade-off between new product sales and remanufacturing, while the manufacturer-led structure can strategically influence this trade-off by controlling collection volume and the proportion of products allocated to remanufacturing. To mitigate the cannibalization of new product sales caused by intensified competition from remanufactured products, both centralized and manufacturer-led structures tend to restrain collection and remanufacturing activities in order to protect the manufacturer’s profitability. When restoration costs become heterogeneous, the marginal profitability of remanufacturing declines. To maintain profitability, remanufacturers tend to raise the prices of remanufactured products, which further intensifies competition between new and remanufactured products and weakens the incentives to expand recovery activities under these structures. By contrast, third-party collectors are less sensitive to such market competition due to their volume-driven revenue structure. As a result, even when cost heterogeneity increases, they continue to have strong incentives to expand collection and remanufacturing activities. Moreover, since remanufacturing generally delivers higher economic value and environmental benefits than material recycling, a higher collection intensity under third-party structures leads to a greater proportion of products entering remanufacturing pathways. This, in turn, improves overall environmental performance, as evidenced by a higher and .
From a managerial perspective, these findings suggest that third-party collection can be more effective in maintaining high recovery levels under cost heterogeneity. From a policy perspective, the results imply that policies aimed at promoting remanufacturing (e.g., subsidies or technological support) can further enhance the environmental advantages of third-party collection, particularly in environments with heterogeneous restoration costs.
6. Influence of Different Subsidies
In the policy framework, two subsidy instruments are considered: a collection subsidy and a remanufacturing subsidy granted to consumers (all results are reported in the
Supplementary Materials).
6.1. Collection Subsidy to Consumers (CS)
The collection subsidy is paid to the consumers. Similar to Assumption 1, the collection quantity can be derived as , given that . The collection cost becomes . Accordingly, , given . According to Assumption 4, and . According to Assumption 5, the average quality restoration cost for remanufactured products with a residual value between and becomes .
6.2. Remanufacturing Subsidy to Consumers (RS)
The remanufacturing subsidy is paid to consumers. Similar to Assumption 4, the sales quantity of new and remanufactured products can be derived as , and . Here, is the unit subsidy. Accordingly, and . Here, , , and , which are as the same as in the previous assumptions.
Substituting these results into the six benchmark models, the equilibrium results can be derived using backward induction. The effects of the subsidies under different models can be summarized in
Table 6.
The results indicate that, generally, both the collection subsidy and the remanufacturing subsidy can promote the collection quantity () and the sales quantity of remanufactured products (). However, the collection subsidy has no effect on the sales quantity of remanufactured products under Scenario 1, in which the quality restoration cost is constant. In addition, the collection quantity is unaffected by the remanufacturing subsidy in the OC and OPC models. Moreover, the remanufacturing subsidy reduces the sales quantity of new products () and the material recycling quantity (). By contrast, the sales quantity of new products remains constant as the collection subsidy varies under Scenario 1. It is also noteworthy that the collection subsidy increases the material recycling quantity in all models except for the central (OC and TC) models.
Despite their similar roles in promoting the collection quantity (
) and the sales quantity of remanufactured products (
), the two types of subsidies exhibit fundamentally different effects on the cascade utilization (
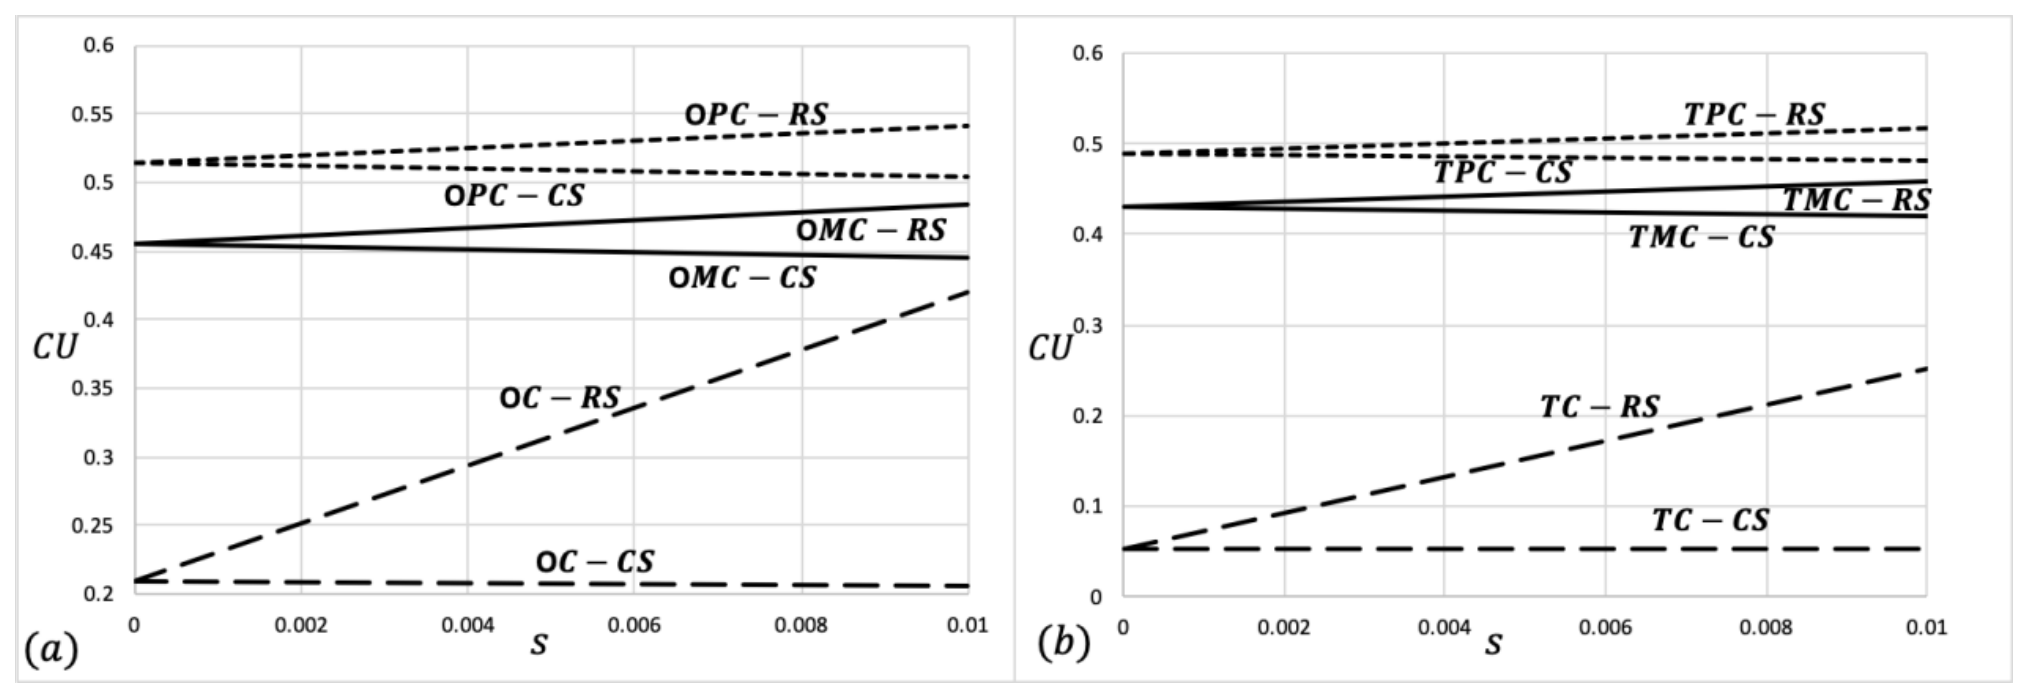
) ratio. As shown in
Figure 4 (and analytically in the
Supplementary Materials), the collection subsidy tends to slightly decrease
across all models, regardless of whether restoration costs are constant or heterogeneous, whereas the remanufacturing subsidy has the opposite effect and increases
.
This divergence can be explained by the underlying allocation mechanism of collected products. The collection subsidy primarily expands the total volume of returns, including lower-quality products, which are more likely to be directed toward material recycling rather than remanufacturing, thereby reducing the average cascade utilization ratio. In contrast, the remanufacturing subsidy directly enhances the profitability of higher-value recovery pathways, encouraging a larger share of collected products to be allocated to remanufacturing and thus increasing .
From a managerial perspective, these findings suggest that firms should carefully distinguish between volume-driven and value-driven recovery strategies. While the collection subsidy is effective in increasing return flows, it may dilute the quality composition of collected products and reduce high-value utilization efficiency. In contrast, the remanufacturing subsidy is more effective in improving the quality allocation of recovered products. From a policy perspective, the results imply that relying solely on the collection subsidy may be insufficient and potentially counterproductive for achieving higher-value circular economy outcomes. A more balanced policy mix that combines collection incentives with remanufacturing support is likely to be more effective in improving both recovery quantity and utilization efficiency.
Furthermore, the results indicate that the remanufacturing subsidy has stronger effects in centralized models than in decentralized ones, suggesting that policy effectiveness depends on the supply chain structure (
Figure 4 and
Figure S1). In addition, the presence of heterogeneous restoration costs reduces the effectiveness of subsidies overall, with the difference between OC-RS and TC-RS being particularly pronounced (
Figure 4a,b:
,
). This highlights the importance of accounting for cost heterogeneity when designing subsidy policies.
7. Conclusions
This study models constant and heterogeneous quality restoration cost scenarios and examines three CLSC channel structures: the centralized (OC/TC) model, manufacturer-collection (OMC/TMC) model, and third-party collection (OPC/TPC) model. It analyzes and compares optimal collection and cascade utilization strategies across these structures and scenarios and assesses environmental outcomes using three indicators. It further investigates the effects of two subsidy types and their implications for the cascade utilization ratio. The main contributions are as follows:
(1) The material recycling revenue (), the comparative revenue advantage of transferring products to remanufacturing (), and the manufacturing cost () generally exert consistent influences in the same model structures across different scenarios.
(2) When is high, the manufacturer-collection (OMC) model gathers the most returns; otherwise, it collects the least. In contrast, models OC and OPC produce identical collection quantities determined solely by the material recycling revenue (), as they share the same quality restoration cost, unlike models TC, TMC, and TPC.
(3) The sales quantity of new products is consistently higher in OMC than in OPC, whereas the sales quantity of remanufactured products is higher in OPC. Whether the centralized (OC) model performs best or worst in terms of new or remanufactured sales depends on two thresholds: and . The same patterns between TMC and TPC remain unchanged when quality restoration costs vary (TMC and TPC). However, the introduction of variable restoration costs alters the relative optimality of the collection structures to some extent.
(4) Material recycling quantity () exhibits a more complex behavior. It is the highest in OPC when both and are low but becomes the highest in OMC when both parameters are sufficiently large. These relationships shift under variable restoration costs, indicating that restoration cost heterogeneity fundamentally affects the relative advantages of collection structures.
(5) Quality restoration cost structures significantly influence environmental outcomes and model rankings. While centralized collection (OC, TC) performs best in and under constant restoration costs, cost variability shifts the advantage toward third-party collection (OPC, TPC) across all indicators.
(6) Both collection and remanufacturing subsidies generally increase the collection quantity () and the sales quantity of remanufactured products (), though collection subsidy does not affect under constant quality restoration costs. Remanufacturing subsidy does not change in OC and OPC, but it reduces the sales quantity of new products () and the material recycling quantity (). However, the collection subsidy increases in all decentralized models but not in centralized ones.
(7) The two subsidies have opposite effects on : collection subsidy slightly reduces in all models, while remanufacturing subsidy increases it. Remanufacturing subsidy is also far more effective in centralized models, though their impact weakens under heterogeneous quality restoration costs.
This study contributes to the existing literature by providing new insights into CLSC management with endogenous cascade utilization. Compared with prior studies [
10,
13,
17,
21], our findings are broadly consistent with the literature emphasizing the importance of recovery structures and policy incentives in shaping collection and remanufacturing outcomes. At the same time, our work extends this stream of research by explicitly endogenizing cascade utilization decisions and highlighting the role of heterogeneous quality restoration costs in influencing both collection strategies and resource allocation across recovery pathways. In contrast to studies that treat cascade utilization as an exogenous parameter or assume homogeneous restoration costs [
20,
21], our results reveal that the allocation of recovered products between remanufacturing and material recycling is jointly determined by supply chain structure, cost heterogeneity, and subsidy design. Moreover, we show that different subsidy instruments operate through distinct mechanisms, leading to divergent effects on cascade utilization efficiency, which has not been examined in prior studies such as [
13,
43].
This study yields several important managerial and policy insights. First, the effectiveness of collection strategies critically depends on restoration cost structures. Cost variability weakens the effectiveness of manufacturer-led and centralized collection by reducing the stability of remanufacturing profitability, while making third-party collection more resilient due to its volume-driven incentive structure. Second, collection structures involve a fundamental trade-off between promoting new product sales and enhancing remanufacturing performance. Manufacturer-led collection is more suitable for firms prioritizing new product markets, whereas third-party collection is more effective in sustaining high recovery levels and promoting remanufacturing, particularly under cost uncertainty. Third, firms should jointly consider revenue conditions ( and ) and restoration cost characteristics when designing recovery strategies, as both factors jointly determine the optimal allocation of returned products and overall environmental performance.
From a policy perspective, the results highlight that different subsidy instruments operate through distinct mechanisms. The collection subsidy primarily expands return volumes but may dilute cascade utilization by increasing the share of lower-quality products directed to recycling. In contrast, the remanufacturing subsidy improves the allocation efficiency of recovered products by shifting them toward higher-value remanufacturing pathways, thereby enhancing environmental performance. These findings suggest that relying solely on collection subsidies may be insufficient and potentially counterproductive for achieving high-value circular economy outcomes. A balanced policy mix that combines collection incentives with remanufacturing support is more effective in improving both recovery quantity and utilization efficiency. Finally, policy effectiveness is contingent on supply chain structure and cost conditions. The remanufacturing subsidy is more impactful in centralized systems, while cost heterogeneity generally reduces subsidy effectiveness. This underscores the importance of accounting for both organizational structure and cost uncertainty in policy design.
More broadly, these findings contribute to the objectives of sustainable consumption and production by highlighting how policy design and collection structures influence resource efficiency and the allocation of recovered products toward higher-value reuse pathways. In particular, promoting remanufacturing and improving cascade utilization efficiency help reduce resource waste and enhance the circular use of materials, which are central to sustainable consumption and production systems.
This study has several limitations. First, regarding the specification of quality restoration costs, we assume a linear relationship between restoration cost and product quality. In practice, such costs may exhibit nonlinear patterns (e.g., increasing at an accelerating rate as product quality declines). While this assumption enhances analytical tractability, it may affect the cost structure under variable restoration cost scenarios. Nevertheless, it does not alter the main qualitative conclusions, particularly those derived under fixed restoration cost settings. Second, the model normalizes the fixed restoration cost () and the quality level of remanufactured products (). Although these normalizations simplify the relative magnitude of fixed and heterogeneous costs, they do not affect the comparative insights of the study, which focuses on the differences between fixed and heterogeneous restoration cost structures. Third, consistent with the prior literature, the consumer’s willingness to pay is assumed to follow a uniform distribution. While this assumption facilitates analytical clarity, it may not fully capture heterogeneous market preferences. Exploring alternative demand distributions represent a promising direction for future research. Finally, although cascade utilization may involve multiple stages, this study considers only remanufacturing and material recycling. Incorporating additional pathways, such as component-level reuse, would introduce more complex decision structures and could further enrich the analysis of multi-stage circular systems. Future research could further extend and enrich this work by conducting a more in-depth and systematic examination of nonlinear restoration cost functions, undertaking a broader and more comprehensive exploration of alternative demand distributions, and developing more detailed and sophisticated multi-stage cascade utilization frameworks to better capture the underlying complexities.