Article

Can the Digital Economy Enable Sustainable Low-Carbon Development of Grain Production? Mechanism Identification and Testing Based on Green Finance

1
School of Management, Dalian Polytechnic University, Dalian 116034, China
2
College of Business and Economics, Shanghai Business School, Shanghai 200235, China
*
Authors to whom correspondence should be addressed.
Sustainability 2026, 18(8), 3884; https://doi.org/10.3390/su18083884
Submission received: 27 January 2026 / Revised: 24 March 2026 / Accepted: 26 March 2026 / Published: 14 April 2026

Abstract

As a vital engine of economic growth, the digital economy can boost agricultural productivity while curbing carbon emissions from grain production, thereby facilitating the green transformation of traditional agriculture and the sustainable development of grain production systems. It serves as a pivotal anchor for achieving China’s dual-carbon strategic goals in the agricultural sector and supporting the long-term sustainability of national grain security. This paper conducts an in-depth analysis of the carbon emission mitigation mechanisms of the digital economy for sustainable agricultural production. Using panel data covering 30 provincial-level regions in China from 2012 to 2021, this study employs and integrates panel regression estimation, mediating effect analysis, and the Spatial Durbin Model (SDM) framework to identify the underlying pathways through which the digital economy affects carbon emissions from grain production and drives low-carbon sustainable transformation of agriculture. The findings reveal the following: (1) The digital economy exerts a significant negative effect on carbon emission intensity in grain production, laying an empirical foundation for digital-enabled sustainable grain production; (2) It indirectly reduces carbon emission intensity by promoting the development of green finance as a mediating channel, unlocking the sustainable empowerment mechanism of green finance for agricultural low-carbon transition; (3) The development of the digital economy presents pronounced spatial spillover effects: improved digital development in one region also lowers grain production carbon emission intensity in neighboring areas, supporting cross-regional coordinated sustainable development of grain production; (4) The carbon-reduction effects of the digital economy exhibit regional heterogeneity, with more significant emission-reduction outcomes observed in eastern and central regions, while such effects are less prominent in western regions, providing a basis for formulating differentiated regional agricultural sustainable development policies. Based on these findings, this paper puts forward a series of targeted policy recommendations, offering theoretical and practical references for the high-quality development of green and low-carbon agriculture and the overall advancement of sustainable agricultural and rural modernization.

1. Introduction

On 17–18 July 2023, General Secretary Xi Jinping emphasized at the National Conference on Ecological and Environmental Protection the importance of actively and steadily advancing carbon peaking and carbon neutrality, urging the accelerated development of a green, low-carbon, safe and high-efficiency energy system, while pointing out that agriculture serves as both a major carbon-emitting sector and a core pillar for achieving China’s dual-carbon strategic objectives, the long-term sustainable development of agricultural systems, and the harmonious coexistence between agricultural production and the ecological environment. As the core subsector of agriculture, grain production is critical to green agricultural development and national food security, which is the cornerstone of sustainable rural revitalization and socio-economic stable development; yet China’s traditional agricultural production models are plagued by irrational input use, low production efficiency and inefficient resource allocation, which constrain the low-carbon transformation of agriculture. Against this backdrop, the digital sector has emerged as a key driver for optimizing economic structure and promoting green development: the scale of China’s digital economy reached 53.9 trillion yuan in 2023, and its integration with agricultural technologies such as drones and blockchain has become a core engine for green agricultural development and the sustainable intensification of grain production systems, providing a core path to break through the bottleneck of traditional agricultural development and achieve the sustainable transformation of grain production. However, the advancement of green agriculture is hampered by challenges including inaccurate production data, inadequate carbon emission monitoring technologies, and an incomplete understanding of agricultural carbon emission processes, making it urgent to investigate both the feasibility and specific pathways through which the digital economy mitigates carbon emissions from grain production and to clarify the core logic of digital economy enabling the sustainable low-carbon development of grain production throughout the whole industrial chain, so as to provide a practical path for the sustainable and high-quality development of China’s grain industry under the dual-carbon target.
Although prior academic scholarship has investigated the carbon emission mitigation effects of the digital economy and the evolutionary dynamics of agricultural carbon emissions, three pivotal research gaps remain unaddressed. First, the majority of existing studies focus on the contribution of digital economic development to economy-wide carbon abatement, with insufficient attention paid to the specialized grain production sector, resulting in a lack of sector-specific assessments of how digital economic growth shapes carbon emissions from grain production and its long-term sustainable development capacity. Second, the prevailing literature largely concentrates on analyzing the local impacts of digital economic advancement on grain production carbon emissions, yet ignores the inherent spatial correlation of digital economic development and fails to fully quantify the spatial spillover effects that digital sector expansion exerts on cross-regional carbon abatement in grain production and the coordinated sustainable development of grain production across regions. Third, current research prioritizes the direct carbon abatement impacts of the digital sector within agricultural systems; meanwhile, the limited body of literature exploring indirect transmission pathways merely focuses on agricultural machinery technological progress, regional economic growth and energy structure optimization, with inadequate scrutiny of the mediating role of green finance as a core intermediate transmission channel which is a key institutional guarantee for the sustainable low-carbon transformation of agriculture. These unresolved research gaps limit the comprehensive understanding of carbon mitigation mechanisms of the digital economy in grain production, further hindering the formulation of targeted policy frameworks for low-carbon agricultural development.
This study addresses the aforementioned research gaps and makes distinct contributions to the existing literature from both theoretical and empirical perspectives. Theoretically, this research integrates the digital economy, green finance, and grain production carbon emissions into a unified analytical framework, systematically identifying and verifying both the direct carbon abatement mechanism of the digital economy in grain production and the internal logic of its enabling effect on the sustainable development of grain production and the indirect mediating mechanism through green finance. This framework enriches the theoretical understanding of how the digital economy drives the low-carbon transformation of agriculture and the sustainable development of grain production systems and supplements the literature on green finance as a transmission channel for digital economic effects in the agricultural sector. Additionally, by incorporating spatial econometric analysis, this study clarifies the spatial spillover characteristics of carbon reduction effects driven by the digital economy in grain production, filling the theoretical gap arising from neglected spatial interdependence in prior research and providing a spatial analytical perspective for interpreting the carbon mitigation effects of the digital economy in agricultural production and the cross-regional coordinated sustainable development of grain production. Empirically, using a balanced panel dataset covering 30 provincial-level administrative regions in China from 2012 to 2021, this study adopts an integrated framework of panel regression, mediating effect analysis, and the Spatial Durbin Model to rigorously examine the impact of the digital economy on carbon emission intensity in grain production and its sustainable development level. It constructs a comprehensive digital economy development index and a standardized green finance indicator system via the entropy weight method, providing empirical measurement benchmarks for subsequent research on digital economy and green finance in agricultural contexts. Moreover, this study applies multiple causal identification strategies, including the instrumental variable method, quasi-natural experiments, and lagged regression, to address the endogeneity of core variables, accurately delineating the causal linkage between the digital economy and carbon mitigation in grain production and bridging the gap of inadequate causal inference in extant studies and provides a reliable empirical basis for formulating policies to promote the sustainable low-carbon development of grain production through digital empowerment. Finally, this research explores regional heterogeneity in the carbon abatement effects of the digital economy across eastern, central, and western China, generating regionally differentiated empirical findings that remedy the absence of heterogeneity analysis in prior scholarship and provides targeted guidance for the differentiated implementation of sustainable grain production development strategies in different regions.
On this basis, this study is structured into five sections. Section 1 systematically reviews the relevant literature on carbon emissions from agricultural production, carbon emissions in grain production processes, and the enabling mechanisms of the digital economy for carbon abatement, identifying the research gaps in existing scholarship. Section 2 conducts theoretical analysis and develops research hypotheses from three dimensions: direct effects, mediating pathways, and spatial correlation. Section 3 specifies the research model, defines dependent variables, core explanatory variables, mediating variables and control variables, and elaborates on data sources and processing methods. Section 4 validates the research hypotheses and presents empirical results via panel regression, mediating effect tests, the Spatial Durbin Model, and heterogeneity analysis. Section 5 summarizes the core findings and proposes targeted policy recommendations to enable the digital economy to reduce carbon emissions from grain production, providing practical references for the high-quality development of green and low-carbon agriculture.

2. Literature Review

Existing studies on the enabling effects of the digital economy on carbon abatement in grain production mainly fall into three core research strands. First, research on agricultural carbon emissions focuses on three key dimensions: the quantification of agricultural carbon emissions, agricultural carbon emission efficiency, and the core driving factors affecting carbon emissions from agricultural systems. In terms of agricultural carbon quantification, scholars have adopted the IPCC emission factor method and the Food and Agriculture Organization (FAO) database [1] to calculate regional, sectoral, and farm-level emissions using models such as GLOBIOM, SPAC, and DNDC [2,3,4]. As research has advanced, five dimensions have become core indicators for quantifying agricultural carbon emissions: land use [5], livestock farming [6], crop cultivation [7], crop residue burning [8], and agricultural energy consumption [9]. Regarding agricultural carbon emission efficiency, scholars have employed linear regression, grey forecasting, and spatial spillover models to evaluate and analyze efficiency from national [10,11], provincial [12], and county [13] perspectives. For factors influencing agricultural carbon emissions, prior studies predominantly adopt the LMDI method [14] or regression models [15,16], identifying key drivers such as fertilizer application patterns, agricultural mechanization levels [17], and agricultural development levels [18]. Second, research on carbon emissions from grain production centers on carbon balance measurement, spatiotemporal evolution, and new productive factors. In carbon balance measurement, scholars have examined the Gansu section of the Yellow River Basin. By establishing a full-cycle carbon balance framework for grain production and applying IPCC carbon conversion factors, life-cycle assessment, and empirical formulas comprehensively, they have estimated grain production carbon budgets. The results show an improving trend in the regional carbon balance, reflecting enhanced local governance [19]. In terms of spatiotemporal evolution, research focuses primarily on the Yangtze River Delta and the Huaihe River Ecological Economic Belt. Using models including the coupling coordination model, carbon emission estimation model, and the Spatial Durbin Model, scholars have found significant positive spatial correlation in grain carbon emissions, with distinct clustering of high- and low-emission zones [20,21,22]. Regarding new productive factors, researchers have adopted fixed-effect panel models, mediating effect models, and panel threshold regression models to empirically explore their causal impacts and mechanisms on grain production carbon emissions. The results indicate that these factors significantly inhibit carbon emissions, mainly by expanding farm household operation scales [23]. Third, studies on the mechanisms through which the digital economy facilitates carbon abatement in grain production have empirically confirmed that digital economic development effectively reduces agricultural carbon emissions via improvements in agricultural machinery technology, regional economic development [24], energy structure optimization [25], and technological and structural effects.
In summary, scholars have conducted extensive research on the intrinsic correlation between the digital economy and carbon emissions, achieving substantial results. Nevertheless, the existing literature displays four prominent limitations. First, most studies focus heavily on the contribution of the digital economy to overall carbon mitigation, with inadequate attention paid specifically to grain production. This leads to a lack of sector-specific analysis regarding how digital economic development affects carbon emissions from grain production activities. Second, the majority of prior investigations only examine the local causal impacts of digital economic progress on carbon emissions in grain production, while overlooking the inherent spatial correlation of digital development and failing to comprehensively assess its spatial spillover effects on carbon abatement within grain production systems. Third, mainstream academic research primarily explores the direct effects of the digital economy in reducing carbon emissions from grain production. The scarce studies concerning indirect pathways mainly consider advancements in agricultural machinery technology, economic development levels, and energy structure, while neglecting the transmission mechanism of green finance. Fourth, few existing works systematically address endogeneity issues among the digital economy, green finance, and agricultural carbon emissions. Most studies merely employ fixed-effect models to test variable correlations, without adopting rigorous causal identification strategies such as instrumental variables and quasi-natural experiments, which undermines the robustness and credibility of their core conclusions.

3. Theoretical Analysis and Research Hypotheses

3.1. Direct Impact Mechanism

As the digital economy permeates all socioeconomic sectors, it not only drives green and high-quality industrial development but also exerts substantial impacts on carbon emissions from grain production, which are reflected in multiple dimensions. First, the application of digital technologies in crop cultivation improves agricultural productivity by enabling data-driven and intelligent farming practices. This substantially boosts agricultural efficiency and thereby affects carbon emissions from grain production. For example, Tian et al. (2023) [26] and Han et al. (2022) [27] argue that by empowering green development comprehensively, the digital economy accelerates the green transformation of production factors, productive forces and production relations, greatly reducing agricultural carbon emissions. To enhance productivity, advanced digital technologies including big data analytics, unmanned aerial vehicles (UAVs), and the Internet of Things help farmers collect agricultural data efficiently, supporting scientific decision-making and significantly improving production efficiency. In precision farming, digital tools enable accurate monitoring of soil conditions and crop growth, assisting farmers in determining optimal fertilization schedules. Data-driven insights facilitate precise fertilization, reduce chemical fertilizer waste, and lower carbon emissions from grain production. Furthermore, digital technologies also markedly curb agricultural carbon emissions in the livestock sector. During precision breeding, digital tools support real-time monitoring of livestock growth and the formulation of targeted feeding strategies. Second, energy-saving monitoring devices such as temperature sensors and smart meters track energy consumption and avoid unnecessary waste. Third, intelligent management optimizes the storage and utilization of livestock manure to improve resource efficiency. Converting manure into reusable resources such as organic fertilizer substantially cuts greenhouse gas emissions, promoting the transition from traditional to green agriculture. Accordingly, we develop the following hypothesis:
Hypothesis 1.
The development of the digital economy exerts an inhibitory effect on carbon emissions from grain production.

3.2. Indirect Impact Mechanism

Carbon emission abatement in grain production driven by the digital economy can be indirectly realized through green finance transmission channels. On the one hand, the advancement of the digital economy can significantly boost green finance development. Specifically, Li et al. (2024) [28] argue that by integrating digital technologies with the agricultural industry, the digital economy can stimulate endogenous innovation in green finance, thereby boosting the development of eco-friendly digital finance. Zhang et al. (2024) [29] contend that leveraging big data and core blockchain technologies, strengthening integration with energy internet systems, and promoting the application of blockchain in financial regulatory technology (RegTech) scenarios to enhance risk prevention and control capabilities in the green finance sector can directly drive the sound and stable development of green finance. On the other hand, the sound and orderly development of green finance enables the rational and optimized allocation of capital, providing financial support for low-carbon agricultural development. For instance, green finance bolsters agricultural scientific and technological innovation by offering venture capital and technology loans. This encourages relevant agricultural research institutions and enterprises to carry out technological innovation and cultivate new crop varieties, thereby injecting new impetus into agricultural production practices and improving grain production technology and efficiency. Accordingly, this study proposes the following hypotheses:
Hypothesis 2.
The effect of digital economic development on carbon emissions in grain production is mediated by green finance.
Hypothesis 3.
The development of green finance exerts a significant inhibitory effect on carbon emissions in grain production.

3.3. Inter-Regional Spatial Overflow Impacts

As the advancement of digital rural development continues, the carbon reduction effects of the digital economy on agriculture are becoming increasingly pronounced. Regional economies form an interconnected integrated system, in which the rapid development of the digital economy promotes regional agglomeration. Geographically closer regions feature stronger cross-regional factor mobility. Yang et al. (2023) [30] and Xu et al. (2022) [31] verify in their research that digital economic development generates spatial spillover effects. By breaking temporal and geographical constraints, it significantly enhances interregional connectivity. While improving the carbon emission efficiency of local grain production, it also exerts a marked inhibitory effect on grain production carbon emissions in other provinces, facilitating coordinated cross-regional carbon abatement. Meanwhile, the flow of digital factors elevates technological standards. Digital technologies alleviate cross-regional resource constraints, increase the frequency of information and technology sharing, and strengthen interregional linkages. Furthermore, the Report to the 20th National Congress of the Communist Party of China stresses the steady advancement of coordinated regional development strategies to strengthen interregional connection intensity. Accordingly, this study proposes the following hypothesis:
Hypothesis 4.
The digital economy exerts significant spatial spillover effects on carbon abatement in grain production.

3.4. Alternative Mechanisms and Comparative Analysis

In addition to the green finance mediating mechanism verified in this study, the existing literature confirms three core alternative transmission channels through which the digital economy affects carbon emissions in grain production. This study further conducts in-depth theoretical analysis and empirical testing of these mechanisms to eliminate confounding interference from competing pathways and ensure the robustness of the core findings.
First is the agricultural technological progress mechanism. Through digital technology diffusion and knowledge spillovers, the digital economy promotes the research, development, popularization, and application of low-carbon agricultural technologies, improves the technical efficiency of grain cultivation, and thereby reduces carbon emission intensity in grain production.
Second is the grain production structure optimization mechanism. The digital economy alleviates information asymmetry in agricultural markets, guides farmers to optimize their planting structure, reduces the planting proportion of high-carbon grain varieties, and raises the share of low-carbon and high-efficiency grain varieties, thereby achieving carbon abatement through production structure optimization.
Third is the agricultural production factor allocation mechanism. The digital economy improves the allocation efficiency of key production factors, including labor, land, and capital, in grain production, mitigates factor misallocation, enhances the total factor productivity of grain cultivation, and thus reduces carbon emission intensity in grain production.
This study empirically tests the above three alternative mechanisms along with the core mediating mechanism of green finance, compares the strength of different mechanisms, and thereby clarifies the unique explanatory power of the green finance mechanism proposed herein.

4. Research Design

4.1. Model Construction

First, based on the above elaborated direct effect mechanisms, this study constructs the following baseline model:
CI it = 0 + 1 D I G it + 2 X it + δ i + τ t + μ it
where CI it denotes the carbon emission intensity of grain production, X it represents the relevant control variables, D I G i t indicates the level of digital economic development in province i in year t, δ i and τ t capture the time and spatial fixed effects respectively, μ i t is the random error term, and 0 is the constant term.
Second, the digital economy exerts an indirect effect on carbon emission intensity in grain production through green finance transmission channels. Based on the above indirect mechanism, the following mediating effect model is constructed:
G F I it = β 0 + β 1 D I G it + β 2 X it + δ i + τ t + μ it
C I it = γ 0 + γ 1 D I G it + γ 2 G F I it + γ 3 X it + δ i + τ t + μ it
As shown in Equations (2) and (3), G F I i t denotes the mediating variable. If the coefficients of 1 , β 1 , and γ 2 are statistically significant, a mediating effect exists. If coefficient γ 1 is insignificant, full mediation occurs; otherwise, partial mediation is present.
Finally, considering the spatial spillover effects of the digital economy on carbon emissions in grain production and drawing on the findings of Zhao et al. (2020) [32], this study incorporates spatial interaction terms for digital economic development, grain production carbon emission intensity, and other variables into Equation (4). Based on this baseline framework, the Spatial Durbin Model is constructed to empirically examine the causal effects of digital economic development on carbon emissions from grain production. The model is specified as follows:
C I it = 0 + 1 D I G it + 2 X it + δ i + τ t + μ it + ρ W C I + φ 1 W D I G it + φ 2 W X it
where parameter ρ denotes the spatial autocorrelation coefficient, W is the spatial weighting matrix, and φ represents the elasticity coefficient of cross-variable spatial interaction terms.

Endogeneity Treatment

Severe endogeneity problems may exist in the baseline model, which can lead to biased estimation results and hinder accurate identification of the causal relationship between the digital economy ( D G I ) and carbon emission intensity in grain production ( C I ). These issues mainly arise from three key sources:
First, reverse causality bias. On the one hand, the development of the digital economy reduces carbon emission intensity in grain production. On the other hand, regions with lower carbon emission intensity and more advanced low-carbon agricultural development tend to possess stronger fiscal capacity and greater market demand for the development and deployment of digital infrastructure, which further accelerates regional digital economic development, thereby forming a bidirectional causal relationship between D G I and C I . Meanwhile, the level of green finance ( G F I ), the mediating variable, is also influenced by the low-carbon development of regional grain production, leading to reverse causality between G F I and C I .
Second, omitted variable bias. Unobservable factors, such as the intensity of regional agricultural policy implementation, rural cultural characteristics, and farmers’ low-carbon production awareness, can simultaneously affect the development of both the digital economy and green finance, as well as carbon emission levels in grain production. Although the two-way fixed effects specification controls for individual and time-invariant fixed effects, it cannot fully eliminate the estimation bias induced by time-varying omitted variables.
Third, measurement error bias. Although the core variables such as D G I and G F I in this study are constructed using authoritative indicator systems and the entropy weight method, measurement errors may still stem from incomplete indicator coverage and statistical deviations, thereby triggering endogeneity issues:
(1)
Instrumental Variable Method (IV-2SLS)
This study adopts two exogenous instrumental variables for the core endogenous variable D G I , which strictly satisfy the relevance and exclusion restriction assumptions:
① Historical instrumental variable: the number of fixed-line telephones per 100 residents in each province in 1984, scaled by the total number of broadband access ports in the previous year. The historical fixed telephone penetration rate reflects the foundation of regional information infrastructure, which is strongly correlated with subsequent digital economic development (satisfying the relevance condition). Meanwhile, the 1984 historical infrastructure data exert no direct causal effect on current carbon emission intensity in grain production and remain unaffected by the contemporary level of low-carbon agricultural development (meeting the exclusion restriction).
② Geographic instrumental variable: the interaction term of the geodesic distance between each provincial capital and Hangzhou and the national digital financial inclusion index for the previous year. Hangzhou is the core hub driving the development of China’s digital economy. Geographic distance from Hangzhou exhibits a significant negative correlation with the diffusion rate and development level of the regional digital economy (satisfying the relevance condition). As a strictly exogenous natural characteristic, geographic distance is unaffected by carbon emission levels in grain production and other economic factors (meeting the exclusion restriction).
Two-stage least squares (2SLS) regression is adopted for estimation, with the corresponding model specifications presented below:
First stage (predict the endogenous variable D I G ):
D I G i t = α 0 + α 1 I V i t + α k C o n t r o l s i t + μ i + v i + ε i t
Second stage (test the core causal relationship):
C I i t = β 0 + β 1 D I G i t + β k C o n t r o l s i t + μ i + v i + T i t
where I V it denotes the instrumental variable, and D G I it is the fitted value of D I G derived from the first-stage regression. All other variables remain consistent with those specified in the benchmark model. To address the inherent endogeneity of the mediating variable G F I , this study further adopts the first-order lag of G F I as an instrumental variable for robustness checks.
(2)
Lagged Term Processing
Given that the impact of digital economic development on carbon emissions in grain production exhibits a lagged effect, and that the lagged term of the core explanatory variable can effectively alleviate reverse causality, the digital economic level in the previous period cannot be affected by contemporaneous carbon emissions from grain production-this study adopts the one-period lag of D I G ( L . D I G ) in regression analysis to further validate the robustness of the core findings.
(3)
Quasi-natural Experiment Based on Multi-period DID
This paper takes the National Digital Rural Pilot Policy, which has been implemented in batches since 2018, as an exogenous policy shock. It constructs a time-varying difference-in-differences (DID) framework to identify the net causal effect of digital economic development on carbon emission intensity in grain production and further verify the underlying causal mechanism. Specifically, provinces designated as digital rural pilot regions serve as the treatment group, whereas non-pilot provinces form the control group. The baseline model is specified as follows:
C I i t = γ 0 + γ 1 T r e a t i t + γ k C o n t r o l s i t + μ i + v t + ω i t
In this specification, T r e a t i t denotes the policy dummy variable, which equals 1 if province i is designated as a digital rural pilot in year t, and 0 otherwise. The coefficient γ 1 captures the net causal effect of the digital rural pilot policy on carbon emission intensity in grain production.

4.2. Variable Selection

4.2.1. Dependent Variable

This study adopts grain production carbon intensity ( C I ) as the core explained variable. Based on IPCC emission coefficients and drawing on the measurement method proposed by Chen et al. [33], the following formula is constructed:
C = C i = T i × δ i
In Equation (8), C denotes the total carbon emissions from grain production, which equals the sum of carbon emissions from six major emission sources in grain farming, as classified in Table 1. Specifically, C i refers to emissions from the i-th source, covering mechanical energy consumption, fertilizer application, pesticide use, agricultural film mulching, irrigation power consumption, and tillage practices. δ i represents the actual consumption or application scale of the i-th emission source in grain production, while δ i denotes the corresponding carbon emission coefficient for the i-th source; the specific coefficient values and cited references are fully presented in Table 1. Equation (8) adopts a two-step calculation principle: first, multiply the actual usage of each of the six emission sources by its matching coefficient to obtain the emissions of each individual source; second, aggregate these individual values to derive the total carbon emissions C from grain production.
On this basis, grain production carbon intensity ( C I ) the core dependent variable in this study is constructed using a two-step accounting framework aligned with the six major carbon emission sources outlined in Table 1. First, total carbon emissions C from grain production are calculated by summing the emissions from the six sources: mechanical energy consumption, fertilizer application, pesticide use, agricultural film mulching, irrigation power consumption, and tillage practices. This calculation follows the IPCC recommended emission factor method with the corresponding coefficients provided in Table 1. Second, the estimated total carbon emissions C are normalized by the gross output value of grain production in the corresponding province for the sample year. This framework makes C I a comprehensive indicator that directly reflects carbon emissions per unit of economic output from grain production. The value of C I depends on three core components: the actual consumption volumes of the six emission sources in Table 1, their respective emission coefficients, and the gross grain output value of the sampled unit.
Compared with the gross agricultural output value commonly used as the denominator in the existing literature, this study adopts grain production output value instead, so as to strictly align the accounting scope with that of the carbon emission numerator. This modification effectively eliminates measurement bias stemming from mismatched boundaries between the grain production sector and the full-spectrum agricultural denominator, allowing the C I indicator to reflect the true carbon emission intensity of grain production more accurately and laying a solid measurement foundation for the subsequent empirical analysis and contribution interpretation of this study.

4.2.2. Core Explanatory Variables

In this empirical analysis, this study defines the comprehensive development level of the digital economy ( D I G ) as the core explanatory variable. Drawing on the framework proposed by Li et al. [38], five dimensional indicators are selected to construct an evaluation system for digital economic development, as summarized in Table 2. These indicators include: internet penetration, measured by the number of internet users per 100 residents; the employment scale of internet-related industries, gauged by the proportion of employees in the computer service and software sector; internet-linked economic output, proxied by per capita telecommunications business volume; mobile internet coverage, calculated as the number of mobile phone subscribers per 100 residents; and inclusive digital financial development, represented by the China Digital Financial Inclusion Index. These indicators effectively capture the dynamic trends and operational ecosystem of the digital economy, along with the progress of inclusive digital finance, while reliably reflecting the overall development of digital economic activities across the sample.
This study takes 30 provincial administrative regions in China as the research sample and calculates the comprehensive index using the entropy weight method. The sample includes 30 provincial units ( i = 1, 2, …, 30) and five evaluation indicators ( j = 1, 2, …, 5). The original indicator matrix is defined as X = ( x i j ) 30 × 5 , where x i j represents the raw value of the j-th indicator for the i-th provincial unit. The detailed calculation steps of this method are presented below:
  • Standardization Processing for Raw indicators
This study adopts min-max normalization to eliminate the influence of dimensional differences among indicators, with the calculation formula presented as follows:
Y i j = x i j min ( x j ) max ( x j ) min ( x j )
In this formula, min( x j ) and max( x j ) represent the minimum and maximum values of the j-th indicator across the 30 provincial units, respectively. If max( x j ) = min( x j ), let yij = 0. Following standardization, yij ∈ [0, 1], forming the standardized matrix Y = ( y i j ) 30 × 5 .
2.
Calculation of indicator proportion
A small constant ε = 10 6 is incorporated for numerical shifting to prevent computational errors in logarithmic transformation caused by zero values, as shown in the formula below:
P i j = y i j + ε i = 1 30 ( y i j + ε )
This formula satisfies I = 1 30 P i j = 1 and 0 < P i j < 1, generating the proportion matrix P = ( P i j ) 30 × 5 .
3.
Calculation of indicator information entropy
The entropy coefficient is K = 1 ln 30 , with the information entropy formula:
e j = i = 1 30 P ij ln ( P ij )
If P ij = 0 , set P ij ln ( P ij ) = 0 . The information entropy e j [ 0 1 ] , and a smaller e j indicates a greater degree of dispersion of the indicator.
4.
Computation of index difference coefficient
The difference coefficient is complementary to information entropy and reflects the discriminative power of each indicator, as given in the following formula:
g j = 1 e j
A larger g j means a higher contribution of the indicator to the comprehensive evaluation.
5.
Calculation of objective indicator weight
The difference coefficients are normalized to obtain the weight of each indicator, with the formula:
w j = g j j 5 g j
This formula satisfies i = 1 5 ω j = 1 . Multiplying ω j by 100 yields the indicator weight percentage shown in Table 2.
6.
Composite Index Construction for Digital Economic Advancement
The digital economy index for the i-th province is calculated as the weighted sum of standardized indicators and their corresponding weights, as shown in the formula below:
D I G i = j = 1 5 ω j × y i j
The D I G i index is bounded between 0 and 1, with a higher numerical value signifying a more advanced degree of digital economy advancement in the corresponding province.

4.2.3. Mediating Variable

This study takes the comprehensive development level of green finance (GFI) as the core mediating variable. Drawing on the findings of Sun et al. (2022) [39], it constructs an evaluation index framework for green finance development, with full details provided in Table 3. The framework comprises seven secondary indicators: green credit, green investment, green insurance, green bond issuance, green policy support, green fund operations, and green equity investment.
The development level of green credit is measured by the proportion of loans allocated to ecological conservation projects. This indicator is defined as the ratio of provincial environmental protection loans to the total outstanding loans of the province, consistent with established academic research [40]. Green investment is reflected by the ratio of environmental pollution abatement investment to regional gross domestic product (GDP). Green insurance market penetration is gauged by the coverage rate of environmental pollution liability insurance, calculated as the share of premiums from such insurance in total insurance industry premiums, drawing on the existing literature [41]. For green bonds, cumulative issuance scale is adopted as the core indicator, namely the ratio of total green bond issuance to overall issuance in the national bond market. For green policy support, support intensity is represented by the proportion of fiscal expenditure on environmental protection, measured as the ratio of ecological fiscal spending to total general public budget expenditure. The development of green funds is quantified by their relative market size, i.e., the ratio of the total net asset value of green funds to the market capitalization of all publicly offered funds in China. Finally, the development depth of the green equity market is assessed via the trading activity of green equity-related assets. This indicator refers to the proportion of cumulative trading volume from carbon emission rights trading, energy use rights trading and pollutant emission rights trading in the total trading volume of China’s equity market, in accordance with prior research [42].
Based on a research sample of 30 Chinese provinces, the index is quantified by the entropy weight method. Let the sample consist of 30 provinces (i = 1, 2, …, 30) and 7 indicators (j = 1, 2, …, 7), with the original indicator matrix defined as X = ( x i j ) 30 × 7 (where X i j denotes the original value of the j-th green finance indicator for the i-th province). The specific calculation steps are as follows:
  • Standardization of original indicators
The min-max standardization method is adopted to eliminate the influence of dimensional differences, with the formula:
Y ij = x i j min ( x j ) max ( x j ) min ( x j )
where min ( x j ) and max ( x j ) are the minimum and maximum values of the j-th green finance indicator across the 30 provinces, respectively. If max ( x j ) = min ( x j ) , set y i j = 0 . After standardization, y i j [ 0 , 1 ] , yielding the standardized matrix Y = ( y i j ) 30 × 7 .
2.
Calculation of indicator proportion
A tiny constant ε = 10 6 is introduced for translation processing to avoid logarithmic operation errors caused by zero values, with the formula:
p i j = y i j + ε i = 1 30 ( y i j + ε )
This formula satisfies i 30 P i j = 1 and 0 < P i j < 1, generating the proportion matrix P = ( P i j ) 30 × 7 .
3.
Calculation of indicator information entropy
The entropy coefficient is k = 1 ln 30 , with the information entropy formula:
e j = k i = 1 30 p i j   ln ( p i j )
If P i j = 0 set P i j ln ( P i j ) = 0 . The information entropy e j [ 0 1 ] , and the smaller the numerical value of e j the wider the dispersion range exhibited by the underlying indicator.
4.
Variation Coefficient Estimation for Evaluation Indicators
The difference coefficient serves as the complement of information entropy and reflects the discriminative ability of each evaluation indicator, as shown in the formula below:
g j = 1 e j
A greater g i value indicates a higher contribution of this indicator to comprehensive evaluation.
5.
Calculation of objective indicator weight
The divergence coefficients are normalized to determine the weight of each underlying indicator, with the formula outlined below:
w j = g j j = 1 7 g j
This formula satisfies j = 1 7 w j = 1 .
6.
Calculation of comprehensive green finance index
The green finance index for the i-th province is obtained from the weighted sum of standardized indicator values, with the formula shown below:
G F I i = j = 1 7 w j × y i j
The G F I i , whose valid values are strictly constrained within the closed interval from 0 to 1, follows a core principle that a higher index value corresponds to a more mature development level of green finance across the corresponding provincial-level administrative unit.

4.2.4. Control Variables

Given that carbon emissions from grain production are also affected by other factors, these determinants are incorporated into the model as control variables. Specifically, the control variables include the following: (1) Green Innovation Efficiency (EFF), calculated using the SBM model with selected indicators; (2) Industrialization (IDT), represented by the ratio of industrial value added to gross domestic product; (3) Traffic Density (TRAFFIC), measured as the ratio of total railway and highway mileage to the land area of the respective region; (4)Fiscal support intensity for agriculture (CZ), defined as the share of agricultural fiscal expenditure in general public budget expenditure; (5) Agricultural planting structure (ZZ), captured by the proportion of grain sown area in total crop sown area.

4.3. Data Sources

This study covers 30 provinces in mainland China (excluding Hong Kong, Macao and Taiwan) over the period 2012–2021. The sample period terminates in 2021 because complete and standardized provincial panel data for subsequent years are unavailable: relevant statistical indicators regarding grain production carbon emissions, digital economic development and green finance development had not been fully published and compiled in official yearbooks and statistical bulletins upon the completion of this study. All research data are obtained from authoritative statistical sources. The core data stem from the China Agricultural Machinery Industry Yearbook, China Statistical Yearbook, and China Rural Statistical Yearbook, supplemented by official annual statistical communiques and yearbooks issued by each sample province, ensuring the authenticity and reliability of the empirical data throughout the research period.
To avoid spurious regression, the LLC test is applied to examine unit roots across all variables. The results indicate that most variables reject the null hypothesis at the 1% significance level, confirming the absence of unit roots and ensuring data stationarity, which validates the subsequent empirical analysis. Detailed test statistics are reported in Table 4.

5. Empirical Findings and Analysis

5.1. Benchmark Regression Analysis

The benchmark regression results reported in Table 5 demonstrate that digital economic development exerts a significantly negative, statistically robust effect on the carbon emission intensity of grain cultivation. This inhibitory effect remains stable in both directions and statistical significance after the inclusion of control variables, retaining a pronounced negative impact. These baseline regression findings confirm that the advancement of the digital economy can markedly suppress carbon emissions arising from the grain production process, which delivers robust empirical support for Hypothesis 1 proposed in this study. For the control variables, transport density also exerts a significantly negative influence on the carbon emission intensity of grain farming activities. Although not statistically significant, industrialization level and agricultural crop structure exhibit negative effects, suggesting that optimizing crop structures reduces the proportion of high-carbon-emission crops while increasing low-carbon-emission crops, thereby lowering carbon emissions from grain production. Concurrently, increased industrialization exerts a negative influence on carbon emissions from grain production. This may stem from industrialization promoting agricultural scale expansion and advancing agricultural technologies, rendering production processes more environmentally friendly and consequently reducing carbon emissions; the estimated coefficient for green innovation efficiency with respect to carbon emission intensity in grain production is positive and statistically significant. This may stem from green technology applications relying on energy support, for instance, intelligent agricultural systems require substantial electricity and other fossil fuels, leading to higher carbon dioxide emissions. Fiscal support for agriculture positively impacts carbon emission intensity, potentially because subsidies and funding may stimulate expansion of grain production activities and increased use of agricultural inputs, thereby driving up total carbon emissions generated by agricultural production activities.
In addition to the baseline regression, we further conducted robustness checks to verify the stability and reliability of our model specification. Specifically, we adopt the natural logarithm of aggregate carbon emissions from grain cultivation as an alternative proxy for grain production carbon intensity to replace the core explained variable in the benchmark model. The estimation results show that our core explanatory variable (DIG) still exerts a statistically significant impact on grain production carbon intensity at the 1% confidence level, which fully validates the robustness of the baseline regression results.

Endogeneity Test

To mitigate potential endogeneity concerns, including reverse causal effects and estimation bias stemming from unobserved omitted variables, and to precisely identify the causal nexus between digital economic development and the carbon emission intensity of grain cultivation, we implemented a series of endogeneity tests using the instrumental variable approach, lagged-term regression, and multi-period difference-in-differences (DID) model, with the full test results reported in Table 6.
(1)
Instrumental Variable Method Test Results
The first-stage regression estimation results revealed that the two selected instrumental variables yielded coefficients of 0.318 and −0.274 for the core explanatory variable DIG, both of which were statistically significant at the 1% confidence level, fully aligning with our prior theoretical expectations. Meanwhile, the F-statistic from the first-stage regression reached 42.68, far exceeding the critical threshold of 10 for the weak instrument test. This result effectively rules out concerns regarding weak instruments in our model specification.
For the second-stage regression, the estimation results demonstrated that the regression coefficient of DIG on the explained variable CI is −0.312, which passed the test for statistical significance at the 1% level. This finding was fully consistent with the coefficient sign and statistical significance level of the benchmark regression, while the absolute value of the coefficient was slightly higher than that of the benchmark regression estimate. This confirmed that after addressing endogeneity issues including reverse causality, omitted variable bias, and measurement errors, the advancement of the digital economy still exerted a significant causal inhibitory impact on the carbon emission intensity of grain production, verifying that the core conclusion of our research is highly robust.
(2)
Lagged Term Regression Results
The regression estimation of the first-order lagged term of the core explanatory variable DIG (denoted as L.DIG) on the explained variable CI yielded a coefficient of −0.217, which was statistically significant at the 1% confidence level and fully aligned with the core findings of our baseline regression. Given the inherent temporal logic that the current carbon emission level from grain production could not exert any impact on the digital economic development level in the prior period, this estimation result further eliminated the interference of reverse causality on our core research conclusion and effectively validated the causal nexus between digital economic development and carbon emission reduction in grain production.
(3)
Multi-period DID Model Test Results
The baseline regression results of the multi-period DID model revealed that the estimated coefficient of the core treatment variable Treat was −0.187, which was statistically significant at the 5% confidence level. This finding confirmed that the nationwide implementation of the digital countryside pilot policy exerted a significant inhibitory effect on the carbon emission intensity of grain production across the pilot regions. On this basis, we further conducted a battery of robustness checks on the baseline DID model: the parallel trend assumption test confirmed that there was no statistically significant divergence in the evolutionary trend of grain production carbon emission intensity between the treatment group and control group before the policy rollout, which fully satisfied the parallel trend identification premise required for the difference-in-differences (DID) model. The falsification test (placebo test) based on 500 rounds of random assignment of treatment units showed that the estimated coefficients of the policy treatment dummy clustered near zero, with the vast majority failing to pass the statistical significance test, thus effectively eliminating the disturbance of stochastic confounding factors on the baseline regression findings. Furthermore, the robustness test excluding concurrent policy interference indicated that the coefficient of the Treat variable remained significantly negative after controlling for the effects of other agricultural low-carbon development policies, which further validated the reliability of the DID estimation results. The findings of this quasi-natural experiment further corroborated the causal linkage between digital economic development and the decline of carbon emission intensity in grain production.
Furthermore, to address the potential endogeneity concerns associated with the mediating variable GFI, this study adopted the first-order lagged term of GFI as the instrumental variable to perform a robustness check for the mediation effect estimates. The test results revealed that after correcting for the endogeneity bias of GFI, the partial mediating effect of green finance remained statistically significant at the 5% confidence level, which fully validated that the core conclusion regarding the mediating transmission mechanism of this study remained highly robust.

5.2. Testing the Mediating Effect

To further unpack the transmission mechanism underlying the impact of digital economic development on carbon emissions from grain production, we selected green finance as the core mediating variable for the mechanism identification test in this study. Table 7 presents the detailed regression results for this mechanism analysis.
Model 1 estimated the total effect of digital economic development on the carbon emission intensity of grain cultivation, excluding the pre-specified mediating factor. The regression results demonstrated that the coefficient of digital economic development on carbon intensity was −0.253, confirming that advances in the digital economy significantly curb carbon emissions generated during grain farming activities.
Model 2 tested the causal effect of digital economic development on the mediating variable, green finance. The estimation results showed that the digital economy had a positive estimated coefficient of 0.422 on green finance, which is statistically significant at the conventional significance level. This finding indicated that the robust development of the digital economy could effectively elevate the overall development level of green finance. From one perspective, the digital economy facilitated the popularization and application of big data and digital technologies, building a sound information sharing network for green financial services. This effectively alleviated the long-standing problem of information asymmetry in the credit market and further improved the service efficiency and quality of green finance. From another perspective, the advancement of the digital economy spawned the rapid growth of digital inclusive finance. Through the construction of a multi-level financial service system, it promoted the inclusive and balanced development of digital financial services, which in turn drove the high-quality development of green finance.
Model 3 investigated the transmission effect of digital economic development on grain production carbon emission intensity after incorporating the mediating variable. The regression findings revealed that green finance had a significantly negative coefficient of −0.079. This confirms the existence of a significant mediating effect of green finance, that is, green finance plays a partial mediating role in the inhibitory effect of digital economic development on grain production carbon emission intensity.
To improve the reliability and precision of our empirical findings, we further adopted the bootstrap sampling method to test the statistical significance of the mediation effect. Specifically, a significant mediating effect was validated if the 95% confidence interval of the indirect effect excluded zero. Meanwhile, full mediation was confirmed when the 95% confidence interval of the direct effect contained zero; otherwise, a partial mediation effect was established. The complete results of the bootstrap mediation mechanism test are presented in detail in Table 8. More precisely, at the 95% statistical confidence level, the bias-corrected confidence interval of the indirect effect was [−0.137, −0.031], while the corresponding confidence interval for the direct effect was [−0.188, −0.047]. Meanwhile, the percentile-adjusted confidence intervals estimated under the same confidence level were [−0.140, −0.034] for the mediating transmission effect and [−0.187, −0.046] for the direct causal effect, with none of the above intervals covering zero. This finding validated the existence of the mediating transmission mechanism, where green finance exerts a partial mediating effect in the process of digital economic development curbing carbon emission intensity from grain cultivation. Accordingly, Hypothesis 2 and Hypothesis 3 of this study were empirically supported.

5.3. Spatial Spillover Effect Test

5.3.1. Test for Global Autocorrelation

In this study, we adopted a spatial econometric analytical framework to empirically identify the causal effect of digital economic development on the carbon intensity of grain cultivation. Before formal model specification and regression estimation, we conducted the global Moran’s I test to verify the presence of global spatial dependence among all core research variables. Only variables passing the statistical significance test were included in the subsequent rigorous spatial econometric regression models. The global Moran’s I is strictly constrained to the closed interval from −1 to 1, and a statistically significant value confirms notable spatial correlation between digital economic development and carbon emission levels from grain production. A significantly positive Moran’s I (greater than 0) denotes positive spatial dependence, while a negative value (less than 0) signifies negative spatial dependence. Table 9 presents the Moran’s I results, revealing positive spatial autocorrelation in the index values for the period 2012–2021. This indicates significant spatial interaction between the digital economy, carbon emissions from grain production, and adjacent regions.

5.3.2. Local Autocorrelation Test

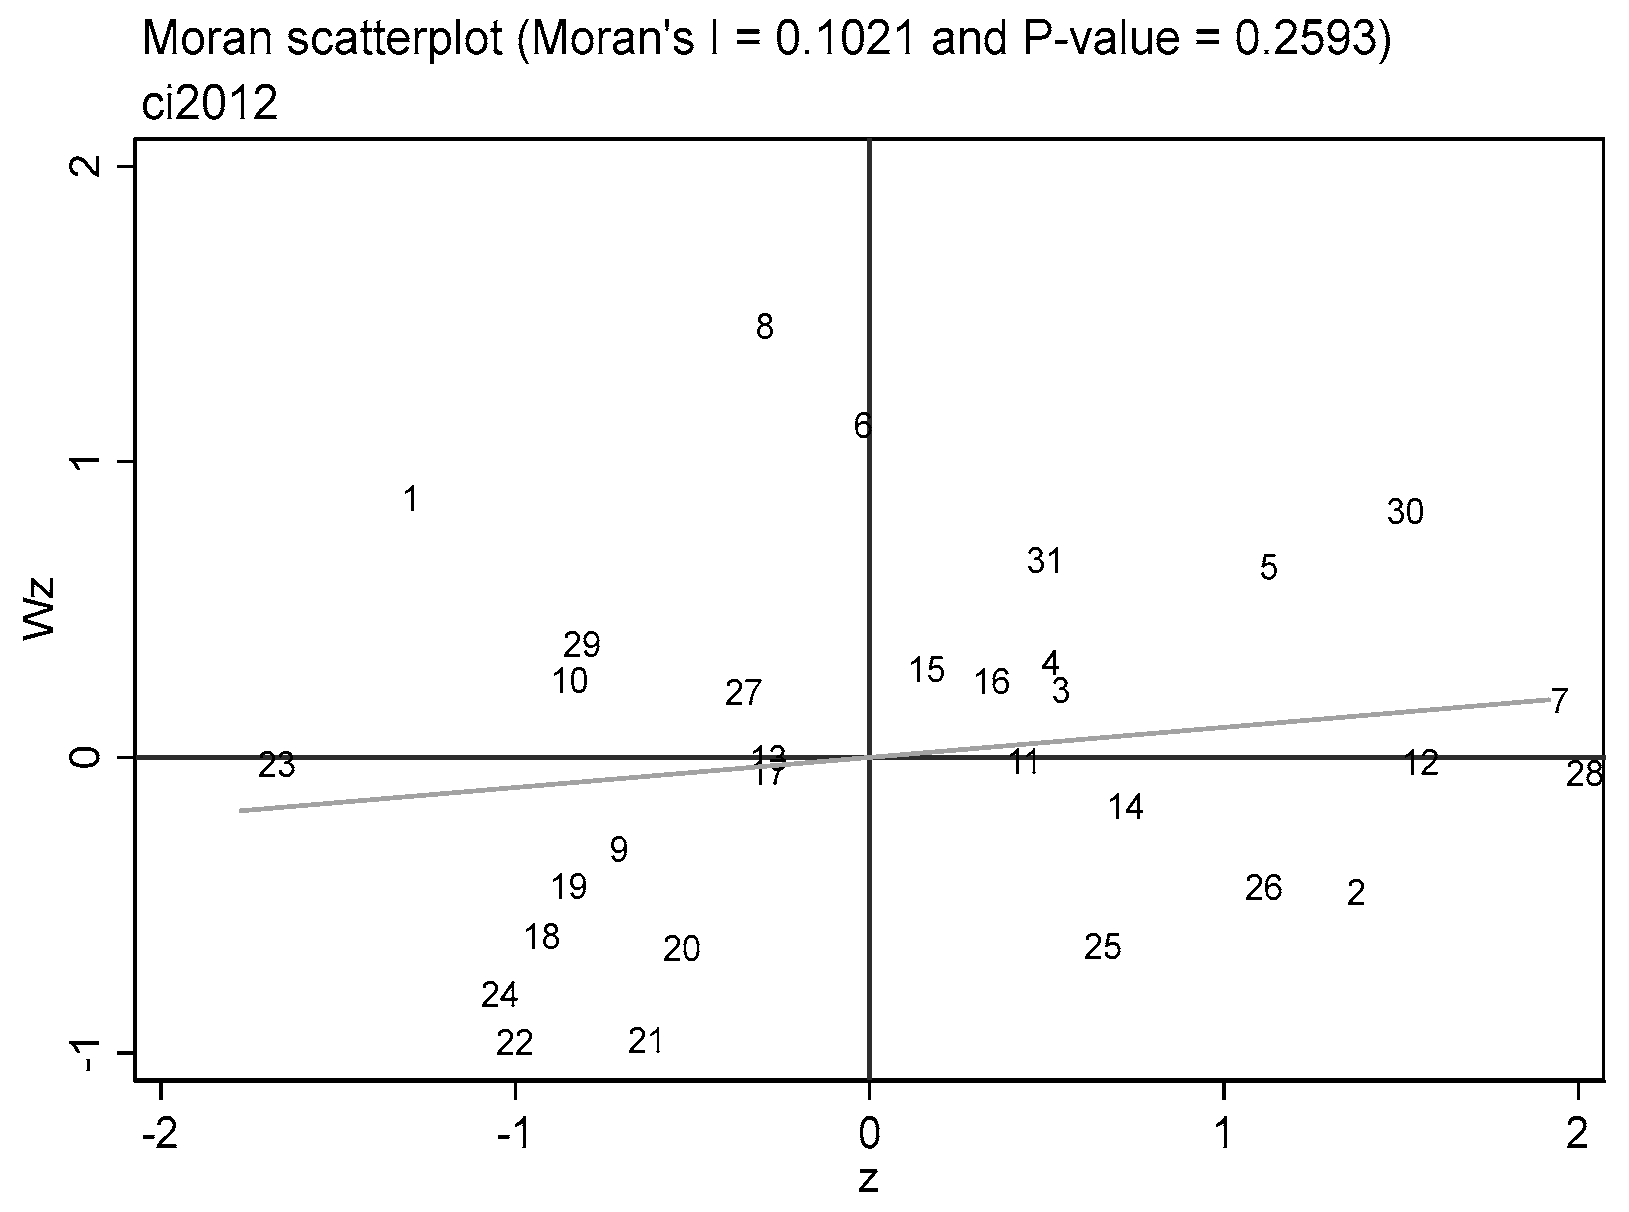
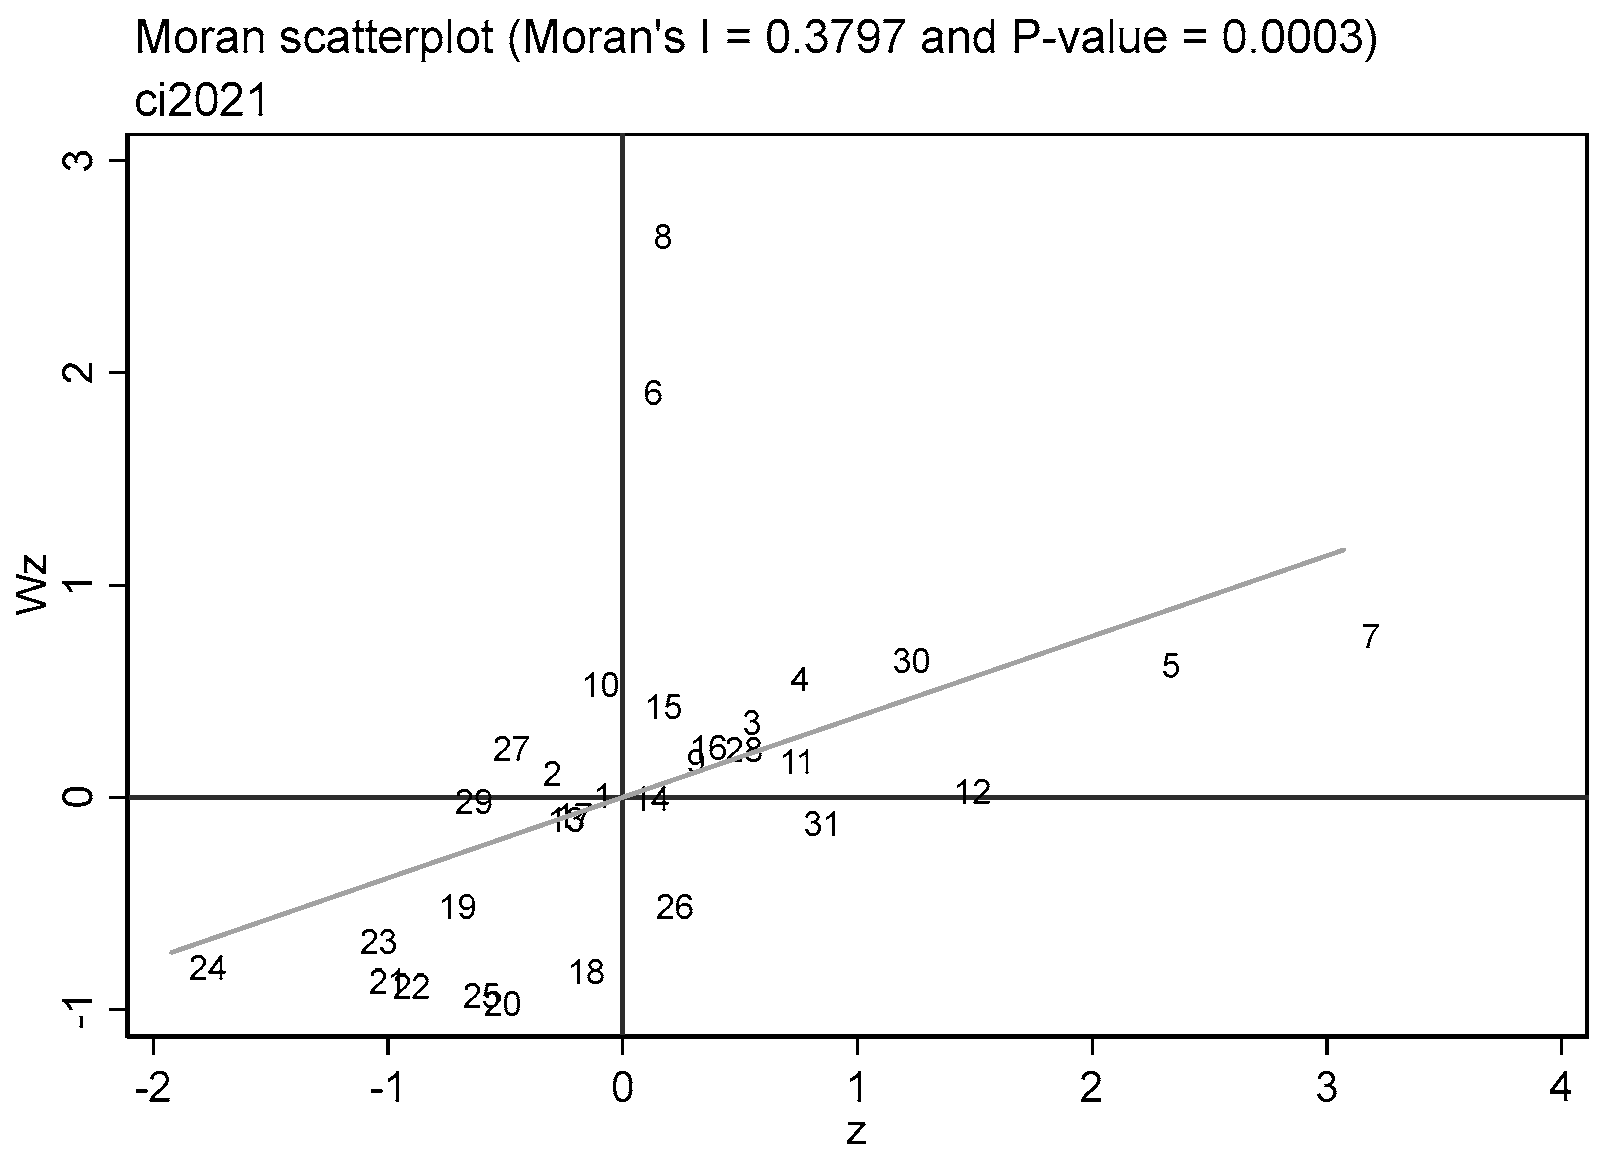
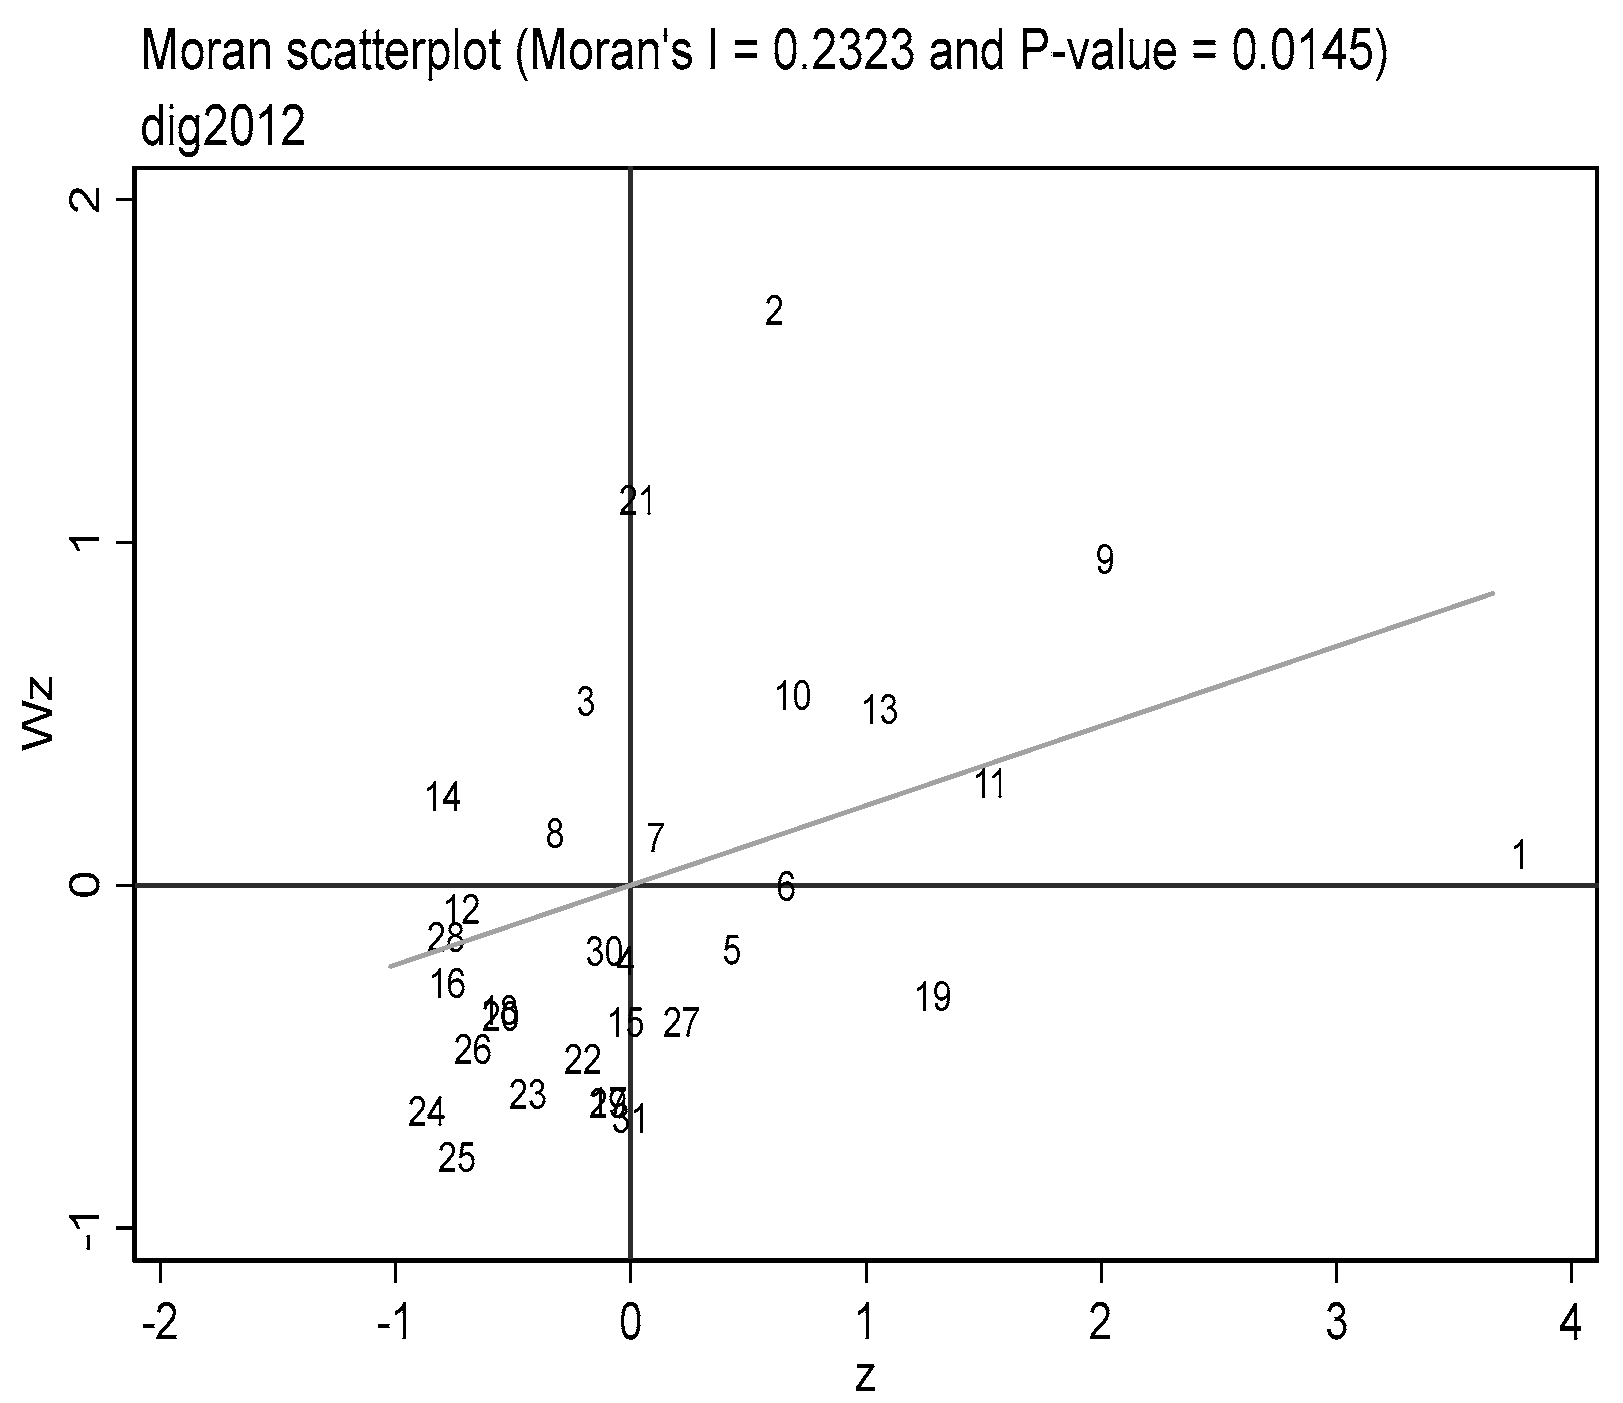
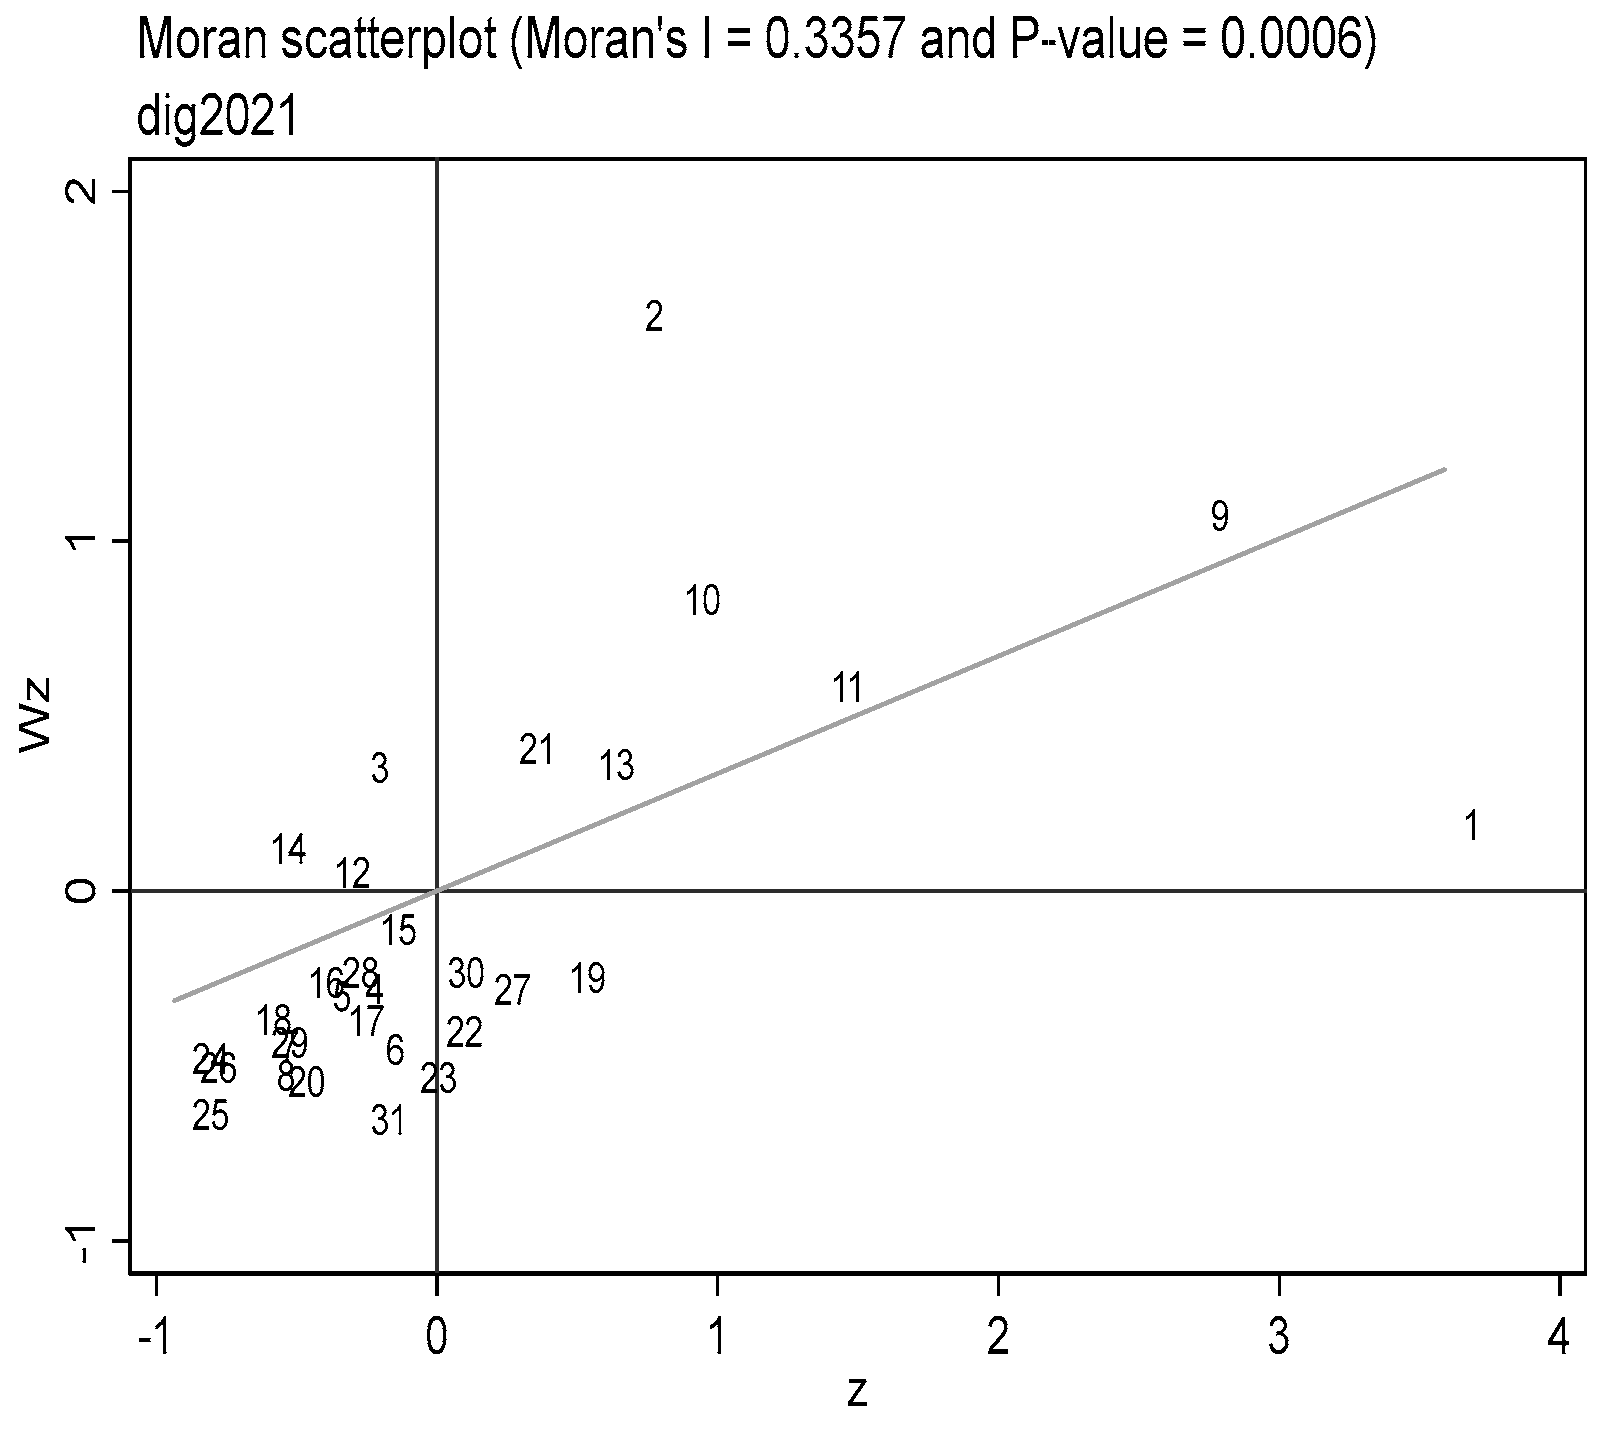
To further characterize the spatial agglomeration patterns of digital economic development and grain production carbon emission intensity across sample provinces, this study adopted the local Moran’s I statistic for spatial distribution pattern identification. Figure 1, Figure 2, Figure 3 and Figure 4 display the local Moran’s I scatter plots for digital economic development and grain production carbon emissions in the sample years 2012 and 2021, respectively.
The 30 sampled provinces in this study were divided into four quadrants based on the scatter plot results, with each quadrant corresponding to a distinct spatial agglomeration type:
The first quadrant corresponded to the high-high (H-H) agglomeration region, which referred to provinces with high indicator values adjacent to neighboring areas with similarly high values. This pattern reflected positive spatial autocorrelation, meaning both the digital economic development level and grain production carbon emission intensity were at high levels in the local province and its surrounding regions.
The second quadrant denoted the low-high (L-H) agglomeration region, where provinces with low observed indicator values were encircled by neighboring regions with high indicator values. This pattern formed negative spatial dependence, indicating that the local province had a low level of digital economic development and low grain production carbon emission intensity, while its adjacent areas showed significantly higher levels on both indicators.
The third quadrant represented the low–low (L–L) agglomeration region, in which regions with low indicator values were bordered by adjacent areas with equally low indicator values. This pattern also exhibited positive spatial autocorrelation, meaning both the digital economic development level and grain production carbon emission intensity remained at low levels in the local region and its neighboring provinces.
The fourth quadrant referred to the high-low (H-L) agglomeration region, where provinces with high indicator values were surrounded by neighboring regions with low observed values. This pattern reflected negative spatial dependence, indicating that the local province had a higher level of digital economic development and lower grain production carbon emission intensity, while its adjacent areas exhibited the exact opposite characteristics.
A comprehensive analysis of Figure 1, Figure 2, Figure 3 and Figure 4 showed that the fitted regression line in all scatter plots had a positive slope, with the vast majority of sample provinces distributed in Quadrant I and Quadrant III. This confirmed that digital economic development and grain production carbon emission intensity exhibited dominant spatial patterns of H-H agglomeration and L-L agglomeration across the sample. On this basis, this study adopted spatial econometric models for empirical estimation to further identify the causal impact of digital economic development on grain production carbon emission intensity.

5.3.3. Spatial Durbin Model

To identify the optimal spatial econometric specification for this study and improve the precision of our empirical estimation, we systematically conducted a series of standard diagnostic tests, including the Lagrange Multiplier (LM) test, Likelihood Ratio (LR) test, and Wald test.
The LM test results confirmed that both the spatial lag model (SLM) and spatial error model (SEM) were statistically significant at the 1% confidence level, thus rejecting the corresponding null hypotheses. This finding indicated that our research sample presented significant spatial lag dependence and spatial error dependence simultaneously.
In addition, the Hausman specification test generated a p-value below the conventional 0.05 threshold, which validated the adoption of a fixed-effects model specification.
Finally, we performed the LR and Wald tests for further model optimality verification. The tests yielded LR(lag), LR(error), Wald(lag), and Wald(error) statistics of 64.96, 58.85, 72.30, and 65.33, respectively. All statistics rejected their respective null hypotheses at the 1% confidence level, demonstrating that the spatial Durbin model (SDM) is the best-fitting and most appropriate specification for this research.
Accordingly, we employed the fixed-effects SDM as the baseline model for our subsequent empirical analysis.
Table 10 reports the baseline estimation results of the spatial Durbin model constructed with the spatial contiguity weight matrix. The results showed that the digital economy yielded a direct effect coefficient of −0.270 on grain production carbon emission intensity, which was statistically significant at the 1% confidence level. This finding confirmed that the advancement of the digital economy significantly curbed the carbon intensity of grain cultivation within the local region.
In terms of spatial spillover effects, the indirect effect coefficient of the digital economy on grain production carbon emission intensity was estimated at −3.858, which also passed the 1% statistical significance test. This result verified that digital economic development had a pronounced negative spatial spillover effect: the improvement of the digital economy in a local province could also exert a significant inhibitory effect on the grain production carbon emission intensity of adjacent areas, which provided solid empirical support for the validity of Hypothesis 4.

5.4. Heterogeneity Analysis

Given China’s vast territorial expanse, marked disparities in development levels persist across regions, along with an uneven distribution of digital economic development in agriculture among provincial administrative units. To further unpack the heterogeneous impacts of digital economic development on grain production carbon emission intensity across different regions and ensure the robustness and accuracy of our empirical estimation, we categorized the 30 provincial-level administrative units in mainland China into three major regional clusters following widely accepted academic geographic criteria: eastern China, central China, and western China. The full regression results of this regional heterogeneity test were presented in detail in Table 11.
The heterogeneity estimation results reported in Table 11 confirmed significant regional divergence in the effect of digital economic development on grain production carbon emission intensity across China’s eastern, central, and western geographic clusters.
For the eastern subsample, the estimated coefficient of digital economic development on grain production carbon emissions was significantly negative at the 5% significance level, confirming that digital economic development delivered a tangible carbon abatement effect on local grain production activities. For China’s central region, the regression coefficient of digital economic development on grain production carbon emissions was also negative and passed the 1% significance test. This finding verified that digital economic development similarly exerted a significant emission-reduction effect in central China.
Notably, although the digital economy presents a significant inhibitory effect on grain production carbon emissions in both eastern and central China, the absolute magnitude of the coefficients showed a clear divergence: the emission-reduction effect of the digital economy in the central region was markedly stronger than that in the east. This heterogeneity can be explained by two core factors. First, the eastern region had a more advanced economic development level and a more optimized industrial structure, which left limited room for the digital economy to further penetrate the agricultural sector and exert its emission reduction effect. Second, the eastern region already had higher carbon emission efficiency in grain production, so the marginal emission abatement potential of further digital economy development was relatively constrained.
By contrast, for the western region, the estimated coefficient of digital economic development on grain production carbon emissions was negative but failed to pass the conventional statistical significance test. The underlying reasons were twofold. On the one hand, the western region exhibited relatively lagging technological development, which severely restricted the penetration and large-scale application of digital economic technologies in the agricultural sector. On the other hand, the western region had a lower overall economic development level and relatively backward infrastructure, which further constrained the deep integration of the digital economy with local agricultural production activities.

6. Conclusions and Recommendations

6.1. Conclusions

For central China, the regression coefficient of digital economic development on grain production carbon emissions was negative and statistically significant at the 1% significance level. This confirmed that digital economic development similarly exerted a tangible carbon abatement effect on grain production carbon emissions across the central region.
Our empirical findings further validated that the targeted deployment of digital technologies across crop planting, field management, and the entire production chain constitutes the core driver of reducing grain production carbon intensity. This finding pinpoints the core entry point for the digital economy to drive agricultural carbon abatement and carried critical practical implications for guiding local governments to design more tailored digital agriculture development strategies.
This core finding indicated that advancing the digital transformation of agricultural production is not only a critical path to boost agricultural production efficiency but also a core strategic initiative to achieve the “dual carbon” targets in China’s agricultural sector.
In terms of the transmission mechanism, digital economic development indirectly curbed the carbon intensity of grain production through the mediating channel of advancing green finance development. This result was consistent with the theoretical framework proposed by Zhang, H. et al. (2024) [29] on green finance supporting ecological agriculture, and offered micro-level empirical evidence for their theoretical logic. The policy enlightenment drawn from this mechanism test is that advancing agricultural carbon abatement cannot rely solely on mandatory administrative orders or single-dimensional technological popularization, but also needs to build a sound market-based incentive system. The government should guide financial institutions to use digital technologies to identify and evaluate agricultural green projects, develop innovative financial instruments including carbon emission credits and green agricultural insurance, and make green finance a core bridge connecting digital economic development and low-carbon agricultural transformation, thus forming an endogenous driving force for long-term agricultural carbon reduction.
From the perspective of spatial spillover, digital economic development exhibits a significant negative spatial spillover effect: the advancement of digital economic development in a local province can effectively curb the carbon emission intensity of grain production in adjacent areas. The existing literature has mostly focused on the local carbon abatement effect of the digital economy within a single region, whereas this paper employs the spatial Durbin model to verify that digital economic development in a local province can also generate significant carbon reduction dividends for neighboring regions. This finding is of considerable guiding significance for promoting collaborative carbon governance in contiguous major grain-producing areas. In the process of advancing the “Digital China” initiative, we should not only focus on the regional coordinated layout of digital infrastructure, but also prioritize the construction of cross-regional agricultural data interconnection and sharing platforms, as well as cross-regional technical cooperation and exchange mechanisms. By strengthening such spatial linkages, the carbon reduction dividends of digital economic development can be expanded from the local scope to a wider regional scope, forming a positive interactive pattern of regional collaborative carbon reduction.
Finally, in terms of regional heterogeneity, the carbon abatement effect of digital economic development on grain production showed significant regional divergence: the carbon reduction effect was prominent in eastern and central China, while the carbon abatement effect in western China was not statistically significant. This result did not deny the carbon reduction potential of the digital economy, but revealed the existing bottlenecks in western China, such as backward digital infrastructure and insufficient capacity to adopt agricultural technologies. This finding further highlighted the necessity of formulating differentiated and region-specific support policies.

6.2. Recommendations

6.2.1. Solidify the Digital Economy Foundation and Advance the Deep Integration of Digital Technologies into Agriculture

The core prerequisite for unlocking the digital economy’s carbon abatement potential in grain cultivation lies in upgrading the digital infrastructure system for agricultural development and building a long-term mechanism for the sustainable development of digital agriculture. To this end, priority should be given to expediting the nationwide deployment of new digital infrastructure, advancing the deep integration of digital and intelligent technologies including big data, 5G, and blockchain across the entire production chain of grain farming, building a full-coverage operational system for agricultural big data, and achieving a scientifically rational layout of big data-related infrastructure in China’s major grain-producing regions to support the sustainable intensification and low-carbon transformation of grain production. Concurrently, leveraging smart agricultural technologies to monitor real-time crop supply-demand dynamics and growth conditions enables the precise allocation of production resources, advancing the full adoption of site-specific precision nutrient application, water-efficient irrigation technologies, and eco-friendly pest prevention and control to curb agricultural carbon emissions at the production source and improve the resource use efficiency and sustainable production capacity of grain farming systems. On the other hand, accelerate the optimization of grain production methods by actively promoting energy-efficient agricultural machinery such as fuel-saving tractors, to reduce fossil fuel consumption and tangibly cut carbon emissions during grain production and promote the sustainable upgrading of agricultural mechanization. Finally, strengthen the precise management of fertilizer application in grain cultivation: implement soil-test-based formulated fertilization and promote the replacement of synthetic fertilizers with organic amendments to further reduce the carbon intensity of grain cultivation and maintain the long-term sustainable fertility of cultivated land, which is the core carrier of grain production.

6.2.2. Vigorously Developing Green Finance and Strengthening Financial Support

We should actively respond to national policies that promote the synergistic pursuit of carbon peaking, carbon neutrality goals, grain security and the sustainable development of grain production. Establish a scientific and systematic methodology for agricultural carbon emissions accounting and low-carbon agriculture assessment standards. Utilize standardized systems to accurately measure carbon emissions across the entire grain production process, thereby enabling precise carbon management to effectively reduce the carbon intensity of grain production and form a standardized evaluation system for the sustainable development level of grain production. Accelerate the integration of green finance into the grain production sector, broaden financing channels for green agriculture, improve the efficiency and accessibility of capital supply, effectively ease the financing pressure on agricultural operators, and drive the transformation of traditional grain cultivation models toward green, low-carbon and sustainable intensive development approaches. Strengthen the risk-sharing function of green finance, improve the institutional mechanisms for green agricultural insurance, thereby enhancing the resilience of agricultural operators against natural and market risks, fully mobilizing the enthusiasm of various entities to participate in green agricultural development, consolidating the safeguards for the green upgrading of grain cultivation, and thus accelerating the high-quality transformation of conventional agriculture toward modern intensive and sustainable development agriculture to ensure the long-term stability and sustainable improvement of grain production capacity while achieving carbon emission reduction targets.

6.2.3. Strengthen Interregional Connectivity to Enhance the Digital Economy’s Capacity to Abate Carbon Emissions from Agricultural Production

Further refine the agricultural infrastructure supporting grain production, narrow regional disparities in the development of digital agricultural infrastructure, break down temporal and spatial barriers, and realize the mutual sharing of grain production information to lay a solid foundation for the coordinated and sustainable development of grain production across regions. This will help farmers promptly access green and advanced cultivation techniques, thereby curbing carbon emissions from grain cultivation at the source and laying a solid foundation for the green development of agriculture and the continuous improvement of the sustainable production capacity of the grain industry. Actively promote technological innovation and its application in grain farming, and launch cross-regional joint campaigns for agricultural technology promotion. Accelerate the large-scale application of digital technologies to reduce agricultural carbon emissions from grain farming, fully unleash the empowering potential of digital economic development for low-carbon grain farming, and expedite the transformation from traditional cultivation models to green, low-carbon and sustainable circular development models. Simultaneously, fully leverage advanced technologies such as big data to build a shared environmental monitoring data platform. Use this platform to achieve cross-regional data interoperability and sharing, improve regional mechanisms for pollution prevention and control, and while reducing carbon emissions from local grain production, promote resource conservation and pollution reduction in grain production across surrounding areas, forming a sound pattern of collaborative carbon reduction and coordinated sustainable development of grain production in contiguous areas.

6.2.4. Actively Promote Agricultural Technologies and Strengthen Policy Support for Western Regions

Firstly, actively promote the adoption of low-carbon agricultural digital technologies in the agricultural sector. Accelerate the deployment of digital tools such as intelligent irrigation systems, agricultural drones, and agricultural big data platforms to improve the sustainable development capacity of grain production in underdeveloped regions. By precisely collecting core data on meteorological conditions, soil properties, and crop growth, as well as scientifically analyzing soil moisture levels and crop needs, customized cultivation plans can be provided to farmers. This facilitates the implementation of precision fertilization and sowing, thereby reducing resource waste at the source and supporting carbon abatement in grain production and the sustainable utilization of agricultural resources such as water, soil and fertilizer. Secondly, enhance policy support. Governments should roll out targeted measures, such as fiscal subsidies and tax breaks, to encourage farmers to adopt low-carbon agricultural technologies. This will accelerate the deep integration of the digital economy with agricultural production, and leverage policy instruments to promote the scientific decarbonization of agriculture and establish a long-term policy support system for the sustainable low-carbon development of grain production. Finally, deepen regional collaboration. Recognizing the regional heterogeneity of the carbon-reduction effect of the digital economy, promote the establishment of technical cooperation mechanisms between the eastern and western regions. Introduce advanced low-carbon agricultural technologies and practical experience from the eastern regions to achieve resource sharing and complementary advantages and promote the balanced and sustainable development of grain production across the country. This targeted initiative will not only bridge the technological gaps in western China, but also amplify the carbon abatement effect of digital economy development in curbing agricultural production-related carbon emissions in these regions and comprehensively improve the overall sustainable development level of China’s grain production system.

Author Contributions

Conceptualization, X.X., T.L., J.W. and L.W.; methodology, T.L.; software, None; validation, T.L. and L.W.; formal analysis, X.X. and L.W.; investigation, X.X., N.H., T.L. and L.W.; resources, J.W.; data curation, N.H.; writing—original draft preparation, X.X. and N.H.; writing—review and editing, T.L., J.W. and L.W.; visualization, X.X. and N.H.; supervision, T.L. and L.W.; project administration, J.W.; funding acquisition, X.X. All authors have read and agreed to the published version of the manuscript.

Funding

This research was supported by the National Social Science Fund of China (Grant No. 24BGJ019).

Institutional Review Board Statement

Not applicable.

Informed Consent Statement

Not applicable.

Data Availability Statement

The data supporting the findings of this study are openly available from official public statistical publications, including the China Agricultural Machinery Industry Yearbook (http://www.amiy.com.cn/), China Statistical Yearbook (https://www.stats.gov.cn/sj/ndsj/), China Rural Statistical Yearbook (https://www.stats.gov.cn/zs/tjwh/tjkw/tjzl/index_1.html), and the statistical yearbooks and statistical bulletins of each provincial-level administrative region in China (http://www.stats.gov.cn/fw/wsbs/).

Conflicts of Interest

The authors declare no conflict of interest.

References

  1. Tubiello, F.N.; Salvatore, M.; Rossi, S.; Ferrara, A.; Fitton, N.; Smith, P. The FAOSTAT database of greenhouse gas emissions from agriculture. Environ. Res. Lett. 2013, 8, 015009. [Google Scholar] [CrossRef]
  2. Valin, H.; Havlík, P.; Mosnier, A.; Herrero, M.; Schmid, E.; Obersteiner, M. Agricultural productivity and greenhouse gas emissions: Trade-offs or synergies between mitigation and food security? Environ. Res. Lett. 2013, 8, 035019. [Google Scholar] [CrossRef]
  3. Vetter, S.H.; Sapkota, T.B.; Hillier, J.; Stirling, C.M.; Macdiarmid, J.I.; Aleksandrowicz, L.; Green, R.; Joy, E.J.; Dangour, A.D.; Smith, P. Greenhouse gas emissions from agricultura food production to supply Indian diets: Implications for climate change mitigation. Agric. Ecosyst. Environ. 2017, 237, 234–241. [Google Scholar] [CrossRef]
  4. Peter, C.; Helming, K.; Nendel, C. Do greenhouse gas emission calculations from energy crop cultivation reflect actual agricultural management practices? A review of carbon footprint calculators. Renew. Sustain. Energy Rev. 2017, 67, 461–476. [Google Scholar] [CrossRef]
  5. Sun, C.-F.; Jiang, W.; Gao, W.-D. Spatial-temporal Evolution and Influencing Factors of Land Use Carbon Emissions in Shandong Province. Environ. Sci. 2025, 46, 30–40. [Google Scholar]
  6. Zhu, J.W.; Liu, W.B.; Liu, J.D. Study on the Temporal Changes and Influencing Factors of Agricultural Carbon Emissions in Inner Mongolia Autonomous Region. J. Nat. Sci. Hunan Norm. Univ. 2023, 46, 20–28. [Google Scholar]
  7. Fan, Z.; Xing, W.; Bu, Y.; Liu, J. Calculation and peak analysis of carbon emissions from agricultural planting in Jiangsu Province. J. Soil Water Conserv. 2023, 37, 78–85. [Google Scholar] [CrossRef]
  8. Mao, X.; Zhu, H.; Bao, Z.; Li, B. Distribution characteristics and carbon emission effects of straw burning hotspots from the perspective of urban-rural linkage. Mod. Urban Res. 2023, 38, 17–22. [Google Scholar] [CrossRef]
  9. Tian, Y.; Zhang, C. Evaluation of China’s Agricultural Energy Carbon Emission Reduction Maturity and Its Dynamic Evolution. China Popul. Resour. Environ. 2023, 33, 57–66. [Google Scholar]
  10. Iyke-Ofoedu, M.I.; Takon, S.M.; Ugwunta, D.O.; Ezeaku, H.C.; Nsofor, E.S.; Egbo, O.P. Impact of CO2 emissions embodied in the agricultural sector on carbon sequestration in South Africa: The role of environmental taxes and technological innovation. J. Clean. Prod. 2024, 444, 141210. [Google Scholar] [CrossRef]
  11. Koondhar, M.A.; Udemba, E.N.; Cheng, Y.; Khan, Z.A.; Koondhar, M.A.; Batool, M.; Kong, R. Asymmetric causality among carbon emission from agriculture, energy consumption, fertilizer, and cereal food production—A nonlinear analysis for Pakistan. Sustain. Energy Technol. Assess. 2021, 45, 101099. [Google Scholar] [CrossRef]
  12. Deng, W.; Xu, Z. Characteristics of Agricultural Carbon Emissions and Analysis of Carbon Peaking in Hunan Province. Chin. J. Eco-Agric. 2024, 32, 206–217. [Google Scholar] [CrossRef]
  13. Zhou, Y.F.; Li, B.; Zhang, R.Q. Spatiotemporal evolution and influencing factors of agricultural carbon emissions in Hebei Province at the county scale. Chin. J. Eco-Agric. 2022, 30, 570−581. [Google Scholar] [CrossRef]
  14. Deng, R.; Xiao, X.; Liu, F. Research on Agricultural Carbon Emissions in Major Grain-Producing Areas of China from the Dual Perspectives of Equity and Efficiency. Surv. World 2023, 6, 14–25. [Google Scholar] [CrossRef]
  15. Zwane, T.T.; Udimal, T.B.; Pakmoni, L. Examining the drivers of agricultural carbon emissions in Africa: An application of FMOLS and DOLS approaches. Environ. Sci. Pollut. Res. 2023, 30, 56542–56557. [Google Scholar] [CrossRef] [PubMed]
  16. Koondhar, M.A.; Aziz, N.; Tan, Z.X.; Yang, S.; Abbasi, K.R.; Kong, R. Green growth of cereal food production under the constraints of agricultural carbon emissions: A new insights from ARDL and VECM models. Sustain. Energy Technol. Assess. 2021, 47, 101452. [Google Scholar] [CrossRef]
  17. Wu, H.Y.; Huang, H.J.; He, Y.; Chen, W.K. Measurement, spatial spillover and influencing factors of agricultural carbon emissions efficiency in China. Chin. J. Eco-Agric. 2021, 29, 1762−1773. [Google Scholar] [CrossRef]
  18. Ganda, F. The influence of agricultural policy on carbon emissions in selected OECD countries. Heliyon 2023, 9, e19881. [Google Scholar] [CrossRef]
  19. Yang, L.; Yang, Q. Carbon balance measurement and zoning of grain production in the whole cycle of the Gansu section of the Yellow River Basin. Soil Water Conserv. Bull. 2025, 45, 167–176. [Google Scholar] [CrossRef]
  20. Zhou, R.; Liao, B.; Wu, S. Spatial-temporal evolution and driving factors analysis of net carbon sinks in major grain crop production under the “dual carbon” goal: A case study of prefecture-level cities in the Yangtze River Delta region. Acta Ecol. Sin. 2026, 46, 1–18. [Google Scholar] [CrossRef]
  21. Gao, H.; Liu, T.; Yang, Y.; Cheng, Q.; Xinran, L.; Yan, Y. Spatial and temporal evolution characteristics of carbon balance and food security coordination in grain production in the Huaihe River Ecological Economic Belt. J. Agric. Resour. Environ. 2025, 42, 1517–1528. [Google Scholar] [CrossRef]
  22. Xu, J.; Zhao, X. Spatial-temporal evolution and influencing factors of carbon emissions from grain production in the Yangtze River Economic Belt. J. Agric. Resour. Environ. 2025, 42, 1480–1492. [Google Scholar] [CrossRef]
  23. Fan, Z.; Qin, Z.; Ding, Z.; Tan, Q. Impact and mechanism of new agricultural productive forces on carbon emissions from grain production in China. Resour. Sci. 2025, 47, 1312–1326. [Google Scholar] [CrossRef]
  24. Tian, Y.; Liao, H. Research on the Impact and Mechanism of the Digital Economy on Agricultural Carbon Emissions. Reform 2024, 9, 84–99. [Google Scholar]
  25. Yu, Q. Research on the Impact Effect and Mechanism of the Digital Economy on Agricultural Carbon Emissions: Based on the Analysis of Agricultural Modernization. E-Commer. Lett. 2024, 13, 4916–4925. [Google Scholar] [CrossRef]
  26. Tian, H.; Guan, H. Research on the Impact of the Digital Economy on Carbon Emissions from Grain Production: Empirical Evidence from 108 Prefecture-Level Cities in the Yangtze River Economic Belt. Chin. J. Agric. Resour. Reg. Plan. 2023, 44, 145–157. [Google Scholar]
  27. Han, J.; Chen, X.; Feng, X. Realistic Challenges and Path Selection for Digital Economy Empowering Green Development. Reform 2022, 9, 11–23. [Google Scholar]
  28. Li, G. Research on Digital Technology Empowering High-quality Development of Green Finance in Tianjin. Bus. Exhib. Econ. 2024, 2, 136–139. [Google Scholar] [CrossRef]
  29. Zhang, H.; Wu, P. Green Finance and Ecological Low-Carbon Agriculture Development: Theoretical Logic and Practical Path. Southwest Financ. 2024, 03, 56–66. [Google Scholar]
  30. Yang, L. The Impact of the Digital Economy on Agricultural Carbon Emission Efficiency and Its Spatial Spillover Effect. Product. Res. 2023, 65–69. [Google Scholar] [CrossRef]
  31. Xu, W.; Zhou, J.; Liu, C. The impact of digital economy on urban carbon emissions: Based on the analysis of spatial effects. Geogr. Res. 2022, 41, 111–129. [Google Scholar] [CrossRef]
  32. Zhao, T.; Zhang, Z.; Liang, S. Digital Economy, Entrepreneurial Activity, and High-quality Development: Empirical Evidence from Chinese Cities. Manag. World 2020, 36, 65–76. [Google Scholar] [CrossRef]
  33. Chen, C.; Jiang, W. The Impact and Mechanisms of Rural Digitization on Agricultural Green Total Factor Productivity. Pol. J. Environ. Stud. 2025, 34, 6543–6557. [Google Scholar] [CrossRef]
  34. IPCC. Climate Change 2013: The Physical Science Basis; Technical Summary; IPCC: Geneva, Switzerland, 2013. [Google Scholar]
  35. Oak Ridge National Laboratory. SCALE 6.3. 2024. Available online: https://www.ornl.gov/content/scale-63 (accessed on 15 August 2024).
  36. Duan, H.; Zhang, Y.; Zhao, J.; Bian, X. Carbon footprint analysis of cropland ecosystems in China. J. Soil Water Conserv. 2011, 25, 203–208. [Google Scholar]
  37. Liu, H.; He, C. Mechanism and Test of Green Finance Promoting High-quality Development of Urban Economy: Empirical Evidence from 272 Prefecture-level Cities in China. Invest. Res. 2021, 40, 37–52. [Google Scholar]
  38. Li, B.; Zhang, J.; Li, H. Spatial and Temporal Characteristics of Agricultural Carbon Emissions in China and Decomposition of Influencing Factors. China Popul. Resour. Environ. 2011, 21, 7. [Google Scholar] [CrossRef]
  39. Sun, B.; Xu, X. Spatial–temporal evolution of the relationship between agricultural material inputs and agricultural greenhouse gas emissions: Experience from China 2003–2018. Environ. Sci. Pollut. Res. 2022, 29, 46600–46611. [Google Scholar] [CrossRef]
  40. Kafi, A.; Zainuddin, N.B.; Mansor, M.F.; Bin Salleh, M.N.; Saifudin, A.b.M.; Arif, N.A.; Shahron, S.A.; Ramasamy, R.; Mohamud, I.H. Navigating the future of agri-food supply chain: A conceptual framework using bibliometric review. J. Agric. Food Res. 2025, 19, 101707. [Google Scholar] [CrossRef]
  41. Zhao, Z.; Liu, Q.; Qiu, Y. Impact of supply chain digitalization on total factor productivity of agricultural enterprises. Int. Rev. Financ. Anal. 2025, 107, 104584. [Google Scholar] [CrossRef]
  42. Pambekti, G.T.; Lestari, I.P. Unlocking Green Productivity Through Green Lending, Digitalisation and Financial Literacy. ISRA Int. J. Islam. Financ. 2024, 16, 88–108. [Google Scholar] [CrossRef]
Figure 1. Scatter plot of Moran’s index for carbon emissions from grain production in 2012.
Sustainability 18 03884 g001
Figure 2. Scatter plot of Moran’s index for carbon emissions from grain production in 2021.
Sustainability 18 03884 g002
Figure 3. Scatter Plot of Moran’s Index for Digital Economy in 2012.
Sustainability 18 03884 g003
Figure 4. Scatter plot of the Moran’s I index for the digital economy in 2021.
Sustainability 18 03884 g004
Table 1. Carbon emission coefficients and sources for grain Production.
Carbon SourceCarbon Emission CoefficientReference Source
Mechanical Energy Consumption0.593 kg·kg−1IPCC 2013 [34]
Fertilizer Input0.896 kg·kg−1Oak Ridge National Laboratory, USA [35]
Pesticide usage4.934 kg·kg−1Oak Ridge National Laboratory, USA [35]
Agricultural film coverage5.180 kg·kg−1Institute of Agricultural Resources and Ecological Environment, Nanjing Agricultural University [36]
Irrigation electricity consumption25 kg·hm−2Liu Huake et al. [37]
Land cultivation312.600 kg·km−2Chen, C et al. [33]
Table 2. Indicator Architecture for Digital Economic Advancement Index.
Primary IndicatorsSecondary IndicatorsTertiary IndicatorsIndicator Weight
(%)
Comprehensive Digital Economy Development IndexThe popularization level of internet access and the total employment scale of internet-related industriesCount of internet-using individuals per 100 capita74.94
Proportion of practitioners engaged in computer services and software sectors7.859
Internet-related outputTelecommunications Services Volume per Capita0.019
Mobile internet usersMobile telephone subscribers per 100 persons0.328
Digital Financial Inclusion DevelopmentChina Digital Financial Inclusion Index16.854
Table 3. Green Finance Indicator System.
Primary IndicatorsSecondary IndicatorsTertiary IndicatorsIndicator Definition
Green Finance Indicator SystemGreen CreditProportion of Environmental Protection Project LoansTotal environmental protection project loans in the province/Total loans in the province
Green InvestmentEnvironmental pollution control investment as a percentage of GDPEnvironmental pollution control investment/GDP
Green insuranceDegree of promotion of environmental pollution liability insuranceEnvironmental pollution liability insurance premium income/total premium income
Green bondsGreen bond development levelTotal Green Bond Issuance/Total Bond Issuance
Green SupportProportion of fiscal expenditure allocated to environmental protectionFiscal environmental protection expenditure/Fiscal general budget expenditure
Green FundsProportion of green fundsTotal market value of green funds/Total market value of all funds
Green equityGreen Equity Development DepthCarbon trading, energy rights trading, emission rights trading/Total equity market transaction volume
Table 4. Variable-Targeted Descriptive Statistical Analysis.
VariableObsMeanStd. Dev.MinMaxLLC
DIG3000.3270.1520.0650.871−8.8388 ***
GFI3000.7670.0650.6420.899−12.9756 ***
EFF3000.5340.4310.0491.824−10.8391 ***
IDT3000.3130.0910.0720.523−7.6780 ***
TRAFFIC3000.9640.5400.0532.274−10.5230 ***
CZ30011.6493.4374.1120.384−9.4049 ***
ZZ3000.6500.1420.3550.971−6.7528 ***
CI3000.1850.0620.0430.399−8.6575 ***
Note: *** indicates that the LLC test statistic is significant at the 1% significance level.
Table 5. Direct Impact of the Digital Economy on Carbon Emission Intensity in grain Production.
VariableCI
Fixed Effects
Base ModelInclusion of Control VariablesReplace the Dependent Variable
Directional Effect−0.255 ***−0.253 ***−0.533 ***
(0.009)(0.013)(0.046)
EFF 0.016 **0.039
(0.006)(0.020)
IDT −0.070−0.274 *
(0.038)(0.130)
TRAFFIC −0.044 *0.076
(0.018)(0.062)
CZ 0.0010.014 ***
(0.001)(0.004)
ZZ −0.018−0.000
(0.045)(0.153)
_cons0.269 ***0.321 ***5.375 ***
(0.003)(0.040)(0.135)
N300300300
r20.7310.7500.435
r2_a0.7010.7170.360
Note: *, **, *** denote statistical significance at the 10%, 5% and 1% levels, respectively.
Table 6. Endogeneity Test Results.
Variable(1) IV-2SLS First Stage(2) IV-2SLS Second Stage(3) Lagged Term Regression(4) Multi-Period DID Model
Dependent VariableDIGCICICI
Historical IV0.318 ***
(0.042)
Geographic IV−0.274 ***
(0.039)
DIG ^ −0.312 ***
(0.021)
L.DIG−0.217 ***
(0.015)
Treat−0.187 **
(0.076)
EFF0.0000.015 **0.016 ***0.016 **
(0.002)(0.006)(0.006)(0.006)
IDT−0.025−0.073 *−0.069 *−0.071 *
(0.021)(0.038)(0.038)(0.038)
TRAFFIC0.065 ***−0.040 **−0.043 **−0.044 **
(0.011)(0.018)(0.018)(0.018)
CZ−0.002 *0.0010.0010.001
(0.001)(0.001)(0.001)(0.001)
ZZ0.054−0.015−0.017−0.018
(0.032)(0.045)(0.045)(0.045)
_cons0.542 ***0.368 ***0.319 ***0.322 ***
(0.051)(0.040)(0.040)(0.040)
N300300280300
R20.8410.7480.7470.751
F-statistic231.450116.823132.547135.791
First-stage F-statistic42.680
Note: *, **, *** denote statistical significance at the 10%, 5% and 1% levels, respectively.
Table 7. Indirect Transmission Effect of Digital Economic Advancement on Carbon Intensity from Grain Cultivation.
IndicatorModel 1Model 2Model 3
CIGFICI
DIG−0.253 ***0.422 ***−0.220 ***
(−18.918)(23.100)(−9.594)
EFF0.016 ***0.0000.016 ***
(2.749)(0.029)(2.763)
IDT−0.070 *−0.021−0.072 *
(−1.839)(−0.399)(−1.889)
TRAFFIC−0.044 **0.067 ***−0.039 **
(−2.417)(2.687)(−2.108)
ZZ−0.0180.057−0.013
(−0.396)(0.933)(−0.296)
CZ0.001−0.0020.001
(1.132)(−1.140)(1.011)
GFI −0.079 *
(−1.790)
_cons0.321 ***0.553 ***0.365 ***
(8.130)(10.229)(7.882)
N300300300
R20.7500.8330.753
F136.700226.156118.575
Note: *, **, *** denote statistical significance at the 10%, 5% and 1% levels, respectively.
Table 8. Bootstrap Test Results.
Effectz-ValueBiasStandard Errorp-ValueBootstrapping
Bias-Corrected 95%Percentile 95%
LowerUpperLowerUpper
Indirect effect−3.40−0.0010.0250.001−0.137−0.031−0.140−0.034
Direct effect−3.670.0010.0320.000−0.188−0.047−0.187−0.046
Total effect−10.010.0000.0200.000−0.244−0.163−0.245−0.164
Table 9. Global Moran’s I Index for Carbon Emissions from the Digital Economy and grain Production Across China’s 30 Provinces.
Year D I G it C I it
Moran’s Ip-ValueMoran’s Ip-Value
20120.1810.0310.3160.112
20130.1570.0570.3070.338
20140.1430.0650.2960.126
20150.1620.0460.2890.115
20160.1940.0220.2790.071
20170.2110.0150.2700.008
20180.1960.0230.2390.002
20190.2110.0140.2370.001
20200.1930.0210.2410.001
20210.2360.0060.2210.000
Table 10. Spatial Durbin Model Estimation.
VariableDirect EffectIndirect EffectTotal Effect
DIG−0.270 ***−3.858 ***−4.128 ***
(0.0655)(1.360)(1.402)
EFF0.0525 ***0.356 **0.409 ***
(0.00837)(0.139)(0.144)
IDT0.107 ***−0.537−0.429
(0.0346)(0.360)(0.375)
TRAFFIC−0.01360.354 ***0.340 **
(0.00906)(0.133)(0.137)
CZ0.00365 ***0.0184 *0.0220 **
(0.00122)(0.00966)(0.0101)
ZZ−0.02710.2730.246
(0.0238)(0.219)(0.229)
Observations300300300
Note: *, **, *** denote statistical significance at the 10%, 5% and 1% levels, respectively.
Table 11. Heterogeneity Analysis Results.
VariableCI
EasternCentralWestern
DIG−0.174 **−0.904 ***−0.182
(0.0766)(0.176)(0.120)
EFF0.0212 ***−0.006850.0241 **
(0.00710)(0.00823)(0.00959)
IDT−0.100 *−0.247 ***0.0772
(0.0519)(0.0463)(0.0542)
TRAFFIC−0.0737 ***0.001200.0239
(0.0285)(0.0169)(0.0315)
CZ0.00607 ***0.000302−0.000376
(0.00149)(0.00150)(0.00148)
ZZ−0.0762−0.04210.0644
(0.0467)(0.0635)(0.120)
N130.00060.000120.000
r20.1170.4830.021
Note: *, **, *** denote statistical significance at the 10%, 5% and 1% levels, respectively.
Disclaimer/Publisher’s Note: The statements, opinions and data contained in all publications are solely those of the individual author(s) and contributor(s) and not of MDPI and/or the editor(s). MDPI and/or the editor(s) disclaim responsibility for any injury to people or property resulting from any ideas, methods, instructions or products referred to in the content.