Article

Can Data Assetisation Boost Corporate Investment Efficiency in the Fintech Context?

1
School of Economics and Management, University of Chinese Academy of Sciences, Beijing 100190, China
2
School of Finance, Xinjiang University of Finance and Economics, Urumqi 830012, China
3
School of Finance, Capital University of Economics and Business, Beijing 100070, China
*
Author to whom correspondence should be addressed.
Sustainability 2026, 18(8), 3763; https://doi.org/10.3390/su18083763
Submission received: 3 March 2026 / Revised: 31 March 2026 / Accepted: 8 April 2026 / Published: 10 April 2026

Abstract

Using 29,278 firm-year observations of Chinese A-share listed firms from 2012 to 2023, this study examines whether data assetisation improves corporate investment efficiency and whether bank fintech conditions shape this relationship. Data assetisation refers to the process through which firms transform data resources into economically valuable, governable, and deployable assets. We construct a text-based proxy from annual reports using a Word2Vec-expanded lexicon and further distinguish between own-use and transactional data assets. The study finds: (1) Data assetisation significantly enhances corporate investment efficiency, with self-use data assets demonstrating a stronger driving effect. (2) Mechanism analysis reveals that data assetisation alleviates underinvestment by easing financing constraints and leveraging the “talent effect”. Concurrently, it mitigates overinvestment by reducing agency problems and accelerating digital transformation, thereby enhancing investment efficiency. (3) Heterogeneity tests indicate that the positive impact of data assetisation on investment efficiency is more pronounced among growth-stage enterprises, technology-intensive firms, and companies operating in regions with high bank liquidity. (4) Banking fintech positively moderates the enhancement of corporate investment efficiency through data assetisation, with a more pronounced effect on alleviating underinvestment. However, it may also exacerbate overinvestment. This study contributes to sustainable economic development by improving resource allocation efficiency, reducing capital misallocation, and supporting high-quality, low-waste, and sustainable growth of the real economy. Consequently, enterprises should vigorously develop data assetisation, applying different types of data assets to specific use cases to unlock data dividends. This approach supports the scientific development of corporate investment decisions and enhances investment efficiency, laying a micro-level foundation for sustainable socio-economic development.

1. Introduction

As one of the traditional “three drivers” of the economy, investment serves as a primary engine for economic growth, playing a crucial role in optimising resource allocation and propelling scientific innovation and technological advancement [1]. The Third Plenary Session of the 20th CPC Central Committee emphasised the need to “deepen reforms in the investment approval system and improve mechanisms to stimulate the vitality of social capital investment and facilitate investment implementation.” As of October 2024, national fixed-asset investment reached approximately RMB 42.3222 trillion, representing a year-on-year increase of 3.4%, with investment scale exhibiting a trend of annual growth (Citation: Data sourced from the National Bureau of Statistics). However, China’s investment efficiency faces dual challenges of regional polarisation and inefficiency, hindering its role in stabilising the broader economic landscape. Investment efficiency is central to high-quality corporate development because it reflects whether firms allocate capital to positive-net-present-value opportunities while avoiding both underinvestment and overinvestment. Improving investment efficiency also helps reduce redundant construction, lower resource waste, and promote sustainable socio-economic development. In the digital economy, an increasingly important question is whether firms can improve investment efficiency by turning data resources into economically valuable assets. This study asks three related questions. First, does data assetisation improve corporate investment efficiency? Second, through which channels does it affect underinvestment and overinvestment? Third, does bank fintech amplify or weaken these effects? In this paper, data assetisation refers to the process through which firms identify, organise, govern, disclose, and deploy data resources so that they become reusable and value-generating corporate assets.
Existing research has examined investment efficiency from both external governance and internal corporate perspectives. Prior studies show that government quality [2,3], public data openness [1], ownership structure [4], managerial characteristics [5], and digital transformation [6] can all shape firms’ investment behaviour. These studies provide an important foundation, but they do not directly answer whether data assetisation itself matters. This distinction is important because data assetisation is not equivalent to broad digital transformation. Digital transformation describes a wider organisational change in technology, processes, and business models, whereas data assetisation focuses more narrowly on the conversion of data resources into governable, valuable, and potentially financeable assets [7]. Nor is it identical to traditional intangible assets, because many intangible assets are non-data based and do not capture the continuous extraction, updating, governance, and redeployment of data resources. However, few scholars have examined the impact of data assetisation on corporate investment efficiency from a data asset perspective and with fintech as the starting point, nor have they explored fintech’s pivotal role in this process. This gap presents an opportunity for the present research. Against the goal of sustainable development, improving investment efficiency through data assetisation helps achieve more efficient resource allocation, greener economic growth, and higher-quality and sustainable development of the real economy.
In the digital economy era, the deepening development of fintech provides a broad application platform for data elements to empower corporate production and value creation, while also offering new opportunities for data assets and traditional factors to boost corporate investment efficiency. Data assetisation, as a dynamic process evolving from data → data elements → data assets, involves crucial steps such as data collection, storage, management, analysis, and application. This transforms data into a vital resource for driving innovation and development, enhancing its economic and practical value. The formal implementation in January 2024 of the Interim Provisions on Accounting Treatment for Enterprise Data Resources (hereinafter referred to as the Interim Provisions) signifies the transition of corporate data assets from natural resources to economic assets, fully embodying the process of data resource valorisation. In-depth analysis of the resource and application effects of data assetisation reveals its significant impact on enhancing corporate investment efficiency. On the one hand, from the perspective of resource effects, data assetisation elevates the economic value of data assets, enabling their entry into data markets as tradable commodities and generating monetary appreciation for enterprises. Concurrently, through further cleansing and enrichment, data assetisation endows data with attributes tailored to specific commercial contexts, enhancing its scarcity. This facilitates credit pledge functions analogous to intangible assets, thereby strengthening the financing capabilities of data assets. The resource effect of data assetisation improves corporate liquidity, alleviating investment shortfalls caused by financing constraints [8]. Fintech plays a pivotal role in this process. By providing advanced technological tools and innovative financial solutions, it accelerates data assetisation, thereby optimising corporate investment efficiency. From an application perspective, data assetisation transforms corporate data resources into valuable assets through processing and value creation, endowing them with resource element attributes. This process continuously incorporates new data resources, enhancing the economic value of data assets while providing management with fresh avenues for obtaining authentic operational insights. Through prudent exploitation of data assets and market forecasting, their supervisory and application functions can be effectively leveraged, thereby mitigating overinvestment stemming from principal–agent issues [9]. Fintech facilitates this process by establishing data asset management systems and providing relevant tools, assisting enterprises in managing the lifecycle of data assets. This enhances operational efficiency, realises value creation, and drives improvements in corporate investment efficiency. In summary, investigating whether data assetisation can enhance corporate investment efficiency, through which pathways it achieves this, and how Fintech development influences these processes, holds significant theoretical and practical implications for stimulating stable and orderly economic growth.
To test these ideas, we use 29,278 firm-year observations of Chinese A-share listed firms during 2012–2023 and construct a text-based proxy for disclosed data assetisation from annual reports using a Word2Vec-expanded lexicon. The evidence shows that higher data assetisation is associated with lower investment inefficiency. When data assets are split into own-use and transactional types, the own-use dimension is more strongly associated with overall efficiency gains. Mechanism tests show patterns consistent with lower financing constraints, stronger human capital, lower agency costs, and deeper digital transformation. The relationship is stronger for growth-stage firms, technology-intensive firms, and firms in regions with higher bank liquidity. Bank fintech positively moderates the main relationship, especially on the underinvestment margin. This study contributes to the literature in three ways. First, it clarifies the conceptual position of data assetisation by distinguishing it from general digital transformation and from conventional intangible assets, and by linking it to information asymmetry, agency theory, and the resource-based view. Second, it offers a transparent text-based proxy for disclosed data assetisation and separates own-use from transactional data assets, thereby providing a tractable micro-level measure for empirical work. Third, it provides firm-level evidence on how data assetisation is associated with investment efficiency and shows that the surrounding fintech environment conditions this relationship. Because the key explanatory variable is text based, our results should be interpreted as evidence on disclosed data assetisation intensity rather than as a direct balance-sheet stock of data assets.
The remainder of the paper is organised as follows. Section 2 develops the theoretical arguments and hypotheses. Section 3 describes the research design, variables, and empirical strategy. Section 4 reports the main findings, heterogeneity results, mechanism evidence, and discussion. Section 5 concludes with implications, limitations, and directions for future research.

2. Materials and Methods

2.1. Theoretical Analysis and Research Hypotheses

Theoretically, as the digital economy evolves, the asset specificity theory within transaction cost economics suggests that more versatile data assets better serve as collateral, thereby enhancing enterprises’ credit access capabilities [9]. Practically, data assetisation captures digital transaction and investment information within capital markets, enabling enterprises to readily identify new investment opportunities. Concurrently, corporate digital transformation leverages the informational effects of data assets to effectively reduce internal and external information asymmetry, strengthen internal information management and risk control capabilities, and mitigate agency problems and managerial overconfidence [10]. The development of the digital economy also presents opportunities for the advancement of fintech within financial institutions such as banks [11]. On the one hand, the application of digital technologies provides convenient tools for financial institutions to better assess the value of data assets, facilitating the resource effects of data assetisation. On the other hand, the interaction between data assetisation and fintech not only enhances the accuracy of market investment forecasting but also, through collaborative supervision between enterprises and banks, leverages the regulatory empowerment of data assets, thereby realising the application effects of data assetisation. Based on this, this paper will focus on the resource effects and application effects of data assetisation to analyse its impact on corporate investment efficiency, as well as the moderating influence of banks’ fintech capabilities in this process.

2.1.1. Mechanistic Analysis of Data Assetisation on Corporate Investment Efficiency

From the resource-based view, firm-specific data resources can become strategically valuable when they are accumulated, governed, and embedded in business processes rather than merely stored. Data assetisation therefore increases the economic usefulness of data by converting diffuse information into structured, reusable, and decision-relevant assets. At the same time, information asymmetry theory suggests that better data governance and disclosure can reduce frictions between firms and external capital providers, while agency theory implies that more transparent and analysable data can strengthen monitoring of managers. These three perspectives jointly suggest that data assetisation may affect investment efficiency through both a resource effect and an application/governance effect.
Resource Effects of Data Assetisation
Underinvestment often arises when firms face financing constraints or when managers cannot identify and evaluate profitable projects effectively [7,12]. Data assetisation can alleviate both problems. First, the standardisation, governance, and internal integration of data improve the quality of information available to decision makers, helping firms evaluate opportunities more accurately and reducing project-selection errors. These assets function as novel internal and external information resources, enabling employees to internalise knowledge and further convert it into employee wisdom [13]. The transmission from data elements to employee wisdom constitutes a non-static, multi-stakeholder transformation process that facilitates the accumulation of employee experience and elevates the enterprise’s human capital level. Enhancing the comprehensive capabilities of investment personnel optimises investment selection biases, enabling sound investment decisions. Concurrently, by continually elevating corporate awareness of data assets, these assets can serve as crucial evidence for forecasting investment directions, thereby improving investment rationality, alleviating underinvestment issues, and boosting corporate investment efficiency. Second, when data resources become more visible and economically interpretable, they can strengthen external stakeholders’ assessment of firm quality, which may ease financing frictions [9,14]. China’s financial system lags behind the development of its real economy, rendering corporate financing susceptible to transaction costs [14]. Data assetisation employs digital networks as transactional mediums to realise peer-to-peer data pledge models. Concurrently, enterprises categorise data assets into distinct asset classes, facilitating automated identification during the pledge process. This effectively reduces information search and transaction costs between banks and enterprises, thereby alleviating financing constraints. With the implementation of the Interim Provisions, the process of incorporating data assets into balance sheets is becoming increasingly standardised. Third, data-intensive firms may attract and retain higher-quality human capital because data assetisation typically requires analytical, managerial, and technical capabilities [13]. Better project screening and better access to capital jointly reduce underinvestment. In summary, this leads to the formulation of the first research hypothesis, H1.
H1: 
Data assetisation alleviates corporate investment shortfalls by leveraging resource effects, thereby enhancing corporate investment efficiency.
Application Effects of Data Assetisation
Data assetisation mitigates agency problems by leveraging application effects and optimises long-term development strategies through driving corporate digital transformation, thereby enhancing investment efficiency. From the perspective of alleviating agency problems, data assetisation enhances the practical value of data assets by strengthening data element extraction and management capabilities. It fully leverages the role of visualised information transmission, standardises information disclosure methods, and significantly diversifies corporate financing channels. This shifts the initiative in business governance and key innovation back to the enterprise’s internal structure [15], thereby reinforcing management’s core analytical position. In the process of enhancing operational capabilities and driving corporate growth, management reduces traditional agency problems under decentralised models by increasing personal returns and gaining societal recognition [16]. Concurrently, data assetisation facilitates shareholder comprehension of corporate production, operations, and investment activities by converting operational information into visualised data assets. This reduces internal oversight costs, aligning agents’ personal interests with corporate objectives [17], thereby improving principal–agent relationships and enhancing corporate investment efficiency. From the perspective of driving corporate digital transformation, digital transformation underscores the significance of data assets. By enhancing information mining efficiency and broadening data sourcing channels, it extends corporate governance boundaries through digital information exchange platforms. This amplifies the supervisory effect of governance entities, exemplified by social media [18], thereby standardising corporate governance practices and elevating long-term development preferences. Overinvestment is often linked to agency conflicts, managerial overconfidence, and weak information environments [6,7]. Data assetisation can mitigate these problems because it formalises the collection, storage, and use of operating information, making managerial actions and project outcomes more traceable. A more structured data environment also facilitates internal control and performance monitoring, which can reduce agency costs [15,16,17]. In addition, data assetisation complements digital transformation by improving data availability across business functions. This can widen the informational base of investment decisions and reduce reliance on managerial intuition alone [5,10,18]. In summary, this leads to the formulation of the second research hypothesis, H2.
H2: 
Data assetisation alleviates excessive corporate investment by leveraging application effects, thereby enhancing investment efficiency.

2.1.2. The Moderating Role of Fintech

Bank fintech can strengthen the investment efficiency effect of data assetisation for two reasons. First, fintech improves banks’ ability to process soft and hard information, including data-related signals that are difficult to evaluate through traditional credit screening alone [19,20]. This may increase the financing value of disclosed data assetisation and further reduce underinvestment. Considering the resource effects of fintech empowering data assetisation, fintech enables efficient integration with corporate data assets through technological drivers, accurately estimating their economic value. Enhanced by fintech, banks can now utilise data mining and cleansing to identify not only quantifiable “hard information” such as tangible assets and credit ratings, but also “soft information” like entrepreneurial spirit and commercial creditworthiness. This enables precise assessment of corporate behaviour, effectively alleviating financing constraints [20] and boosting corporate investment efficiency. Second, fintech can improve monitoring and post-lending information flows, reinforcing the governance value of data assetisation. Through technologies like blockchain and biometrics, fintech strengthens external oversight bodies’ supervision of corporate management behaviour. By horizontally transmitting data assets to other investors, it leverages synergistic regulatory effects to mitigate agency problems. Simultaneously, fintech integrates capital market data to complement corporate data assets, jointly providing precise predictive information for corporate investment. This enhances the rationality of investment decisions and alleviates overinvestment phenomena. Finally, regarding fintech’s reduction in banks’ risk perception, when banks adopt a cautious lending stance in response to economic uncertainty shocks, this shrinks market lending volumes, increases corporate financing costs, and simultaneously diminishes the pledgeability of corporate data assets, thereby intensifying financing constraints faced by enterprises [21]. The advancement of fintech, through precise forecasting of market fluctuations and the adoption of risk diversification strategies, enhances banks’ resilience to risks, reduces their risk perception, increases their willingness to lend, and ensures the smooth progression of corporate investment activities. In summary, this leads to the formulation of the third research hypothesis, H3.
H3: 
Fintech exerts a positive moderating effect on the enhancement of corporate investment efficiency through data assetisation.

2.2. Research Design

2.2.1. Sample Selection and Data Sources

This study uses all non-financial and non-real-estate A-share listed firms during 2012–2023. The sample window begins in 2012 for two reasons. First, large-scale digital annual reports and the related vocabulary of data resources become materially more stable in the early 2010s, which improves the comparability of a text-based data assetisation measure. Second, starting in 2012 allows the analysis to capture the diffusion of cloud computing, big data, and digital business models before the accounting recognition shock generated by the 2024 Interim Provisions on Accounting Treatment for Enterprise Data Resources. The sample ends in 2023 to avoid mixing the voluntary pre-rule period with the post-rule accounting regime. After excluding financial and real-estate firms, ST, *ST, PT, and suspended firms, and observations with missing key variables, and after winsorising all continuous variables at the 1st and 99th percentiles, the final sample contains 29,278 firm-year observations. Firm-level financial data are obtained from the CSMAR and Wind databases, while the text data used to construct data assetisation are drawn from listed firms’ annual reports.

2.2.2. Variable Selection and Model Construction

Dependent Variables
Investment Efficiency (Inveff): Following Richardson’s methodology [22], this study measures inefficient investment levels using the absolute deviation between a firm’s actual investment level and its optimal investment level. The magnitude of this value reflects the severity of inefficient investment, serving as a proxy for investment efficiency. The sign of the residual value indicates overinvestment (over_Inveff) or underinvestment (under_Inveff), with the underinvestment indicator taking the absolute value to standardise the direction of the metric. The greater the values of the overinvestment (over_Inveff) and underinvestment (under_Inveff) indices, the more severe the respective investment imbalances become. The specific model construction is illustrated in Equation (1).
I n v i t = β 0 + β 1 G r o w i   t 1 + β 2 L e v i   t 1 + β 3 S i z e i   t 1 + β 4 C a s h i   t 1 + β 5 A g e i   t 1 + β 6 R e t i   t 1 + β 7 I n v e s t i   t 1 + Y e a r + I n d u s t r y + ε
where I n v i t denotes the new investment expenditure of firm i in year t, Grow represents the operating revenue growth rate, Lev denotes the firm’s leverage ratio, Size represents the firm’s asset scale, Cash indicates the firm’s cash flow situation, Age signifies the firm’s listing duration, Ret denotes the firm’s stock return rate, I n v e s t i   t 1 represents the new investment expenditure of firm i in year t − 1, Year is the year dummy variable, and Industry is the industry dummy variable. To reflect the lagged impact of firm-specific factors on investment behaviour, all influencing factors are treated with a one-period lag.
Explanatory Variables
Data Monetisation (Da): Data assetisation (Da) is the core explanatory variable. We define it as the disclosed intensity with which a firm converts data resources into economically valuable and governable assets. Following He et al. [9] and related text analysis studies [5], we construct Da in three steps. First, we build an annual report corpus and use seed terms such as “data”, “digital”, “information”, and “network” to expand a candidate lexicon with the Word2Vec model. Second, we manually screen the candidate terms and retain expressions that indicate data resource governance, data platform construction, data application, data transaction, and related assetisation activities. Third, we count the retained terms in each firm’s annual report and use ln(1 + word frequency) as the proxy for disclosed data assetisation. To explore functional heterogeneity, we further divide the lexicon into own-use data assetisation (Oda) and transactional data assetisation (Bda) according to whether the language mainly reflects internal operational use or market-oriented transaction and exchange.
This measure has a clear advantage in capturing strategic orientation toward data assets before formal accounting recognition became widespread. At the same time, because it relies on disclosed text, it may reflect communication incentives as well as actual deployment. We therefore treat it as a measure of disclosed data assetisation intensity rather than a direct inventory of data assets, and we discuss this limitation explicitly in the Section 4.
Control Variables
This study selected the following control variables potentially influencing corporate hiring to mitigate the impact of sample selection bias on regression outcomes. These include—Enterprise Ownership Structure (SOE): Set to 1 if the enterprise is state-owned, otherwise 0; Enterprise Scale (Size): Measured using the logarithm of total assets; Debt-to-Asset Ratio (Lev): measured as total liabilities divided by total assets; Total Asset Growth Rate (AssetGrowth): measured as the difference between current year total assets and previous year total assets divided by the previous year’s total assets; Board Size (Board): measured as the natural logarithm of the number of board members; Dual Role (Dual): Measured by a dummy variable indicating whether the Chairman and Chief Executive Officer are held by the same individual and set to 1 if so, otherwise 0; Tobin’s Q Ratio (TobinQ): Measured by the ratio of the firm’s market value to its asset replacement cost; Firm Age: Measured using the logarithm of the difference between the current year and the year of establishment; Employee Count: Measured using the logarithm of the total number of employees; Bank Shareholding: Set to 1 if shares are held in banks or other financial institutions, otherwise 0. These variables capture ownership characteristics, financing capacity, governance structure, growth prospects, organisational maturity, and access to external finance, all of which may affect investment efficiency and or the propensity to pursue data assetisation.
Model Construction
To examine the relationship between data assetisation and investment inefficiency, we estimate a fixed effects model in which investment inefficiency is regressed on data assetisation and the control variables, with industry and year fixed effects included to absorb time-invariant sectoral heterogeneity and common macro shocks. The following econometric model is established, drawing upon Yu, Minggui et al. [23].
I n v e f f i t = β 0 + β 1 D a i , t + β z C i , t + r i + θ t + ε
where I n v e f f i t denotes the inefficient investment of firm i in year t; D a i , t represents the data assetisation development of firm i in year t; C i , t comprises various control variables potentially influencing corporate investment efficiency; r i and θ t denote industry fixed effects and time fixed effects respectively, to exclude industry heterogeneity that does not vary over time and reduce interference from time effects; ε constitutes the random disturbance term. At the same time, we do not treat the baseline model as fully causal. To address remaining endogeneity concerns such as sample selection bias, omitted variables, reverse causality, and dynamic persistence, we complement the baseline regression with Heckman two-step estimation, propensity score matching, system GMM, and instrumental variable analysis.

3. Results

3.1. Descriptive Statistics

Table 1 reports the descriptive statistics. The mean of Inveff is 0.030 and the standard deviation is 0.115, indicating substantial cross-firm heterogeneity in inefficient investment. The mean of Da is 2.291, with a standard deviation of 0.734 and a range from 0 to 5.908, suggesting a right-skewed distribution in disclosed data assetisation. The wide dispersion is consistent with marked differences in firms’ data governance capabilities, digital strategies, and business models. To reduce the influence of extreme observations, all continuous variables are winsorised at the 1st and 99th percentiles. The control variables also exhibit meaningful variation across firms, which supports their inclusion in the multivariate analysis.

3.2. Benchmark Regression Analysis

3.2.1. Impact of Data Assetisation on Corporate Debt Concentration and Corporate Investment Efficiency

The VIF and Hausman tests suggest no serious multicollinearity and support the use of the fixed effects specification. Table 2 reports the benchmark estimates. Across all four columns, the coefficient on Da is negative and statistically significant. In the fully controlled specification with industry and year fixed effects, the coefficient on Da is −0.010 (p < 0.01), indicating that firms with higher disclosed data assetisation tend to exhibit lower investment inefficiency. Using the sample standard deviation of Da, a one standard deviation increase in data assetisation is associated with roughly a 24.5% reduction in inefficient investment relative to the sample mean. This magnitude is economically meaningful. At the same time, because the baseline model remains observational, the evidence should be interpreted as a robust association rather than as definitive proof of causality.

3.2.2. Impact of Self-Use Data Assets and Tradeable Data Assets on Corporate Investment Efficiency

To further refine the effects of data assetisation, data assets were categorised by usage into internal-use data assets and transactional data assets. This approach examined the impact of the economic and practical effects of data assetisation on corporate investment efficiency. The regression results are presented in Table 3. The test results in Columns (1) and (4) indicate that both internal-use data assets (Oda) and transactional data assets (Bda) significantly reduce corporate inefficient investment and enhance investment efficiency, with internal-use data assets demonstrating a more pronounced enabling effect. By substituting investment deficiency (under_Inveff) and overinvestment (over_Inveff) for investment efficiency, it is found that proprietary data assets demonstrate a significant advantage in mitigating investment deficiency, while transactional data assets prove more effective in alleviating overinvestment. These findings indicate that proprietary data assets alleviate underinvestment by enhancing corporate utilisation of data resources, improving market forecasting accuracy, and boosting operational efficiency, thereby ensuring sufficient investment capital. Concurrently, transactional data assets mitigate overinvestment by strengthening corporate disclosure practices and reinforcing internal and external collaborative oversight.

3.3. Endogeneity Tests

3.3.1. Heckman Two-Step Method

As the indicators for corporate data assetisation are constructed using Word2Vec neural network models and deep machine learning techniques, with corporate annual reports and other publicly available information serving as key references, firms possess an incentive to exaggerate their data assetisation levels to secure greater external funding. This readily introduces bias between the true and estimated values of corporate data assetisation, thereby generating endogeneity issues stemming from sample selection bias. To mitigate the impact of this issue on regression results, this study employs Heckman’s two-step method for re-estimation. First, a proxy variable (XR) for corporate data asset disclosure is constructed. This variable is set to 1 if the company’s public announcements during the current year contain seed terms such as “information,” “network,” “digital,” or “data,” and 0 otherwise. Secondly, using the dummy variable (XR) as the dependent variable and all control variables as covariates, a first-stage regression test is conducted via a Probit model to derive the inverse Mills ratio (IMR). Finally, the IMR is incorporated into the baseline regression model (2) for a second-stage regression test. The results of the second step are presented in Column (1) of Table 4. The coefficient for data assetisation (Da) is −0.010 and passes the 1% significance test, while the IMR coefficient is 0.049 and also passes the 1% significance test. This indicates that the regression results remain robust after overcoming sample selection bias.

3.3.2. Propensity Score Matching (PSM)

The benchmark regression previously incorporated industry and year fixed effects to eliminate the influence of industry characteristics that do not vary over time and temporal characteristics that do not vary across industries. However, firm characteristics exert differential effects on data assetisation development, potentially introducing endogeneity issues due to omitted variables. This paper employs propensity score matching (PSM) to address these issues. First, enterprises are stratified into high- and low-data assetisation groups by calculating the median data assetisation score, assigning values of 1 and 0 respectively. Second, all control variables are treated as covariates for 1:1 propensity score matching. Finally, the matched samples undergo re-testing. The regression results are presented in Column (2) of Table 4. After controlling for omitted variables in the sample, the coefficient for data assetisation (Da) is −0.009 and passes the 1% significance test, consistent with previous research findings.

3.3.3. Dynamic Panel Regression

A firm’s investment preferences in the previous period may influence the current management’s investment choices, meaning that investment efficiency is affected by prior decisions. This can generate time-series autocorrelation, introducing endogeneity bias. Therefore, this study employs the System Generalised Method of Moments (SYS-GMM) to address the endogeneity issue arising from autocorrelation. The regression results are presented in Column (3) of Table 4. The AR(1) coefficient is significant while the AR(2) coefficient is insignificant, indicating that the disturbance term exhibits no autocorrelation issues, thus meeting the requirements for dynamic panel analysis. The data assetisation (Da) coefficient is −0.225 and passes the 1% significance test, demonstrating that after mitigating serial autocorrelation characteristics, data assetisation remains effective in enhancing corporate investment efficiency.

3.3.4. Instrumental Variables Method

To alleviate reverse-causality concerns, we use the mean level of data assetisation among other firms in the same industry-year as an instrumental variable, following related studies [9,24]. The rationale is that peer adoption within the same industry can shape a focal firm’s data assetisation behaviour through learning, competition, and benchmarking. In this sense, the instrument should be correlated with the focal firm’s Da. After controlling for firm characteristics and fixed effects, peer firms’ data assetisation is less likely to affect the focal firm’s investment inefficiency directly except through the focal firm’s own strategic response. The results of the first stage of the 2SLS regression are presented in Table 4. The instrumental variable (IV) regression coefficient is significantly positive. The Cragg-Donald Wald F-statistic is 18.35, exceeding the 10% significance threshold of 16.38 for weak instrumental variable tests, thus rejecting the weak IV hypothesis and satisfying the correlation requirement. The Kleibergen-Paap rk LM statistic is 12.46 and passes the 1% significance test, rejecting the null hypothesis of unidentifiability of the instrumental variable. The results of the second stage of the 2SLS regression indicate that the regression coefficient for data assetisation (Da) is −0.123 and passes the 5% significance test. This demonstrates that, after controlling for reverse causality interference, data assetisation still enhances corporate investment efficiency. To further validate the exogeneity of the instrumental variables, this study incorporates them into regression model (2), following the methodology of Tang et al. [25]. The regression results are presented in Column (6). Here, the regression coefficient for data assetisation (Da) is significantly negative, while the instrument variable (IV) coefficient is insignificant, further confirming that the instrument variable satisfies the exogeneity requirement. We nevertheless recognise a key limitation: industry-level digitalisation shocks may simultaneously affect peer firms’ data assetisation and firm-level investment efficiency, which weakens the exclusion restriction. For this reason, the IV estimates should be reported as supplementary evidence rather than as the sole identification strategy. We therefore interpret the IV results together with the Heckman, PSM, and SYS-GMM results.

3.4. Robustness Tests

3.4.1. Substitution of the Dependent Variable

First, drawing upon Biddle [26]’s methodology, we employ the sales revenue growth rate to gauge corporate income growth levels. The regression residual coefficient of this growth rate serves as a measure of investment efficiency, with higher values indicating lower efficiency. Secondly, drawing upon Chen [27]’s methodology, a NEG dummy variable was incorporated into Biddle’s model. This accounts for differing relationships between investment and sales growth rates during periods of rising versus falling revenues. The NEG variable is set to 1 when sales growth declines and 0 otherwise. Investment efficiency is then measured by the absolute value of the model residuals, where a larger residual indicates lower investment efficiency. The regression results are presented in Table 5, Columns (1) and (2). The regression coefficients for data assetisation are significantly negative in both cases, indicating robust results.

3.4.2. Addressing Serial Correlation Issues

First, to mitigate the impact of heteroskedasticity and serial correlation on regression results, this study employs Driscoll and Kraay robust standard errors for re-testing. By individually standardising sample units and recombining them into new panel data, individual variations are eliminated to enhance estimation accuracy. Test results (Column 3, Table 5) show significantly negative data assetisation regression coefficients, confirming robustness.
Secondly, to further address serial correlation, this study incorporates data assetisation from both preceding and subsequent periods into the regression. This mitigates the impact of temporal dependencies on regression outcomes. Results indicate that regression coefficients for both ex ante (Da) and ex post data assetisation prove insignificant, with only the current period yielding a significant coefficient. This confirms that regression results remain robust after controlling for serial correlation.

3.4.3. Sub-Sample Regression

Firstly, enterprises located in economically developed regions possess stronger foundations for data assetisation and more favourable data resource endowments, which may lead to “spurious regression” caused by outliers. Therefore, this paper excludes samples from municipalities directly under the central government and provincial capitals to mitigate the influence of regional comprehensive endowments on regression results. Secondly, in September 2015, the State Council issued the Action Plan for Promoting Big Data Development, signifying big data’s elevation to a national-level development strategy and substantially enhancing the importance of data as an economic factor. Consequently, this study employs sample data from 2015 to 2023 to minimise the impact of missing data assetisation values on regression outcomes. The test results, as shown in Columns (5) and (6) of Table 5, indicate that the regression coefficients for data assetisation are all significantly negative, demonstrating the robustness of the findings.

3.4.4. Placebo Test

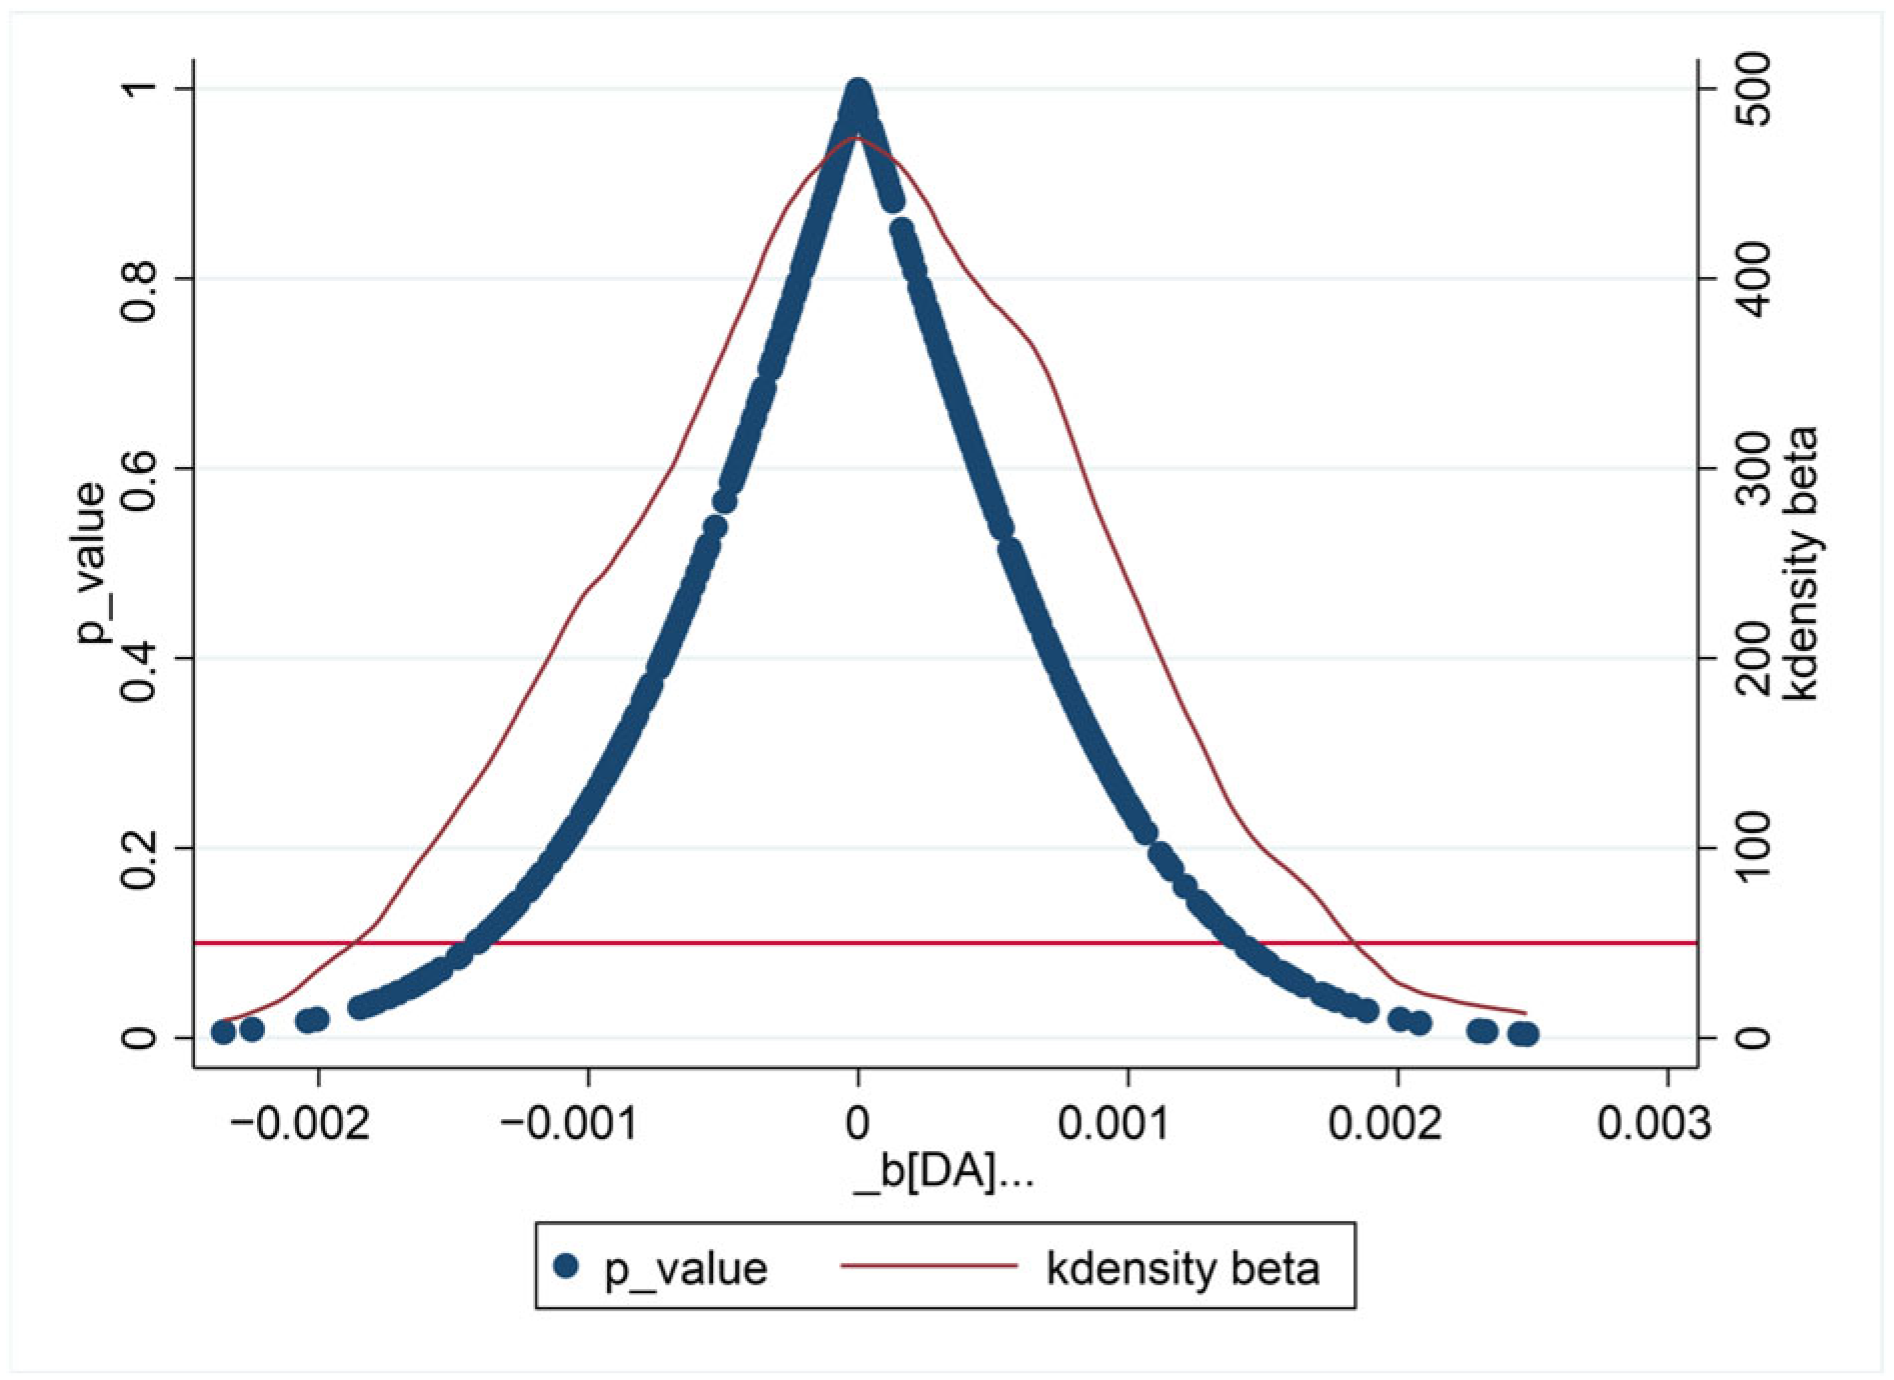
To further eliminate the influence of other unpredictable factors on the investment efficiency of enterprises, this paper uses the placebo test to reduce the regression bias caused by endogenous unobservable factors. In terms of operation, this paper conducts 500 random sampling simulations on the benchmark results, records the effect coefficient of Da on the investment efficiency of enterprises in each regression, and plots the kernel density distribution map of the regression coefficients. As can be seen from Figure 1, the regression coefficients in the placebo test results show a bell-shaped distribution centred on zero, and the p-values are mostly above 0.1, indicating that the null hypothesis of a mean regression coefficient of 0 in random sampling regression cannot be rejected overall. Therefore, it can be considered that the estimation results of the original model are robust; that is, the efficiency of enterprise investment is affected by the explanatory variables already included in the model, rather than due to random errors or omitted variables.

3.5. Heterogeneity Analysis

3.5.1. Corporate Life Cycle

The life cycle theory posits that differing developmental stages of enterprises influence their endowment of data elements, risk preferences, and investment directions. These stage-specific characteristics impact the efficacy of data assetisation on corporate investment efficiency. Drawing upon Dickinson [28], this study employs the cash flow approach to categorise enterprises into three groups: growth, maturity, and decline. Using panel regression, we examine how business life cycle heterogeneity affects the impact of data assetisation on enhancing investment efficiency. The regression results, presented in Table 6 (Columns 1–3), show that the regression coefficients for data assetisation (Da) are all significantly negative. This indicates that data assetisation enhances investment efficiency for enterprises across all life cycle stages. Notably, the between-group difference coefficient is significant, and the regression coefficients follow the order: growth stage < mature stage < decline stage. This suggests that data assetisation exerts a more pronounced promotional effect on investment efficiency for enterprises in the growth stage.
To further explore how corporate life cycle heterogeneity influences data assetisation’s enhancement of investment efficiency, investment efficiency was disaggregated into underinvestment and overinvestment. Test results are presented in Columns (4) to (9) of Table 6. Specifically, Columns (4) to (6) examine the effect of data assetisation (Da) on overinvestment. The coefficient for growth-stage enterprises is significantly negative, indicating that data assetisation most effectively mitigates overinvestment in this stage. Columns (7) to (9) present the test results for data assetisation (Da) on underinvestment. The coefficient for data assetisation in growth-stage enterprises is significantly negative, indicating that data assetisation is more effective in mitigating underinvestment within this phase. This stems from the fact that for enterprises in the growth phase, data assetisation better communicates their digital maturity externally, thereby securing critical resources. Concurrently, it effectively drives a shift in management decision-making from experience-driven to data-driven approaches, thus resolving underinvestment issues. Furthermore, data assetisation enables comprehensive integration of data resources, refining classifications of existing data assets and enhancing inter-firm data exchange. By increasing information transparency, it mitigates information asymmetry, strengthens oversight of management investment behaviour, and effectively curbs excessive investment.

3.5.2. Types of Enterprise Resources

Based on the intensity of production factors, enterprises can be categorised as labour-intensive, technology-intensive, or asset-intensive. Different enterprise types exhibit significant variations in their emphasis on and application of data assetisation. This paper references the National Economic Industry Classification, designating agriculture, forestry, animal husbandry, and fisheries; manufacturing; commerce, catering, and other services as labour-intensive enterprises. High-tech services such as information services, R&D, and design services are classified as technology-intensive enterprises, while heavy industry and construction are categorised as asset-intensive enterprises. A grouped regression approach was employed to examine how enterprise resource type heterogeneity influences the impact of data assetisation on investment efficiency. The test results, as shown in Table 7, Columns (1) to (3), reveal that the regression coefficients for data assetisation (Da) are all significantly negative, with the order being technology-intensive < asset-intensive < labour-intensive. This indicates that data assetisation is most effective in enhancing investment efficiency for technology-intensive enterprises. This may stem from the fact that technology-intensive enterprises typically operate within high-tech service sectors, where data resources form the foundation for enhancing service quality and fostering innovation. Their emphasis on data collection and data assetisation fully unlocks the potential of data dividends to empower investment efficiency gains. Asset-intensive enterprises typically rely on substantial asset investments to sustain daily operations, with assets primarily comprising fixed assets, intangible assets, accounts receivable, and so forth. Data assetisation optimises the investment environment by stabilising operational conditions through enhanced asset management and improving resource utilisation efficiency. Conversely, labour-intensive enterprises exhibit lower digitalisation levels and have yet to leverage the informational advantages of data assets in investment decision-making.

3.5.3. Bank Liquidity

From a banking perspective, when systemic liquidity is ample, banks’ capital surpluses significantly increase, effectively meeting lending and investment demands. At such times, the banking system may be more inclined to accept data assets as collateral, alleviating corporate investment shortfalls. From the data assetisation perspective, this transformation constitutes a critical step in enhancing the value of corporate data assets. This process requires financial institutions to confer financial attributes upon such assets, meeting the criteria for high-quality collateral and alleviating the predicament of diminished investment efficiency caused by financing constraints. Consequently, variations in bank liquidity exert heterogeneous effects on data assetisation’s capacity to enhance corporate investment efficiency. Following the methodology of Huang Zhen et al. [29], this study employs the year-on-year growth rate of M2 to measure banking system liquidity, where a higher growth rate indicates a more accommodative monetary policy environment and stronger bank liquidity. By selecting the median value of M2 growth rate to divide the observation sample into high-liquidity and low-liquidity groups, a grouped regression approach is adopted to verify the heterogeneous impact of bank liquidity. Test results are presented in Table 7, Columns (4) and (5). The regression coefficients for data assetisation (Da) are consistently negative and higher in high-liquidity than low-liquidity regions, indicating that data assetisation more effectively optimises corporate investment in areas with greater banking liquidity. This aligns with the aforementioned hypothesis.

4. Discussion

4.1. Mechanism Testing

This paper examines the pathways through which data assetisation influences corporate investment efficiency by testing its mechanism regarding overinvestment and underinvestment. To verify the relevant mechanisms, an econometric model is constructed based on Jiang Ting [30], as follows:
M i t = γ 0 + γ 1 D a i , t + γ z C i , t + r i + θ t + ε i , t
This section provides channel-consistent evidence rather than a fully causal mediation test. We estimate the mechanism equation by regressing each mechanism variable M on Da and the control set. When M is financing constraints or human capital, the results are interpreted as evidence on the underinvestment channel; when M is agency costs, digital transformation, or managerial overconfidence, the results are interpreted as evidence on the overinvestment channel. Because these mechanism variables are proxies and the data are observational, the tests are intended to assess whether the empirical patterns are consistent with the proposed mechanisms, not to identify a complete causal mediation structure. The remaining letter variables retain the same meanings as in Equation (3) above.

4.1.1. Testing the Underinvestment Mechanism

Scholars have suggested that low corporate investment efficiency stems from underinvestment and overinvestment, the former primarily driven by financing constraints and investment project selection bias [7]. On one hand, credit discrimination by financial institutions exacerbates the misallocation of credit resources, leaving most enterprises with insufficient investment liquidity. On the other hand, investment decision biases arising from inadequate professional expertise among investment personnel further intensify the shortage of effective investment, constraining corporate development. Data assetisation alleviates corporate underinvestment and enhances investment efficiency by strengthening information disclosure and leveraging talent attraction. Specifically, first, we examine the impact of data assetisation on underinvestment, where higher underinvestment index values indicate more severe underinvestment. Second, we employ the SA index and FC index to represent firms’ financing constraint levels, with higher values indicating greater constraints. Additionally, we measure corporate investment liquidity using the ratio of current assets to total assets. Finally, drawing upon Huang Zhuo et al. [31], human capital levels are measured by the proportion of employees holding bachelor’s degrees or higher, with further analysis of managerial educational backgrounds. The test results are presented in Table 8. Column (1) shows that the regression coefficient for data assetisation (Da) is significantly negative, indicating that data assetisation can effectively alleviate the problem of insufficient investment. Columns (2) to (4) demonstrate that data assetisation can effectively alleviate corporate financing constraints and further increase the ratio of current assets to total assets. Enhancing short-term liquidity alleviates the problem of insufficient investment. Columns (5) and (6) reveal a significantly positive coefficient for data assetisation (Da), indicating its role in attracting talent and enhancing investment efficiency. The findings suggest that data assetisation more readily elevates human capital quality, thereby alleviating corporate investment shortfalls.
To further examine the enabling effect of banking fintech development on data assetisation’s mitigation of investment shortfalls, this study re-examines the aforementioned path mechanisms using the interaction term between data assetisation (Da) and fintech (Fin). The regression results are presented in Table 9. Within the financing constraint pathway, the interaction coefficient is significantly positive and exhibits a higher absolute value than the corresponding coefficient in Table 8. This indicates that the development of banking fintech effectively amplifies the mitigating effect of data assetisation on financing constraints, further enhancing corporate capital adequacy and current asset ratios, thereby facilitating improved investment efficiency. However, regarding the human capital upgrading pathway, fintech development does not demonstrate a further enhancing effect on the quality of employees and management.

4.1.2. Testing the Overinvestment Mechanism

Corporate overinvestment primarily stems from principal–agent problems and managerial irrationality. On one hand, the separation of ownership and management rights shifts managers’ focus from maximising shareholder value to maximising personal gain, leading them to excessively pursue high-profit, high-risk investment projects and exacerbating overinvestment [20]. On the other hand, excessive optimism among managers regarding macroeconomic and industry prospects may induce herd behaviour in investment decisions, lacking scientific rigour. Concurrently, overconfidence within management leads to neglect of investment signals from peers, resulting in overlapping investment domains that exacerbate overinvestment and ultimately diminish corporate investment efficiency [6]. Data assetisation mitigates corporate overinvestment and enhances investment efficiency by strengthening internal and external oversight while accelerating digital transformation. Specifically, firstly, following the methodology of ANG J S [32], agency costs are measured by the ratio of total sales and administrative expenses to operating revenue, with higher values indicating more severe principal–agent issues. Secondly, drawing upon the research of Wu Fei et al. [33], corporate digitalisation levels are assessed using the logarithm of word frequency, where a higher value indicates greater digitalisation. Additionally, following Jiang, Fu Xiu et al. [34], we measure managerial overconfidence through relative executive compensation. If the combined remuneration of the top three executives exceeds the sample mean of executive pay, the firm is deemed to exhibit managerial overconfidence and assigned a value of 1; otherwise, it is assigned 0. The regression results are presented in Table 10. Column (1) shows a significantly negative regression coefficient for data assetisation (Da), indicating that data assetisation effectively mitigates overinvestment issues. Columns (2), (4), and (6) demonstrate that data assetisation drives digital transformation by leveraging synergistic regulatory effects to alleviate agency problems and managerial overconfidence, thereby reducing corporate overinvestment and enhancing investment efficiency. In summary, Hypothesis A2 is validated.
To further examine the enabling role of banks’ fintech development in mitigating overinvestment through data assetisation, the interaction term between data assetisation (Da) and fintech (Fin) was substituted for the original explanatory variable in the model. The test results are presented in Columns (3), (5), and (7) of Table 10. Specifically, while fintech development effectively enhances data assetisation’s mitigation of agency problems, it exerts a crowding-out effect on data assetisation’s capacity to elevate corporate digitalisation levels and curb managerial overconfidence. This may stem from fintech’s dual impact: while facilitating convenient financing channels, it simultaneously intensifies the trend of enterprises “shifting away from the real economy towards the virtual”, thereby suppressing digital transformation efforts. In mitigating managerial overconfidence through data assetisation, fintech may paradoxically induce renewed “data illusions”. Blind optimism regarding data volume and data-driven biases can exacerbate excessive investment in certain areas, thereby diminishing corporate investment efficiency.

4.1.3. The Moderating Effect of Banking Fintech

To examine the moderating role of banking fintech levels in enhancing corporate investment efficiency through data monetisation, this study establishes the testing model as shown in Equation (4).
I n v e f f i t = β 0 + β 1 D a i , t + β 2 D a i , t × F i n i , t + β 3 F i n i , t + β z C i , t + r i + θ t + ε
where F i n i , t denotes the fintech development status of banks providing credit services to firm i in year t. Drawing upon the methodology of Jin Hongfei et al. [35], this study constructs a fintech lexicon for banks across four dimensions: digitalisation, informatisation, internetisation, and intelligentisation. Python 3.12 is employed to crawl corresponding term frequency data from Baidu search results and bank annual reports, with the level of bank fintech measured by the logarithm of the sum of term frequencies across these four dimensions. The key coefficient examined is β 2 . A significantly negative β 2 indicates that the bank’s fintech development positively moderates the enhancement of corporate investment efficiency through data assetisation. The regression results are presented in Table 11. Column (1) shows a cross-term coefficient of −0.007, passing the 1% significance test, indicating that the bank’s fintech development positively promotes investment efficiency through corporate data assetisation. This may stem from fintech’s utilisation of emerging digital technologies such as big data and cloud computing to achieve efficient collection and analysis of market and corporate data. This enables effective assessment of the economic value of corporate data assets and ensures investors can promptly access critical analytical data. Consequently, it alleviates financing constraints while enhancing the scientific rigour of corporate investment decisions. To further validate the direction of fintech’s influence, this study replaces corporate investment efficiency with underinvestment and overinvestment for testing. The regression results are shown in Column (2) and Column (3). Column (2) exhibits a significantly negative interaction coefficient, while Column (3) shows a significantly positive interaction coefficient. This indicates that fintech positively promotes the mitigation of underinvestment through corporate data assetisation yet exerts a suppressing effect on alleviating corporate overinvestment. This may stem from fintech enhancing market transparency to provide diversified investment support for enterprises, thereby economically empowering data assets and better alleviating funding shortages. However, fintech development also heightens the risk of enterprises “shifting away from the real economy towards the virtual economy,” exacerbating overinvestment.

4.2. Conclusions from Mechanism Testing

The findings contribute to the literature in three respects. First, they suggest that data assetisation is not merely another label for digital transformation. Whereas digital transformation concerns broad organisational change, data assetisation emphasises whether data resources become identifiable, governable, and economically deployable assets. The negative association between Da and investment inefficiency therefore points to a more specific micro-mechanism: firms appear to benefit when data are converted into assets that support financing, coordination, and monitoring.
Second, the evidence helps bridge two strands of research that are often discussed separately: the literature on investment efficiency and the literature on digital or information capability. Prior work shows that better information environments and governance arrangements can reduce inefficient investment [22,26,27]. Our results extend this logic by highlighting data assetisation as a firm-level organisational capability that is associated with both lower underinvestment and lower overinvestment. The heterogeneity results further imply that the effect is strongest where firms are more dependent on information processing, external financing, and growth opportunities.
Third, the moderating role of bank fintech shows that external financial infrastructure matters for whether firms can convert data-related capabilities into better investment outcomes. This is consistent with the view that data assetisation generates greater value when lenders can recognise, process, and monitor data-based signals effectively. At the same time, the relatively weaker effect on overinvestment cautions that easier financing is not unambiguously beneficial in every context.
Several limitations should temper interpretation. Most importantly, Da is a text-based proxy derived from annual reports. It therefore captures disclosed data assetisation intensity rather than the true stock, quality, or legal separability of data assets. Firms may use digital language strategically, which creates potential disclosure bias. In addition, although we implement multiple endogeneity checks, observational designs cannot fully eliminate omitted industry-level digital shocks; this concern is particularly relevant to the industry-peer instrument. Finally, the sample ends in 2023 and thus does not evaluate the post-2024 accounting regime for enterprise data resources. These limitations do not invalidate the results, but they mean that the findings should be read as strong associative evidence rather than definitive causal proof.
Future research can deepen the analysis in at least three ways. One is to combine text-based measures with balance-sheet recognition, data transaction records, or direct indicators of data rights. Another is to exploit policy shocks, staggered regional initiatives, or bank-level fintech rollouts for cleaner identification. A third is to examine whether the investment efficiency effect of data assetisation differs across legal environments, privacy regimes, or international markets.

5. Conclusions

This study examines whether data assetisation is associated with corporate investment efficiency using 29,278 firm-year observations of Chinese A-share listed firms between 2012 and 2023. The results indicate that higher disclosed data assetisation is associated with lower inefficient investment. Mechanism analyses are consistent with two broad channels: a resource channel, reflected in lower financing constraints and stronger human capital, and a governance/application channel, reflected in lower agency costs and deeper digital transformation. The association is stronger among growth-stage firms, technology-intensive firms, and firms operating in regions with higher bank liquidity. Bank fintech strengthens the main relationship primarily by alleviating underinvestment. This study provides important micro-level evidence for sustainable economic development. By improving investment efficiency, data assetisation helps reduce capital misallocation, limit overcapacity and resource waste, promote the efficient allocation of social capital, and support high-quality, sustainable, and low-carbon economic growth.
First, for governmental and supervisory bodies, national-level strategic planning should be implemented. Continuous oversight is required to ensure the standardised accounting treatment of corporate data resources is properly implemented. Guidance should be provided to enterprises on accurately disclosing data asset information, thereby enhancing the transparency and credibility of corporate data assets. This will bolster investor confidence and promote improvements in corporate investment efficiency. Concurrently, the government should strengthen support for SMEs implementing digital strategies, injecting vitality into investment. For enterprises financing through data assets, governments should offer tax and fee reduction policies or other incentive measures to support investment in data assetisation, lower financing thresholds, and alleviate underinvestment.
Secondly, financial institutions such as banks should proactively respond to corporate financing demands by developing targeted innovations in data asset financial services systems to better assess the value of corporate data assets. Banks and other financial institutions should establish data asset catalogues, prioritise the development of fintech, and enhance the efficiency of interfacing with corporate data assets. This will alleviate corporate funding shortages and improve the scientific rigour of investment decision-making. Concurrently, they should seize opportunities presented by the digital economy to drive their own digital transformation, pioneering new data asset valuation and risk assessment services. This approach will expand their own economic growth points while providing convenient financial support for corporate investment.
Thirdly, enterprises should actively advance the development of data assets, particularly the cultivation and utilisation of self-consumed data assets, thereby improving investment efficiency. Concurrently, enterprises should prioritise digital development by establishing and refining data asset management platforms to supplement fundamental data asset elements. Fully leveraging the attraction of digital transformation to human capital, enhancing employees’ digital literacy and management’s professional investment rationality will lay the “human” and “financial” foundations for anchoring emerging investment directions.
The study should also be read with caution. Because the core explanatory variable is text based, the findings speak most directly to disclosed data assetisation intensity rather than to directly observed data asset stocks. In terms of sustainable development implications, this study demonstrates that data assetisation is an important path to improve investment efficiency and promote sustainable socio-economic development. It provides empirical support for enterprises, financial institutions, and governments to promote digitalisation and sustainable growth strategies. Future research can extend the sample into the post-2024 accounting period, combine text measures with accounting recognition or transaction data, and employ stronger quasi-experimental designs. Overall, the paper provides micro-level evidence that data assetisation is a relevant and economically meaningful dimension of the digital economy when explaining firm investment efficiency.


Author Contributions

Conceptualisation, H.L.; Methodology, J.X.; Software, L.Z.; Validation, L.Z.; Formal analysis, L.Z.; Investigation, Y.F.; Resources, H.L.; Data curation, Y.F.; Writing—original draft, H.L.; Writing—review and editing, J.X.; Visualisation, Y.F.; Supervision, J.X.; Project administration, J.X.; Funding acquisition, J.X. All authors have read and agreed to the published version of the manuscript.

Funding

This research received no external funding.

Institutional Review Board Statement

Not applicable.

Informed Consent Statement

Not applicable.

Data Availability Statement

The original contributions presented in this study are included in the article. Further inquiries can be directed to the corresponding author.

Conflicts of Interest

The authors declare no conflicts of interest.

References

  1. Ye, Y.W.; Yu, T.T.; Tao, Y.Q.; Chen, J.X. The Investment Stabilisation Effect of Government Data Element Sharing: Evidence from Public Data Open Platforms. J. Quant. Econ. Tech. Econ. 2025, 42, 136–156. [Google Scholar]
  2. Chen, D.Q.; Li, S.F.; Lei, G.Y. Government Governance, Control Structure and Investment Decisions: Empirical Evidence from Family-Owned Listed Companies. J. Financ. Bank. 2012, 124–138. [Google Scholar]
  3. Chen, D.Q.; Li, S.F.; Zhong, Y.J. Government Quality, Investment and Capital Allocation Efficiency. World Econ. 2012, 35, 89–110. [Google Scholar]
  4. Zhao, C.; Su, L.S.; Cao, W. Mixed Ownership Reform: Governance Effect or Resource Effect?—A Study on Corporate Investment Efficiency under Different Property Rights Regimes. J. Shanghai Univ. Financ. Econ. 2021, 23, 75–90. [Google Scholar]
  5. Yi, C.J.; Zhao, X.Y. Can Digital Transformation Enhance the Overseas Investment Efficiency of Chinese Multinational Enterprises? China Ind. Econ. 2024, 150–169. [Google Scholar]
  6. Xia, H.C.; Yang, C. Managerial Overconfidence, Management Autonomy and Corporate Investment Efficiency. Stud. Sci. Sci. 2025, 43, 1748–1760. [Google Scholar]
  7. Pan, Y.; Tang, X.D.; Ning, B. Chain Shareholders and Corporate Investment Efficiency: Governance Synergy or Competitive Collusion. China Ind. Econ. 2020, 136–164. [Google Scholar]
  8. Wang, Y.; Yang, D. Transformation of the Chinese Management Accounting System: From Data Elements to Data Assets. Manag. World 2024, 40, 171–189. [Google Scholar]
  9. He, Y.; Chen, L.L.; Du, Y.G. Can Data Assetisation Alleviate Financing Constraints for Specialised, Sophisticated, Distinctive and Innovative SMEs? China Ind. Econ. 2024, 154–173. [Google Scholar]
  10. Sun, H.B.; Cao, D.; Liu, Z.L. Climate Policy Uncertainty, Digital Transformation and Corporate Investment Efficiency. J. Shanghai Univ. Financ. Econ. 2024, 26, 62–77. [Google Scholar]
  11. Gu, H.F.; Shen, Y. Does the Development of Digital Finance Enhance Corporate Investment Efficiency? Evidence from Chinese A-share Listed Companies. J. Hunan Univ. (Soc. Sci. Ed.) 2024, 38, 51–62. [Google Scholar]
  12. Zhao, Z.Y.; Wang, Y.T.; Chen, J.N. Non-Administrative Penalty Regulation and Corporate Investment Efficiency: Empirical Evidence from Exchange Inquiry Letters. Nankai Econ. Res. 2022, 181–200. [Google Scholar]
  13. Yuan, Z.M.; Yu, X.; Li, M.; Liu, G.C. Does Data Assets Enhance Human Capital Levels in Chinese Enterprises? Empirical Evidence Based on Text Analysis. Nankai Manag. Rev. 2025, 28, 64–75. [Google Scholar]
  14. Zhang, J.; Lu, Z.; Zheng, W.P.; Chen, Z.Y. Financing Constraints, Financing Channels and Corporate R&D Investment. World Econ. 2012, 35, 66–90. [Google Scholar]
  15. Zheng, Z.G.; Li, M.; Yong, H.Y. Does Shareholder Concerted Action Improve Corporate Governance? Res. Financ. 2022, 152–169. [Google Scholar]
  16. Zhu, Q.Y.; Tan, X.F. Corporate Digital Transformation and Investment Efficiency: Empirical Evidence from Annual Report Texts. Econ. Sci. 2024, 93–113. [Google Scholar]
  17. Liu, Z.W.; Zhang, Q.S. Research on Data Element Empowerment of Corporate Investment Efficiency: A Quasi-Natural Experiment Based on Public Data Openness. Economist 2024, 42–52. [Google Scholar]
  18. Yermack, D. Corporate governance and blockchains. Rev. Financ. 2017, 21, 7–31. [Google Scholar] [CrossRef]
  19. Feng, Y.Q.; Cao, Y. Bank Fintech, Economic Policy Uncertainty and Corporate Investment Behaviour. Contemp. Financ. Econ. 2024, 58–72. [Google Scholar]
  20. Li, Z.H.; Zhang, X.D. Can Banking Fintech Improve Corporate Investment Efficiency? Evidence from Chinese Listed Companies. J. Nankai Univ. (Philos. Soc. Sci. Ed.) 2024, 101–113. [Google Scholar]
  21. Feng, Y.Q.; Zhang, H.L.; Ni, J. Financial Asset Investment Motives of Real Economy Enterprises: The Heterogeneous Impact of Monetary Policy and the Moderation Effect of Digital Finance. China Ind. Econ. 2024, 118–136. [Google Scholar]
  22. Richardson, S. Over-investment of free cash flow. Rev. Account. Stud. 2006, 11, 159–189. [Google Scholar] [CrossRef]
  23. Yu, M.G.; Wang, K. Local Government Debt Financing, Crowding-Out Effects and Corporate Labour Employment. Econ. Res. J. 2022, 57, 58–72. [Google Scholar]
  24. Xiao, T.S.; Sun, R.Q.; Yuan, C.; Sun, J. Corporate digital transformation, human capital restructuring and the labour income share. Manag. World 2022, 38, 220–237. [Google Scholar]
  25. Tang, Y.J.; Wang, Y.; Tang, C.H. Digital Economy, Market Structure and Innovation Performance. China Ind. Econ. 2022, 62–80. [Google Scholar]
  26. Biddle, G.C.; Hilary, G.; Verdi, R.S. How does financial reporting quality relate to investment efficiency? J. Account. Econ. 2009, 48, 112–131. [Google Scholar] [CrossRef]
  27. Chen, F.; Hope, O.K.; Li, Q. Financial reporting quality and investment efficiency of private firms in emerging markets. Account. Rev. 2011, 86, 1255–1288. [Google Scholar] [CrossRef]
  28. Dickinson, V. Cash flow patterns as a proxy for firm life cycle. Account. Rev. 2011, 86, 1969–1994. [Google Scholar] [CrossRef]
  29. Huang, Z.; Zhou, X.J.; Guo, Y. The Debt Structure Channel in the Central Bank’s Collateral Management Framework: Empirical Evidence from Bond-Issuing Enterprises. Financ. Trade Econ. 2024, 45, 71–87. [Google Scholar]
  30. Jiang, T. Mediating and Moderating Effects in Empirical Studies of Causal Inference. China Ind. Econ. 2022, 100–120. [Google Scholar]
  31. Huang, Z.; Tao, Y.Q.; Liu, Z.D.; Ye, Y.W. Smart Manufacturing, Human Capital Upgrading and the Labour Income Share of Enterprises. Economics 2024, 24, 1412–1427. [Google Scholar]
  32. Ang, J.S.; Cole, R.A.; Lin, J.W. Agency costs and ownership structure. J. Financ. 2000, 55, 81–106. [Google Scholar] [CrossRef]
  33. Wu, F.; Hu, H.Z.; Lin, H.Y.; Ren, X.Y. Corporate Digital Transformation and Capital Market Performance: Empirical Evidence from Stock Liquidity. Manag. World 2021, 37, 130–144+10. [Google Scholar]
  34. Jiang, F.X.; Zhang, M.; Lu, Z.F.; Chen, C.D. Managerial Overconfidence, Corporate Expansion and Financial Distress. Econ. Res. J. 2009, 44, 131–143. [Google Scholar]
  35. Jin, H.F.; Li, H.J.; Liu, Y.L. FinTech, Banking Risk and Market Crowding-Out Effects. J. Financ. Econ. 2020, 46, 52–65. [Google Scholar]
Figure 1. Placebo Test.
Sustainability 18 03763 g001
Table 1. Descriptive statistics of key variables.
VarNameObsMeanSDMinMedianMax
Inveff29,2780.0300.115−1.096−0.0101.448
Da29,2782.2910.7340.0002.1975.908
SOE29,2780.3550.4790.0000.0001.000
Size29,27822.2631.29619.58522.0726.452
Lev29,2780.4260.2040.0320.4180.908
Asset Growth29,2780.1680.368−0.3830.0885.116
Board29,2782.1200.1971.6092.1972.708
Dual29,2780.2840.4510.0000.0001.000
TobinQ29,2782.0421.3820.8021.60515.607
FirmAge29,2782.9270.3321.3862.9953.611
Employee29,2787.6761.2454.1747.59711.181
Bank29,2780.0560.2300.0000.0001.000
Table 2. Benchmark regression results.
(1)(2)(3)(4)
VARIABLESInveffInveffInveffInveff
Da−0.008 ***−0.011 ***−0.006 ***−0.010 ***
(−8.33)(−9.17)(−6.81)(−8.79)
SOE 0.008 ***0.011 ***
(5.74)(6.88)
Size −0.008 ***−0.010 ***
(−9.71)(−10.48)
Lev 0.011 ***0.019 ***
(3.14)(5.08)
AssetGrowth 0.143 ***0.146 ***
(74.60)(76.11)
Board −0.000−0.000
(−0.14)(−0.08)
Dual −0.003 **−0.004 ***
(−2.01)(−2.74)
TobinQ −0.008 ***−0.008 ***
(−15.27)(−14.56)
FirmAge 0.016 ***0.007 ***
(7.79)(2.95)
Employee 0.008 ***0.008 ***
(10.48)(9.10)
Bank −0.006 **0.001
(−2.29)(0.32)
Constant0.018 ***−0.0050.071 ***0.128 ***
(8.16)(−0.48)(4.30)(6.22)
Fixed effectsNoYesNoYes
Observations29,27829,27829,27829,278
R-squared0.0020.0200.1740.195
Note: ***, **, * denote significance levels of 1%, 5%, and 10% respectively; values in parentheses indicate t-statistics.
Table 3. Regression results by data asset dimension.
(1)(2)(3)(4)(5)(6)
VARIABLESInveffOver_InveffUnder_InveffInveffOver_InveffUnder_Inveff
Oda−0.009 ***−0.004 **−0.003 **
(−7.91)(−2.54)(−2.37)
Bda −0.008 ***−0.006 ***−0.002 *
(−7.34)(−3.77)(−1.95)
Constant0.126 ***0.081 ***0.050 ***0.091 ***0.066 ***0.042 **
(6.11)(3.14)(2.72)(4.54)(2.61)(2.29)
Control variablesYesYesYesYesYesYes
Fixed effectsYesYesYesYesYesYes
Observations29,27829,27829,27829,27829,27829,278
R-squared0.1940.4180.1030.1940.4180.102
Note: ***, **, * denote significance levels of 1%, 5%, and 10% respectively; values in parentheses indicate t-statistics.
Table 4. Endogeneity test.
(1)(2)(3)(4)(5)(6)
Heckman’s Two-Step MethodPSMGMMInstrumental VariablesInstrumental VariablesInstrumental Variables
Variable NameInveffInveffInveffDaInveffInveff
Da−0.010 ***−0.009 ***−0.225 *** −0.123 **−0.010 ***
(−8.41)(−5.98)(−20.62) (−8.75)
IMR0.049 ***
(4.25)
IV 0.025 *** −0.003
(4.21) (−0.07)
AR(1) −11.54 ***
AR(2) −2.50
Constant0.162 ***0.081 ***−0.2513.599 ***0.458 **0.124 ***
(7.44)(3.05)(−0.62)(4.15)(2.54)(6.02)
Control variablesYesYesYesYesYesYes
Fixed effectsYesYesYesYesYesYes
Observations29,27816,37324,78229,27829,27829,278
R-squared0.1900.194 0.4340.5900.195
Note: ***, **, * denote significance levels of 1%, 5%, and 10% respectively; values in parentheses indicate t-statistics.
Table 5. Robustness test.
(1)(2)(3)(4)(5)(6)
Replace the Dependent VariableRobust Standard error CorrectionExclusion of Serial CorrelationSubsample Regression
Variable NamesInveffInveffInveffInveffInveffInveff
Da−0.002 ***−0.001 **−0.010 ***−0.004 **−0.010 ***−0.011 ***
(−3.06)(−2.55)(−3.73)(−2.07)(−6.44)(−9.02)
Constant0.099 ***0.093 ***0.128 **0.133 ***0.164 ***0.102 ***
(10.42)(9.96)(2.96)(5.75)(5.65)(4.33)
Control variablesYesYesYesYesYesYes
Fixed effectsYesYesYesYesYesYes
Observations29,27829,27829,27822,40115,26520,973
R-squared0.2350.22739600.1970.2000.211
Note: ***, **, * denote significance levels of 1%, 5%, and 10% respectively; values in parentheses indicate t-statistics.
Table 6. Analysis of lifecycle heterogeneity.
(1)(2)(3)(4)(5)(6)(7)(8)(9)
Growth StageMaturity PhaseDecline PhaseGrowth PhaseMaturity StageDecline PhaseGrowth PhaseMaturity PhaseDecline Phase
Variable NameInveffInveffInveffOver_Inveff Under_InveffOver_Inveff Under_InveffOver_Inveff Under_InveffUnder_InveffUnder_InveffUnder_Inveff
Da−0.021 ***−0.011 ***−0.005 ***−0.021 ***−0.004−0.001−0.004 **−0.002−0.001
(−5.07)(−5.79)(−3.96)(−4.04)(−1.56)(−0.29)(−2.39)(−0.62)(−1.10)
Constant0.284 ***0.154 ***0.0380.1610.079 *−0.0070.239 ***0.123 ***0.027
(3.67)(4.19)(1.56)(1.54)(1.81)(−0.22)(3.30)(3.59)(1.24)
Intergroup difference coefficient−0.007 ***//
Control VariablesYesYesYesYesYesYesYesYesYes
Fixed effectsYesYesYesYesYesYesYesYesYes
Observations5340966914,2695340966914,2695340966914,269
R-squared0.3710.1180.1200.5170.3280.2780.1730.1030.137
Note: ***, **, * denote significance levels of 1%, 5%, and 10% respectively; values in parentheses indicate t-statistics.
Table 7. Analysis of corporate resource types and bank liquidity heterogeneity.
(1)(2)(3)(4)(5)
Labour-IntensiveTechnology-IntensiveAsset-IntensiveHigh Bank LiquidityLow Bank Liquidity
Variable NameInveffInveffInveffInveffInveff
Da−0.007 ***−0.012 ***−0.008 **−0.011 ***−0.009 ***
(−3.44)(−8.24)(−2.50)(−5.56)(−6.66)
Constant0.123 ***0.257 ***−0.0600.099 ***0.169 ***
(3.73)(9.63)(−1.21)(3.89)(4.74)
Intergroup difference coefficient−0.006 **−0.001 *
Control VariablesYesYesYesYesYes
Fixed effectsYesYesYesYesYes
Observations10,23812,565647518,85010,428
R-squared0.1930.1970.2400.1950.215
Note: ***, **, * denote significance levels of 1%, 5%, and 10% respectively; values in parentheses indicate t-statistics.
Table 8. Analysis of the underinvestment mechanism.
Variable Name(1)(2)(3)(4)(5)(6)
Financing ConstraintsHuman Capital
UnderinvestmentSA IndexFC IndexCurrent RatioLevel of Human CapitalManagement Qualifications
Da−0.002 **−0.002 **−0.004 ***0.013 ***0.702 ***0.040 ***
(−2.52)(−2.27)(−3.48)(8.15)(11.41)(4.15)
Constant0.051 ***−2.552 ***4.410 ***0.912 ***−41.180 ***−2.900 ***
(2.73)(−128.57)(192.60)(30.78)(−36.16)(−15.99)
Control variablesYesYesYesYesYesYes
Fixed effectsYesYesYesYesYesYes
Observations29,27829,27829,27829,27829,27829,278
R-squared0.1030.8210.8150.3780.3300.068
Note: ***, **, * denote significance levels of 1%, 5%, and 10% respectively; values in parentheses indicate t-statistics.
Table 9. Testing the enabling effects of fintech.
Variable Name(1)(2)(3)(4)(5)
Financing ConstraintsHuman Capital
SA IndexFC IndexCurrent Assets RatioLevel of Human CapitalManagement Qualifications
Da × Fin−0.003 **−0.024 ***0.024 ***0.083 ***0.015 ***
(−2.18)(−5.89)(10.69)(2.77)(2.74)
Constant−2.540 ***3.768 ***0.865 ***−41.241 ***−1.631 ***
(−80.17)(9.09)(16.54)(−23.11)(−5.04)
Control variablesYesYesYesYesYes
Fixed effectsYesYesYesYesYes
Observations29,27829,27829,27829,27829,278
R-squared0.8500.5950.3820.3410.088
Note: ***, **, * denote significance levels of 1%, 5%, and 10% respectively; values in parentheses indicate t-statistics.
Table 10. Analysis of overinvestment mechanisms.
Variable Name(1)(2)(3)(4)(5)(6)(7)
Agency ProblemDigital Transformation
OverinvestmentAgency CostsAgency CostsDigitalisation LevelDigitalisation LevelOverconfidenceOverconfidence
Da−0.005 ***−0.007 *** 0.741 *** −0.388 **
(−3.30)(−4.31) (4.37) (−2.41)
Da × Fin −0.010 ** −0.120 ** 0.188 ***
(−6.52) (−2.18) (3.71)
Constant0.085 ***0.320 ***0.278 ***122.923 ***118.558 ***108.628 ***108.581 ***
(3.29)(11.53)(10.96)(39.41)(20.98)(36.51)(20.68)
Control variablesYesYesYesYesYesYesYes
Fixed effectsYesYesYesYesYesYesYes
Observations29,27829,27829,27829,27829,27829,27829,278
R-squared0.4180.0820.2180.9790.9610.3480.332
Note: ***, **, * denote significance levels of 1%, 5%, and 10% respectively; values in parentheses indicate t-statistics.
Table 11. Moderating effect of fintech.
Variable Name(1)(2)(3)
Bank Fintech Level
Inveff Under_InveffUnder_InveffOver_Inveff Under_Inveff
Da−0.014 *−0.020 **−0.004 *
(−1.92)(−2.15)(−1.70)
Da × Fin−0.007 ***−0.008 ***0.007 ***
(−4.22)(−5.65)(3.19)
Fin−0.003−0.005−0.001
(−0.73)(−1.06)(−0.36)
Constant0.088 **0.0400.057 *
(2.29)(0.82)(1.65)
Control variablesYesYesYes
Fixed effectsYesYesYes
Observations29,27829,27829,278
R-squared0.1970.4040.114
Note: ***, **, * denote significance levels of 1%, 5%, and 10% respectively; values in parentheses indicate t-statistics.
Disclaimer/Publisher’s Note: The statements, opinions and data contained in all publications are solely those of the individual author(s) and contributor(s) and not of MDPI and/or the editor(s). MDPI and/or the editor(s) disclaim responsibility for any injury to people or property resulting from any ideas, methods, instructions or products referred to in the content.