1. Background
Electric Vehicle (EV) technology is a pivotal solution to traffic-induced air pollution and environmental challenges, as it eliminates on-road emissions. However, while EVs eliminate tailpipe emissions during operation, their overall environmental impacts also depend on upstream factors such as battery manufacturing, raw material extraction, and infrastructure construction, which should be considered in comprehensive life-cycle assessments. The adoption of EVs has surged recently due to factors such as energy efficiency and zero tailpipe emissions. Additional considerations such as fuel costs, purchase prices, and demographic influences also significantly shape the market share of alternative fuel vehicles [
1,
2]. Machine-learning analyses of recent U.S. survey data reveal that high household income and home ownership strongly predict EV ownership, while renters and rural households show much lower adoption [
3]. Recent spatial-econometric analysis further demonstrates that EV adoption diffuses through social and spatial networks, with larger populations and higher grid carbon intensity associated with greater EV ownership [
4]. In this study, the term ‘EV’ specifically refers to Battery Electric Vehicles (BEVs). By the end of 2024, EVs and PHEVs (Plug-in Hybrid Electric Vehicles) constituted 1.09% of all vehicles in Michigan, compared to 6.12% in California and 2.02% across the United States. Additionally, there were 3731 public charging stations in Michigan, 48,778 in California, and 194,767 nationwide, translating to 25, 39, and 30 EVs per charger, respectively [
5]. The Michigan Future Mobility Plan aims to support 2 million EVs by 2030 with the deployment of 100,000 EV chargers [
6]. However, widespread EV acceptance is hindered by issues like range anxiety, prolonged charging durations, and insufficient charging infrastructure [
7,
8]. To address these challenges and enhance EV market share, the construction of a robust network of EV chargers is crucial. This network should strategically integrate both slow and fast chargers to ensure trip feasibility, reduce range anxiety, and offer an acceptable level of service to EV users, while balancing costs and grid impacts, mitigating battery degradation, and supporting equitable access [
9].
EV adoption has recently emerged as a key strategy for promoting sustainable ecotourism and boosting economic growth in regions renowned for tourist attractions. Despite the potential benefits, consumers perceive EV limitations as a barrier to purchasing such vehicles [
10]. Therefore, exploring these limitations from a tourism standpoint and identifying strategies to overcome them is essential. EV charging infrastructure is crucial for supporting ecotourism by providing sustainable and convenient travel options. As EVs gain popularity among tourists, the availability of charging stations along travel routes and at tourist destinations becomes increasingly important.
1.1. EV Charger Technologies
Globally, EV charging infrastructure is divided into three levels based on voltage and recharging time. Level 1 is the slowest, uses a standard 120 V AC outlet, typically providing around 1–1.9 kW of power, and charging about 40 miles in eight hours. Level 2 charging operates on 208–240 V AC and delivers approximately 3 kW and 19 kW of power. It is commonly used in private and public facilities and charges 100 miles in eight hours. Level 3, or Direct Current Fast Charging (DCFC), is the fastest charging option, delivering roughly 50 kW to more than 350 kW per port. It can recharge an EV battery up to 80% in 30 min or less, suitable for long-distance travel [
11,
12,
13]. Although DCFC reduces charging time, it has higher implementation costs and higher charging costs for users and causes more battery degradation due to higher currents and temperatures. Conversely, Level 2 chargers are more cost-effective and gentler on batteries [
14,
15]. On average, Level 2 charging costs approximately
$0.20–
$0.26 per kilowatt-hour (kWh), whereas DC fast charging typically ranges from
$0.35–
$0.60 per kWh, as observed in December 2025. Actual prices can vary substantially depending on local electricity rates, utility demand charges, and site-specific operational factors [
16].
Multiple recent studies have focused on the effects of charging speed on lithium-ion battery health. A consistent finding across these studies is that frequent use of high-power DC fast charging accelerates battery degradation relative to slower Level 1 and Level 2 charging. Elevated charging currents and the associated thermal stress during DCFC sessions contribute to faster capacity fade over time. For example, an experimental 2025 study cycling batteries under mixed charging patterns found that the scenario involving more than 90% DC fast charging led to significantly greater capacity loss (and earlier need for pack replacements) than predominantly Level 2 charging, although the severity varied by battery chemistry [
17]. Real-world data support this trend: analysis of 10,000 EVs in the U.S. showed Level 2 charging is much gentler on batteries, while heavy DCFC usage, especially in hot conditions, correlates with higher degradation rates [
18]. These findings reinforce that although fast charging is convenient, moderating its use can prolong battery life. Integrating both Level 2 chargers and DCFCs creates a comprehensive and balanced charging network to meet the diverse needs of EV users.
1.2. Intercity vs. Urban Charging Planning
There are four aspects in charging infrastructure planning objectives: transportation network, grid network, infrastructure specifications, and user behavior and experience [
19]. This requires considering charging demand, power supply, and budget limitations, creating a planning challenge to optimize the charging configuration for a given demand [
20]. The planning problem can be categorized into intercity models and urban models, which differ mainly in traveled distance and initial State of Charge (SoC) distribution. Intercity trips are long-distance journeys where the EV users typically start fully charged to plan ahead for the trips; however, the trip distance might exceed the range of a fully charged battery [
21,
22]. In contrast, urban trip distances generally fall within the driving range of EVs and require consideration of travelers’ activities and chain of trips. Urban trips can begin with any SoC, influenced by factors such as the availability of home or workplace chargers, preceding trips, and dwell time at the origin or destination [
23,
24].
Intercity charging stations are generally located along highways to facilitate intermediate (en-route) charging, with a focus on DCFCs [
25,
26]. Conversely, urban charging stations are typically located in areas where vehicles are parked either for short durations, supporting the use of DCFCs, or for extended periods, where Level 2 chargers facilitate destination (end-of-route) charging for urban trip patterns. These locations vary based on factors such as time of day and land use, including home, workplace, and public parking [
27,
28].
1.3. Charging Infrastructure Modeling Approaches and Solution Methods
Research on EV charger placement focuses on identifying charging demand and installing chargers to meet this demand [
29,
30]. There are two main approaches: flow-based and node-based [
31]. The flow-based approach treats demand as network flow, placing stations at key intersections to capture traffic, often using models like the Flow-Capturing Location Model [
32,
33]. However, this model overlooks EV range limitations [
34]. To address this, Kuby and Lim developed the Flow Refueling Location Model, which incorporates range constraints to improve vehicle flow coverage [
35]. Other models use set-covering methods to minimize costs while ensuring complete EV flow coverage, accounting for construction costs [
36,
37], charging and waiting times [
28], and travel time [
38,
39]. Station capacity can be treated as a constraint [
34,
40] or a decision variable [
28,
36]. The node-based approach frames the problem as a facility location problem, positioning stations at nodes to ensure coverage within a specific distance [
41]. The Set Covering Location Model minimizes the number of facilities needed, while the Maximum Covering Location Model maximizes coverage within budget constraints [
42,
43].
Studies on EV charging infrastructure planning employ a wide range of objective functions and constraints, reflecting the multidimensional and interdisciplinary nature of the problem. A substantial body of research prioritizes cost minimization, where models reduce installation costs, such as land acquisition, construction, charger hardware, and labor, or operating costs including electricity prices and demand charges. For example, He et al. develop a mixed-integer linear program that minimizes total system costs across vehicle batteries, fast charging stations, energy storage systems, and peak-demand charges [
44]. Similarly, Huang et al. identify cost-effective charging station deployment strategies that satisfy alternative fuel vehicle demand across all origin–destination pairs, explicitly accounting for multiple deviation paths in the network [
45]. Another major category focuses on demand coverage maximization, where classic models such as the Flow-Capturing Location Model aim to maximize the EV flow served along origin–destination paths [
32]. User inconvenience minimization represents another objective function, with models that reduce detour distance, waiting time, and charging duration. For instance, Honma et al. compare path-based and node-based formulations to minimize additional travel time while ensuring feasible demand coverage [
46], whereas Chen et al. optimize the placement of dynamic charging lanes to minimize total trip time [
39]. In studies integrating the electricity network, power-system objectives such as minimizing power losses, voltage deviations, and thermal overload are emphasized, particularly in co-optimization frameworks that couple transportation demand with distribution-grid performance [
47]. In addition, recent studies have explored energy management strategies that integrate renewable energy sources and energy storage systems to mitigate the impact of EV charging on grid operations and improve energy utilization efficiency [
48]. An optimization framework that integrates distributed energy resources (e.g., solar panels, second-life batteries, and other energy storage systems) with fast charging infrastructure demonstrates that coordinated DER deployment can significantly reduce system costs while addressing spatiotemporal variations in EV demand and grid conditions [
49]. Similarly, a comprehensive planning framework has been developed to determine the optimal size, type, and location of distributed energy resources for supporting DCFC demand, showing that combining solar panels with second-life lithium-ion batteries can achieve substantial cost savings while alleviating grid constraints [
50]. Increasingly, researchers adopt multi-objective formulations that simultaneously balance cost, coverage, user inconvenience, and power system performance, highlighting the trade-offs inherent in comprehensive EV infrastructure planning [
24,
51,
52]. Xiao et al. proposed a coordinated photovoltaic and energy-storage-based scheduling framework for electric bus charging that simultaneously minimizes operating cost and carbon emissions [
53]. Another emerging objective is to ensure network robustness during extreme weather. A multilayer network analysis of Florida’s EV charging network during Hurricane Ian revealed critical vulnerabilities that could hinder evacuations, emphasizing the need for resilience metrics in planning [
54].
Two primary approaches for optimizing the placement of charging infrastructure are exact and heuristic methods [
19]. Exact methods include linear [
55,
56] and nonlinear [
43,
57] models with single or multiple objectives [
58]. These models are commonly solved using commercial solvers such as CPLEX, Knitro and Gurobi [
59,
60,
61]. In real-world scenarios and networks, the problem size increases significantly, especially in terms of the number of variables and constraints [
24]. Thus, heuristic methods such as greedy algorithms [
62], simulated annealing (SA) [
22,
24], genetic algorithms [
63], chicken swarm optimization [
64,
65], and other evolutionary algorithms [
66], are introduced which excel in finding optimized solutions to complex and multi-dimensional problems [
67].
1.4. Charging Networks Integration
As highlighted by Bhat et al., designing an EV charging network requires integrating both fast and slow charging stations to accommodate diverse user demands and preferences [
68]. Most existing studies on EV charging infrastructure optimization focus on fast chargers, with few addressing multiple charging modes [
19], and those that do typically use a single optimization framework. Huang et al. proposed optimization models for fast and slow chargers, focusing on minimizing total cost while meeting coverage [
42]. Wang et al. proposed a four-step method to deploy normal and fast charging stations to meet the charging demands of private EVs and electric taxis, focusing on estimating demand using EV profiles and transport statistics [
9]. Sun et al. proposed a location model for slow and fast charging stations with dual objectives: maximizing coverage and capturing maximum flow [
43]. Their model considers urban residents’ travel behaviors and operates within a budget limit. Lin et al. proposed a framework to optimize the location and size of Level 2 chargers and DCFCs, maximizing investment benefits [
55]. Their framework considers charging behaviors, urban land use, and uses an agent-based trip chain model to represent EV owners’ travel and charging patterns. Bhat et al. examine potential electric vehicle buyers’ location preferences for public charging stations, considering station attributes and individual characteristics [
68]. Some studies assume that the budget is sufficient to serve all the demand [
56,
65]. Conversely, other studies consider budget constraints and use partial coverage strategies to maximize demand coverage [
43,
57] or include a penalty term for unserved demand [
42].
1.5. EV Tourism and Charging Planning
Tourism often involves long-distance travel and extended stays, requiring tailored EV charging infrastructure planning. Proper planning can reduce costs for both providers and users, and influence EV users’ itinerary [
27]. An effective approach to planning chargers for EV tourism combines DCFCs for intermediate charging during long-distance trips with Level 2 chargers at tourist destinations, where visitors stay longer. Thus, an integrated framework is needed to optimize the placement and capacity of both Level 2 chargers and DCFCs within tourist regions.
Research on EV tourism is still emerging. Wang and Lin used set- and maximum-coverage models with mixed integer programming to locate chargers based on vehicle refueling patterns, applying their approach to Penghu Island and considering tourist sites for slow chargers [
57]. Wang et al. addressed tourist trip design for EVs, factoring in time windows and range constraints [
69]. Suanpang et al. employed reinforcement learning for EV-charging recommendations, using Chiang Mai, Thailand, as a smart tourism city case study [
70]. Xu et al. developed a model for selecting EV charging station sites using kernel density analysis of urban populations, including tourist areas, to maximize EV user satisfaction [
71]. Knowles et al. created an EV readiness index assessing 94 road trip itineraries related to Canada’s national parks by assessing factors such as the number of Level 2 and Level 3 chargers, the spacing between chargers, and the corresponding road distances [
72].
These studies highlight the necessity of incorporating diverse charging options and real-world case studies to better predict future EV charging needs, moving beyond theoretical and test networks. However, most existing studies focus primarily on general EV charging infrastructure planning or urban mobility contexts, with limited attention to tourism-oriented travel patterns and corridor-based recreational trips. Tourism travel often involves longer travel distances, extended dwell time at destinations, and concentrated flows along scenic corridors, which require a coordinated planning strategy that integrates destination-based and en-route charging. In addition, many studies that consider only a single type of charger (e.g., Level 2) often treat unserved charging demand through penalty terms without explicitly modeling alternative charging options, which may overlook realistic user behavior. To address this gap, this study develops an optimization framework that integrates tourism-related demand estimation with the coordinated planning of Level 2 destination chargers and DC fast chargers along the Lake Michigan Circuit.
1.6. Research Gaps and Study Contributions
Despite the growing body of research on EV charging infrastructure planning, several limitations remain across the existing literature. Studies on EV Charger Technologies (
Section 1.1) typically focus on the technical characteristics, costs, and battery impacts of individual charging technologies, but they rarely examine how multiple charger types interact within a coordinated charging network. In response, this study explicitly considers both Level 2 chargers and DC fast chargers within a unified framework to reflect the complementary roles of slow and fast charging in real-world travel patterns. Similarly, research on Intercity vs. Urban Charging Planning (
Section 1.2) often treats intercity corridor charging and urban destination charging as separate planning problems, even though many real-world travel patterns involve elements of both. This study addresses this limitation by examining a corridor-based tourism region where both en-route and destination charging must be planned simultaneously. Work on Charging Infrastructure Optimization (
Section 1.3) has developed a wide range of optimization approaches, yet many studies rely on simplified assumptions regarding user behavior, charging demand, or grid interactions. In this study, these limitations are partially addressed by incorporating empirically informed travel demand patterns and by considering multiple cost components and operational constraints within the optimization framework. Research on Charging Networks Integration (
Section 1.4) increasingly recognizes the need to jointly plan different charging technologies; however, many models still optimize a single charger type or assume sufficient budgets to meet all charging demand. The present study instead models both Level 2 and DCFC infrastructure under realistic budget constraints and allows for partial demand coverage to better reflect practical planning conditions. Finally, the literature on EV Tourism and Charging Planning (
Section 1.5) remains relatively limited, with most studies focusing on general urban mobility rather than tourism-oriented travel behavior. Tourism travel often involves longer trips, concentrated flows along scenic corridors, and extended dwell times at destinations, which require a coordinated charging strategy that integrates corridor and destination charging. To address this gap, this study develops an optimization framework specifically tailored to tourism travel patterns along the Lake Michigan Circuit, integrating tourism demand estimation with coordinated planning of Level 2 destination chargers and DC fast chargers.
The literature review has identified four major gaps in the current research, and this paper contributes to the field by addressing each of these gaps as follows:
Planning EV charging infrastructure for tourist regions through an integrated Level 2 and DCFC network, where unmet demand from Level 2 stations dynamically shifts to nearby DCFCs. This study introduces a novel framework that explicitly models the interconnection between charger types, an aspect rarely examined in existing literature.
A balanced planning framework is developed that integrates Level 2 and DCFC infrastructure, in which Level 2 siting decisions are informed by the spatial distribution of DCFCs. The framework also incorporates both system-level and user-oriented perspectives and explicitly accounts for users’ charging behaviors.
The model introduces a battery-health–aware operational strategy by prioritizing charging at destination Level 2 stations and reserving DCFCs primarily for intermediate travel needs. This coordinated approach minimizes exposure to high-current charging events that accelerate battery degradation, while still ensuring trip feasibility and reliability for long-distance EV travelers.
By addressing the distinctive travel and charging patterns of tourism destinations, the proposed approach offers a unique and forward-looking pathway for enabling sustainable ecotourism.
This study addresses these gaps by proposing a comprehensive framework to optimize the locations and quantities of Level 2 chargers at tourist destinations and DCFCs along the primary LMC corridor within Michigan. The framework aims to minimize costs for both users and providers while ensuring trip feasibility and adhering to budget constraints. It develops distinct but interconnected networks for Level 2 and DCFCs, utilizing heuristic methods like greedy and SA algorithms, dynamic penalties, and two-stage decision-making techniques. This approach considers intercity trips, existing charging infrastructure, and associated costs to identify the best investment strategy for supporting ecotourism in Michigan, based on extensive real-world data.
The remainder of the paper is organized as follows: starting with the Problem Statement, followed by the Data Summary. Next, it presents the Modeling Framework and Solution Approaches. Finally, it presents the Case Study and discusses the Results. The paper concludes with key insights and recommendations for future research.
2. Problem Statement
The “Lake Michigan EV Circuit Tour” is a multi-state initiative involving Michigan, Wisconsin, Illinois, and Indiana to establish EV infrastructure along Lake Michigan’s 1100-mile coastline. The project aims to enhance coastal tourism by installing reliable charging stations at recreational areas, hospitality businesses, and entertainment attractions, allowing EV drivers to enjoy long-distance vacations without range anxiety [
73].
Figure 1 depicts Lake Michigan, the main corridor (also known as Lake Michigan Circuit or LMC), and the surrounding cities and states. Given that more than 50% of the circuit is located within Michigan, this area has been chosen as the initial focus for planning charging infrastructure to support EV tourism around Lake Michigan.
This research presents a comprehensive framework for optimizing EV charging infrastructure along the Lake Michigan coastline in Michigan, addressing both slow charging at tourist destinations and fast charging along the LMC corridor. The framework consists of two interconnected sections, each addressing unique aspects of the charging infrastructure.
Destination charging focuses on determining the optimal locations and quantities of Level 2 chargers at tourist destinations, particularly lodging sites such as hotels and motels. In this study, we assume users stay overnight at these locations, allowing them to effectively utilize Level 2 charging. It involves travel demand analysis, EV and energy demand estimation, and charger placement optimization, employing a heuristic algorithm to balance and minimize infrastructure costs and user inconveniences. A node-based approach is used to model Level 2 charging demand. Due to the extended charging times of Level 2 chargers, queuing models are not employed for destination chargers, as they are impractical in this context.
Intermediate charging focuses on determining the optimal locations and quantities of DCFCs at the corridor level to balance and minimize infrastructure costs and user inconvenience, while ensuring trip feasibility and compliance with budget constraints. This is accomplished through a heuristic algorithm with dynamic penalties and a two-stage decision-making process that identifies both the locations and number of DCFCs. This section also utilizes a flow-based charging demand modeling approach and an M/M/c queuing model (Poisson arrival distribution, exponential service distribution, and c parallel servers) to manage high EV turnover rates. The algorithm models EV charging behaviors by considering multiple charging station options during intercity trips. The framework also ensures that any unserved destination charging demand is covered by DCFC stations.
This study aims to answer three key questions in supporting EV tourism through charging infrastructure planning:
How might a strategic combination of slow and fast chargers be effectively planned for tourist regions to support eco-friendly travel?
What constitutes the optimum investment strategy for providers to install slow and fast chargers in a real-world large-scale case study, ensuring trip feasibility and adherence to budgetary limitations?
What is the optimal charging configuration from the users’ perspective that minimizes inconveniences while also reducing battery degradation?
By incorporating both slow and fast chargers, this study aims to support EV adoption and ecotourism in Michigan. The research considers EV users’ intercity trips, existing charger capabilities, and costs to identify the best investment strategy.
3. Summary of Data
Charging infrastructure planning involves a diverse range of stakeholders. For this research, extensive meetings have been held with these stakeholders to gain their insights and perspectives. The collected data were then used as inputs for the modeling framework. This section provides an overview of the data collected.
3.1. Study Area and Road Network
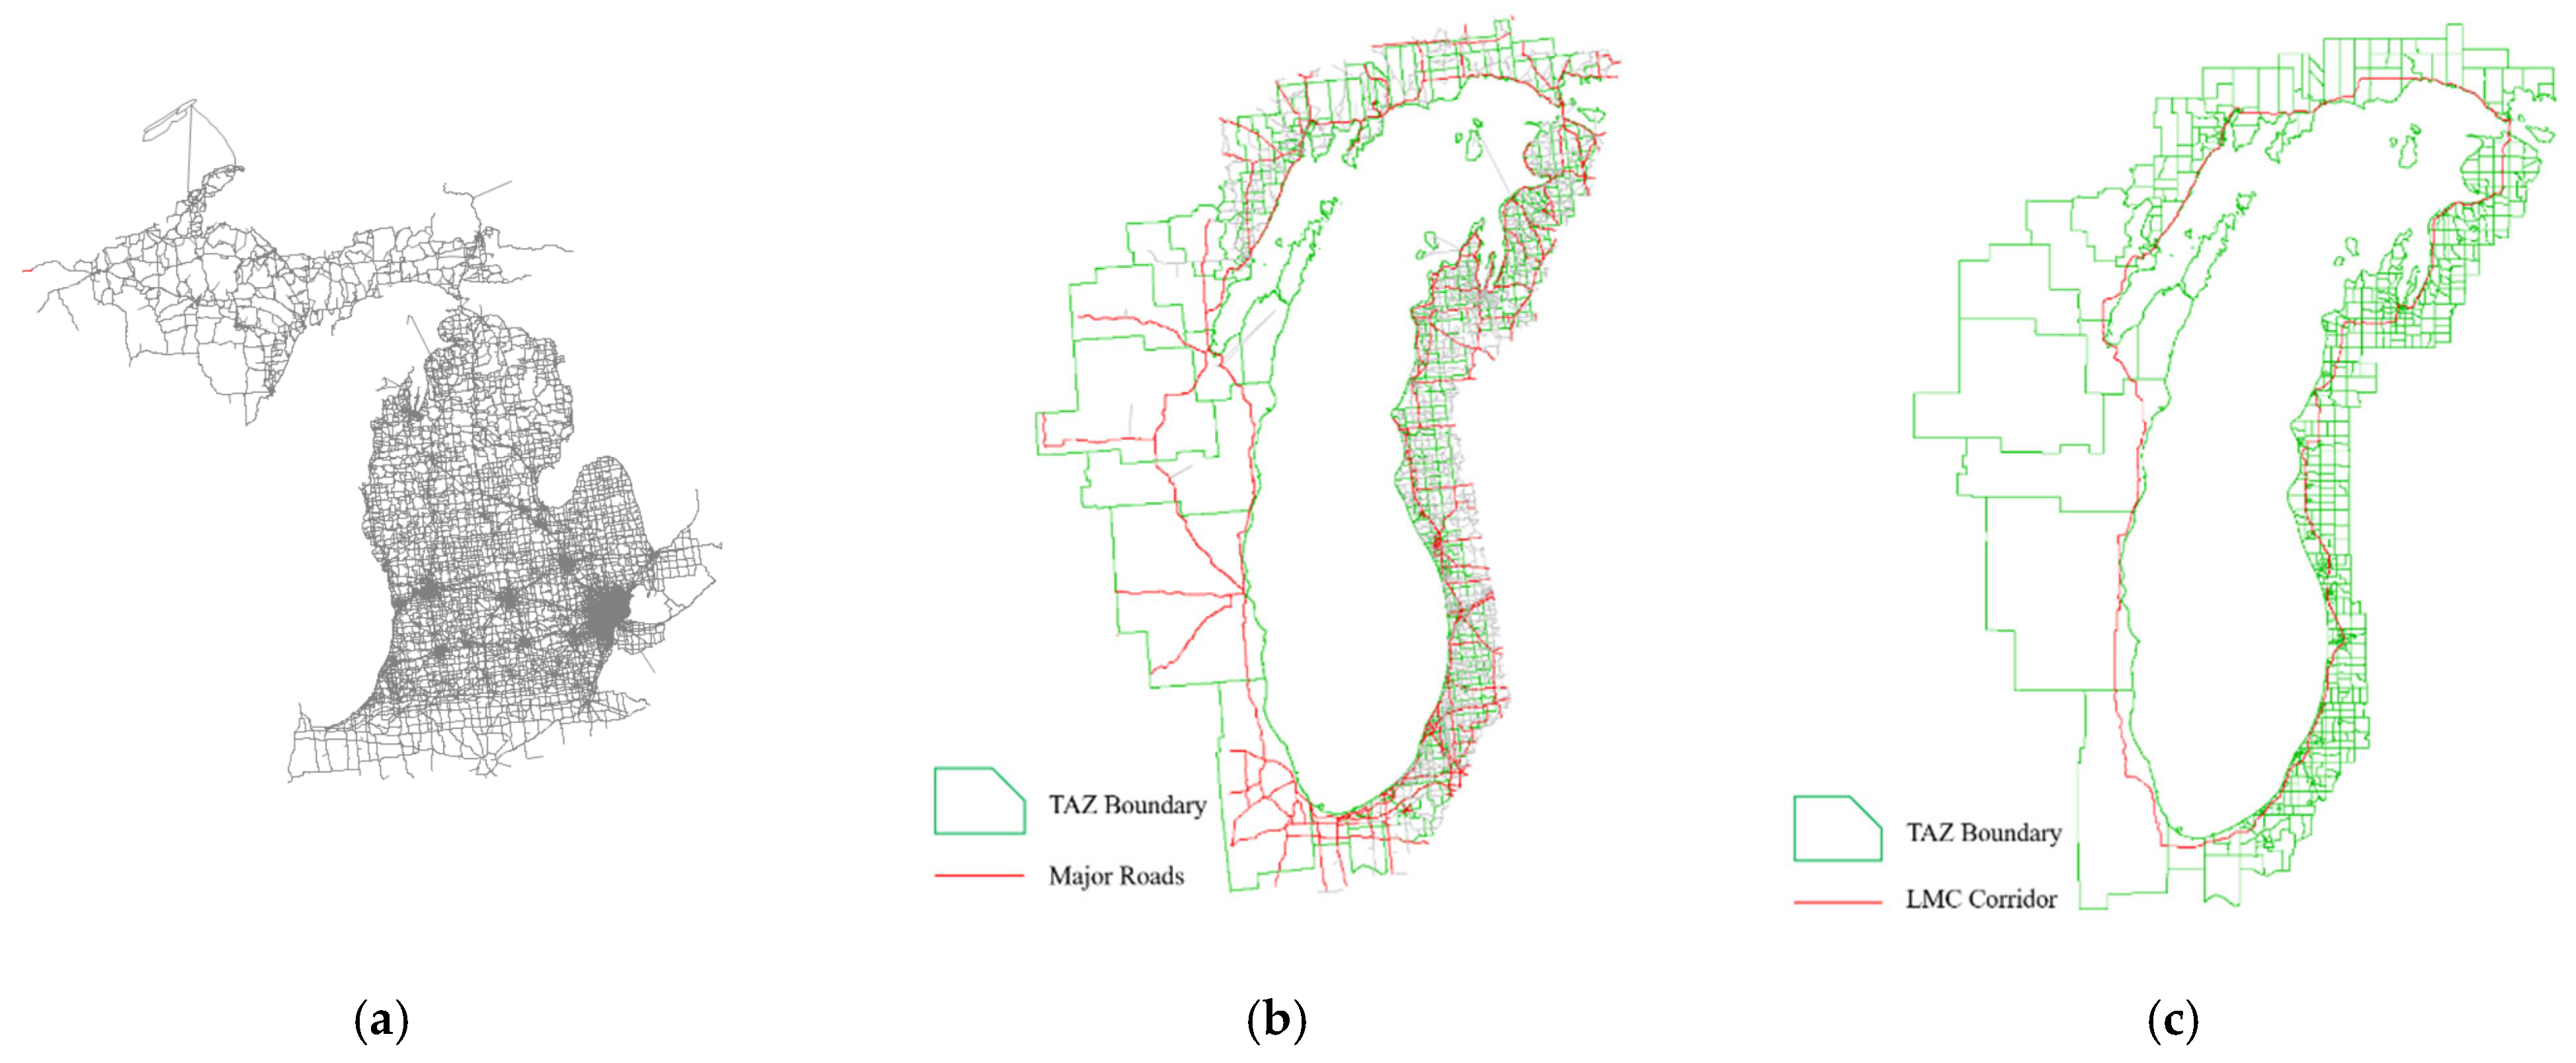
The designated study area, referred to as the LMC area, includes the region within a 10-mile distance from the Lake Michigan shoreline. The road network data were sourced from the 2015 updated and calibrated Michigan network provided by the Michigan Department of Transportation (MDOT). In this dataset, Michigan is divided into smaller geographical regions called Traffic Analysis Zones (TAZ). Michigan has a total of 4461 TAZs, with 626 TAZs either entirely or partially within the LMC area. The LMC area contains approximately 10,000 nodes and 32,000 links. Each TAZ is represented by a centroid with specific geographical coordinates. Visual representations of the road network in Michigan and the LMC area are shown in
Figure 2a and
Figure 2b, respectively.
3.2. Corridor Structure
The goal is to establish an EV charging corridor with DCFCs for convenient road trips within the LMC area. The corridor should be close to the shoreline and accessible to tourist attractions and amenities around the lake. It should also include major arterial roads and expressways with high-speed limits and capacity. The proposed corridor encompasses interstates I-94 and I-196, and highways US-31 in the Lower Peninsula (LP) and US-2 and US-35 in the Upper Peninsula (UP), covering approximately 600 miles.
Figure 2c provides a visual representation of the proposed charging corridor.
3.3. Candidate Points
Since the goal of this study is to establish a network supporting EV tourism, tourist attractions and businesses in the LMC area are considered as potential sites for EV chargers. Candidate points are categorized by business type and average visitor stay duration: (i) short-term stay locations (less than 2 h): retail stores, restaurants, gas stations; (ii) mid-term stay locations (2–6 h): parks, shopping malls, movie theaters, stadiums; and (iii) long-term stay locations (more than 6 h): hotels, motels, and rental cabins.
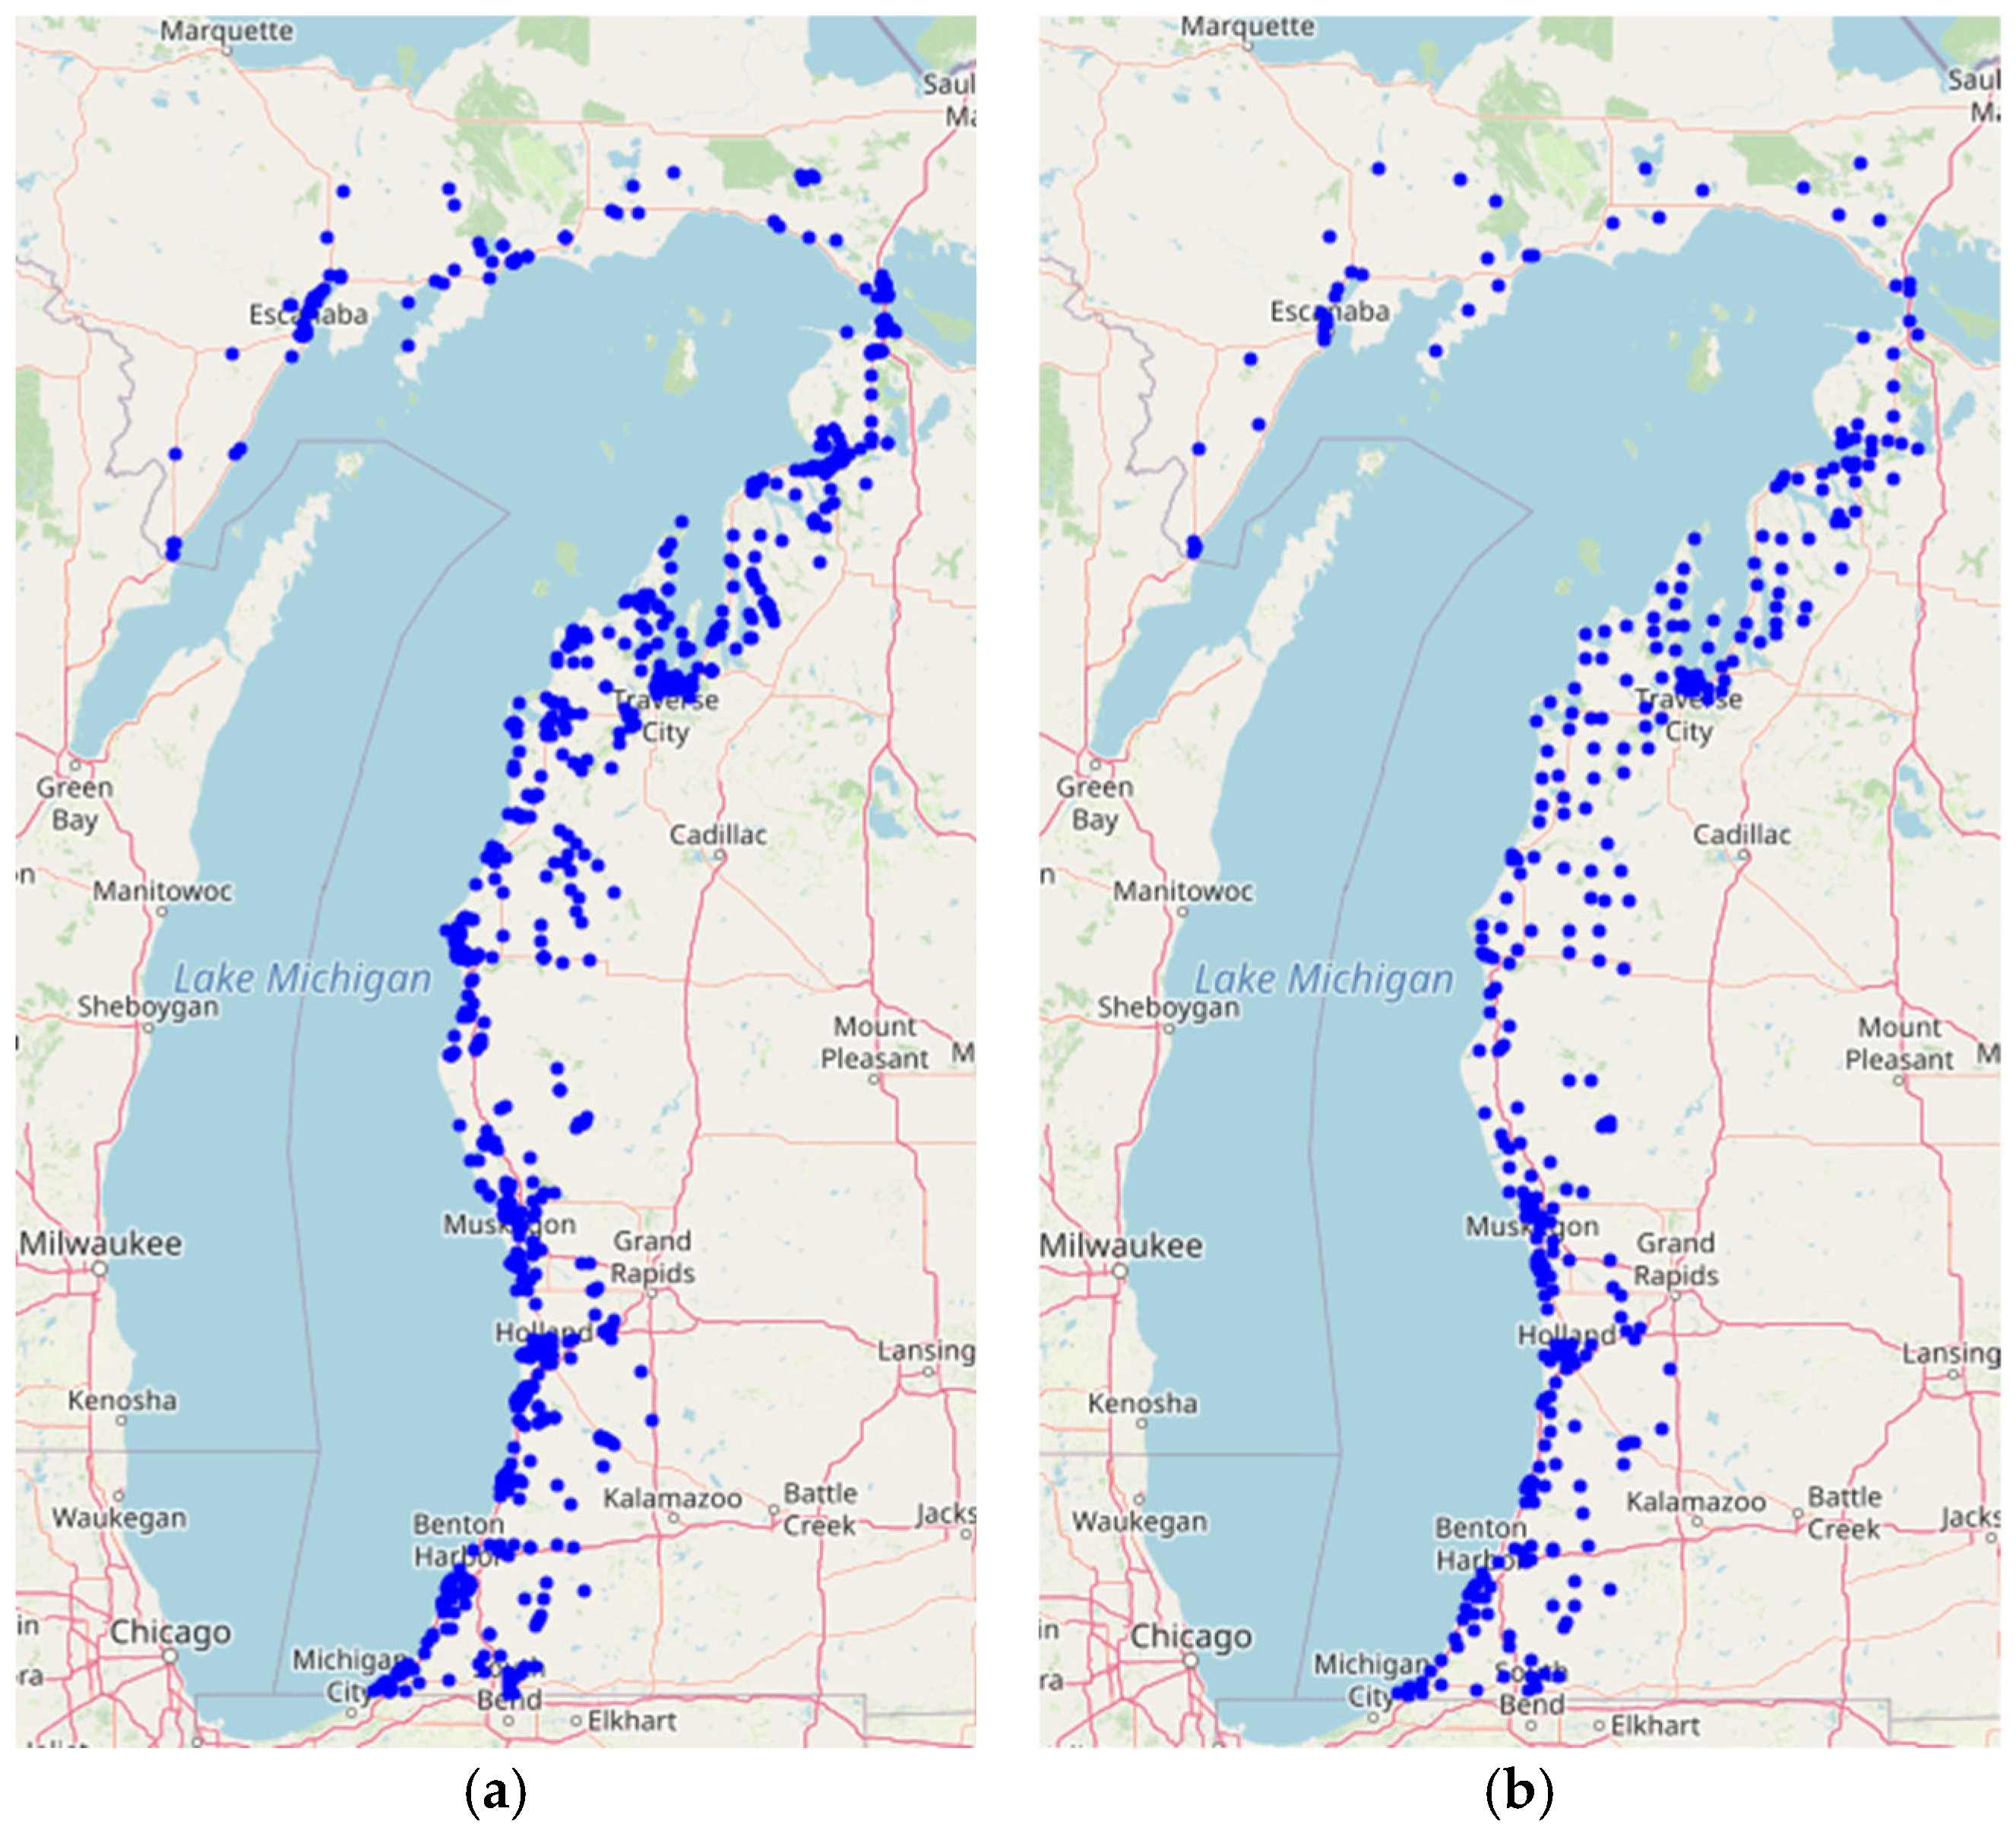
Level 2 chargers are slower and best suited for long-term stay locations. As shown in
Figure 3a, 964 of the 7074 candidate points in the LMC area correspond to long-term stay locations. For planning purposes, all long-term stay locations within a single TAZ were aggregated, and the centroid of that TAZ was designated as the representative candidate location. Of the 626 TAZs within the LMC area, 343 TAZs contain at least one long-term stay location, and thus their centroids were considered candidate locations for Level 2 charger deployment.
Figure 3b depicts the TAZ centroids that serve as the final candidate locations for Level 2 charging station deployment.
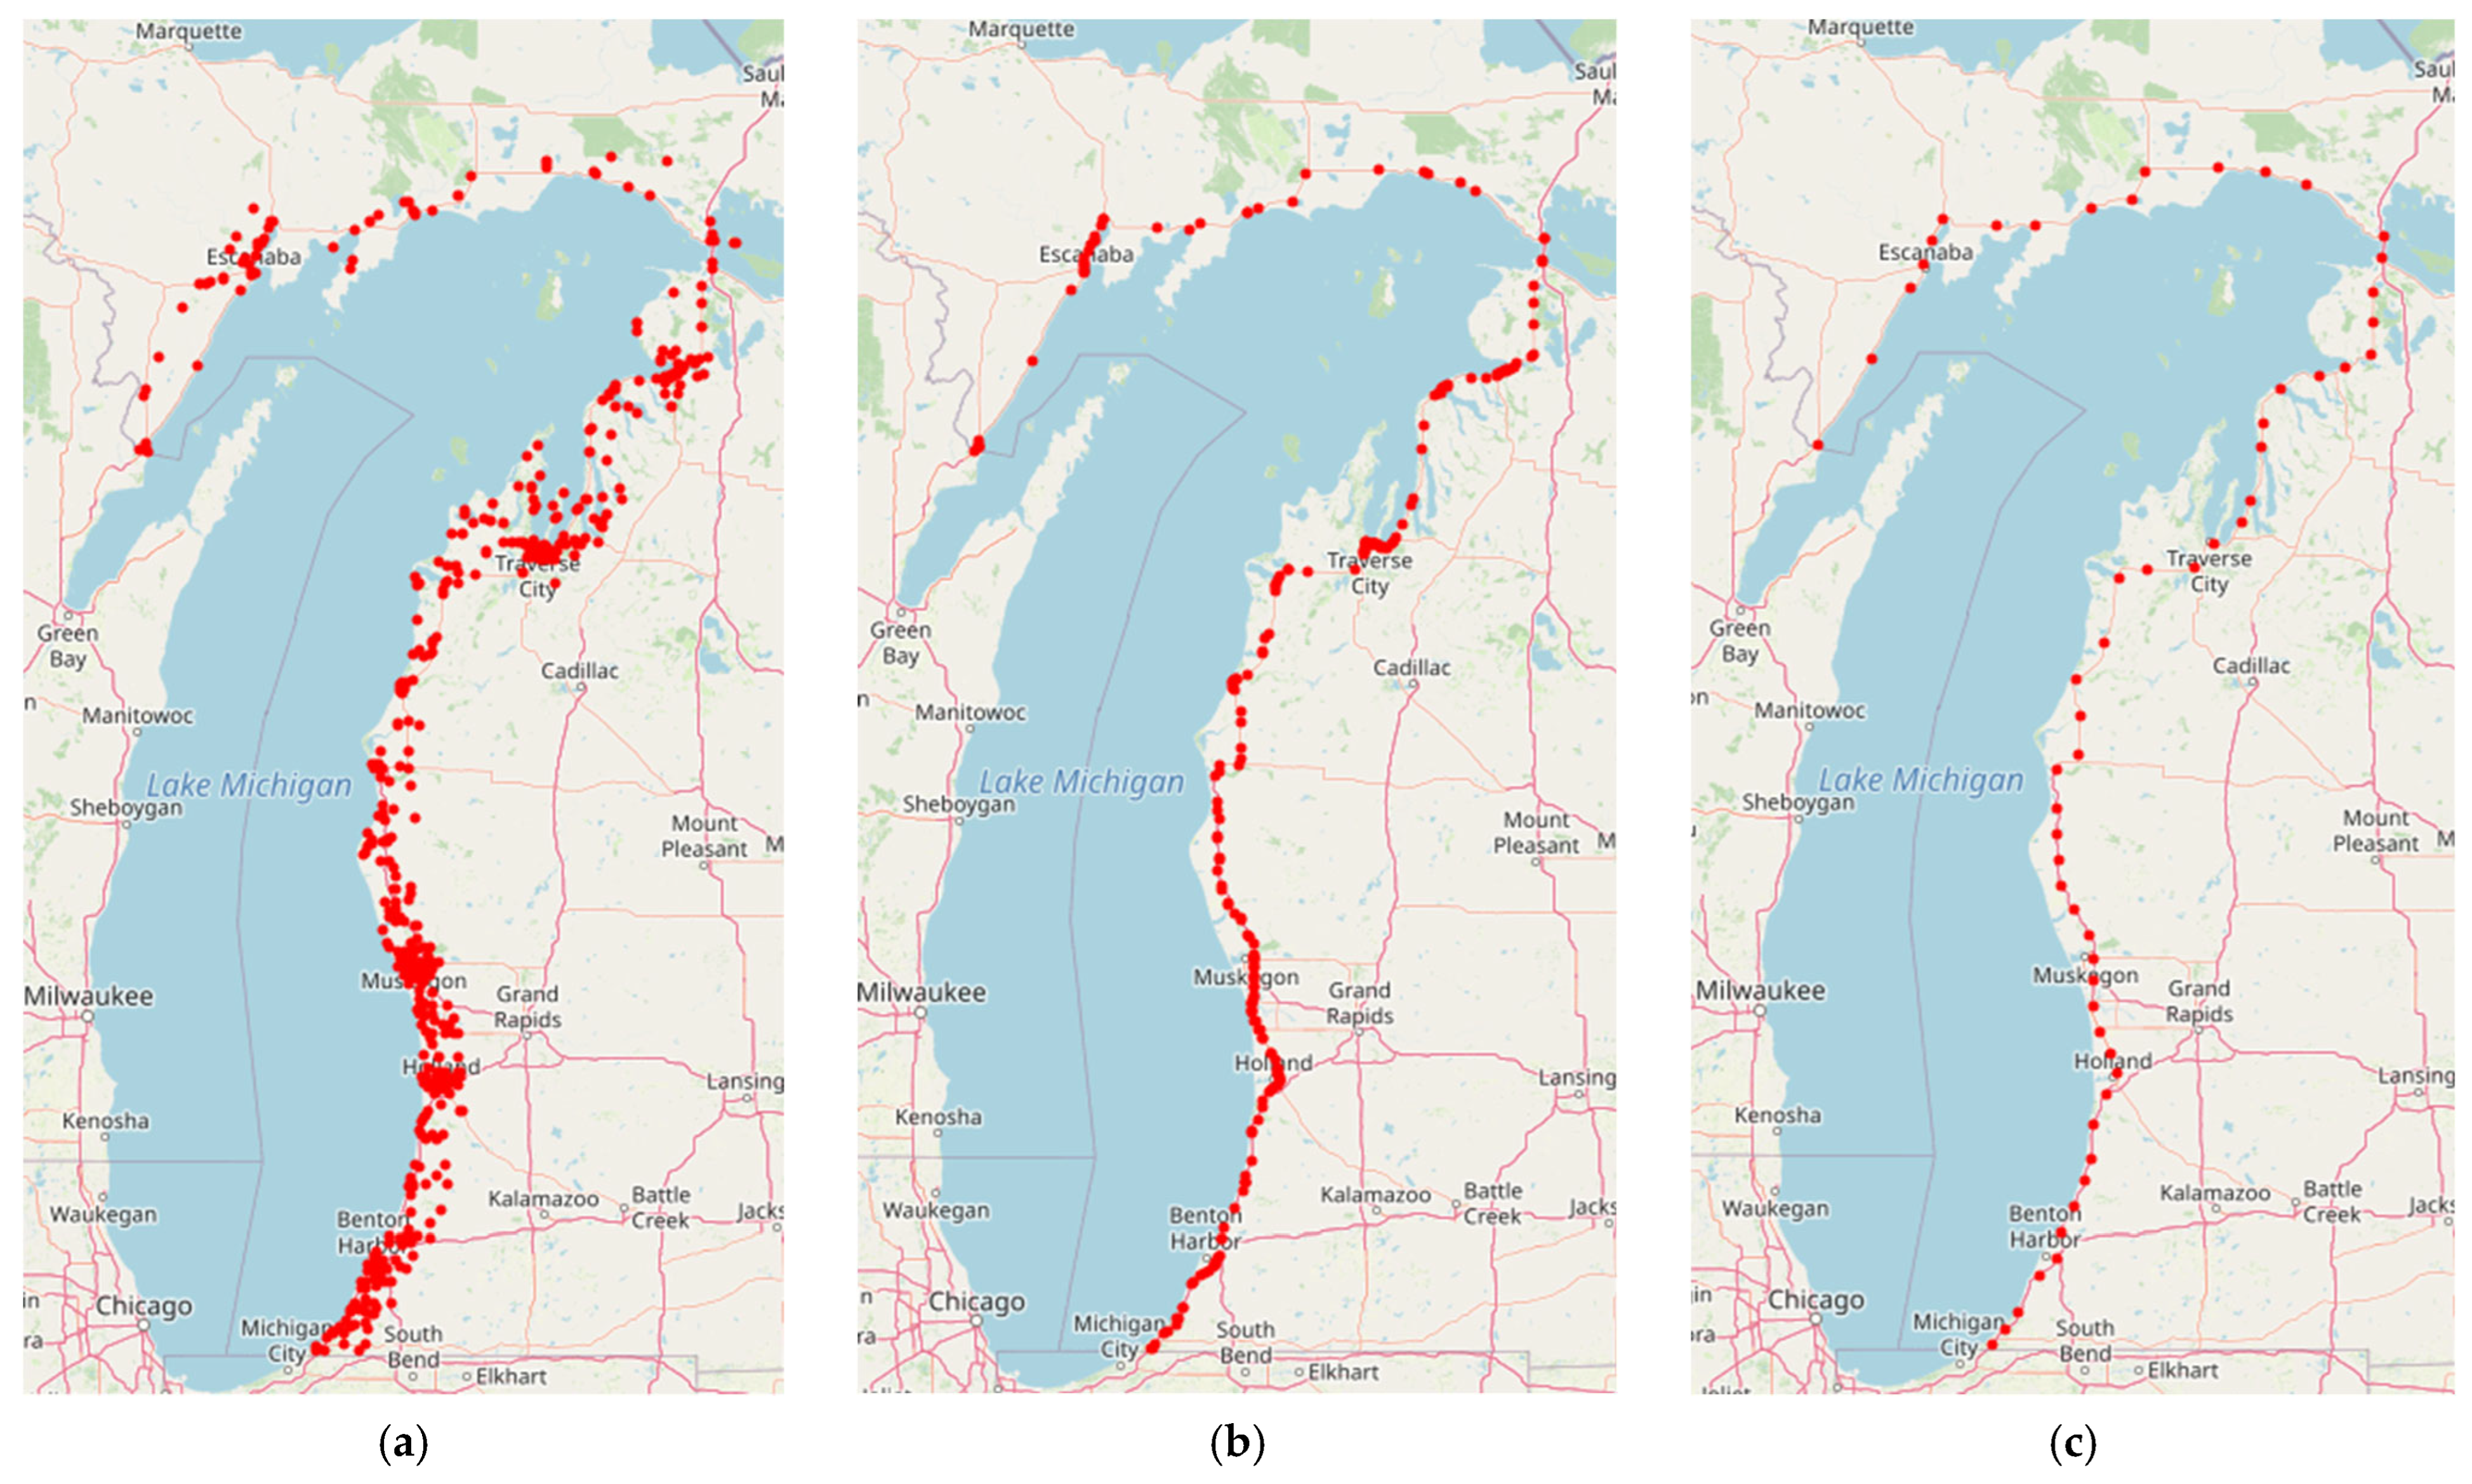
Short-term stay locations are ideal for DCFC stations, as average visit durations typically range from 15 to 60 min. A total of 640 short-term stay locations were identified in the LMC area, as shown in
Figure 4a. Each of these locations was then linked to the nearest access point on the main corridor through the shortest path, and their detour travel distances were recorded. This process resulted in 219 distinct candidate locations on the corridor, which serve as representative access points for the original short-term stay locations. As shown in
Figure 4b, most of these locations were closely distributed, with an average distance of less than 3 miles between them. However, in less developed areas of UP, distances could extend up to 24 miles. Evaluating the optimal charging infrastructure among 219 candidate locations can be time-consuming, especially in densely populated areas. To streamline this, hierarchical agglomerative clustering was applied to group the nearby candidate locations. In this approach, each candidate location is initially treated as an individual cluster. The algorithm then iteratively merges the two clusters with the smallest geographic distance between them, calculated using the Euclidean distance between their latitude and longitude coordinates. When two clusters merge, a new representative point (cluster centroid) is computed based on the average coordinates of all locations within the merged cluster. Distances to neighboring clusters are then recalculated using the average linkage criterion, which measures the average pairwise distance between points belonging to the two clusters. The clustering process continues until the distance between neighboring clusters exceeds the specified threshold of 5 miles. The centroid of each resulting cluster serves as a corridor node representation, reducing the candidate locations to 58 nodes along the LMC corridor, as shown in
Figure 4c. These 58 nodes are the final DCFC candidate locations for constructing charging infrastructure and generating and attracting EV trips.
3.4. Travel Demand
The study utilized the Michigan Origin-Destination (OD) demand table from MDOT, which provides data on trips to and from each of the 4461 TAZs. However, specific tourism-related trip data were unavailable, so an alternative approach, detailed in the solution approach section, was used to estimate tourism demand.
After identifying the final 58 DCFC candidate locations along the main corridor, the next step was to assess travel demand along the LMC corridor. The OD demand matrix of Michigan was analyzed to determine the trips passing through these nodes. The LMC corridor demand is categorized into two main groups: (i) demand generated and attracted within the LMC area and (ii) demand passing through the LMC. For the first group, the study assigned the origin and destination to the nearest of the 58 corridor nodes, converting the Michigan TAZ demands into corridor demands. For the second group, the shortest path algorithm was applied to all OD pairs to identify trips traversing the LMC area. The first and last trajectory points within the LMC along the shortest path were matched to the nearest corridor node. Out of the 19.7 million daily trips in Michigan, 1.3 million were recognized as moving between the specified corridor nodes, indicating the travel demand along the LMC.
3.5. Charging Infrastructure Cost
In this study, charging infrastructure costs are categorized into three primary components: charging station costs, charger costs, and electric grid upgrade costs. A charging station is defined as a physical site hosting one or more EV chargers. Charger costs represent the price of individual charging units, which vary by type (Level 2 or DCFC), power rating, and manufacturer. Charging station costs capture a wider set of expenditures, including electrical panel and switchgear installation, engineering and design, permitting, and project management. Electric grid upgrade costs account for the investments required to ensure that the power grid can accommodate the energy demand at each site. Cost estimates were obtained from multiple industry sources, including Greenlots, ChargePoint, Ford Pro, RED-E, and Consumers Energy, and are based on cost data reported in 2020–2025.
3.6. Electric Grid Upgrade Cost
Michigan is divided into regions managed by different utility providers, who have provided electric grid make-ready cost estimates for specific power levels to designated locations. These grid upgrade costs were obtained in 2022 from the corresponding utility providers. Five distinct energy levels were considered separately for Level 2 and DCFC stations. These grid upgrade costs cover expenses for acquiring, installing, and maintaining the power grid infrastructure needed to support the demands of charging stations.
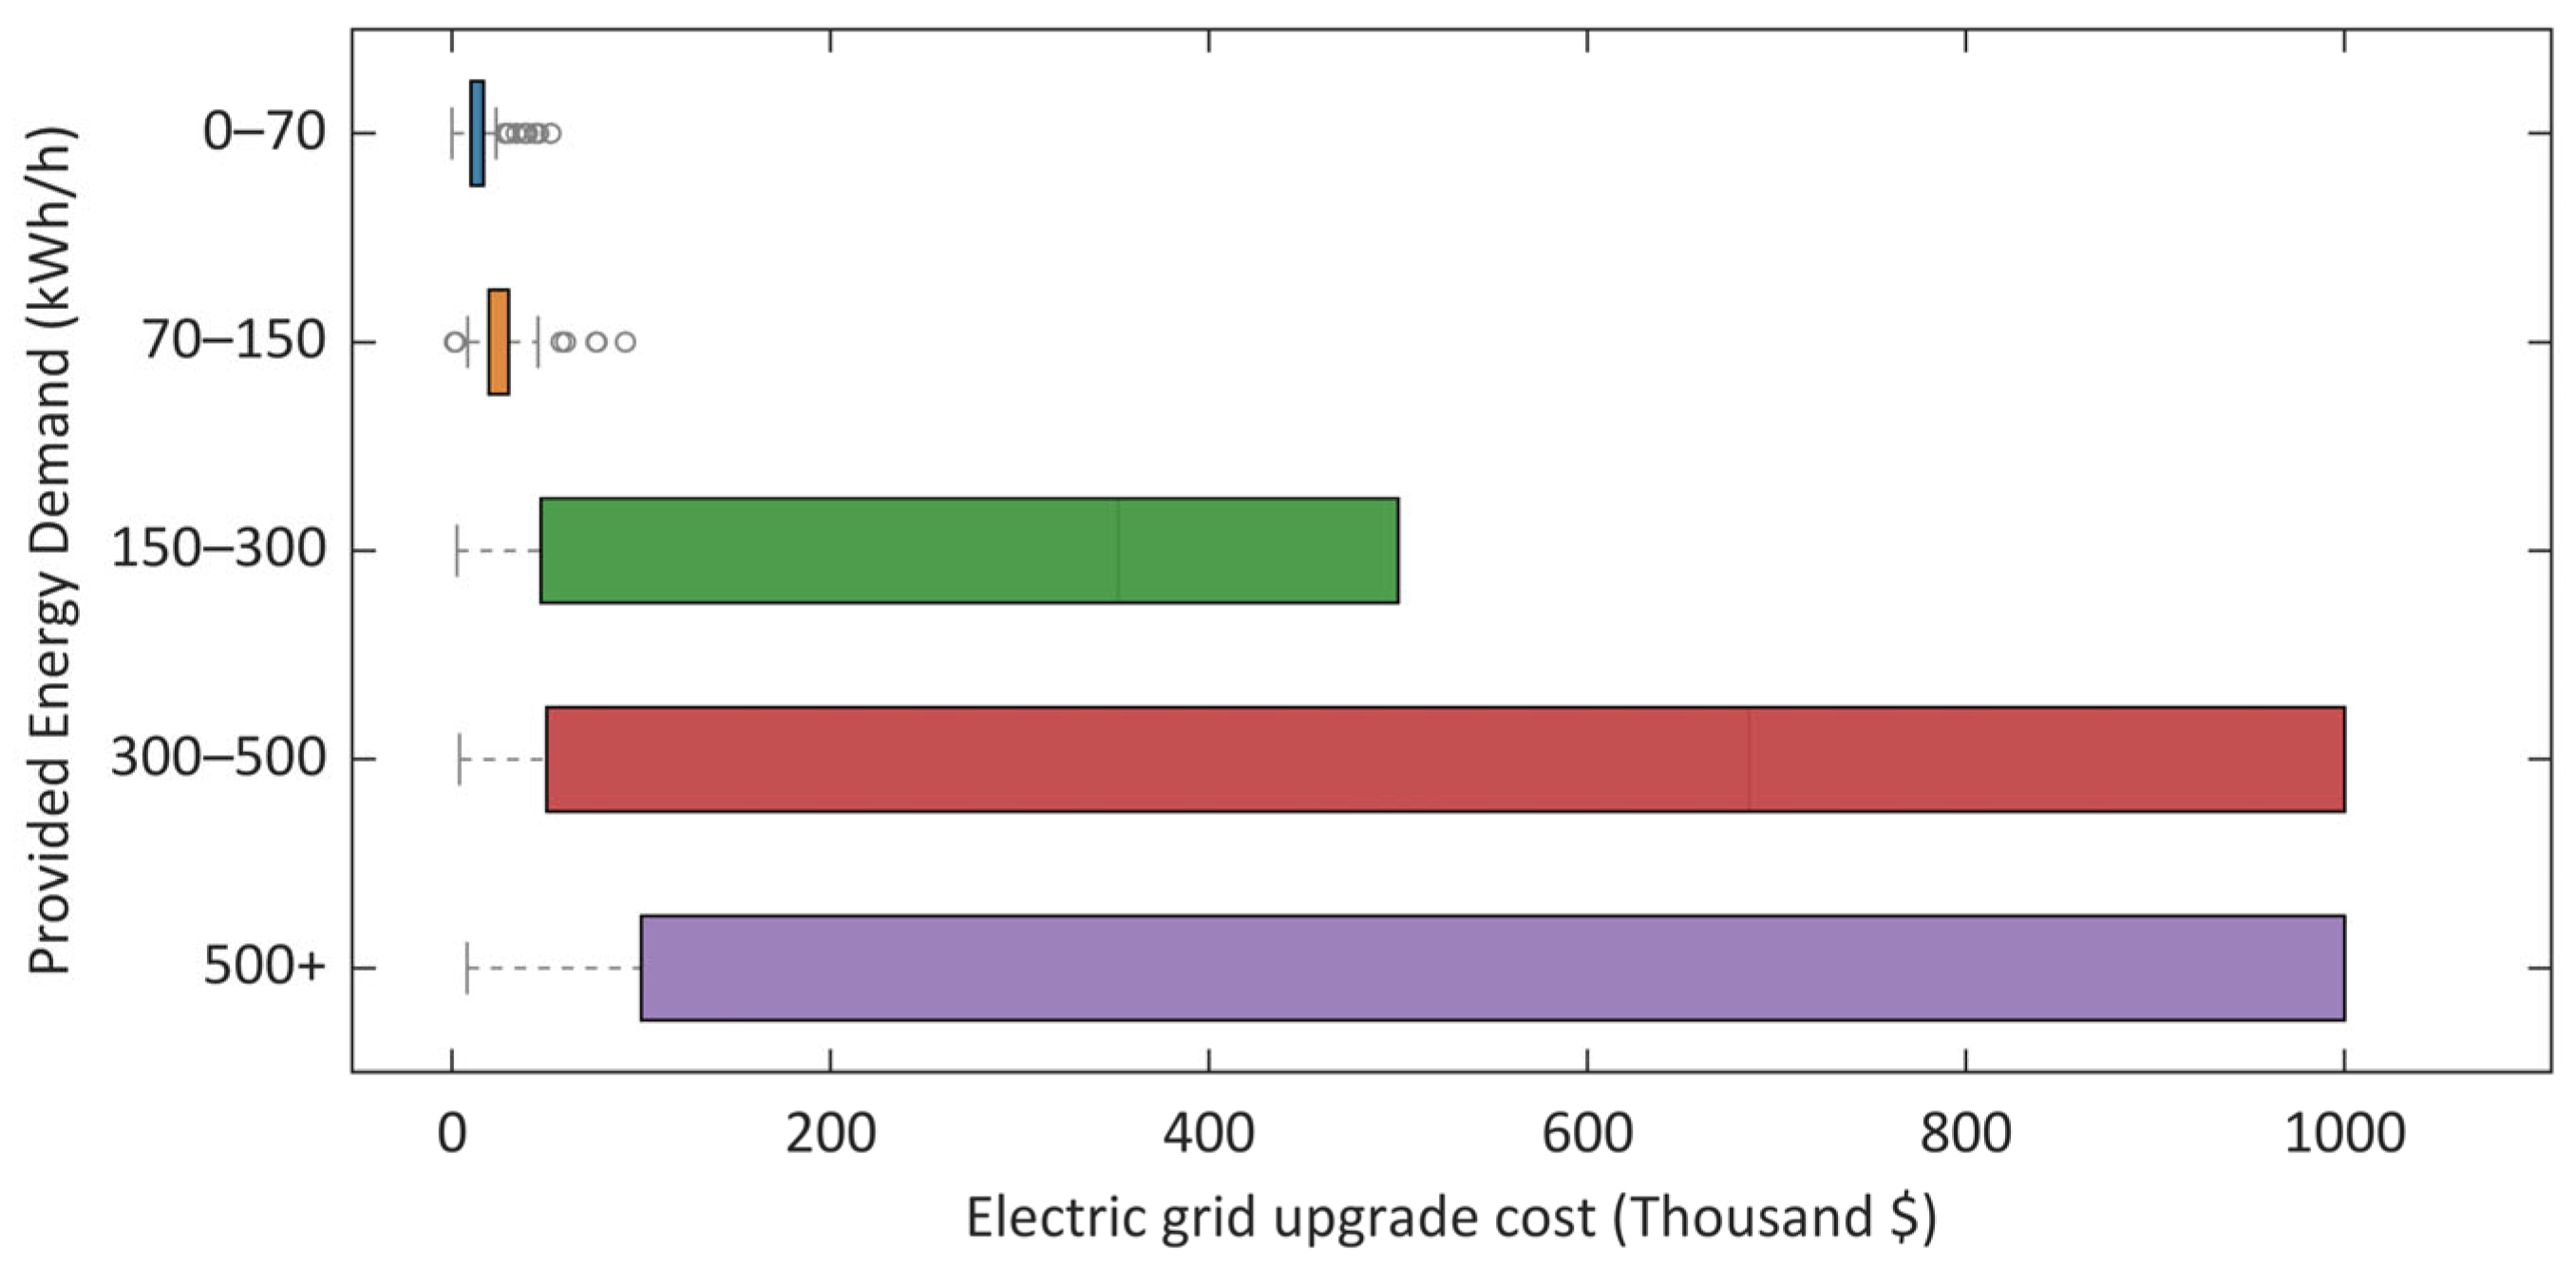
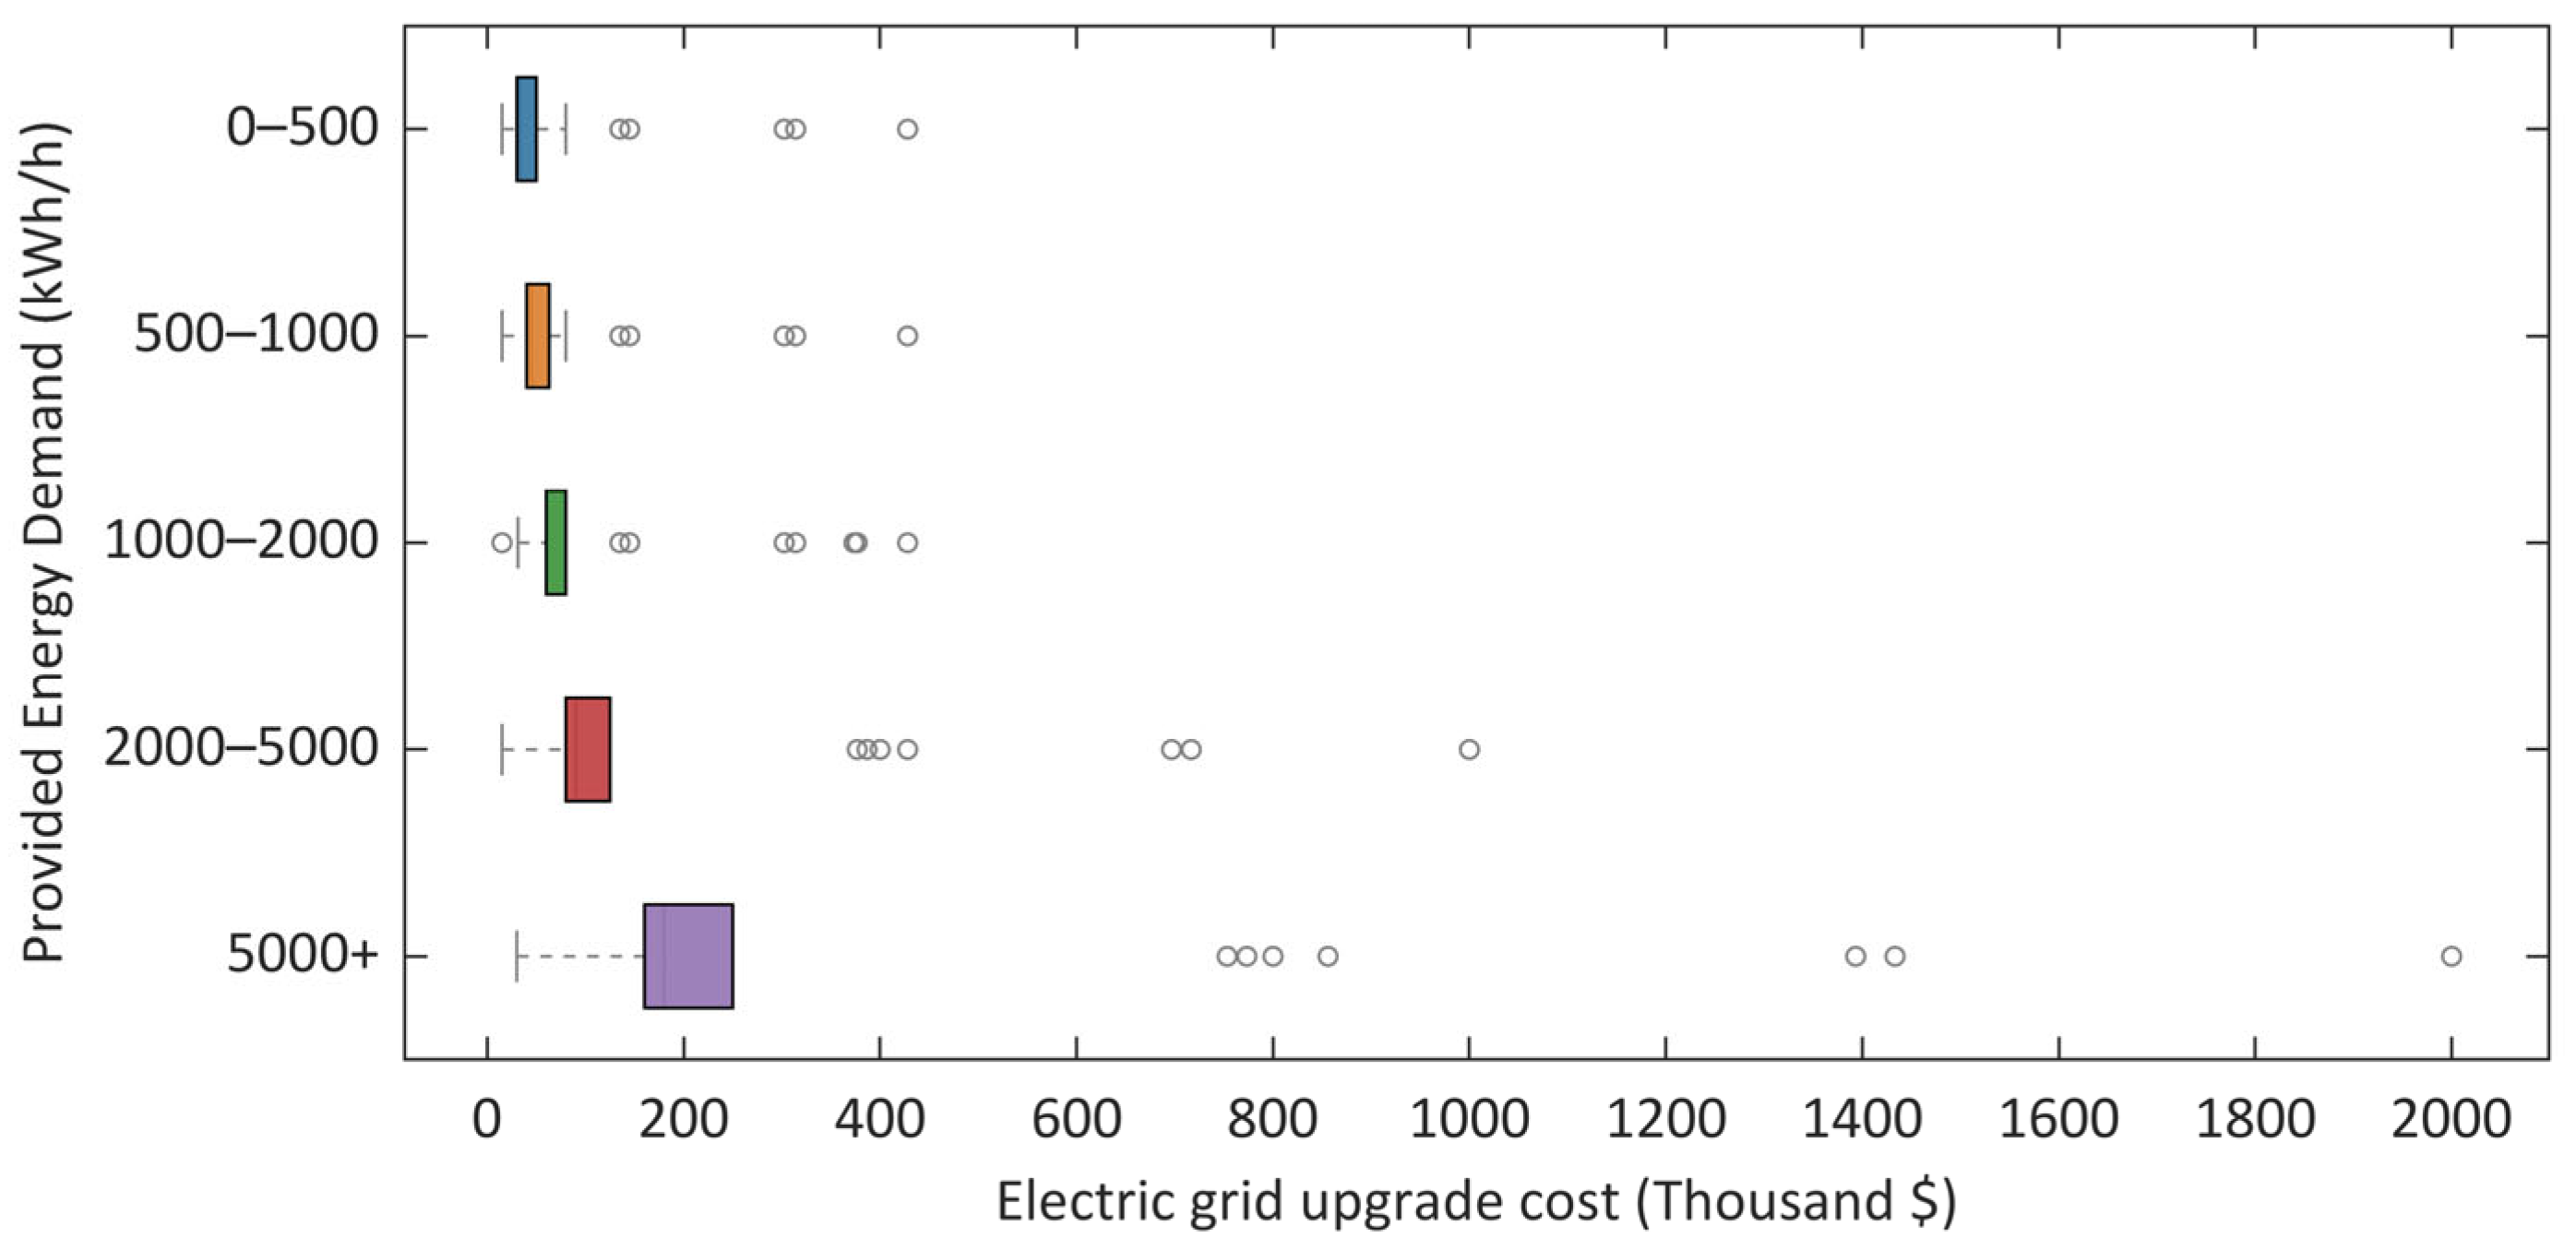
Grid upgrade costs in the LMC area varied significantly due to diverse land development and environmental characteristics, ranging from rural to densely urban regions. While some locations showed consistent costs regardless of energy level, others experienced significant cost increases as energy demand rose. These increases are largely due to the need for technological upgrades or enhancements in grid capacity. To address this variability, the study devised a step function capturing grid upgrade costs
for different ranges of hourly energy demand at each location
.
Figure 5 shows the distribution of grid upgrade costs by energy demand level for Level 2 chargers. For each energy demand level, the box plot represents the distribution of grid upgrade costs across different locations within the study area. Equation (1) presents the step function used to represent grid upgrade costs for Level 2 chargers. In this equation, the grid upgrade cost
at location
is determined by the energy demand level at that location (
). Specifically, the cost corresponds to the upgrade cost associated with the demand tier
that accommodates the required energy capacity, denoted as
. This step function structure reflects the fact that grid upgrade costs increase discretely as higher demand thresholds are reached. Note that
Figure 5 displays the utility upgrade cost associated with different demand tiers at different locations
.
Electric grid upgrade cost data for all 640 initial DCFC candidate points were also acquired. For each of the final 58 corridor nodes, the grid upgrade cost was calculated as the average of the grid upgrade costs associated with the originally aggregated DCFC candidate points at that location.
Figure 6 presents the distribution of grid upgrade costs by energy demand level for DCFC chargers across the corridor nodes. For each energy demand level, the box plot shows the variability of grid upgrade costs across different locations within the study area. Equation (2) presents the step function used to represent grid upgrade costs for DCFC chargers. In this equation, the grid upgrade cost
at location
is determined by the energy demand level at that location (
). Specifically, the cost corresponds to the upgrade cost associated with the demand tier
that accommodates the required energy capacity, denoted as
. This step function structure reflects the fact that grid upgrade costs increase discretely as higher demand thresholds are reached. Note that
Figure 6 displays the utility upgrade cost associated with different demand tiers at different locations
.
3.7. Current Charging Infrastructure
Incorporating existing chargers in the analysis is essential, as they currently meet a portion of the charging demand. This inclusion allows for a more comprehensive and realistic evaluation of the charging infrastructure needs and efficient use of resources.
3.7.1. Existing Level 2 Chargers
The Alternative Fuel Data Center (AFDC) [
77] provides data on EV charging station locations across the nation, including Michigan. In the LMC area, a Level 2 charger is considered accessible if it is within a 0.5-mile radius of a Level 2 candidate point. As a result, 230 existing Level 2 chargers are included in the analysis.
Figure 7 shows the distribution of these chargers in the LMC area.
3.7.2. Existing DC Fast Chargers
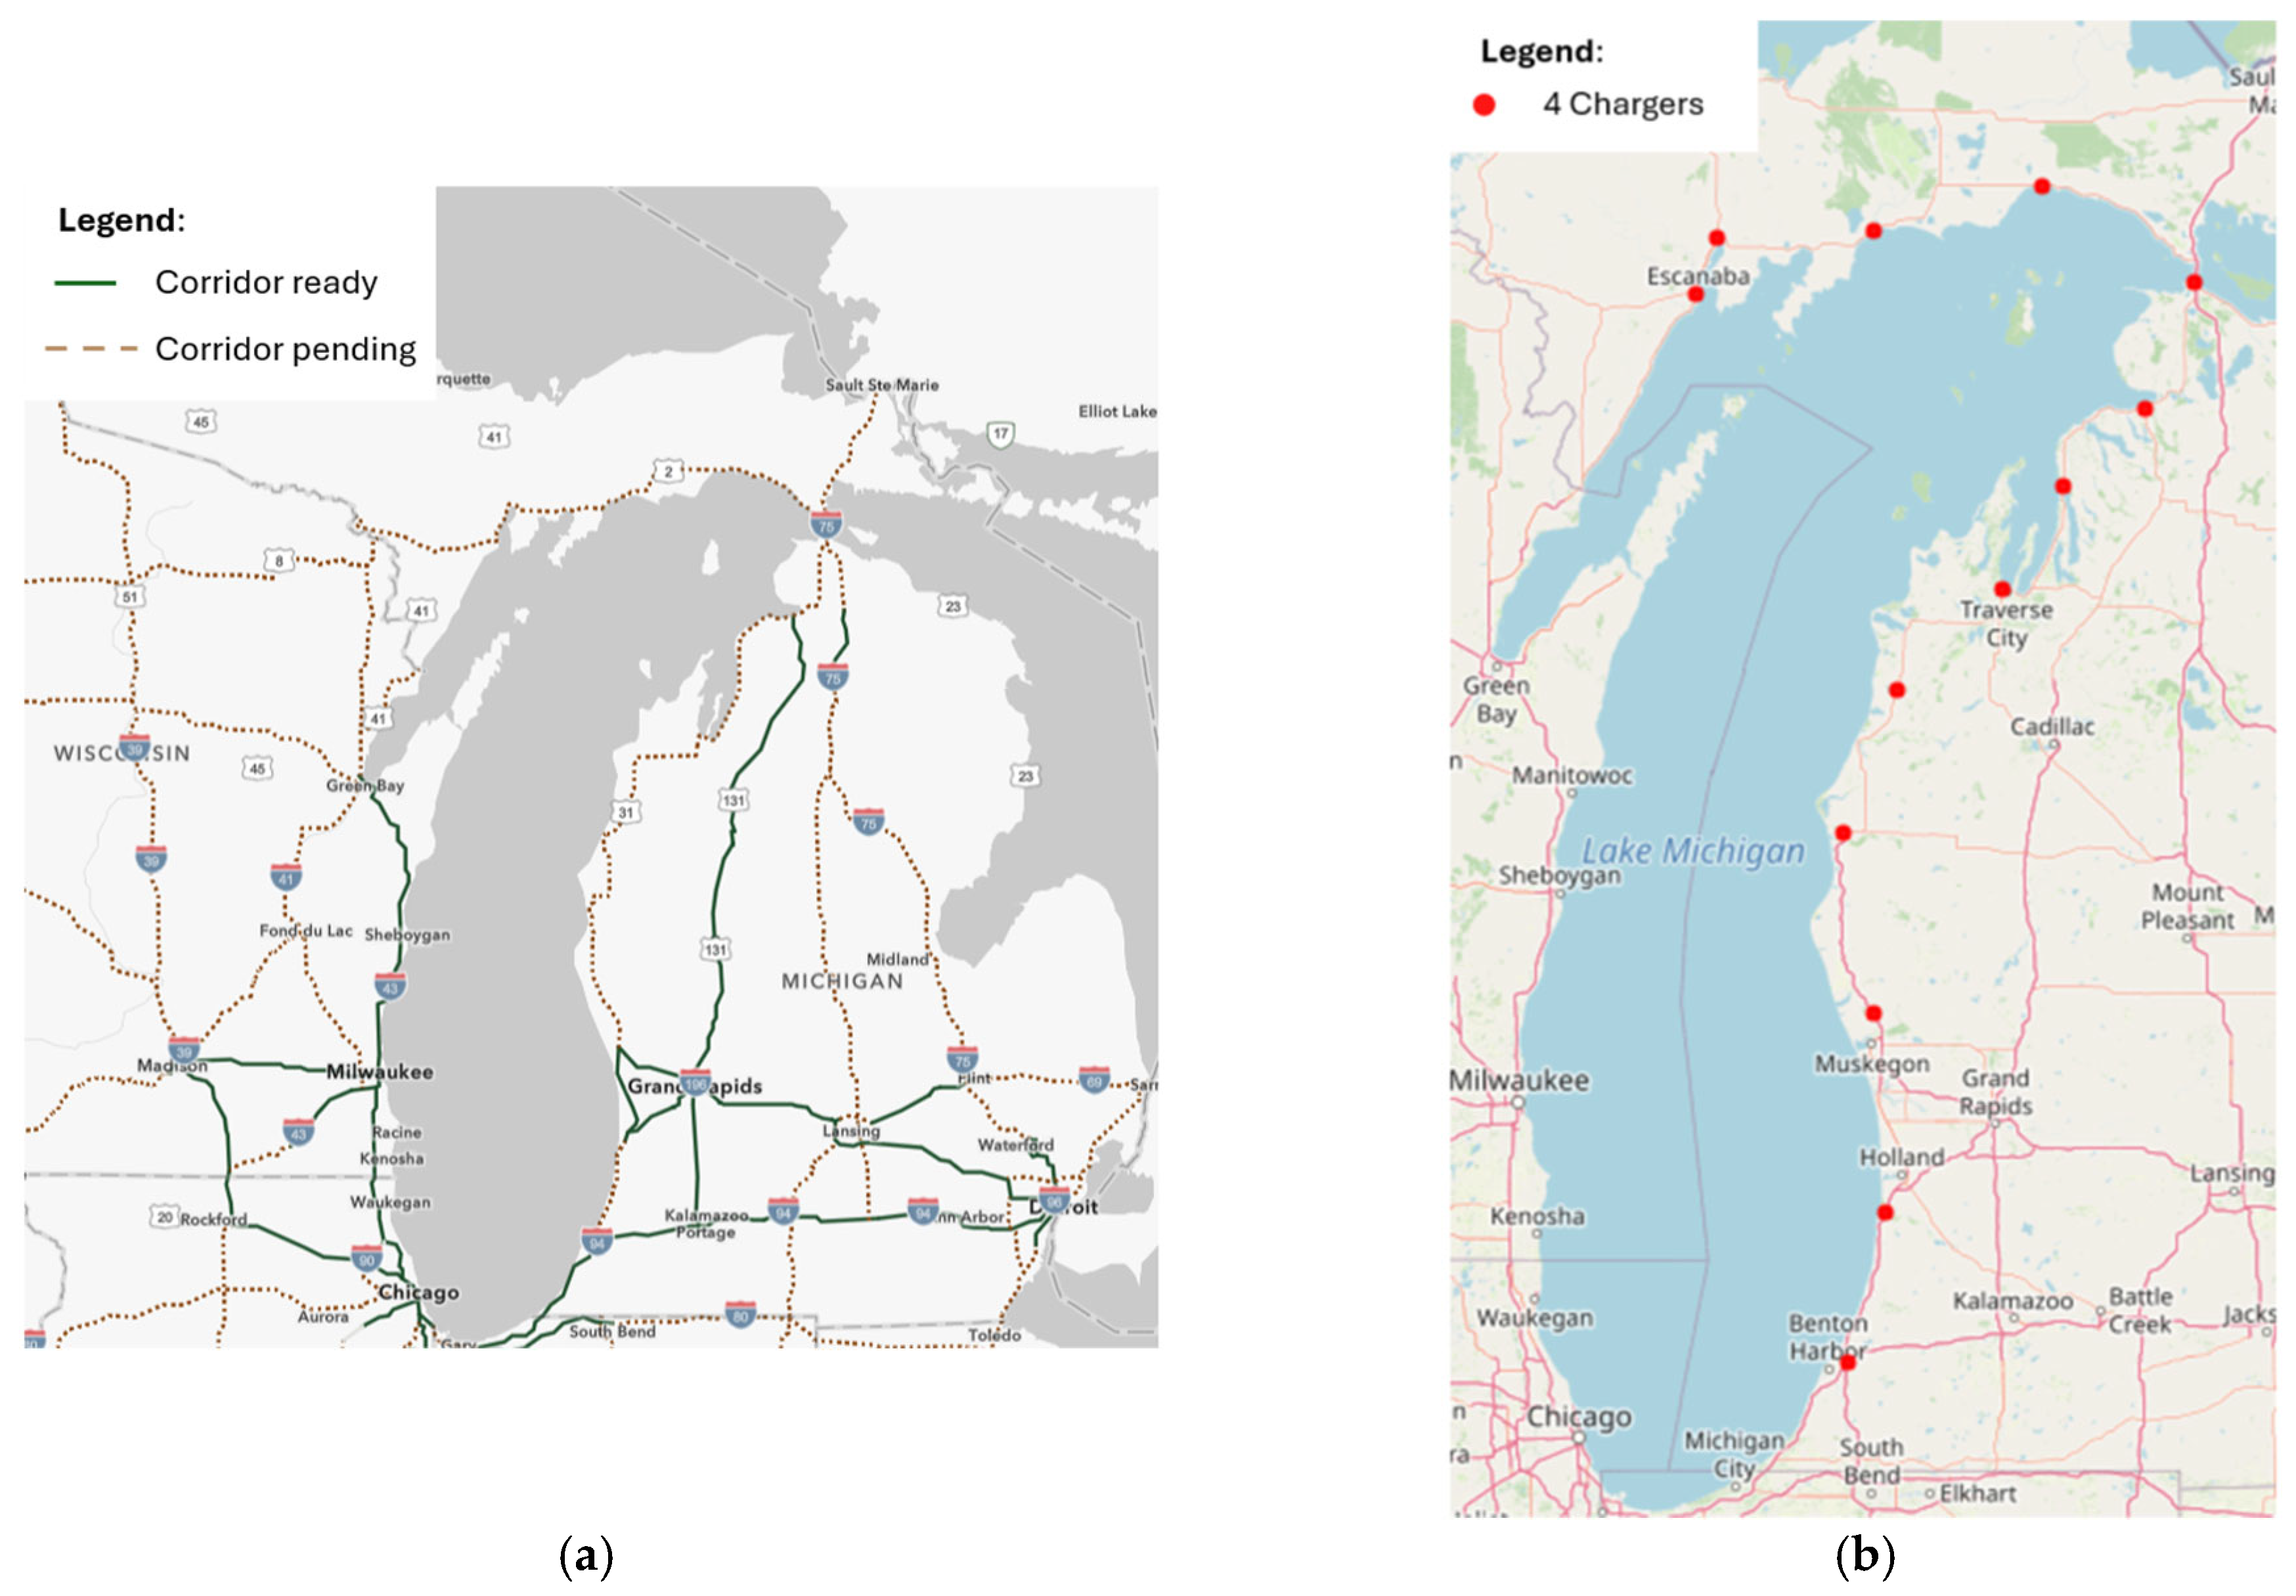
Federal and state initiatives aimed at expanding fast-charging infrastructure are designed to enhance intercity electric vehicle mobility across Michigan. As part of these efforts, designated Alternative Fuel Corridors are planned to host sites equipped with a minimum of four 150 kW DCFCs, as illustrated in
Figure 8a. This planned corridor network was evaluated to identify facilities that could contribute to the existing and near-term charging landscape along the LMC corridor. The assessment identified 13 stations along the corridor that are expected to provide four or more DCFC units by 2026, yielding an estimated total of 52 current and planned fast chargers incorporated into the LMC analyses, as shown in
Figure 8b. These corridor-based fast chargers will accommodate a portion of the DCFC demand and any unserved charging demand from the Level 2 network.
5. Solution Approach
The optimization problem formulated in this study is characterized as a Mixed-Integer Nonlinear Programming (MINLP) model. The nonlinearities stem primarily from constraints associated with stochastic queuing at DCFC stations, path feasibility along the travel corridor, and the stepwise representation of electric grid upgrade costs. While commercial solvers can be applied to such problems, the large-scale nature of the model, combined with the nonlinear components described above, results in substantial computational time and memory requirements, making exact solution approaches computationally impractical for this study. To address these challenges, this study employs an integrated solution framework that consists of multiple heuristic algorithms: the Greedy Adaptive Incremental allocatioN (GAIN) method developed by Soltanpour et al. [
75] for Level 2 charging infrastructure and the Modified Constrained Simulated Annealing (MCSA) method introduced by Rostami et al. [
76] for DCFC infrastructure. This study relied on these algorithms because their performance, reliability, and applicability had already been thoroughly tested and evaluated in the original studies that introduced them. In those studies, the authors conducted extensive validation and analysis to demonstrate the robustness and effectiveness of the proposed methods under different conditions. In particular, the GAIN algorithm was compared with an exact solver in the original study, showing that it reaches a solution that is marginally different from the optimal solution (approximately +2%), while the exact method requires approximately 24 s compared to only 0.5 s for GAIN. Similarly, the MCSA algorithm was also benchmarked against an exact approach for a reduced-size problem, where both methods reached exactly the same results, but the exact solution required about 18 h, whereas MCSA achieved the same solution in only 1.15 min. Therefore, the fundamental validity of the algorithms was not re-tested here and this study focuses on applying these well-established methods within the context of the present research problem.
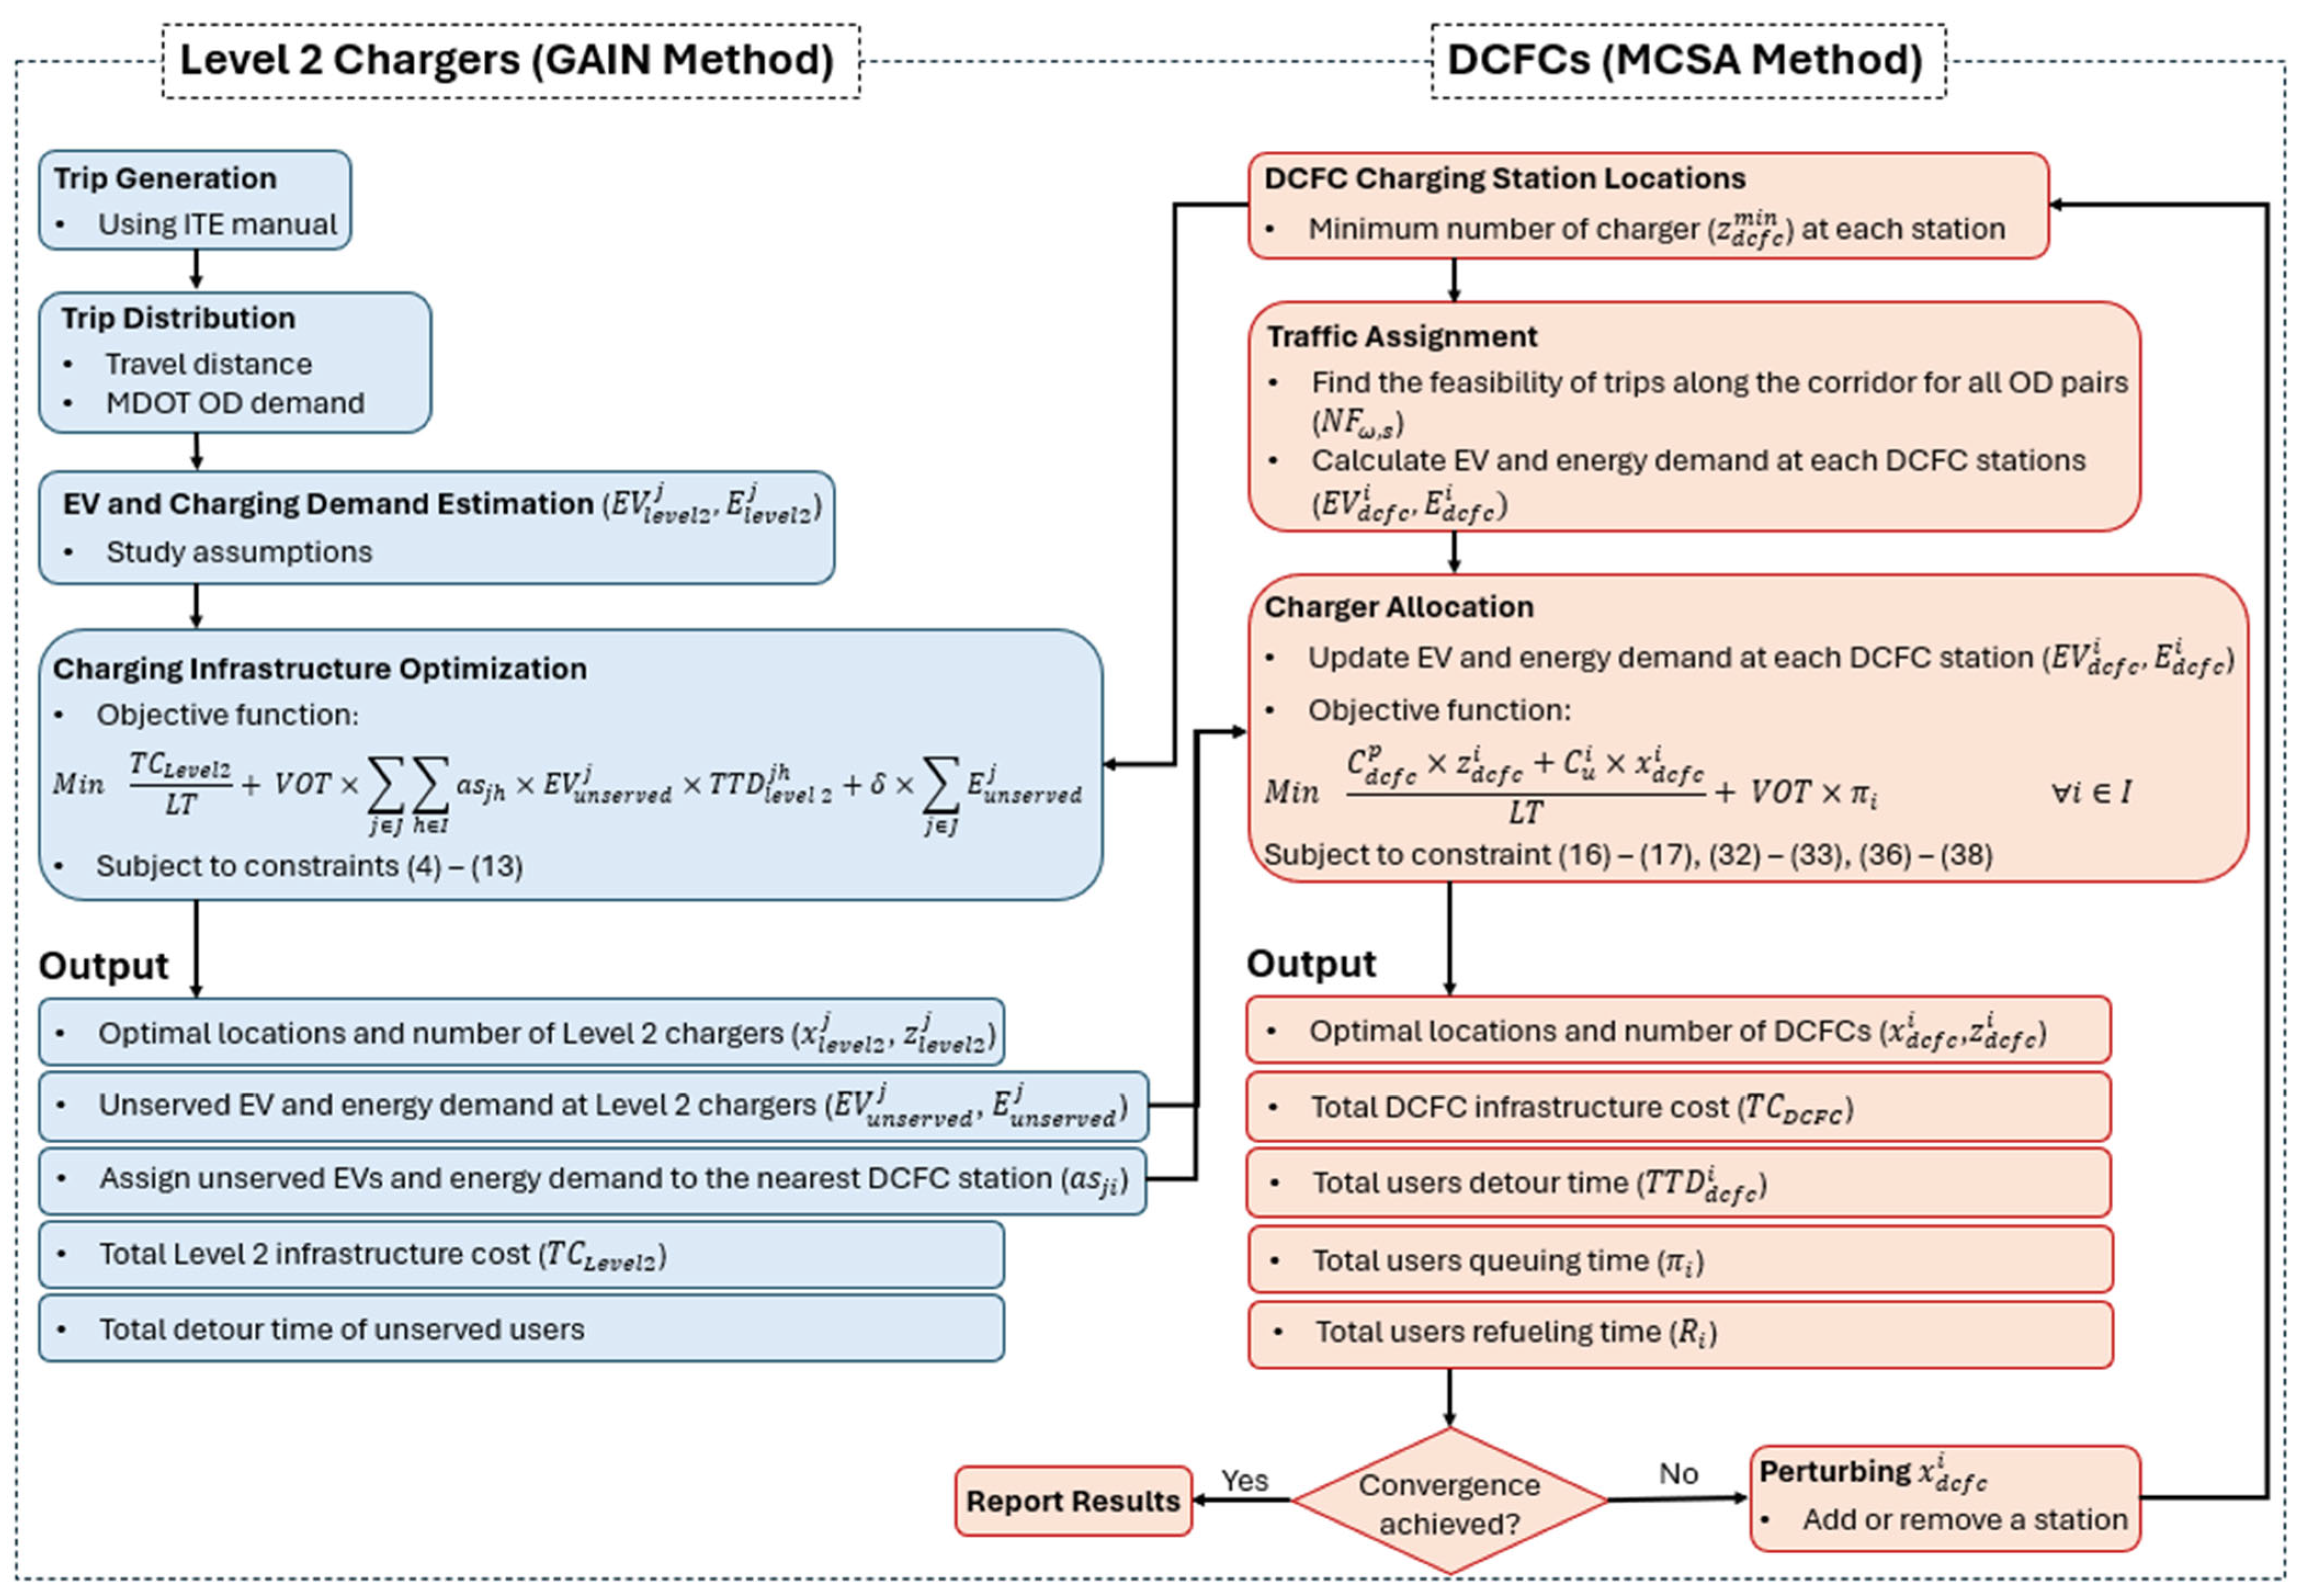
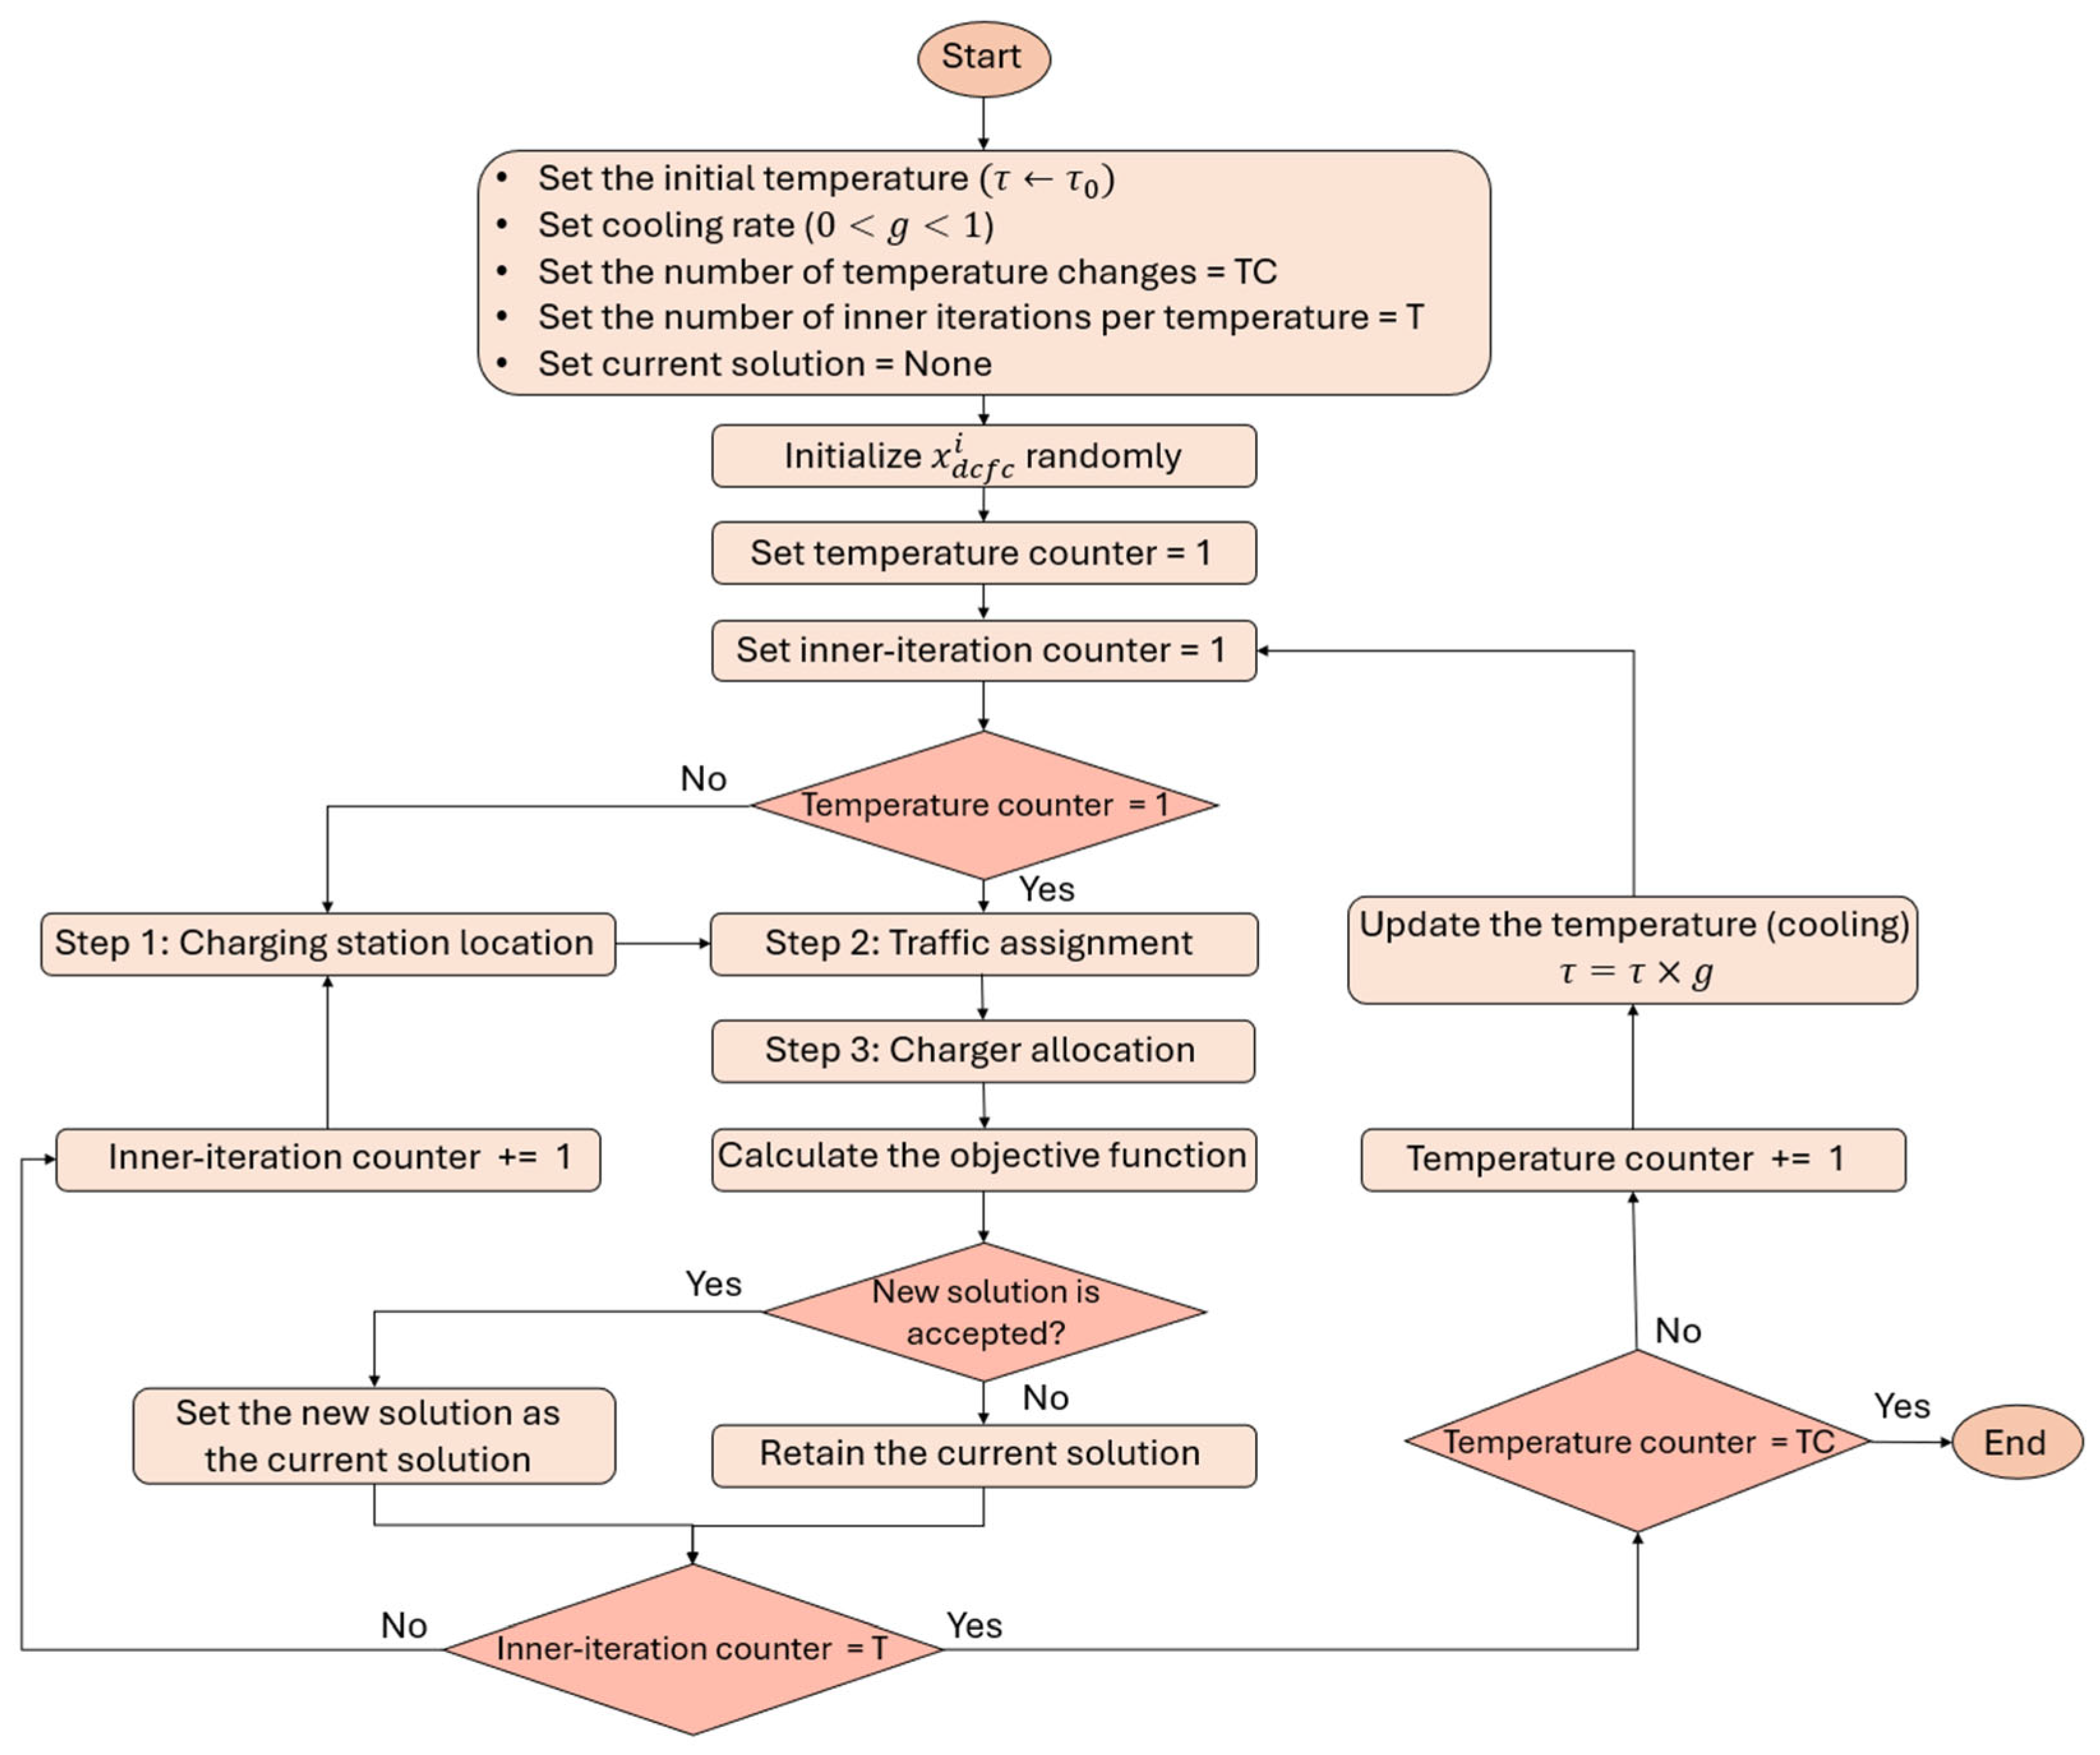
Figure 10 illustrates the proposed integrated framework developed in this study, which solves Level 2 and DCFC networks simultaneously with the interconnected solution approach.
As illustrated in
Figure 10, the proposed framework employs an iterative process that integrates Level 2 (destination-based) and DCFC (corridor-based) charging networks, rather than addressing them sequentially. The process begins by randomly initializing the locations of DCFC stations through binary assignments of the decision variable
, with the condition that existing charging sites are always included. The traffic assignment module is then applied to evaluate the feasibility of trips along the corridor and to estimate the corresponding energy demand at each DCFC station. These preliminary DCFC locations are subsequently incorporated into the Level 2 charging framework.
Within the Level 2 framework, knowledge of DCFC station placement is required to allocate unserved EVs and their associated energy demand from Level 2 stations to the nearest DCFC stations, while also calculating detour times. Once the Level 2 framework is solved, the number of unserved EVs, their energy requirements, and their assigned DCFC stations are determined. This information is then used to update the EV and energy demand at each DCFC station, which in turn informs the optimization of charger quantities at these stations. The decision variable is subsequently perturbed by slightly modifying the current configuration, generating a new that alters Level 2 detour travel times and, in turn, the associated unserved charging demand. This iterative process continues until the termination criteria are satisfied. The following sections present a detailed description of the solution approaches for both networks.
5.1. Level 2 Destination Charging
The primary analytical steps in this section include: (i) trip generation, (ii) trip distribution, (iii) EV and charging demand estimation, and (iv) charging infrastructure optimization. These steps determine the optimal location and number of Level 2 chargers.
5.1.1. Trip Generation
First, due to the absence of tourism-specific data, trip generation rates from the Institute of Transportation Engineers (ITE) Trip Generation Manual [
80] are derived by matching the business types of candidate locations with the corresponding land use categories in the manual and are then used to estimate the number of trips attracted to each destination zone. The manual provides trip generation rates based on estimator variables such as facility area or number of employees, depending on the land use type. In this study, long-term stay locations such as hotels and motels are considered as candidate points. According to the manual, hotels and motels generate on average 14.34 and 25.17 trips per employee per day, respectively. By applying the recommended assumption of 50% entering and 50% exiting trips, the number of attracted trips is estimated as 7.17 trips per employee per day for hotels and 12.58 for motels.
5.1.2. Trip Distribution
The origins of trips are identified by considering both traveled distance and state OD demand, used for accurately predicting tourism travel patterns. Although trips originating from distant locations are more likely to terminate at long-term destinations such as hotels, they typically appear less frequently in the OD demand table. Consequently, the distribution factor must strike a balance between travel distance and state OD demand to more accurately capture tourism travel behavior. Equation (39) defines the calculation of the distribution factor, excluding trips under 85 miles that are unlikely to end at long-term destinations. The probability of zone
m serving as the origin of trips attracted to zone
n (
) is proportional to two ratios: the share of demand between zones
m and
n relative to the total demand attracted to zone
n (
), and the share of the distance between zones
m and
n relative to the total distance between all zones and zone
n (
). Normalization of demand and distance mitigates scale disparities and enables their meaningful combination. The resulting product integrates the effects of both travel demand and distance in the trip distribution process.
5.1.3. EV and Charging Demand Estimation
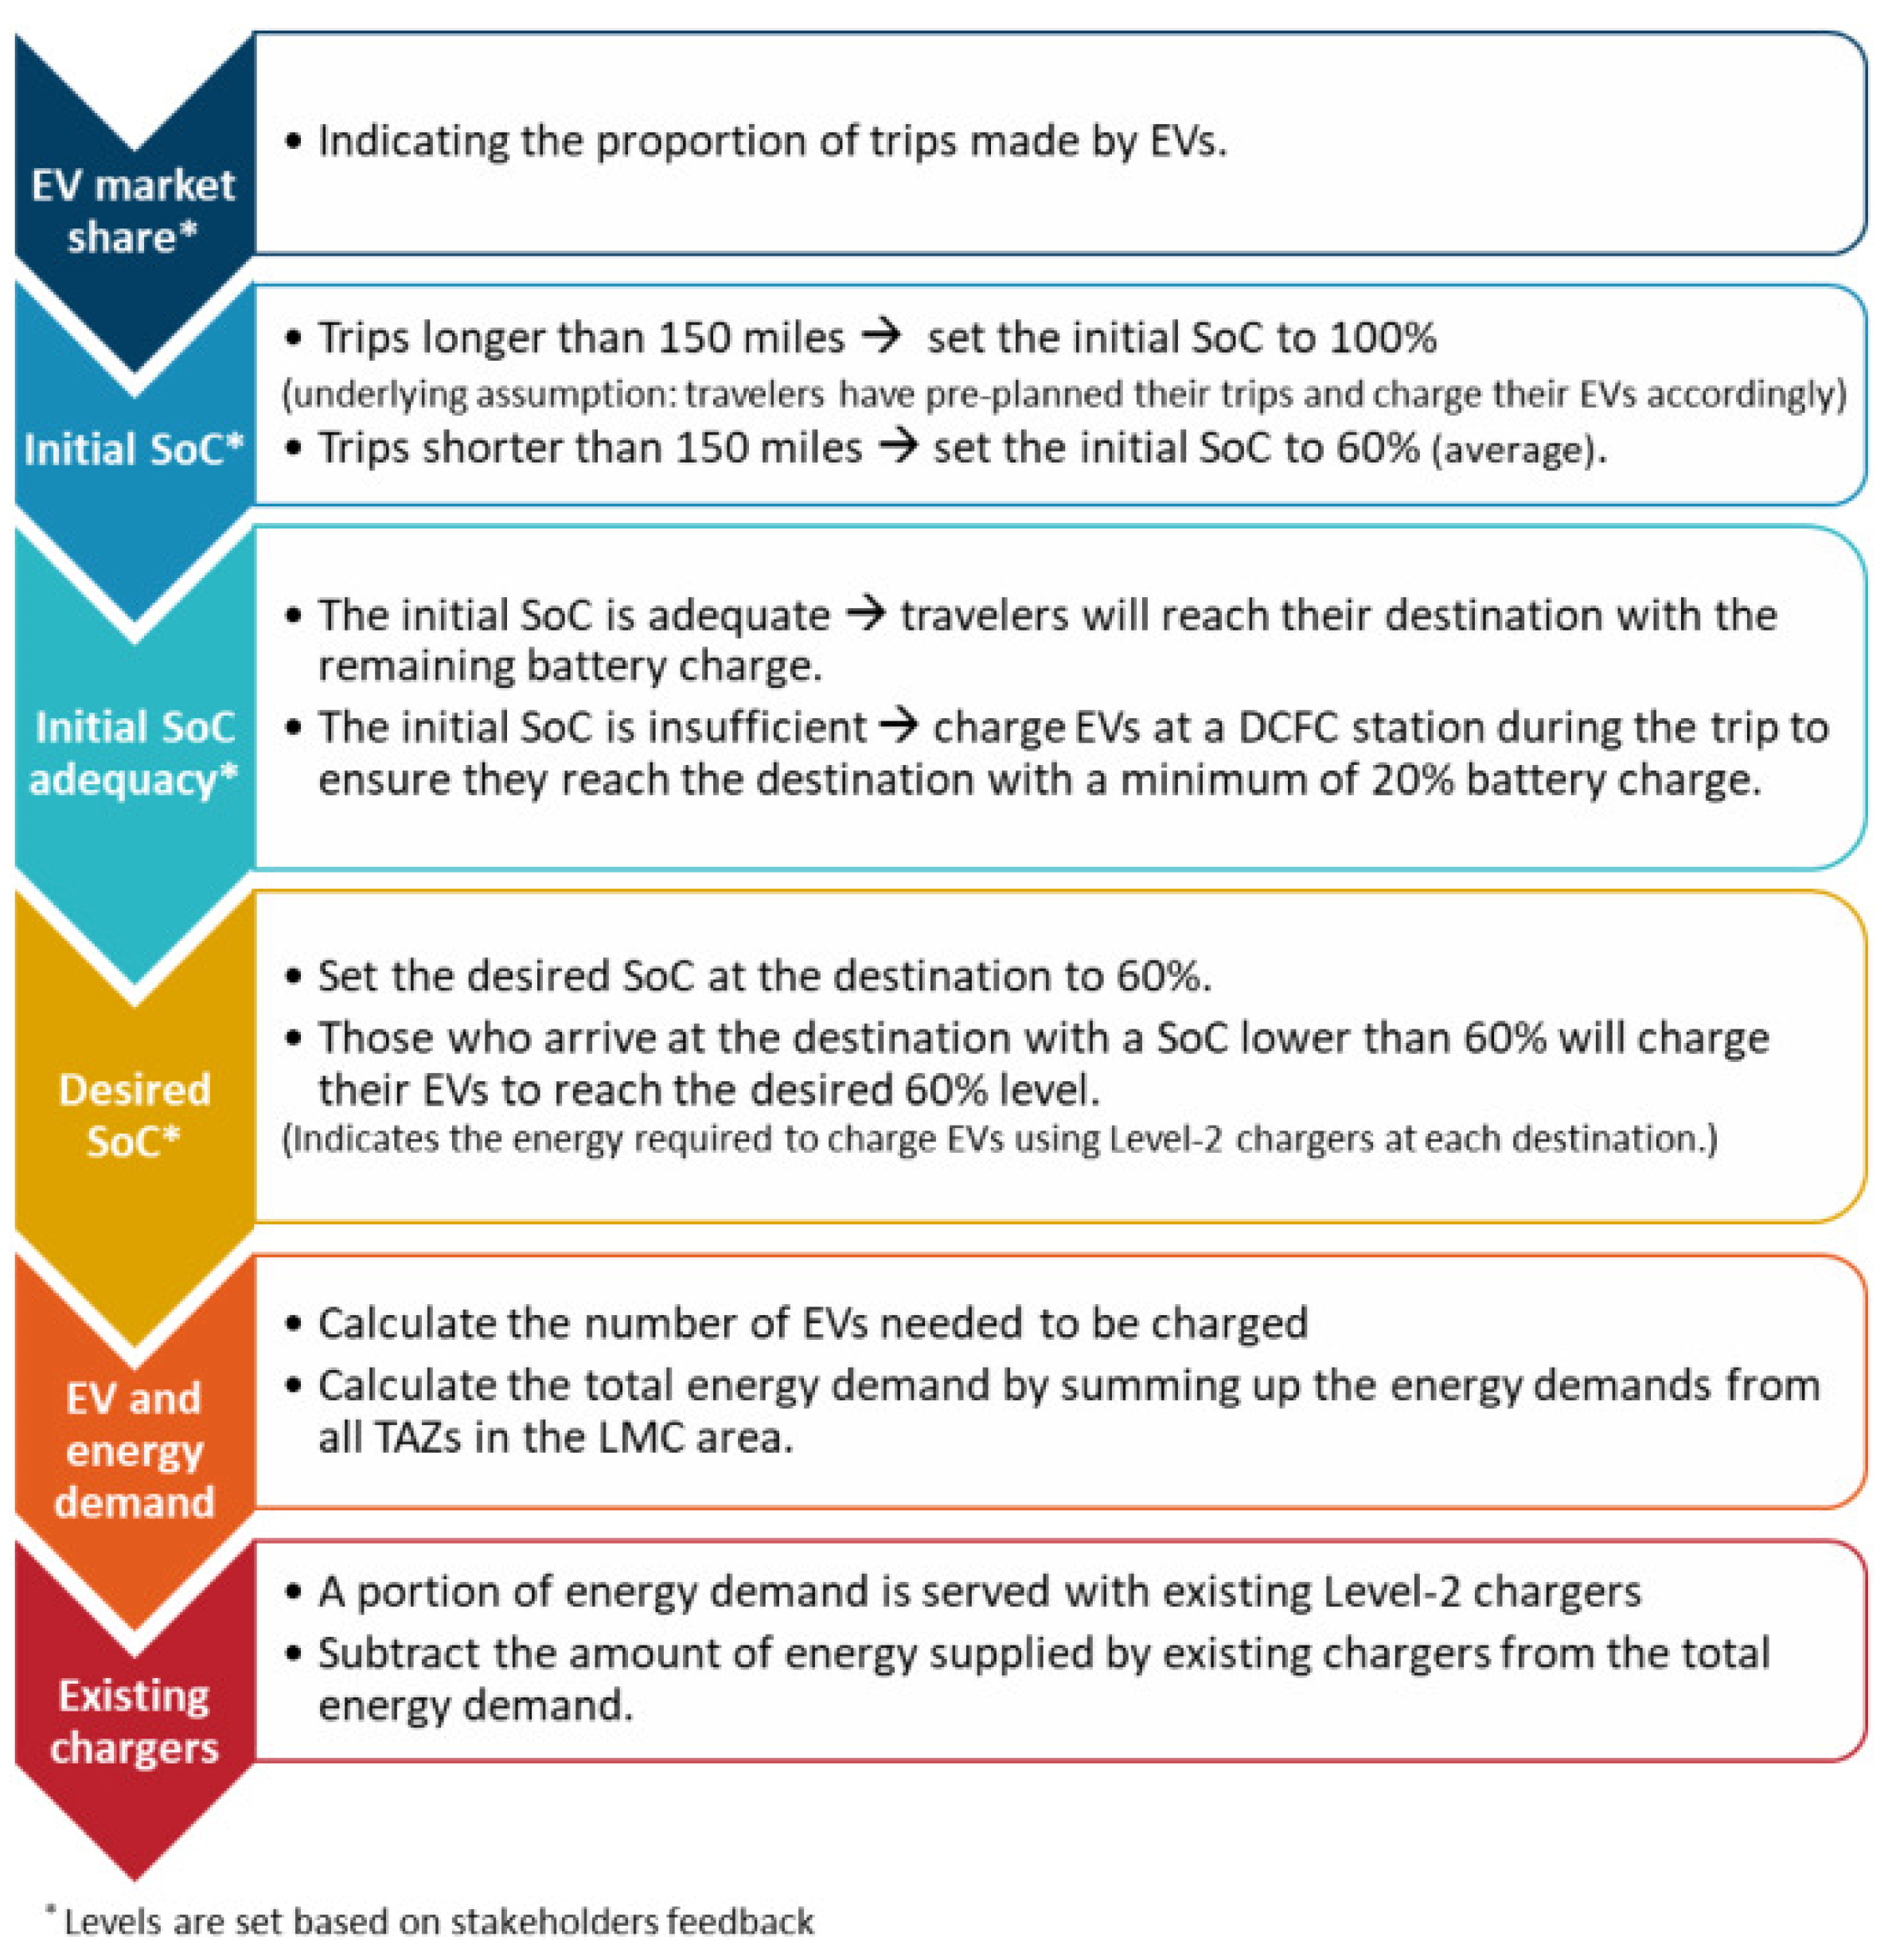
The destination charging demand is then estimated based on factors including EV market share, initial SoC, minimum allowable SoC, and desired SoC (which represents the battery level that users aim to achieve upon arrival at their destination, at which point they recharge their vehicle to this level) at the destinations. These parameter values were determined based on discussions and feedback obtained through stakeholder engagement sessions involving EV users, car companies, infrastructure providers, planners, and decision-makers.
Figure 11 summarizes the assumptions adopted in this study to estimate the EV charging demand.
5.1.4. Charging Infrastructure Optimization
The first three steps are computed once at the outset, as they are independent of DCFC placement and remain constant across iterations. The subsequent step introduces the charger optimization model, which determines the optimal location and number of Level 2 chargers based on the outputs of the preceding steps and the location of DCFC stations. The GAIN method begins by enumerating the costs associated with different quantities of Level 2 chargers at each destination zone. The algorithm then performs an iterative allocation process, incrementally adding chargers across locations. At each step, it evaluates the potential benefits of all possible allocations by considering user inconvenience costs, delays, and infrastructure costs, and then selects the location and number of chargers that provide the greatest marginal improvement. Unlike approaches restricted to adding a single charger per iteration, GAIN permits the allocation of one or multiple chargers simultaneously, thereby reducing the likelihood of entrapment in local optima. The process continues until the available budget is exhausted or all destination zones are fully served, with no remaining unserved demand, whichever condition is met first (for detailed methodology, refer to Ref. [
75]).
5.2. DCFC Intermediate Charging
This section describes the MCSA algorithm developed by Rostami et al., along with the required adaptation to be included as part of the integrated framework: (i) charging station location, (ii) traffic assignment, and (iii) charger allocation. Together, these steps determine the optimal siting and sizing of DCFC infrastructure.
The general framework of the MCSA method, as illustrated in
Figure 12, begins with the initialization of the temperature and cooling rate parameters, which regulate the rate at which the temperature decreases over time. The algorithm also specifies the number of temperature changes and the number of inner iterations performed at each temperature level. In each iteration, a new neighboring solution is generated by perturbing the current solution (Step 1: Charging Station Location). This is followed by Step 2, traffic assignment, and Step 3, charger allocation. Once the station locations and charger quantities are determined, the objective function is evaluated for the new solution, incorporating infrastructure costs, user inconvenience costs, and constraint violations. The acceptance of a new solution depends on its objective function value relative to the current solution. If the new solution yields a lower objective function, it is accepted outright. Otherwise, it may still be accepted according to a probabilistic acceptance function that depends on both the current temperature and the relative objective function values of the new and current solutions. As the temperature decreases over time, the probability of acceptance diminishes, thereby guiding the algorithm toward convergence to the optimal solution. When a new solution is accepted, it becomes the basis for subsequent perturbations; if rejected, the current solution is retained as the basis. This iterative process continues until the termination criteria are satisfied. The following subsections provide detailed explanations of each step.
5.2.1. Charging Station Location
Charging station location is treated differently in the initial iteration compared to subsequent ones. In the first iteration, the algorithm randomly initializes DCFC stations through binary assignments of the decision variable with the condition that existing stations are always included. In later iterations, a new neighboring solution is generated by perturbing the current either by adding or removing a station. The probability of removal is lower for stations with higher EV and energy demand, while the probability of addition is higher for sites with greater EV traffic. To effectively manage feasibility and budget constraints, the algorithm employs a dynamic penalty approach, allowing perturbation not only in station locations but also in the penalty vector. In this step, each station is assigned the minimum allowable number of chargers ().
5.2.2. Traffic Assignment
To evaluate system feasibility, this study proposes an EV station selection and assignment algorithm. The algorithm defines the buffer range, the search area within which users search for charging stations, assigns vehicles to stations located within this range, and determines their charging behavior. If no charging stations fall within the buffer, the trip and its associated demand are deemed infeasible, and the total infeasible demand across all corridor trips is used as the feasibility violation for that solution. Otherwise, demand is distributed evenly among the available stations. Charging behavior is determined by trip context: if the charging event is the final one before reaching the destination, vehicles charge only enough to ensure at least the minimum SoC upon arrival; otherwise, they recharge to the maximum allowable SoC at that stage. When multiple charging events are required, the trip is divided into smaller segments, and each event is evaluated independently. By performing this step, the EV and energy demand at each station are calculated and subsequently used in the next step to determine the required number of chargers at each station. In this study, the initial SoC is assumed to be 60%, the buffer range is defined between 20% and 40% SoC, and the maximum allowable SoC is set to 80%. These parameter values were determined based on discussions and feedback obtained through stakeholder engagement sessions involving EV users, infrastructure providers, planners, and decision-makers. For most parameters, the stakeholders showed general agreement on the selected values. In instances where differing opinions arose, the stakeholders engaged in further discussion and reached a consensus by adopting representative average values that were acceptable to all parties.
5.2.3. Charger Allocation
In this step, the total infrastructure cost of constructing charging stations with the minimum number of chargers, as specified in the first step, is first calculated. Any remaining budget is then allocated to install additional chargers across the stations. If the calculated infrastructure cost exceeds the available budget, the solution is classified as infeasible, and the excess amount beyond the budget is recorded as the budget violation for that solution. For each DCFC charging station, the unserved EV and energy demand redirected from the Level 2 network must be incorporated into the existing EV and energy demand at that station. Given a specified set of station locations, the corresponding charging events and associated energy demands are used to determine the optimal number of chargers at each station, with the objective of balancing electric grid upgrade costs, charger installation costs, and user queueing delays. In the absence of budgetary constraints, sufficient chargers are allocated at each station to minimize the objective function defined in
Figure 10 across all charging stations. Under budget limitations, however, this study introduces an iterative greedy allocation strategy. In each iteration, one charger is assigned to the station that yields the lowest combined infrastructure cost (electric grid upgrade and charger cost) while producing the greatest reduction in user queueing time. The process continues until the budget threshold is reached.
6. Numerical Example
This section presents the results of the proposed framework by applying the solution approach to the LMC study area. The main scenario assumes a total budget of
$20 million for constructing charging infrastructure, followed by a budget-sensitivity analysis to examine how different budget levels influence infrastructure deployment and user inconvenience. For each scenario, the estimated CO
2 emissions savings are also calculated. In addition, a value-of-time analysis is conducted based on average hourly wages in Michigan to assess how user time valuation affects charging infrastructure decisions and associated inconvenience.
Table 2 presents the assumptions and parameter values adopted for the main scenario in this study, developed in consultation with major and relevant stakeholders. Parameters with location-specific variation, such as land costs and electric grid upgrade costs, and total DCFC EV and energy demand, are excluded due to their substantial variability. The assumptions adopted in this study are aligned with current state and federal initiatives, including the NEVI Formula Program, particularly in terms of the DCFC charger power level and infrastructure requirements. Additionally, the existing DCFC infrastructure incorporated in the analysis reflects planned deployments under different state policy programs. These policy-related inputs can be readily modified, allowing the proposed framework to be adapted to different regional policy contexts and planning guidelines.
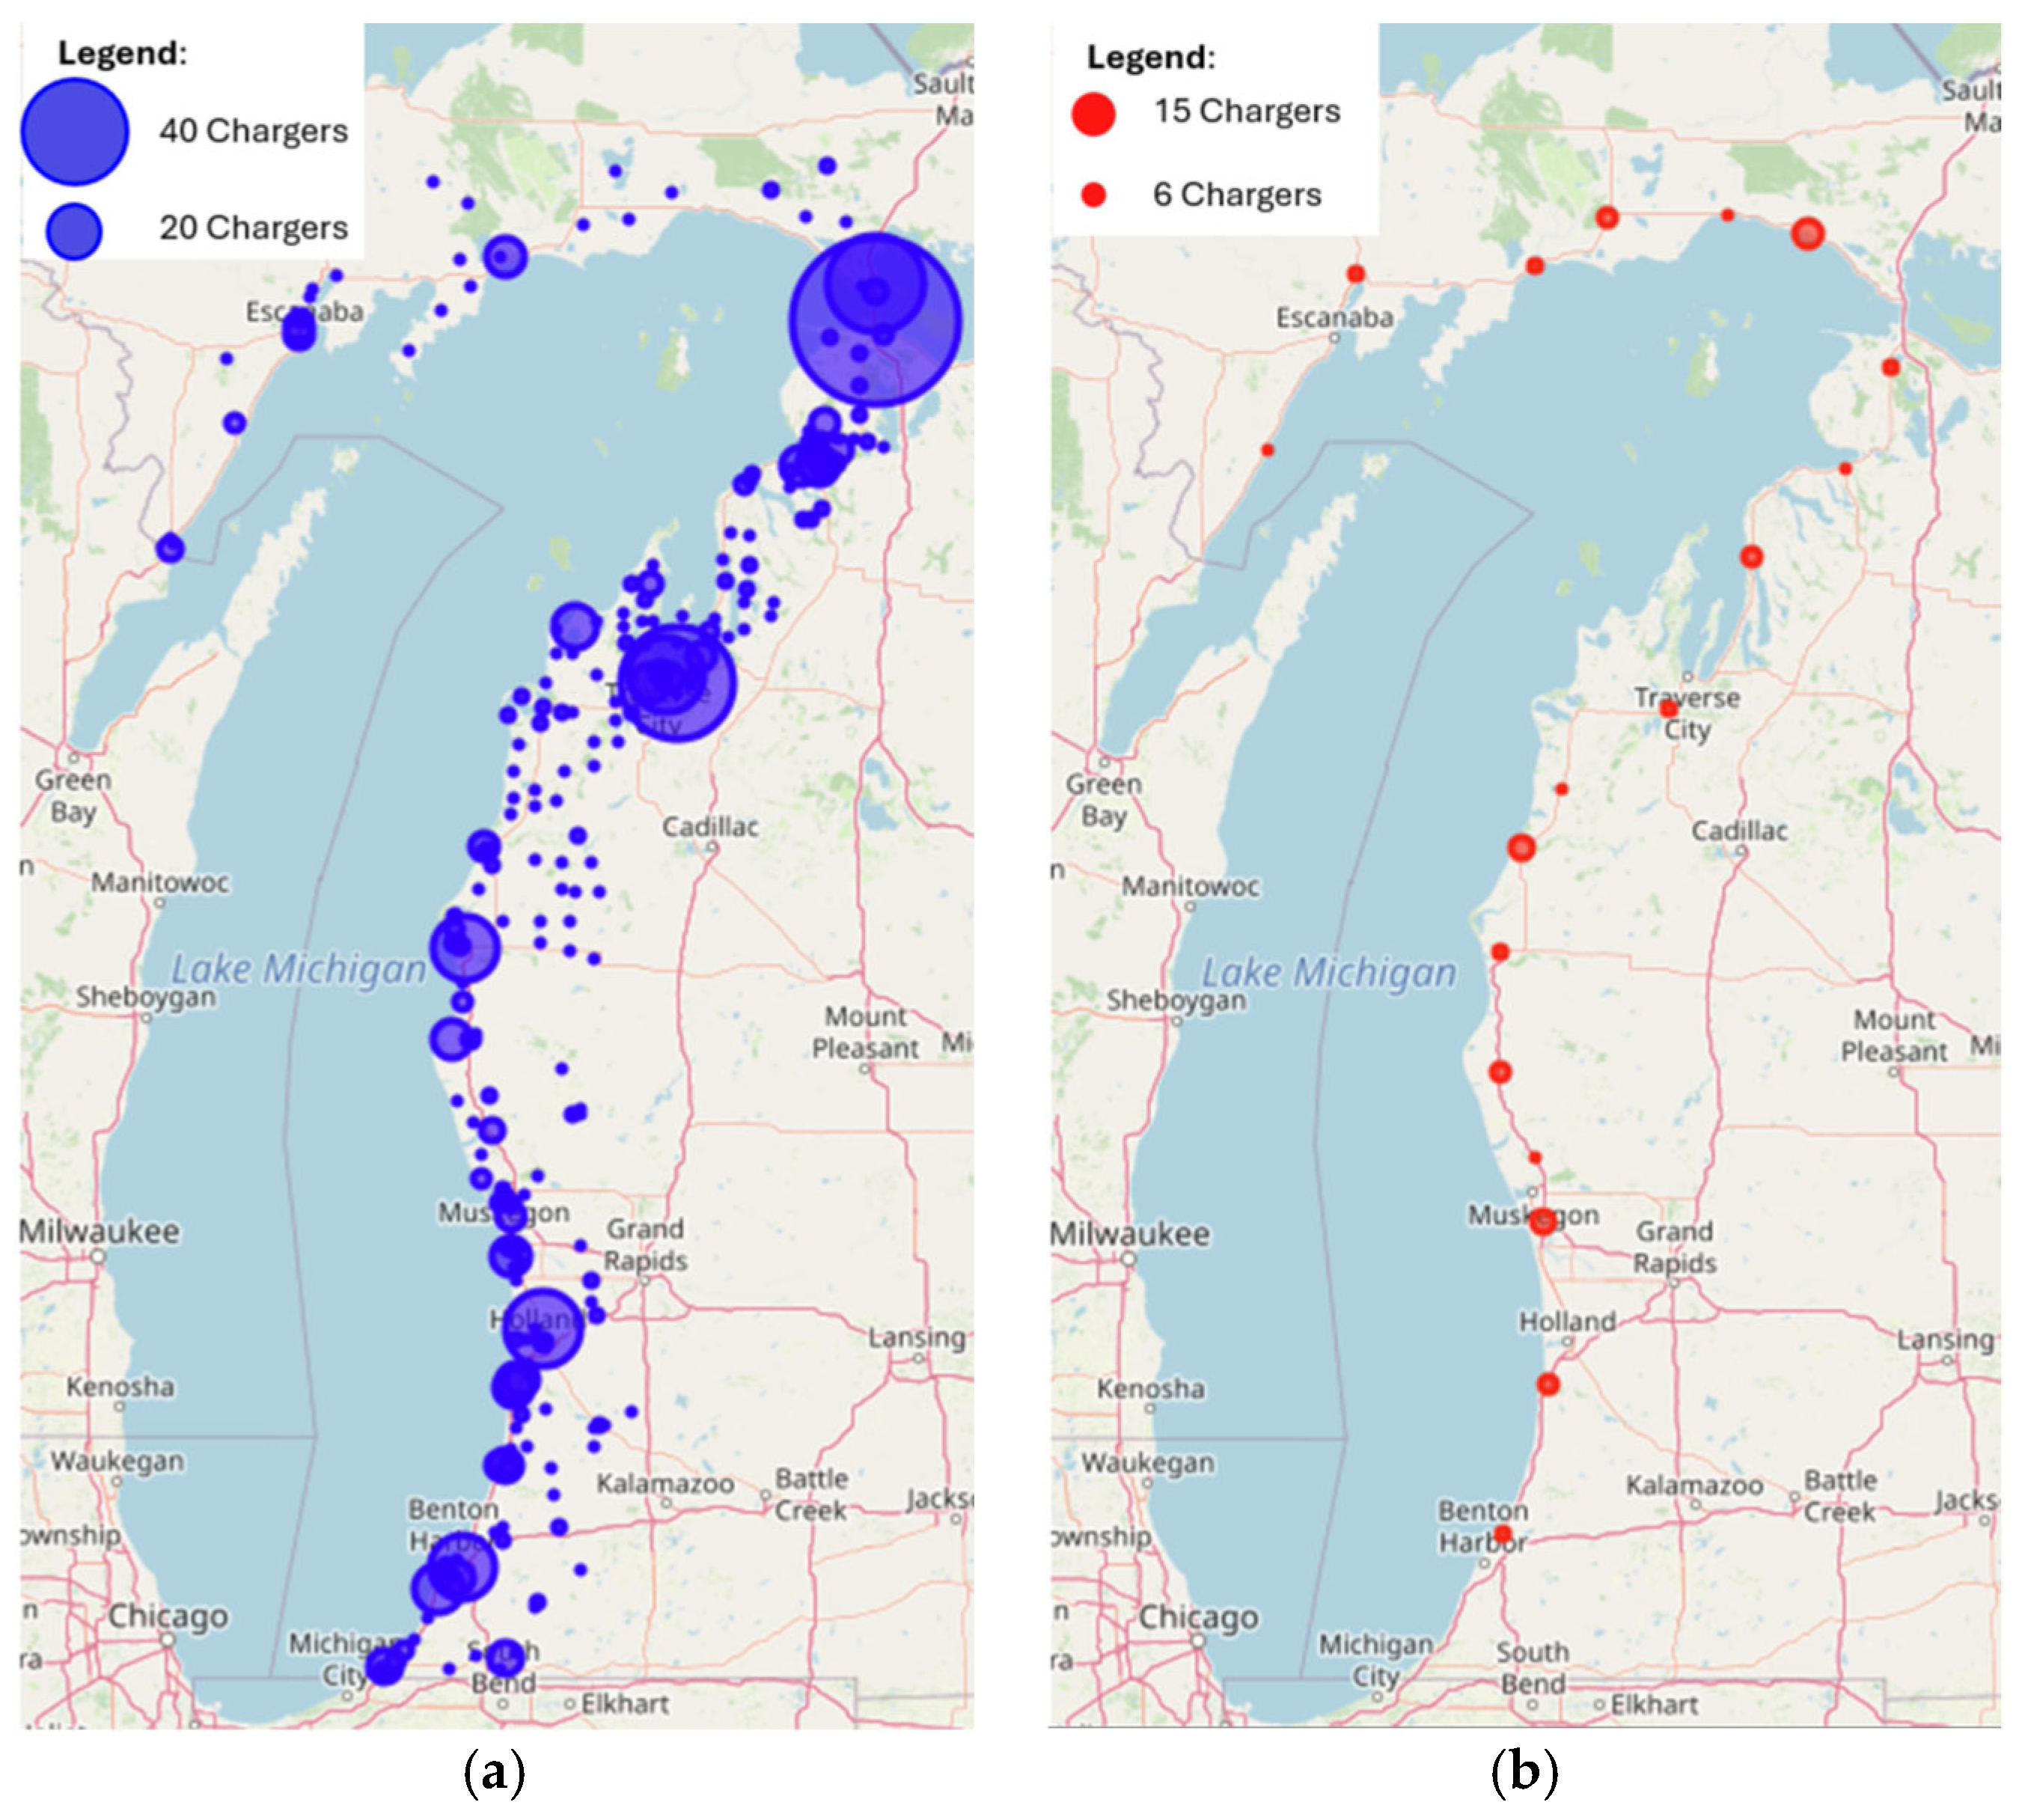
In this study, alternative allocation strategies are applied to divide the total budget between Level 2 chargers () and DCFCs (), with the goal of evaluating overall network performance from the users’ perspective. When assigning budgets to Level 2 or DCFC networks, because the model simultaneously minimizes total infrastructure cost and user inconvenience (Equations (3) and (14)), it may either use the entire allocated budget to construct charging infrastructure or spend less if additional chargers do not provide significant benefits to users. As a result, it is essential to compare alternative budget allocation strategies to determine which configuration performs best from both system and user perspectives.
Table 3 presents the optimal results for an interconnected network of Level 2 chargers and DCFCs under a total budget of
$20 million. To compare alternative budget allocation strategies, the last two rows of
Table 3 present (i) the total user inconvenience cost, defined as the sum of detour time, queuing time, and refueling time for users charging at DCFCs, as well as the detour time for users who cannot access Level 2 chargers and the additional monetary cost incurred due to the price differential between DCFC and Level 2 charging, all calculated on a daily basis; and (ii) the total infrastructure and user inconvenience cost, defined as the sum of the total infrastructure cost, spread over the infrastructure’s lifetime to obtain a per-day value that is comparable to user inconvenience, and the total user inconvenience cost.
In evaluating alternative budget-allocation strategies, scenarios allocating $3 million or less to DCFC are excluded from the results, as several corridor trips become infeasible under those conditions. Overall, the proposed infrastructure effectively accommodates the entire LMC EV demand, regardless of the budget split between Level 2 chargers and DCFCs, indicating that in most cases, the interconnected network provides an acceptable level of service. However, exceptions arise when only $4 million or $5 million is allocated to DCFC stations, as the average queuing time at DCFCs increases to over 10 min. To maintain an acceptable level of service, at least $6 million of the budget must be allocated to the DCFC network.
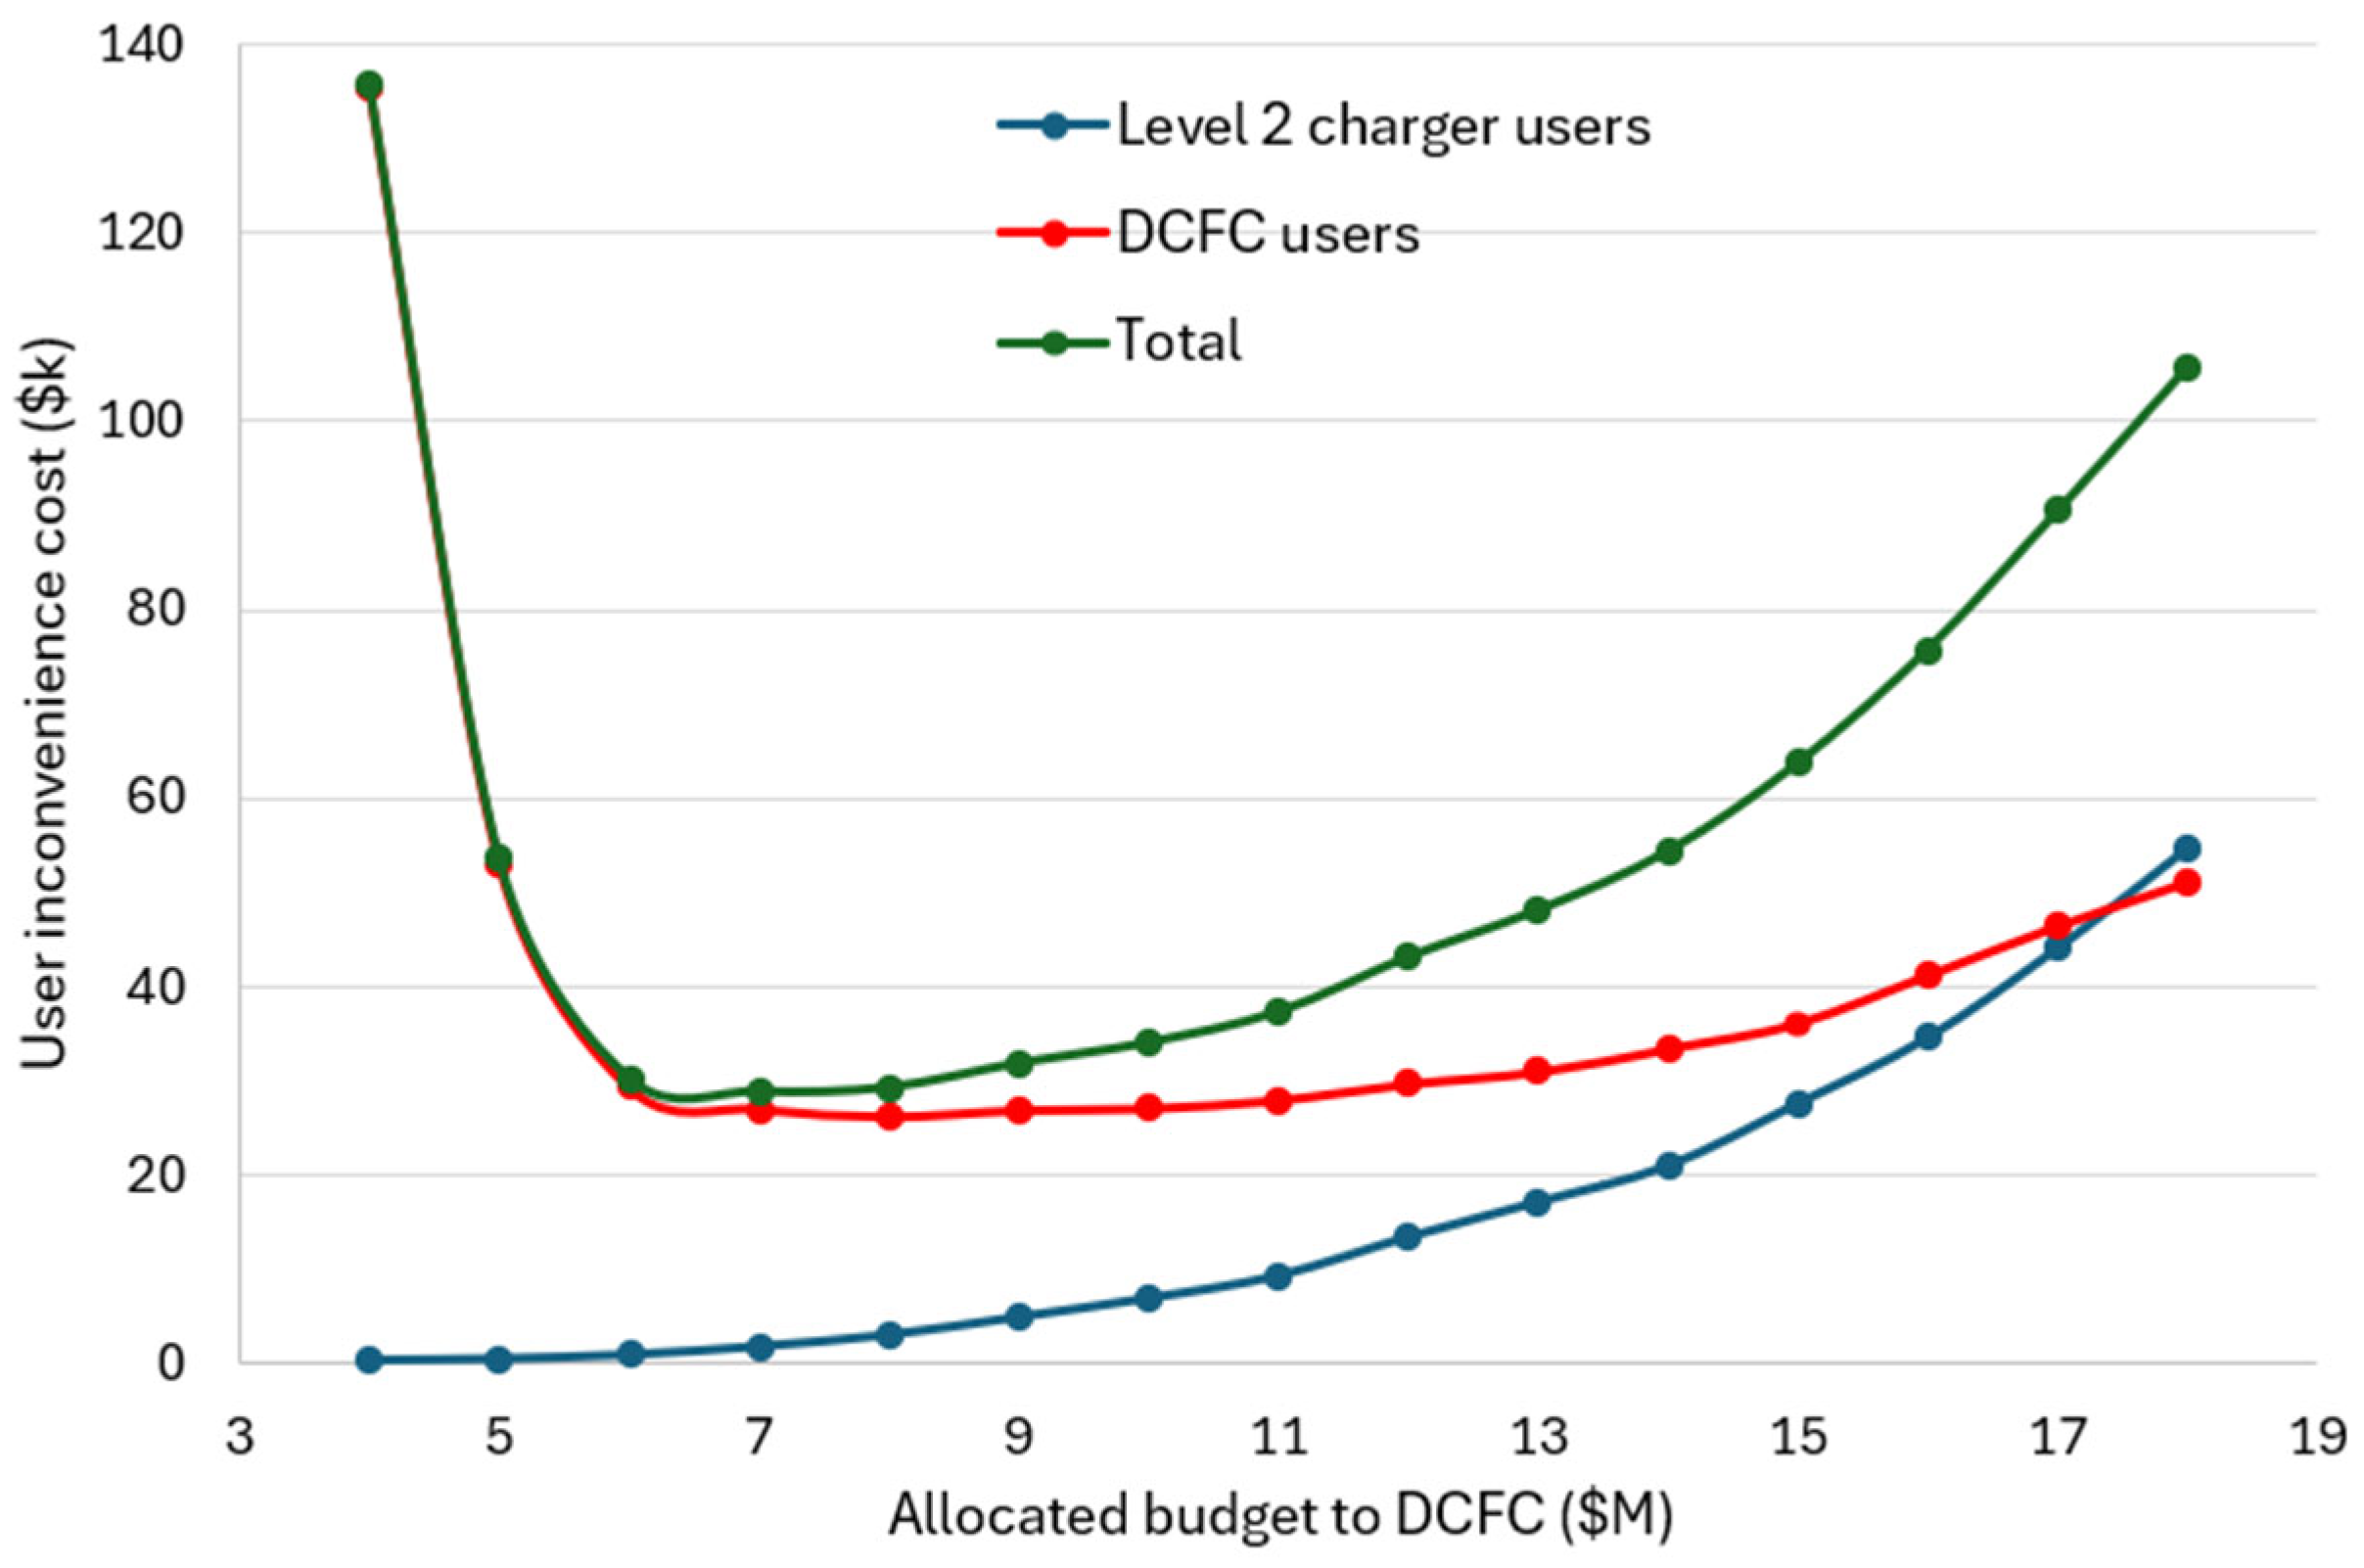
By comparing the total user inconvenience cost across allocation strategies, it becomes evident that decreasing the allocation to Level 2 chargers while increasing the allocation to DCFCs initially reduces overall user inconvenience, after which it begins to rise again.
Figure 13 illustrates how user inconvenience costs for both Level 2 and DCFC users evolve as more budget is shifted toward DCFCs. The figure shows that: (i) the inconvenience cost for Level 2 users increases because more users must detour to DCFCs, and the rate of increase accelerates as the Level 2 budget is reduced; and (ii) the inconvenience cost for DCFC users, and the total user inconvenience cost, initially decreases sharply due to higher DCFC availability and shorter queuing times, but eventually begins to rise again as an increasing number of users are redirected from Level 2 chargers and increasing the number of users charging at DCFCs, with the rate of increase gradually accelerating.
In
Table 3, certain configurations do not fully utilize the entire budget (when
$15 million and
$16 million are allocated to DCFCs). This occurs because the marginal benefit of investing in additional chargers, measured as the reduction in user inconvenience, does not outweigh the extra infrastructure cost. Consequently, for these scenarios, comparing only the total user inconvenience cost is insufficient, since the total infrastructure cost is not necessarily the same across strategies. A comparison of the total cost of infrastructure and user inconvenience indicates that decreasing the allocation to Level 2 chargers while increasing the allocation to DCFCs initially reduces the combined cost before it begins to rise again. The minimum combined cost is achieved when
$13 million is allocated to Level 2 chargers and
$7 million to DCFCs.
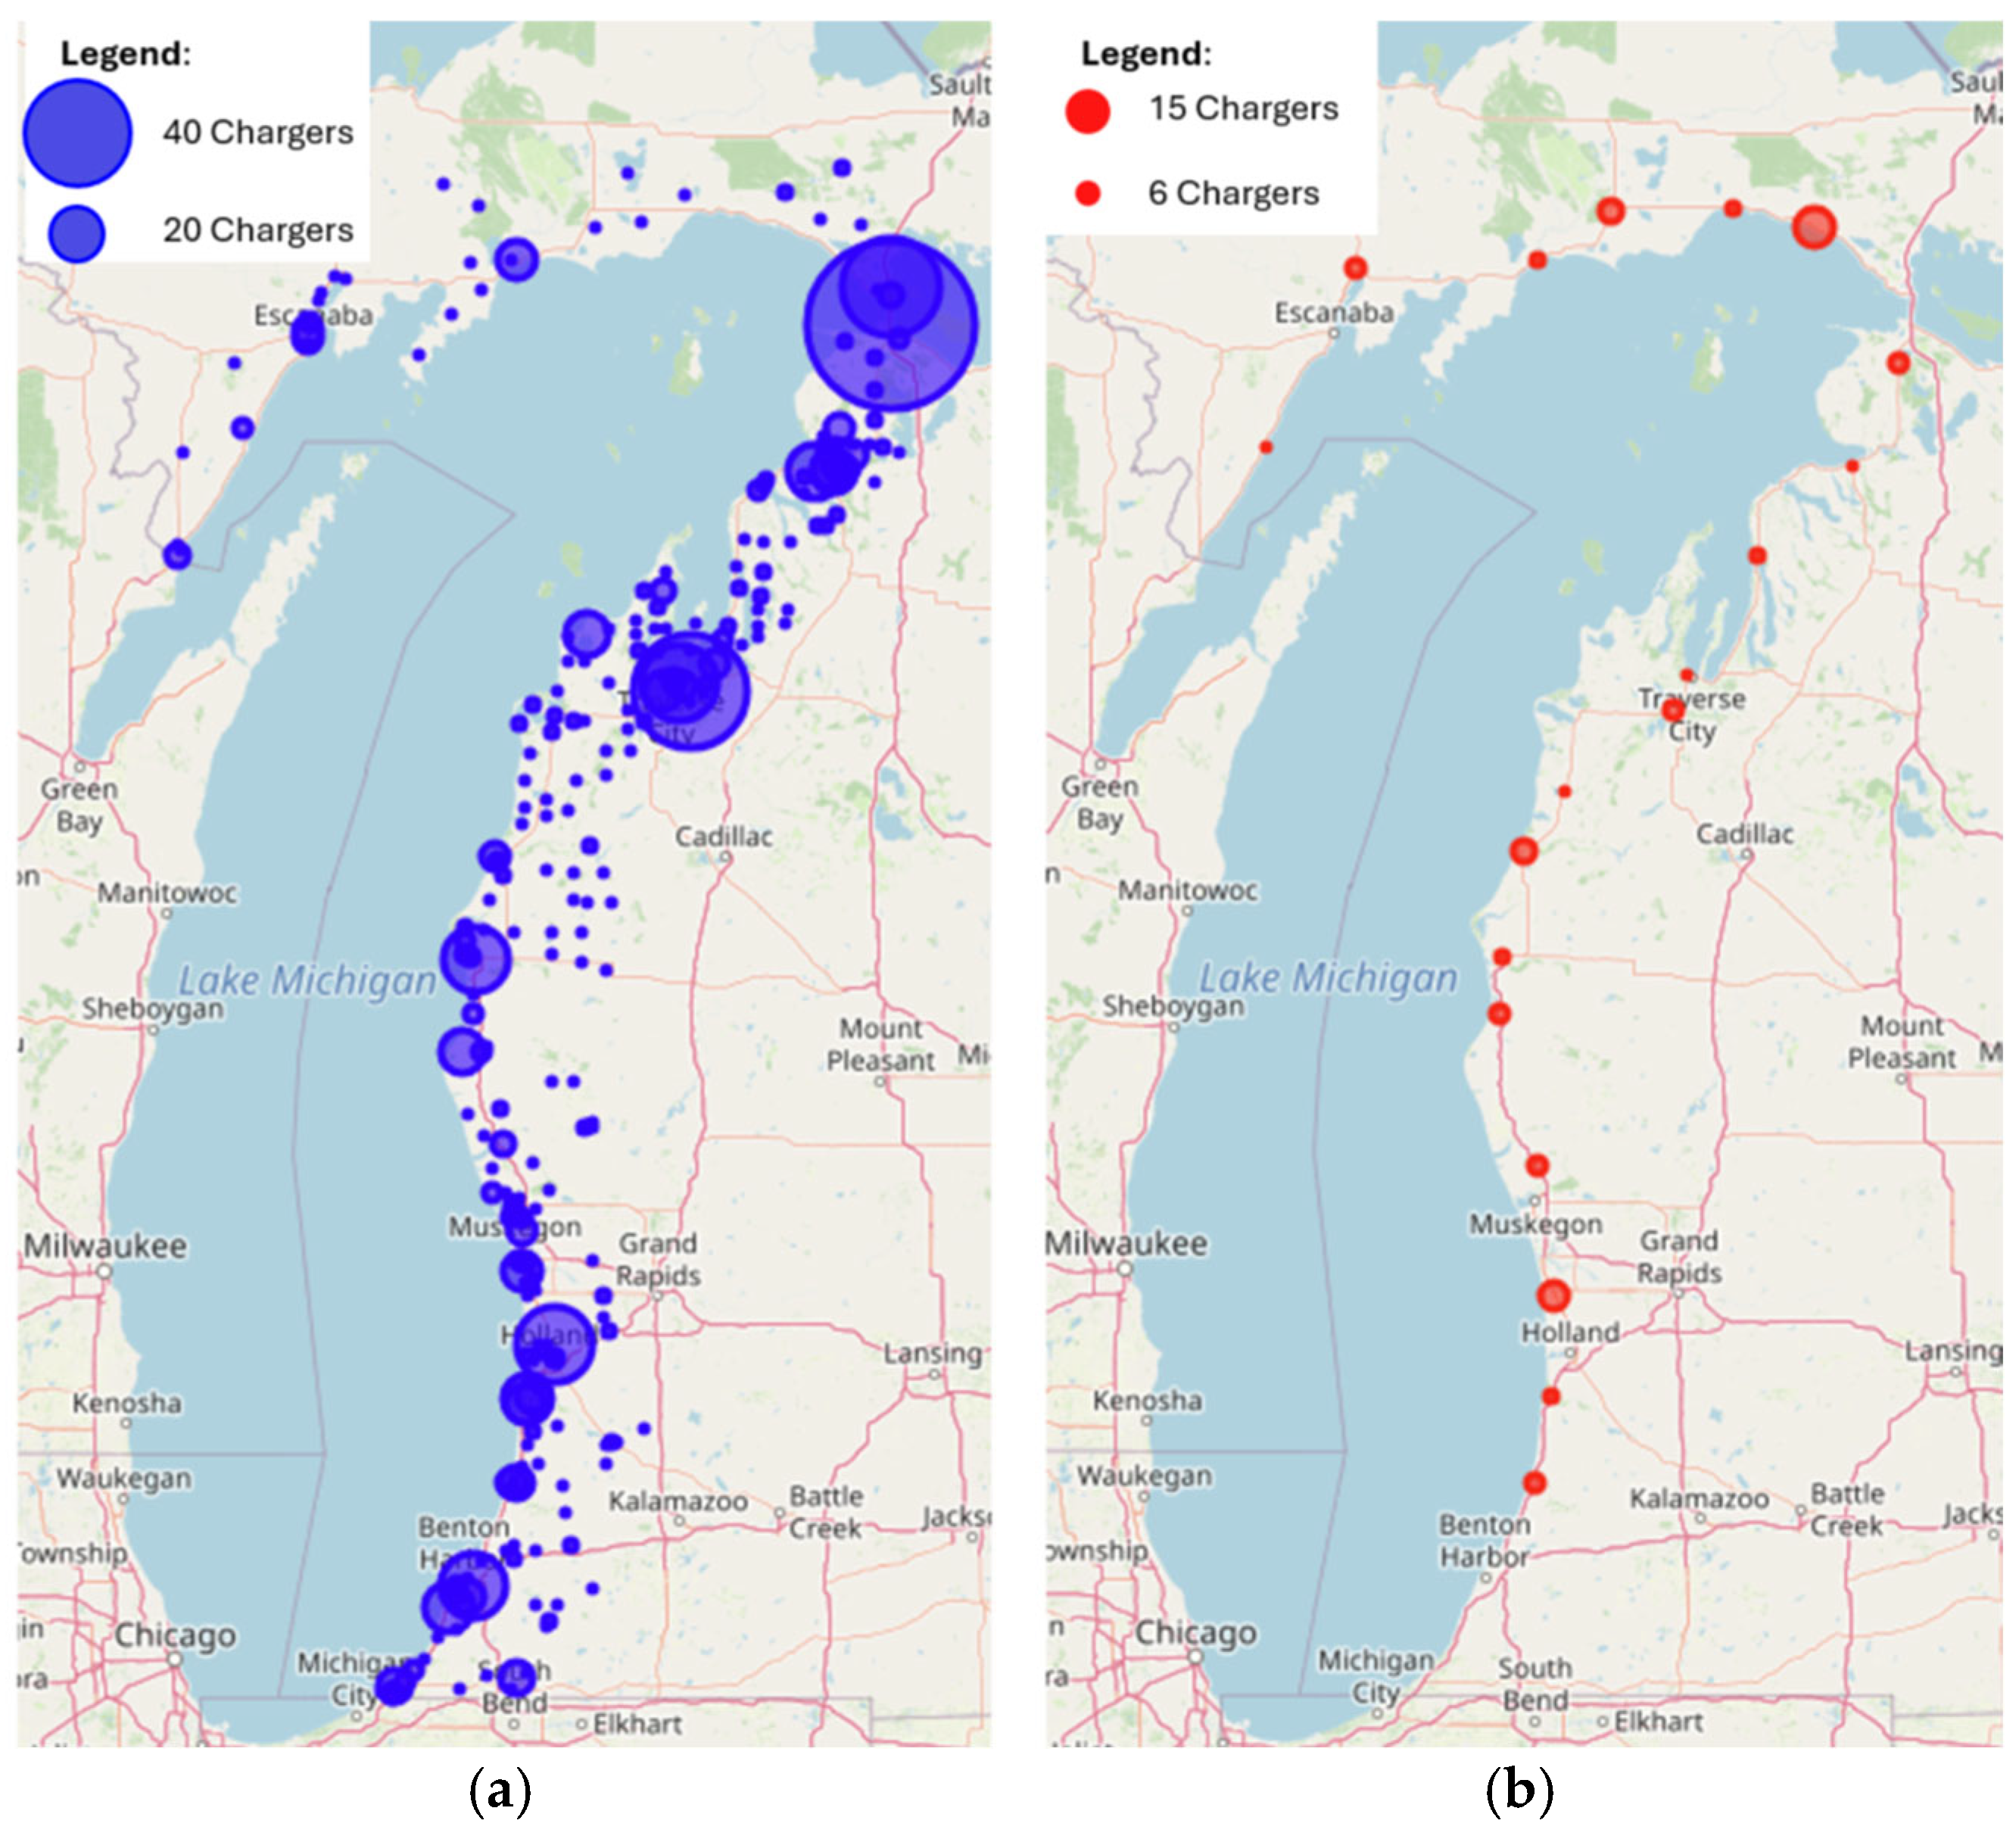
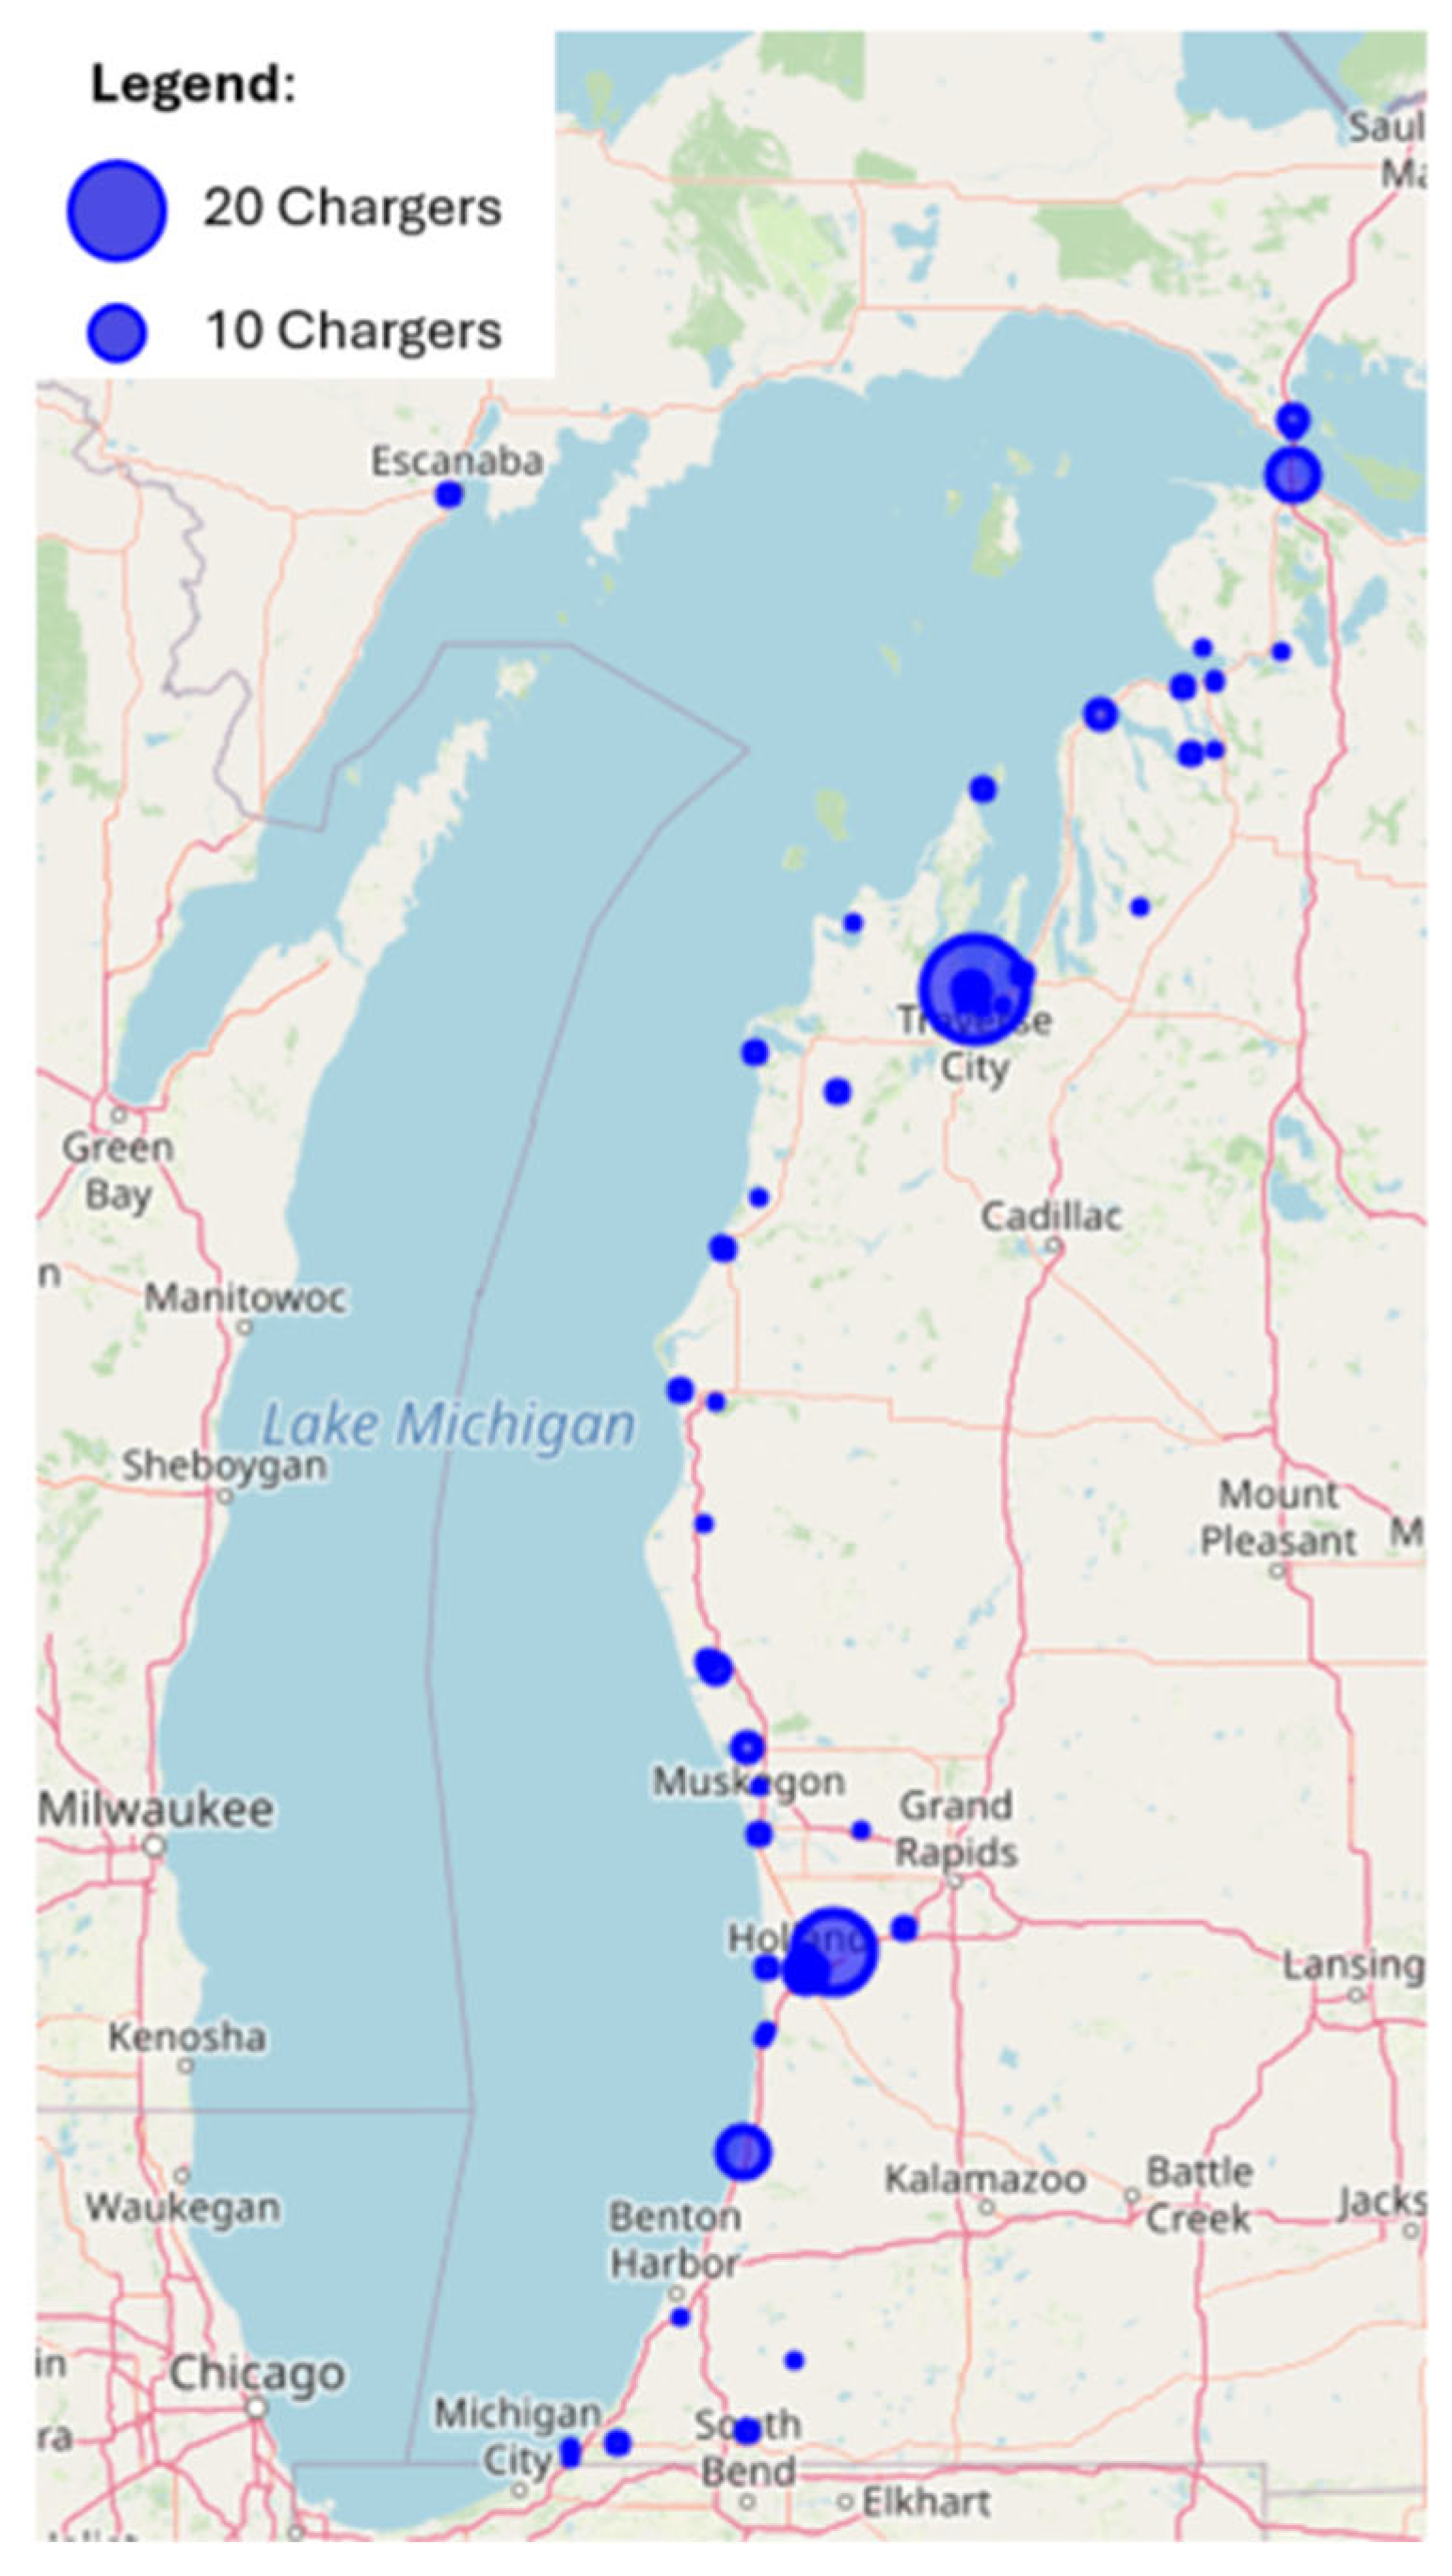
Figure 14 depicts the spatial distribution of interconnected Level 2 and DCFC chargers for the optimal configuration.
6.1. Total Budget Sensitivity Analysis and Environmental Impacts
This section evaluates three total budget scenarios:
$15 million,
$25 million, and a scenario with no budget limit to assess how different investment levels influence infrastructure deployment, and compare these outcomes with the
$20 million main scenario. In addition, for each budget scenario, the total CO
2 emissions savings are calculated. For each scenario, alternative budget allocation strategies between Level 2 chargers (
) and DCFCs (
) are examined.
Table 4,
Table 5 and
Table 6 present the optimal results for the interconnected network of Level 2 chargers and DCFCs under these three total budget scenarios.
In the $15 million budget-limit scenario, the entire budget is fully utilized in all allocation strategies; therefore, the system perspective remains unchanged, and the comparison focuses on the user perspective. Comparing the total user inconvenience cost across allocations reveals that as the budget allocated to Level 2 chargers decreases and the allocation to DCFC increases, the total user inconvenience cost initially declines before rising again. The minimum total user inconvenience cost is achieved when $8 million is allocated to Level 2 chargers and $7 million to DCFCs.
In the $25 million budget-limit scenario, allocation strategies that assign $16 million or more to Level 2 chargers do not fully utilize the total available budget, meaning that the reduction in user inconvenience does not outweigh the additional investment cost. As a result, comparison of the total infrastructure cost and user inconvenience shows that decreasing the allocation to Level 2 chargers while increasing the allocation to DCFCs initially reduces the combined cost, after which it begins to rise again. The minimum combined cost occurs when $16 million is allocated to Level 2 chargers and $9 million to DCFCs.
Table 6 reports the optimal results for the no-budget-limit case. These results suggest that a total investment of about
$26 million (
$15.57 million for Level 2,
$10.22 million for DCFC) is adequate to deploy the necessary charging infrastructure across the LMC to accommodate tourism trips and achieve an acceptable level of service. This configuration yields a user-inconvenience cost of
$23.46 thousand, the minimum across all scenarios evaluated.
Table 7 compares the optimal configurations for each budget-limit scenario identified in the preceding analysis. As shown, increasing investment in charging infrastructure decreases Level 2 unserved EV and energy demand, total Level 2 detour delay, total DCFC delay per user (refueling, queuing, and detour), and total user inconvenience cost. When the budget is raised from
$15 million to
$20 million, the entire increment is allocated to Level 2 chargers; when it is raised from
$20 million to
$25 million, the additional funds are divided roughly equally between Level 2 and DCFC. This occurs because, at lower budgets, substantial Level 2 demand remains unserved, causing users to detour to DCFCs and increasing DCFC queuing time; therefore, the algorithm initially prioritizes Level 2 investment. Moreover, increasing the budget from
$15 million to
$20 million reduces the total user inconvenience cost by 47%, while increasing it from
$20 million to
$25 million reduces the cost by 18%. Comparing all scenarios, it is found that achieving the optimal configuration requires allocating between 35% and 47% of the total budget to DCFCs, depending on the overall budget level.
To identify the best-performing scenario across all budget limits, it is necessary to assess whether the benefits of additional chargers (reduced user inconvenience cost) outweigh the added infrastructure cost. Comparing the total cost of infrastructure and user-inconvenience (last row of
Table 7) indicates that the minimum occurs when
$15.57 million is allocated to Level 2 and
$8.93 million to DCFC, yielding a total infrastructure cost of
$24.50 million.
In addition to economic and operational benefits, evaluating CO
2 emissions savings provides further insight into the environmental impacts of different investment strategies. This allows for a more comprehensive assessment by capturing both cost efficiency and environmental performance across scenarios. For the optimal configurations under each budget limit scenario, the total CO
2 emissions savings are estimated based on the electrified vehicle miles traveled using battery efficiency and total energy demand in the network and then translated into emissions using the Environmental Protection Agency (EPA) average factor of 368 g/mile [
81].
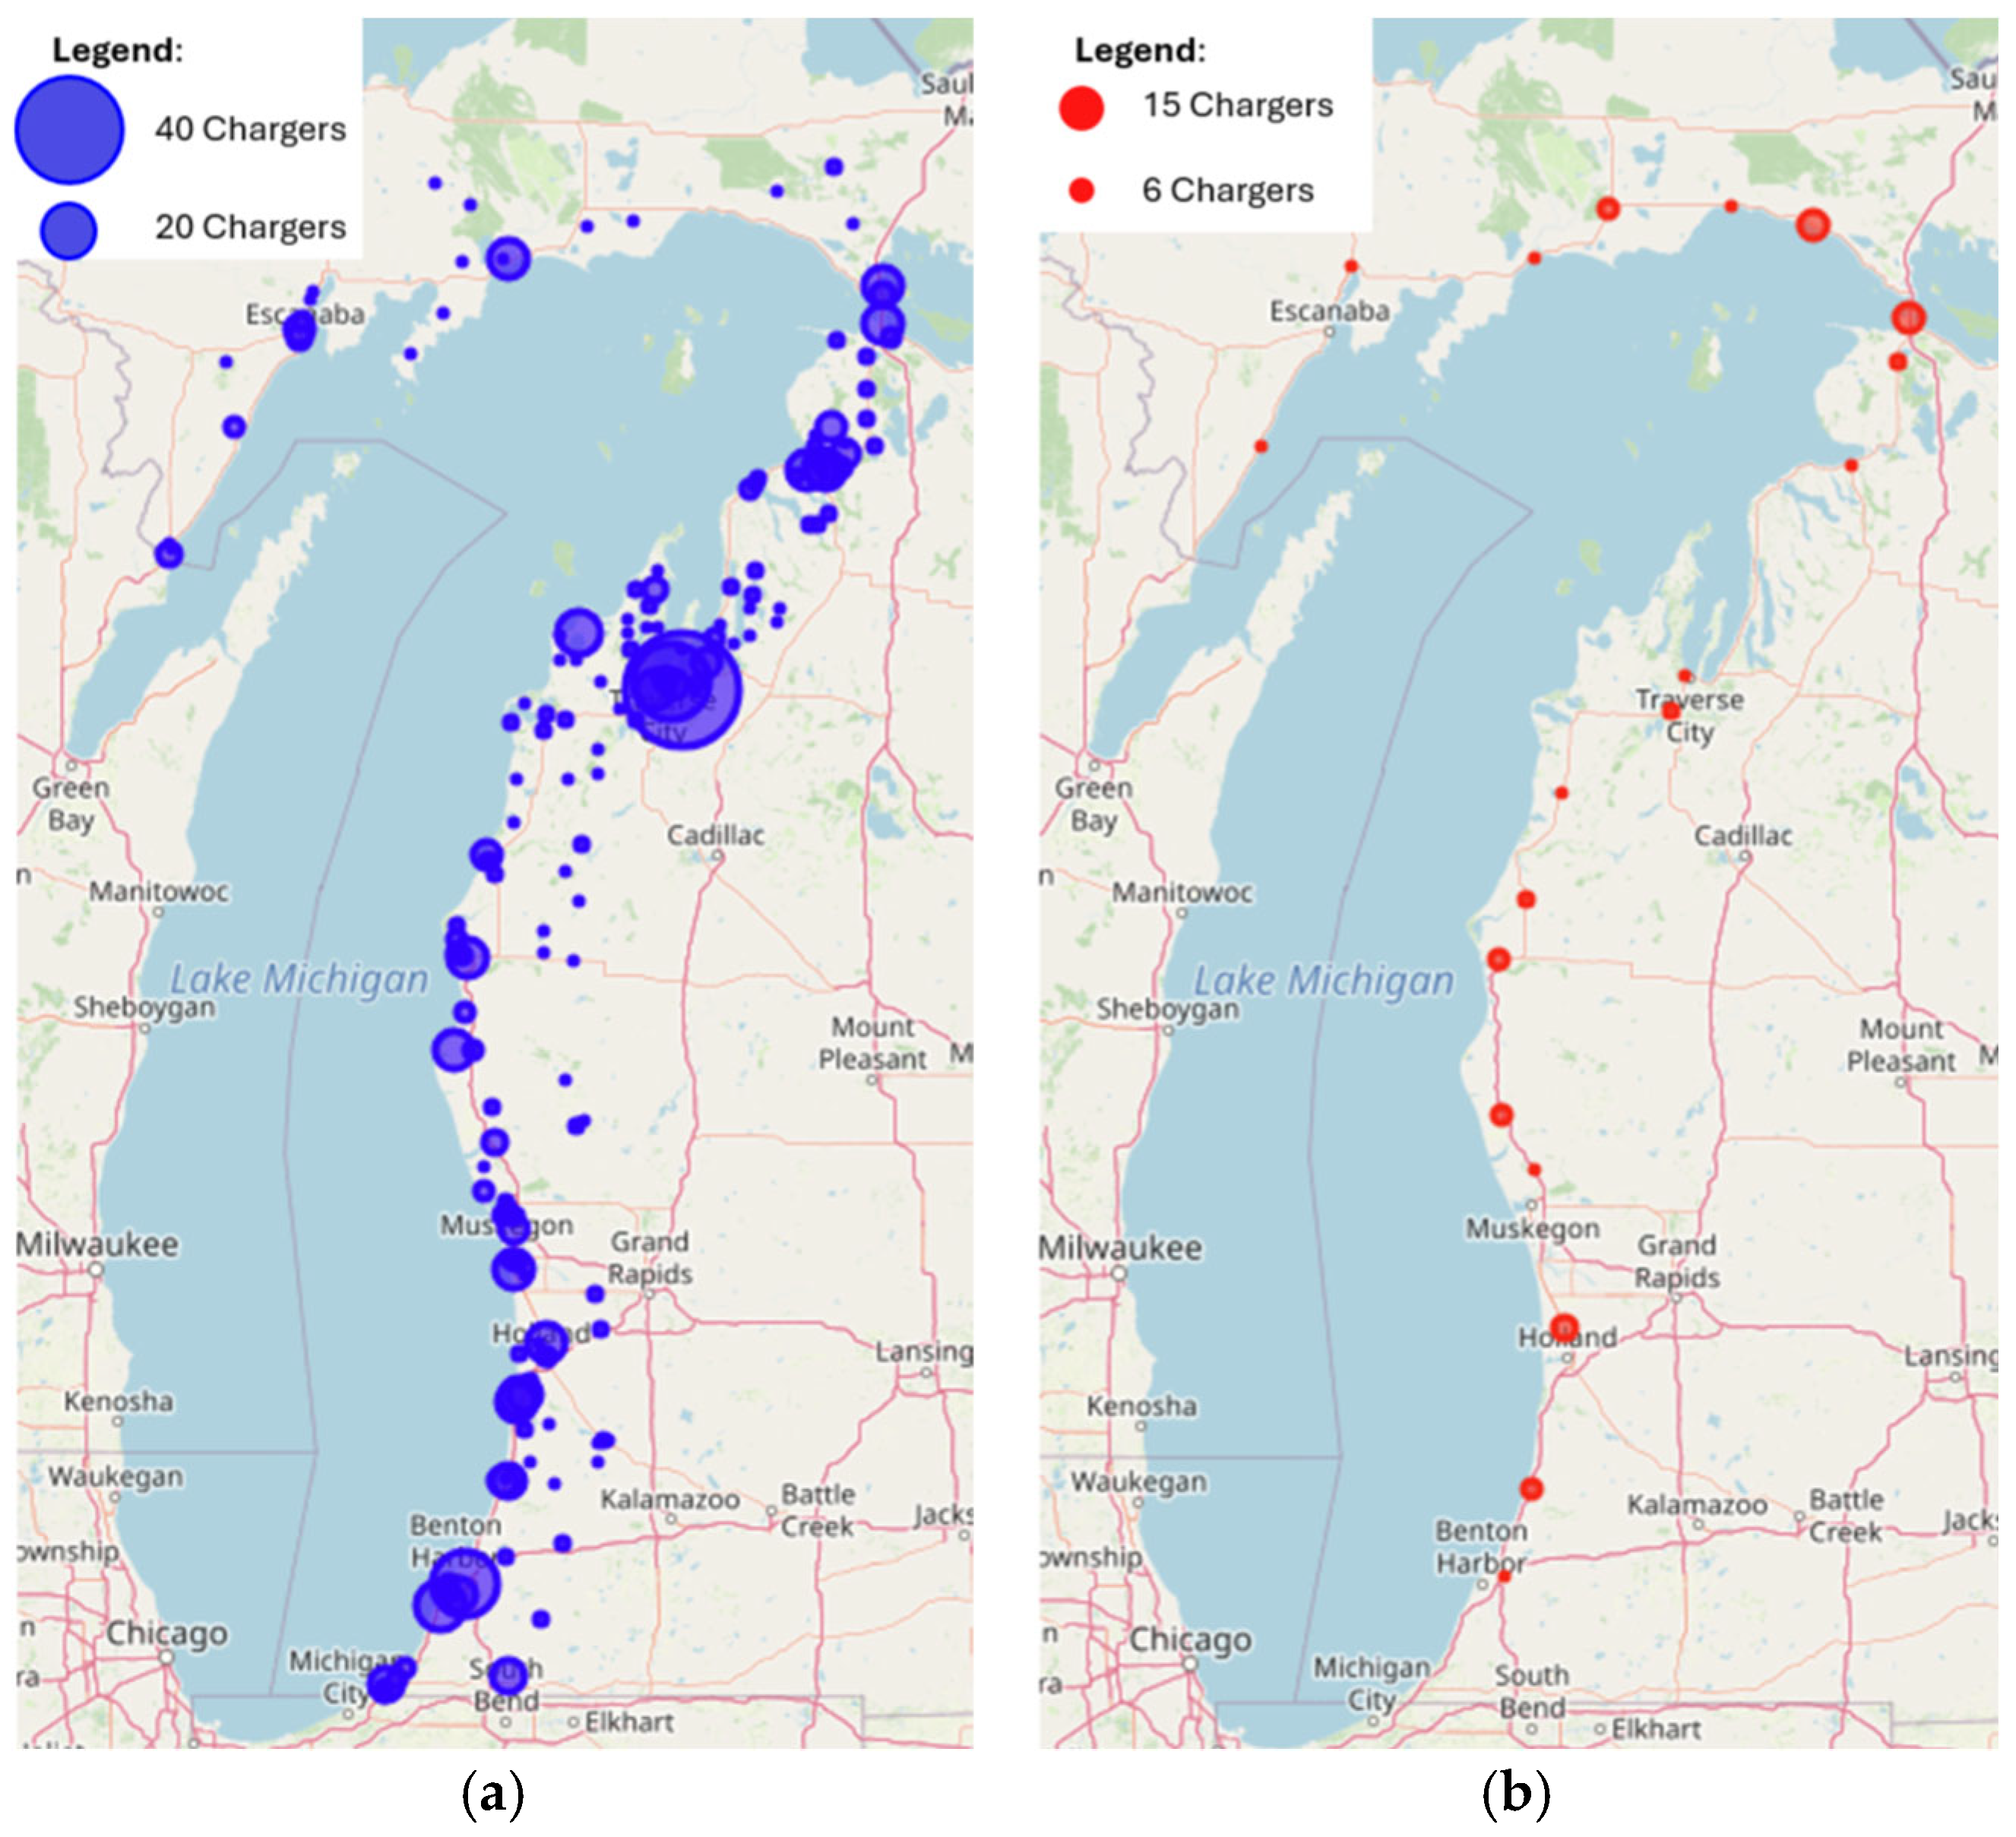
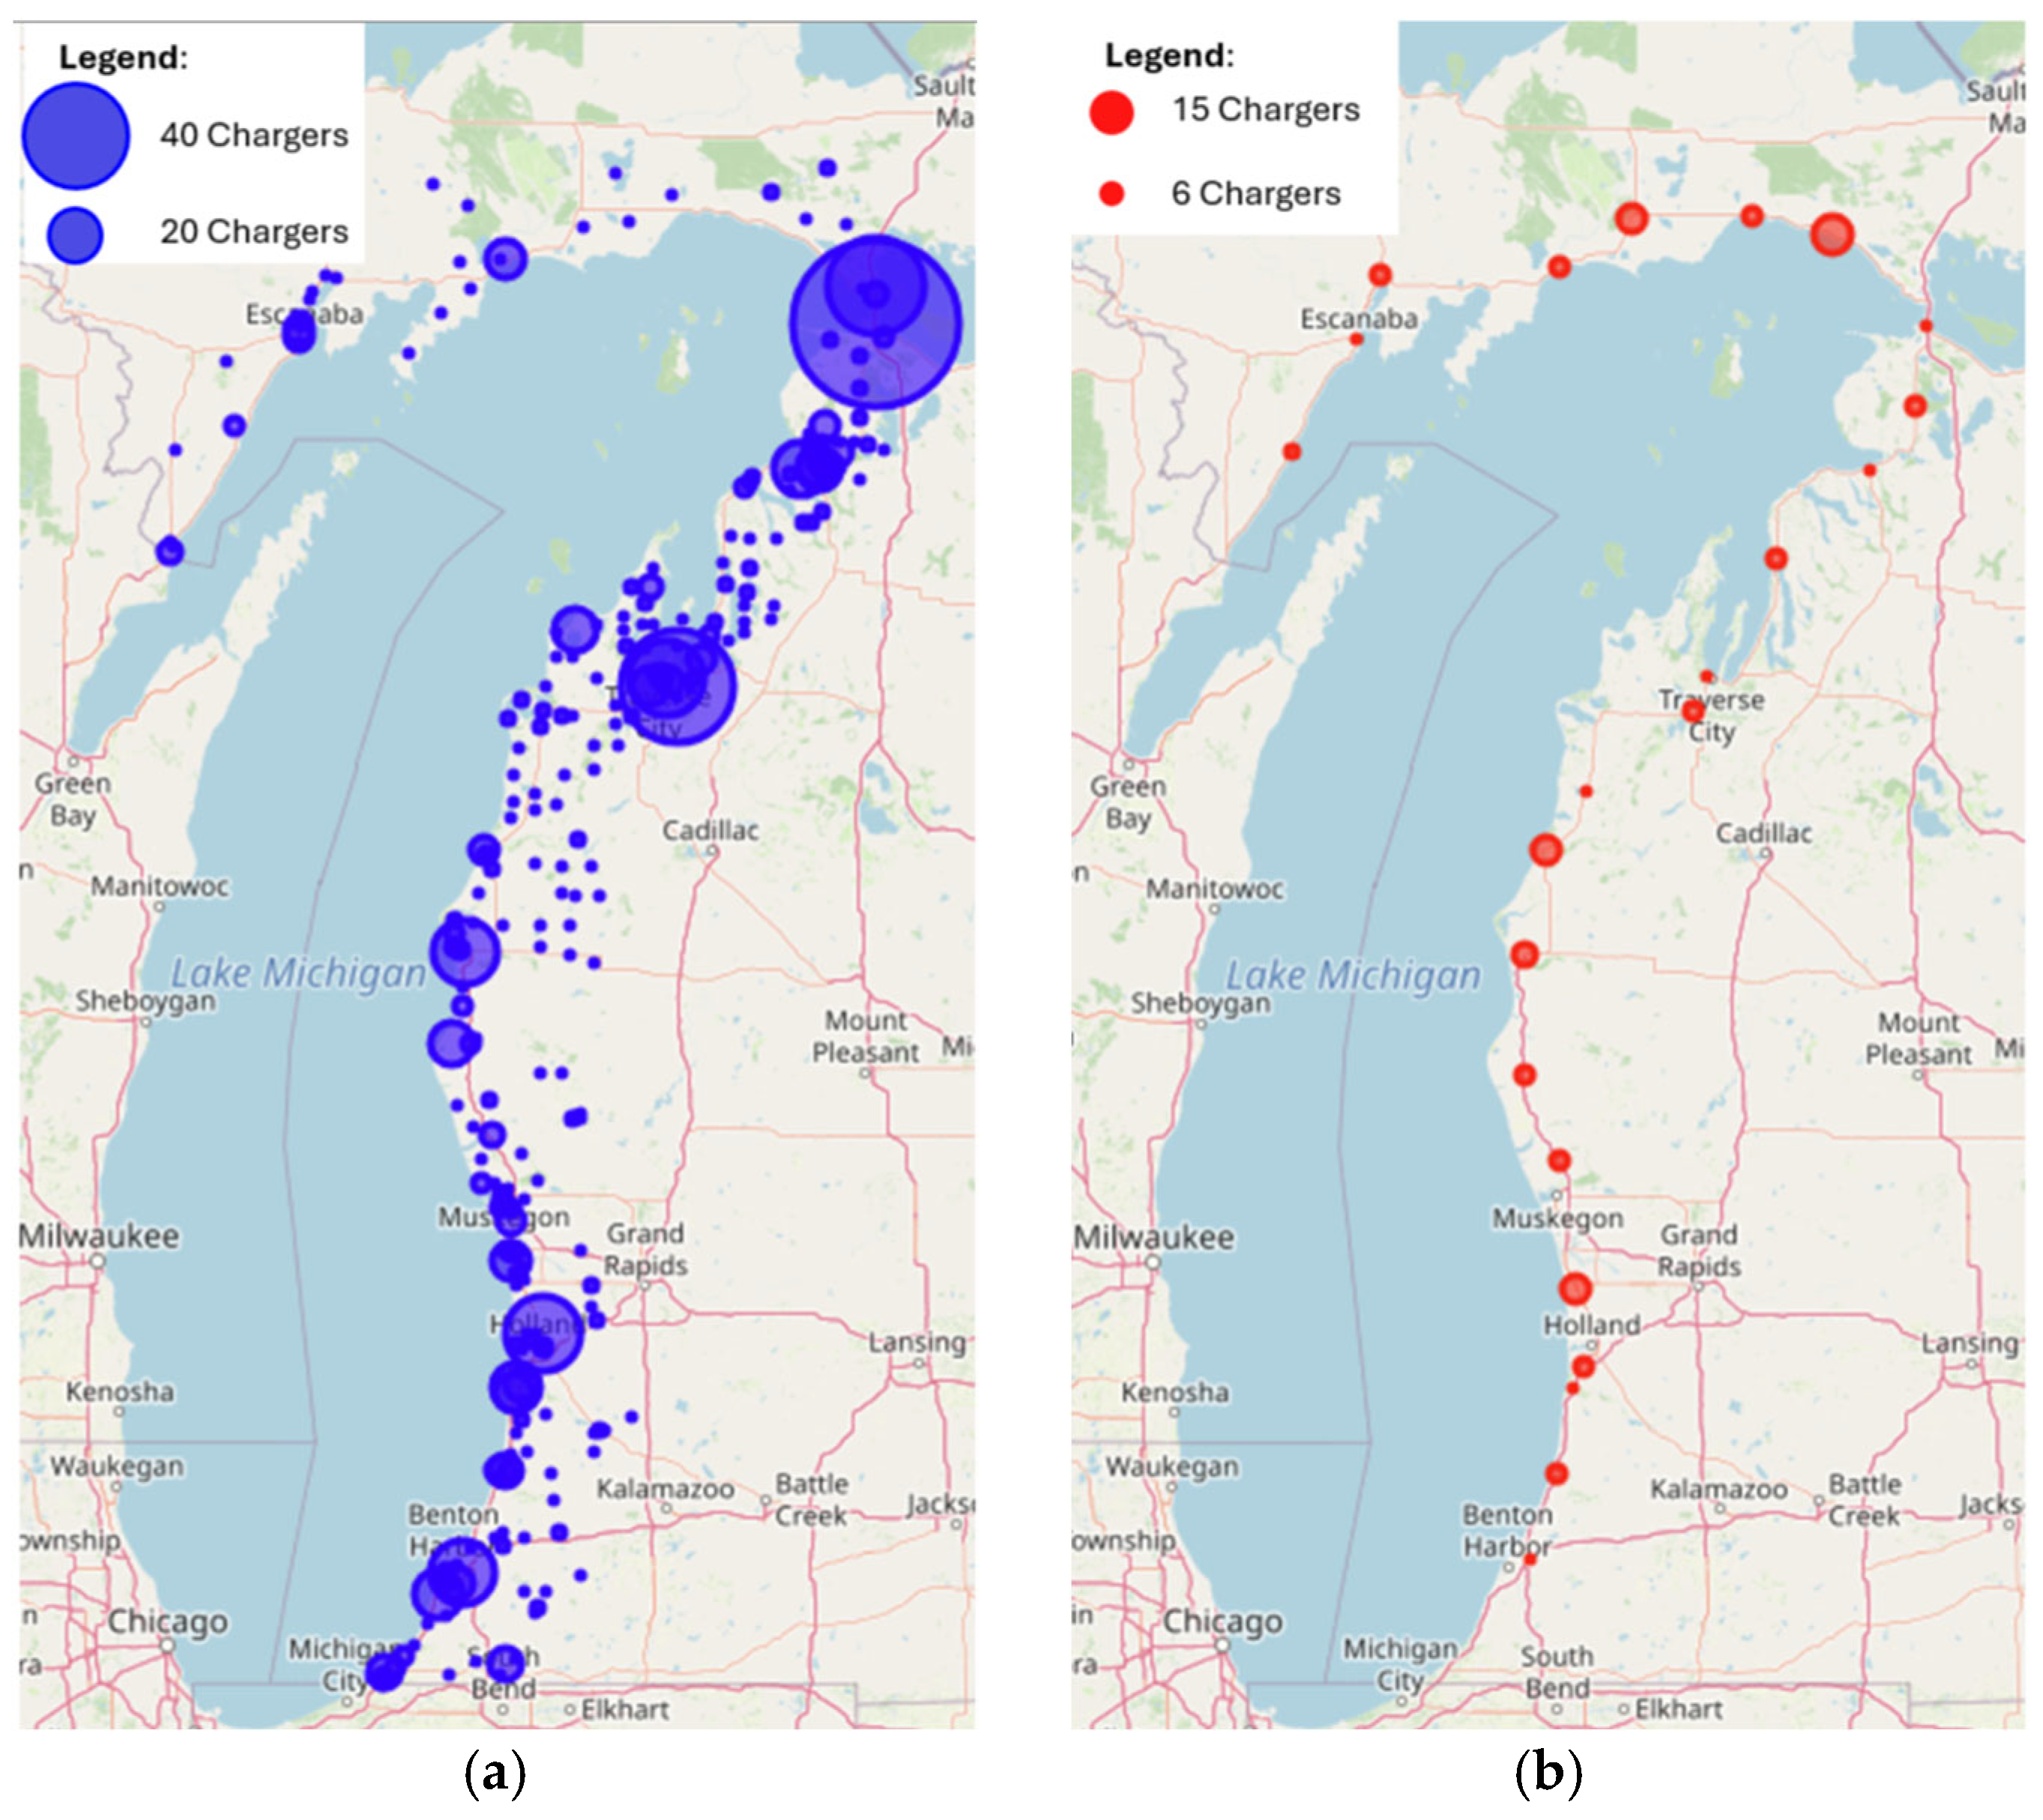
Figure 15,
Figure 16 and
Figure 17 depict the spatial distribution of interconnected Level 2 and DCFC chargers for the optimal configuration in each budget-limit scenario.
6.2. User Value of Time Sensitivity Analysis
In this section, different values of time for users are examined to assess how changes in time valuation influence charger deployment. Hourly wage data for Michigan are obtained from the Michigan Department of Technology, Management, and Budget, which reports 2024 wage statistics for the state’s Prosperity Regions [
82].
Table 8 summarizes these data, with the last row presenting the weighted average hourly wage. In addition, the minimum hourly wage in Michigan for 2024 is
$12.48, as reported by the Department of Labor and Economic Opportunity [
83]. Based on these data, reported in 2024 for Michigan, different values of time for users are adopted to run the framework, derived from the weighted average hourly wage calculated for each percentile across the state’s Prosperity Regions. Accordingly, values of
$13 (minimum wage),
$23 (median wage), and
$36 (75th percentile) per hour are used to represent users’ value of time and are evaluated against the
$18 per hour value corresponding to the 25th percentile assumption used in the main scenario.
Table 9 summarizes the results obtained from running the framework under an unconstrained budget scenario for charging-infrastructure deployment, considering different values of time for users. The last row reports the total user delay, which includes the detour delay for unserved users at Level 2 chargers as well as the detour, queuing, and refueling times for users charging at DCFCs. Overall, the results indicate that increasing the value of time leads to a greater number of required chargers, lower unserved EV and energy demand at Level 2 chargers, shorter DCFC queuing time, lower Level 2 detour delay, and a reduction in total user delay. However, there is one minor exception. When the value of time increases from
$18 to
$23 per hour, the Level 2 charging network slightly worsens, as the total detour delay experienced by unserved users at Level 2 chargers increases by about 5%. Despite this increase, the total user delay across the entire network still decreases, indicating that the model optimizes overall system performance rather than minimizing delays for the Level 2 and DCFC networks independently. In this scenario, when the value of time increases from
$18 to
$23 per hour, the Level 2 configuration remains unchanged in terms of both station locations and charger quantities. However, the number of DCFC chargers increases by six, and their locations are slightly adjusted. As a result, the Level 2 user inconvenience slightly worsens, whereas the expanded DCFC network reduces the total user delay across the entire network. Moreover, this result highlights the interdependence between the Level 2 and DCFC networks, where improvements in the DCFC network more than offset the slight deterioration observed in the Level 2 network. By increasing the value of time from
$13 to
$36 per hour, which corresponds to the minimum hourly wage and the average of the 75th-percentile hourly wage in Michigan, respectively, the number of DCFCs increases by almost 18%, and the average queuing time decreases by approximately 50%.
7. Conclusions
This research presents a comprehensive framework for optimizing a mix of DCFC and Level 2 EV charging infrastructure along the Lake Michigan coastline in Michigan, using methods that are readily transferable to other tourism-oriented regions. The charging stations include destination charging at tourist destinations and intermediate charging along the main corridor. Destination chargers are Level 2 chargers, capable of adding approximately 100 miles of range over an eight-hour charging period. In contrast, intermediate chargers are DCFCs, which can recharge an EV battery to about 80% in 30 min or less. Although DCFCs provide substantially faster charging, their higher currents and associated thermal stress can accelerate battery degradation, whereas Level 2 charging is generally much gentler on battery health.
For destination charging, a heuristic algorithm known as GAIN determines the optimal locations and quantities of Level 2 chargers, focusing on minimizing system costs and user inconveniences. The intermediate charging incorporates MCSA, dynamic penalties, and a two-stage decision-making process to determine the best locations and quantities for DCFCs. The objective is to minimize both user and system provider costs while ensuring feasible and cost-effective tourism trips. The interconnection of destination (Level 2) and intermediate (DCFC) charging options ensures that DCFC stations, primarily deployed to sustain trip feasibility as intermediate charging, can effectively compensate for any insufficiencies in destination charging.
The study also accounted for variable electric grid costs across different regions, incorporating the need for technological upgrades and grid capacity enhancements. A step function was developed to capture electric grid costs corresponding to various hourly energy demand ranges, providing a realistic evaluation of charging infrastructure needs. Moreover, existing Level 2 and DCFC chargers were considered in the analysis, acknowledging their role in partially meeting the charging demand and influencing the optimal placement of new chargers.
The proposed infrastructure satisfies the full LMC EV demand across all budget limit scenarios and across different allocations between destination and intermediate charging. Ensuring that all corridor trips remain feasible, that drivers can reach a charger before depleting their battery, requires allocating at least $4 million to DCFCs. Overall, the interconnected network provides satisfactory service; however, when DCFC funding falls below $6 million, the average total DCFC delay (detour, queuing, and refueling) exceeds 20 min per user. Thus, while trip feasibility can be maintained with a $4 million investment in DCFC infrastructure, reaching an acceptable level of service requires 1.5 times more investment in DCFC, expanding DCFC investment to approximately $6 million.
The proposed algorithm determines the optimal locations and number of chargers under a budget constraint for an interconnected Level 2 and DCFC network. Because the two networks interact, users unserved at Level 2 stations may detour to DCFCs. The algorithm uses the budget efficiently; it avoids additional installations when the benefit from added chargers does not exceed the extra investment cost, leaving funds unspent. As the budget increases, it directs money to the network that helps users the most. Empirically, when the budget rises from $15 million to $20 million, the full increment is directed to Level 2 chargers, resulting in a 47% reduction in total user inconvenience cost. when it increases from $20 million to $25 million, the increment is divided approximately evenly between Level 2 and DCFC installations, leading to an 18% reduction in total user inconvenience cost. The analysis indicates that achieving the optimal configuration requires allocating approximately 35% to 47% of the total budget to DCFCs, with the exact proportion depending on the overall budget level. This allocation may also be influenced by electric grid upgrade costs. Because these costs represent a larger share of Level 2 infrastructure costs (approximately 40%) than DCFC costs (less than 10%) in the case study results, increases in grid upgrade costs could discourage Level 2 expansion relative to DCFC deployment. However, the grid upgrade costs required for Level 2 chargers are typically minimal and often negligible.
The proposed algorithm also assesses how charging-infrastructure deployment responds to different user values of time. The results show that higher values of time lead to an increase in the total number of required chargers, a reduction in unserved EV and energy demand at Level 2 chargers, shorter queuing times at DCFC stations, and an overall decline in total user delay. When the value of time increases from $13 to $36 per hour, corresponding to the minimum hourly wage and the average 75th-percentile hourly wage in Michigan, respectively, the number of DCFC chargers increases by nearly 18%, while average queuing time decreases by approximately 50%.
Overall, this study underscores the need to balance investment between destination (Level 2) and intermediate (DCFC) charging to optimize infrastructure performance. Comparisons in
Table 3,
Table 4 and
Table 5 show substantial variation in total user inconvenience, confirming that budget allocation between Level 2 and DCFC is consequential and should be optimized jointly. The interconnected network adapts to diverse travel patterns in the LMC region, demonstrating the flexibility and reliability of an integrated approach for meeting charging demand. By providing dependable, efficient charging for visitors, this strategy supports EV adoption and advances Michigan’s ecotourism goals.
A key limitation of this study is the reliance on ITE Trip Generation rates to estimate tourism travel demand at long-term stay locations due to the lack of tourism-specific OD data. These rates are derived by ITE based on averages from a limited number of studies, and their reported standard deviations are relatively large, which may lead to underestimation or overestimation of tourism trips. More accurate tourism-specific OD data could refine the estimated number of trips attracted to each destination and their travel routes, potentially affecting the spatial distribution of charging demand, the number of chargers at each destination, and the balance between Level 2 and DCFC infrastructure. While tourism-specific OD data could refine the spatial allocation and quantities of charging infrastructure, the major tourism destinations considered in this study would likely remain key attractions; therefore, the overall infrastructure deployment patterns across the region are unlikely to change substantially. Future studies could improve and validate these estimates by using emerging data sources such as mobile phone location data, connected vehicle trajectory data, or tourism-specific travel surveys to better capture actual travel patterns associated with tourism activities.
Another limitation relates to the stepwise representation of electric grid upgrade costs. The stepwise representation of electric grid upgrade costs reflects the estimated investments required to upgrade the existing grid infrastructure to support specific charging power levels under current planning conditions. Although these estimates already account for necessary grid improvements, significant technological advancements or structural changes in power systems could alter these cost structures in the future. Consequently, future studies may update the step function as grid technologies and infrastructure evolve.
Another limitation of this study is the low EV market share in the study region (approximately 1%), which results in limited charging activity. Consequently, existing charging patterns are not sufficiently representative, and detailed charging session data are generally not publicly available. Due to these limitations, validation of the model using observed charging behavior cannot be reliably conducted at this time. As EV adoption increases and more detailed operational charging data become available, future research will be able to better validate and refine the model using real-world charging behavior.
The framework is designed to be flexible and transferable, making it applicable to a wide range of tourism-oriented regions where Level 2 charging is deployed at destinations and DCFC is installed along travel corridors that are integrated with and run alongside these destinations, supporting not only access to destinations but also continuous travel between them (e.g., California Pacific Coast Highway and the New Jersey EV Tourism Program). This can be achieved by updating key inputs such as candidate charging locations, travel demand patterns, EV market share, budget constraints, other local policies, and user behavior characteristics (e.g., state of charge preferences and value of time).
Future research could explore dynamic adjustments to the infrastructure based on real-time data and evolving EV technologies. Expanding the framework to include diverse geographic regions could also provide further insights into optimizing EV infrastructure on a larger scale. In addition, incorporating tourism-specific origin–destination data, emerging mobility datasets such as mobile phone location data or connected vehicle trajectories, and more detailed grid infrastructure information could further improve demand estimation and infrastructure planning. Furthermore, future research may extend the proposed framework by integrating renewable energy sources and battery energy storage systems into charging station planning, which can reduce grid upgrade requirements, mitigate peak demand, and improve the overall sustainability of EV charging infrastructure, especially during the peak tourism demand seasons. In addition, future work could explore the integration of Smart Charging strategies to dynamically manage charging demand and reduce stress on the grid. Incorporating Vehicle-to-Grid (V2G) capabilities could further enhance system flexibility by enabling bidirectional energy flow between EVs and the grid, contributing to more efficient energy utilization and reduced infrastructure upgrade needs. By implementing this interconnected framework, this research lays the foundation for a more sustainable and user-friendly EV charging network, contributing to broader environmental and economic benefits for the region.



_Li.png)

 ,
,