Article

Auto Shredder Residue for Sustainable Concrete: Performance and Potential Economic Benefits

by
Dimitrios Goulias
and
Osama A. B. Aljarrah
*
Department of Civil and Environmental Engineering, University of Maryland, College Park, MD 20742, USA
*
Author to whom correspondence should be addressed.
Sustainability 2026, 18(7), 3540; https://doi.org/10.3390/su18073540
Submission received: 9 March 2026 / Revised: 28 March 2026 / Accepted: 2 April 2026 / Published: 3 April 2026

Abstract

The increasing demand for civil infrastructure has contributed significantly to CO2 emissions and global warming potential (GWP), largely due to concrete production, cement manufacturing, and natural aggregate extraction. Automotive shredder residue (AutoSR) offers a sustainable alternative; however, its effects on concrete performance remain poorly understood. This study evaluates AutoSR fines, termed eco-friendly aggregates (EFAs), used at 10% volumetric replacement for natural fine aggregate in eight concrete mixtures. Fresh and hardened properties were assessed for EFAs with varying particle characteristics. Microstructural features, including the interfacial transition zone (ITZ), and maturity indicators based on the temperature–time factor (TTF) and ultrasonic pulse velocity (UPV) were examined. All EFA mixtures showed reduced workability compared to the control mix, while hydration behavior and UPV responses remained comparable, allowing the development of maturity master curves. Mechanical performance was strongly influenced by EFAs’ characteristics, with an increased ITZ thickness identified as the primary driver of strength reduction. The study establishes a clear mechanistic link between EFA absorption, ITZ development, and strength loss, supporting a practical 10% replacement level for structural applications and providing guidance for future optimization. The potential economic benefits are also briefly discussed.

1. Introduction

The global surge in the human population has driven a sharp increase in the demand for construction materials, particularly concrete, with consumption rising more than fourfold between 1990 and 2020 [1]. Its versatility, strength, stiffness, and durability make it the most widely used material in infrastructure construction. However, despite these advantages, concrete production is a major contributor to global CO2 emissions, accounting for approximately 5% to 8% of the total emissions [2]. About 87% of these emissions are attributed to cement manufacturing, 10% to concrete placement and transportation, and 2% to aggregate production [1]. To mitigate the environmental impact of concrete production and reduce the depletion of natural resources, the concrete industry has extensively explored alternative cementitious materials and recycled aggregates [3,4]. Within this context, the present study focuses specifically on automotive shredder residue (AutoSR) as a potential low-carbon fine aggregate, rather than on recycled aggregates in general.
Previous studies on recycled aggregates have established a useful general framework: recycled materials often exhibit higher water absorption, lower density, and more variable grading than natural aggregates, which can reduce workability and, in some cases, mechanical performance [5,6,7,8,9,10,11,12,13,14]. However, these general observations do not fully explain the behavior of AutoSR, which is compositionally heterogeneous and distinct from conventional recycled aggregates, requiring a more material-specific assessment. For this reason, the present review emphasizes prior studies dealing directly with AutoSR, end-of-life vehicle (ELV) residues, and closely related automotive-derived fine fractions in cementitious materials.
Multiple studies have shown that the mechanical properties of conventional concrete are strongly influenced by the microstructure of the interfacial transition zone (ITZ)—the interface between aggregates and the cement paste matrix [15,16]. Consequently, many studies have investigated the ITZ in concrete incorporating recycled aggregates. Findings indicate that recycled materials can significantly alter the ITZ and surrounding cementitious microstructure due to two main factors: (i) interactions between recycled constituents and cement hydration products and (ii) increased porosity and water demands associated with higher absorption and adjustments to the water-to-cement (w/c) ratio. Furthermore, chemical reactions within the ITZ may vary depending on the composition of the recycled aggregates, as reported in several studies [11,12,17,18]. While this mechanistic framework is relevant to AutoSR, existing evidence specific to AutoSR remains limited and fragmented, highlighting the need for a targeted investigation.
Despite extensive research on commonly recycled materials such as recycled concrete aggregates, glass, brick, and plastics, AutoSR remains one of the least studied alternatives. AutoSR is the residual fraction of end-of-life vehicles (ELVs) after magnetic separation removes ferrous metals like iron and steel, constituting about 20–25% of the total ELV mass [19]. These materials are highly heterogeneous, with the composition varying depending on input streams and recycling processes, and may include plastics, glass, textiles, rubber, foams, metallic particles, and moisture [19,20]. Due to this complexity, AutoSR is predominantly disposed of in landfills, creating environmental concerns due to leachates containing organic compounds and heavy metals [21]. Given these challenges, the potential use of AutoSR as a fine aggregate in concrete has received limited attention, highlighting a clear gap in understanding its performance, governing interaction mechanisms within concrete, and overall feasibility. The few existing studies remain limited in scope. Early work by Xu et al. examined automotive-related wastes in concrete but did not establish a clear mechanistic link between material characteristics and performance [22]. Péra et al. investigated AutoSR valorization in building materials, demonstrating feasibility but without addressing structural concrete behavior or ITZ-controlled mechanisms [23]. More recently, Caetano et al. studied the fine fraction of AutoSR in concrete paving blocks, again focusing on non-structural applications and product-level feasibility rather than partial replacement in structural concrete [24].
Some studies have explored specific aspects of these effects [22,23,24,25,26], with results showing inconsistent trends in mechanical properties, workability, and porosity influenced by the pre-treatment methods applied to AutoSR [20,22,23,25]. These variations indicate that both the processing conditions and material composition play critical roles in determining concrete performance. Studies also suggest that concrete behavior is governed by the cement matrix, natural aggregates, and AutoSR, underscoring the need for further investigation [22]. In addition, because AutoSR is generated from variable end-of-life vehicle (ELV) streams and different recycling stages, its composition may vary over time and across processing facilities. This heterogeneity has direct implications for repeatability and reliability, as variations in particle composition, absorption, grading, and residual fibrous content can affect workability, ITZ development, and mechanical responses. Accordingly, the practical implementation of AutoSR-derived fines will require source control, routine material characterization, and mixture optimization. Therefore, the key unresolved issue is not whether AutoSR can be incorporated into cementitious systems but how the specific characteristics of AutoSR-derived fines govern concrete behavior under controlled replacement conditions.
Previous research on aggregates derived from AutoSR and ELVs has mostly reported changes in slump and compressive strength, while the underlying mechanisms are rarely quantified directly. In most studies, the ability of recycled fines to absorb mixing water, alter the thickness and quality of the ITZ, and weaken the paste–aggregate bond is described qualitatively and only occasionally supported by microstructural evidence, rather than being systematically measured [27,28]. At the same time, experimental programs commonly investigate replacement levels of 15–20% or higher, typically in the context of non-structural applications, such as AutoSR-based paving products [24] and broader fine valorization scenarios [29], where the objective is bulk utilization rather than structural performance. Therefore, the existing AutoSR literature remains limited in three key respects: (i) it rarely isolates low replacement levels relevant to structural applications, (ii) it seldom quantifies ITZ development as a governing mechanism, and (iii) it generally reports performance outcomes without directly linking them to absorption-driven microstructural changes. In practice, however, recent studies suggest that recycled materials such as plastic aggregates may be suitable for structural concrete only at low substitution levels (typically ≤10%), where strength reductions remain modest and can be evaluated further through targeted testing [30]. However, for AutoSR, the literature does not yet provide a comparable low-level benchmark for structural use. Instead, prior studies have primarily focused on feasibility-driven applications, such as building materials and paving products, or on broader fine valorization strategies rather than controlled, low-level replacement [23,24,29]. Accordingly, the 10% replacement level adopted in this study is both conservative and literature-informed, representing a lower and more controlled substitution level than those typically examined in previous AutoSR research. This provides a practical basis for assessing whether AutoSR-derived fines can perform acceptably in structural concrete before considering higher replacement levels. However, it remains unclear whether AutoSR-derived fines can reliably perform at such low levels and which mechanisms ultimately govern their behavior under these conditions.
To address these research gaps, this study evaluates the feasibility of replacing 10% of a natural fine aggregate (NFA) with eco-friendly aggregates (EFAs) derived from AutoSR. This replacement level was intentionally selected to isolate material-driven mechanisms while remaining relevant to structural applications and to establish a lower-bound benchmark relative to prior AutoSR studies, which have predominantly focused on non-structural applications or broader utilization scenarios rather than controlled low-level replacement in structural concrete [23,24,29]. The EFAs were obtained from different stages of the automotive recycling process, thereby representing distinct compositional characteristics. Seven concrete mixtures (M2 to M8) were designed, with 10% volumetric replacement of fine aggregate, relative to a control mixture (MD7, referred to here as M1) composed entirely of natural aggregates, representative of typical infrastructure concrete used in Maryland and the surrounding regions. In total, eight mixtures (M1 to M8) were prepared and evaluated for both fresh and hardened properties. In addition, the ITZ was examined to assess microstructural and potential chemical interactions associated with EFA incorporation. Accordingly, this study is positioned as a targeted AutoSR investigation, focusing not on general recycled aggregates but on the mechanistic role of AutoSR-derived fines in governing concrete performance at a controlled and practically relevant replacement level. This includes the application of a maturity-based ultrasonic pulse velocity (UPV) master curve approach to EFA-modified concrete as part of the analysis, rather than the development of a new predictive methodology.
Therefore, the specific objectives and contributions of this study are to
  • Quantify the effect of 10% EFA replacement on fresh and hardened concrete properties;
  • Determine how EFA absorption influences ITZ thickening and quantify its relationship with strength reduction, addressing a mechanism that has rarely been directly measured for AutoSR-derived aggregates;
  • Evaluate hydration behavior and apply a maturity-based UPV (master curve) framework to EFA-modified concrete as part of a mechanistic interpretation, rather than proposing a new modeling methodology—an approach with limited prior investigation;
  • Define a literature-informed and conservative performance baseline at 10% replacement that is suitable for potential structural use, where strength reductions remain limited, mechanistically diagnosable, and practically manageable, without compromising structural concrete performance [30,31,32,33]. This contrasts with prior studies that have typically examined higher substitution levels (often up to 40%) for bulk or non-structural applications and establishes a clear basis for future optimization and treatment studies [24,29,30,31,32].

2. Experimental Testing

2.1. Materials

The concrete mixtures were prepared using type IL Portland limestone cement (PLC), a blended hydraulic cement conforming to ASTM C595/C595M [34]. This cement contains 5–15% interground limestone, which reduces the carbon footprint while maintaining mechanical performance comparable to that of ordinary Portland cement (OPC) [35]. PLC was selected because it aligns with current industry trends toward low-carbon binders; the inclusion of limestone reduces the CO2 emissions from cement production by approximately 10% compared with OPC [36,37]. The PLC had a specific gravity (SG) of 3.10 and a bulk unit weight (UW) of approximately 1500 kg/m3 [38,39]. The natural coarse aggregate (NCA), sourced locally, had an SG of 2.94, a UW of 1656.60 kg/m3, and absorption of 0.93%. The NFA, a bluestone aggregate, had an SG of 2.80 and absorption of 1.23%. Both NCA and NFA conformed to the grading requirements of ASTM C33 [40].
Seven types of EFA, labeled EFA-1 to EFA-7, were sourced from a local automotive shredding facility and used to replace 10% of the NFA by volume in the concrete mixtures. These EFAs were intentionally collected from different stages of the recycling process to represent the inherent heterogeneity of AutoSR-derived fines. All EFAs were used in their as-received (air-dry) conditions, and their measured absorption values were accounted for in mix water adjustments during batching. This approach captures a realistic range of material behavior; however, it does not fully represent temporal variability within a single facility or differences among recycling plants. Therefore, the results should be interpreted as mechanistic trends across representative EFA types, rather than as the complete statistical characterization of all possible AutoSR feedstocks. Elemental analysis of the NFA and EFAs was conducted using a scanning electron microscope (SEM) at the University of Maryland, College Park, MD, USA, and the results are presented in Table 1. The analysis showed that, unlike NFA, all EFAs contained carbon. In addition, elements such as calcium, magnesium, iron, and potassium were present but at varying concentrations. Elements including phosphorus, sulfur, sodium, zinc, and titanium were also consistently detected in EFAs. These compositional differences highlight the importance of evaluating their potential impacts on the ITZ and support the mechanistic focus of this study on absorption, ITZ development, and strength loss. In particular, the high carbon content and the presence of heterogeneous non-mineral phases suggest reduced chemical affinity with the cementitious matrix compared with natural siliceous fine aggregates. At the same time, the relatively low calcium and magnesium content indicates lower potential for favorable interaction with cement hydration products at the interface. Together with the high absorption capacity of several EFAs, these characteristics are expected to promote local water redistribution, reduce paste continuity near the aggregate surface, weaken the paste–aggregate bond, and contribute to the development of a thicker and less uniform ITZ.
The characterization of NFA and EFAs included an evaluation of key physical properties. The apparent SG, absorption, and fineness modulus (FM) were determined in accordance with ASTM C127, ASTM C128, and ASTM C33, respectively [40,41,42]. Particle shape (form 2D) and angularity were measured using the Aggregate Image Measurement System 2 (AIMS2) at the University of Maryland, College Park, MD, USA, and classified based on established scales [43]. The average uncompacted void content (UVC) was determined following ASTM C1252 [44], and the particle size distribution of EFAs was evaluated in accordance with ASTM C136 [45].
The results, presented in Table 2 and Figure 1, revealed significant variability among the EFAs. As shown in Figure 1, the particle size distributions varied, with some EFAs exhibiting finer or coarser grading relative to others. As indicated in Table 2, several EFAs had FM values outside the acceptable range of 2.25 to 3.25, suggesting potential challenges in achieving adequate workability and strength. Similarly, significant variations in SG, absorption, and UVC are expected to influence both fresh and hardened concrete properties. From an implementation standpoint, this variability indicates that AutoSR-derived fines cannot be treated as a uniform aggregate source without prior characterization. In practice, achieving consistent concrete performance would require the routine evaluation of key properties, including absorption, grading, density, and fibrous content, as well as potential preprocessing or classification to reduce feedstock variability. However, most EFAs and NFA particles were classified within the range of moderately spherical shapes with moderate angularity based on AIMS2 measurements. Therefore, this study intentionally used unprocessed EFAs obtained directly from the different stages of the automotive recycling process to minimize additional processing and costs and to evaluate their direct applicability in concrete. Using unprocessed material also allows the isolated effects of absorption, porosity, and ITZ behavior to be assessed without introducing treatment-related influences.

2.2. Mix Proportions and Samples

Building on the characterization of the NFA and EFAs, eight concrete mixtures were designed and prepared in the laboratory. The control mix (M1) was produced using NCA and NFA, while seven additional mixtures (M2 to M8) were prepared by replacing 10% of the NFA by volume with EFAs (EFA-1 to EFA-7). The mix design followed the guidelines of ACI 211 [46]. The target compressive strength was 28 MPa at 28 days, and the coarse aggregate (CA) satisfied the #57 grading requirements of ASTM C33 [40], consistent with mix MD7 [47]. The w/c ratio was set at 0.44 and adjusted to account for aggregate absorption and moisture content (MC). The target air content (AC) was 5.5%, and the target slump was 50 mm . The detailed mixture proportions are provided in Table 3. All parameters, except for EFAs, were kept constant to enable a direct evaluation of how EFA absorption and surface characteristics influenced ITZ development and the resulting strength.
Cylindrical specimens with a diameter of 100 mm and a height of 200 mm were cast, along with beam specimens measuring 150 × 150 mm for each mixture. For each mix, a minimum of three replicate specimens (n = 3) were prepared for each mechanical test, including the compressive strength, elastic modulus, and MOR. The specimens were cured in a water bath at 23 ± 2 °C for 28 days to ensure proper hydration. All procedures were conducted in accordance with ASTM C192/C192M [48].

2.3. Testing Experimentation

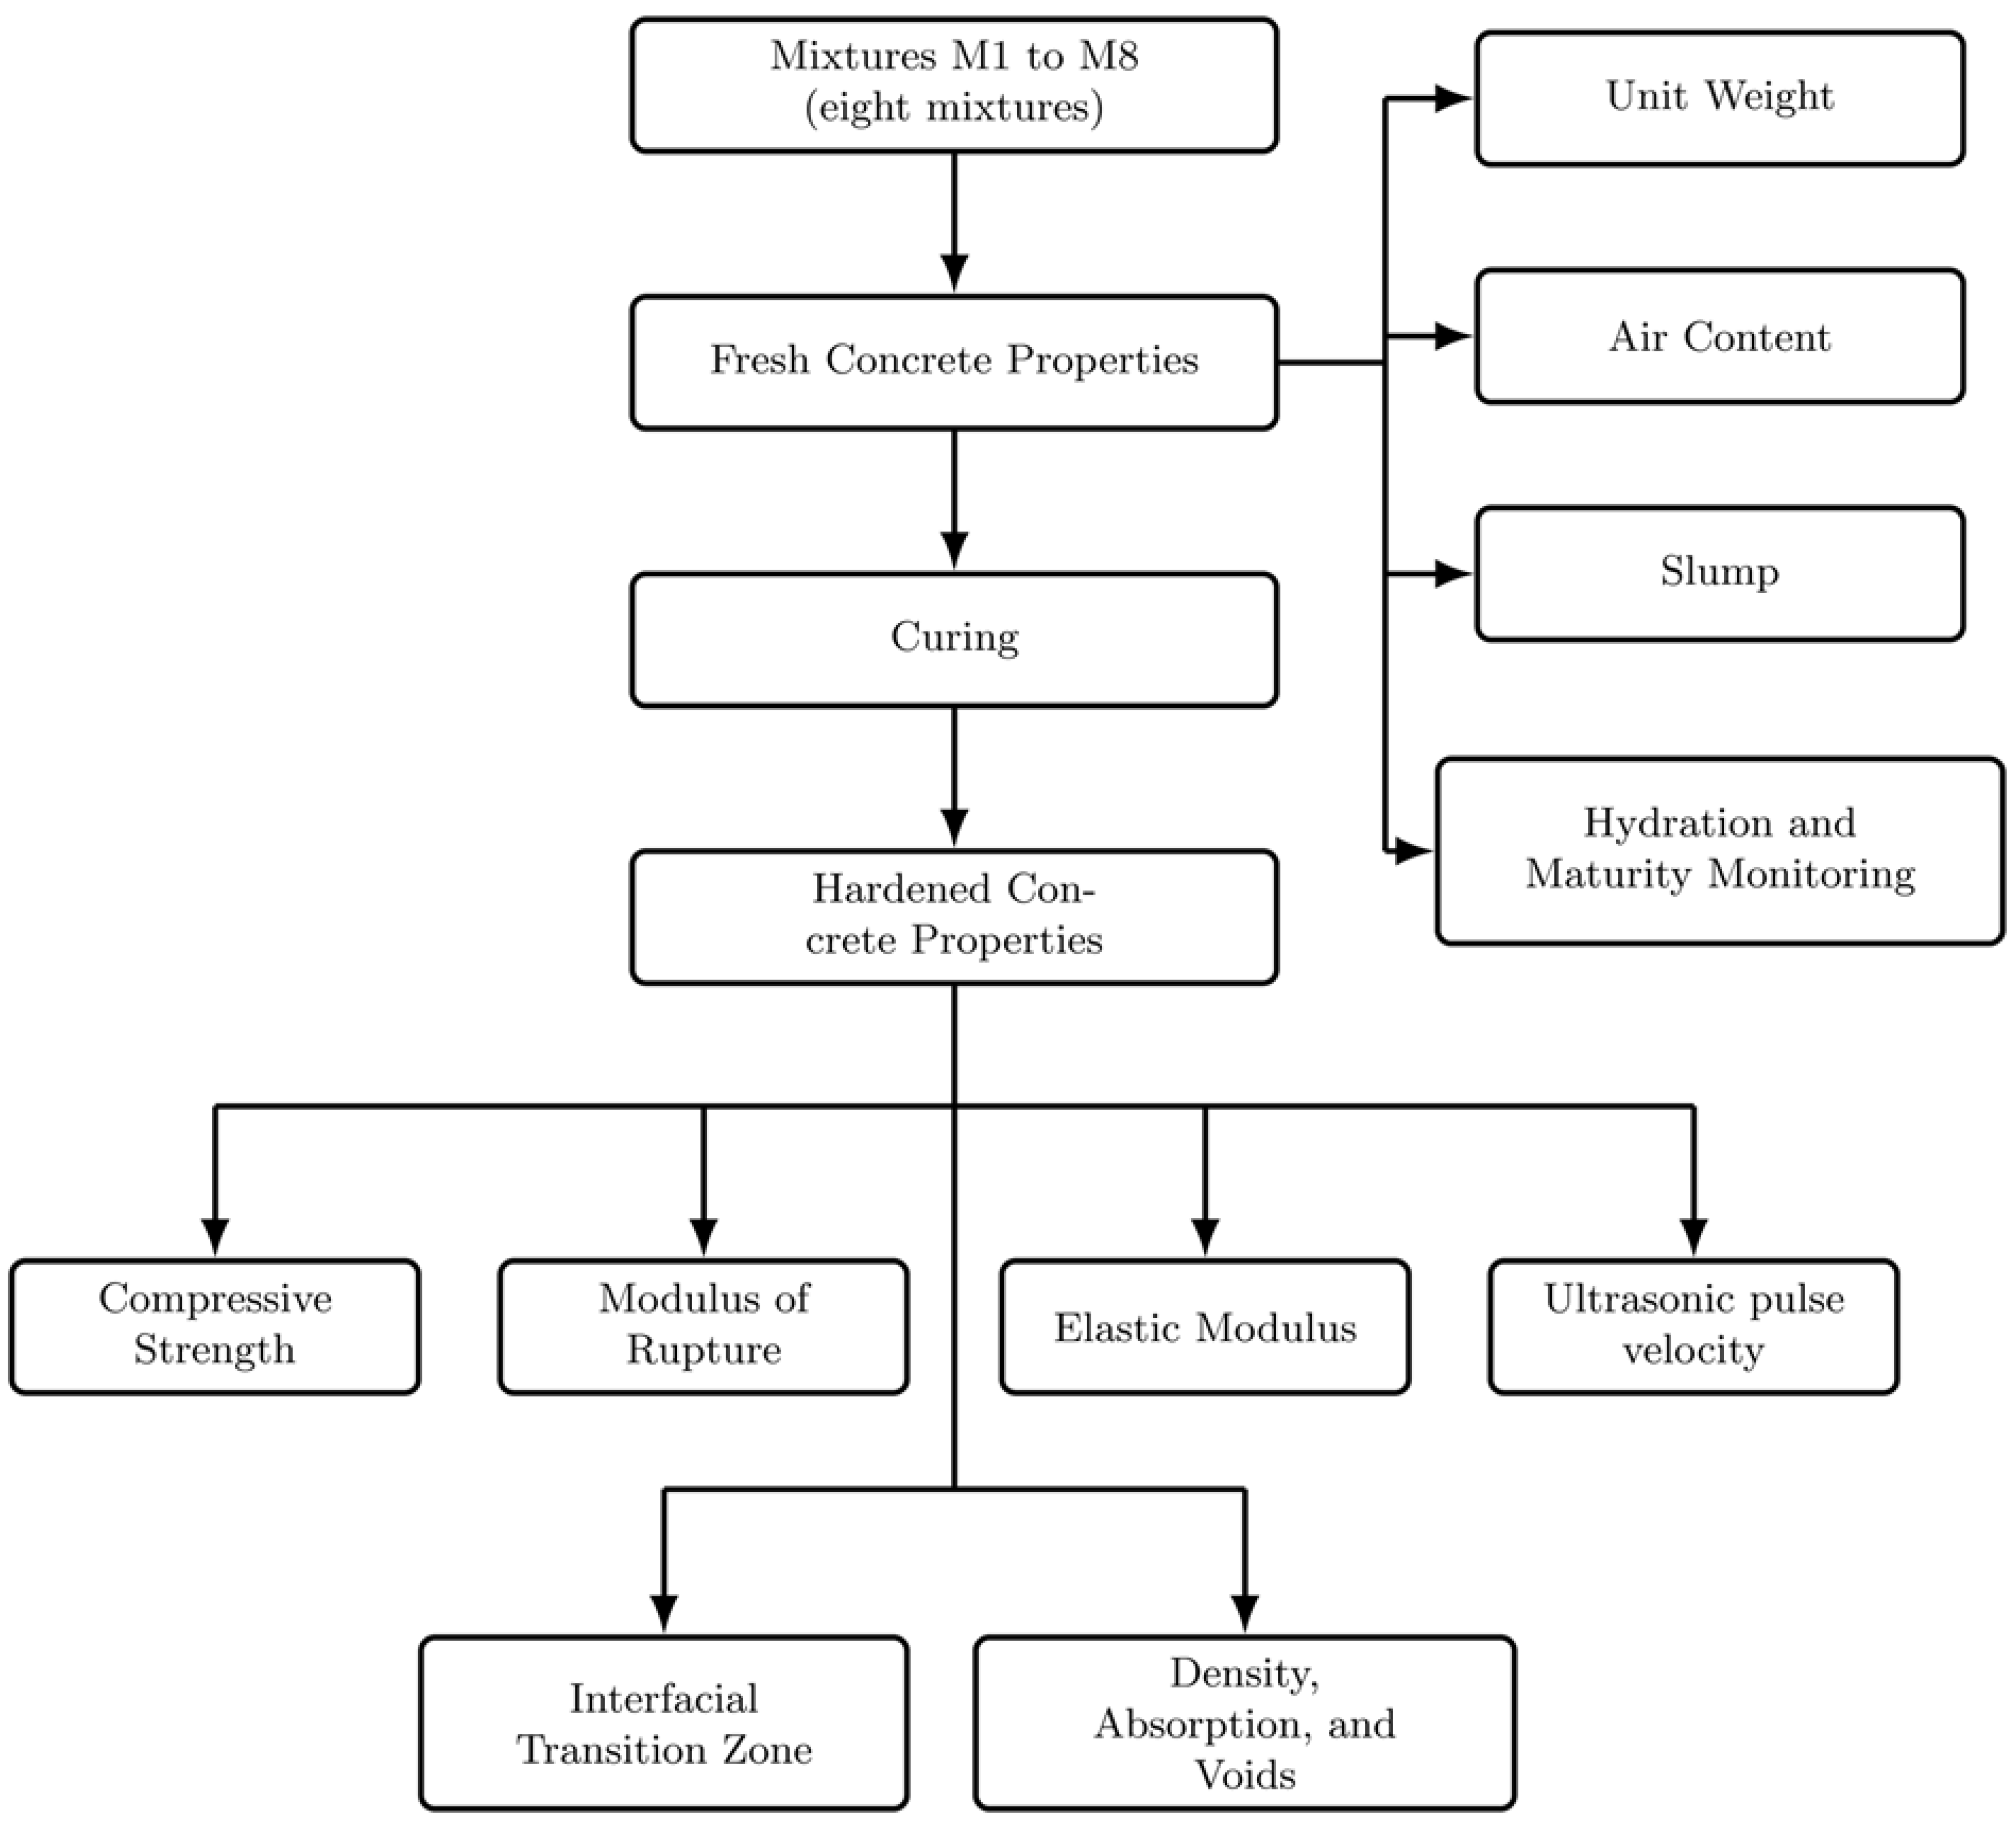
Figure 2 presents the overall testing program for the concrete mixtures. All specimens were prepared and tested in accordance with relevant ASTM standards. Fresh concrete properties, including UW, AC, and slump, were measured following ASTM C138/C138M, C231/C231M, and ASTM C143/C143M, respectively [49,50,51]. During the 28-day curing period, cement hydration and concrete maturity were monitored in accordance with ASTM C1074 [52]. Maturity monitoring was conducted using embedded temperature sensors placed in representative specimens (one per selected mixture), with continuous temperature data used to calculate the time–temperature factor (TTF). This constituted the first phase of the experimental program.
The second phase focused on the properties of hardened concrete. Tests for the compressive strength, modulus of rupture (MOR), elastic modulus, and ultrasonic pulse velocity (UPV) were conducted in accordance with ASTM C39/C39M, ASTM C78/C78M, ASTM C469/C469M, and ASTM C597, respectively [53,54,55,56]. UPV measurements were performed on cylindrical specimens (n = 3 per mixture) at each testing age. In addition, the density, absorption, and void content of the hardened concrete were determined in accordance with ASTM C642 [57], with three specimens per mixture (n = 3) used for porosity-related measurements. ITZ imaging was conducted on selected concrete cores to examine the microstructural characteristics. For ITZ evaluation, measurements were obtained from multiple locations within each specimen, with three measurements per interface averaged to obtain representative values (n = 3 per mixture). This integrated testing framework was designed to link mechanical and durability performance to hydration behavior and the ITZ morphology, enabling a mechanistic interpretation rather than reporting performance outcomes alone.

2.4. Statistical and Model Performance Evaluation Methods

The experimental data were analyzed using statistical methods and regression-based performance metrics to evaluate the reliability and predictive accuracy of the relationships between mixture parameters and model outputs. All analyses were conducted at a 95% confidence level ( α = 0.05), and confidence intervals (CIs) were used to quantify uncertainty in mean differences between mixtures. Adjusted p-values were calculated using the Holm, permutation, and FDR methods to account for multiple comparisons. The predictive performance of each regression model was evaluated using the coefficient of determination ( R 2 ), root mean square error ( R M S E ), and mean absolute error ( M A E ), as defined in Equations (1)–(3) and following standard formulations [58,59]:
R 2 = 1 i = 1 n y i y ^ i 2 i = 1 n y i y ¯ i 2  
R M S E = 1 n i = 1 n y i y ^ i 2
M A E = 1 n i = 1 n y i y ^ i  
where y i  is the observed experimental value, y ^ i  is the predicted value, y ¯ i  is the mean of the observed values, and n is the total number of data points. Higher R 2 values indicate a stronger fit between the measured and predicted results, while lower R M S E and M A E values indicate improved predictive accuracy and precision. The Kolmogorov–Smirnov ( K S ) test was also applied to verify the normality of residuals and ensure that regression assumptions were satisfied. Collectively, p-values, CIs, and model error indices provide a consistent framework for evaluating statistical significance and predictive performance, supporting the interpretation of the results in subsequent sections and confirming that the observed trends reflect material behavior rather than random experimental variation. The mechanical property comparisons were based on three replicate specimens per mixture (n = 3), consistent with ASTM standards [53,54]. This relatively small sample size limits the statistical power, particularly when applying multiple-comparison corrections. Therefore, the results are interpreted as indicative trends rather than definitive differences between mixtures.

3. Testing Results and Discussion

3.1. Fresh Concrete Properties

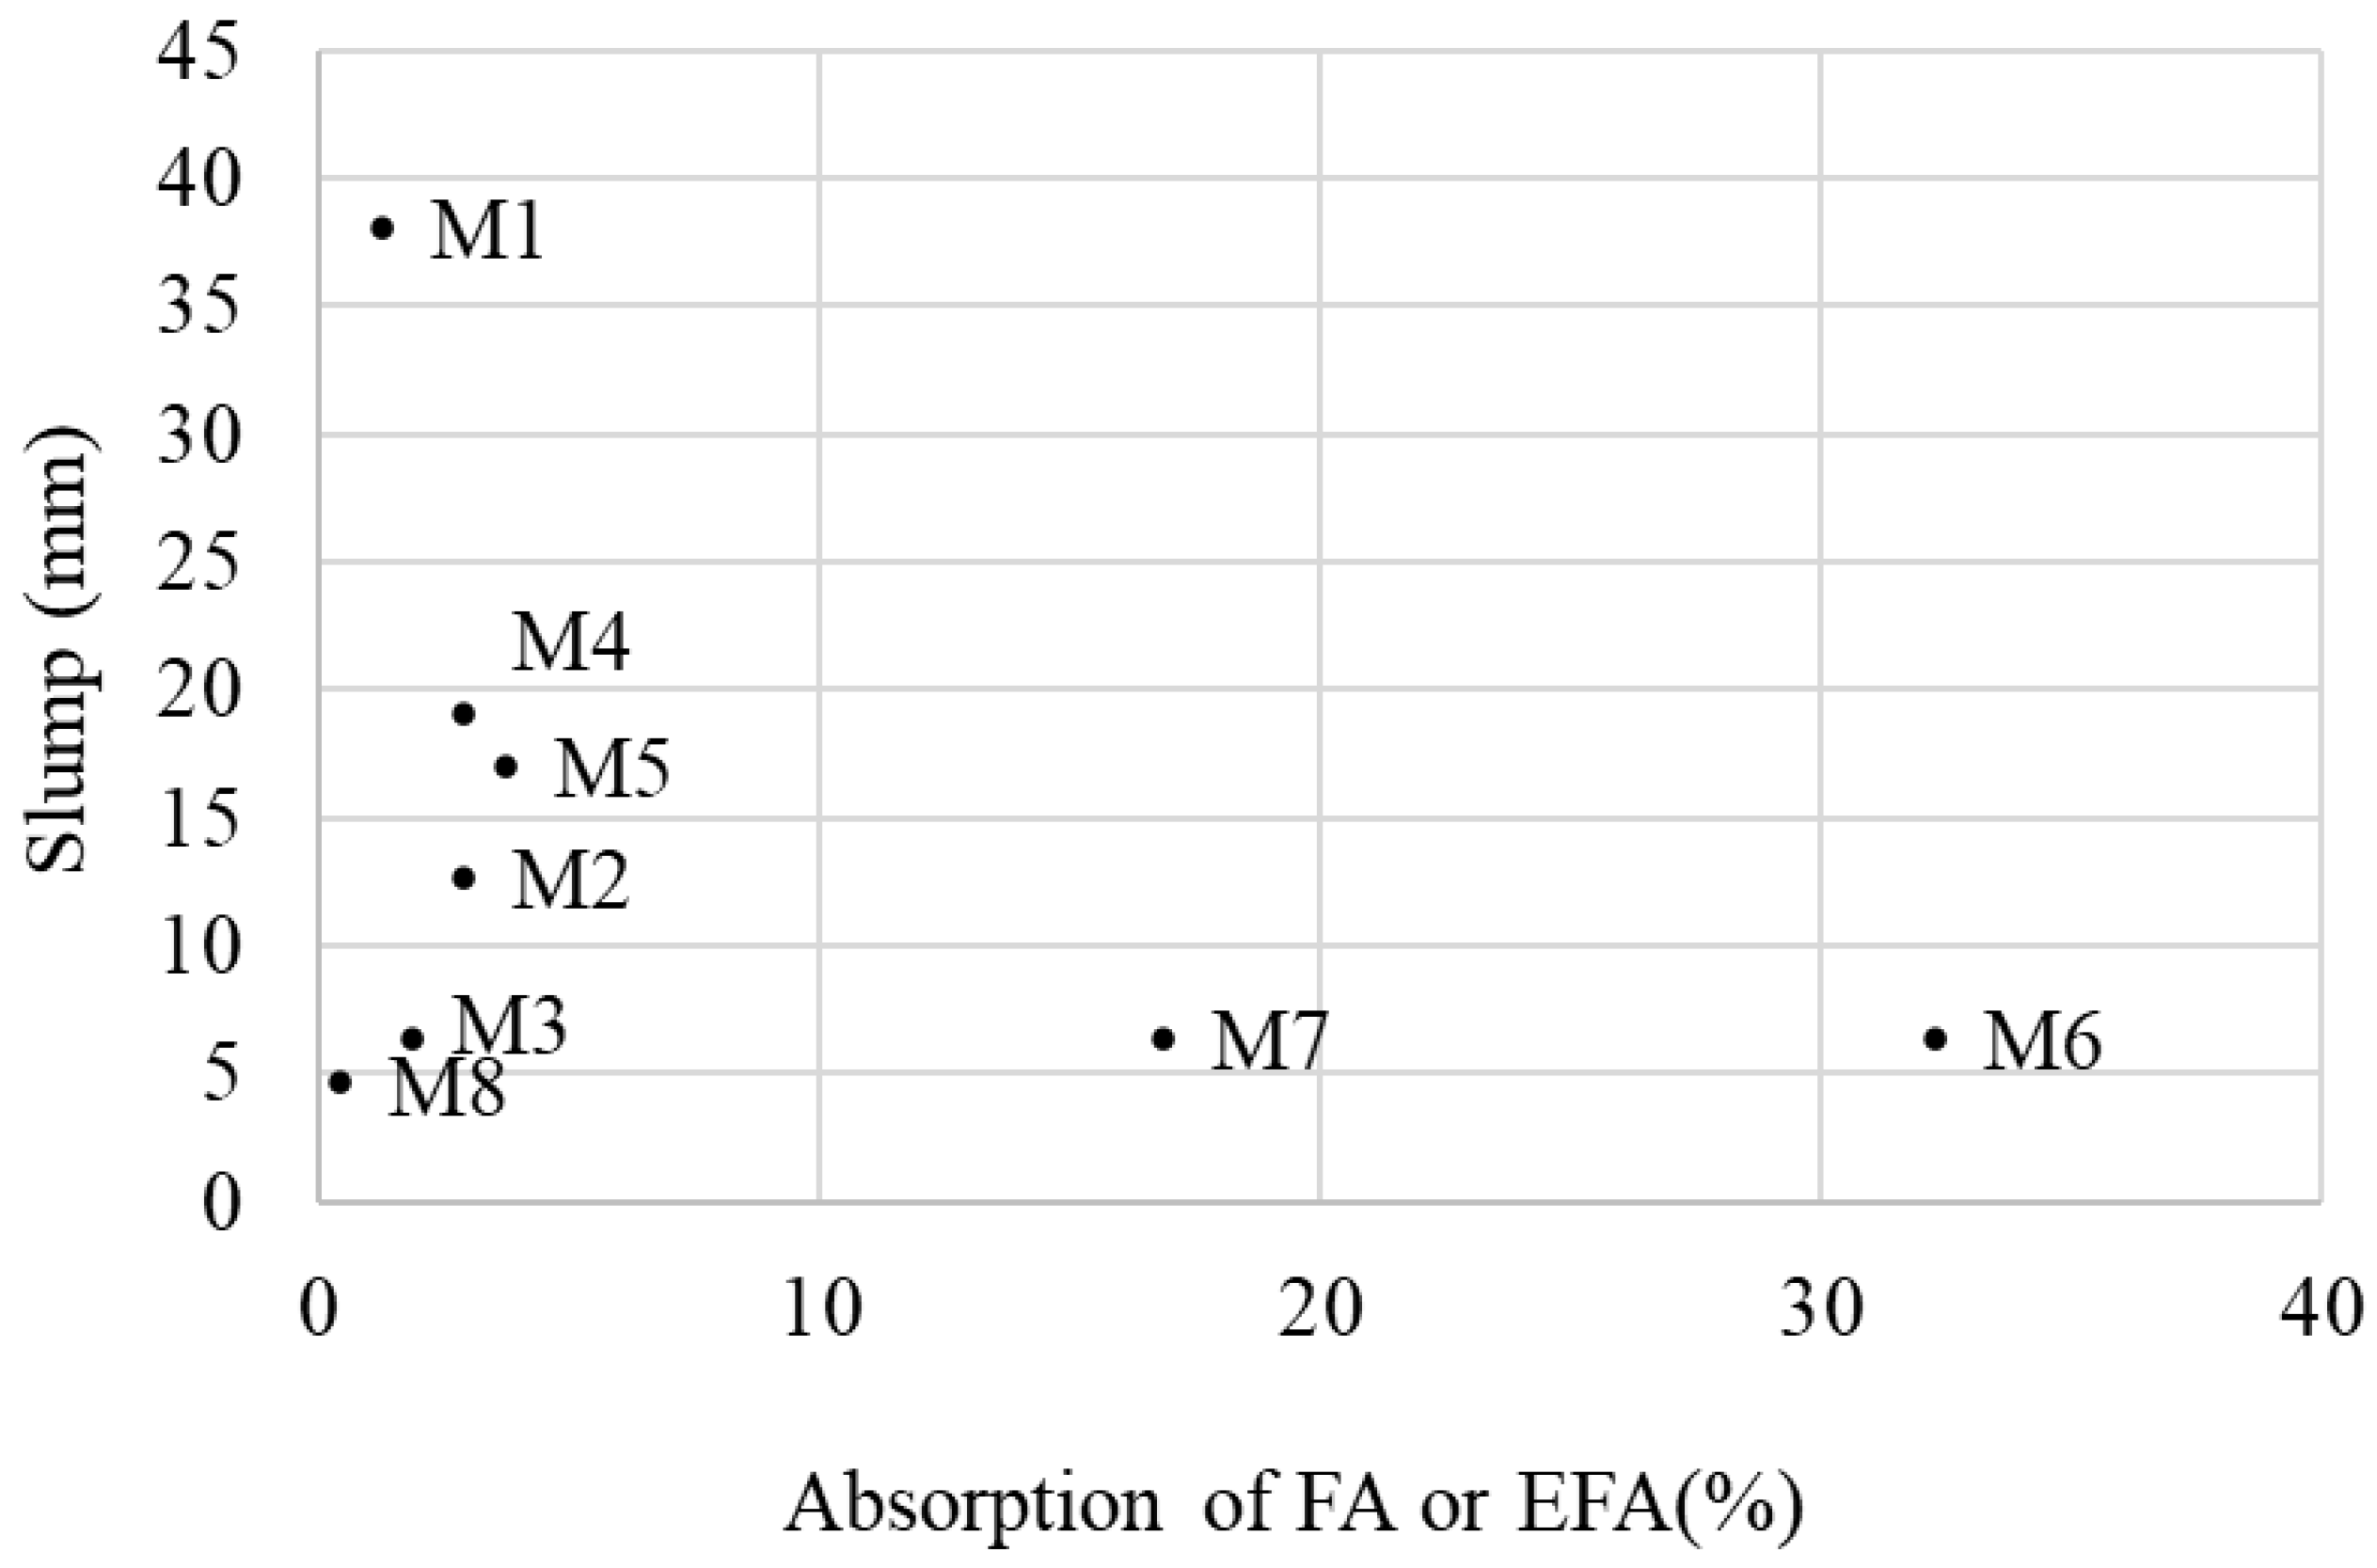
The slump test results (Table 4) show a marked reduction in workability with the incorporation of as-received EFAs. Slump values for mixtures containing EFAs (M2 to M8) ranged from 5 to 19 mm , compared to 38 mm for the control mixture (M1). This reduction is primarily attributed to the high absorption capacity of EFAs, combined with the effects of particle gradation, shape (form 2D), angularity, and UVC. These results indicate that slump loss is systematically governed by EFA absorption and packing characteristics, rather than random variations in mixture preparation. However, distinct behavior was observed in M6 (EFA-5) and M7 (EFA-6), which exhibited the lowest slump values despite having the highest absorption levels. This suggests that additional factors beyond absorption contribute to workability loss. Specifically, this behavior is attributed to the presence of fibrous content in these EFAs, unlike the other AutoSR-derived materials (EFA-1 to EFA-4 and EFA-7), which were largely fiber-free (Figure 3).
Regarding the measured UW, mixtures M5 to M8 exhibited lower values than the control mixture M1 (2513 kg / m 3 ), as shown in Table 4. This reduction is attributed to the combined effects of the SG, absorption, and UVC of the EFAs. In contrast, mixtures M2–M4 showed UW values comparable to M1. The AC of EFA-modified concrete ranged from 1.80% to 6.5%, compared to 2.8% for M1, with M5 exhibiting the highest AC (6.5%). This variation suggests that certain EFAs promote increased air entrainment or air retention, likely due to differences in particle morphology, absorption, and internal void structure.

3.2. Hydration Monitoring, Time Temperature Factor, and Master Curves

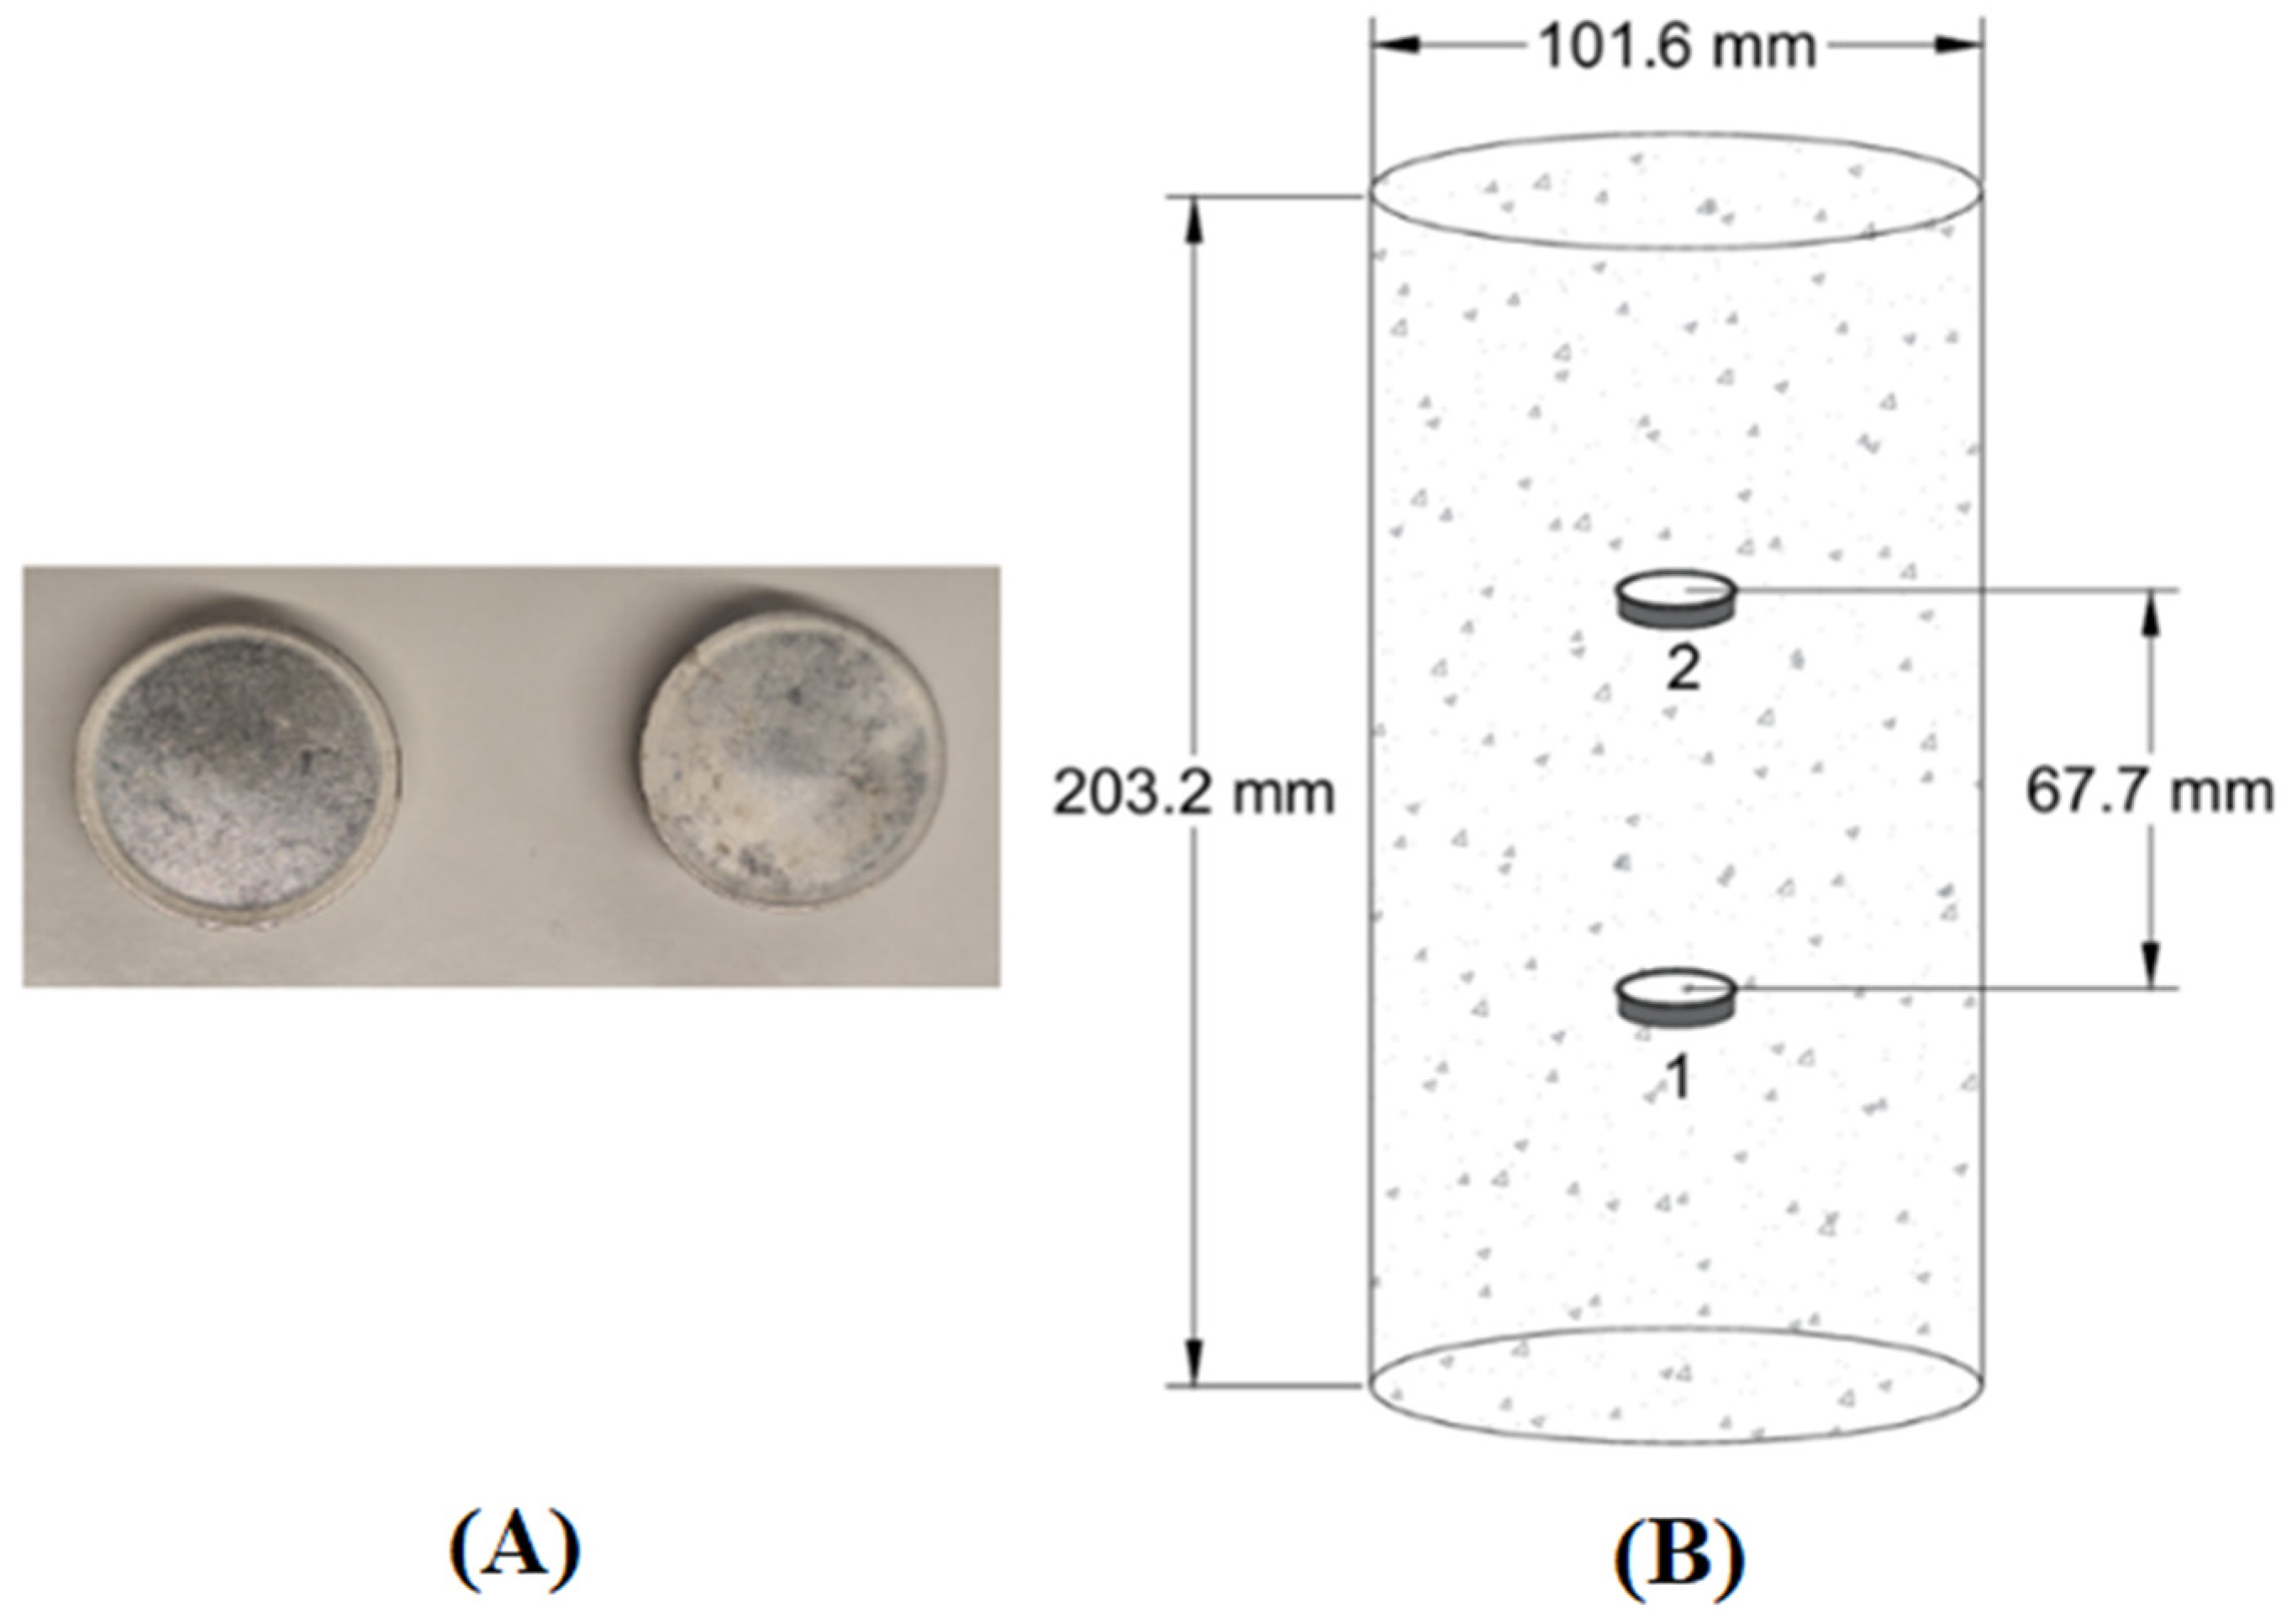
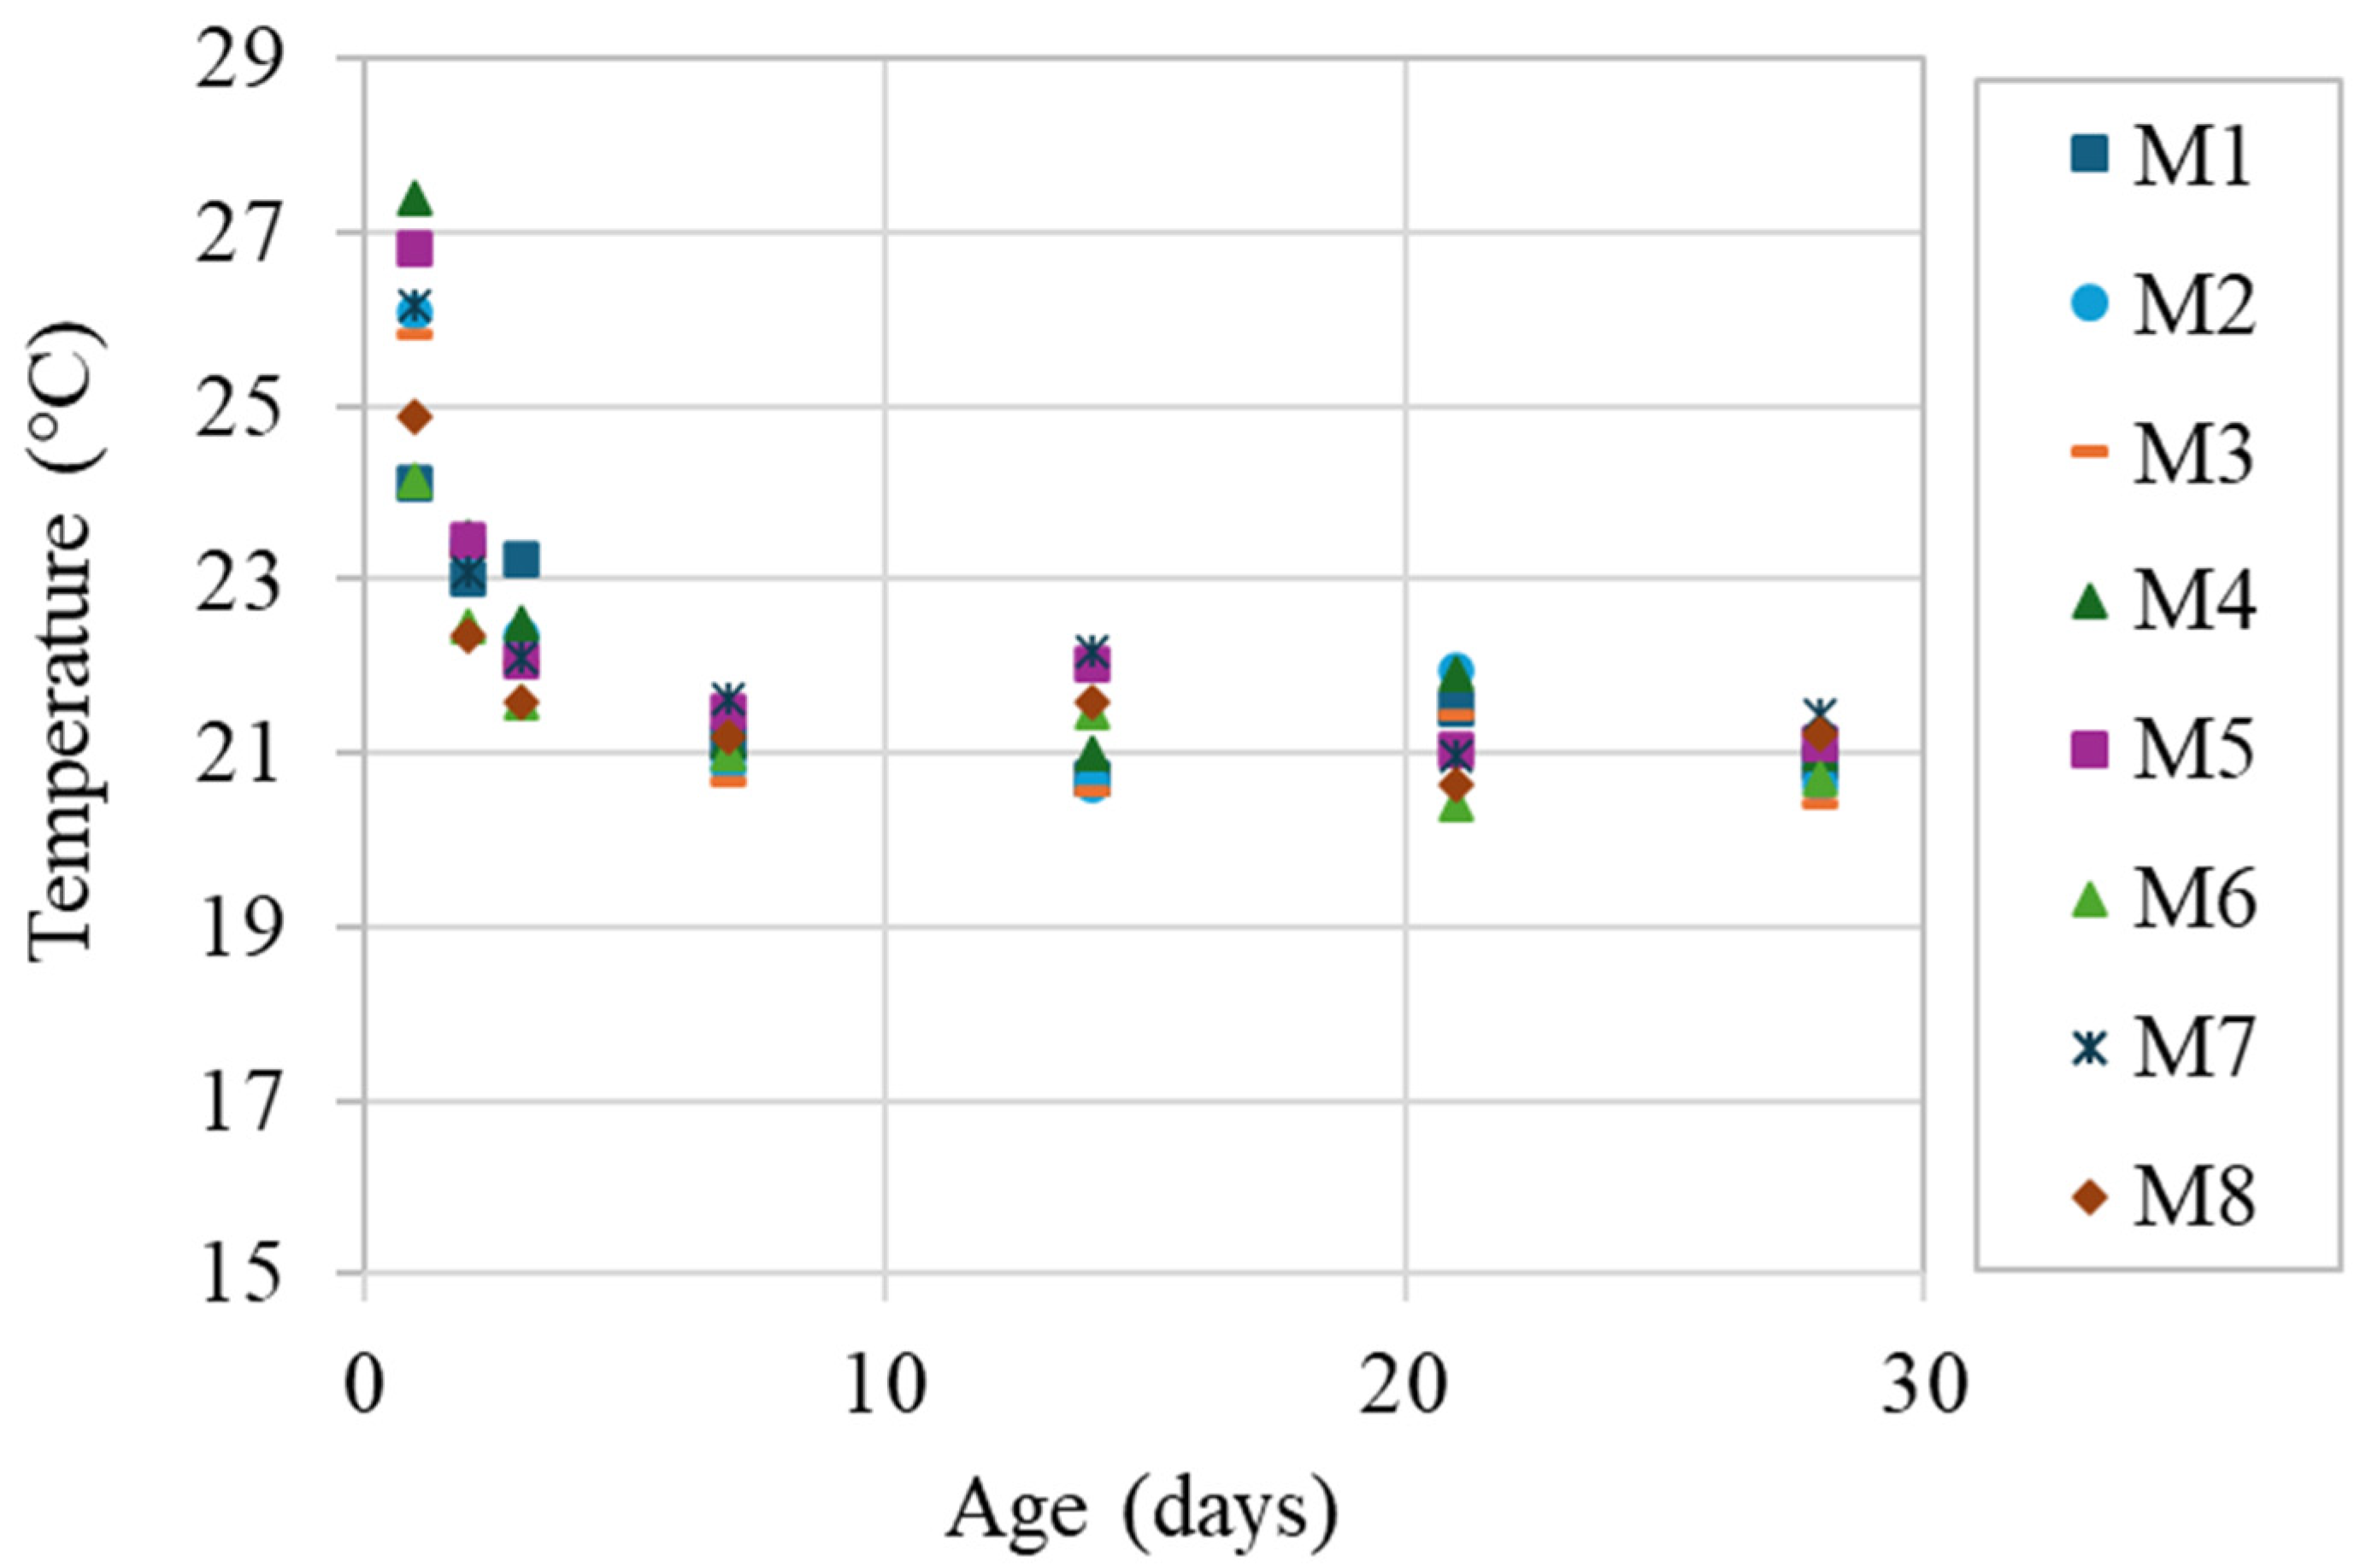
To monitor temperature development during hydration and calculate the TTF, iButton temperature sensors were embedded in selected cylindrical specimens (Figure 4). The resulting temperature–time profiles (Figure 5) showed consistent trends across all mixtures, with only minor variations. These results indicate that EFA inclusion did not significantly alter hydration kinetics. At the 10% replacement level, the presence of EFAs appears to have a negligible effect on the thermal evolution of concrete, suggesting that their influence is primarily physical rather than chemical.
The TTF (or maturity index) was determined for each concrete mix based on the recorded temperature–time data, following the Nurse–Saul function in Equation (4):
M t =   0 t T T 0   Δ t
where
  • M t = temperature–time factor or maturity index at age t (°C.days or °C.hours);
  • Δ t = time interval (days or hours);
  • T = average temperature of concrete during interval Δt (°C);
  • T 0 = datum temperature, i.e., the lowest temperature for strength development (10 °C).
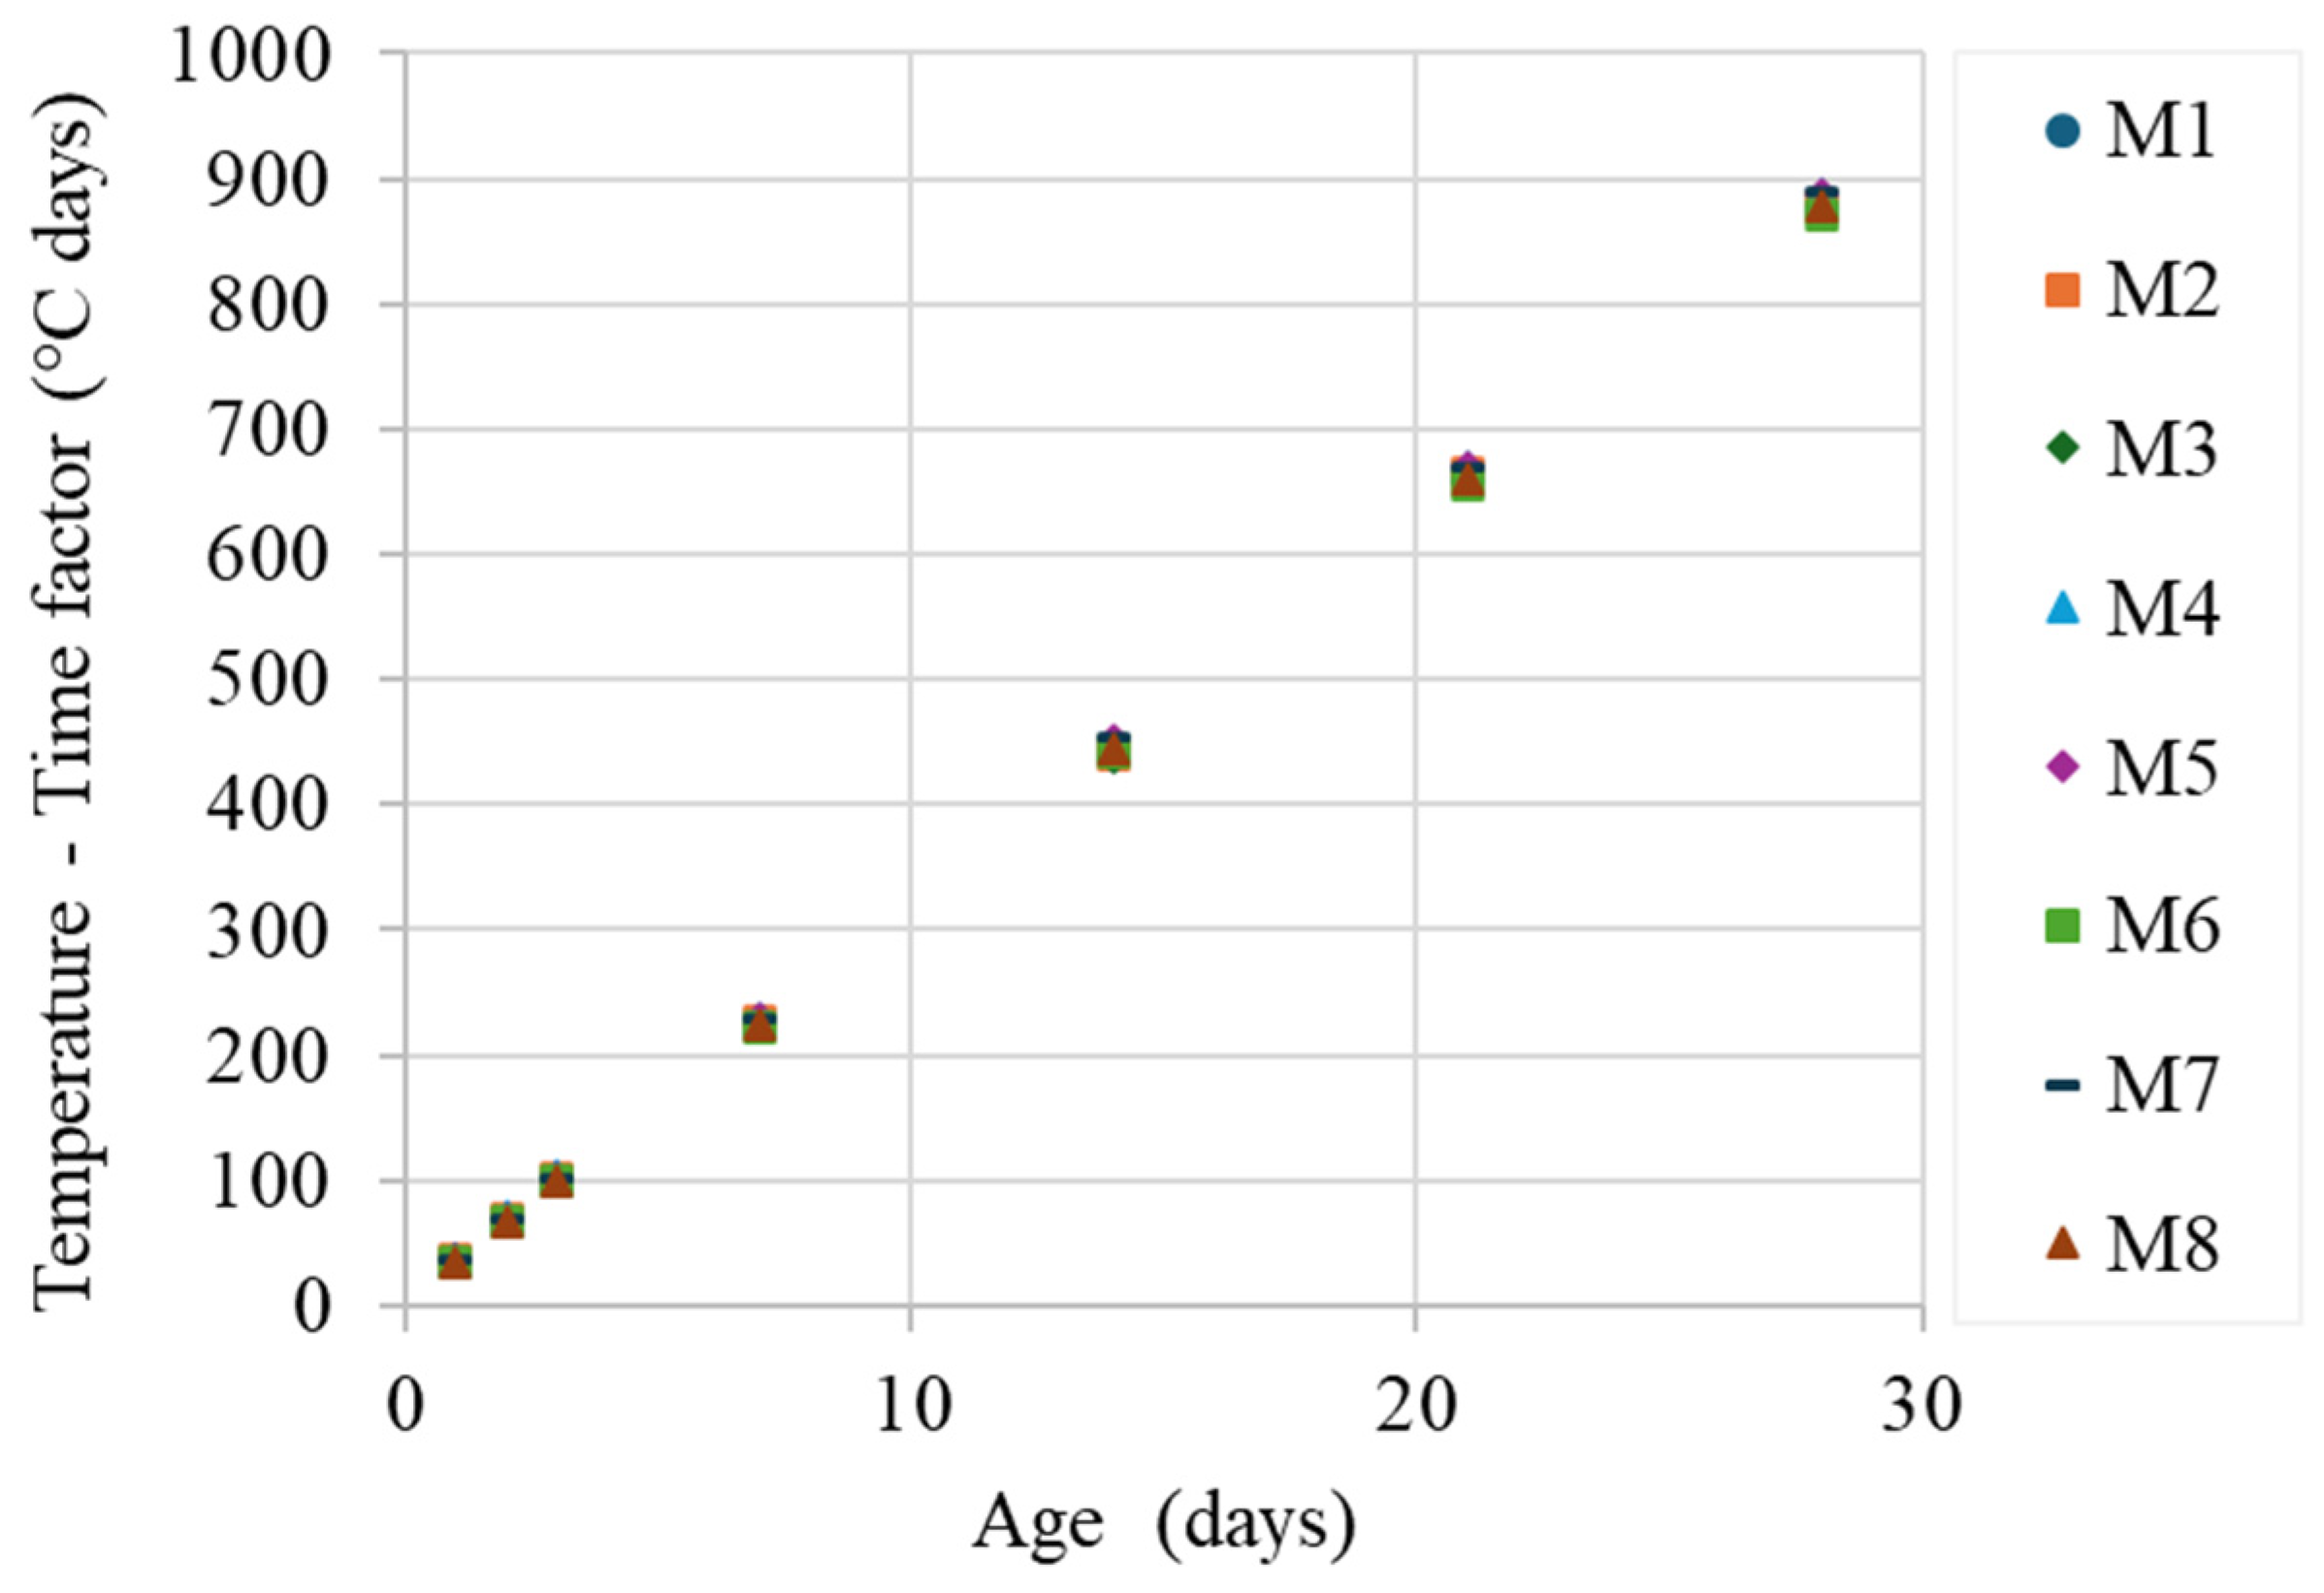
The maturity curves (Figure 6) for all EFA mixtures closely followed that of the control (M1), exhibiting consistent linear relationships. These results confirm that the hydration kinetics were not significantly affected by the EFA composition. Accordingly, the observed differences in mechanical performance are attributed to aggregate–paste interactions, particularly ITZ effects, rather than changes in hydration behavior.
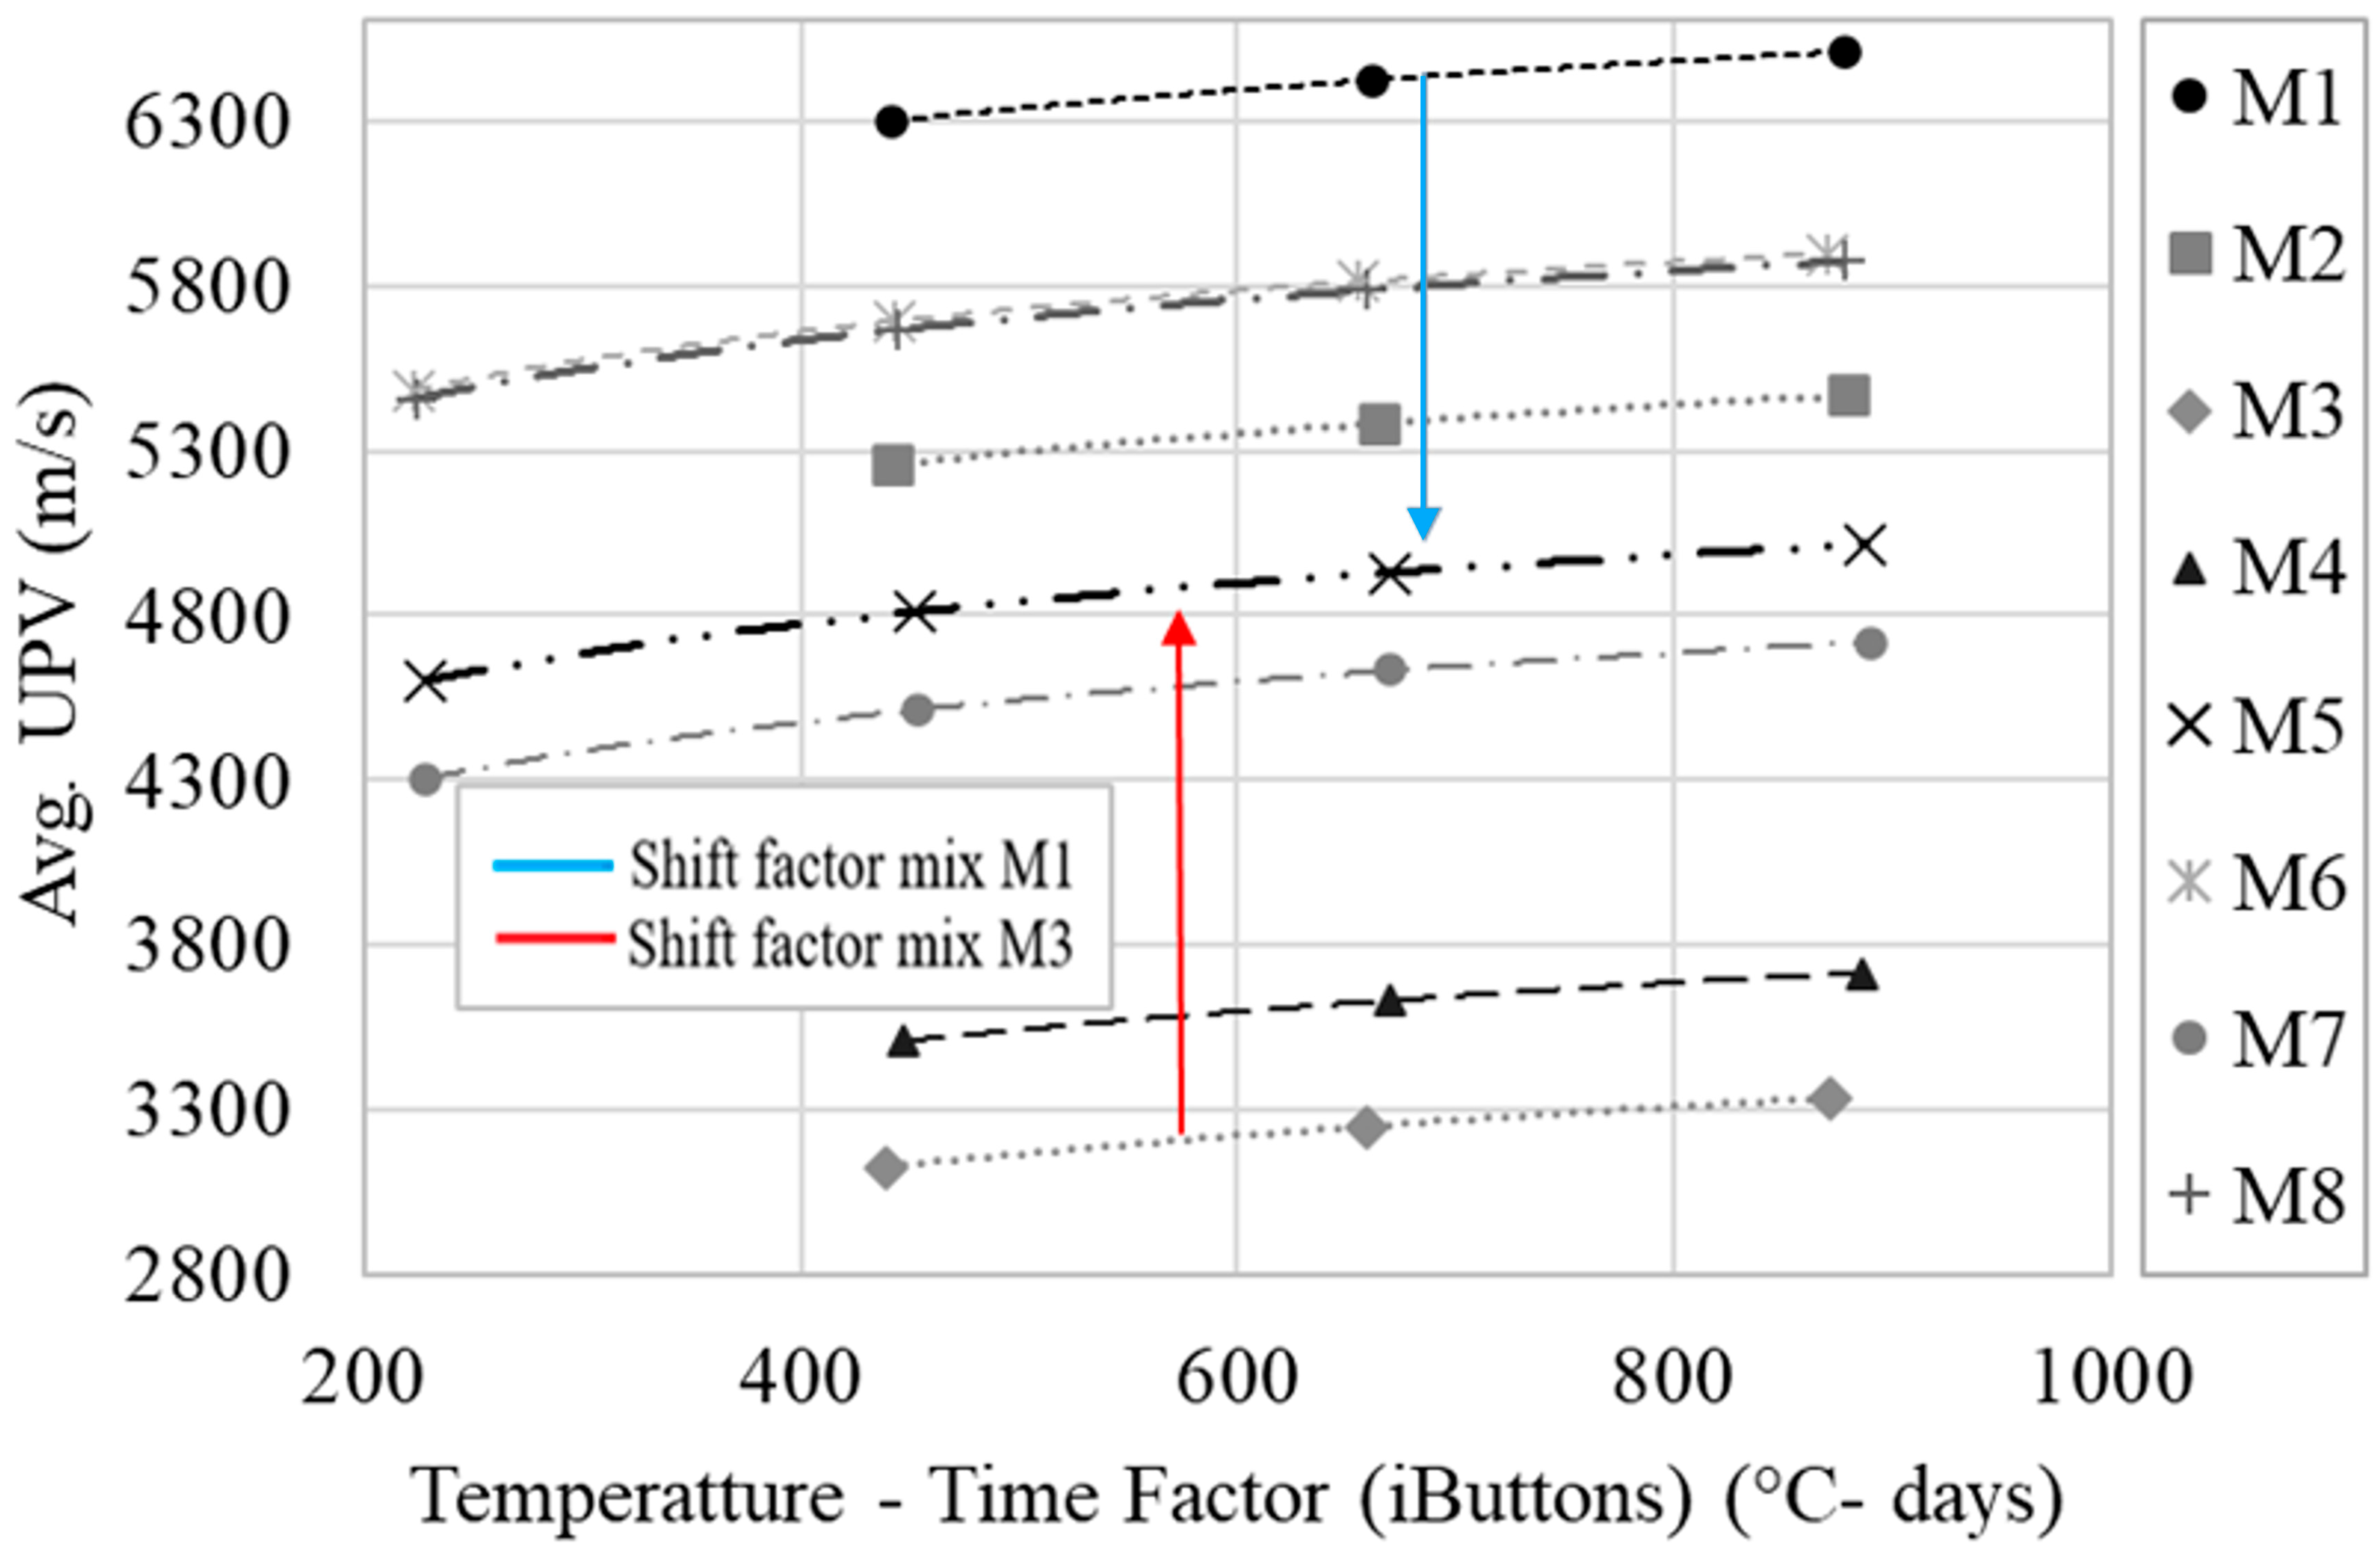
UPV testing was performed on cylindrical specimens from all mixtures during the hydration period, in accordance with ASTM C597 [56]. UPV values increased over time for all mixtures, consistent with normal hydration and microstructural development. Following Saremi and Goulias [60], master curves were developed using time-dependent UPV data collected throughout the curing period. These curves describe the relationship between the UPV and maturity and are used here to compare hydration-related behavior among mixtures, rather than to directly predict strength. The relationship between the UPV and the TTF, expressed as the maturity index (MI) derived from iButton data (Figure 7), was evaluated. A logarithmic function provided the best fit for all mixtures (Equation (5)):
y = a . L n M I + b
where
  • y M I = average UPV (m/s);
  • a, b = logarithmic regression coefficients;
  • MI = temperature–time factor or maturity index at age t (°C·days or °C·hours).
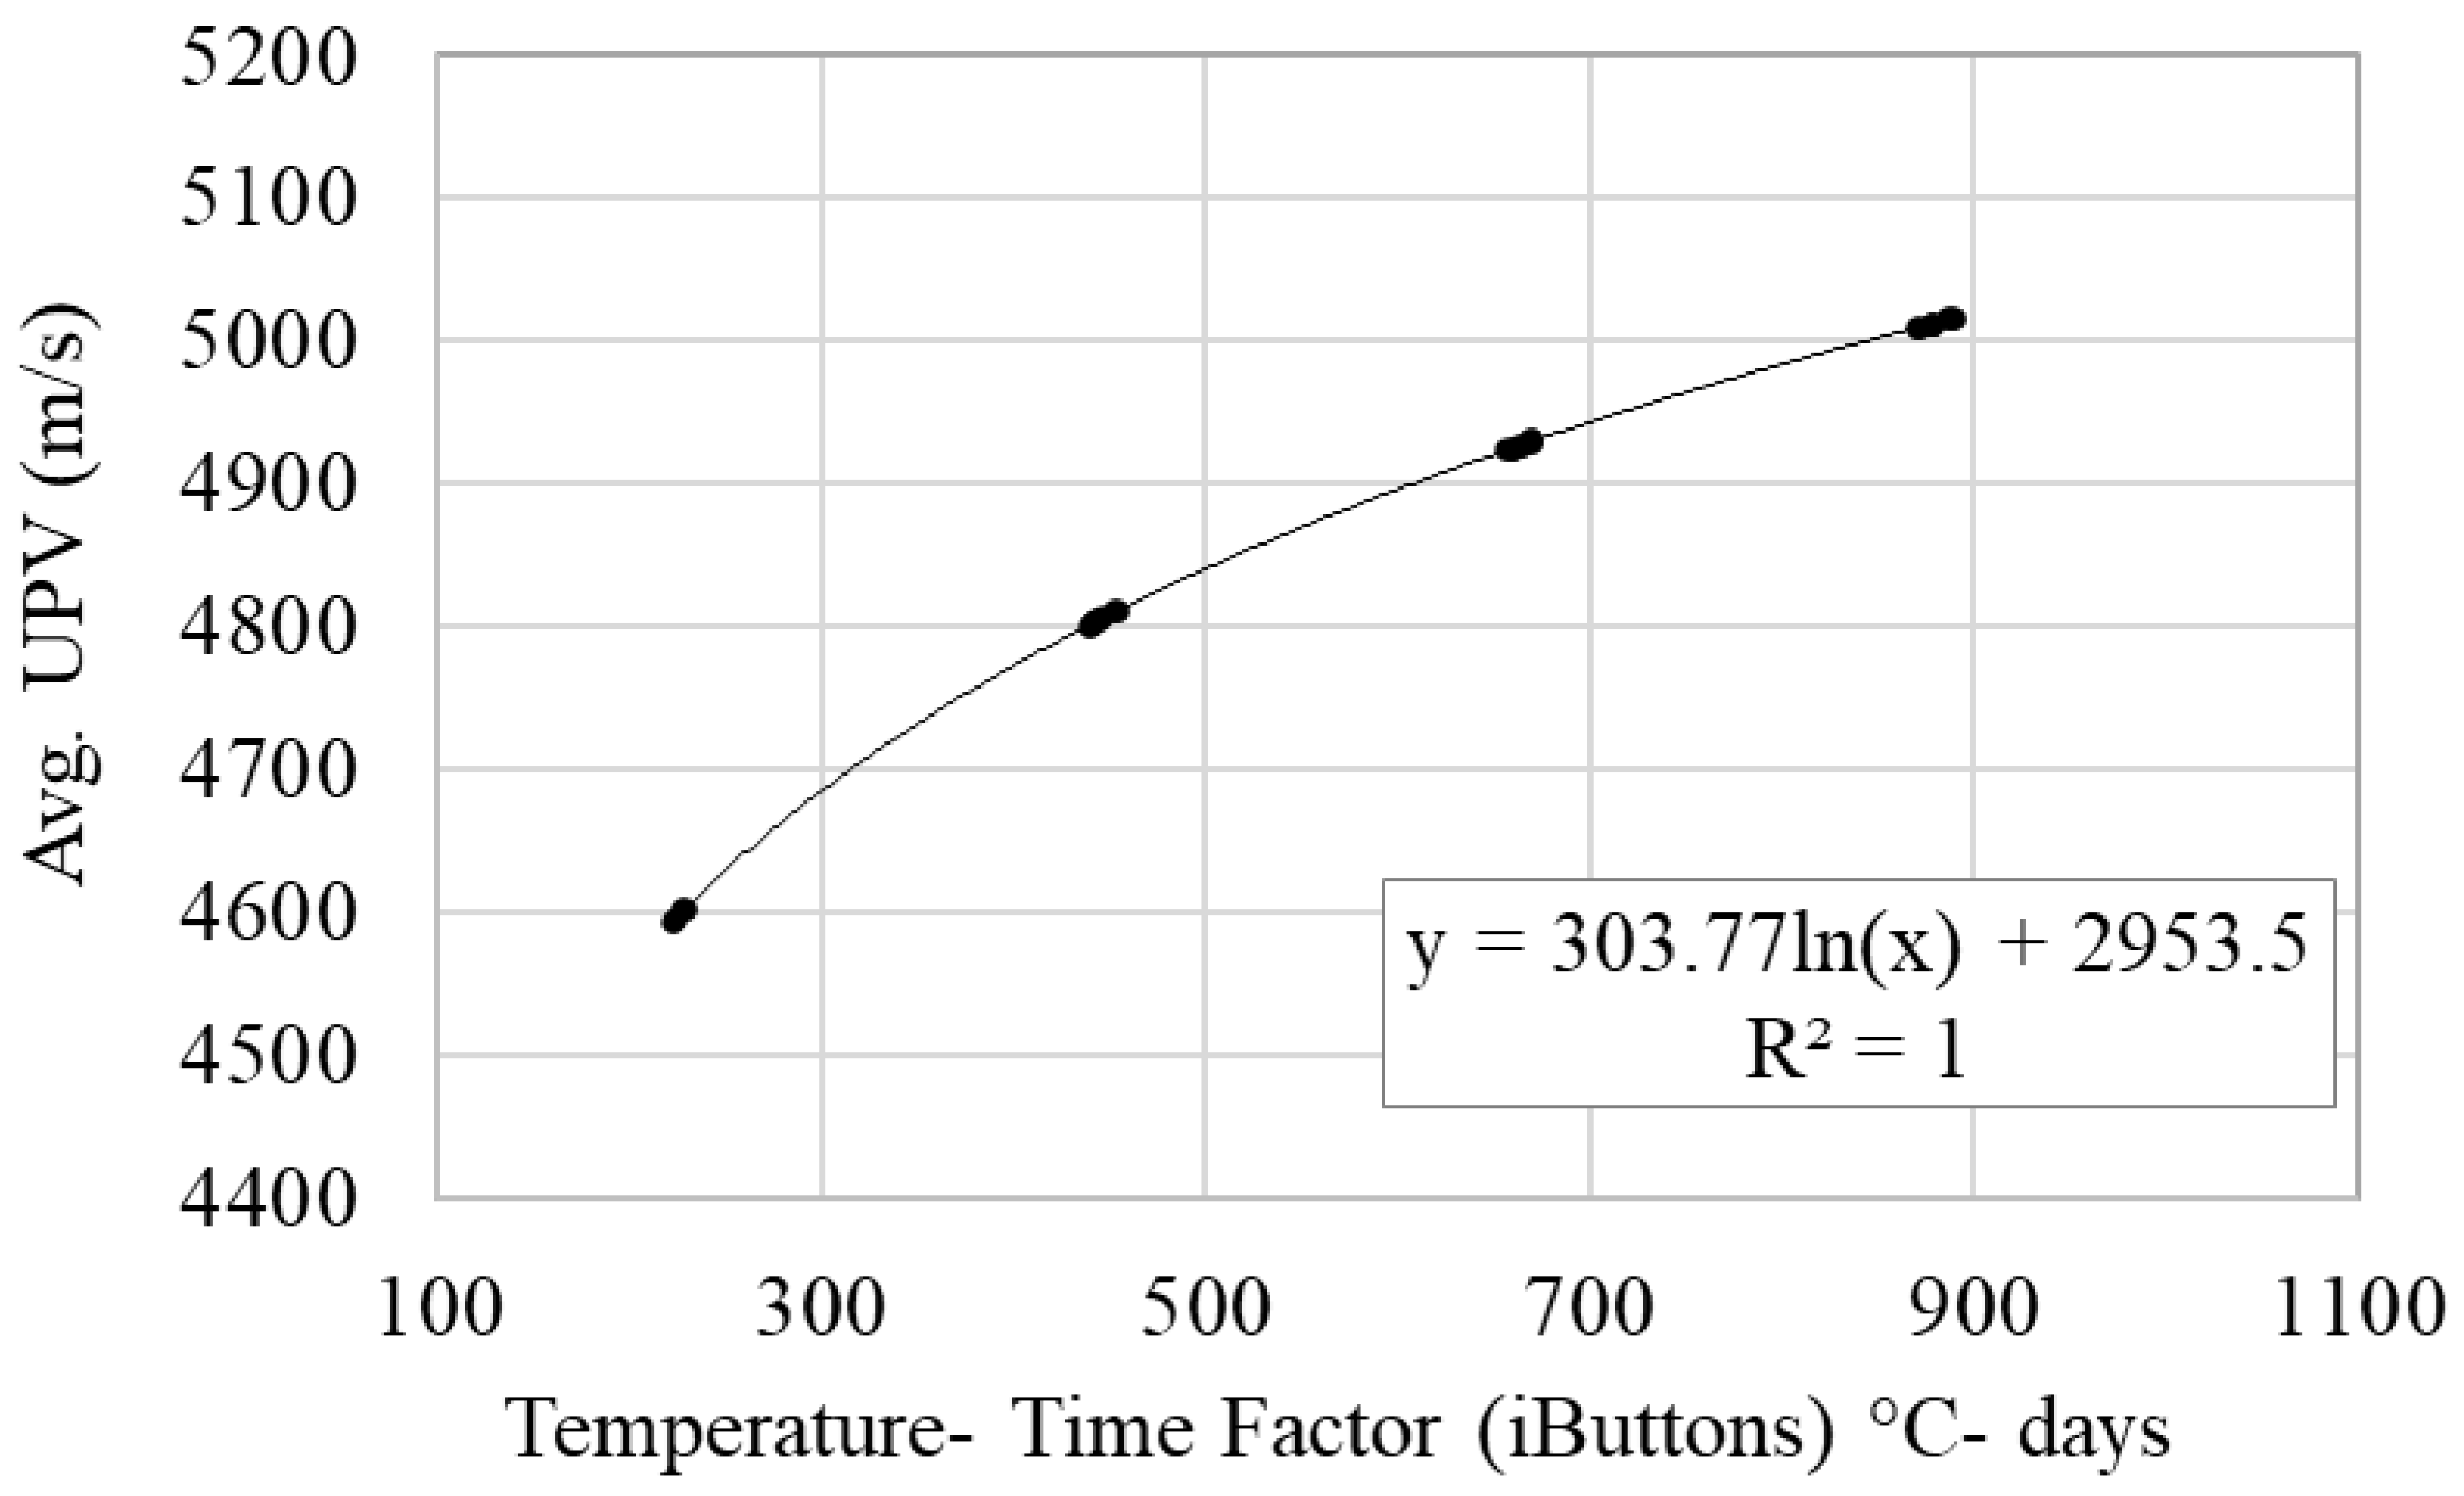
Vertical shift factors were calculated relative to the reference mixture (M5) to normalize UPV responses and construct the master curve (Figure 8). The corresponding regression coefficients and shift factors are summarized in Table 5. This normalization enables a direct comparison of the UPV–maturity relationships across mixtures and supports the interpretation of mixture effects.
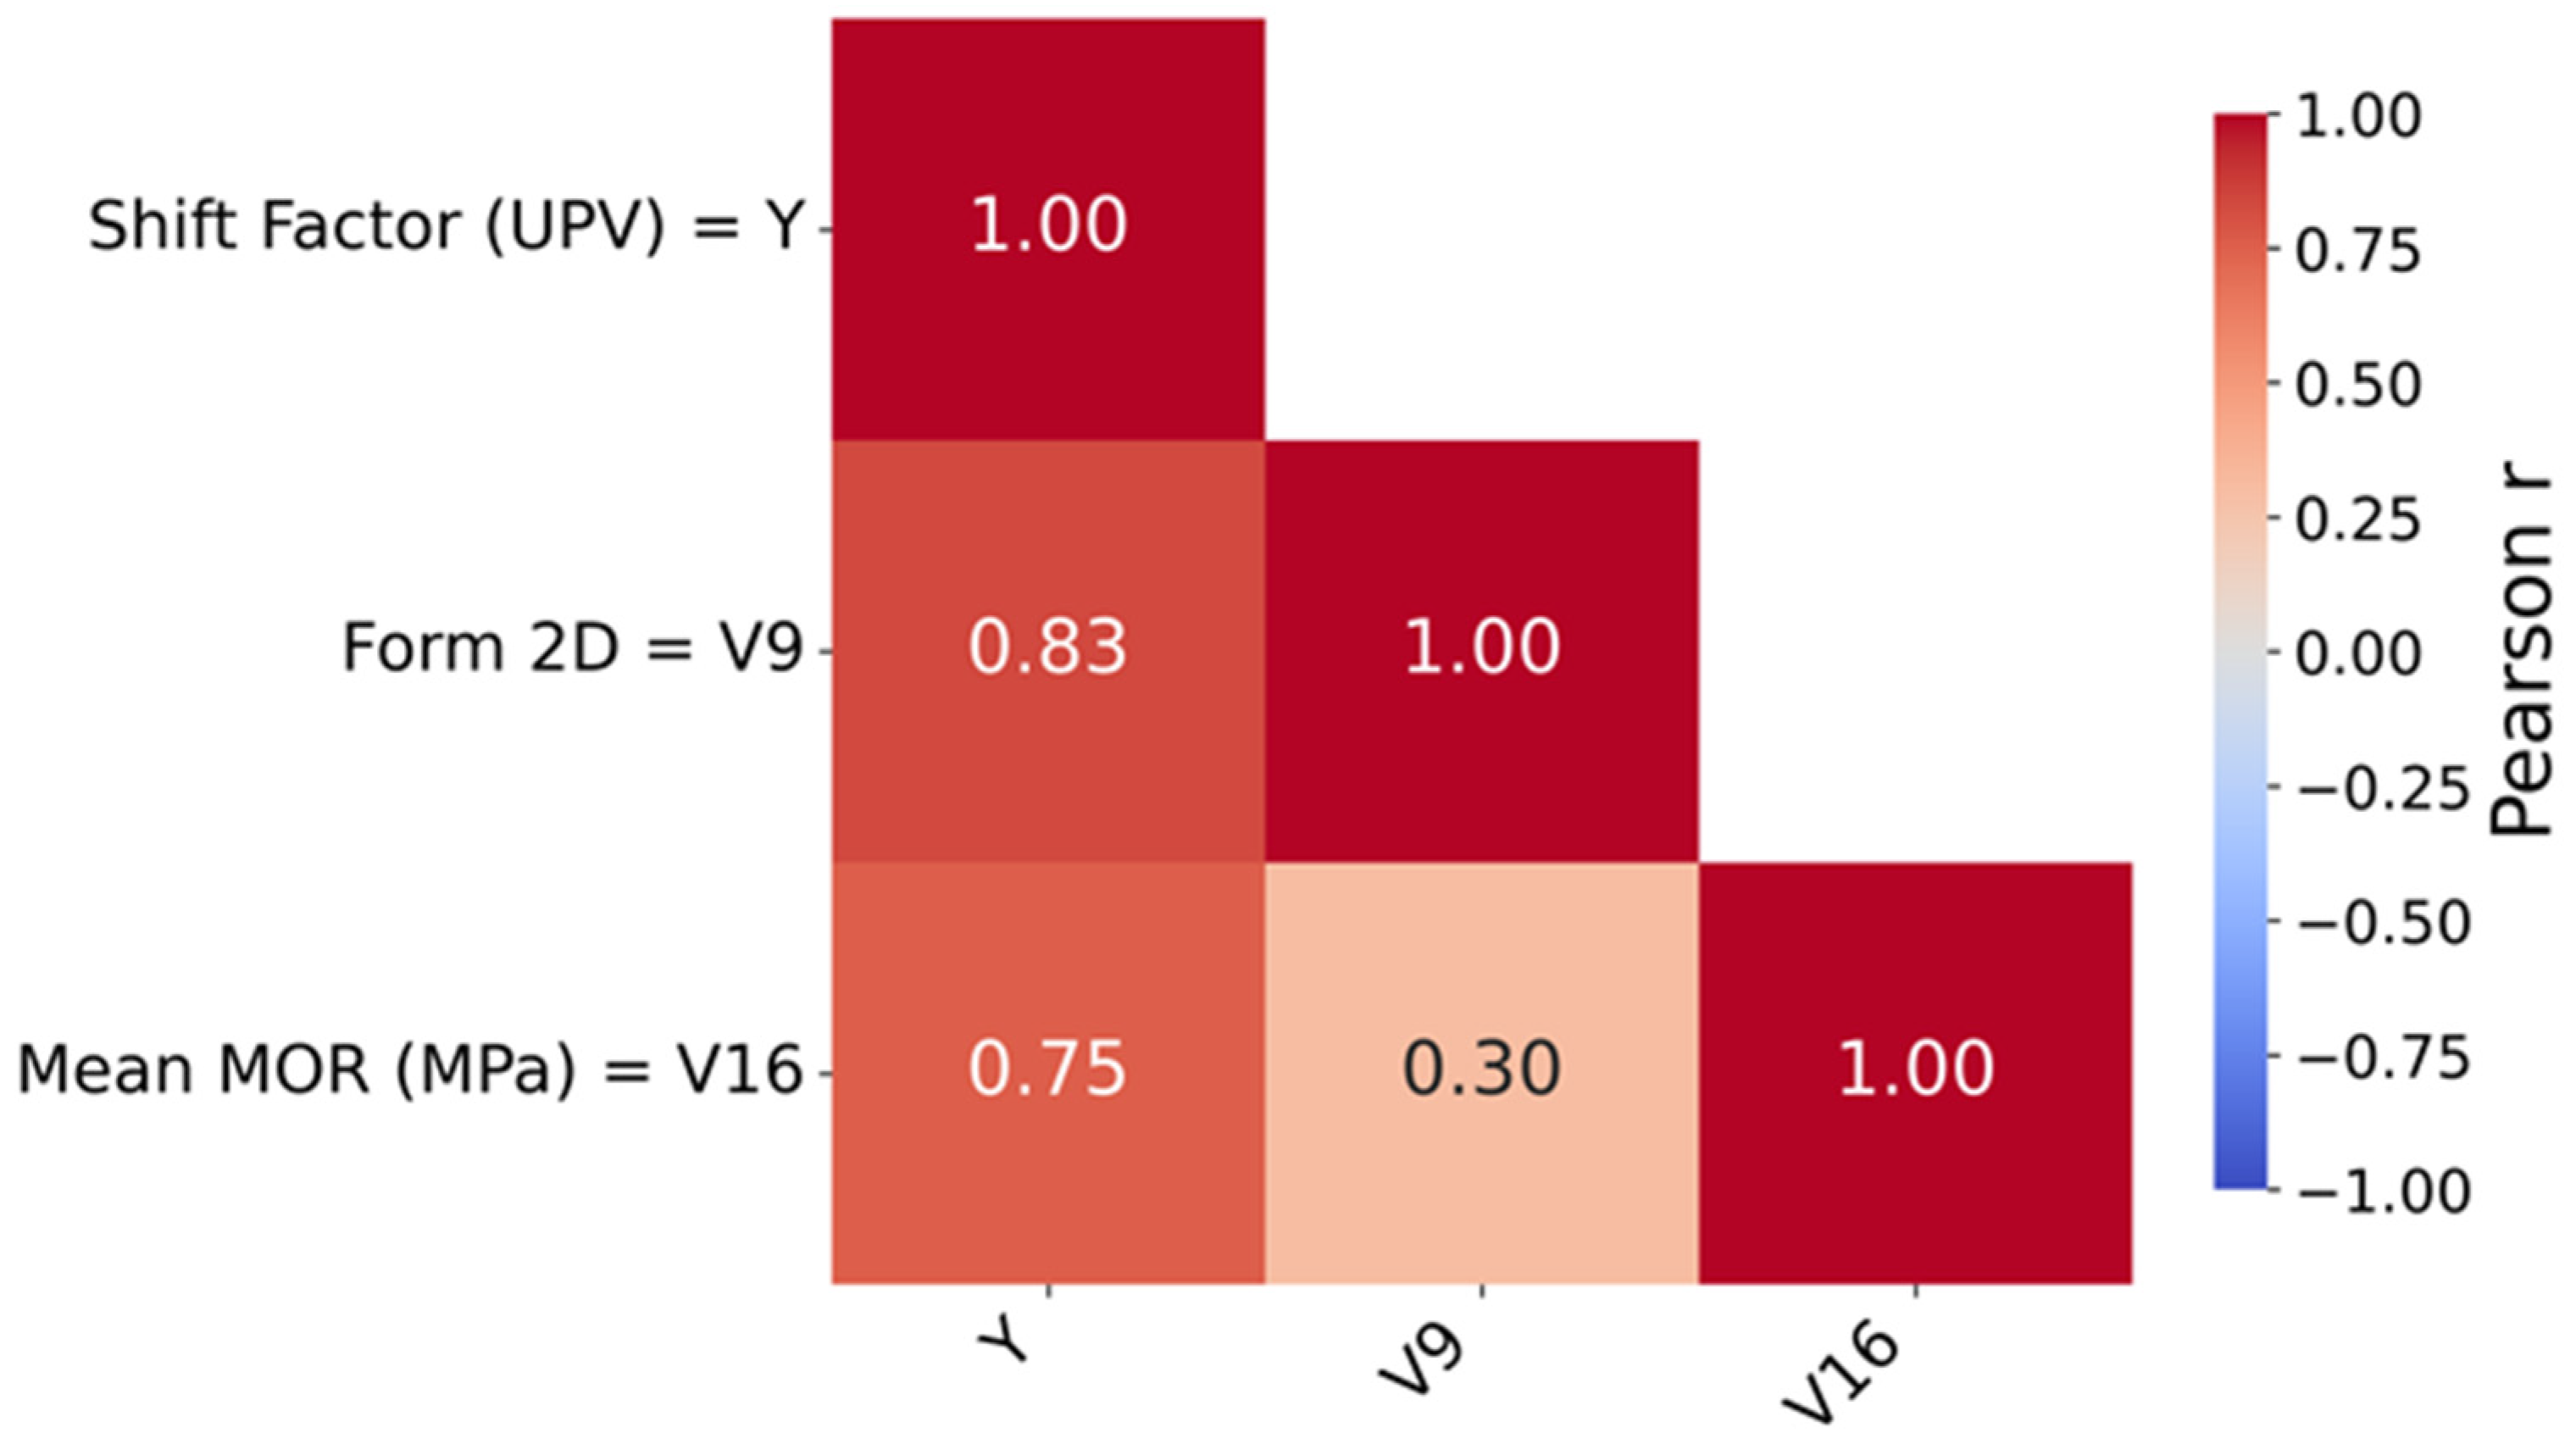
To relate the UPV shift factor ( Y ) to mixture properties, a Pearson correlation analysis was performed between Y and the coded variables (V1–V21) to identify influential predictors and assess multicollinearity (Figure 9). Based on this analysis, V9 (2D form) and V16 (mean MOR) showed the strongest associations with Y while exhibiting low intercorrelation (r ≈ 0.30). Thus, these variables were considered in the final model. It should be noted that variables such as the mean MOR, although reported later in the manuscript, were included only within the correlation-based analysis of the same experimental dataset to identify properties associated with the UPV shift factor and not as independent predictive inputs. This analysis is intended to support mechanistic interpretation, rather than to establish a predictive modeling framework. Accordingly, a multiple linear regression model was developed to describe the relationship between Y and selected mixture variables (Equation (6)):
Y =   13,480 + 1322 V 9 + 757 V 16  
Equation (6) is used to analyze relationships between the UPV response and mixture characteristics within the dataset and is not intended for strength prediction or mixture design.
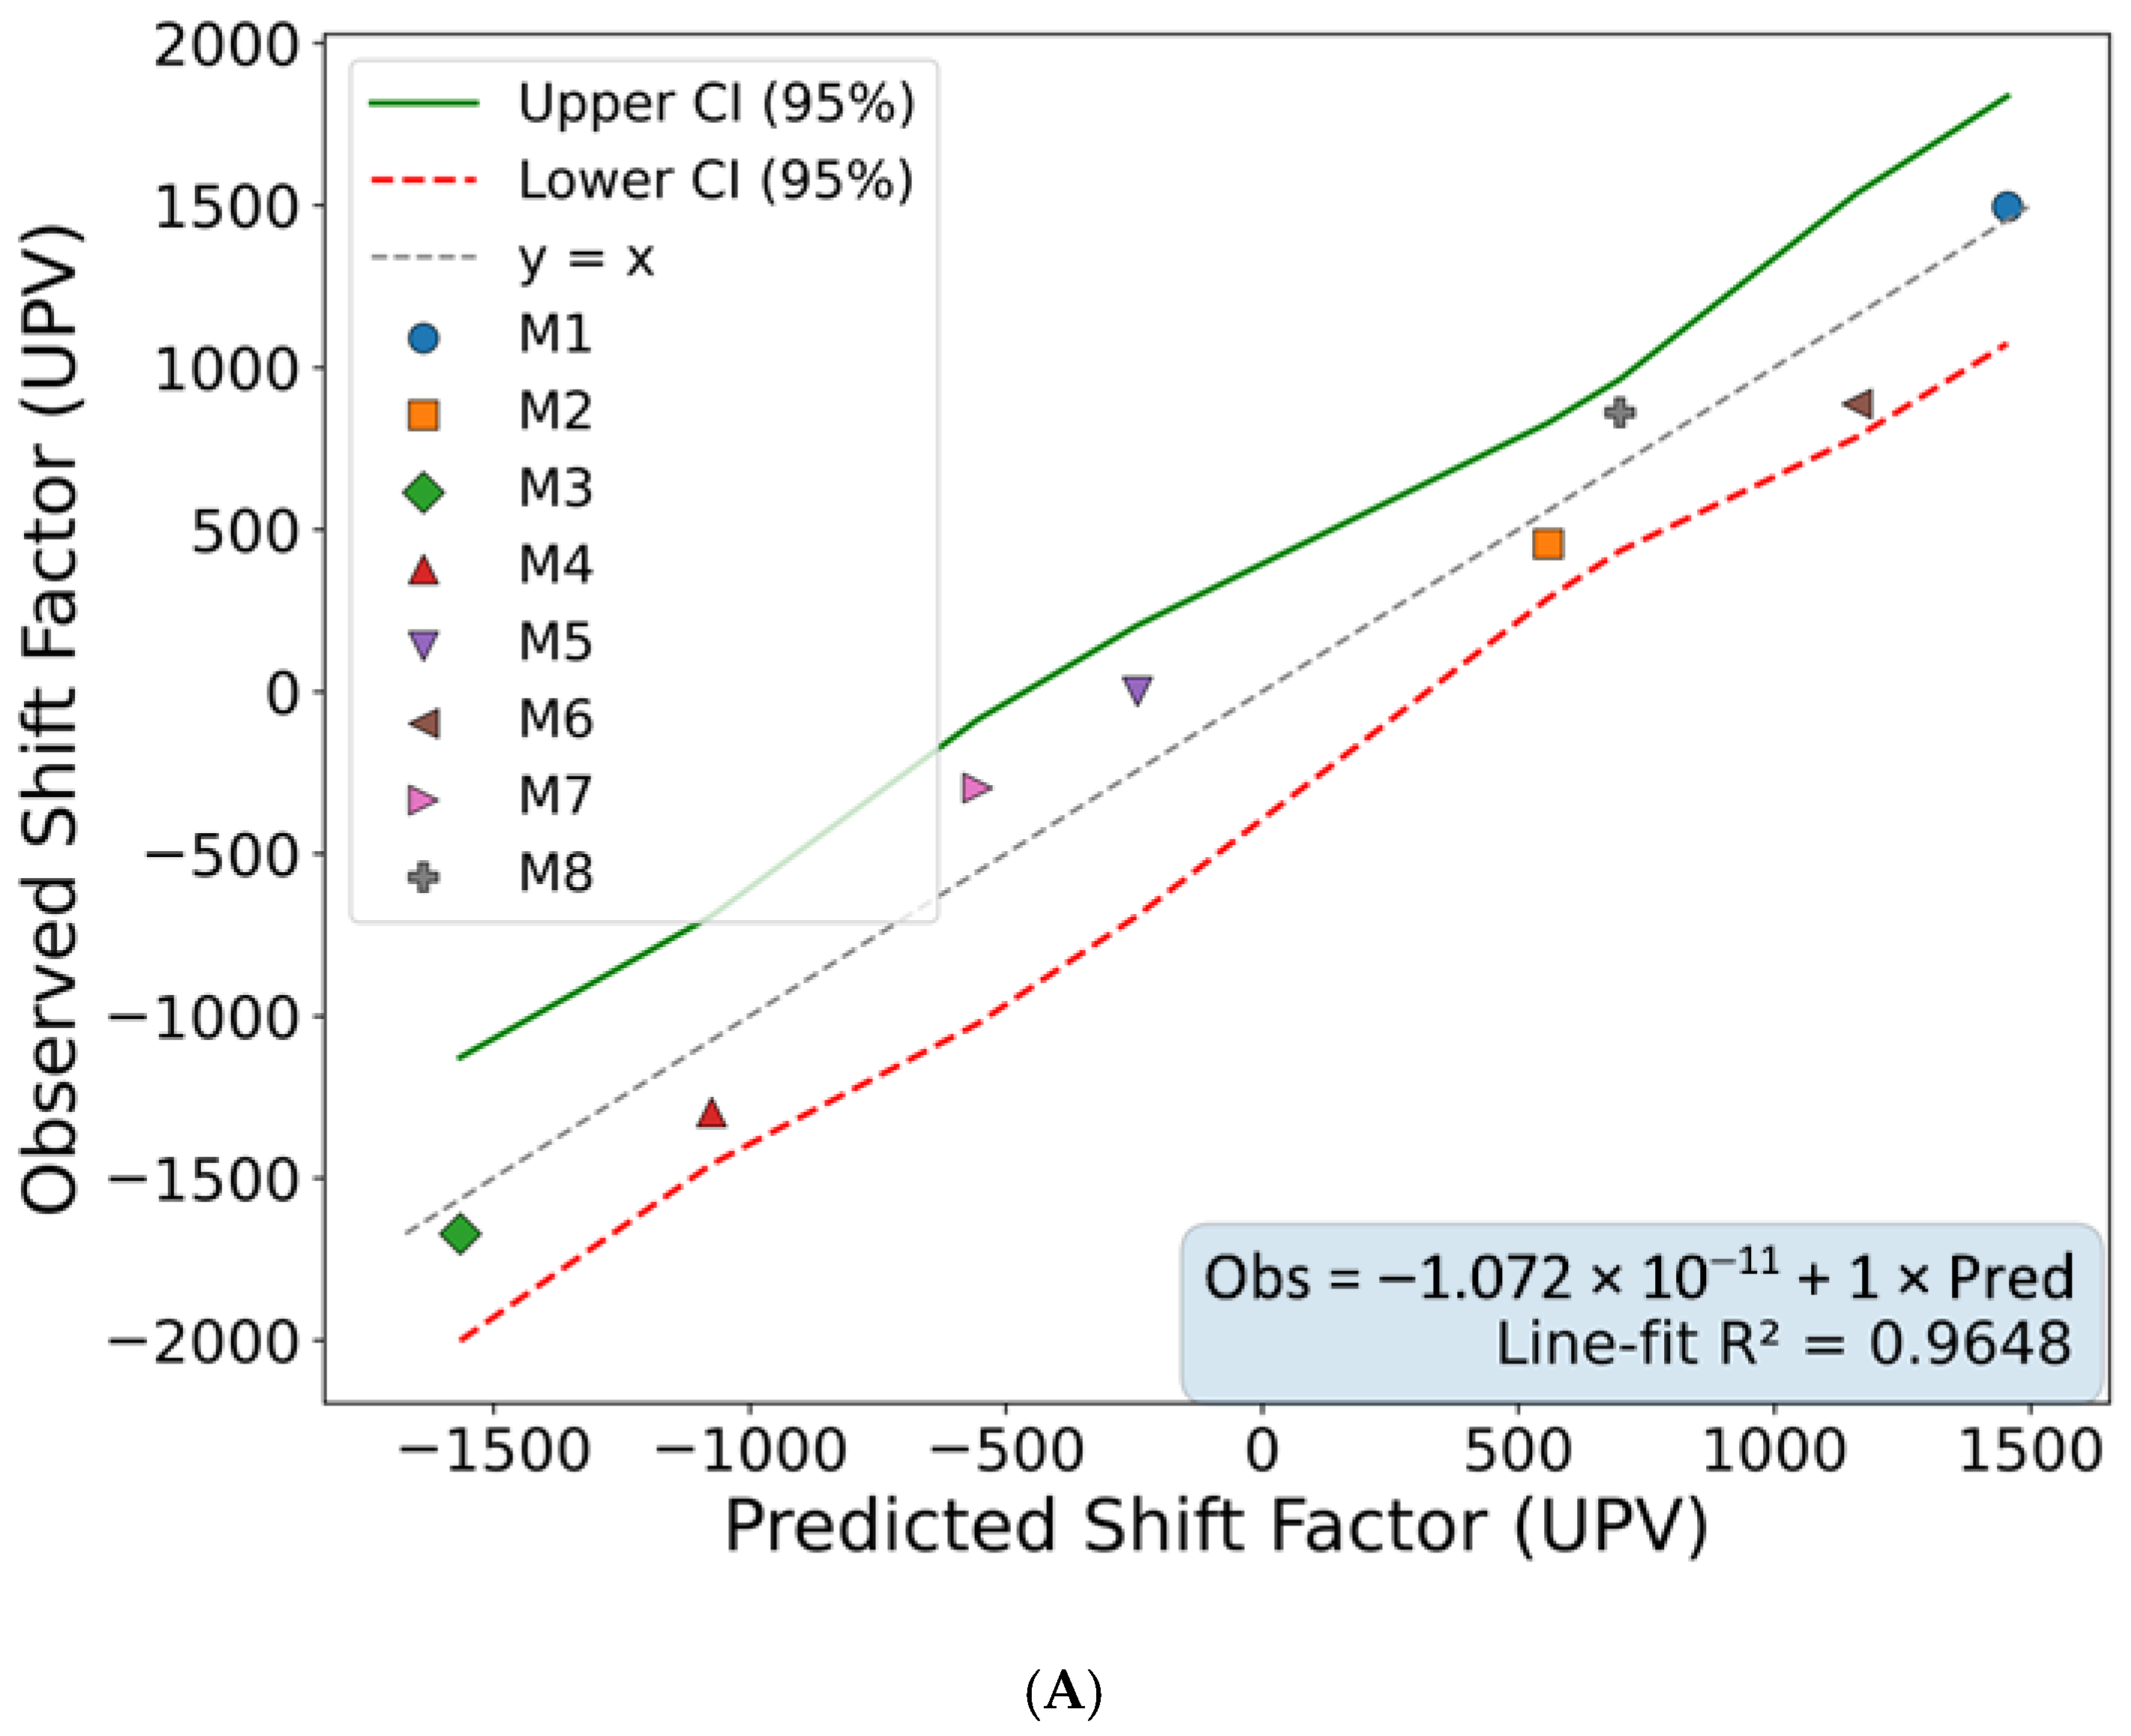
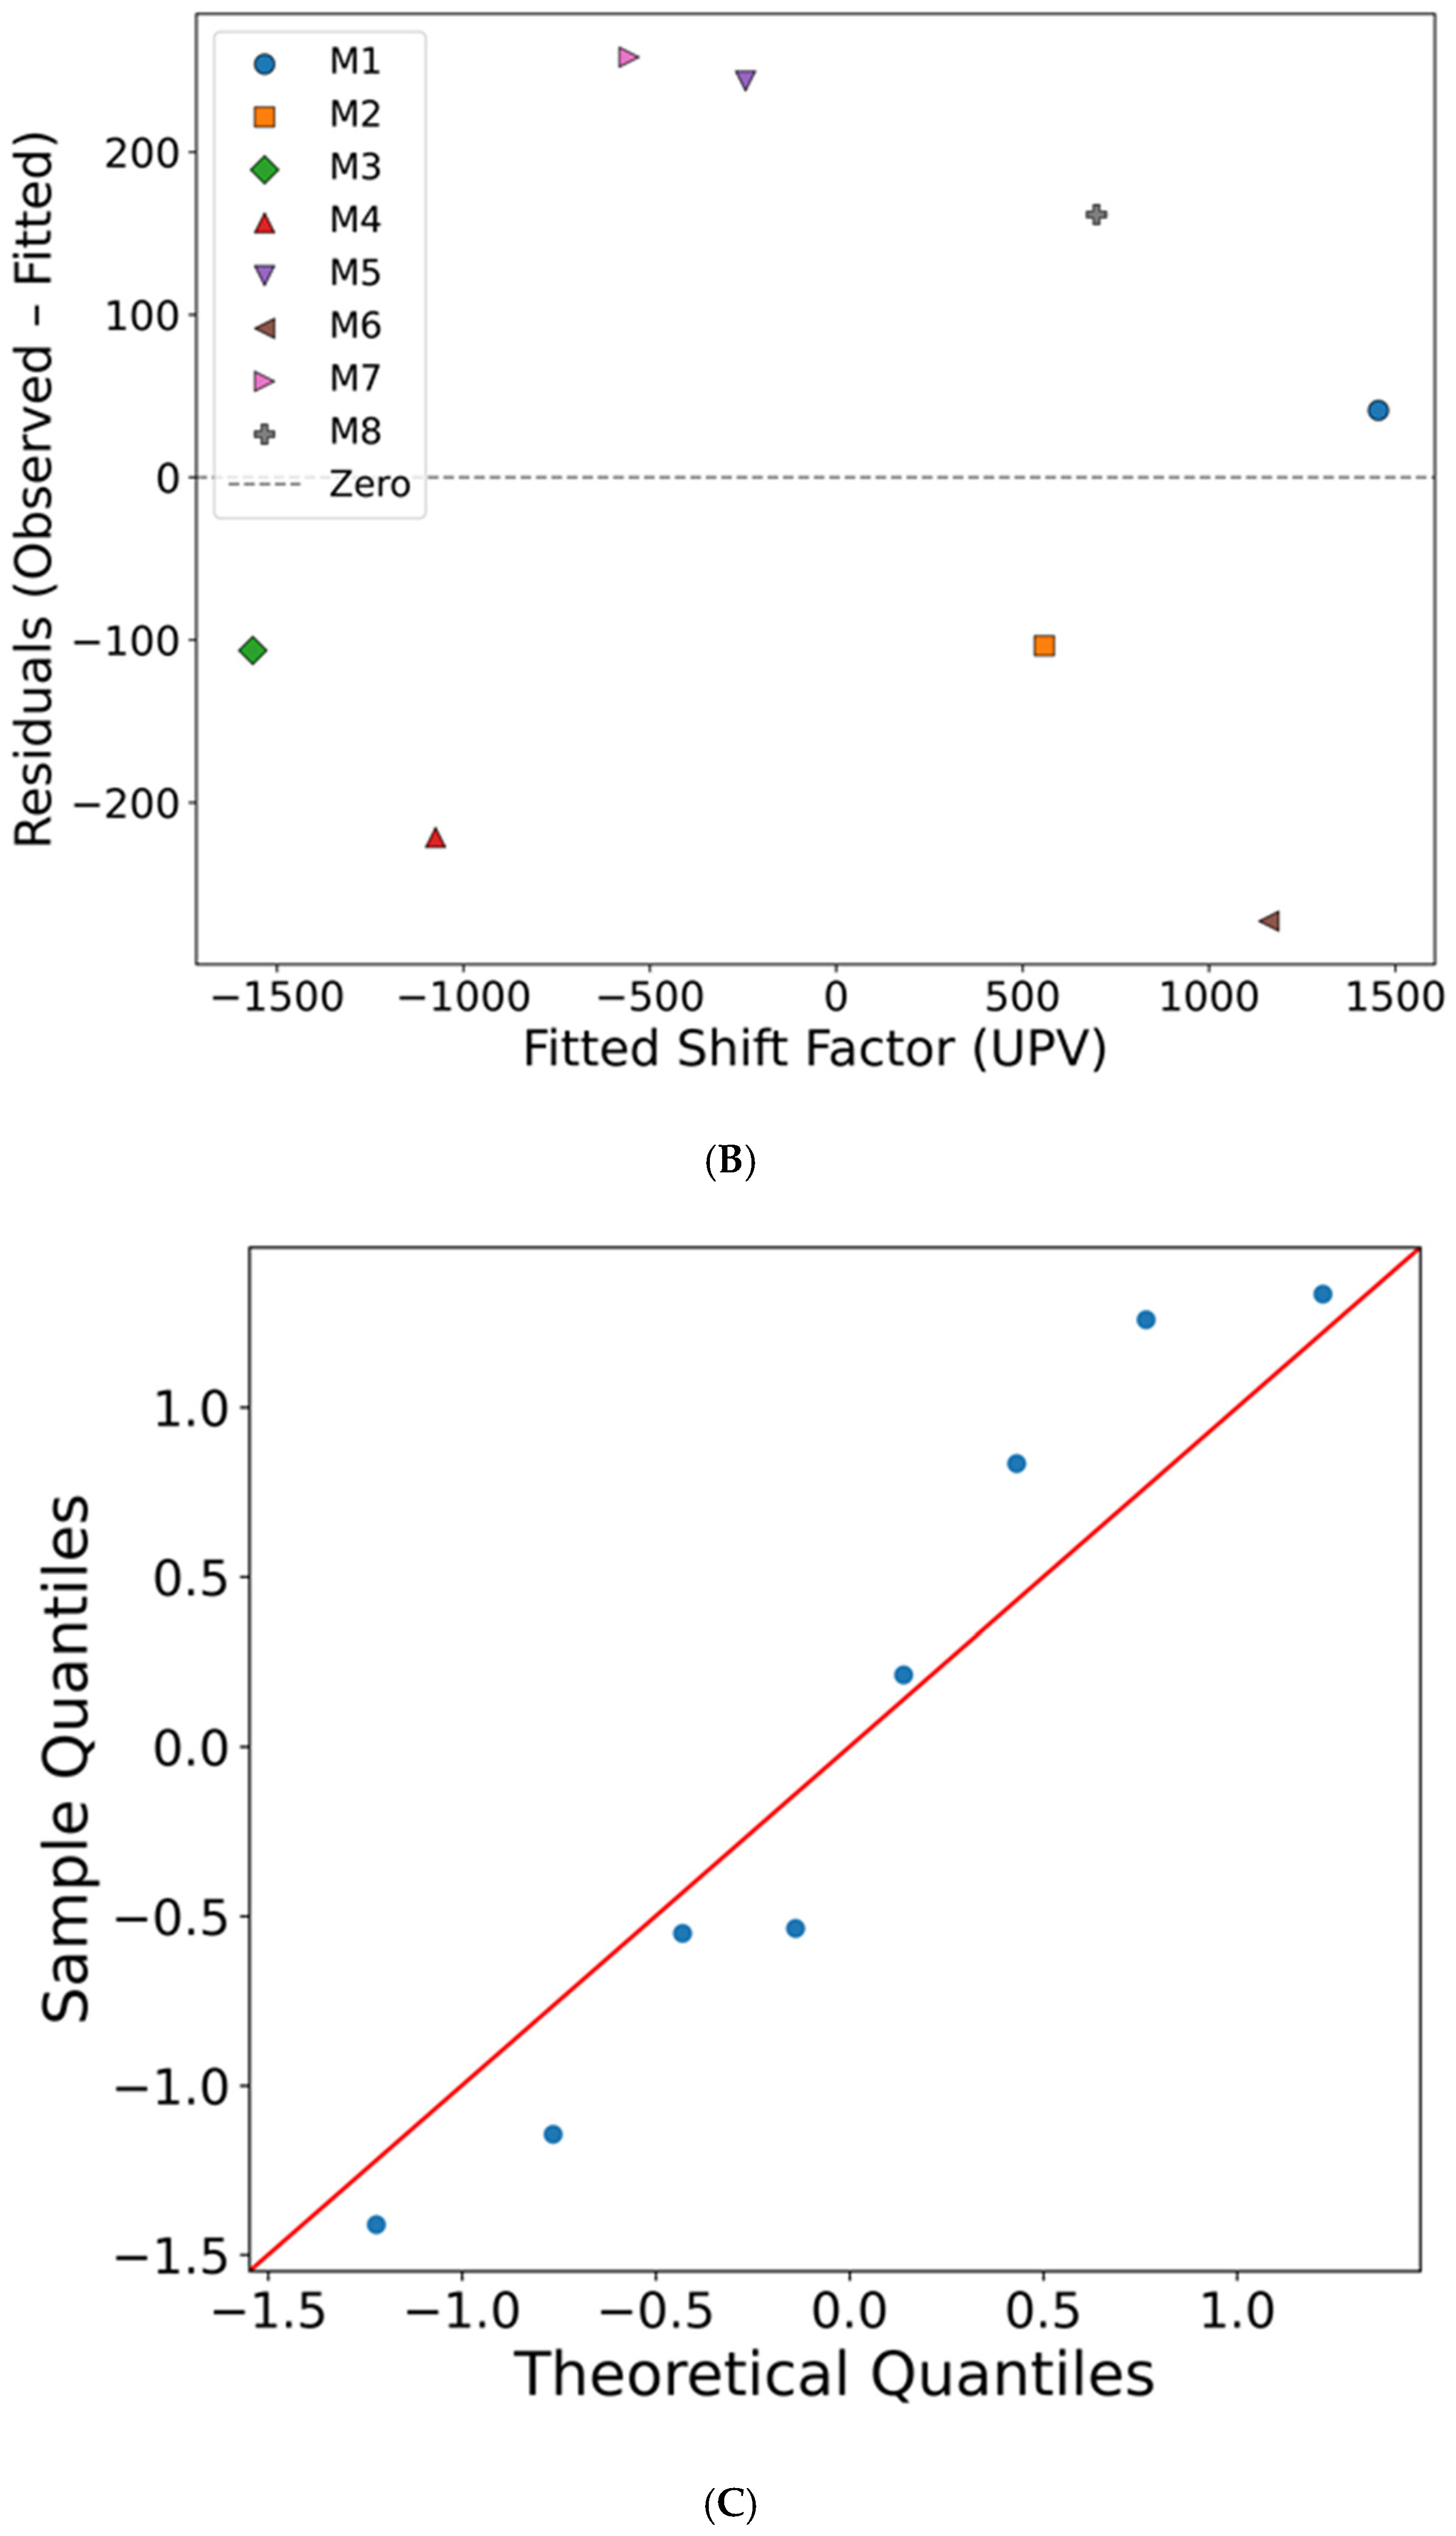
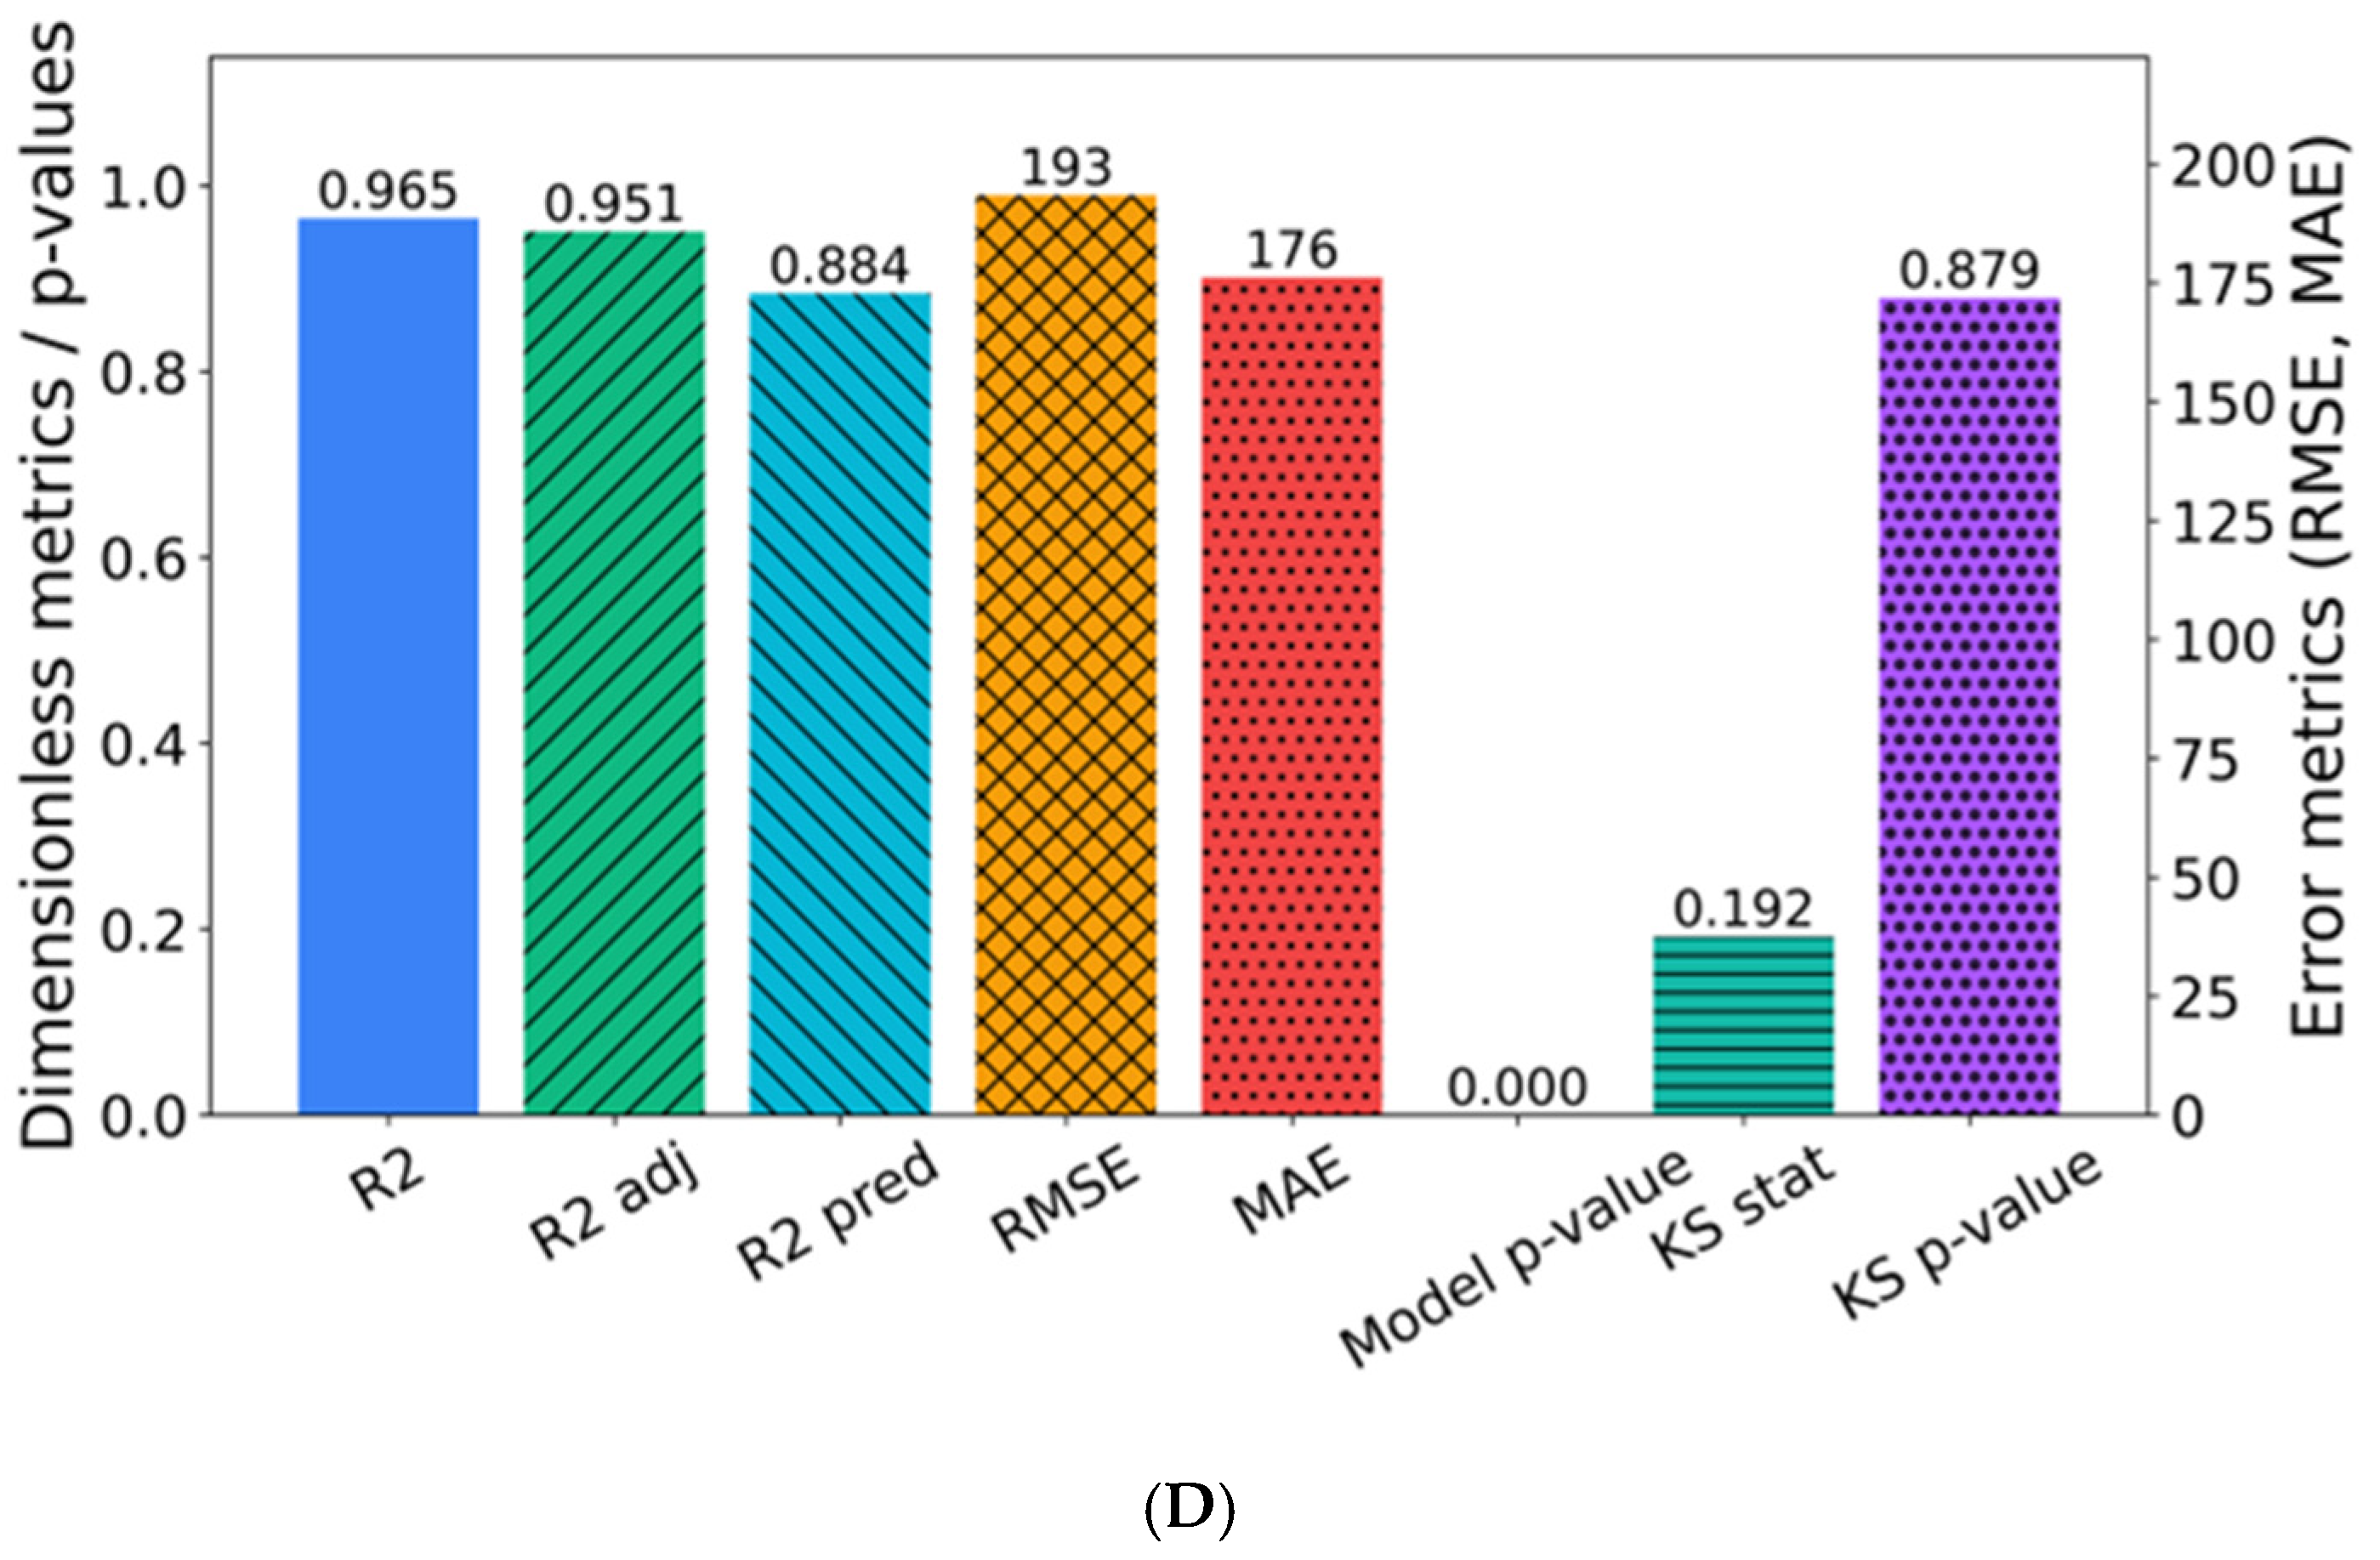
Model performance is summarized in Figure 10. In panel (A), the predicted and observed shift factors show strong agreement, with all data points lying within the 95% confidence bounds. In panel (B), the residuals are randomly distributed around zero, indicating homoscedasticity. The Q–Q plot in panel (C), together with the Kolmogorov–Smirnov test (p > 0.05), confirms that the residuals do not significantly deviate from normality. Finally, panel (D) shows high model performance, with  R 2 = 0.965, R a d j 2 = 0.951, R p r e d 2 = 0.884, R M S E = 193, and M A E = 176. The gap (i.e., difference) between R 2 and R pred 2 , together with the moderate R M S E and M A E , suggests that overfitting is limited. Overall, the model provides a stable and generalizable representation of the UPV shift factor within the dataset studied.

3.3. Hardened Concrete Properties

3.3.1. Mechanical Properties of Hardened Concrete

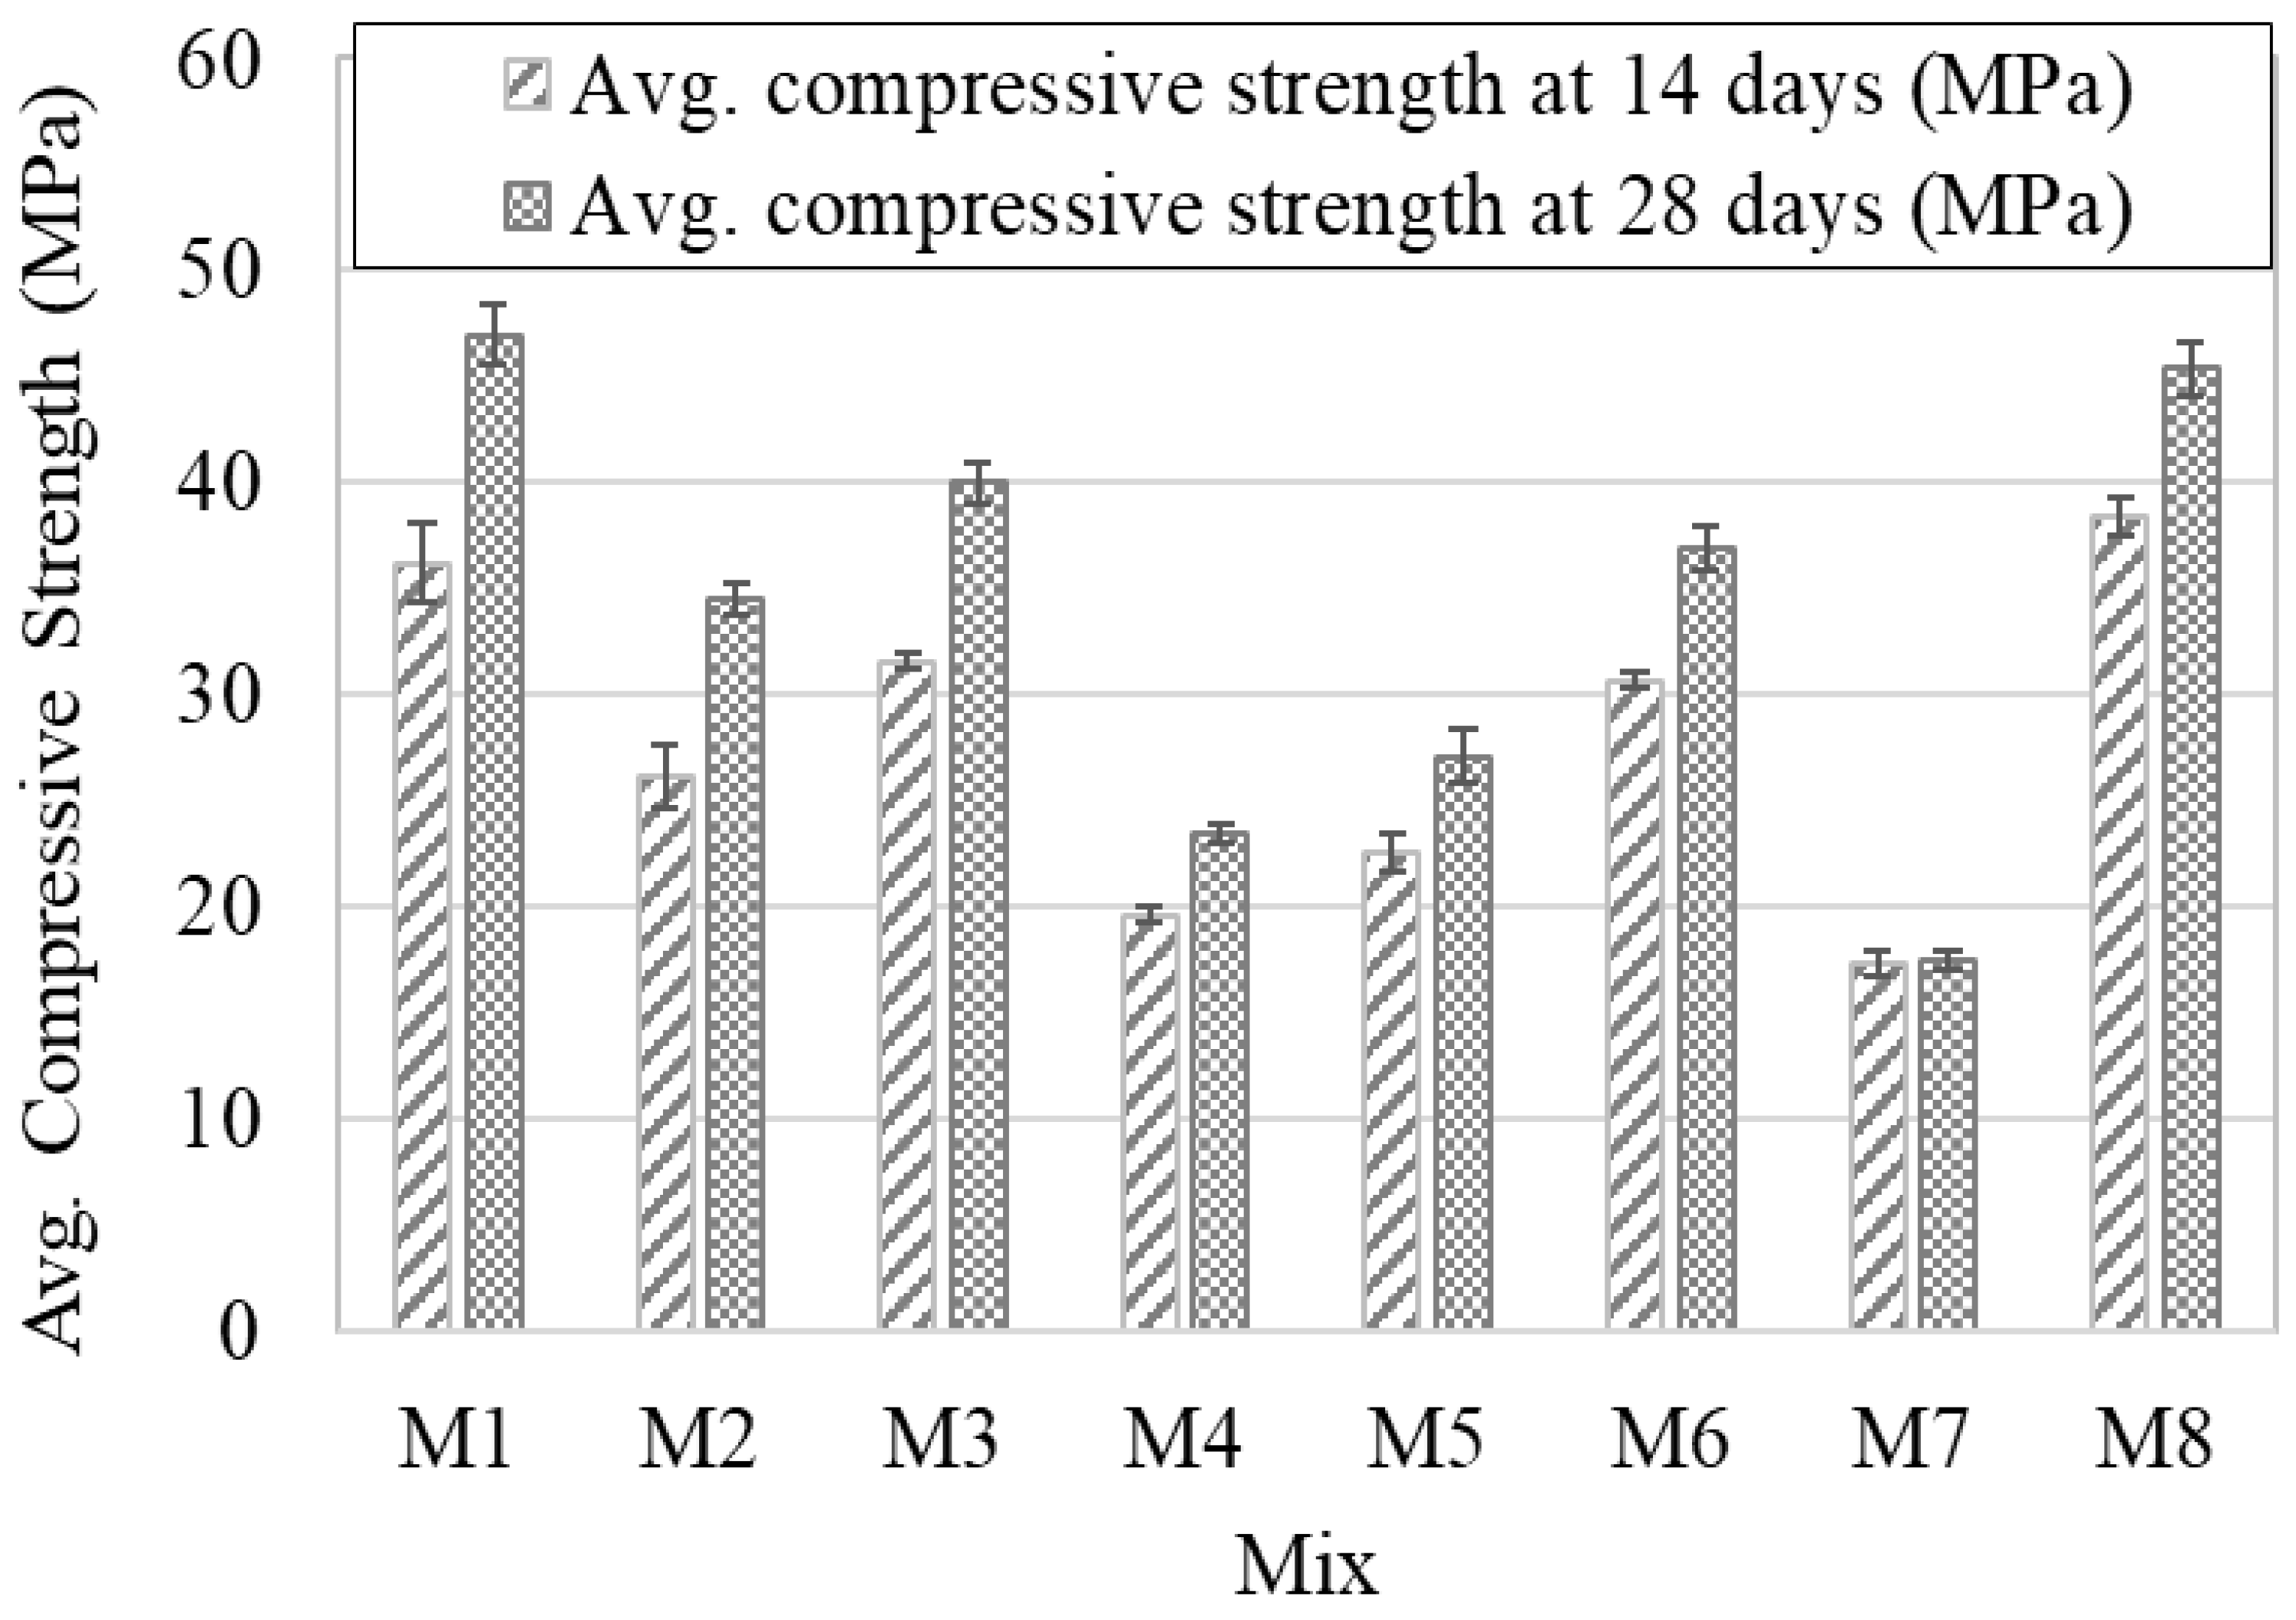
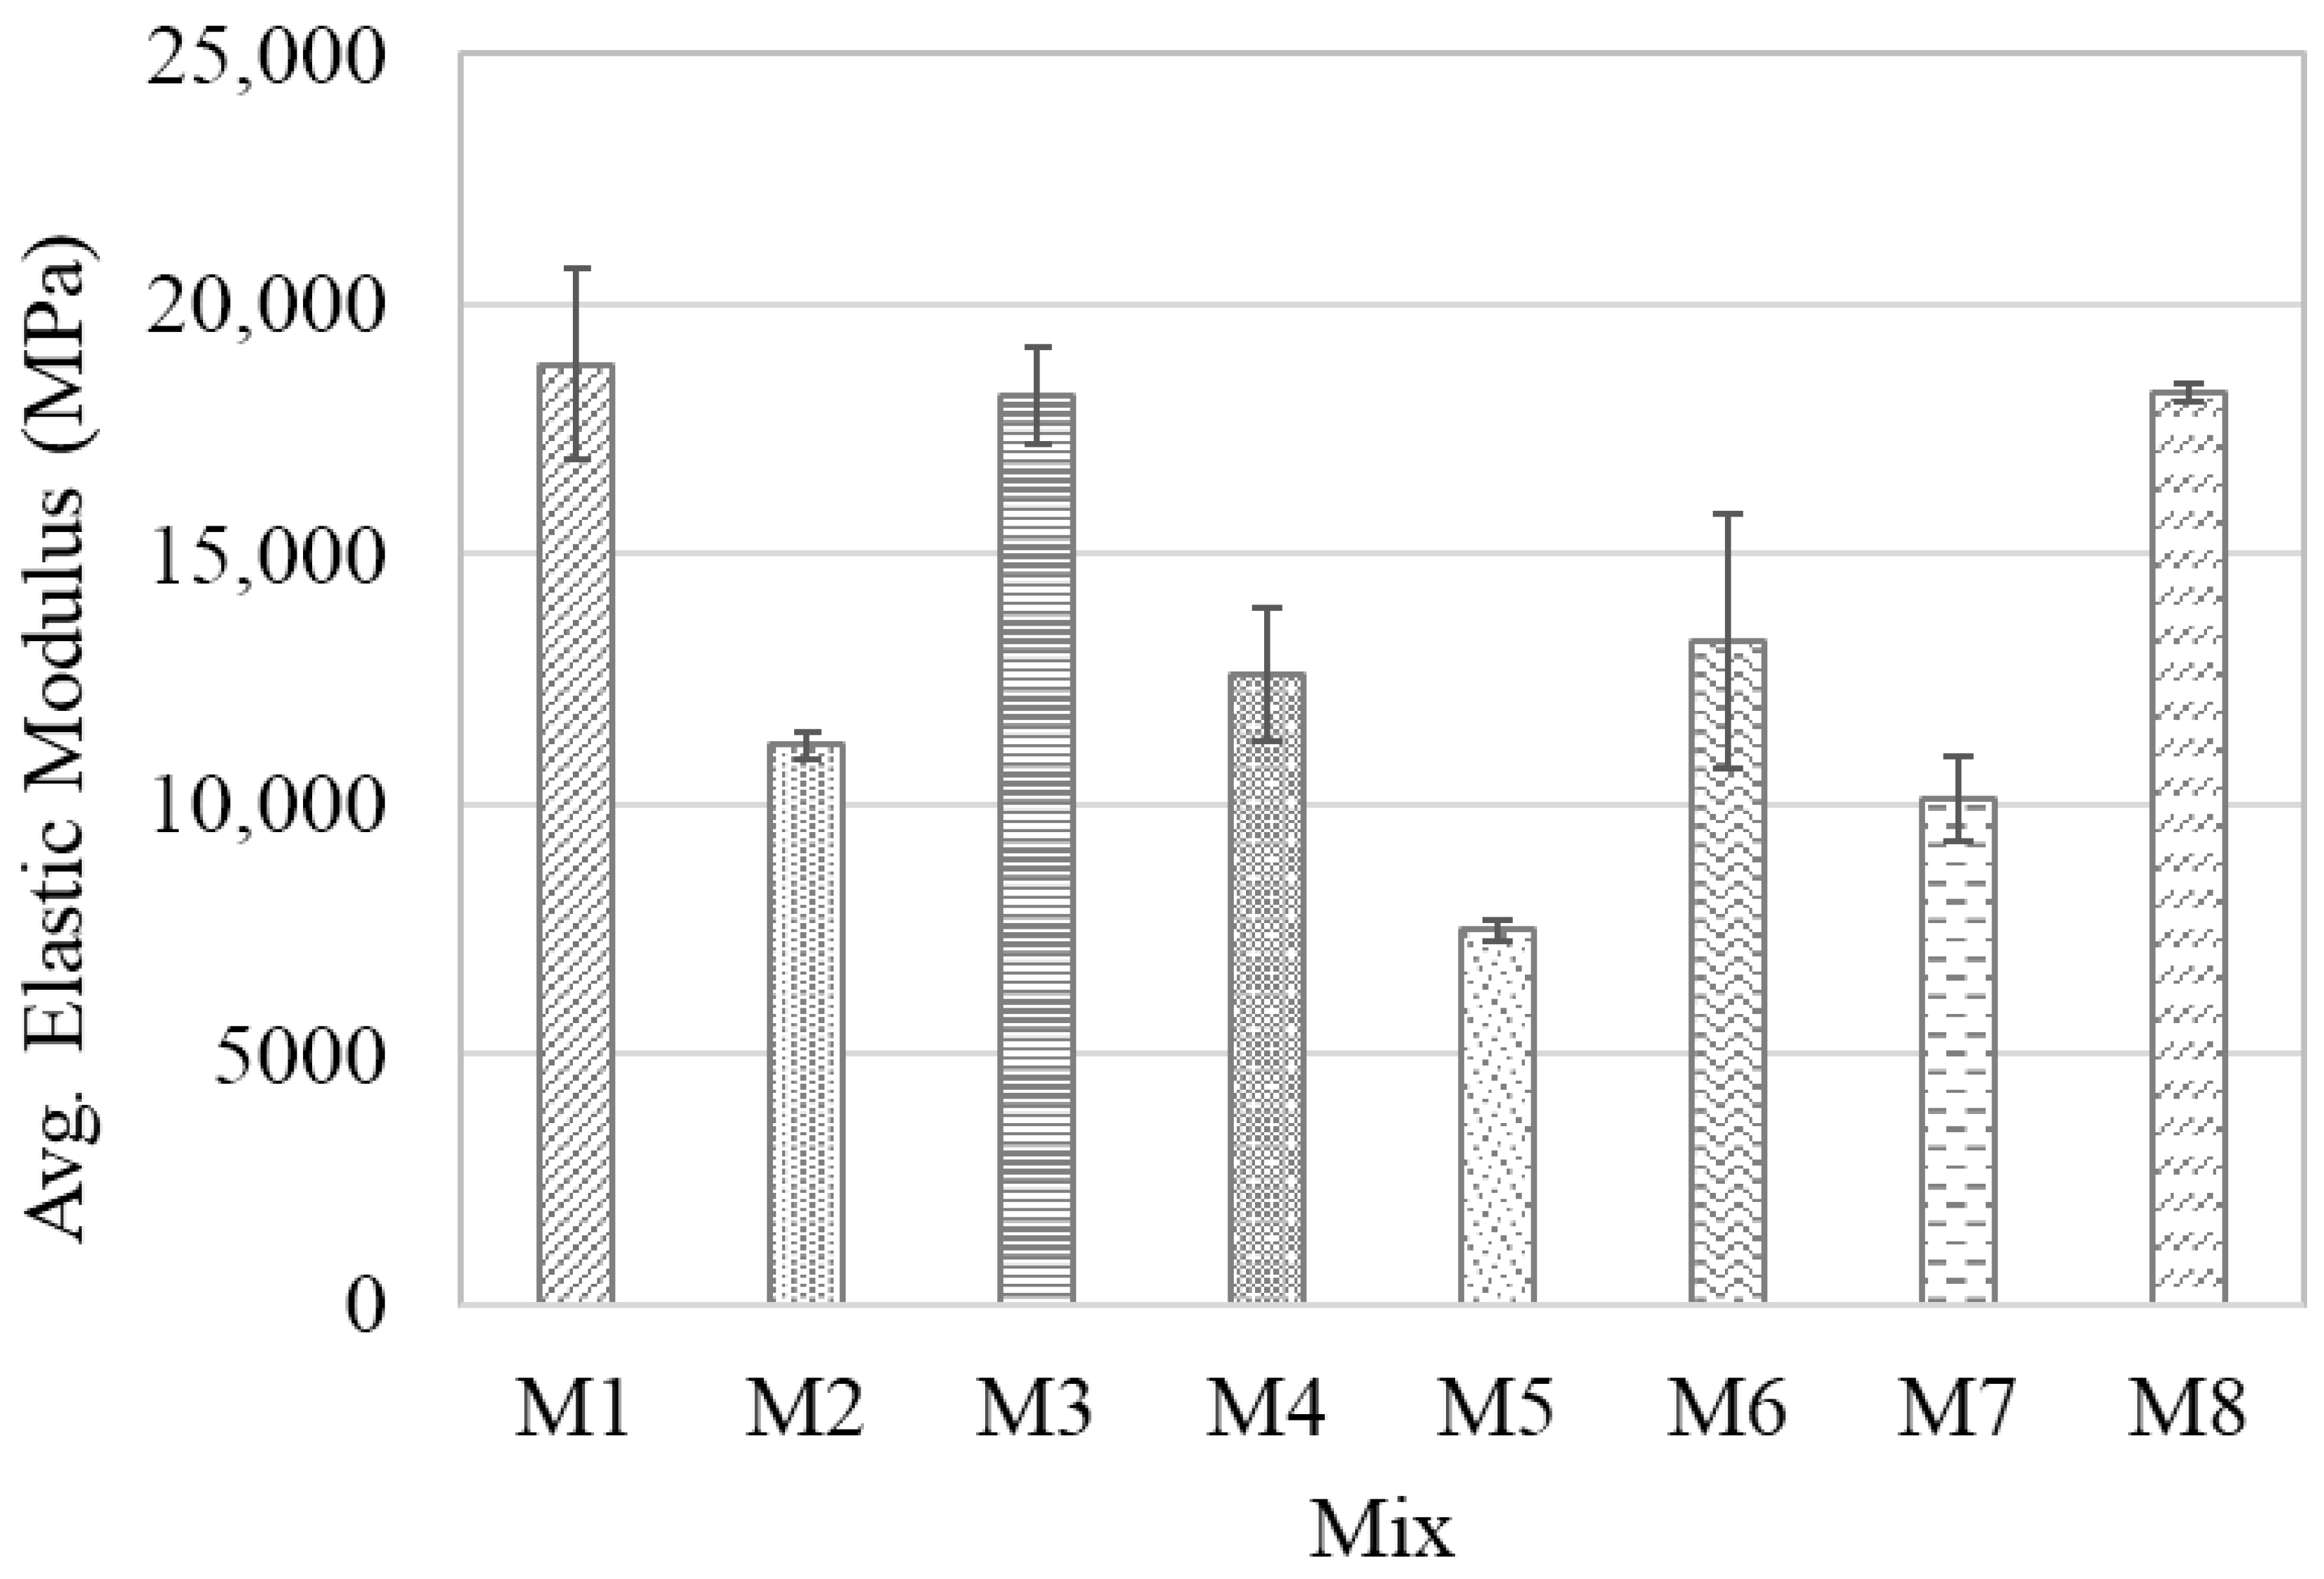
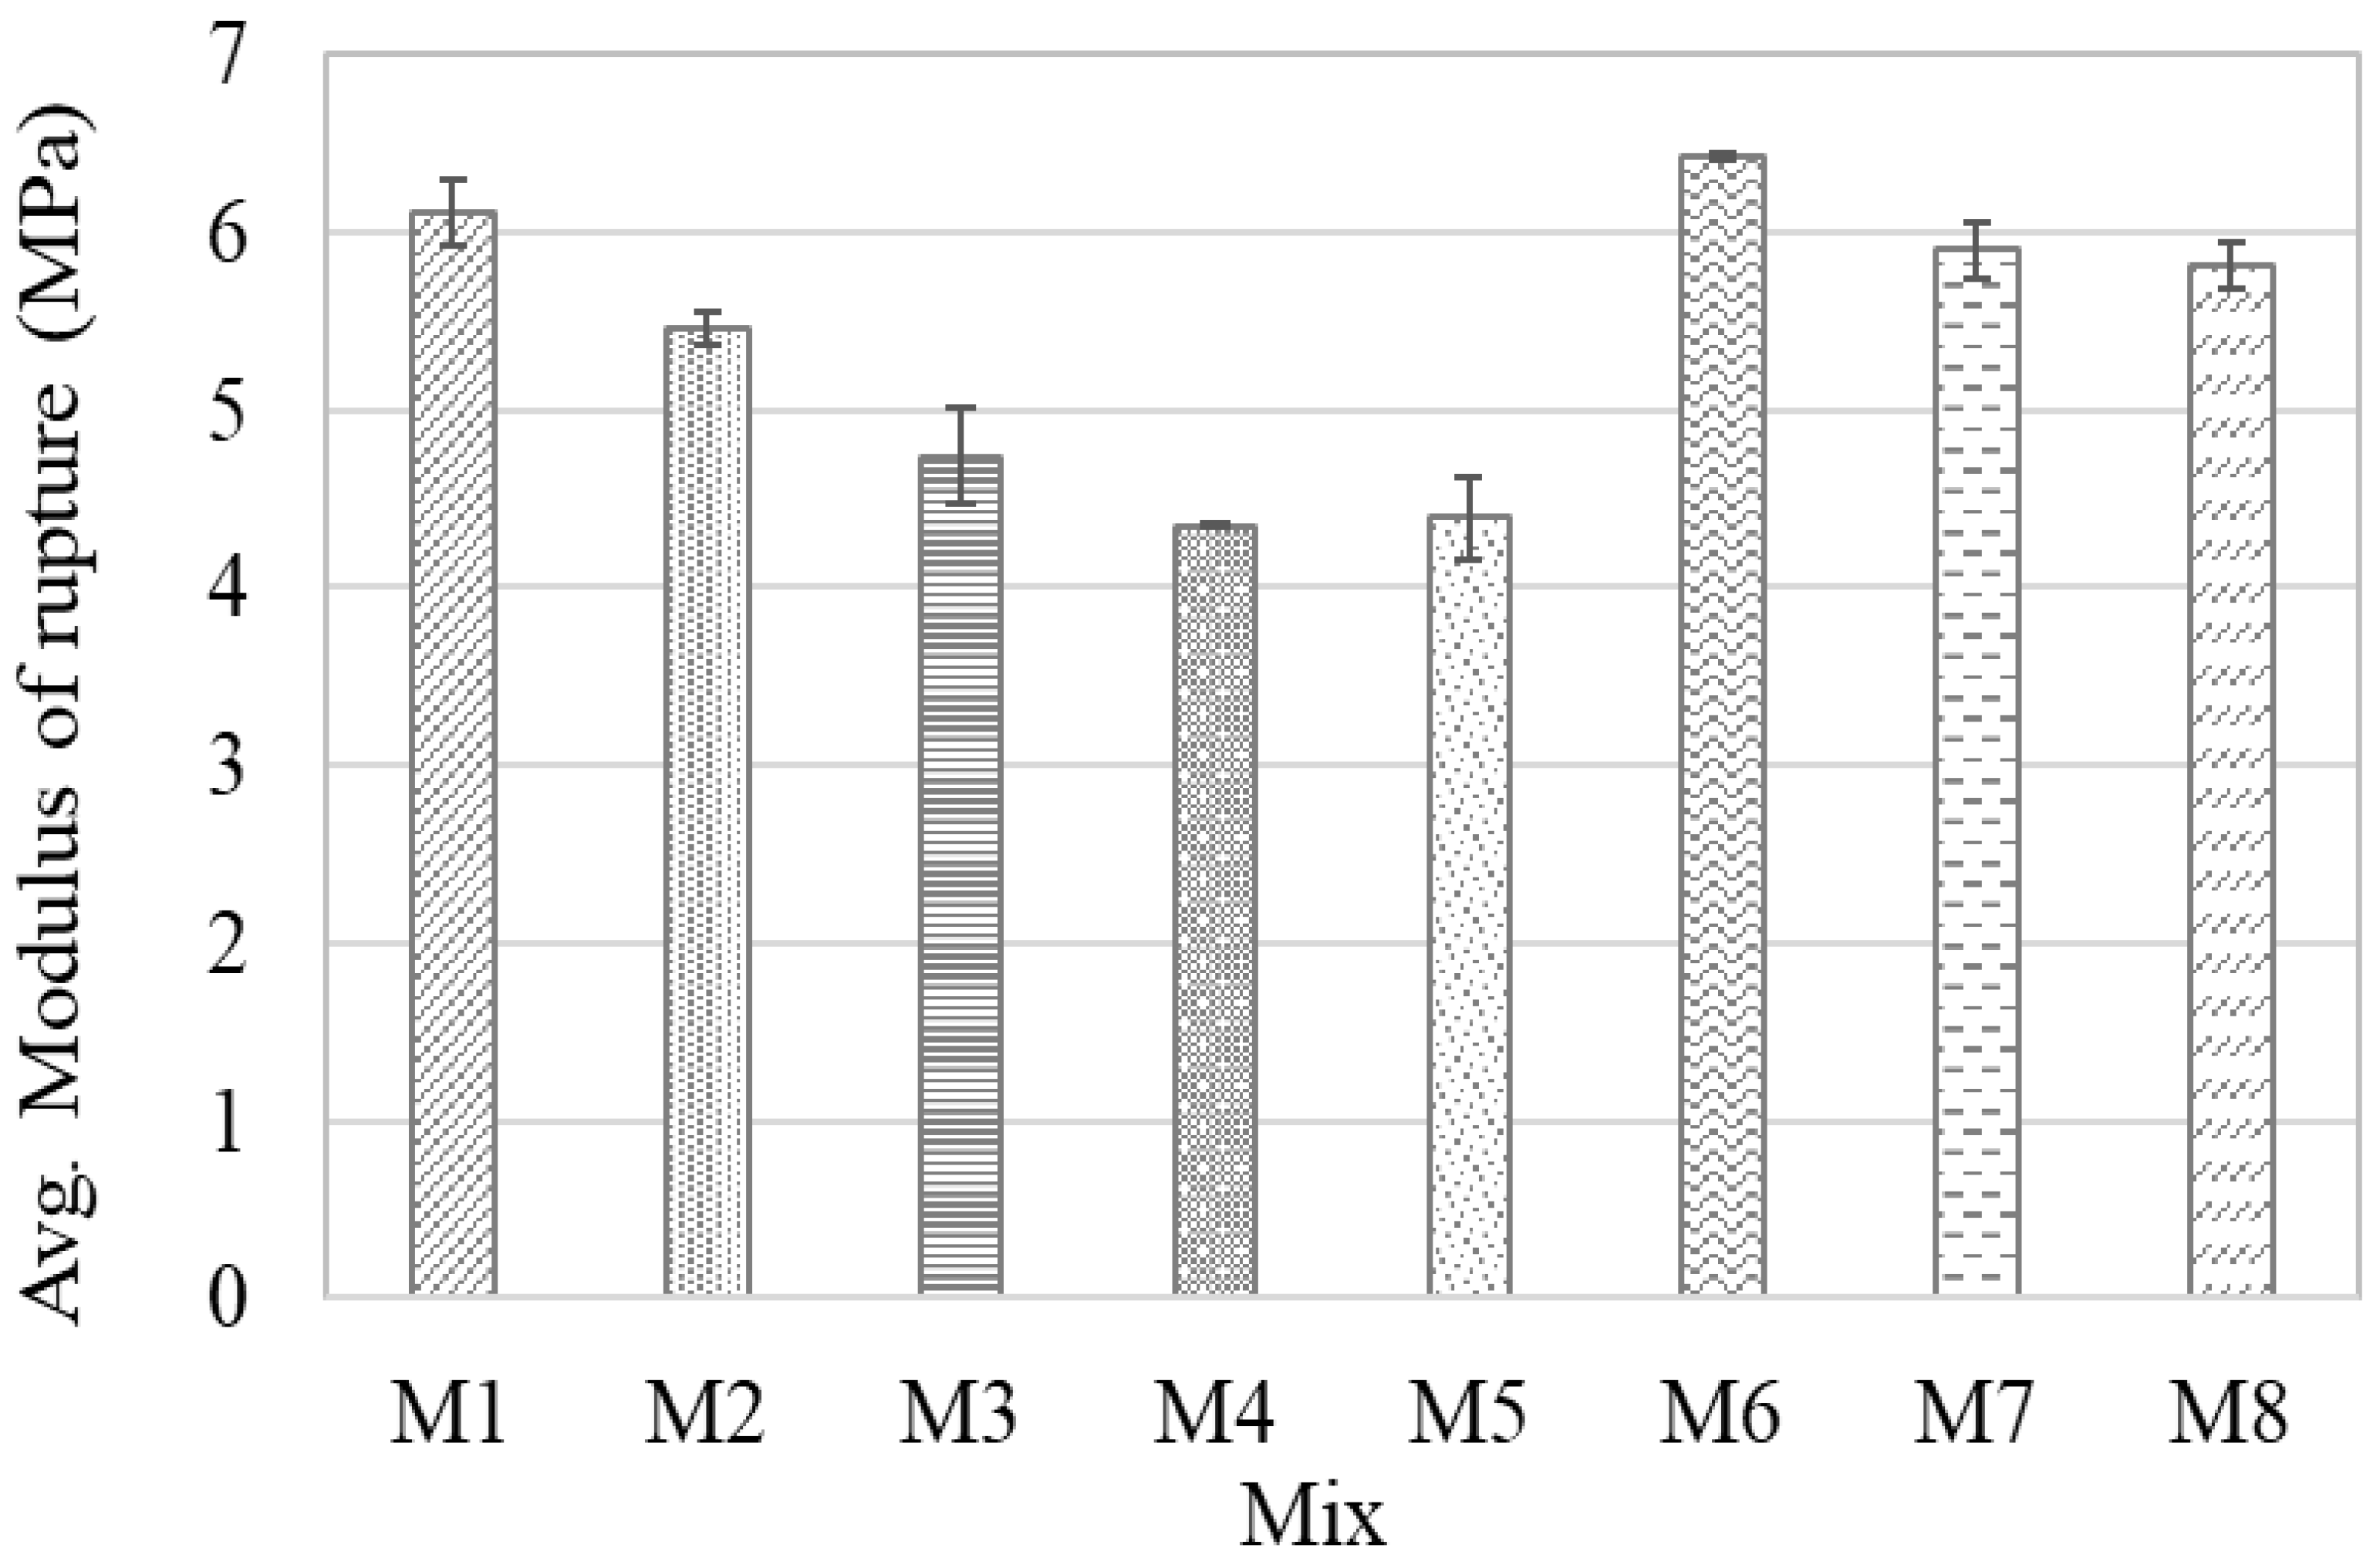
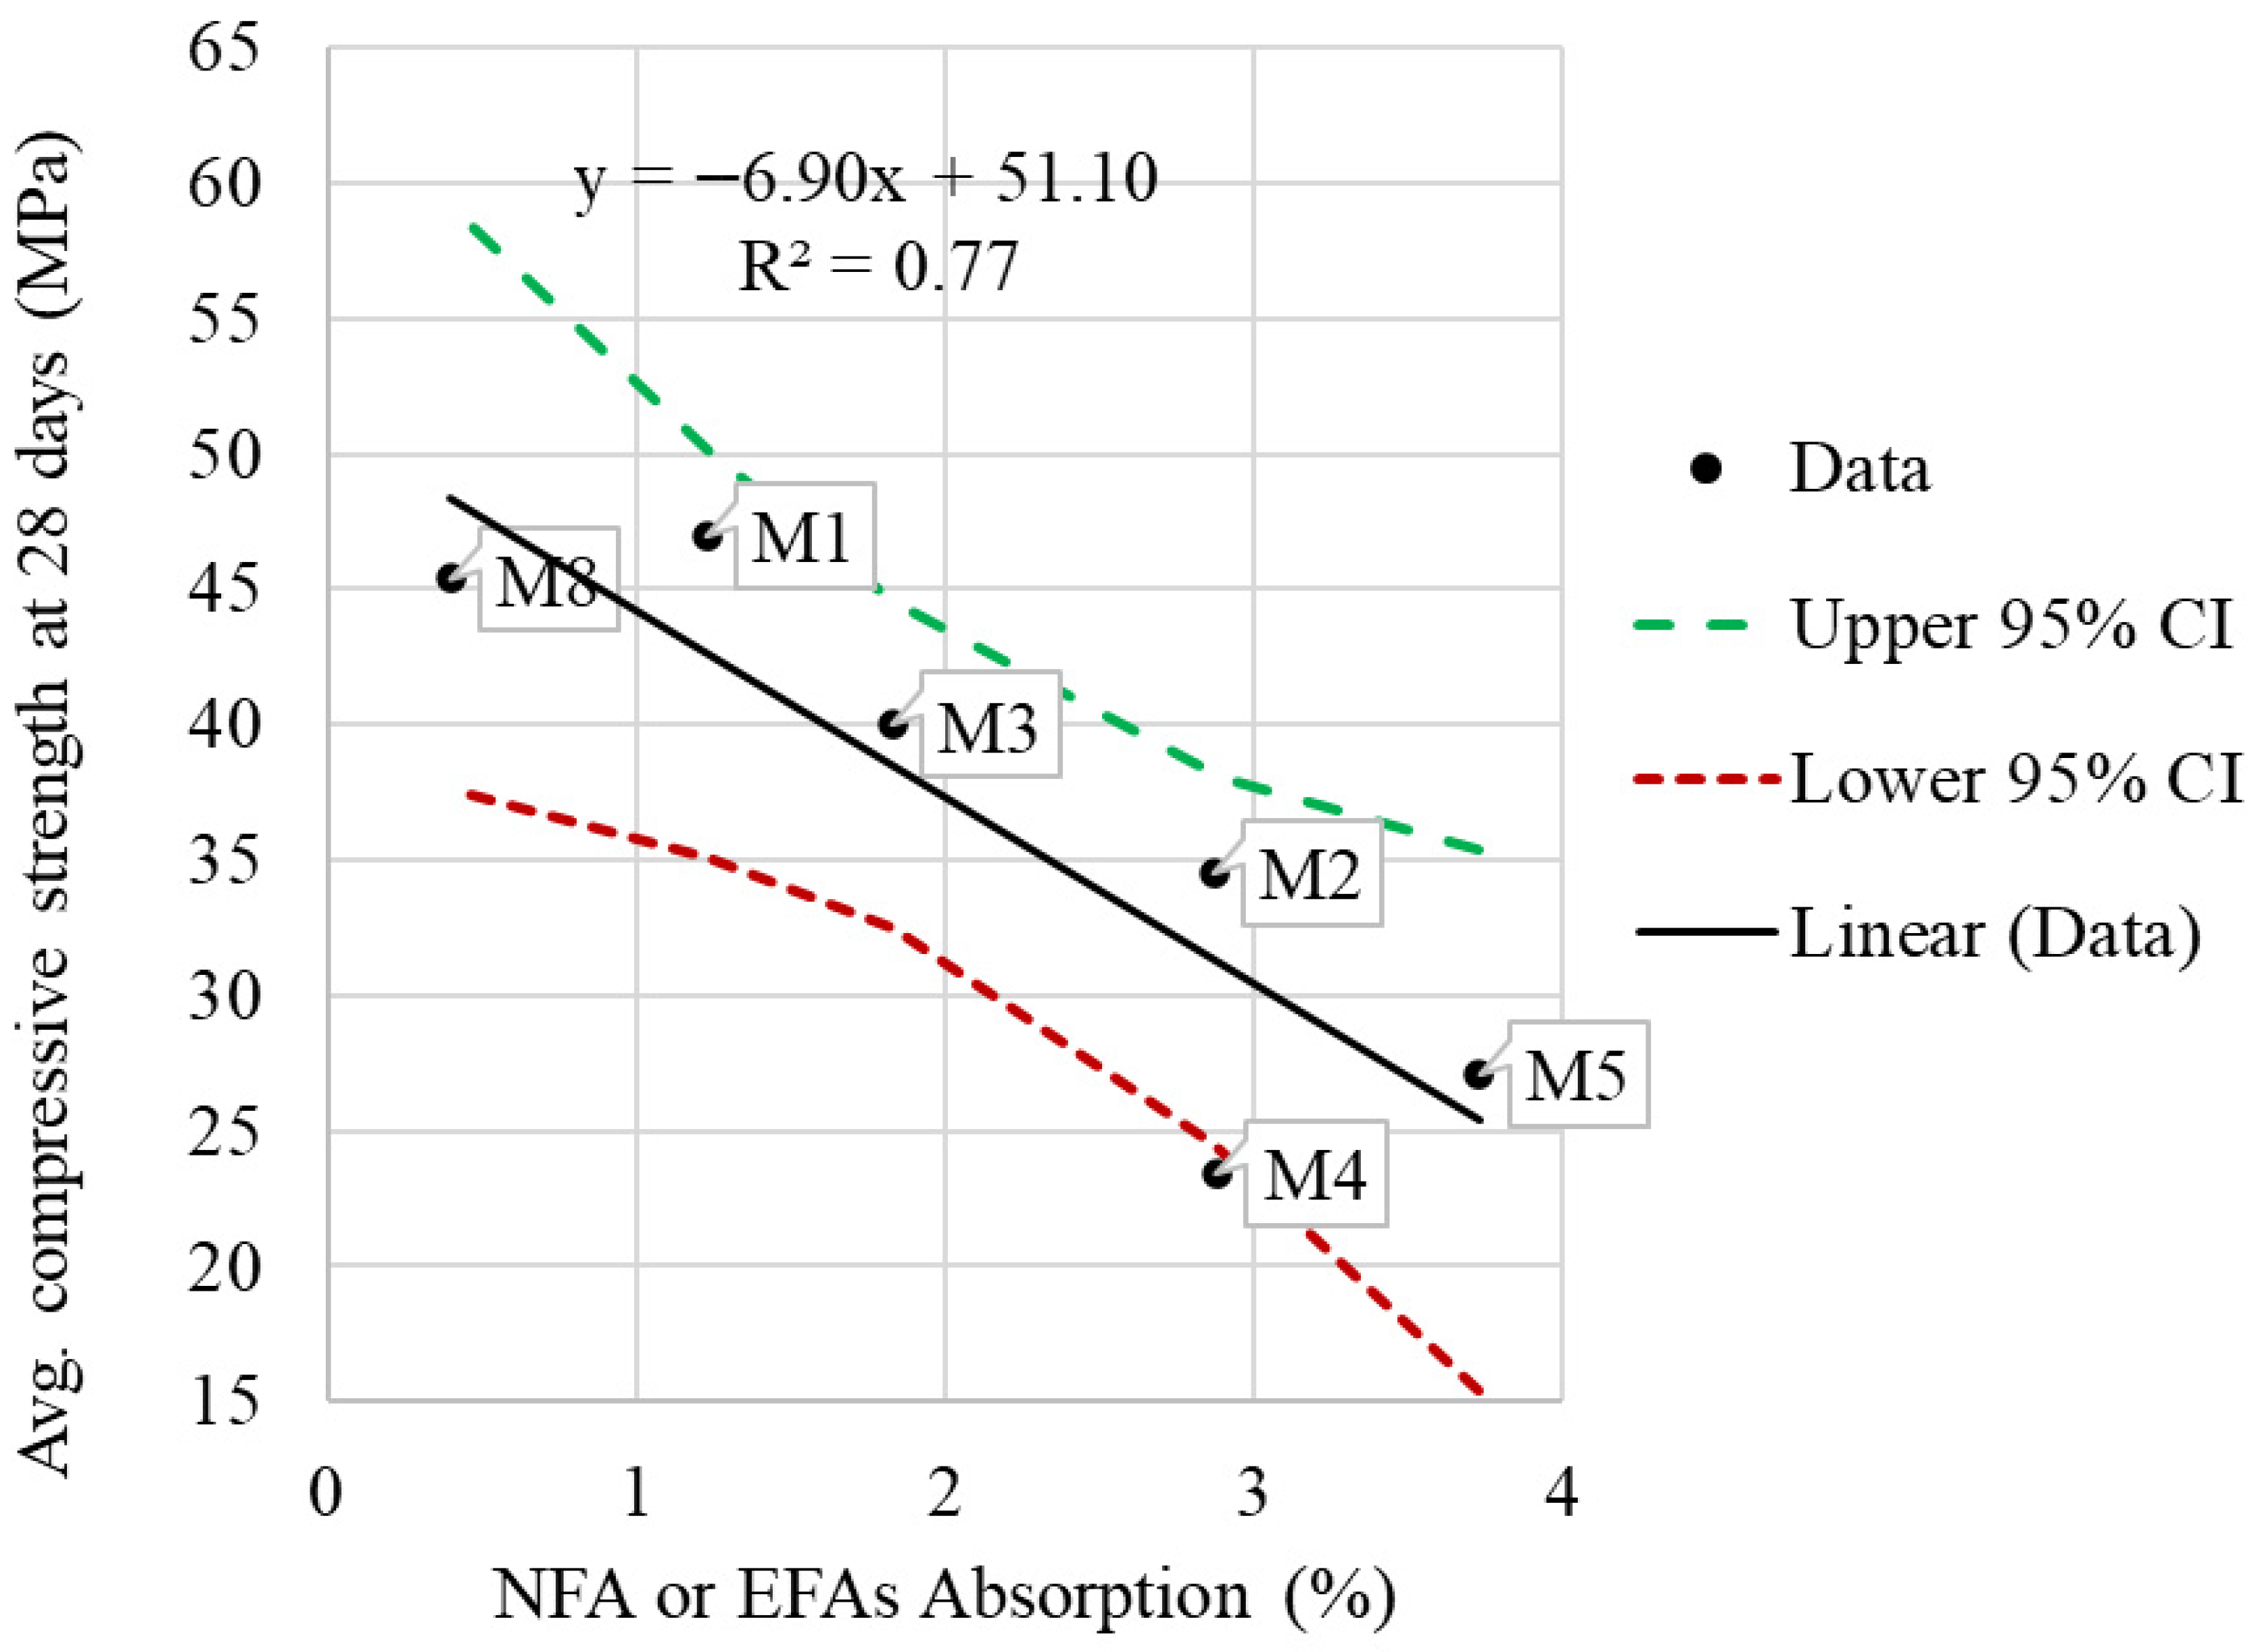
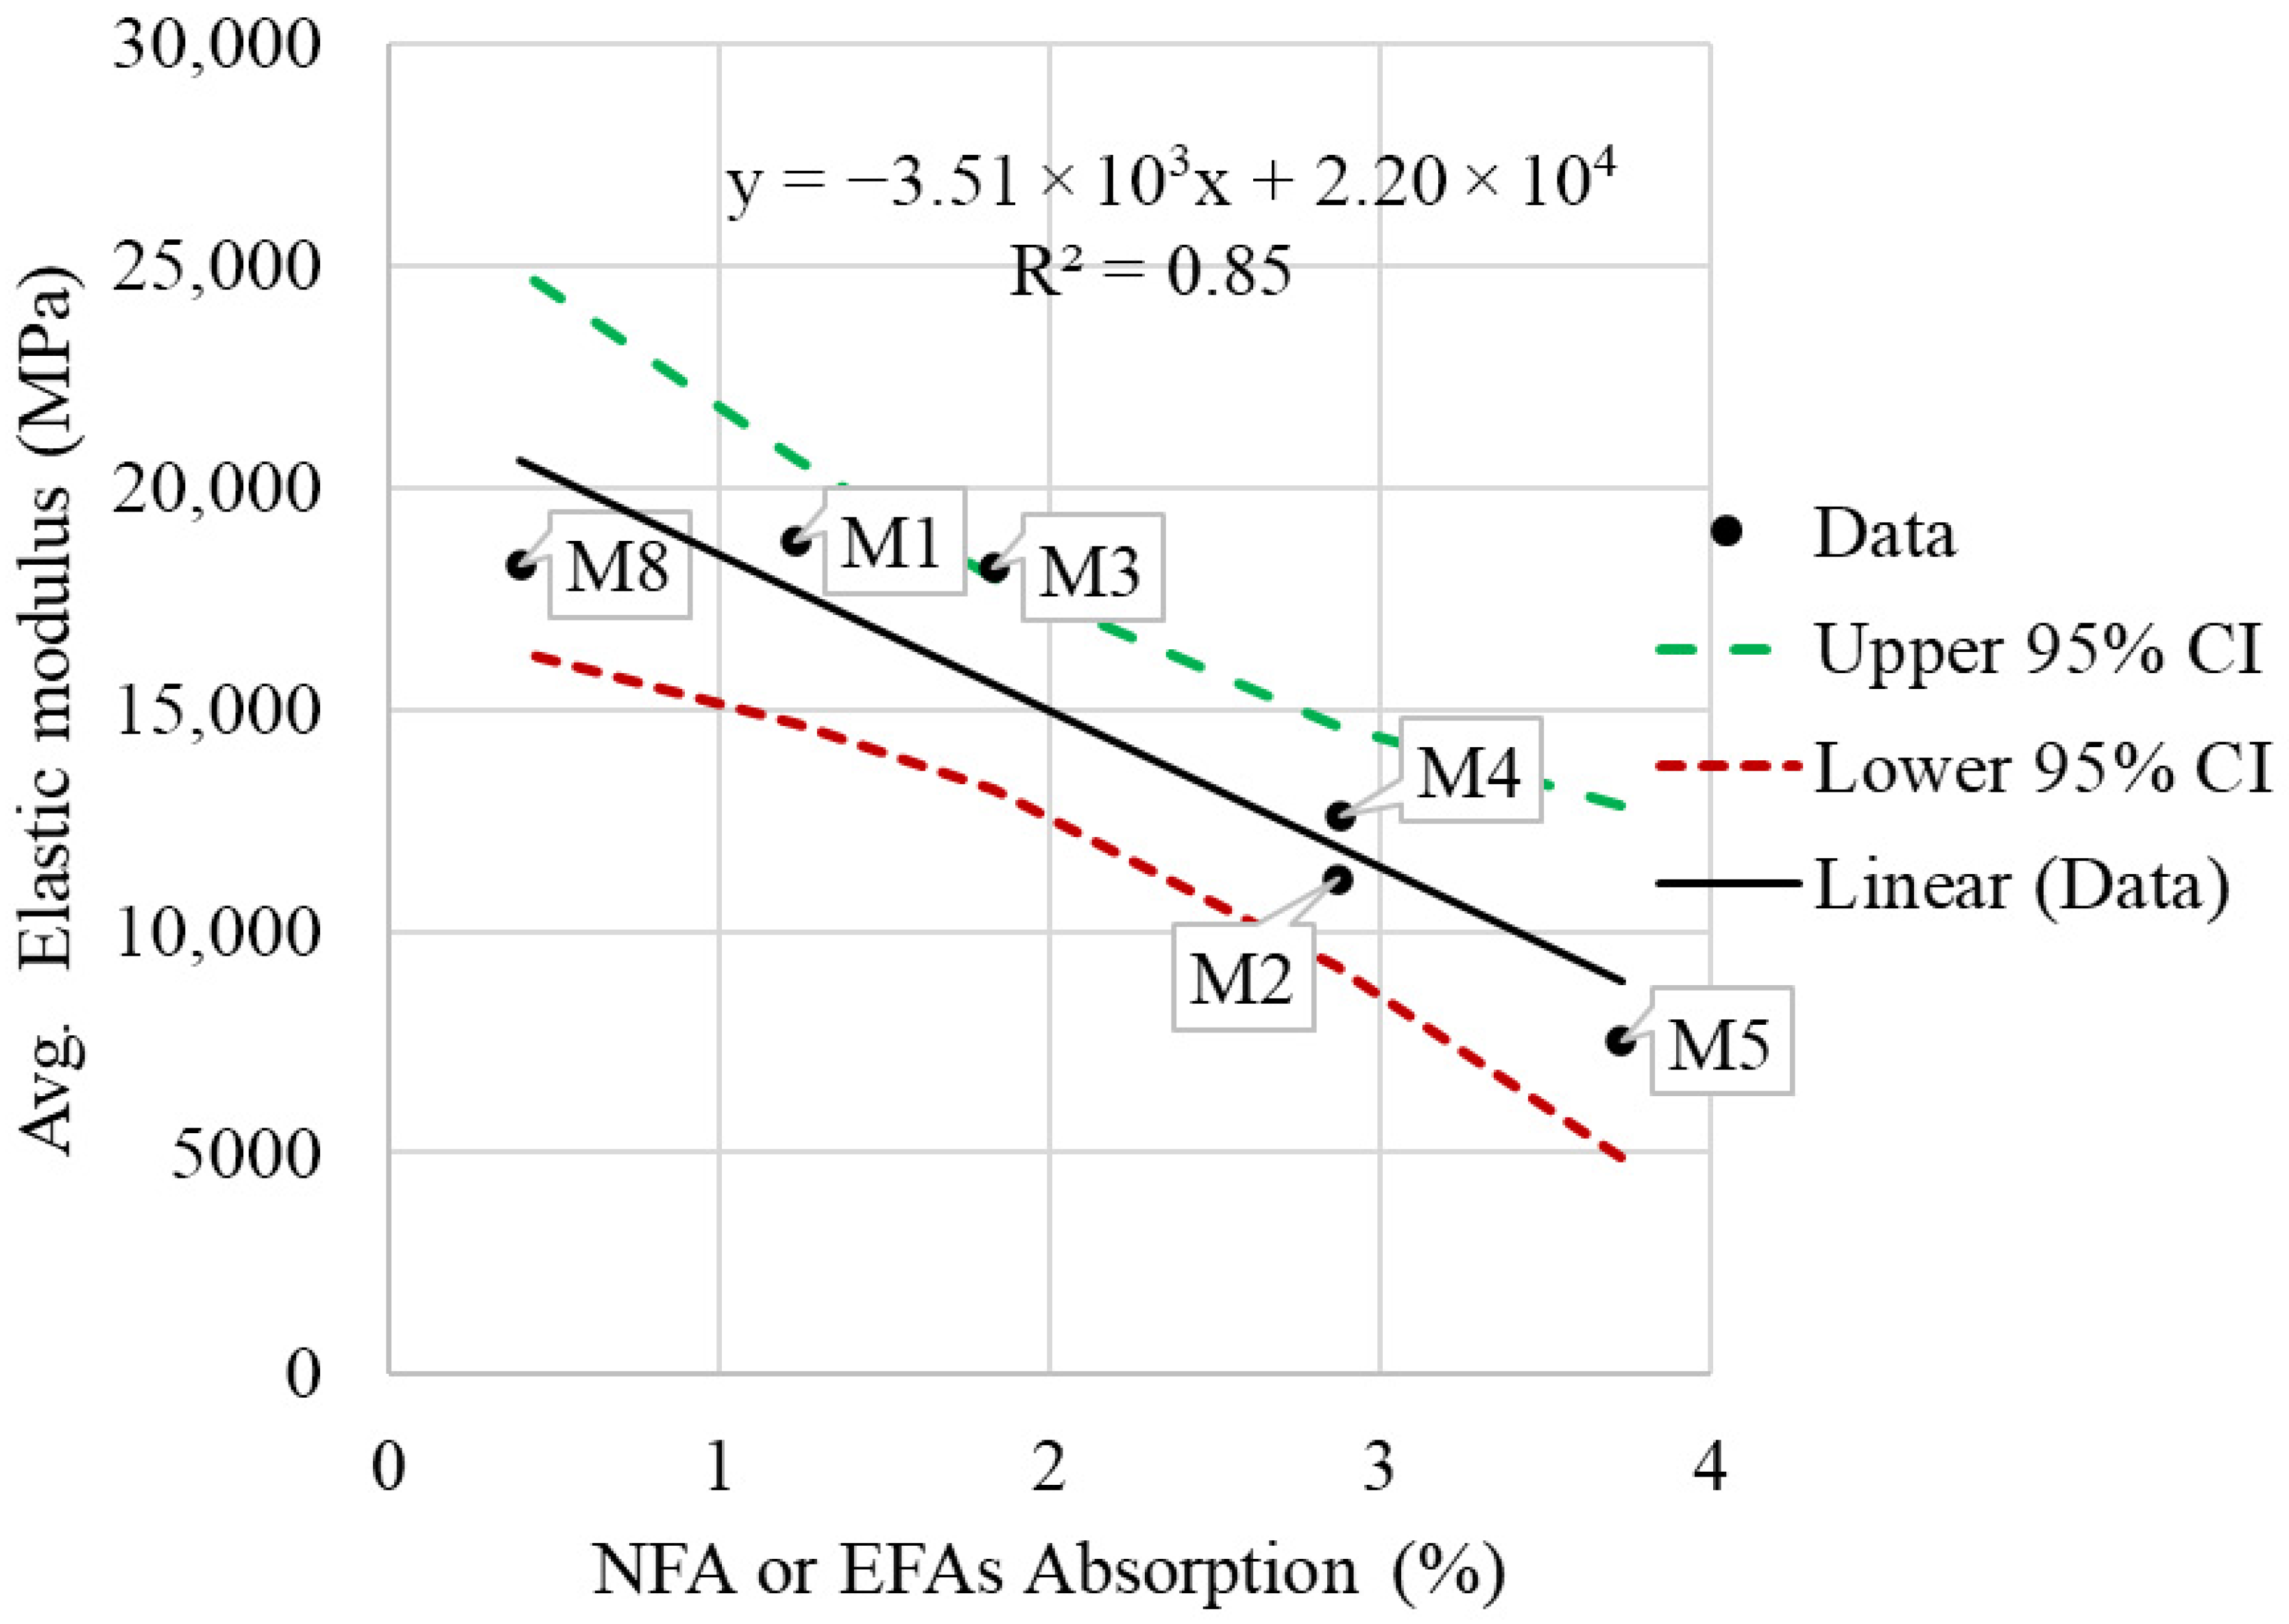
The mechanical properties of the concrete mixtures (M1–M8) were evaluated in accordance with ASTM standards [49,50,51]. Compressive strength was measured at 14 and 28 days, while the elastic modulus and MOR were determined at 28 days. The results are presented in Figure 11, Figure 12 and Figure 13, respectively. Each bar represents the mean value of three replicates (n = 3), with error bars indicating the standard deviation (mean ± SD). Regression relationships between the compressive strength and EFA/NFA absorption and slump, as well as between the elastic modulus and EFA/NFA absorption, are shown in Figure 14, Figure 15 and Figure 16. The 95% CIs are included in each model to illustrate the reliability and variability of the fitted relationships.
Statistical analysis based on the 95% CIs and adjusted p-values (Holm, permutation, and FDR) revealed significant differences (p < 0.05) in the mechanical properties (compressive strength, elastic modulus, and MOR) among the mixtures. As summarized in Table 6, Table 7 and Table 8, most EFA mixtures exhibited significantly lower compressive strength and stiffness compared to M1, with all adjusted p-values below 0.05 and the 95% CIs for M2–M7 lying entirely below zero, confirming the reduced mean values. For M8, the 95% CI [−4.74, 1.55] included zero, and all adjusted p-values exceeded α = 0.05, indicating no statistically significant difference in compressive strength relative to M1. Similarly, most mixtures showed a reduced elastic modulus, except for M3 and M8, where the p-values exceeded α and the 95% CIs included zero, indicating statistical equivalence to M1. For the MOR, only M3–M5 exhibited significantly lower values (CIs excluding zero and p < 0.05), while the remaining mixtures were not statistically different from M1. As discussed previously (Table 1 and Table 2), these reductions are primarily attributed to the higher carbon content, lower calcium and magnesium concentrations, and increased water absorption of the EFAs, which collectively weaken the paste–aggregate bond and increase concrete porosity. Thus, the observed strength reductions are linked to material-specific interactions, rather than random mixture variability. Overall, replacing 10% of the NFA by volume with EFAs affects the mechanical performance, particularly the compressive strength and elastic modulus. However, comparisons among mixtures should be interpreted with appropriate caution given the limited sample size (n = 3), especially when the differences are small or p-values approach the significance threshold.
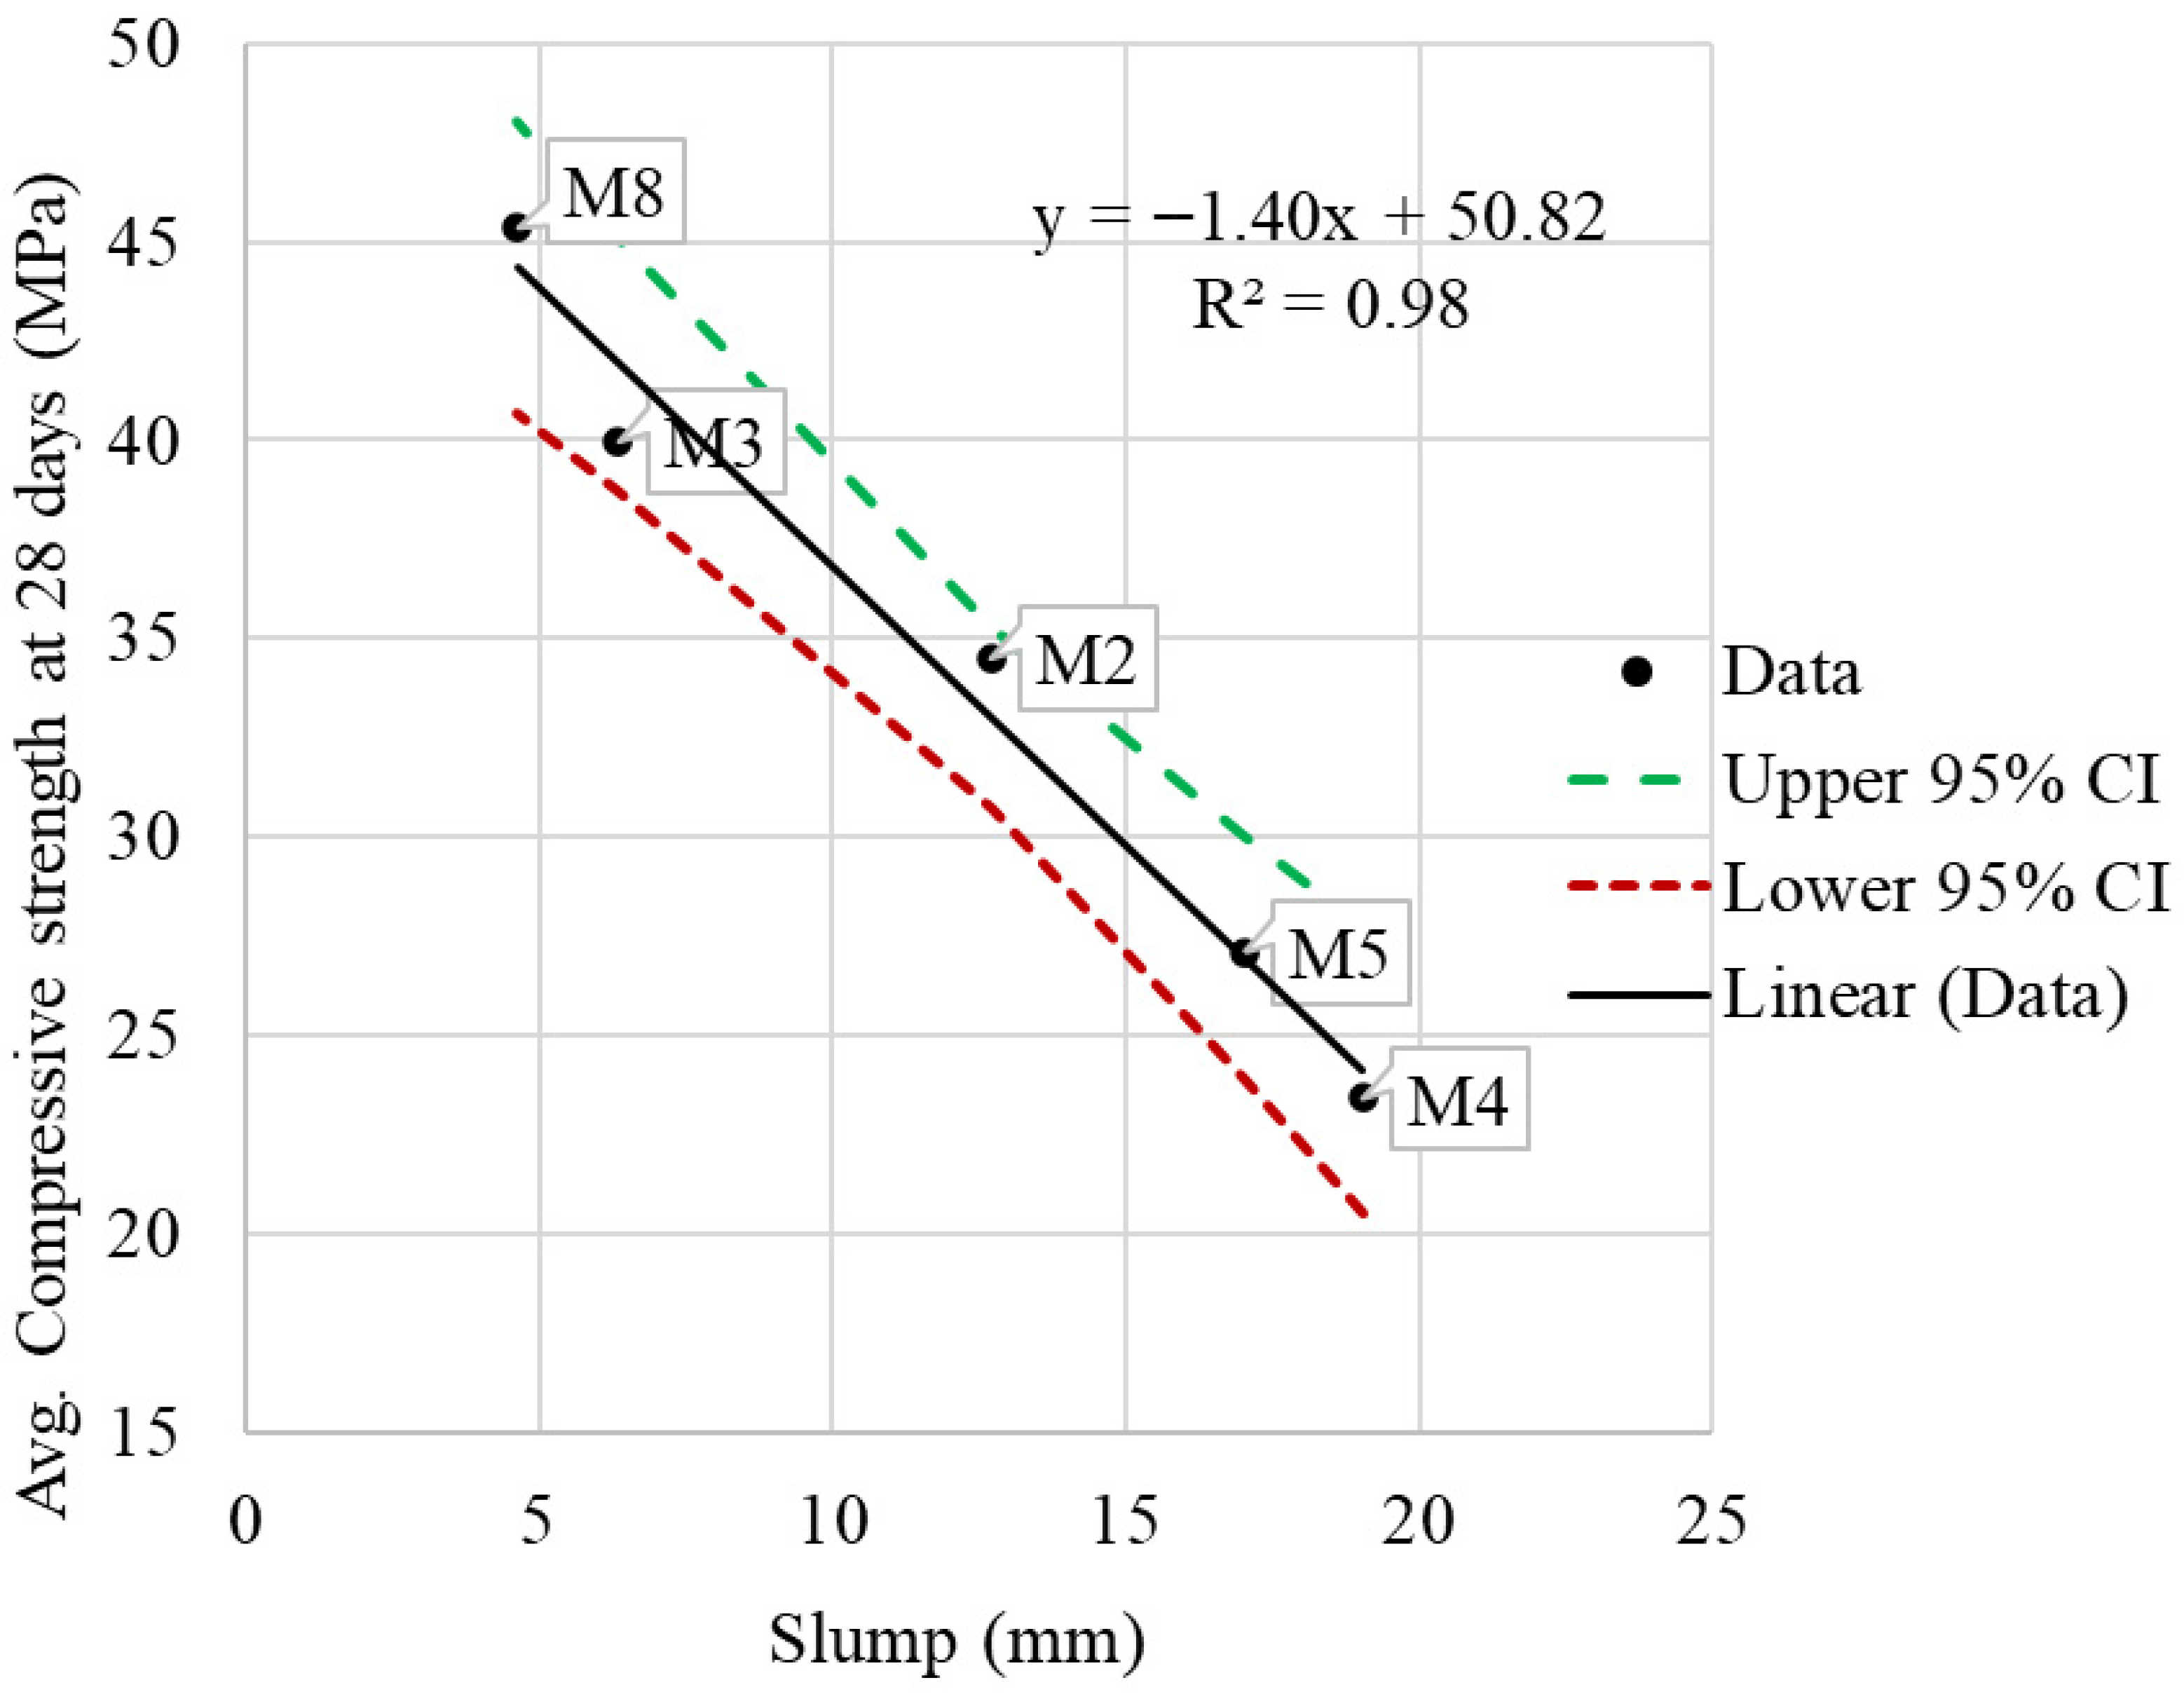
To further interpret these differences, regression analyses were conducted to identify the key factors governing the mechanical behavior of the concrete mixtures. The compressive strength of most mixtures exceeded the 28 MPa target specified for the MD7 mix, a standard benchmark in regional construction. Mixes M4 and M7 were the only mixtures that did not meet this criterion. A significant negative correlation was identified between EFA/NFA absorption and compressive strength ( R 2   = 0.77,   R 2 a d j   = 0.72; Model p = 0.021; KS p = 0.574; Figure 14; Table 9), with a low RMSE and MAE, indicating acceptable model performance. An even stronger negative correlation was observed between compressive strength and slump ( R 2   = 0.98; R 2 a d j = 0.97; Model p = 0.002; KS p = 0.992; Figure 15; Table 9), demonstrating the best model fit and lowest prediction error among the evaluated relationships.
Table 9. Summary of linear model coefficients and performance for concrete properties.
ModelFigureModel
Coefficient
Model Performance
a b R 2 R 2 a d j R M S E M A E Model p-ValueKS
Stat
KS p-Value
1Figure 1451.10−6.900.770.724.173.600.0210.2960.574
2Figure 1550.82−1.400.980.971.231.060.0020.1730.992
3Figure 16 2.20 × 10 4 3.51 × 10 3 0.850.811659.051482.260.0090.1540.994
4Figure 17−297.88406.350.700.62 2.35 × 10 3 1.91 × 10 3 0.0380.1710.980
5Figure 182.680.070.760.690.340.260.0250.2200.880
Note: Model follows y = a + b x ; a : intercept; b : slope; R 2 , R adj 2 : coefficients of determination; RMSE and MAE: error indices; model p-value: regression significance; KS: Kolmogorov–Smirnov statistic and its p-value for residual normality. Model mapping: (1) f c (Compressive Strength) vs. Abs; (2) f c vs. Slump; (3) E vs. Abs; (4) E vs. f c ; (5) MOR vs. f c ; units: MPa for f c ,   E , MOR; mm for Slump; % for Abs; f c ,   E , MOR measured at 28 days.
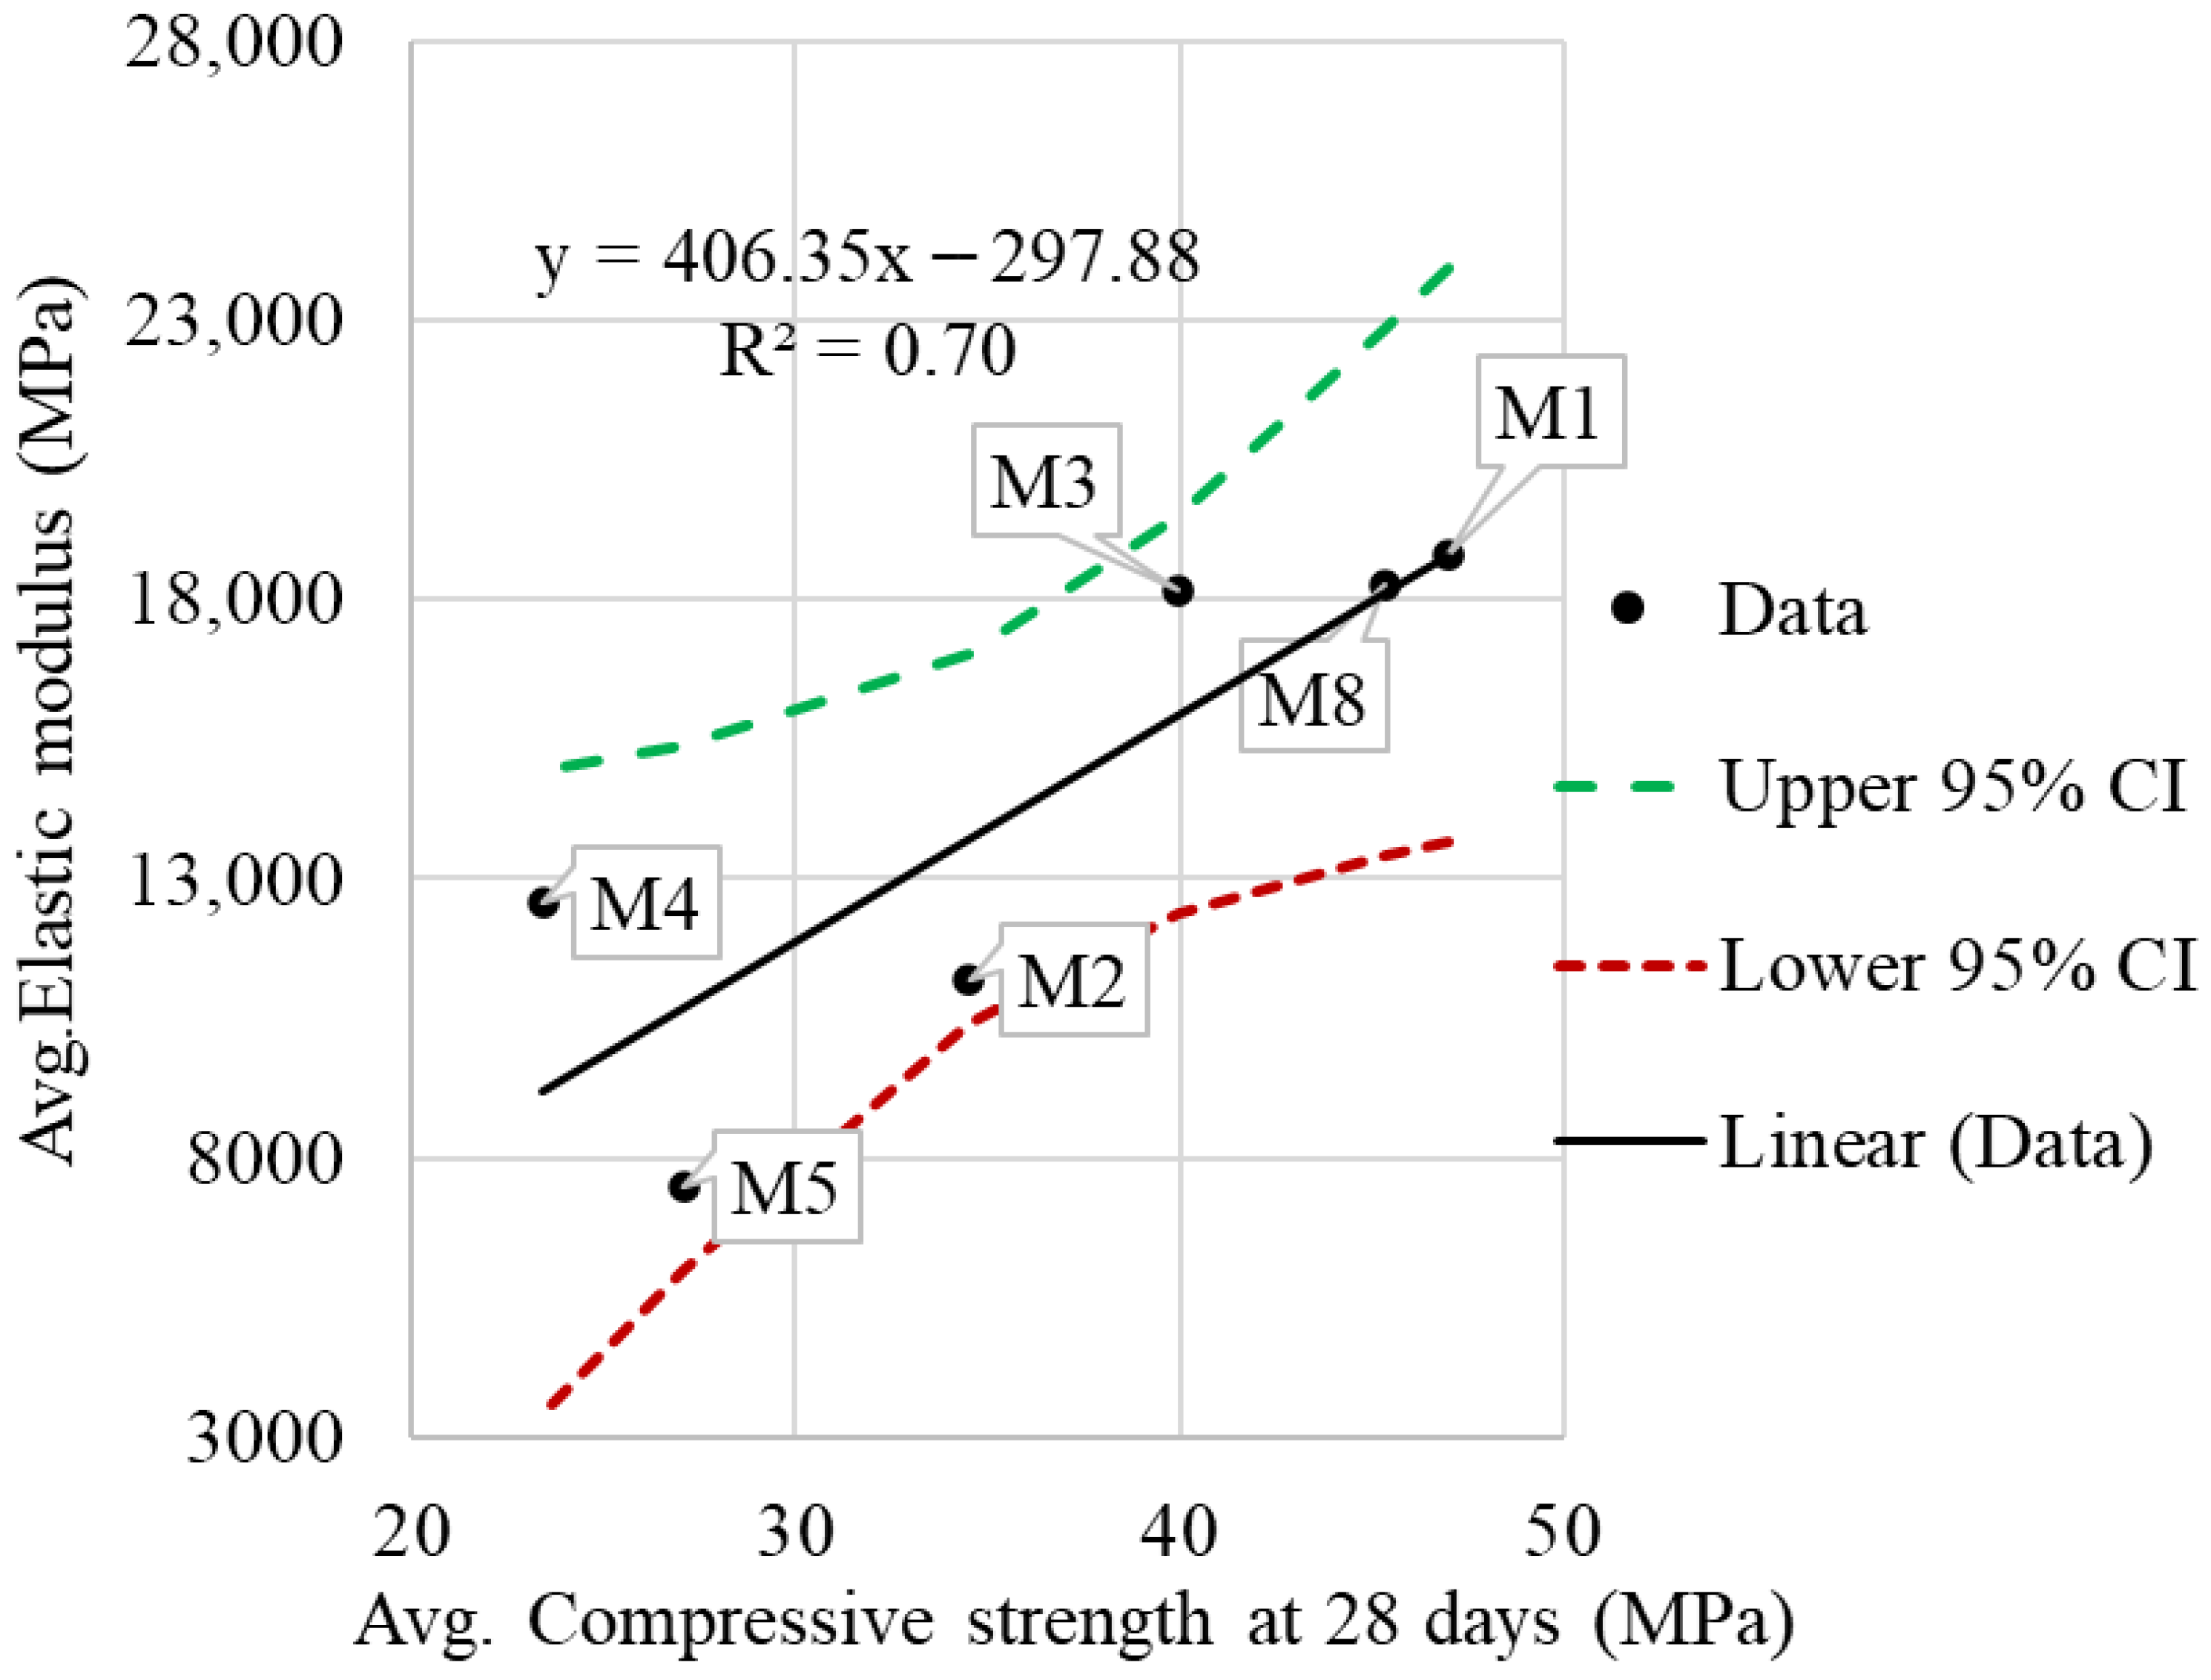
Figure 17. Correlation between average compressive strength and average elastic modulus.
Sustainability 18 03540 g017
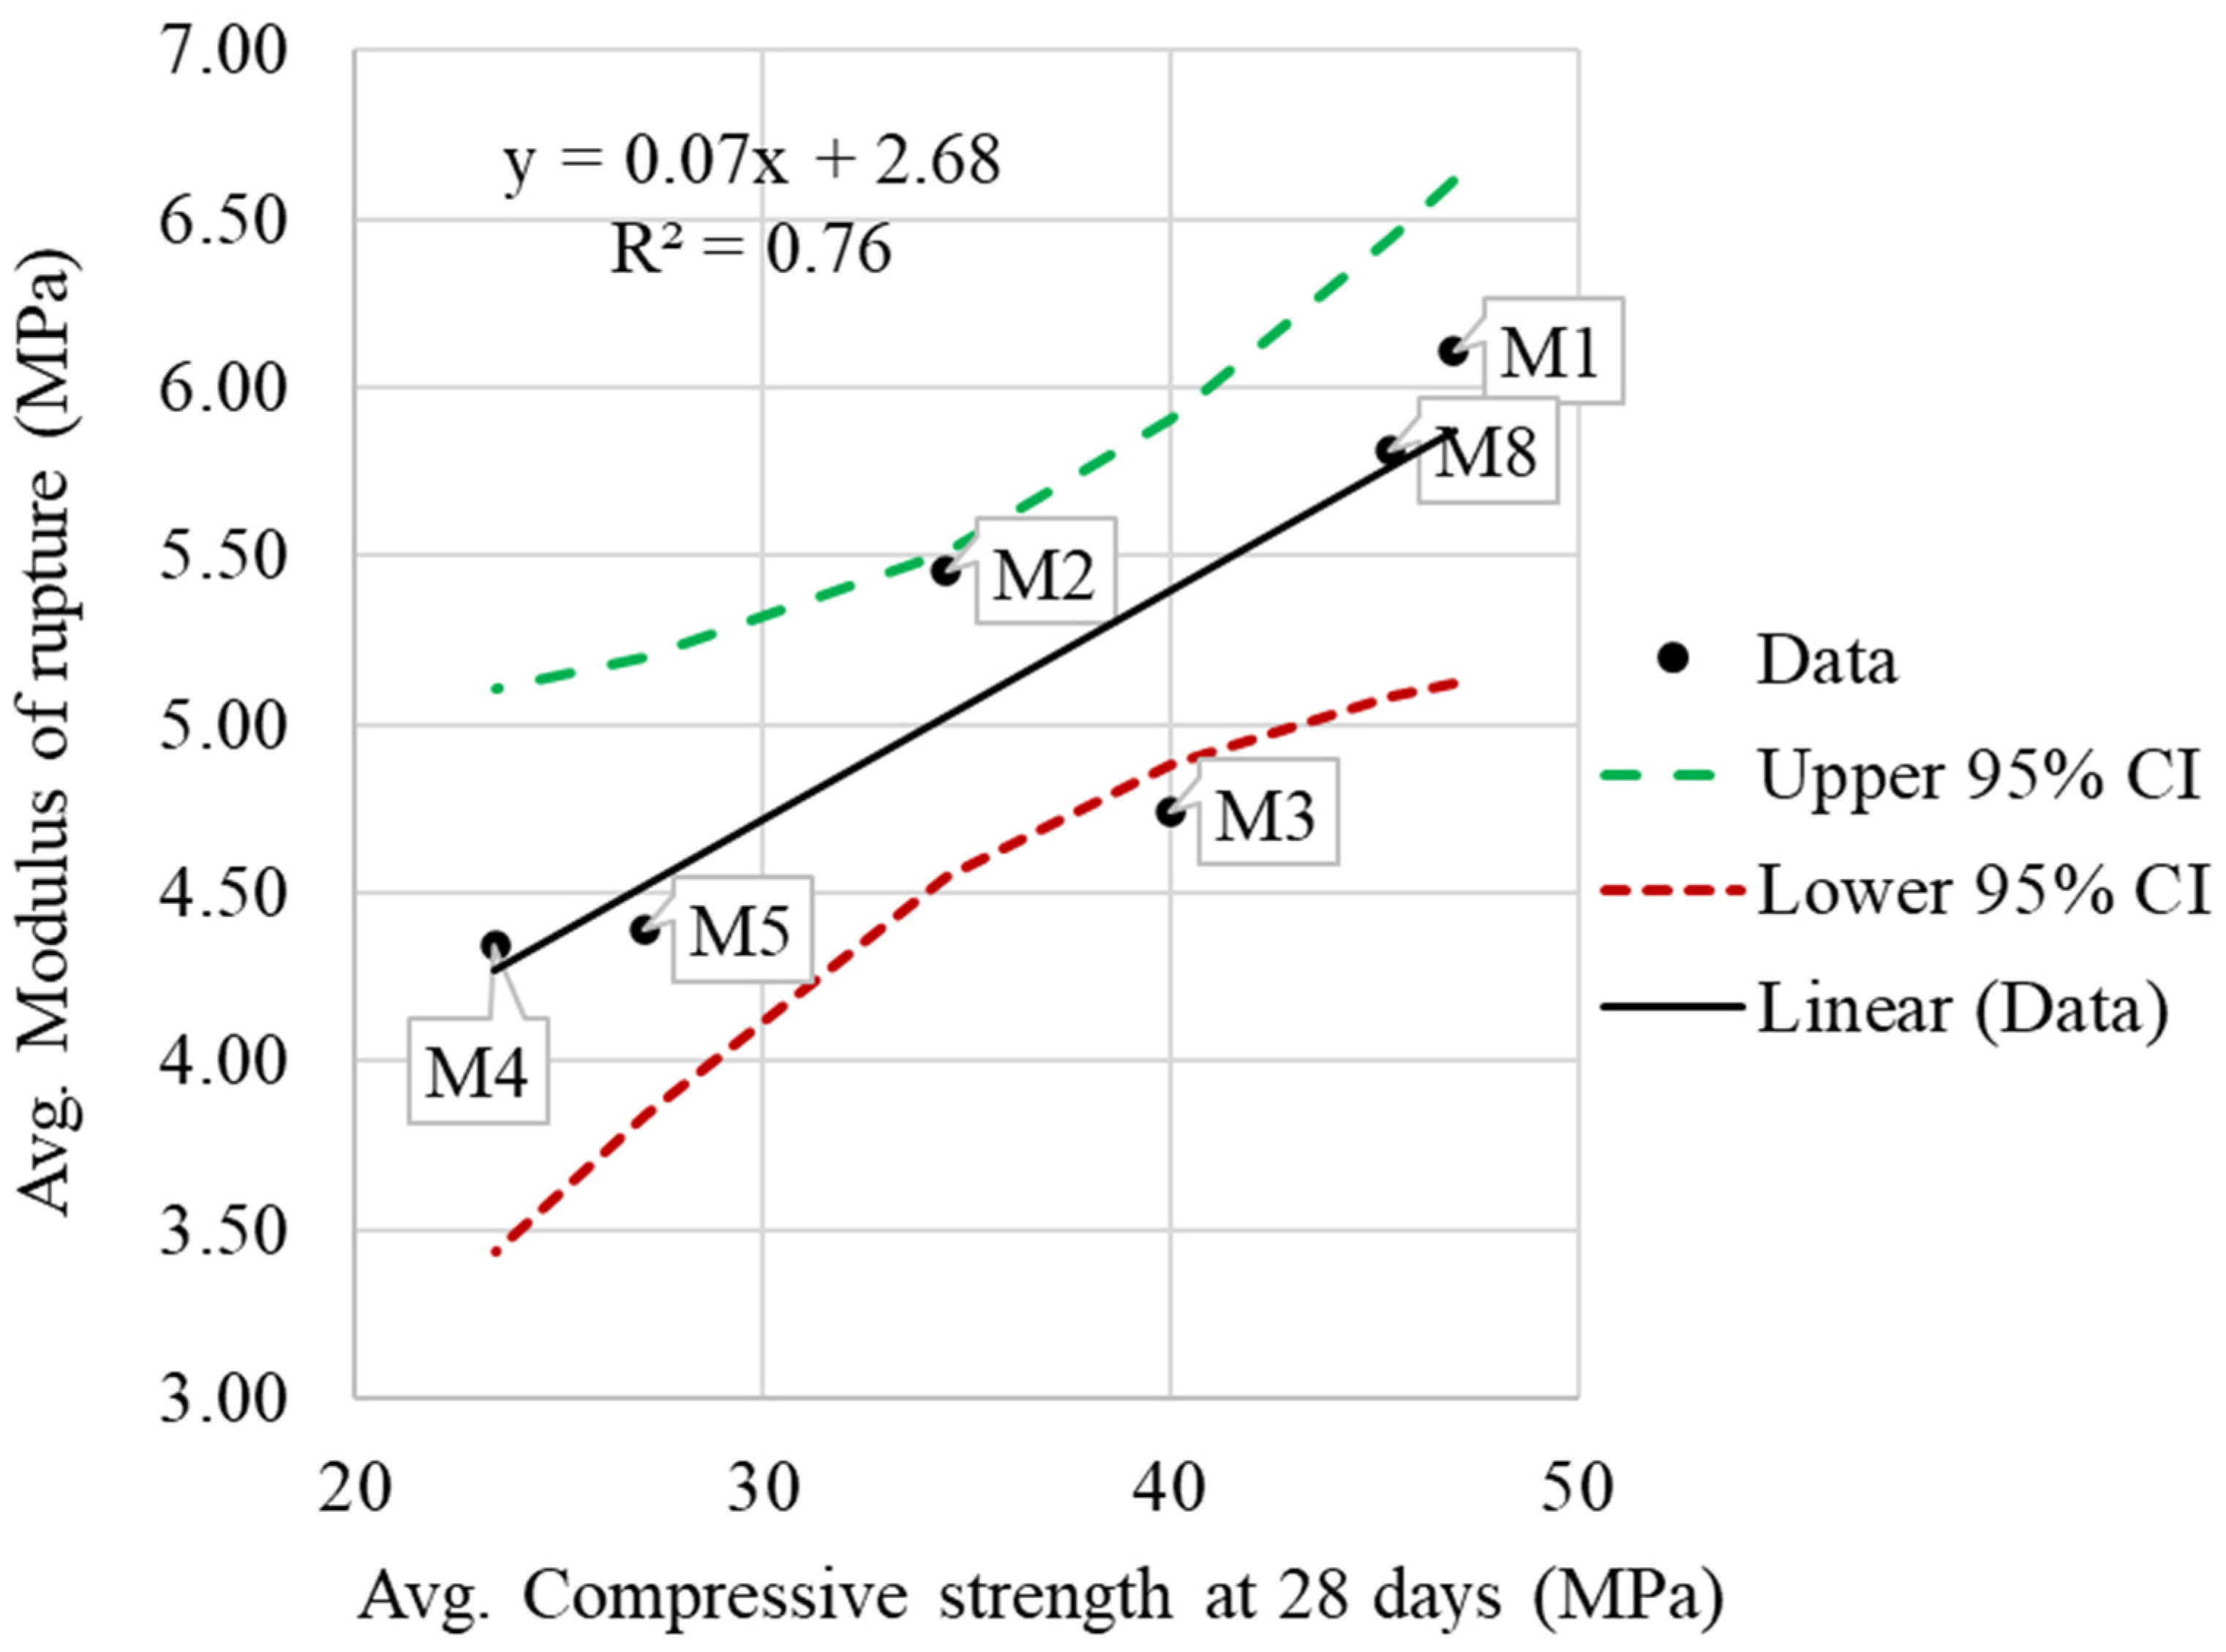
Figure 18. Correlation between average compressive strength and average modulus of rupture.
Sustainability 18 03540 g018
The reliability of the regression models is supported by the 95% CIs in Figure 14 and Figure 15, which closely follow the fitted trends. Only M4 in Figure 14 falls slightly below the lower bound, which is acceptable since the CIs represent the mean response and not individual observations. These results indicate that water content adjustments required to maintain workability, primarily driven by the high absorption capacity of EFAs, play a dominant role in controlling the compressive strength. Increased absorption leads to the redistribution of mixing water, effectively reducing paste quality, weakening the paste–aggregate bond, and promoting ITZ thickening. This provides a clear mechanistic explanation for the observed strength reductions, rather than attributing them to random mixture variability. In this context, slump represents a reflection of the same absorption-controlled mechanism. In EFA mixtures, lower slump reflects a higher water demand and localized water redistribution, which in turn degrades paste integrity and ITZ quality, ultimately reducing the compressive strength. Thus, the strong correlation between the compressive strength and slump reflects a shared underlying mechanism, consistent with the ITZ-based interpretation, rather than a direct causal effect of slump alone.
For the elastic modulus, mixtures M3 and M8 exhibited values comparable to M1. As shown in Table 4, both M3 and M1 had identical UWs of 2513 kg / m 3 , while M8 showed a slightly lower UW (2474 kg / m 3 ), indicating similar density-related characteristics. In contrast, mixes M2, M5, and M7 exhibited reduced elastic moduli relative to M1. Notably, the higher AC in M5 contributed to a lower UW, which in turn reduced both its elastic modulus and compressive strength. Consistent with the compressive strength trends, linear regression revealed a strong negative correlation between the elastic modulus and EFA/NFA absorption ( R 2   = 0.85; R 2 a d j   = 0.81; Model p = 0.009; KS p = 0.994; Figure 16; Table 9), confirming the significant role of absorption in governing stiffness. Although the error metrics (RMSE and MAE) were higher than those for the compressive strength models, the 95% CIs in Figure 16 closely follow the fitted regression line, supporting model reliability.
Considered together, these results indicate a consistent mechanistic response: reductions in stiffness are primarily driven by absorption-induced increases in the effective w/c ratio and the associated weakening of the ITZ, rather than random mix variability. Supporting this, Table 9 shows that Models 1–3 had KS p-values ranging from 0.574 to 0.994, confirming that the residuals were not significantly different from a normal distribution and that all regression assumptions were satisfied.

3.3.2. Relationship Between Compressive Strength, Elastic Modulus, and MOR

Concrete mixes incorporating 10% volumetric replacement of the NFA with EFAs exhibited a strong linear correlation between the compressive strength and elastic modulus ( R 2   = 0.70; R 2 a d j   = 0.62; Model p = 0.038; KS p = 0.980; Figure 17; Table 9), as well as between the compressive strength and MOR ( R 2   = 0.76; R 2 a d j   = 0.69; Model p = 0.025; KS p = 0.880; Figure 18; Table 9). Although the elastic modulus model showed higher error metrics (RMSE and MAE) compared to other models, the compressive strength–MOR relationship exhibited the lowest prediction errors, indicating a more robust fit. The normal distribution of residuals, confirmed by the KS test results, supports the validity of the regression models. This statistical consistency is further supported by Figure 17 and Figure 18, where the 95% CIs closely follow the regression lines. Only M3 in Figure 18 falls slightly below the lower bound, which is acceptable given that CIs represent mean trends rather than individual observations. These relationships indicate that reductions in stiffness (elastic modulus) and flexural capacity (MOR) occur proportionally with reductions in compressive strength, reflecting a shared underlying material mechanism rather than random variability.
Overall, the mixtures exhibited reduced compressive strength, elastic moduli, and MORs compared to the control mix (M1), indicating the generally adverse effect of EFAs on mechanical performance. However, the MOR results showed moderate variability: M3, M4, and M5 recorded lower values than M1, with M5 exhibiting the lowest MOR, while M6 exceeded M1, achieving the highest MOR among all mixtures. This improvement in M6 is attributed to the presence of fibrous content in EFA-5, which enhances the flexural capacity of the concrete. Additionally, all MOR values exceeded 10% of their corresponding compressive strength, indicating consistent and satisfactory proportional flexural performance across all mixtures. Combined with the regression analyses, these trends support a clear mechanistic interpretation: strength, stiffness, and the flexural response at 10% replacement are governed primarily by absorption-driven changes at the ITZ, rather than by the use of recycled material alone.

3.4. Concrete Porosity and Voids

Core samples from mixtures M1–M8 were tested for density, absorption, and void content in accordance with ASTM C642 [57] to evaluate the influence of EFAs on the concrete macrostructure. The results (Table 10) show that M1, M4, and M8 exhibited comparable void volume percentages, while the remaining mixtures showed only minor variations.
Although the UVC of EFAs ranged from 42.5% to 61.3%, higher than that of the NFA (39.7%), the incorporation of EFAs did not consistently increase the hardened concrete porosity, which ranged from 9.0% to 13.3%, compared to 13.1% for M1. This indicates that the UVC of EFAs does not directly control the bulk porosity in hardened concrete. Instead, the void content appears to be governed by multiple interacting factors, including the w/c ratio, mixing procedures, aggregate gradation, and entrapped air, rather than solely by the intrinsic properties of EFAs. Accordingly, the strength reductions observed in EFA mixtures cannot be attributed to bulk porosity. Rather, they are governed by absorption-driven changes at the ITZ, which control the bond quality and local microstructure. Given the relatively low 10% replacement level, the effect of EFAs on the overall void content is expected to be limited, further supporting the notion that the governing mechanisms operate at the ITZ. This finding motivates the ITZ-focused analysis in the following section and suggests that future optimization should prioritize interface modification rather than bulk porosity reduction.

3.5. The Interfacial Transition Zone (ITZ)

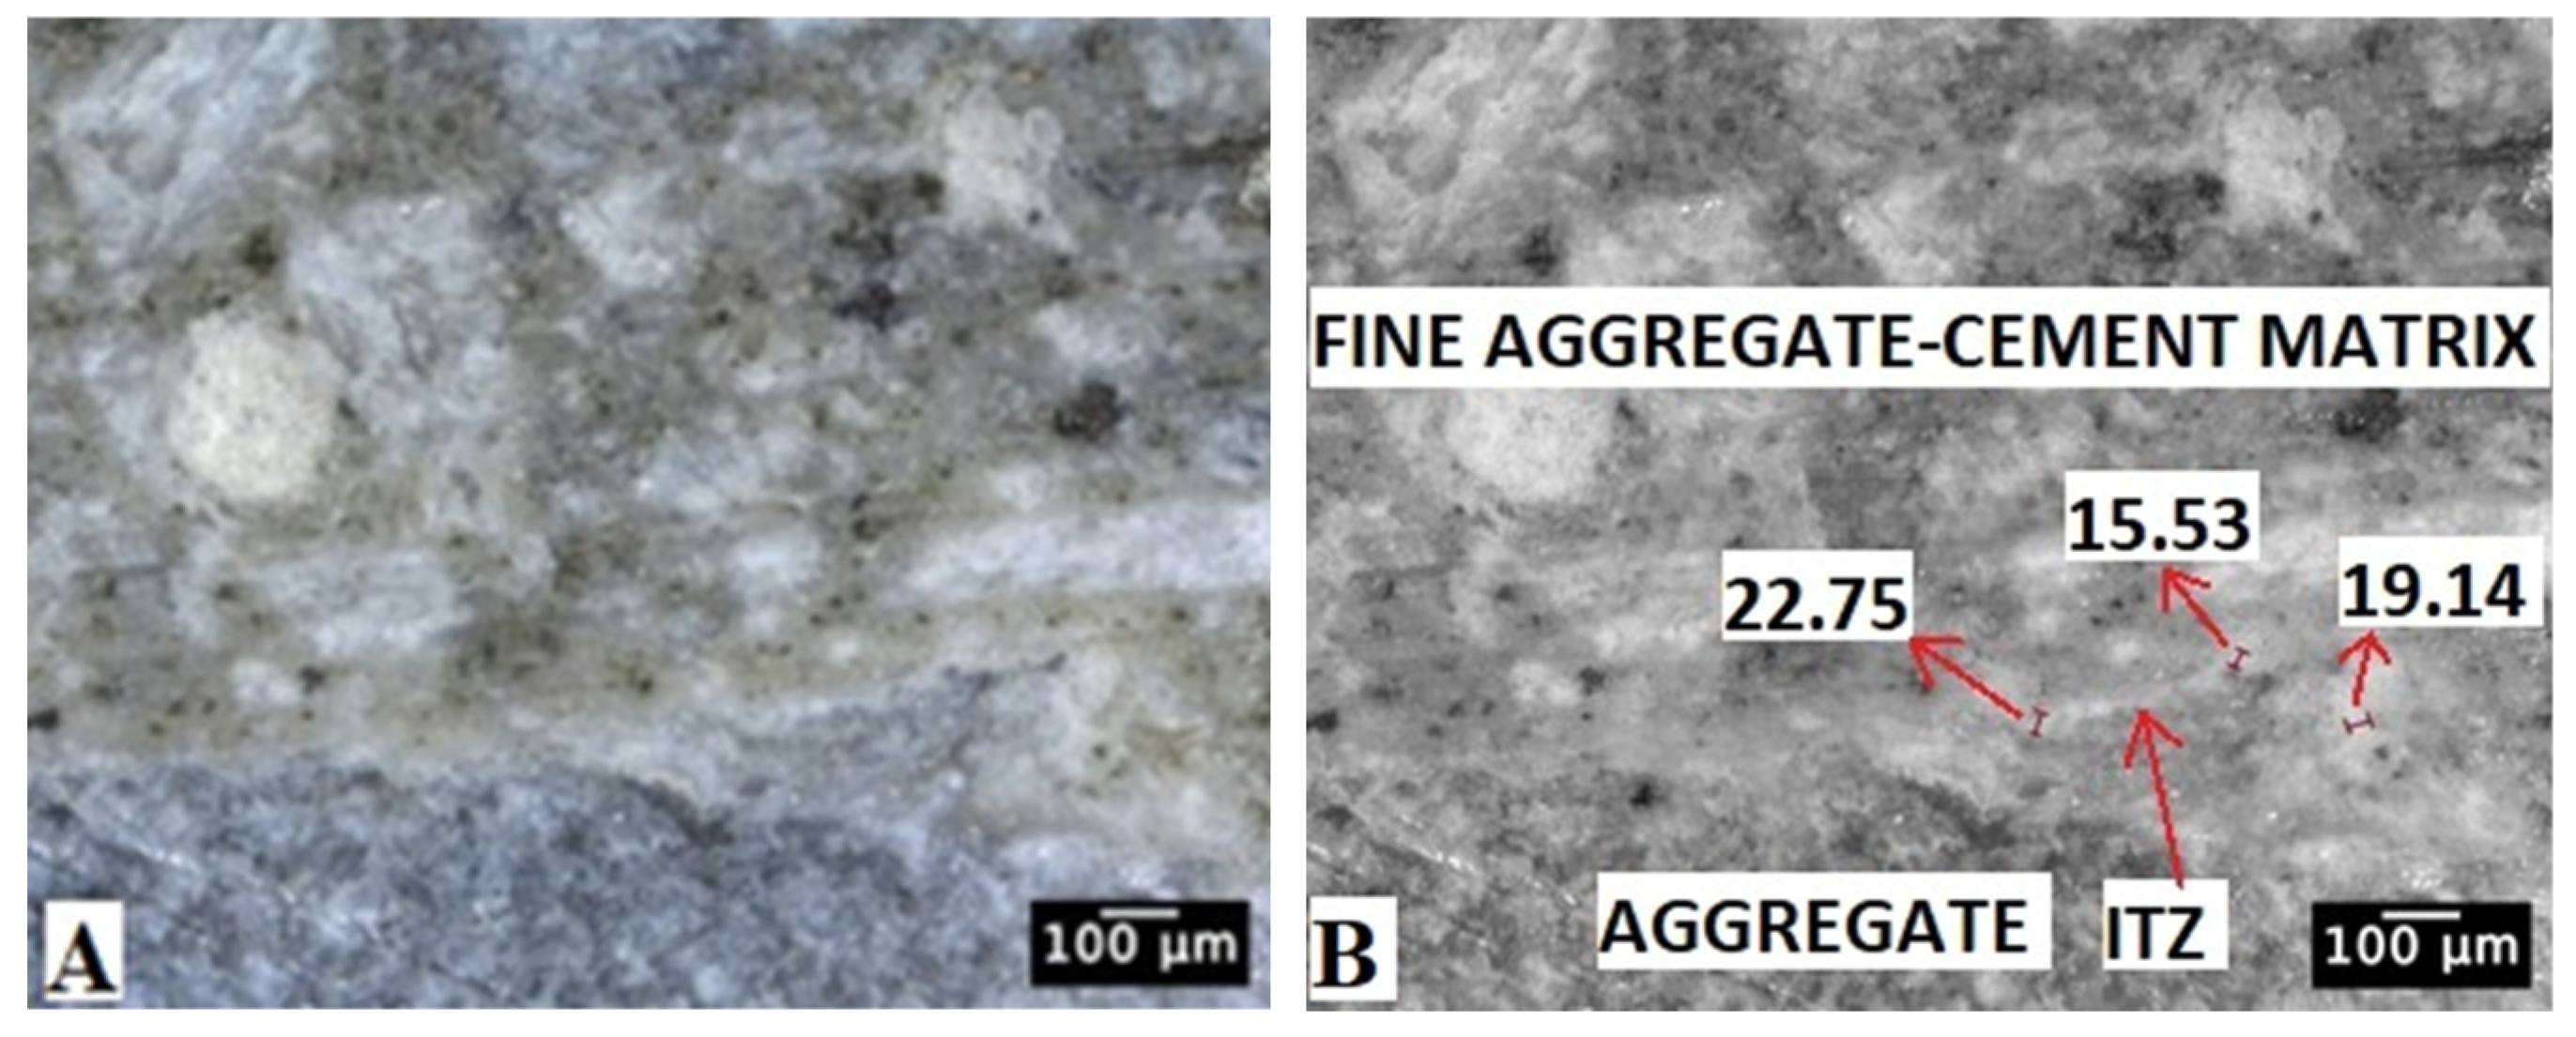
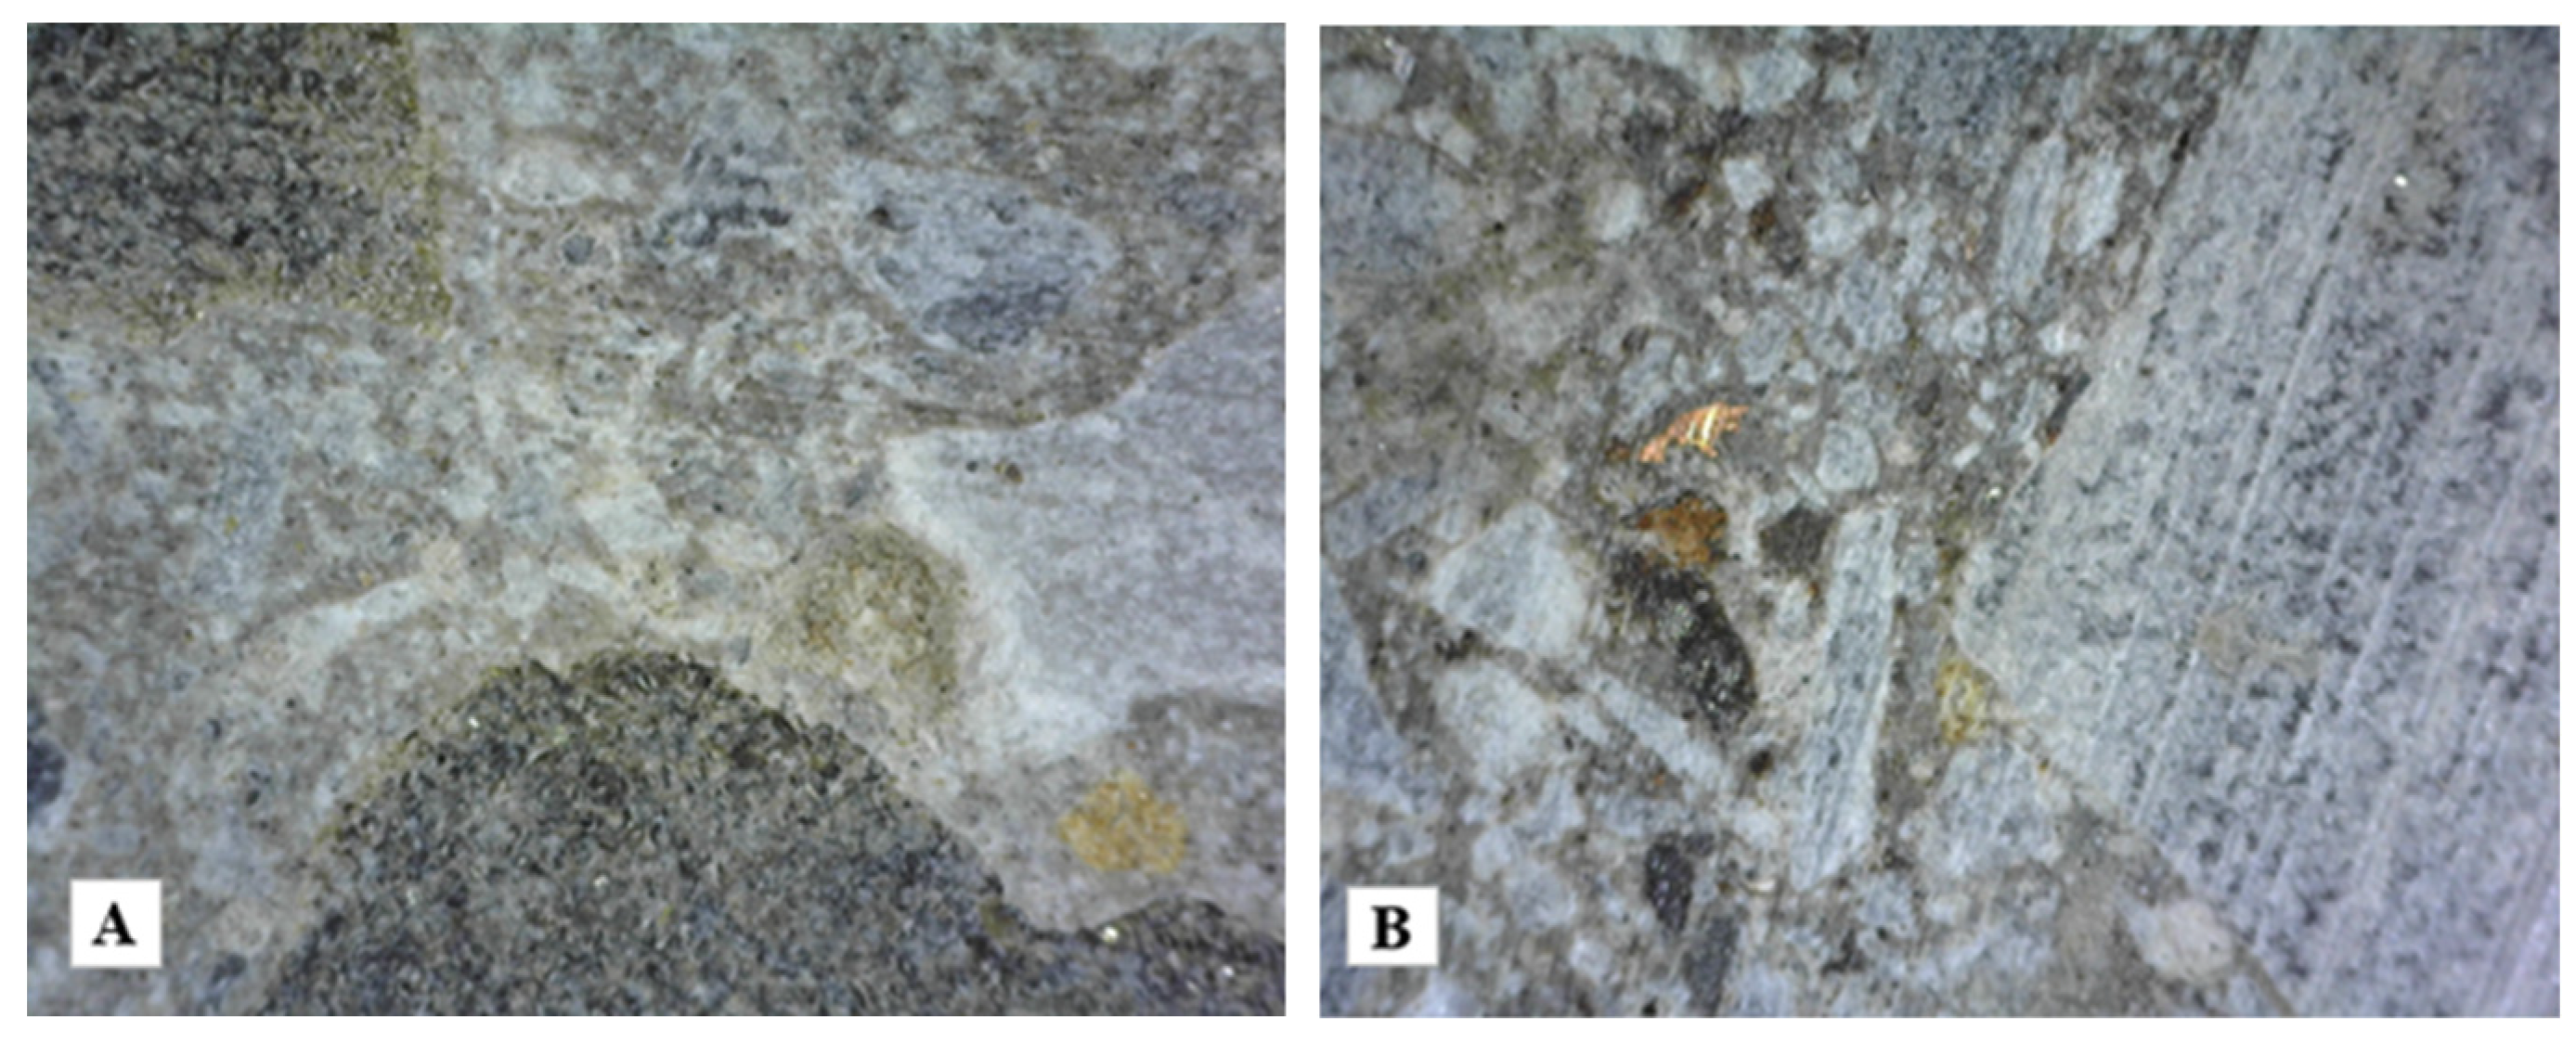
To investigate the potential effects of the elemental composition of EFAs on the ITZ microstructure, and consequently on the mechanical behavior of hardened concrete, optical microscopy was performed at multiple magnification levels. Optical microscopy was selected to enable consistent and repeatable measurements over relatively large observation areas, allowing a comparison of the ITZ thickness across mixtures under identical conditions. While higher-resolution techniques, such as SEM using the energy-dispersive X-ray fluorescence method, can provide more detailed microstructural characterization, optical microscopy was used in this initial study to evaluate relative differences and governing trends across mixtrures using alternative EFAs. Core samples (100 mm diameter × 40 mm height) were obtained by sawing cast cylinders at 120 days of age. The surfaces were left unpolished and unground before microscopic observation to preserve the natural microstructure. Representative images are shown in Figure 19 and Figure 20.
Microscopic analysis revealed three distinct phases: aggregates, cement paste, and the ITZ. The ITZ appeared as a lighter-colored region of variable thickness surrounding the aggregates. In regions where CA and FA were closely spaced, overlapping ITZs were also observed. Table 11 presents the average ITZ thickness for all mixtures, along with statistical comparisons relative to M1 to evaluate the effects of 10% EFA replacement. The ITZ thickness was calculated as the mean of three measurements per interface, obtained between randomly selected aggregate particles and the surrounding cement paste. Measurements were taken at multiple locations within each specimen to capture representative aggregate–paste interfaces. However, due to the inherent spatial variability of the ITZ morphology, the results should be interpreted as representative averages, rather than as the complete characterization of all local variations. The relationship between the ITZ thickness and 28-day compressive strength is presented in Figure 21.
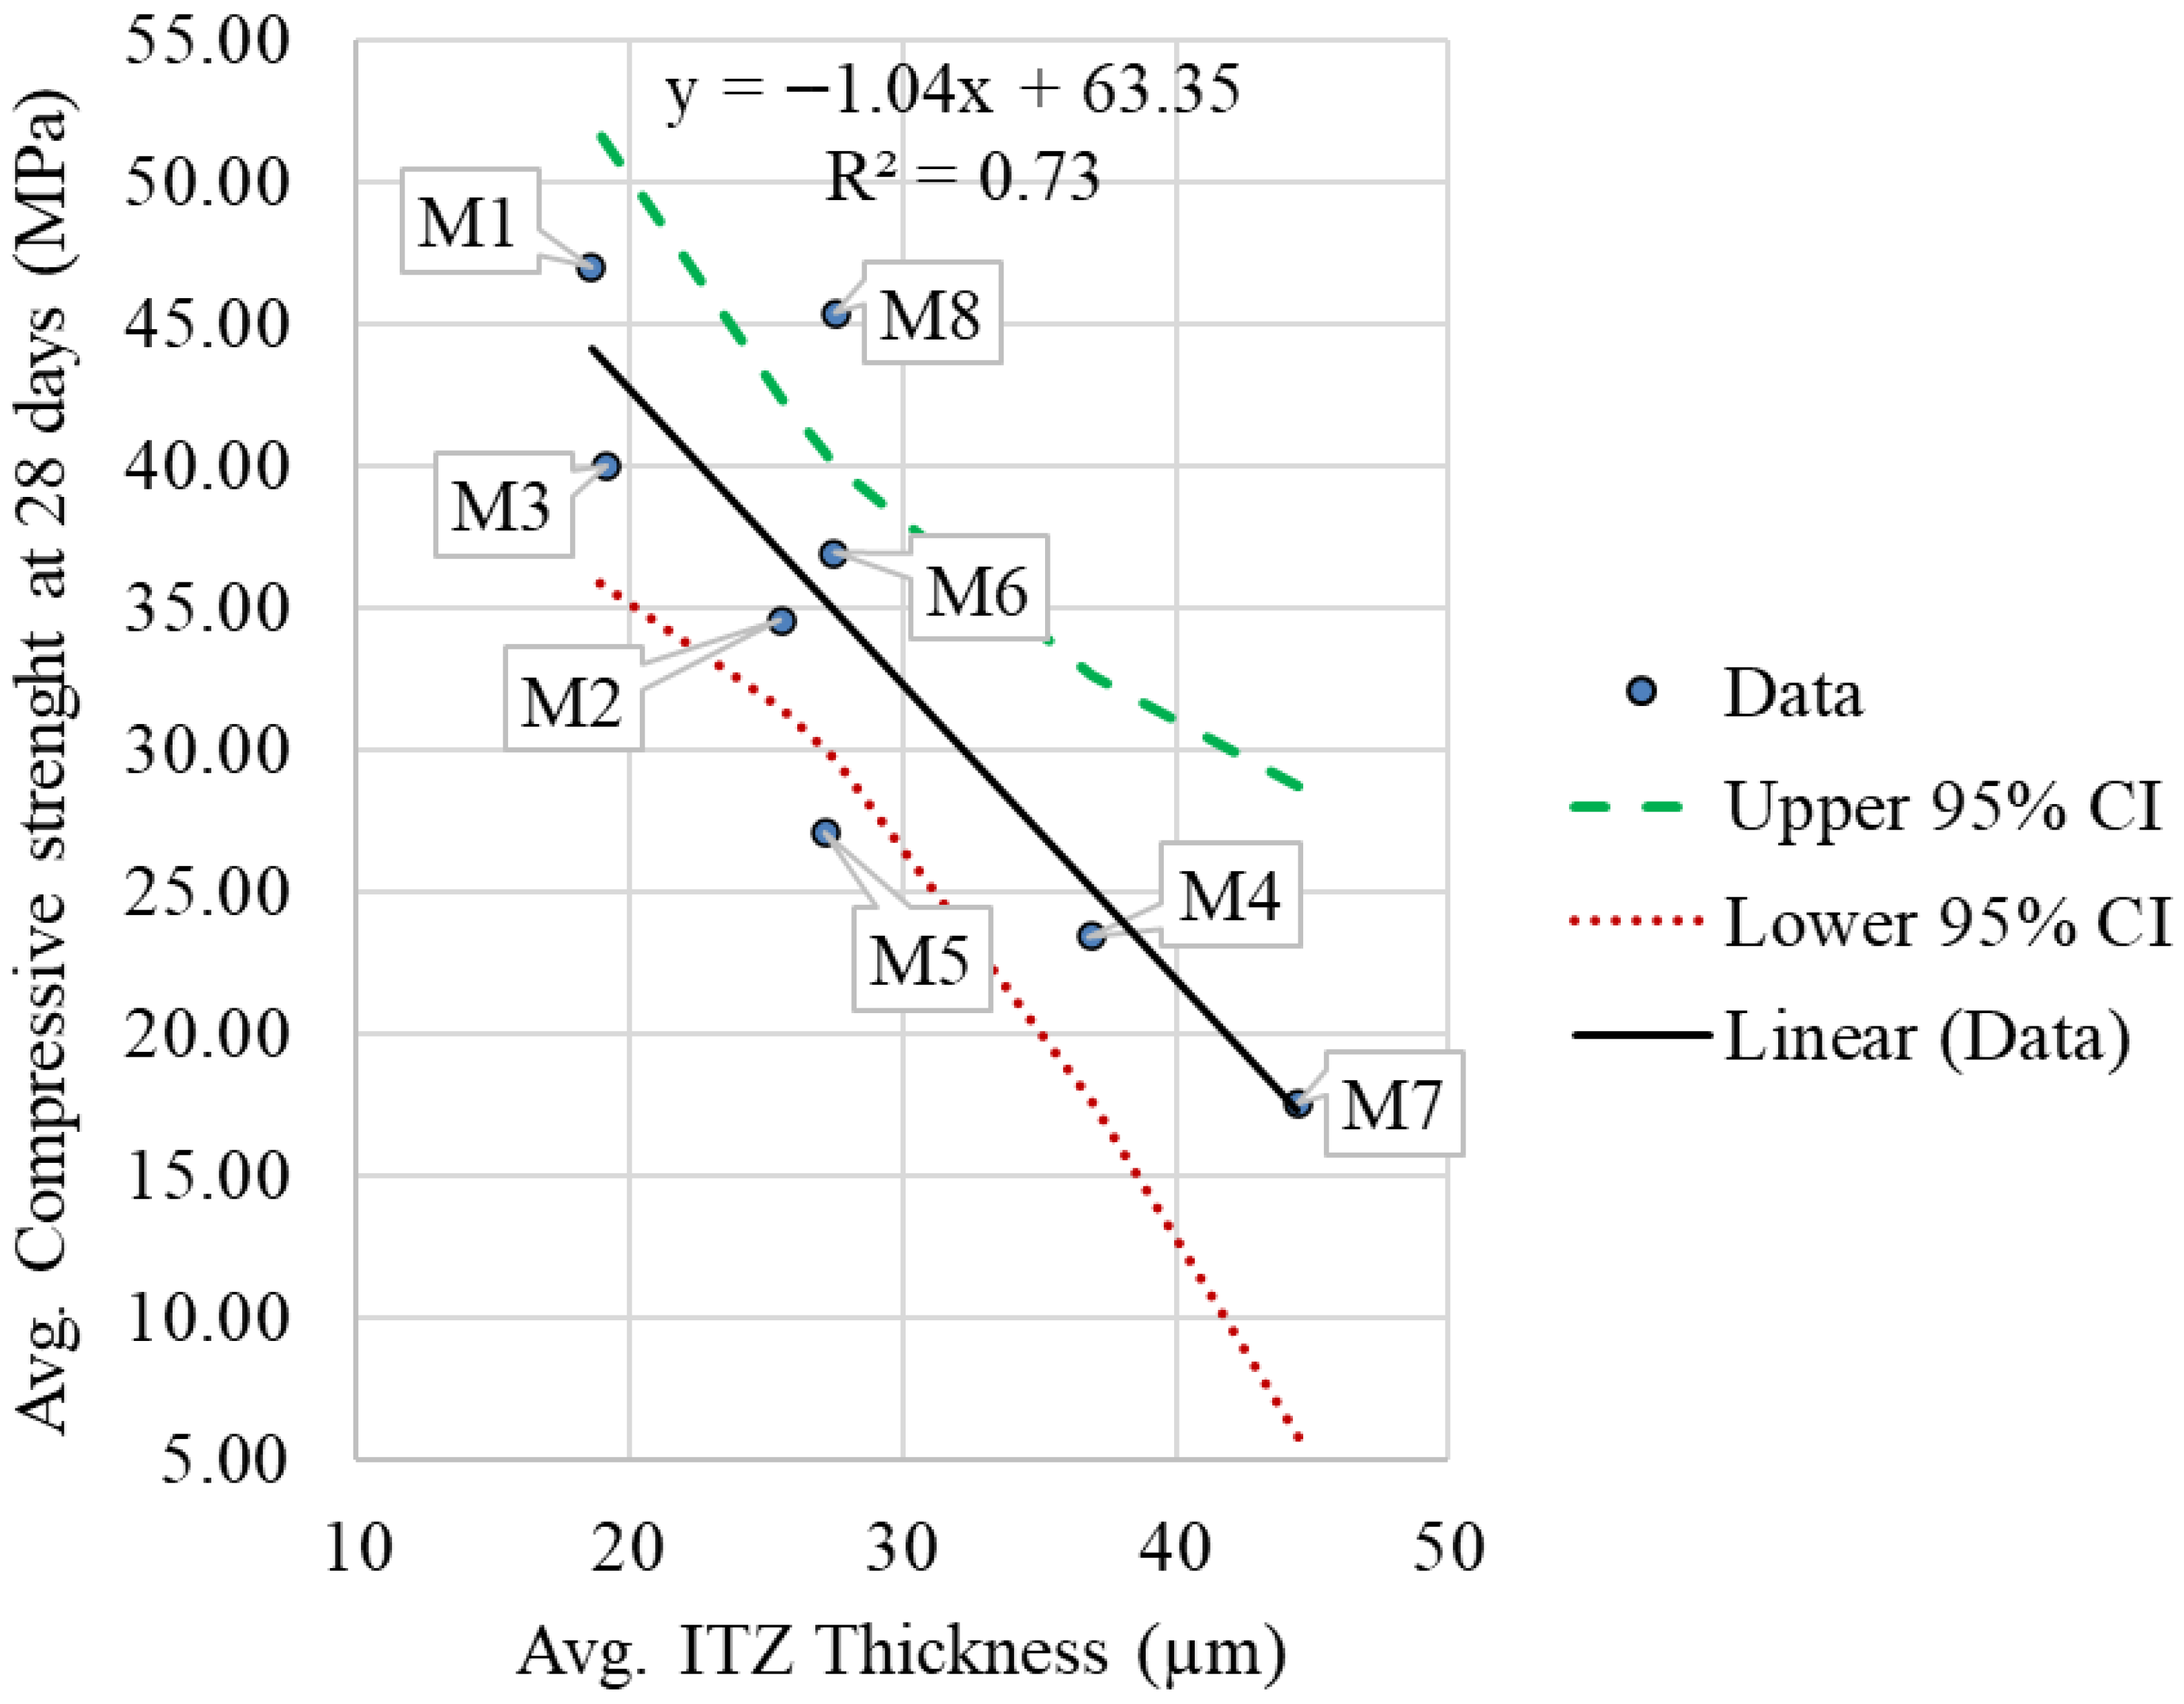
At 10% EFA replacement, all mixtures exhibited a greater mean ITZ thickness than M1 (Diff vs. M1 = 0.55–25.86 µm; Table 10). Statistical comparisons at α = 0.05 (Table 11) showed that M2 and M4–M8 had significantly thicker ITZs than M1 (all adjusted p < 0.05), whereas M3 did not (all adjusted p ≥ 0.05). These findings are supported by the 95% CIs—which exclude zero for M2 and M4–M8 but include zero for M3—and are further confirmed by the FDR results ( q < 0.05 for M2 and M4–M8; q = 0.8185 for M3). To evaluate the relationship between the ITZ thickness and compressive strength, the mean ITZ thickness was plotted against the 28-day compressive strength (Figure 21), revealing a negative linear relationship (y = −1.036x + 63.346). This indicates that an increasing ITZ thickness corresponds to decreasing strength [61], with M7 exhibiting the thickest ITZ, while M3 showed behavior comparable to M1. The 95% CIs in Figure 21 remain narrow around the regression line, with only M8 and M5 slightly outside the bounds—which is acceptable since the intervals represent the mean response rather than individual observations.
Table 12 further supports this relationship, showing a statistically significant negative correlation ( p = 0.007) with a relatively high R 2 = 0.73 and R a d j 2 = 0.68 and low error indices ( R M S E = 5.15 MPa; MAE = 3.94 MPa), indicating a strong model fit. The KS test ( p = 0.933) confirmed that the residuals did not significantly deviate from normality, supporting model validity. Collectively, these results demonstrate a direct and quantifiable mechanism: EFAs increase the ITZ thickness, and this thickening is the primary driver of strength reduction at the 10% replacement level. This behavior is consistent with the heterogeneous composition of the EFAs identified in Table 1. Compared with the NFA, the EFAs contain high carbon and lower calcium/magnesium content, together with other minor constituents associated with AutoSR. These components are not expected to interact with the cement matrix in the same manner as conventional mineral aggregates. Instead, their presence is likely to reduce interfacial compatibility, disrupt local paste development, and, when combined with higher absorption, promote a thicker and weaker transition zone. Accordingly, the observed ITZ thickening is interpreted as the result of both physical effects (water redistribution and local paste deficiency) and compositional effects (reduced interfacial compatibility with hydration products). Overall, these findings identify ITZ control as the key pathway for performance improvement, rather than modifications to the overall mix design. Future optimization should therefore focus on the surface treatment or conditioning of EFAs to regulate ITZ development.

4. Potential Benefits of Using EFAs as a Construction Recycled Material

Using EFAs as a partial replacement for NFA in concrete, even at the 10% replacement level considered in this study, offers potential economic and environmental benefits. According to the National Ready Mixed Concrete Association (NRMCA), the annual production of ready-mix concrete in Maryland, Virginia, and the District of Columbia exceeded 12.62 million m 3 in 2024 [62]. Based on this production volume, 10% volumetric replacement of NFA with EFAs (using EFA-2 as a representative case) corresponds to an estimated recycled material volume of approximately 382,277 m 3 / year , considering the fine aggregate fraction in typical concrete mixtures. Assuming price equivalence between EFAs and conventional fine aggregates, this translates to potential market value of approximately USD 33 million/year. This estimate represents a preliminary order-of-magnitude saving assessment since it does not account for transportation, pre-processing, classification, quality control, or market variability, which may all be influenced by location-specific practices and may all influence economic outcomes. Beyond economic considerations, the use of EFAs could significantly reduce the landfilling of AutoSR-derived materials. Based on the estimated volume of diverted material, this corresponds to nearly one million tons of waste annually, with an associated avoided landfill cost of approximately USD 40 million per year, assuming representative disposal fees. Similarly, such expected environmental benefits are based on the landfill diversion potential and reported aggregate-related emission factors. Thus, a life-cycle assessment (LCA) of the environmental and economic benefits is expected to further reinforce the advantages of using EFAs in concrete at a specific infrastructure project and location.

5. Conclusions

This study evaluated the use of AutoSR-derived EFAs as a partial replacement for NFA in concrete. Given the limited prior research on AutoSR in structural concrete, EFAs represent a novel material requiring systematic investigation. The results demonstrate that concrete with 10% EFA replacement can achieve mechanical performance comparable to that of conventional mixtures, provided that absorption and grading are properly controlled during mix design. However, fresh concrete’s workability decreased significantly (5–19 mm for EFA mixes vs. 38 mm for M1) due to the high absorption capacity of EFAs, which increased the water demand and reduced slump. Hydration behavior and UPV responses were comparable to M1, indicating that EFAs do not significantly affect hydration kinetics, despite differences in chemical composition. This enabled the development of maturity-based master curves, which offer practical advantages over conventional maturity methods, including reduced testing effort, lower costs, and improved efficiency in predicting strength development across mixture variations [53].
From a mechanical standpoint, the compressive strength, elastic modulus, and MOR generally decreased with EFA incorporation. Compressive strength decreased in M2–M7 by 6.99–29.44 MPa ( p     0.05 ), while M8 showed no significant difference. The elastic modulus decreased in M2 and M4–M7 by 5.5–11.3 GPa ( p     0.05 ), whereas M3 and M8 remained statistically comparable to M1. The MOR decreased significantly only in M3–M5 by 1.37–1.76 MPa ( p     0.05 ), with other mixtures showing comparable behavior. These reductions were not associated with changes in hydration or bulk porosity, which remained within a narrow range (9–13%), but were instead governed by microstructural changes at the ITZ. Regression analysis confirmed strong relationships between the compressive strength and slump ( R 2 = 0.98, p ≤ 0.05); elastic modulus and absorption ( R 2 = 0.85, p ≤ 0.05); and compressive strength and ITZ thickness ( R 2 = 0.73, p = 0.007). Importantly, slump should not be interpreted as an independent governing variable but rather as an indicator of absorption-driven water redistribution within the mixture. Increased EFA absorption reduces the effective paste quality, weakens the paste–aggregate bond, promotes ITZ thickening, and ultimately leads to reductions in strength and stiffness. Overall, the results show a clear mechanism: higher EFA absorption redistributes water within the mix, leading to a thicker ITZ and, ultimately, reduced strength and stiffness. Accordingly, performance improvement should focus on controlling the ITZ through the surface treatment or conditioning of EFAs, rather than modifying the overall mix proportions.
Based on the identified mechanism, performance control should focus on
  • Limiting absorption to avoid unintended increases in the w/c ratio;
  • Developing and validating EFA surface modification and pre-conditioning treatments to control ITZ thickening, particularly at 10% replacement level;
  • Verifying that treated EFAs meet compressive strength, stiffness, and durability requirements under standard structural concrete test protocols.
Overall, 10% EFA replacement is feasible for achieving an acceptable level of strength, provided that the mix design and curing are properly controlled. Most mixtures exceeded the target compressive strength of 28 MPa, except M4 (23.41 MPa) and M7 (17.53 MPa). The elastic moduli of M3 (≈18.2 GPa) and M8 (≈18.3 GPa) remained comparable to that of M1 (≈18.8 GPa), consistent with their similar unit weights.
This study focused on a low replacement level (10%) to isolate material effects while maintaining relevance to structural applications. While the results provide insights into the behavior of AutoSR-modified concrete, further work is needed to support broader implementation. Future research should focus on (i) mixture optimization at different EFA contents, (ii) durability under various environmental and service conditions, and (iii) the effects of feedstock variability on repeatability, including variations in EFA properties caused by changes in AutoSR composition, dismantling practices, and plant operations over time. For practical implementation, this will likely require source control, routine incoming-material characterization, and possibly pre-processing or classification protocols to maintain consistent concrete performance. Most importantly, the results identify a practical treatment strategy: performance improvement should focus on controlling ITZ formation (for example, through the surface modification or pre-conditioning of EFAs), rather than changing the concrete mix proportions. A further limitation of the study is the use of three specimens per mixture for mechanical testing. Although the observed trends are consistent with the mechanistic analysis, future studies with larger sample sizes are needed to strengthen the statistical robustness of the mixture-to-mixture comparisons.
In terms of the environmental and economic impacts, the use of EFAs as a replacement for virgin fine aggregate offers clear potential benefits. EFAs are direct by-products of the automotive recycling process and typically require no additional processing, while they are currently disposed of in landfills at a cost of approximately USD 40–45 per ton. In contrast, the production of virgin fine aggregate is associated with greenhouse gas emissions of about 8.1 kg CO2 per ton, including extraction and processing [63,64]. These factors indicate that using EFAs can reduce both disposal costs and emissions, even at low replacement levels. When considered alongside the mechanistic findings of this study, EFAs can be viewed as a viable material option, provided that ITZ development is properly controlled. In terms of the economic and environmental benefits, future work should include a detailed LCA analysis for specific infrastructure projects to reflect the local conditions. It is expected that such assessments will further reinforce the benefits of using EFAs in construction.

Author Contributions

Conceptualization, D.G. and O.A.B.A.; methodology, D.G. and O.A.B.A.; software, D.G. and O.A.B.A.; validation, D.G. and O.A.B.A.; formal analysis, D.G. and O.A.B.A.; investigation, D.G. and O.A.B.A.; resources, D.G.; data curation, D.G. and O.A.B.A.; writing—original draft preparation, D.G. and O.A.B.A.; writing—review and editing, D.G. and O.A.B.A.; visualization, D.G. and O.A.B.A.; supervision, D.G.; project administration, D.G.; funding acquisition, D.G. All authors have read and agreed to the published version of the manuscript.

Funding

This research was funded by Joseph Smith & Sons, Inc.

Institutional Review Board Statement

Not applicable.

Informed Consent Statement

Not applicable.

Data Availability Statement

The original contributions presented in this study are included in the article. Further inquiries can be directed to the corresponding author.

Acknowledgments

The authors would like to recognize the contributions and involvement of Karla Ivonne Arenas in the laboratory experimentation and analysis of this study. The authors also acknowledge the support provided by Joseph Smith & Sons, Inc. by funding this research.

Conflicts of Interest

The authors declare no conflicts of interest.

References

  1. Watari, T.; Cao, Z.; Serrenho, A.C.; Cullen, J. Growing Role of Concrete in Sand and Climate Crises. iScience 2023, 26, 106782. [Google Scholar] [CrossRef] [PubMed]
  2. Khaiyum, M.Z.; Sarker, S.; Kabir, G. Evaluation of Carbon Emission Factors in the Cement Industry: An Emerging Economy Context. Sustainability 2023, 15, 15407. [Google Scholar] [CrossRef]
  3. Hajek, P. Sustainability Perspective in Fib MC2020: Contribution of Concrete Structures to Sustainability. Struct. Concr. 2023, 24, 4352–4361. [Google Scholar] [CrossRef]
  4. Kaptan, K.; Cunha, S.; Aguiar, J. A Review: Construction and Demolition Waste as a Novel Source for CO2 Reduction in Portland Cement Production for Concrete. Sustainability 2024, 16, 585. [Google Scholar] [CrossRef]
  5. Abera, Y.A. Performance of Concrete Materials Containing Recycled Aggregate from Construction and Demolition Waste. Results Mater. 2022, 14, 100278. [Google Scholar] [CrossRef]
  6. Ahmad, J.; Zhou, Z.; Majdi, A.; Alqurashi, M.; Deifalla, A.F. Overview of Concrete Performance Made with Waste Rubber Tires: A Step toward Sustainable Concrete. Materials 2022, 15, 5518. [Google Scholar] [CrossRef]
  7. Batayneh, M.; Marie, I.; Asi, I. Use of Selected Waste Materials in Concrete Mixes. Waste Manag. 2007, 27, 1870–1876. [Google Scholar] [CrossRef]
  8. Kisku, N.; Joshi, H.; Ansari, M.; Panda, S.K.; Nayak, S.; Dutta, S.C. A Critical Review and Assessment for Usage of Recycled Aggregate as Sustainable Construction Material. Constr. Build. Mater. 2017, 131, 721–740. [Google Scholar] [CrossRef]
  9. Pavlů, T. The Utilization of Recycled Materials for Concrete and Cement Production—A Review. IOP Conf. Ser. Mater. Sci. Eng. 2018, 442, 012014. [Google Scholar] [CrossRef]
  10. Maier, P.L.; Durham, S.A. Beneficial Use of Recycled Materials in Concrete Mixtures. Constr. Build. Mater. 2012, 29, 428–437. [Google Scholar] [CrossRef]
  11. Sánchez-Roldán, Z.; Valverde-Palacios, I.; Valverde-Espinosa, I.; Martín-Morales, M. Microstructural Analysis of Concretes Manufactured with Recycled Coarse Aggregates Pre-Soaked Using Different Methods. Mater. Constr. 2020, 70, e228. [Google Scholar] [CrossRef]
  12. Evangelista, L.; Guedes, M.; Ferro, A.C.; De Brito, J. Microstructure of Concrete Prepared with Construction Recycled Aggregates. Microsc. Microanal. 2013, 19, 147–148. [Google Scholar] [CrossRef]
  13. García-González, J.; Rodríguez-Robles, D.; Juan-Valdés, A.; Morán-del Pozo, J.M.; Guerra-Romero, M.I. Porosity and Pore Size Distribution in Recycled Concrete. Mag. Concr. Res. 2015, 67, 1214–1221. [Google Scholar] [CrossRef]
  14. Gómez-Soberón, J.M.V. Porosity of Recycled Concrete with Substitution of Recycled Concrete Aggregate. Cem. Concr. Res. 2002, 32, 1301–1311. [Google Scholar] [CrossRef]
  15. Diamond, S.; Huang, J. The ITZ in Concrete—A Different View Based on Image Analysis and SEM Observations. Cem. Concr. Compos. 2001, 23, 179–188. [Google Scholar] [CrossRef]
  16. Ollivier, J.P.; Maso, J.C.; Bourdette, B. Interfacial Transition Zone in Concrete. Adv. Cem. Based Mater. 1995, 2, 30–38. [Google Scholar] [CrossRef]
  17. Poon, C.S.; Shui, Z.H.; Lam, L. Effect of Microstructure of ITZ on Compressive Strength of Concrete Prepared with Recycled Aggregates. Constr. Build. Mater. 2004, 18, 461–468. [Google Scholar] [CrossRef]
  18. Sidorova, A.; Vazquez-Ramonich, E.; Barra-Bizinotto, M.; Roa-Rovira, J.J.; Jimenez-Pique, E. Study of the Recycled Aggregates Nature’s Influence on the Aggregate–Cement Paste Interface and ITZ. Constr. Build. Mater. 2014, 68, 677–684. [Google Scholar] [CrossRef]
  19. Nourreddine, M. Recycling of Auto Shredder Residue. J. Hazard. Mater. 2007, 139, 481–490. [Google Scholar] [CrossRef]
  20. Inglezakis, V.J.; Zorpas, A.A. Automotive Shredder Residue (ASR): A Rapidly Increasing Waste Stream Waiting for a Sustainable Response. WIT Trans. Ecol. Environ. 2009, 120, 835–843. [Google Scholar] [CrossRef]
  21. Cossu, R.; Lai, T. Automotive Shredder Residue (ASR) Management: An Overview. Waste Manag. 2015, 45, 143–151. [Google Scholar] [CrossRef] [PubMed]
  22. Xu, G.J.; Watt, D.F.; Hudec, P.P.; MacDonald, K.A.; Northwood, D.O. Recycling Automotive Related Wastes in Concrete. J. Mater. Process. Technol. 1995, 48, 385–390. [Google Scholar] [CrossRef]
  23. Péra, J.; Ambroise, J.; Chabannet, M. Valorization of Automotive Shredder Residue in Building Materials. Cem. Concr. Res. 2004, 34, 557–562. [Google Scholar] [CrossRef]
  24. Caetano, J.A.; Schalch, V.; Pablos, J.M. Characterization and Recycling of the Fine Fraction of Automotive Shredder Residue (ASR) for Concrete Paving Blocks Production. Clean Technol. Environ. Policy 2020, 22, 835–847. [Google Scholar] [CrossRef]
  25. Fantilli, A.P.; Chiaia, B. Mechanical Properties of Concrete Made with Fluff. In SP-334: Sustainable Concrete with Beneficial Byproducts; American Concrete Institute: Farmington Hills, MI, USA, 2019. [Google Scholar]
  26. Rossetti, V.A.; Di Palma, L.; Medici, F. Production of Aggregate from Non-Metallic Automotive Shredder Residues. J. Hazard. Mater. 2006, 137, 1089–1095. [Google Scholar] [CrossRef]
  27. Rao, J.; Hagare, D.; Tao, Z. Upcycling of End-of-Life-Vehicle (ELV) Plastics as a Replacement for Natural Fine Aggregate in Concrete. Resour. Conserv. Recycl. Adv. 2024, 21, 200210. [Google Scholar] [CrossRef]
  28. Rao, J.; Hagare, D.; Tao, Z. Upcycling Mixed Plastic Waste as a Replacement for Natural Aggregates in Concrete: A Critical Review. J. Build. Eng. 2025, 114, 114037. [Google Scholar] [CrossRef]
  29. Gunaratne, T.; Johansson, J.; Svensson, N. Environmental Potential of Shredder Fines Valorisation. Waste Manag. 2022, 154, 223–231. [Google Scholar] [CrossRef]
  30. Gámez-García, D.C.; Vargas-Leal, A.J.; Serrania-Guerra, D.A.; González-Borrego, J.G.; Saldaña-Márquez, H. Sustainable Concrete with Recycled Aggregate from Plastic Waste: Physical–Mechanical Behavior. Appl. Sci. 2025, 15, 3468. [Google Scholar] [CrossRef]
  31. Skibicki, S.; Pułtorak, M.; Kaszyńska, M.; Hoffmann, M.; Ekiert, E.; Sibera, D. The Effect of Using Recycled PET Aggregates on Mechanical and Durability Properties of 3D Printed Mortar. Constr. Build. Mater. 2022, 335, 127443. [Google Scholar] [CrossRef]
  32. Tayeh, B.A.; Almeshal, I.; Magbool, H.M.; Alabduljabbar, H.; Alyousef, R. Performance of Sustainable Concrete Containing Different Types of Recycled Plastic. J. Clean. Prod. 2021, 328, 129517. [Google Scholar] [CrossRef]
  33. Abu-Saleem, M.; Zhuge, Y.; Hassanli, R.; Ellis, M.; Rahman, M.; Levett, P. Evaluation of Concrete Performance with Different Types of Recycled Plastic Waste for Kerb Application. Constr. Build. Mater. 2021, 293, 123477. [Google Scholar] [CrossRef]
  34. ASTM C595/C595M-20; Specification for Blended Hydraulic Cements. C01 Committee ASTM International: West Conshohocken, PA, USA, 2021. [CrossRef]
  35. Berke, N.S.; Inceefe, A.N.; Kramer, A.; Antommattei, O.R. Durability of Portland Limestone Cement Concrete. Concr. Int. 2022, 44, 34–39. [Google Scholar] [CrossRef]
  36. Schexnayder, C.J. Producers Shift to Make More Lower-Carbon Portland-Limestone Cement. 2022. Available online: https://www.enr.com/articles/53850-producers-shift-to-make-more-lower-carbon-portland-limestone-cement (accessed on 9 March 2026).
  37. Akerele, D.D.; Aguayo, F.; Wu, L. Portland Limestone Cement in Concrete Pavement and Bridge Decks: Performance Evaluation and Future Directions. Buildings 2025, 15, 660. [Google Scholar] [CrossRef]
  38. Guidroz, S. Investigating the Influence of Portland Limestone Cement Combined with Sugarcane Bagasse Ash and Different Types of Fly Ash on the Mechanical Properties of Engineered Cementitious Composites. Master’s Thesis, Louisiana State University and Agricultural & Mechanical College, Baton Rouge, LA, USA, 2023. [Google Scholar]
  39. Breedon Group plc. Portland Limestone Cement (CEM II/A-L 52.5 N) Technical Data Sheet; Breedon Group plc: Derbyshire, UK; Available online: https://www.breedongroup.com/content/dam/breedon/corporate/documents/products-services/gb/brochure/cement/breedon-portland-limestone/Portland_Limestone_Cement_DS.pdf.downloadasset.pdf (accessed on 9 March 2026).
  40. ASTM C33/C33M-24a; Specification for Concrete Aggregates. C09 Committee ASTM International: West Conshohocken, PA, USA, 2024. [CrossRef]
  41. ASTM C127-24; Test Method for Relative Density (Specific Gravity) and Absorption of Coarse Aggregate. C09 Committee ASTM International: West Conshohocken, PA, USA, 2024. [CrossRef]
  42. ASTM C128-22; Test Method for Relative Density (Specific Gravity) and Absorption of Fine Aggregate. C09 Committee ASTM International: West Conshohocken, PA, USA, 2025. [CrossRef]
  43. Pine Test Equipment, Inc. AFA2A and AFA2C Aggregate Image Measurement System Operation Manual; Pine Test Equipment, Inc.: Grove City, PA, USA, 2017. [Google Scholar]
  44. ASTM C1252-23; Test Methods for Uncompacted Void Content of Fine Aggregate (as Influenced by Particle Shape, Surface Texture, and Grading). D04 Committee ASTM International: West Conshohocken, PA, USA, 2023. [CrossRef]
  45. ASTM C136/C136M-19; Test Method for Sieve Analysis of Fine and Coarse Aggregates. C09 Committee ASTM International: West Conshohocken, PA, USA, 2025. [CrossRef]
  46. ACI 211.1-22; Selecting Proportions for Normal-Density and High-Density Concrete—Guide. American Concrete Institute: Farmington Hills, MI, USA, 2022.
  47. Standard Specifications for Construction and Materials; Maryland Department of Transportation State Highway Administration (MDOT SHA): Baltimore, MD, USA, 2024. Available online: https://roads.maryland.gov/mdotsha/pages/sscm.aspx?PageId=853&lid=SSP (accessed on 9 March 2026).
  48. ASTM C192/C192M-25; Practice for Making and Curing Concrete Test Specimens in the Laboratory. C09 Committee ASTM International: West Conshohocken, PA, USA, 2025. [CrossRef]
  49. ASTM C138/C138M-24a; Test Method for Density (Unit Weight), Yield, and Air Content (Gravimetric) of Concrete. C09 Committee ASTM International: West Conshohocken, PA, USA, 2024. [CrossRef]
  50. ASTM C231/C231M-22; Test Method for Air Content of Freshly Mixed Concrete by the Pressure Method. C09 Committee ASTM International: West Conshohocken, PA, USA, 2024. [CrossRef]
  51. ASTM C143/C143M-20; Test Method for Slump of Hydraulic-Cement Concrete. C09 Committee ASTM International: West Conshohocken, PA, USA, 2026. [CrossRef]
  52. ASTM C1074-19e1; Practice for Estimating Concrete Strength by the Maturity Method. C09 Committee ASTM International: West Conshohocken, PA, USA, 2021. [CrossRef]
  53. ASTM C39/C39M-24; Test Method for Compressive Strength of Cylindrical Concrete Specimens. C09 Committee ASTM International: West Conshohocken, PA, USA, 2024. [CrossRef]
  54. ASTM C78/C78M-22; Test Method for Flexural Strength of Concrete (Using Simple Beam with Third-Point Loading). C09 Committee ASTM International: West Conshohocken, PA, USA, 2022. [CrossRef]
  55. ASTM C469/C469M-22; Test Method for Static Modulus of Elasticity and Poissons Ratio of Concrete in Compression. C09 Committee ASTM International: West Conshohocken, PA, USA, 2022. [CrossRef]
  56. ASTM C597-22; Test Method for Pulse Velocity Through Concrete. C09 Committee ASTM International: West Conshohocken, PA, USA, 2023. [CrossRef]
  57. ASTM C642-21; Test Method for Density, Absorption, and Voids in Hardened Concrete. C09 Committee ASTM International: West Conshohocken, PA, USA, 2022. [CrossRef]
  58. Nafiuzzaman, M.; Jakir, T.I.; Aditi, I.J.; Kabir, A.; Ahsan, K.A. Different Machine Learning Approaches to Predict the Compressive Strength of Composite Cement Concrete. J. Build. Pathol. Rehabil. 2025, 10, 88. [Google Scholar] [CrossRef]
  59. Zhao, Y.; Goulias, D.; Saremi, S. Enhancing Prediction Accuracy of Concrete Compressive Strength Using Stacking Ensemble Machine Learning. Comput. Concr. 2023, 32, 233–250. [Google Scholar] [CrossRef]
  60. Saremi, S.; Goulias, D. Non-Destructive Testing in Concrete Maturity Modeling and Master Curve Development. Appl. Sci. 2023, 13, 7770. [Google Scholar] [CrossRef]
  61. Korouzhdeh, T.; Eskandari-Naddaf, H.; Kazemi, R. The ITZ Microstructure, Thickness, Porosity and Its Relation with Compressive and Flexural Strength of Cement Mortar; Influence of Cement Fineness and Water/Cement Ratio. Front. Struct. Civ. Eng. 2022, 16, 191–201. [Google Scholar] [CrossRef]
  62. National Ready Mixed Concrete Association (NRMCA). Estimated Ready Mixed Concrete Production by State—2024; National Ready Mixed Concrete Association: Alexandria, VA, USA, 2024. [Google Scholar]
  63. Lei, B.; Yu, L.; Chen, Z.; Yang, W.; Deng, C.; Tang, Z. Carbon Emission Evaluation of Recycled Fine Aggregate Concrete Based on Life Cycle Assessment. Sustainability 2022, 14, 14448. [Google Scholar] [CrossRef]
  64. Hwang, J.-W.; Kim, J.-W.; Yang, K.-H. Case Study on Lifecycle CO2 Assessment of Recycled Aggregate Concrete. Case Stud. Constr. Mater. 2025, 23, e05261. [Google Scholar] [CrossRef]
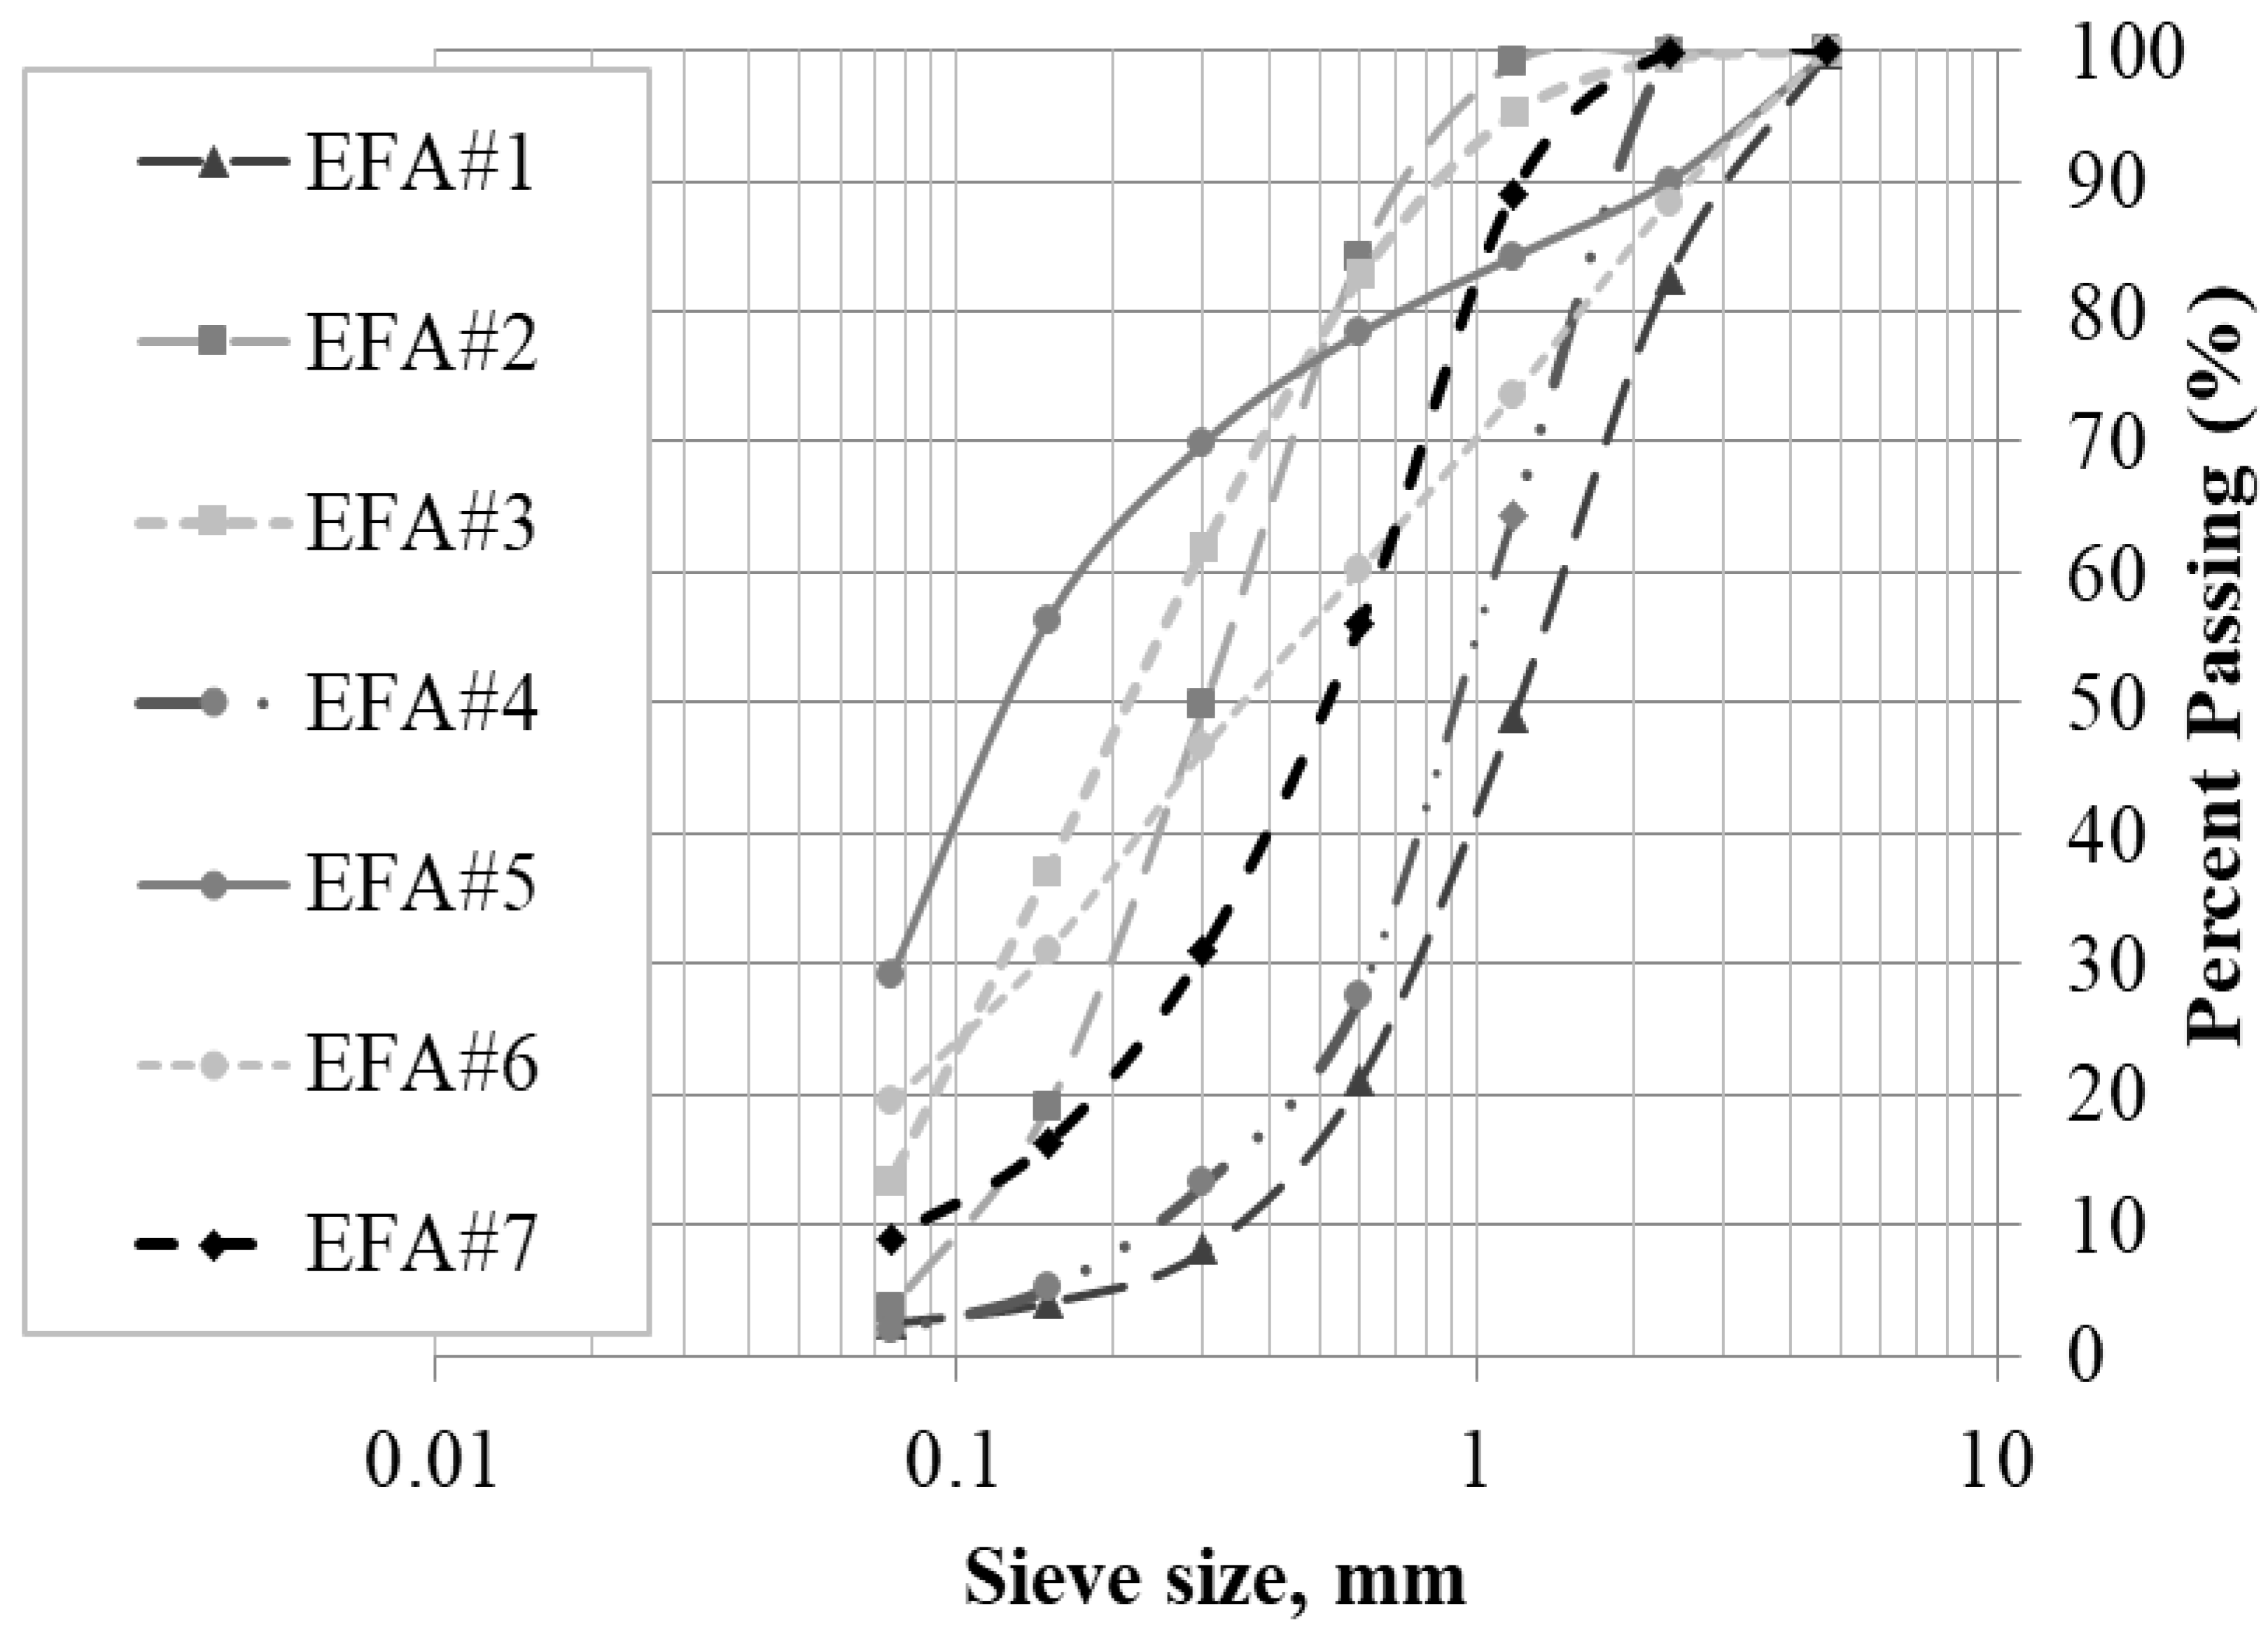
Figure 1. Gradation curves of EFAs.
Sustainability 18 03540 g001
Figure 2. Testing plan for concrete mixes.
Sustainability 18 03540 g002
Figure 3. Slump vs. absorption of FA or EFA.
Sustainability 18 03540 g003
Figure 4. (A) iButton temperature sensors; (B) iButton locations in concrete cylinders.
Sustainability 18 03540 g004
Figure 5. Temperature vs. age for concrete mixes.
Sustainability 18 03540 g005
Figure 6. Temperature–time factors for concrete mixes at 1, 2, 3, 7, 14, 21, and 28 days.
Sustainability 18 03540 g006
Figure 7. Temperature–time factors vs. average UPVs for all concrete mixes.
Sustainability 18 03540 g007
Figure 8. Master curve for UPV vs. time–temperature factor.
Sustainability 18 03540 g008
Figure 9. Pearson’s correlations for UPV shift factors and predictors V 9 and V 16 .
Sustainability 18 03540 g009
Figure 10. Model performance for UPV shift factor: (A) observed vs. predicted, (B) residuals vs. fitted, (C) Q–Q plot, and (D) model metrics.
Sustainability 18 03540 g010aSustainability 18 03540 g010bSustainability 18 03540 g010c
Figure 11. Average compressive strength of concrete mixes at 28 days.
Sustainability 18 03540 g011
Figure 12. Average elastic moduli of concrete mixes at 28 days.
Sustainability 18 03540 g012
Figure 13. Average moduli of rupture of concrete mixes at 28 days.
Sustainability 18 03540 g013
Figure 14. Correlation between average compressive strength and absorption of NFA or EFAs.
Sustainability 18 03540 g014
Figure 15. Correlation between average compressive strength and slump.
Sustainability 18 03540 g015
Figure 16. Correlation between average elastic modulus and absorption of NFA or EFAs.
Sustainability 18 03540 g016
Figure 19. Examples of concrete phases at 50× magnification for (A) mix M1 and (B) mix M8.
Sustainability 18 03540 g019
Figure 20. Example concrete imaging for mix M3 at 250× magnification: (A) colored, (B) grayscale.
Sustainability 18 03540 g020
Figure 21. Influence of ITZ thickness on compressive strength.
Sustainability 18 03540 g021
Table 1. SEM elemental analysis of NFA and EFAs.
ElementNFA
(%)
EFA-1
(%)
EFA-2
(%)
EFA-3
(%)
EFA-4
(%)
EFA-5
(%)
EFA-6
(%)
EFA-7
(%)
C-44.927.634.843.553.222.222.9
O61.145.242.045.140.739.143.339.9
Ca22.81.43.13.21.81.66.03.3
Mg10.50.51.01.30.60.31.00.7
Al2.03.18.31.48.40.93.61.3
Fe0.71.05.23.42.52.611.029.6
Si2.52.19.38.22.51.56.72.4
K0.40.40.7
P0.4
S0.4
Na0.12.40.80.2
Zn2.5
Ti1.30.5
Table 2. Physical properties of NFA and EFAs.
PropertyNFAEFA-1EFA-2EFA-3EFA-4EFA-5EFA-6EFA-7
Apparent SG2.802.422.852.352.101.211.514.57
Absorption (%)1.232.871.832.883.7332.2816.870.40
Fineness modulus3.053.351.481.242.901.212.02.08
Form 2D 17.87.56.36.97.57.46.47.4
Angularity 22776.82990.11919.12263.33062.02891.82383.72881.8
Average uncompacted void content (%)39.742.555.957.547.259.555.261.3
Note: 1 AIMS 2—Form 2D scale: 0 ≤ low ≤ 6.5 (circular shape); 6.5 < moderate ≤ 8; 8 < high ≤ 10; 10 < extreme ≤ 20 (elongated). 2 AIMS 2—Angularity scale: 0 ≤ low ≤ 2100 (circular shape); 2100 < moderate ≤ 3975; 3975 < high ≤ 5400; 5400 < extreme ≤ 10,000 (extremely angular).
Table 3. Concrete mix proportioning.
MixEFA Content
(% by Volume)
Cement
(kg/m3)
Water (kg/m3)CA
(kg/m3)
NFA
(kg/m3)
EFA
(kg/m3)
M1100% NFA3641191102855
M290% NFA + 10%EFA-1364120110277074
M390% NFA + 10% EFA-2364119111277077
M490% NFA + 10% EFA-3364120111277061
M590% NFA + 10% EFA-4364126110177060
M690% NFA + 10% EFA-5364134110977031
M790% NFA + 10% EFA-6364130110977039
M890% NFA + 10% EFA-73641241109770118
Table 4. Physical properties of fresh concrete mixes.
MixSlump
(mm)
Air Content (%)Theoretical Unit Weight
(kg/m3)
Measured Unit Weight
(kg/m3)
M1382.825532513
M2132.425412528
M363.025542513
M4192.325412521
M5176.525312337
M662.125102386
M763.025182376
M851.825992474
Table 5. UPV vs. time–temperature relationships for all mixtures.
Mix a b R2Shift Factor
M1113.84449.10.81495.6
M2250.13408.21.0454.7
M3556.51281.81.0−1671.7
M4438.61657.50.9−1296.0
M5272.42953.50.90.0 (reference mix)
M6179.43840.81.0887.3
M7288.52656.60.9−296.9
M8330.93813.60.9860.1
Note: a and b are logarithmic regression coefficients according to Equation (5).
Table 6. Statistical analysis of 28-day compressive strength (MPa) relative to reference (M1).
MixMean (MPa)Diff vs. M1 (MPa)95% CI p a d j Holm p a d j P e r m q F D R BH
M146.97
M234.52−12.45[−15.47, −9.44]0.00360.00180.0015
M339.98−6.99[−9.98, −4.01]0.00770.02460.0045
M423.41−23.56[−26.82, −20.30]0.00250.00020.0012
M527.08−19.89[−22.99, −16.79]0.00050.00060.0005
M636.91−10.06[−13.05, −7.07]0.00360.00600.0015
M717.53−29.44[−32.70, −26.17]0.00180.00010.0011
M845.37−1.60[−4.74, 1.55]0.23020.67380.2302
Note: M1 is the reference mix; Diff vs. M1 = x ¯ Mix x ¯ M 1 ; 95% CI: two-sided Welch confidence interval for Diff vs. M1; p a d j Holm : Holm–Bonferroni-adjusted p ; p a d j P e r m : Westfall–Young single-step permutation-adjusted p ; q F D R BH : Benjamini–Hochberg false discovery rate q ; α = 0.05 ; n = 3  per mix.
Table 7. Statistical analysis of 28-day modulus of rupture (MPa) relative to reference (M1).
MixMean (MPa)Diff vs. M1 (MPa)95% CI p a d j Holm p a d j P e r m q F D R BH
M16.11
M25.45−0.65[−1.05, −0.26]0.05680.09540.0249
M34.74−1.37[−1.92, −0.81]0.01840.05640.0088
M44.34−1.76[−2.23, −1.29]0.01890.00500.0088
M54.39−1.71[−2.20, −1.22]0.00520.02540.0052
M66.42+0.32[−0.15, 0.79]0.30020.25400.1179
M75.90−0.20[−0.60, 0.20]0.30020.68170.2313
M85.81−0.29[−0.68, 0.10]0.30020.38500.1179
Note: M1 is the reference mix; Diff vs. M1 = x ¯ Mix x ¯ M 1 ; 95% CI: two-sided Welch confidence interval for Diff vs. M1; p a d j Holm : Holm–Bonferroni-adjusted p ; p a d j P e r m : Westfall–Young single-step permutation-adjusted p ; q F D R BH : Benjamini–Hochberg false discovery rate q ; α = 0.05 ; n = 3  per mix.
Table 8. Statistical analysis of 28-day elastic modulus (MPa) relative to reference (M1).
MixMean (MPa)Diff vs. M1 (MPa)95% CI p a d j Holm p a d j P e r m q F D R BH
M118,798.57
M211,195.06−7603.51[−10,858.76, −4348.26]0.03690.02580.0161
M318,187.09−611.48[−3401.80, 2178.84]1.00000.96980.5582
M412,586.21−6212.36[−8972.47, −3452.25]0.02440.07100.0100
M57505.28−11,293.29[−14,578.42, −8008.16]0.02440.00780.0100
M613,274.31−5524.26[−9255.41, −1793.10]0.04680.13850.0218
M710,111.46−8687.11[−11,524.54, −5849.69]0.01950.02260.0100
M818,256.94−541.63[−3842.21, 2758.95]1.00000.97140.5582
Note: M1 is the reference mix; Diff vs. M1 = x ¯ Mix x ¯ M 1 ; 95% CI: two-sided Welch confidence interval for Diff vs. M1; p a d j Holm : Holm–Bonferroni-adjusted p ; p a d j P e r m : Westfall–Young single-step permutation-adjusted p ; q F D R BH : Benjamini–Hochberg false discovery rate q ; α = 0.05 ; n = 3  per mix.
Table 10. Volumes of voids and density of concrete mixes.
MixVolume of Permeable Pore Space (%)Bulk Density Dry (Mg/m3)Apparent Density
(Mg/m3)
M113.112.432.80
M210.652.472.77
M311.282.462.77
M413.312.392.76
M59.022.372.60
M611.842.352.66
M79.902.432.70
M812.902.372.72
Table 11. Statistical analysis of ITZ thickness (µm) relative to reference (M1).
MixMean (µm)Diff vs. M1 (µm)95% CI p a d j Holm p a d j P e r m q F D R BH
M118.59
M225.536.94[4.84, 9.04]0.00310.00480.0012
M319.140.55[−7.96, 9.06]0.81850.99990.8185
M436.9018.31[15.24, 21.38]0.00250.00020.0010
M527.158.56[6.33, 10.79]0.00310.00330.0010
M627.518.92[6.67, 11.17]0.00310.00310.0010
M744.4525.86[22.06, 29.66]0.00250.00010.0010
M827.568.97[6.72, 11.22]0.00310.00310.0010
Note: M1 is the reference mix; Diff vs. M1 = x ¯ Mix x ¯ M 1 ; 95% CI: two-sided Welch confidence interval for Diff vs. M1; p a d j Holm : Holm–Bonferroni-adjusted p ; p a d j P e r m : Westfall–Young single-step permutation-adjusted p ; q F D R BH : Benjamini–Hochberg false discovery rate q ; α = 0.05 ; n = 3  per mix.
Table 12. Average ITZ thickness (µm) and average compressive strength (MPa)—28-day model and performance.
Model
Coefficient
Model Performance
a b R 2 R 2 a d j R M S E   (MPa) M A E (MPa)Model p-ValueKS StatKS p-Value
63.35−1.040.730.685.153.940.0070.1750.933
Note: Model follows y = a + b x ; y : compressive strength (MPa); x : ITZ thickness (µm); a : intercept; b : slope; R 2 , R adj 2 : coefficients of determination; RMSE and MAE: error indices; model p-value: regression significance; KS: Kolmogorov–Smirnov statistic and its p-value for residual normality.
Disclaimer/Publisher’s Note: The statements, opinions and data contained in all publications are solely those of the individual author(s) and contributor(s) and not of MDPI and/or the editor(s). MDPI and/or the editor(s) disclaim responsibility for any injury to people or property resulting from any ideas, methods, instructions or products referred to in the content.