1. Introduction
The Sustainable Development Goals (SDGs), especially SDG 8 (decent work and economic growth), SDG 11 (sustainable cities and communities), and SDG 12 (sustainable consumption patterns), are intimately related to the resilience of domestic tourism. Under structural uncertainty, regionally adaptive resilience techniques are supported by an understanding of varied recovery dynamics [
1,
2].
Recent research has underscored the significance of including spatial dependence in regional shock modeling. Bhattacharjee et al. [
3] amalgamate spatial econometric methodologies with dynamic microsimulation to examine the diverse regional effects of shocks. Likewise, spatial factor models [
4,
5] offer robust frameworks for elucidating cross-sectional dependence in high-dimensional spatiotemporal datasets. Although conventional methods depend on statistical factor decomposition, this study employs a representation learning approach that integrates provincial embeddings with spatial lag characteristics to elucidate both latent heterogeneity and geographic dependence [
3].
In contrast to these econometric frameworks, the present study adopts a deep learning–based representation learning approach where spatial heterogeneity and nonlinear cross-regional interactions are captured through province embeddings within recurrent neural networks [
5].
Domestic tourism serves as a structural stabilizer during times of external volatility, rendering it a crucial component of national economic systems, especially in emerging economies. Domestic travel accounts for a sizeable amount of Thailand’s overall tourism industry and makes a significant contribution to employment creation, regional income distribution, and service sector productivity. However, due to fundamental variations in demand segmentation, infrastructural capacity, and economic makeup, Thailand’s tourism dynamics are highly uneven between regions. Consequently, modeling at the provincial level is crucial for comprehending diverse regional performance and creating tourism strategies that prioritize resilience [
3,
4].
In addition to exposing structural weaknesses in tourism systems, the COVID-19 pandemic also demonstrated the shortcomings of traditional forecasting techniques that rely on stationarity and homogeneous adjustment. Research shows that the recovery of tourism after systemic shocks is nonlinear with respect to time and space [
5]. In Thailand, official reports from the Tourism Authority of Thailand [
6] and the Bank of Thailand [
7] show substantial differences in the rate of recovery amongst provinces, with some showing quick domestic recovery and others experiencing protracted stagnation. These trends imply that the recovery of domestic travel should not be viewed as a unified national rebound but rather as a process of spatiotemporal reconfiguration.
Historically, tourism demand forecasting relied on econometric and statistical time-series models, such as ARIMA and error-correction frameworks [
8]. These models are theoretically interpretable, but they make assumptions about structural stability and linear adjustment processes, which are commonly broken in large-scale disruptions. Sequential modeling has undergone a fundamental transformation with the advent of deep learning. Long Short-Term Memory (LSTM) networks [
6,
7,
9] and Gated Recurrent Units (GRUs) [
10] address the vanishing gradient problem and enable the effective learning of long-range temporal dependencies. Empirical comparisons confirm that LSTM architectures outperform ARIMA in forecasting nonlinear time series [
7].
Within tourism research, deep learning applications have expanded rapidly. Siami-Namini et al. [
11] and Comesaña et al. [
12] demonstrate that neural architectures improve predictive accuracy over traditional models. Cho et al. [
13] and Li et al. [
14] further highlight the suitability of deep learning in high-volatility and high-dimensional tourism environments. However, most studies focus on national aggregates and rarely incorporate explicit spatial dependence. Recent spatiotemporal approaches, including graph-based and multi-view spatial–temporal models [
11], confirm the importance of modeling geographic interactions in tourism flow prediction. Similarly, provincial analyses reveal significant clustering and spillover effects in domestic tourism systems [
4]. Despite these advances, deep learning applications integrating spatial embeddings with structured recovery metrics remain limited [
15].
Thus, three significant methodological gaps remain:
The structured shock–recovery quantification procedures used to represent regime shifts are not sufficiently integrated.
Inadequate use of spatial representation learning to account for regional variations.
A heavy reliance on forecasting frameworks that only consider one outcome, ignoring the dynamic interplay between economic success indicators and demand for tourism.
The recovery of domestic tourism should be viewed from the standpoint of systems engineering as a regime-sensitive spatiotemporal dynamical system with delayed feedback effects, nonlinear transitions, and diverse regional responses. Forecasting architectures that can concurrently describe temporal memory, spatial embeddings, and multi-task objectives within a single analytical framework are necessary to address these features.
In light of this, this study uses monthly provincial-level data from 2019 to 2023 to present a deep-learning-driven spatiotemporal modeling framework for assessing and forecasting Thailand’s domestic tourism dynamics. The approach captures heterogeneous recovery trajectories and regime-switch behavior across provinces by combining multi-task recurrent neural networks (LSTM and GRU), province-level spatial embeddings, temporal engineering aspects, and baseline-based shock–recovery metrics. Time-preserving evaluation techniques are used to compare model performance to statistical and machine learning baselines.
The following research questions are addressed in this study in order to direct the empirical investigation:
This study investigates the potential of deep learning architectures to enhance predictive performance and effectively capture the diverse dynamics of tourist recovery across provinces in the aftermath of systemic shocks, thereby addressing the shortcomings of current tourism demand forecasting methodologies. The study specifically examines recurrent neural network designs, especially Long Short-Term Memory (LSTM) and Gated Recurrent Unit (GRU), which have exhibited significant proficiency in modeling temporal dependencies within intricate time-series data. In light of this purpose, the study articulates the subsequent research questions:
RQ1: Do deep learning architectures (LSTM and GRU) provide superior forecasting accuracy for provincial tourism demand relative to traditional statistical models?
RQ2: Does the incorporation of spatial representations improve the modeling of various tourism recovery mechanisms following systemic shocks?
Two testable hypotheses are used to look into these study questions even more. First, deep learning architectures are anticipated to deliver enhanced predictive performance relative to conventional time-series models in anticipating tourism demand. Second, adding spatial representations to the modeling framework should make predictions more accurate by taking into account regional differences and the way recovery works in different areas.
H1. When it comes to anticipating tourism demand, deep learning models are superior to traditional time-series models.
H2. Predictions are more accurate when you use spatial representations instead of only time-based models.
Through the integration of resilience-oriented tourist system analysis and deep representation learning, this study advances methodology and offers practical policy recommendations for managing sustainable tourism in the face of structural uncertainty.
The recovery of domestic tourism following COVID-19 should not be viewed as a straightforward return to a pre-pandemic equilibrium, but rather as a regime-sensitive spatiotemporal reconfiguration process from the standpoint of systems engineering. Forecasting architectures that combine temporal memory processes, geographical heterogeneity modeling, and structured recovery measures into a single analytical framework are necessary to capture such dynamics [
8].
From a theoretical perspective, this study is grounded in tourism resilience theory and spatiotemporal system modeling. Specifically, the recovery of tourism demand is conceptualized as a nonlinear adaptive process influenced by regional heterogeneity and systemic shocks [
8,
16].
This study employs a representation learning approach to model spatial heterogeneity, as opposed to a formal spatial econometric framework characterized by explicit dependence structures.
Accordingly, H1 reflects the expectation that nonlinear learning architectures outperform linear models under structural instability, while H2 is derived from spatial interaction theory, which suggests that geographically proximate regions exhibit interdependent recovery dynamics.
There is a lack of explicit regime transition quantification in structured shock–recovery modeling, and some problems are listed as follows:
The inability to capture latent provincial variability through spatial representation learning.
The widespread application of forecasting frameworks based on single outputs, which disregard the dynamic interdependencies between demand and economic performance.
Instead of being viewed as a static seasonal process, domestic tourism should be viewed as a regime-switching spatiotemporal dynamical system from an engineering systems perspective. Forecasting architectures that can learn long-memory effects, nonlinear transitions, and spatially varied resilience patterns are required by this viewpoint.
This study uses monthly provincial-level tourism data from Thailand, spanning January 2019 to February 2023, to create a deep-learning-driven spatiotemporal forecasting framework in order to address these issues [
3].
The suggested architecture incorporates the following:
Shock and recovery measures based on baselines for the quantification of organized regimes;
Characteristics that are engineered to capture seasonality, trend, volatility, and shock intensity;
Latent spatial heterogeneity is modeled via learnable province embeddings;
A multi-task learning design that forecasts net profit and tourism demand simultaneously in a single representation space.
The suggested methodology captures nonlinear regime dynamics and diverse post-pandemic recovery trajectories by integrating these elements into Long Short-Term Memory (LSTM) and Gated Recurrent Unit (GRU) architectures. Model performance is rigorously benchmarked against machine learning (XGBoost) and statistical time-series baselines under a time-preserving evaluation protocol [
17], ensuring robust and causally consistent comparison.
This study offers four contributions:
It creates a spatiotemporal analytical framework at the province level to study the dynamics of domestic travel in 77 Thai provinces prior to, during, and following the COVID-19 structural shock.
It presents a quantitative method for measuring shock recovery that is based on sustained recovery thresholds and baseline deviation.
It creates deep learning architectures that are province-aware for multi-task forecasting of economic performance and demand for tourism.
It offers a clever forecasting paradigm for planning a resilient tourist system in the face of systemic uncertainty.
The remainder of this study is organized as follows.
Section 2 describes the Materials and Methods, including the dataset, shock–recovery framework, feature engineering procedures, model architecture, and evaluation protocol.
Section 3 presents the empirical results and comparative performance analysis.
Section 4 discusses the findings, engineering interpretations, policy implications, and robustness considerations.
Section 5 concludes this study and outlines directions for future research.
2. Materials and Methods
The dataset, data processing methods, feature engineering approach, model architecture, and evaluation technique are all sufficiently covered in this section to guarantee reproducibility. The detailed documentation of all data sources, modeling techniques, and computing steps facilitates replication and advances methodologies.
Upon acceptance, the materials, processed datasets, and modeling code needed to replicate the findings will be made freely available, as implied by the publishing of this study. Any applicable limitations on the accessibility of the data are revealed below. While recently created procedures—specifically the shock–recovery quantification and spatiotemporal embedding framework—are detailed in full, established methodological elements are briefly discussed with the relevant citations.
There is no use of human subjects, personally identifiable information, or animal data in this study because it relies on aggregated provincial tourism statistics from publicly accessible databases. Ethics clearance is therefore not necessary.
2.1. Dataset Description
This study uses a monthly provincial-level domestic tourism dataset from Thailand, covering the period from January 2019 to February 2023. The data were sourced from the Tourism Authority of Thailand’s official monthly provincial tourism statistics [
16]. Eight key tourism variables are included in the dataset, which spans all 77 provinces: (1) total hotel occupancy rate; (2) Thai tourists; (3) foreign tourists; (4) occupied tourists; (5) total net profit; (6) Thai net profit; (7) foreign net profit; and (8) total number of tourists.
The variable “occupied tourists” shows how many room nights domestic tourists used in a month. This statistic shows the total demand for accommodation services, which is different from the hotel occupancy rate, which shows the percentage of available rooms that are being used. As a result, it can be used as a stand-in for tourism demand intensity.
In order to maintain proportional structure, hotel occupancy rates were aggregated using provincial methods, whereas tourism volume and net profit variables were summated across provinces for descriptive analysis at the national level. In order to facilitate aligned spatiotemporal representation and feature engineering, the dataset was converted from long format into a province × time multivariate matrix for modeling purposes.
Among the eight tourism indicators, two variables are treated as forecasting targets: (1) total domestic tourists and (2) tourism net profit. The remaining indicators (Thai tourists, foreign tourists, occupied room nights, hotel occupancy rate, and derived structural features) are used as predictor variables.
All predictor variables are included simultaneously in the input vector at each time step, together with engineered temporal and spatial features.
The dataset’s summary statistics, such as the number of provinces (77), indicators (8), and temporal coverage (50 months), as well as descriptive statistics (mean, minimum, and maximum) for important tourist variables, are shown in
Table 1. The use of nonlinear spatiotemporal modeling methodologies is justified by the dataset’s significant interprovincial variability and noticeable structural fractures over the COVID-19 timeframe.
Table 2 makes it clear what the variables do by separating targets from different kinds of predictors, such as demand, capacity, and spatiotemporal aspects. This structure lets the model take into account both changes in tourism demand and how infrastructure is used. Adding engineering elements makes it possible to model nonlinear shock–recovery patterns and seasonal changes. Province embeddings also show hidden spatial differences between regions. In general, the variable design allows a forecasting framework that is multidimensional and takes into account the situation.
2.2. COVID-19 Shock and Recovery Definition
To quantify the structural impact of the COVID-19 pandemic on provincial tourism systems, a pre-pandemic baseline was established using the average monthly value of each tourism indicator during the year 2019. Let
denote the value of tourism indicator
for province
at month
. The 2019 baseline for province
is defined as follows:
2.2.1. Shock Intensity
Shock intensity is measured as the maximum relative decline observed in 2020 compared to the 2019 baseline. Formally, it is defined as follows:
where
denotes the average level of the tourism indicator for province
in 2019, and
represents the lowest observed value in 2020.
This normalized drop ratio captures the maximum contraction relative to pre-pandemic conditions, ensuring comparability across provinces regardless of baseline scale.
2.2.2. Recovery Time
The first month following 2020 in which the tourist index reaches or surpasses its 2019 baseline for a minimum of three consecutive months is referred to as recovery time. In line with recovery measurement techniques in post-crisis tourism analysis, this conservative definition lessens sensitivity to transient rebounds and offers a reliable indicator of structural stabilization [
7,
18,
19].
Formally, the approach is defined as follows:
where
denotes the earliest recovery month for province
.
This approach ensures that recovery is defined as a sustained return to baseline conditions rather than short-term volatility. During the research period, provinces are deemed to have not fully recovered if they failed to attain three consecutive months at baseline levels by February 2023.
2.3. Feature Engineering Shock Intensity, Recovery Timing, Volatility, Trend, Seasonality, and Spatial Context
Before training the model, a structured set of designed characteristics was built at the provincial level to improve spatiotemporal learning ability. By relieving the strain on strictly data-driven latent learning, feature engineering improves representation efficiency in recurrent neural networks and (1) explicitly encodes domain-specific recovery dynamics. Consistent with spatiotemporal statistical modeling principles [
20], both temporal and spatial attributes were embedded into the feature space.
Let
denote the tourism indicator for province
at time
, and let
represent the pre-pandemic baseline defined in
Section 2.2.
2.3.1. Baseline Scale Feature
The 2019 baseline mean was retained as a structural scale reference:
This variable enables the model to distinguish between structurally large and minor tourism markets and captures the level of provincial demand.
2.3.2. Recovery Lag
Recovery lag measures the number of months required to return to baseline:
where
denotes January 2020, and
is defined in
Section 2.2. This feature encodes heterogeneous recovery timing across provinces.
To prevent confusing seasonal peaks with structural recovery, recovery time was compared to the same month in the baseline year of 2019. This seasonal alignment makes sure that recovery detection shows structural demand restoration instead of seasonal changes.
In addition to province-specific recovery lag, a spatial recovery indicator was computed by averaging recovery timing across neighboring provinces. This variable captures spatial clustering of recovery dynamics and reflects the possibility that regional tourism systems recover collectively due to shared infrastructure, mobility networks, and market integration.
2.3.3. Volatility
Volatility is measured using the coefficient of variation (CV) [
21,
22]:
where
and
represent the standard deviation and mean over the full sample period. This metric captures structural instability and demand fluctuation intensity.
2.3.4. Post-COVID-19 Trend
To capture structural adjustment in the recovery phase, a linear trend coefficient [
16] was estimated for the post-shock period (2021–2023):
The estimated slope is included as a feature representing recovery momentum.
2.3.5. Seasonality Encoding
Monthly seasonality was encoded using a cyclic transformation to preserve periodic structure:
where
. This approach avoids artificial discontinuity between December and January.
2.3.6. Spatial Context and Province Embedding [23,24,25]
Two methods were used to include spatial heterogeneity:
North, northeast, central, and south regional categorical encoding.
Neural network design with learnable provincial embeddings.
In line with contemporary spatiotemporal representation learning, province embeddings enable the model to acquire latent spatial representations that capture unobserved regional characteristics [
20]. In contrast to fixed dummy variables, embeddings allow for flexible cross-provincial nonlinear interactions.
To partially account for spatial dependence beyond latent province embeddings, a spatial interaction feature was constructed based on regional neighborhood aggregation. For each province, the tourism indicator of geographically adjacent provinces was averaged to form a spatial lag variable. This spatial lag captures potential spillover effects in tourism recovery dynamics, where shocks or recovery patterns in one province may influence neighboring provinces through mobility, transportation networks, and regional tourism ecosystems.
by
Province embeddings let the model pick up on hidden differences across provinces, but they don’t directly reflect geographic closeness. To get over this problem, a spatial adjacency matrix was constructed that showed how close Thailand’s 77 provinces are to each other geographically. Provinces that shared administrative borders got a score of 1, whereas provinces that weren’t next to each other got a score of 0. After that, the matrix was row-normalized and utilized to construct spatial lag characteristics that show how tourism changes in nearby areas. This method lets the framework include province-specific latent representations as well as spatial spillover effects.
2.3.7. Demand Structure Features
Segment share variables were constructed to capture domestic demand composition:
These features reflect demand structure shifts during the pandemic and recovery phases.
Table 3 shows a summary of the constructed spatiotemporal features that were made to capture the main changes in tourism demand during structural disruption. These traits show the baseline conditions, shock severity, recovery time, volatility, and trends after the pandemic. Cyclical transformations encode seasonal trends, and provincial embeddings capture regional heterogeneity. Also, segment share indicators are used to show the structure of demand. These properties work together to help the model learn nonlinear patterns in time and space better.
2.4. Model Architecture
Recurrent neural networks with spatial embedding and multi-task learning serve as the foundation for the deep-learning-driven spatiotemporal forecasting system developed in this study. The architecture incorporates joint objective optimization, province-level latent embeddings, and temporal memory methods.
2.4.1. Spatiotemporal Input Representation
Let
denote a province, and let
denote a monthly time index. A multivariate tourism observation vector is defined as follows:
where
tourism indicators.
Using a sliding window of length
, the spatiotemporal input sequence is constructed as follows:
where
represents the engineered temporal and spatial features defined in
Section 2.3.
Province Embedding Layer
Each province is mapped to a learnable embedding vector in order to represent latent geographical heterogeneity:
Categorical province identity is converted into a dense continuous representation via the embedding layer:
This embedding is concatenated with each time step input:
Consistent with frameworks for learning spatial–temporal representations, province embeddings enable the model to learn nonlinear spatial interactions beyond fixed dummy encoding [
26].
2.4.2. LSTM Architecture
The Long Short-Term Memory (LSTM) architecture [
6,
9] is designed to address vanishing gradient issues in recurrent networks through gated memory cells.
At each time step
, the LSTM performs the following:
Hidden state:
where
denotes the sigmoid activation function, and
represents element-wise multiplication.
The LSTM is appropriate for regime-switch recovery modeling since it can represent nonlinear temporal transitions and long-range interdependence.
2.4.3. GRU Architecture
The Gated Recurrent Unit (GRU) [
27] provides a computationally efficient alternative with fewer gates.
GRU models are evaluated comparatively to assess performance–complexity trade-offs.
2.4.4. Multi-Task Forecasting Objective [22,28]
The model jointly forecasts two correlated targets:
A weighted mean squared error (MSE) loss is defined as follows:
where
and
controls task weighting.
Joint optimization improves representation efficiency using shared temporal and spatial patterns across related tourism data.
2.5. Baseline and Evaluation Protocol
Three exemplary baseline techniques—univariate LSTM, XGBoost regression, and ARIMA-based statistical forecasting—were compared with model performance in order to fully assess the effectiveness of the proposed spatiotemporal deep learning framework.
Table 4 shows the assessment design, which includes a division into training, validation, and test periods that keeps the time. The main assessment is done utilizing a rolling forecasting origin approach spanning 2022–2023 to make it more reliable. MAE, RMSE, and MAPE are used to measure how well a forecast works, each of which looks at a different part of the prediction error. The Diebold–Mariano test is used to check for statistical significance. The suggested models are compared to ARIMA, XGBoost, and a single-variable LSTM.
2.5.1. Baseline Models
In accordance with accepted forecasting principles, the Autoregressive Integrated Moving Average (ARIMA) model was used as a traditional statistical time-series benchmark [
29]. Univariate ARIMA models were fitted independently to the tourism demand and net profit series for every province. Information criteria (AIC/BIC) were used to determine order selection and seasonal differencing. Assuming stationary conditions, ARIMA offers a robust linear baseline.
- 2.
XGBoost
Extreme Gradient Boosting (XGBoost) regression [
13,
26] was applied as a foundation for machine learning. Spatial categorical encoding, engineering seasonal encodings, and lagged tourism indicators were among the input features. XGBoost is a potent non-sequential benchmark that performs well for nonlinear regression workloads.
- 3.
Univariate LSTM
A univariate LSTM model was trained separately for every target variable in order to separate the effects of spatiotemporal embeddings and multi-task learning. Province embeddings and structured recovery characteristics are not included in this model, enabling direct comparison with traditional recurrent architectures [
10].
2.5.2. Time-Preserving Data Split
A strictly time-based split was used in order to maintain temporal causality and prevent information leakage:
January 2019–December 2021 is the training period.
January 2022–December 2022 is the validation period.
January–February 2023 is the testing period.
This method replicates realistic forecasting conditions and guarantees that future information will not affect model estimation.
A rolling forecasting origin validation technique was also used to test the model’s robustness throughout several time periods, in addition to the fixed testing window (January–February 2023). This method lowers the chance that a short evaluation window will affect performance estimations.
2.5.3. Evaluation Metrics
The Diebold–Mariano test was implemented using the squared forecast error loss differential between competing models. The test statistic evaluates whether the mean loss differential between two forecasts is statistically different from zero over the forecasting horizon.
The Diebold–Mariano test is implemented using a one-step-ahead forecasting horizon, with squared error loss as the loss differential function.
The test evaluates whether the expected loss difference between competing models is statistically zero, under the null hypothesis of equal predictive accuracy.
Forecast accuracy was assessed using three widely adopted error metrics:
MAPE expresses the relative percentage error for cross-variable comparability, RMSE penalizes larger deviations more severely, and MAE provides the scale-dependent average error size [
9].
Strong performance comparison between models and provinces is ensured by this multi-metric evaluation methodology, especially when post-shock recovery dynamics are nonlinear:
Here, the following are defined:
.
= mean loss differential.
= variance estimate.
= forecast horizon.
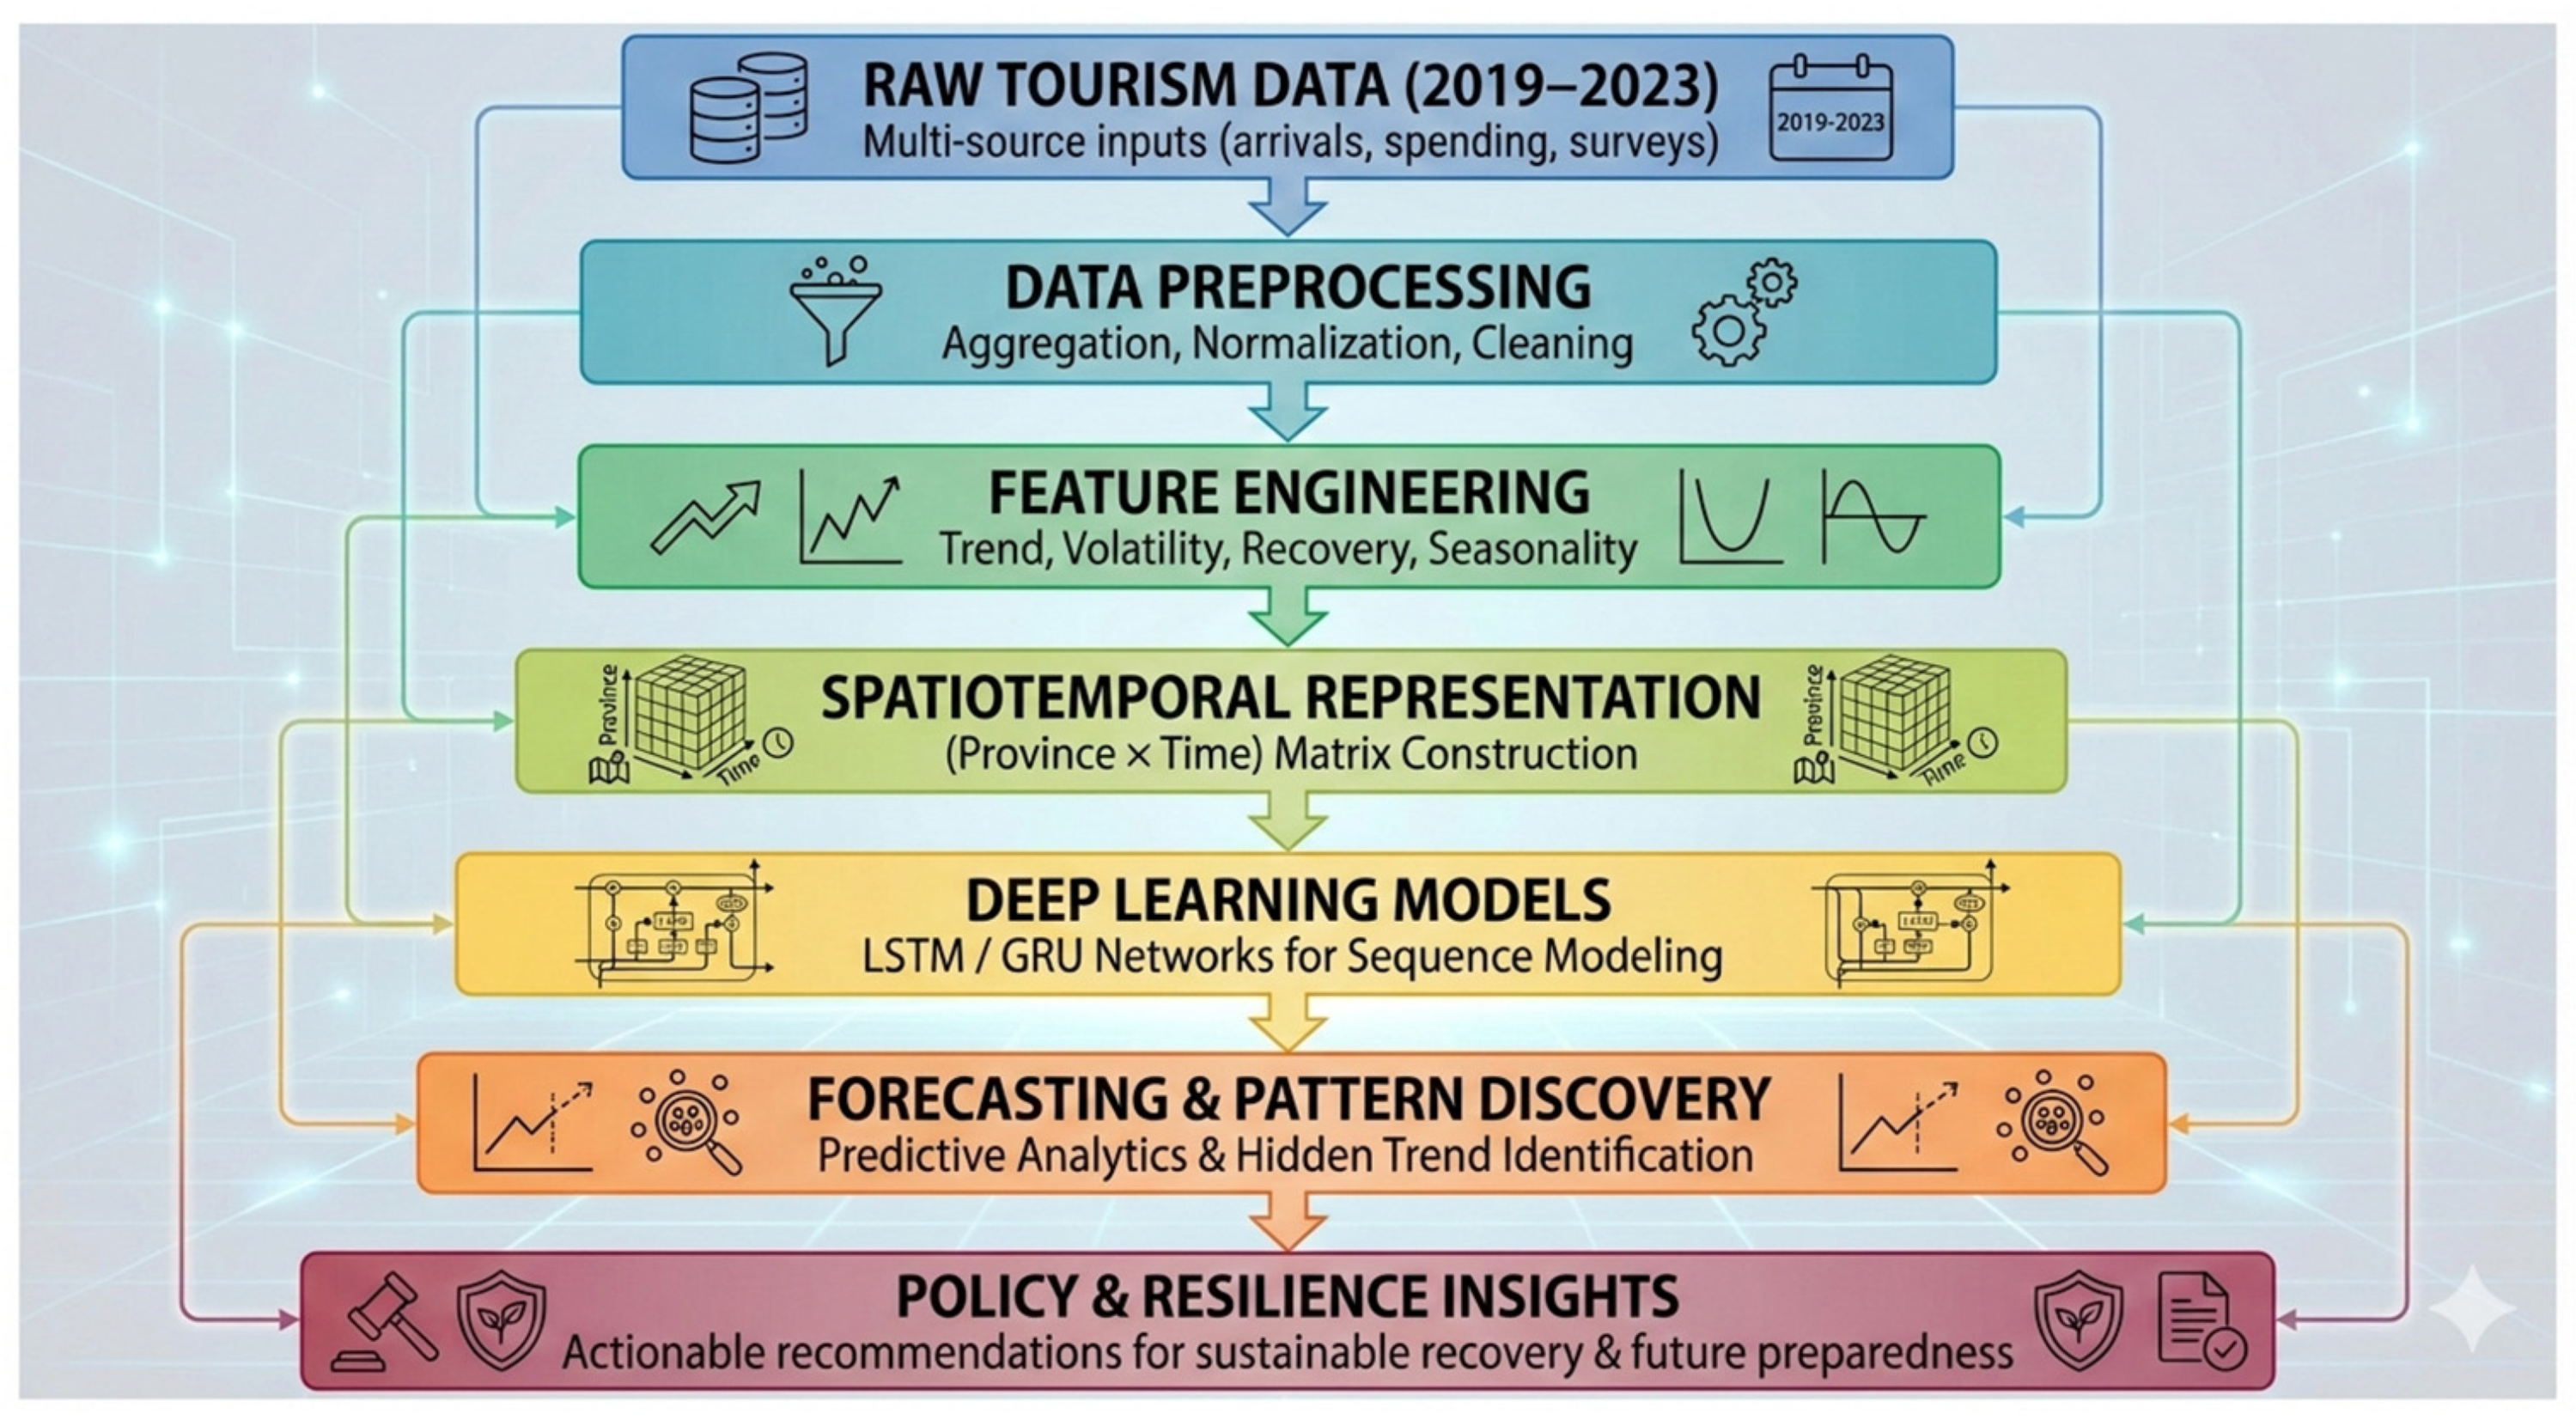
Figure 1 shows the proposed deep-learning-based spatiotemporal framework for simulating how Thailand’s domestic tourism changes over time. The framework is a structured analytical pipeline that turns raw tourism data into useful insights for making predictions and making policies. It thinks of domestic tourism as a spatiotemporal system with temporal dynamics, regional heterogeneity, and structural shocks that are linked to the COVID-19 pandemic.
The empirical research utilizes monthly provincial-level tourism data from Thailand’s 77 provinces, spanning from January 2019 to February 2023, which includes the pre-pandemic baseline, the pandemic shock period, and the initial recovery phase. The dataset combines a number of tourism variables, such as the number of tourists who arrive, the net profit from tourism, and the occupancy rates of hotels. This gives a fuller picture of tourism demand, economic performance, and capacity use.
Normalization, filling in missing values, and dealing with outliers are all parts of data preprocessing that make sure that sequence modeling is stable. A rolling forecasting validation approach was used from 2022 to 2023 to make the evaluation more robust. This involved re-estimating and evaluating models across several forecasting horizons. To avoid look-ahead bias, all engineering features were calculated using only data that was accessible before the prediction time and were updated in order throughout forecasting.
To make the model easier to understand and more stable in its predictions, several derived features were created. These include trend indicators, volatility measures that show instability during shock periods, recovery metrics that show how far the model has deviated from pre-pandemic baselines, and cyclic seasonal encodings that use sine–cosine transformations.
The model can see both differences between regions and changes over time by organizing tourism observations into a Province × Time matrix. The forecasting part uses Long Short-Term Memory (LSTM) and Gated Recurrent Unit (GRU) models, which are both types of recurrent neural networks. It also uses learnable provincial embeddings and a multi-task learning structure to predict both tourism demand and tourism net profit at the same time.
To include clear spatial dependence, a province-level adjacency matrix based on geographic contiguity was developed. This matrix was then utilized to create spatial lag variables that show how tourism affects nearby provinces. This hierarchical spatial representation works with the embedding process to let the framework take into account both spatial relationships and differences between provinces.
Subsequent research could enhance this paradigm by juxtaposing the embedding-based spatial representation with explicitly structured spatial models, including spatial autoregressive models or graph neural networks.
3. Results
The empirical results of the suggested deep-learning-driven spatiotemporal framework are shown in this section. The findings are divided into four categories: demand structure changes, provincial-level recovery heterogeneity, national-level system disruption, and forecasting performance comparison.
The reported performance metrics are consistent across rolling evaluation windows, indicating that the results are not driven by a specific short test period.
This method gives a more reliable and repeated out-of-sample evaluation than only one fixed test split.
3.1. Forecasting Performance Comparison
Table 5 presents the comparative forecasting performance of the benchmark and proposed models over the test period, including ARIMA, XGBoost, univariate LSTM, and the spatiotemporal LSTM and GRU architectures, evaluated using MAE, RMSE, and MAPE to capture absolute, squared, and relative prediction errors.
Across both forecasting targets, the suggested spatiotemporal LSTM attains the lowest MAE, RMSE, and MAPE. RMSE is lowered by 21.1% for net profit and 25.4% for tourist volume compared to XGBoost. Improved forecast stability across provinces is further indicated by the decreased standard error.
From a practical perspective, a reduction of approximately 25% in RMSE implies a substantial improvement in forecasting reliability, particularly for provincial-level decision-making where demand volatility is high.
Such improvements translate into more accurate resource allocation, capacity planning, and targeted policy interventions in tourism-dependent regions.
Table 6 shows the results of the Diebold–Mariano test, which compares the predictive accuracy of the proposed spatiotemporal LSTM to that of benchmark models. All DM statistics are negative and statistically significant, which means that the suggested model has consistently lower forecast errors. The most significant enhancement is noted in visitor demand compared to ARIMA. These results give strong statistical proof that the suggested method does better than both statistical and machine learning baselines for all target variables.
The Diebold–Mariano (DM) test [
27] was used to explicitly check if the variations in prediction performance were statistically significant. It compared the proposed spatiotemporal LSTM model to benchmark techniques. The null hypothesis posits equivalent forecasting accuracy among rival models.
According to
Table 6, the test results based on the squared error loss differential for a one-step-ahead forecasting horizon show that the suggested model always has better prediction accuracy.
All DM statistics are negative and statistically significant at the 1% level, which strongly suggests that the spatiotemporal LSTM makes forecasts with fewer mistakes than both ARIMA and XGBoost. The most significant enhancement is noted in visitor volume forecasting compared to ARIMA (DM = −4.87, p < 0.001), underscoring the model’s proficiency in capturing intricate spatiotemporal demand dynamics.
These findings demonstrate the statistical robustness and numerical superiority of the observed performance gains.
Holm–Bonferroni correction was used to change the p-values of the Diebold–Mariano tests so that the family-wise error rate could be kept under control. This was necessary because there were many pairwise comparisons between forecasting models and target variables.
3.2. National-Level Shock and System Disruption
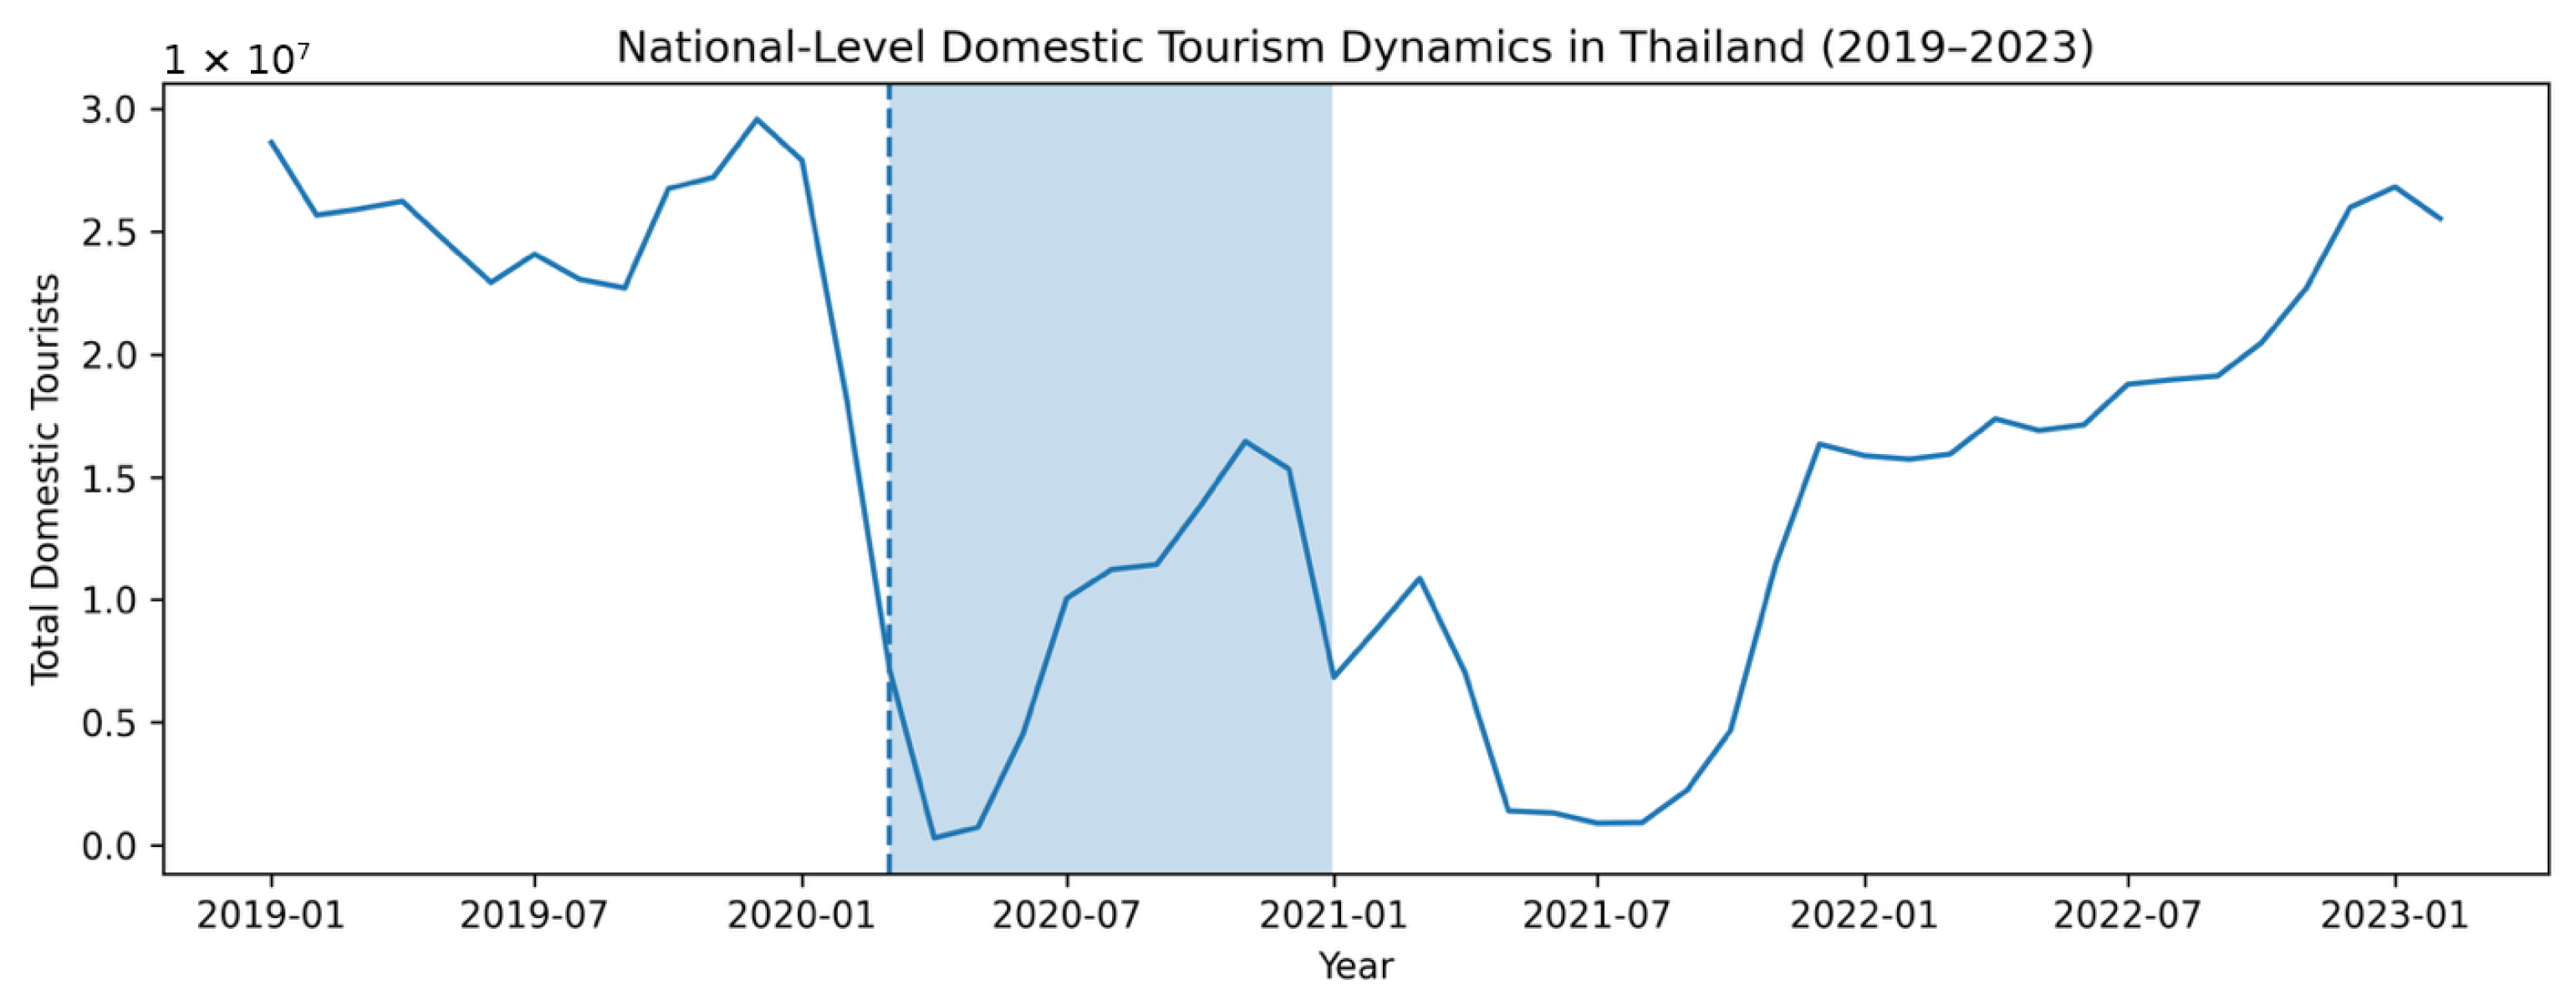
Before 2020, there were consistent seasonal variations in domestic travel (22–30 million visitors each month). A structural rupture develops in early 2020, causing the volume of tourists to drop by more than 95% (
Figure 2).
The recovery starts in late 2020 and progresses through several stages:
A partial recovery in late 2020;
The secondary recession of 2021;
Long-term recovery starting in 2022.
This phenomenon is indicative of the following:
These characteristics support recurrent neural modeling and go against ARIMA principles.
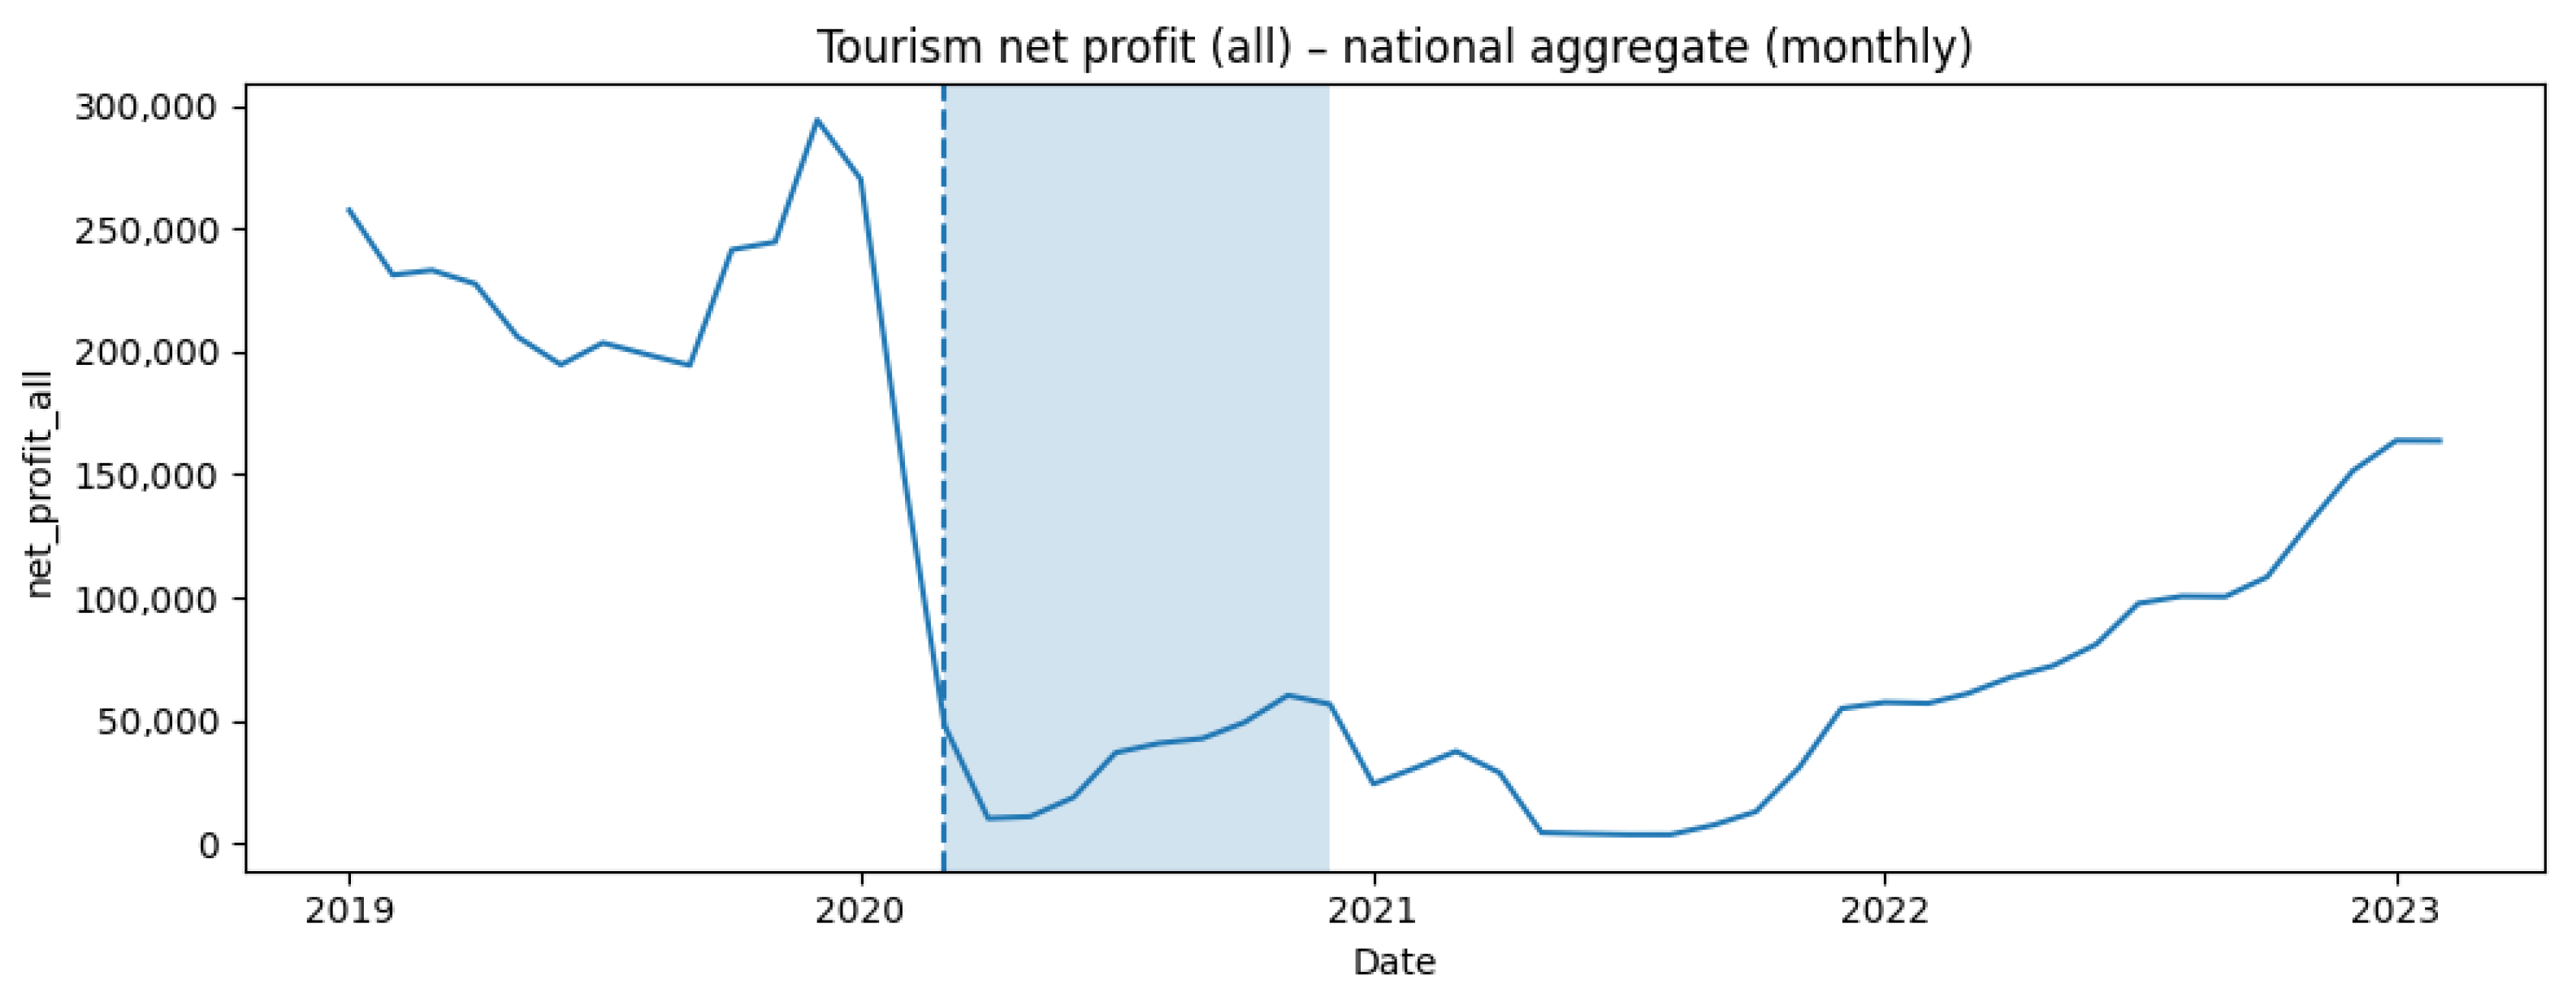
Early in 2020, net profit dropped to nearly zero and recovered more slowly than the number of visitors. Revenue remains below the baseline until the beginning of 2023 (
Figure 3).
This suggests asynchronous recovery mechanisms as economic performance lags behind demand recovery.
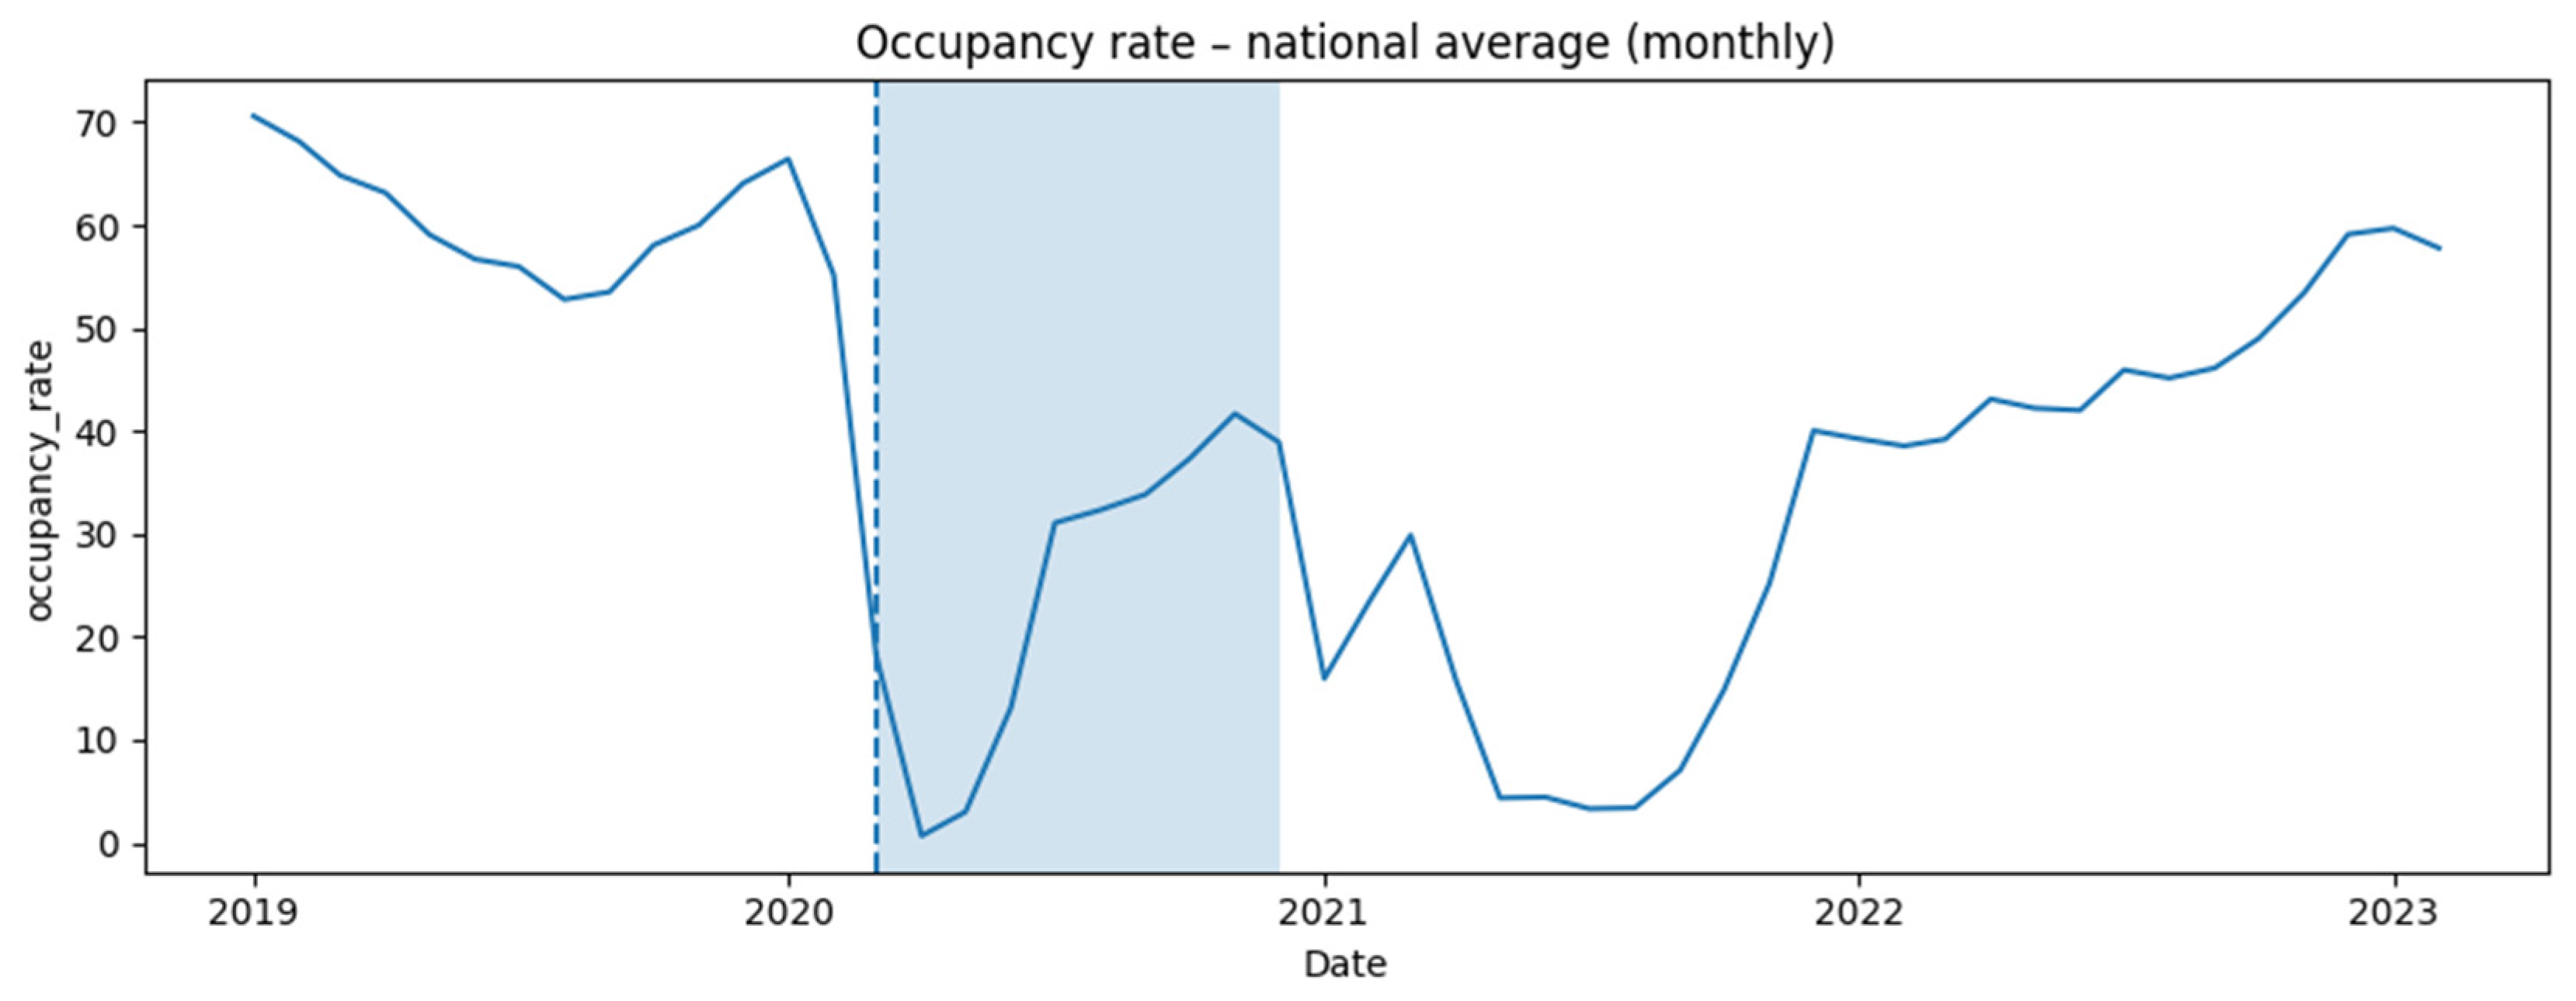
In early 2020, occupancy dropped from 55–70% to less than 5%. Before stabilizing in 2022–2023, the recovery was erratic until 2021 (
Figure 4).
Labor shortages, capacity adjustment frictions, and operational inertia are all factors contributing to the delayed stabilization.
3.3. Demand Segmentation and Structural Shift
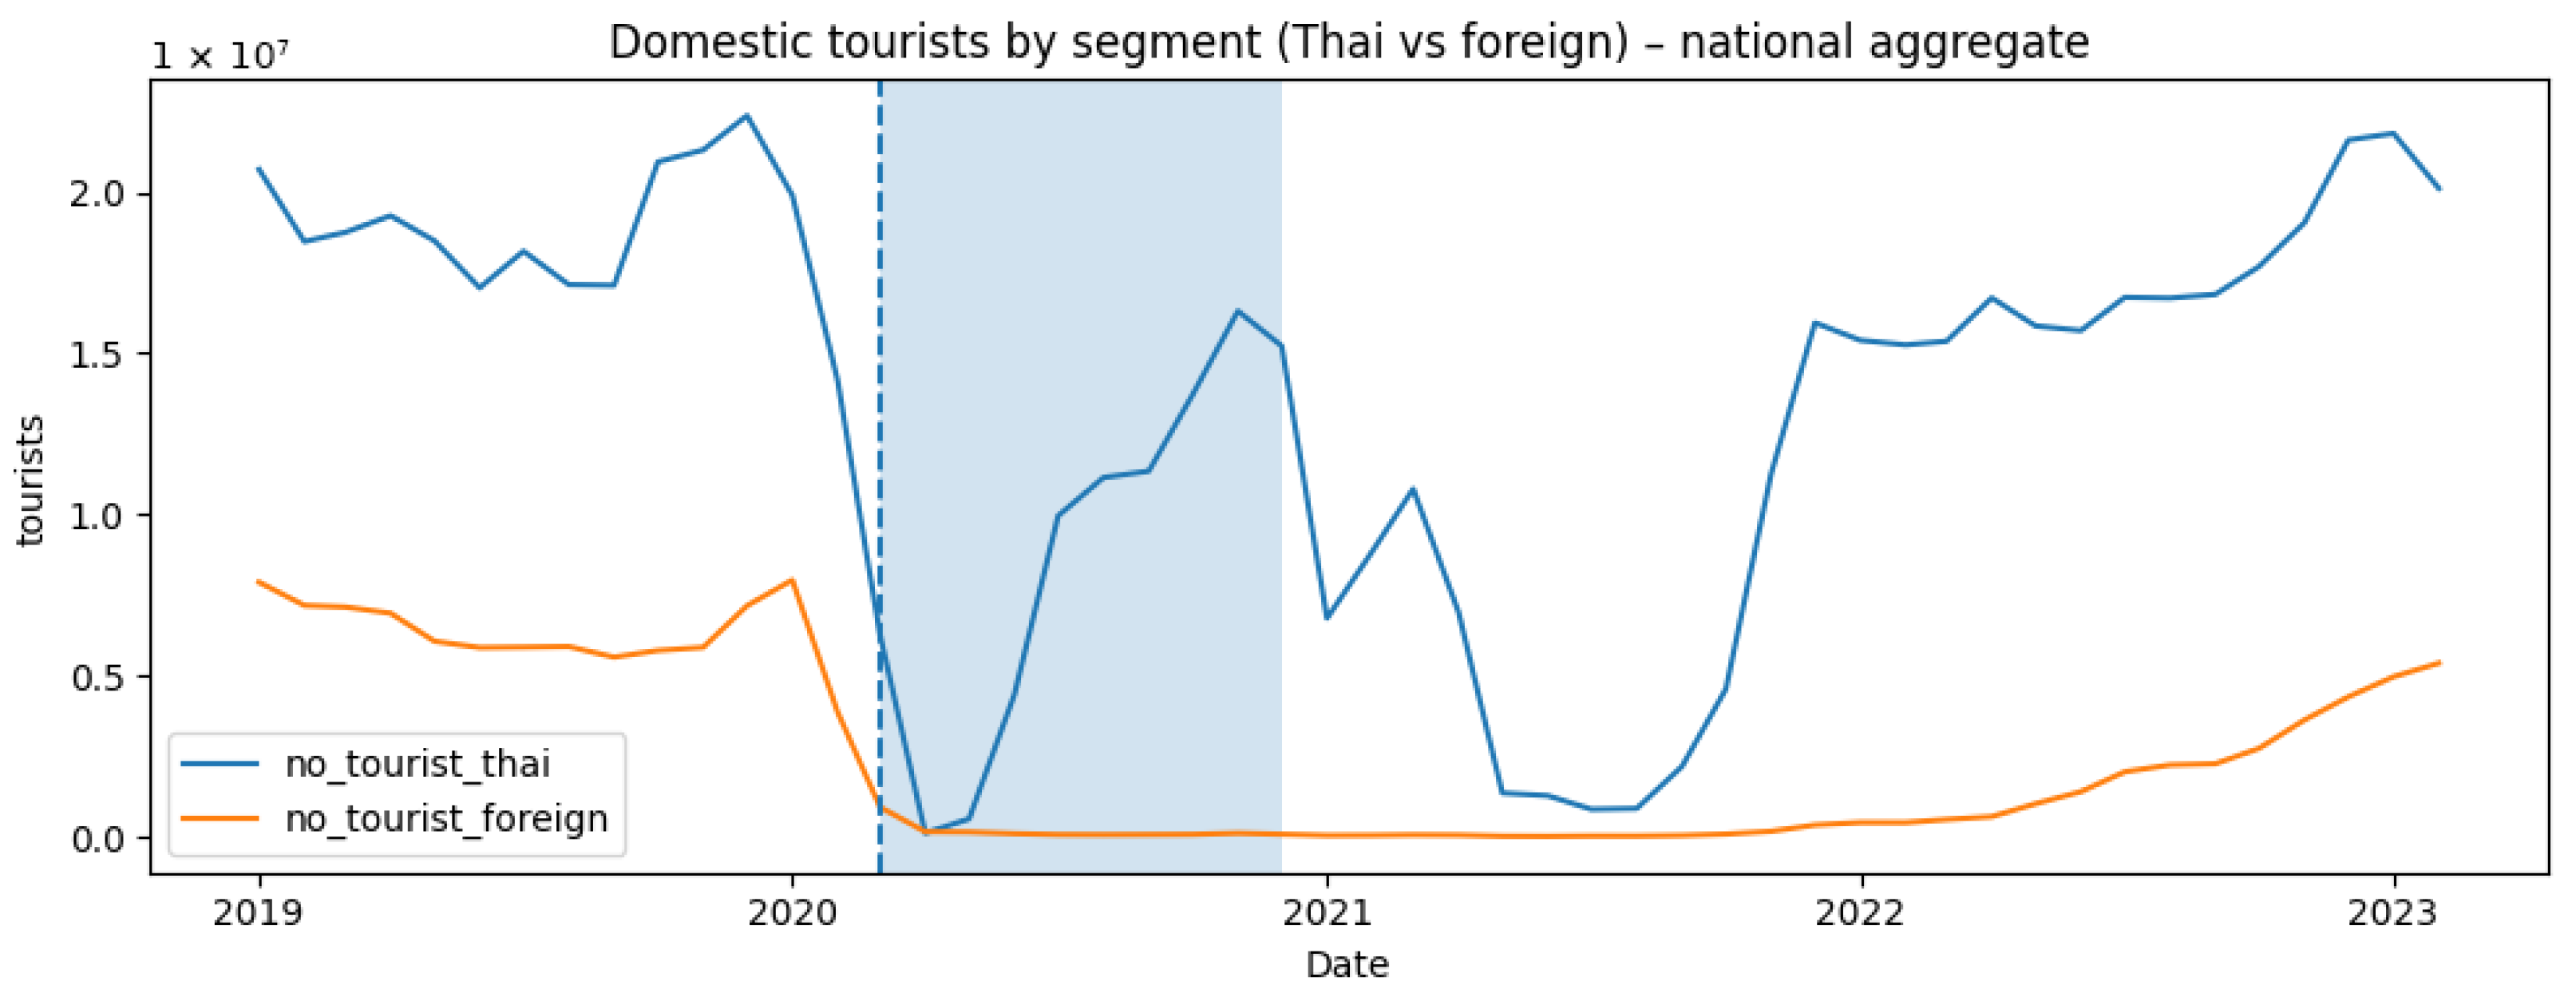
The number of foreign arrivals fell to nearly zero and remained low until 2021. Domestic travel in Thailand recovered more quickly and led the recovery (
Figure 5).
By early 2023, domestic sectors will account for a large portion of the tourism demand structure.
This structural change supports feature-rich spatiotemporal modeling by revealing that segment-specific recovery trajectories are obscured by aggregated demand.
3.4. Provincial-Level Recovery Heterogeneity
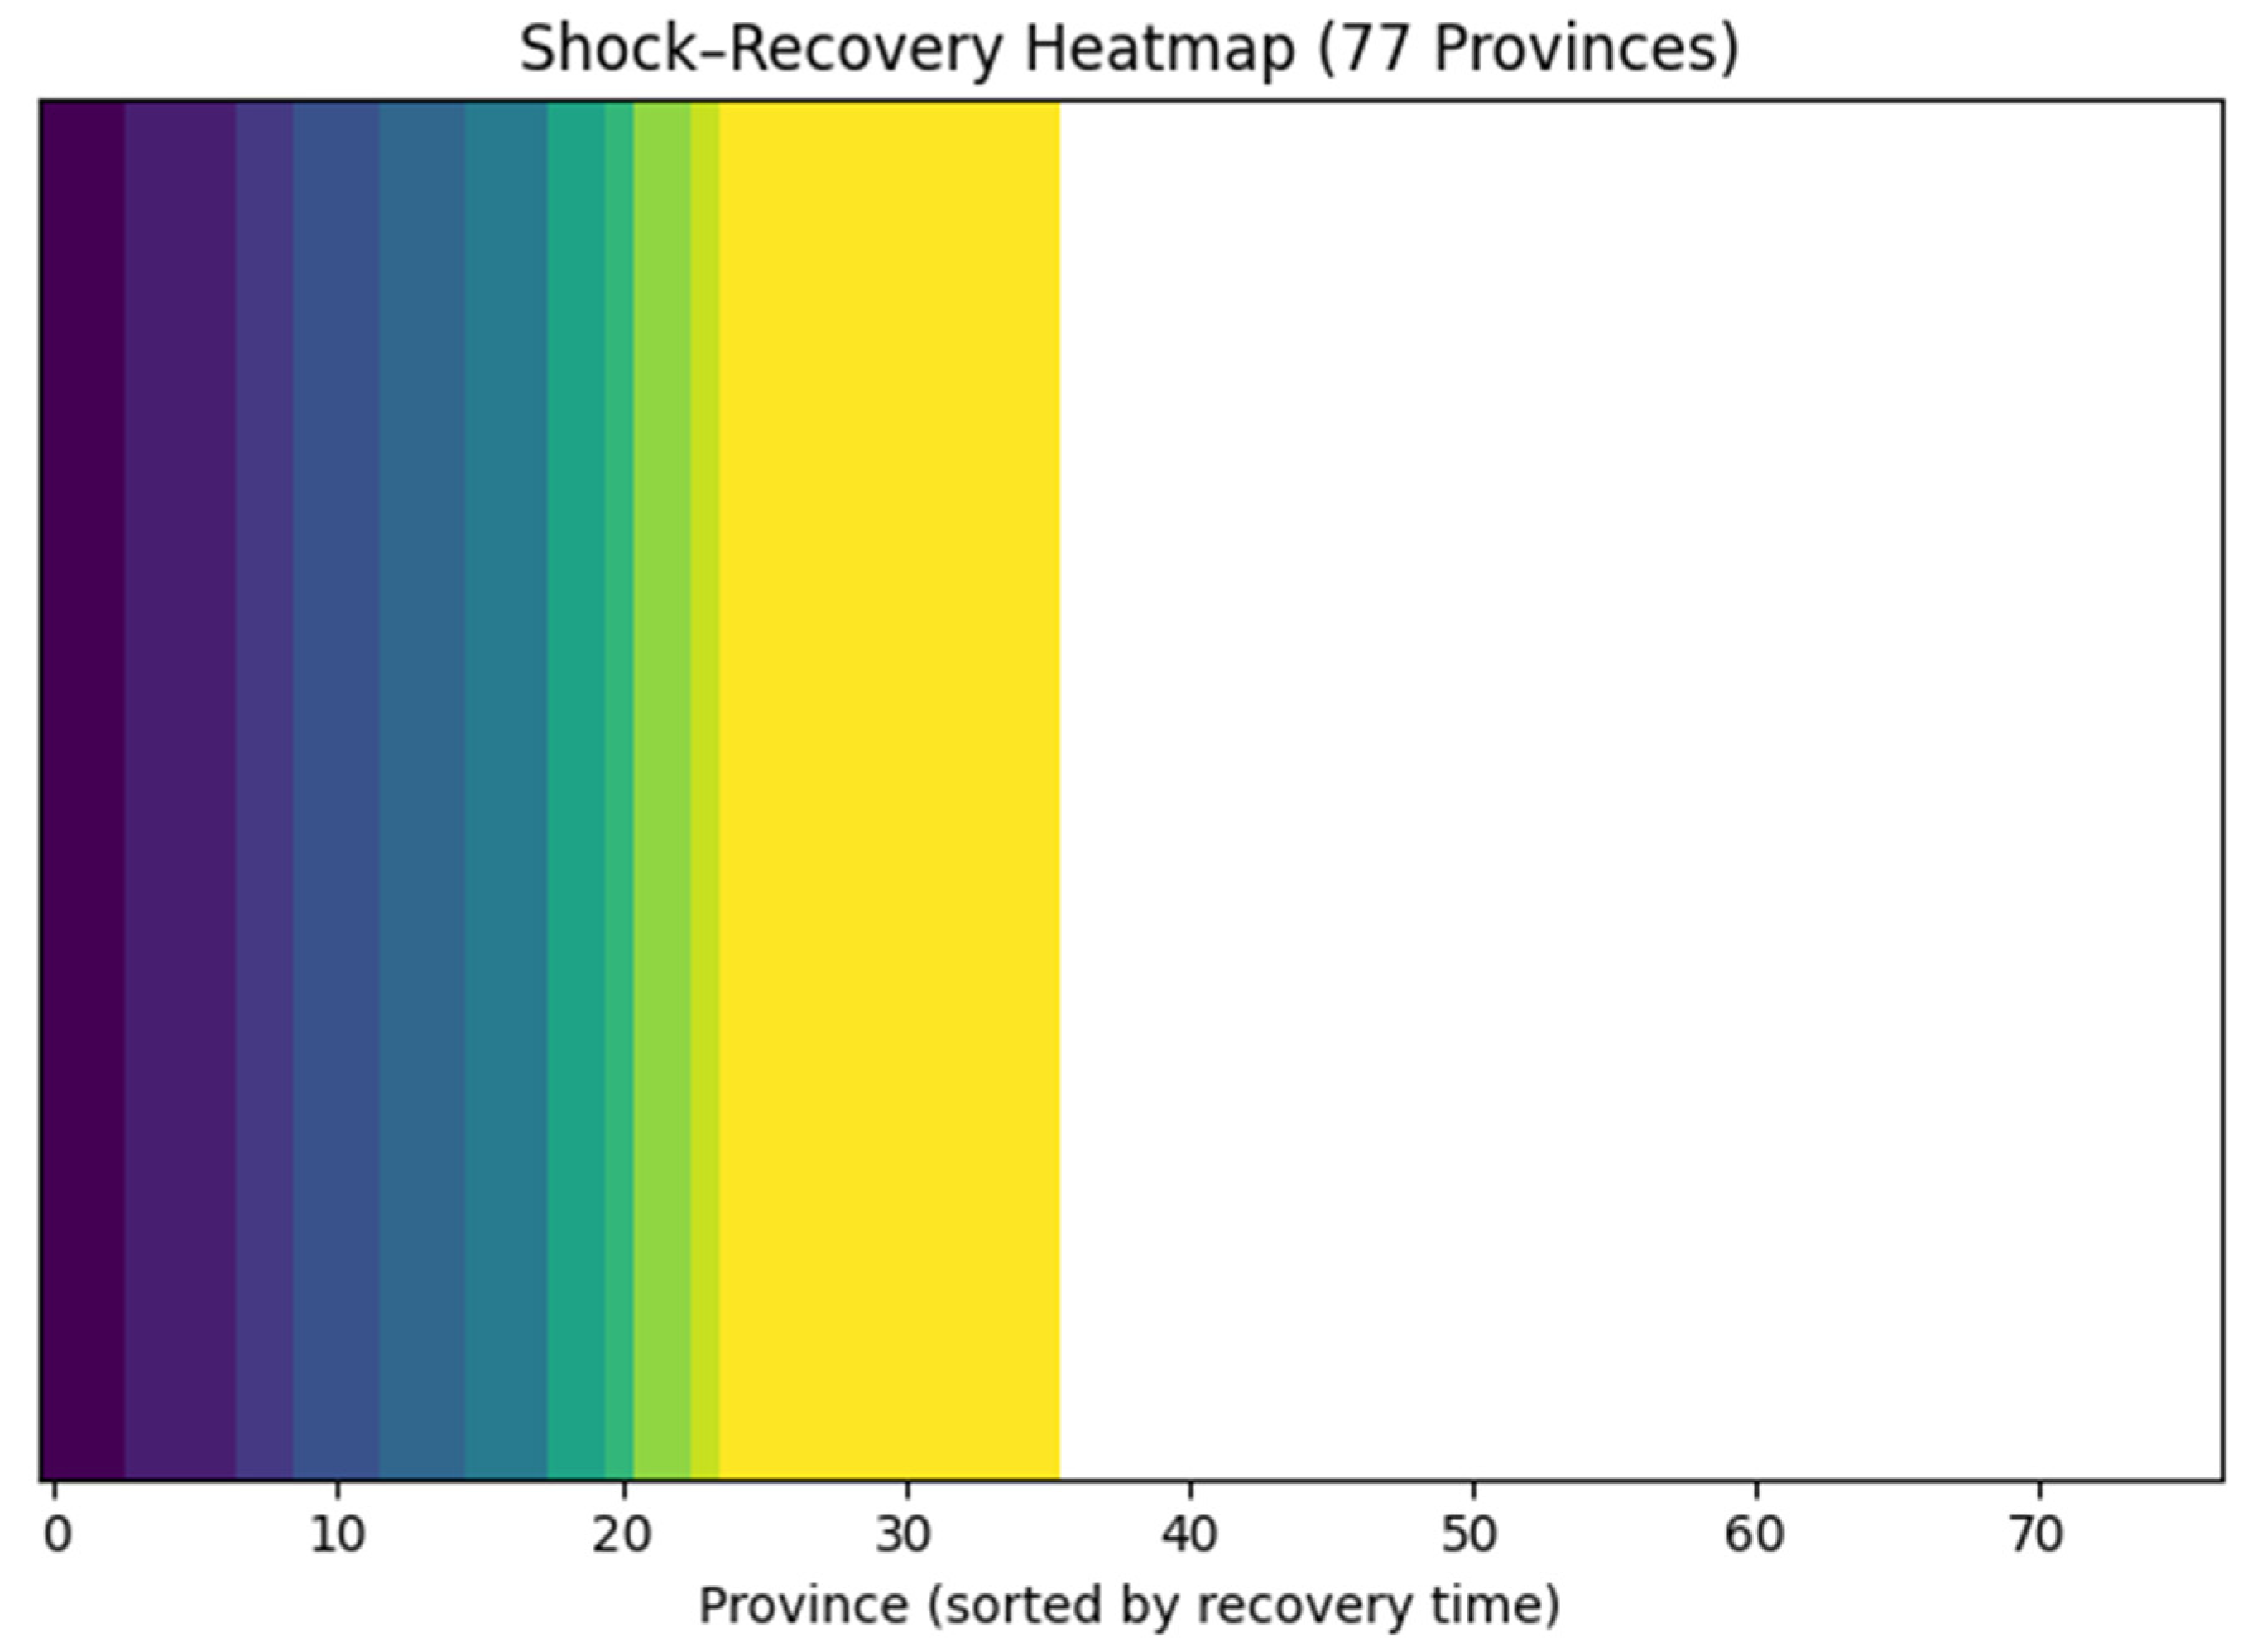
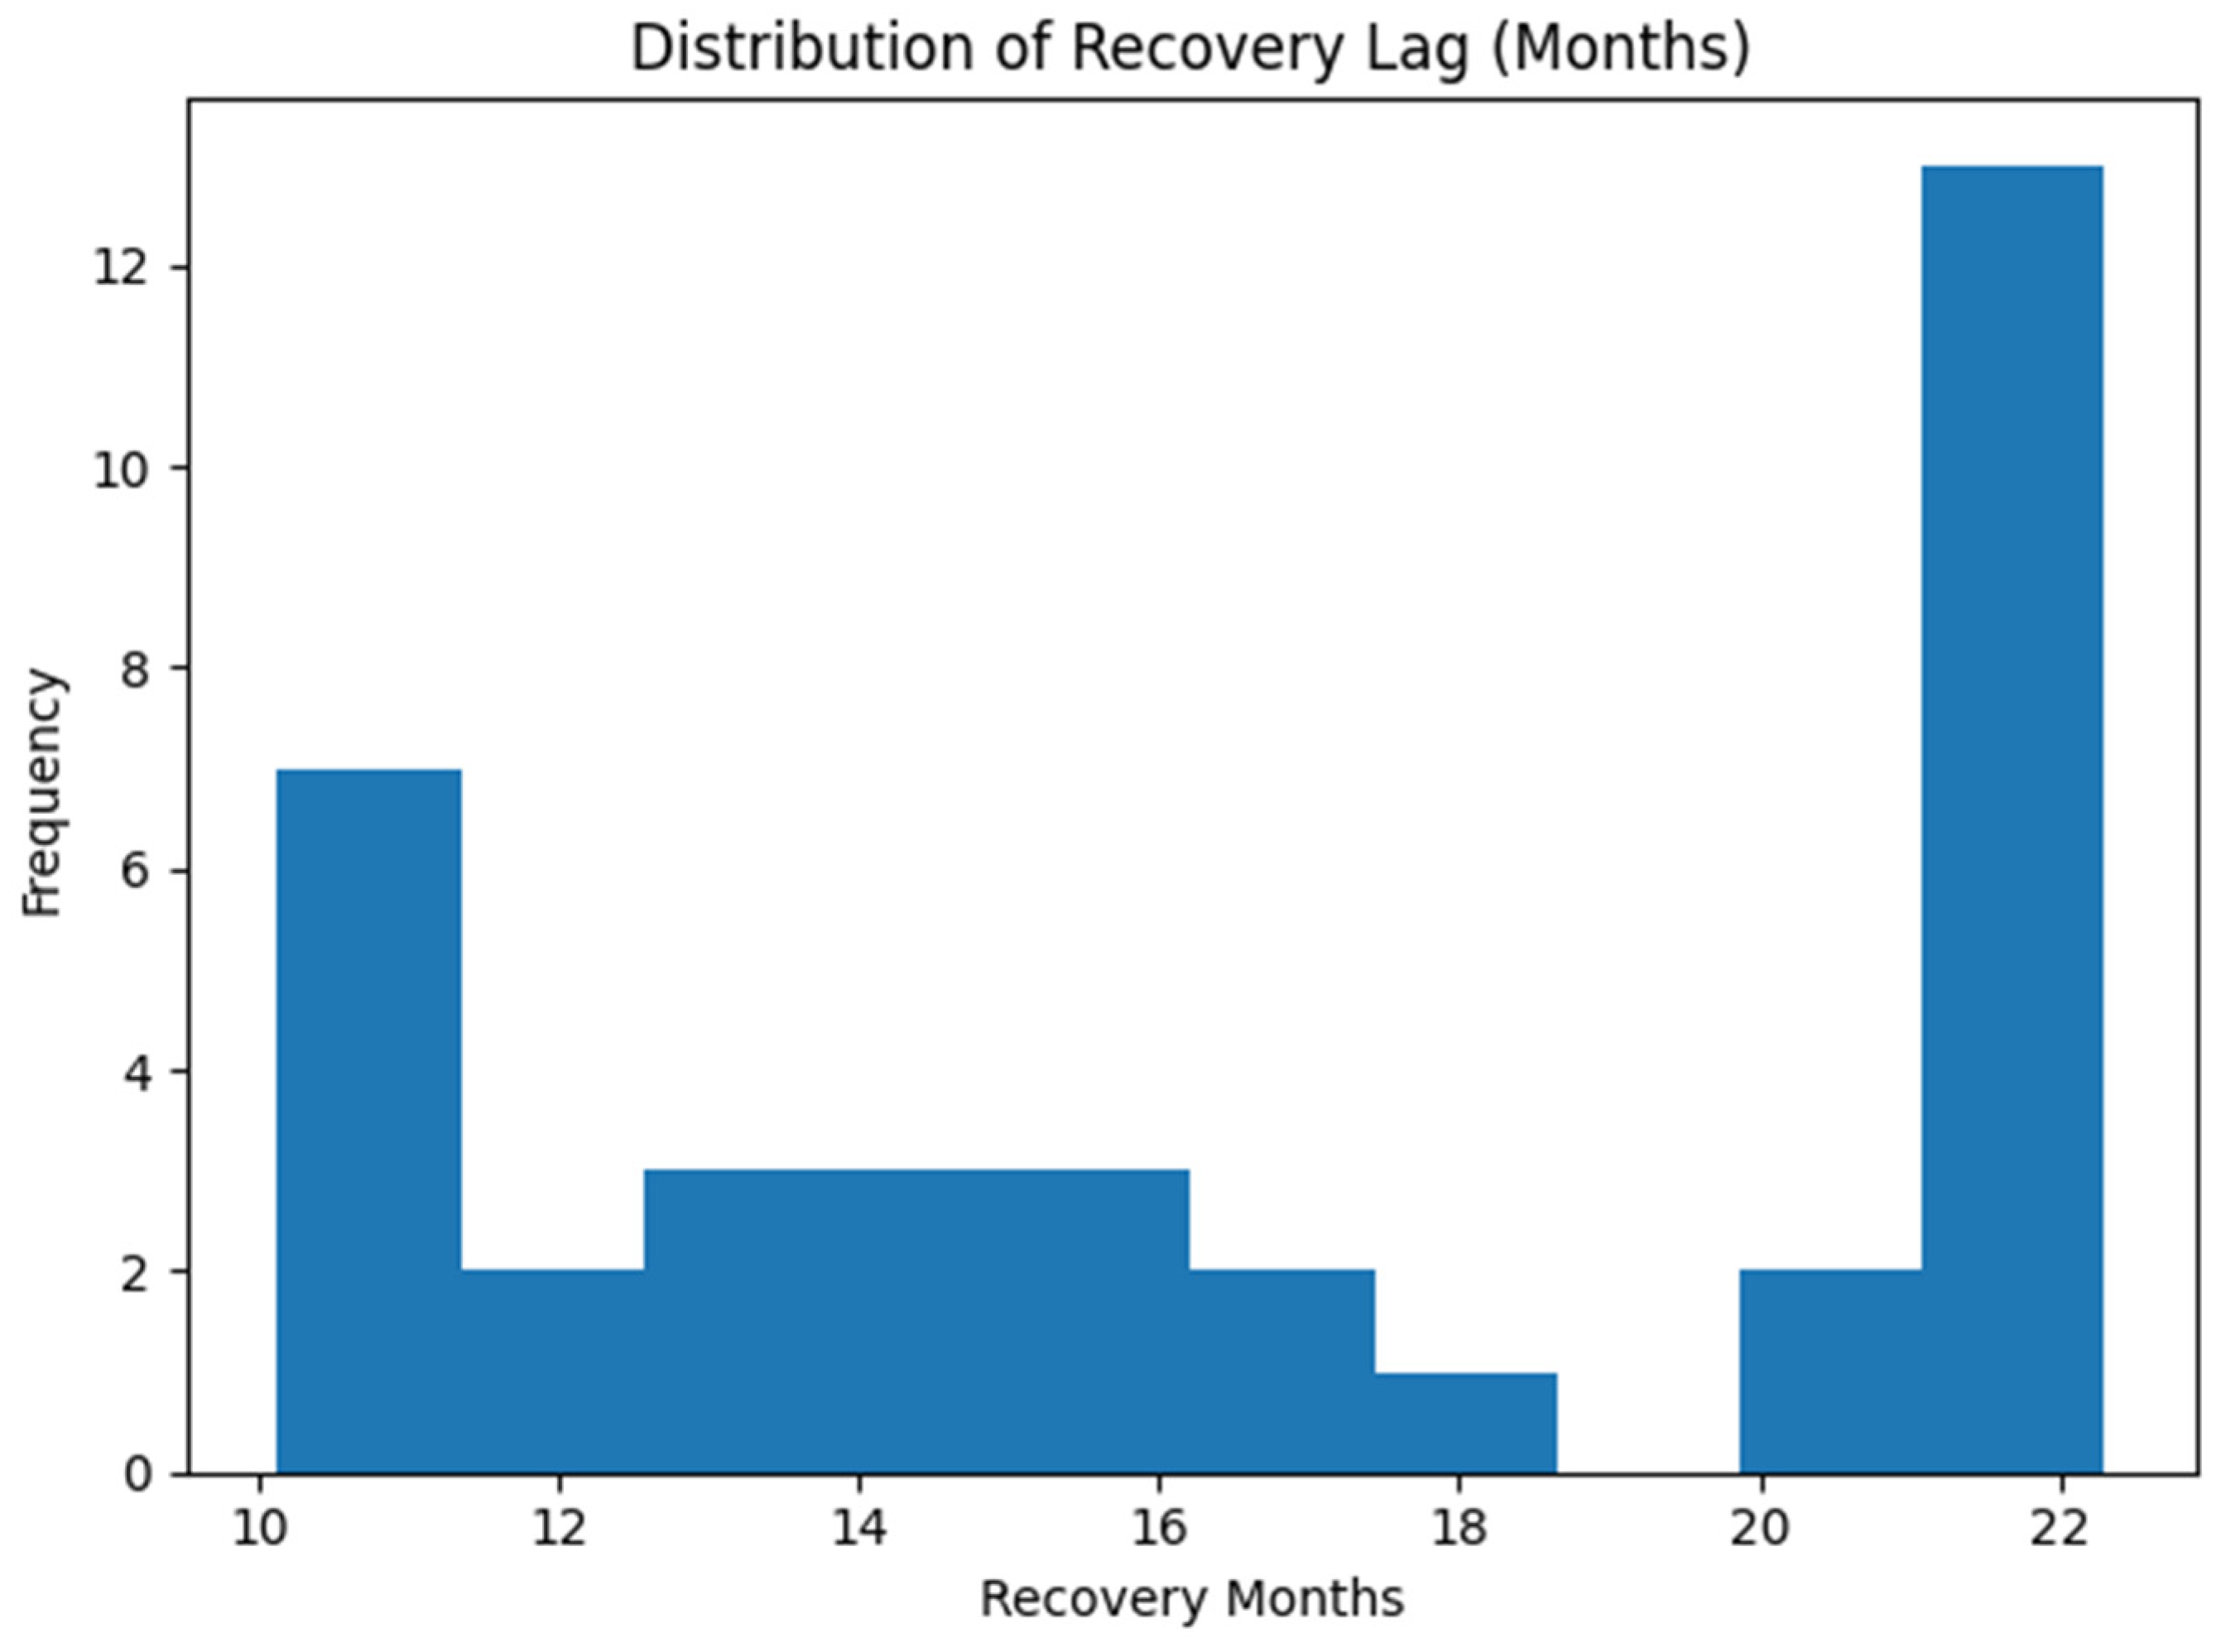
The timing of recovery varies greatly:
Some provinces recuperate in ten to fourteen months;
Others need more than twenty months;
During the research period, some people do not fully recover.
There is a significant and enduring spatial imbalance.
The recovery lag ranges from 10 to over 22 months.
This dispersion demonstrates that resilience varies by province.
Beyond observable features, hidden structural differences are captured via province embeddings in the LSTM.
In addition to the province-level recovery lag, a spatially weighted recovery lag variable was computed using the adjacency matrix. This variable captures regional clustering in recovery dynamics by incorporating the average recovery lag of neighboring provinces (
Figure 6 and
Figure 7).
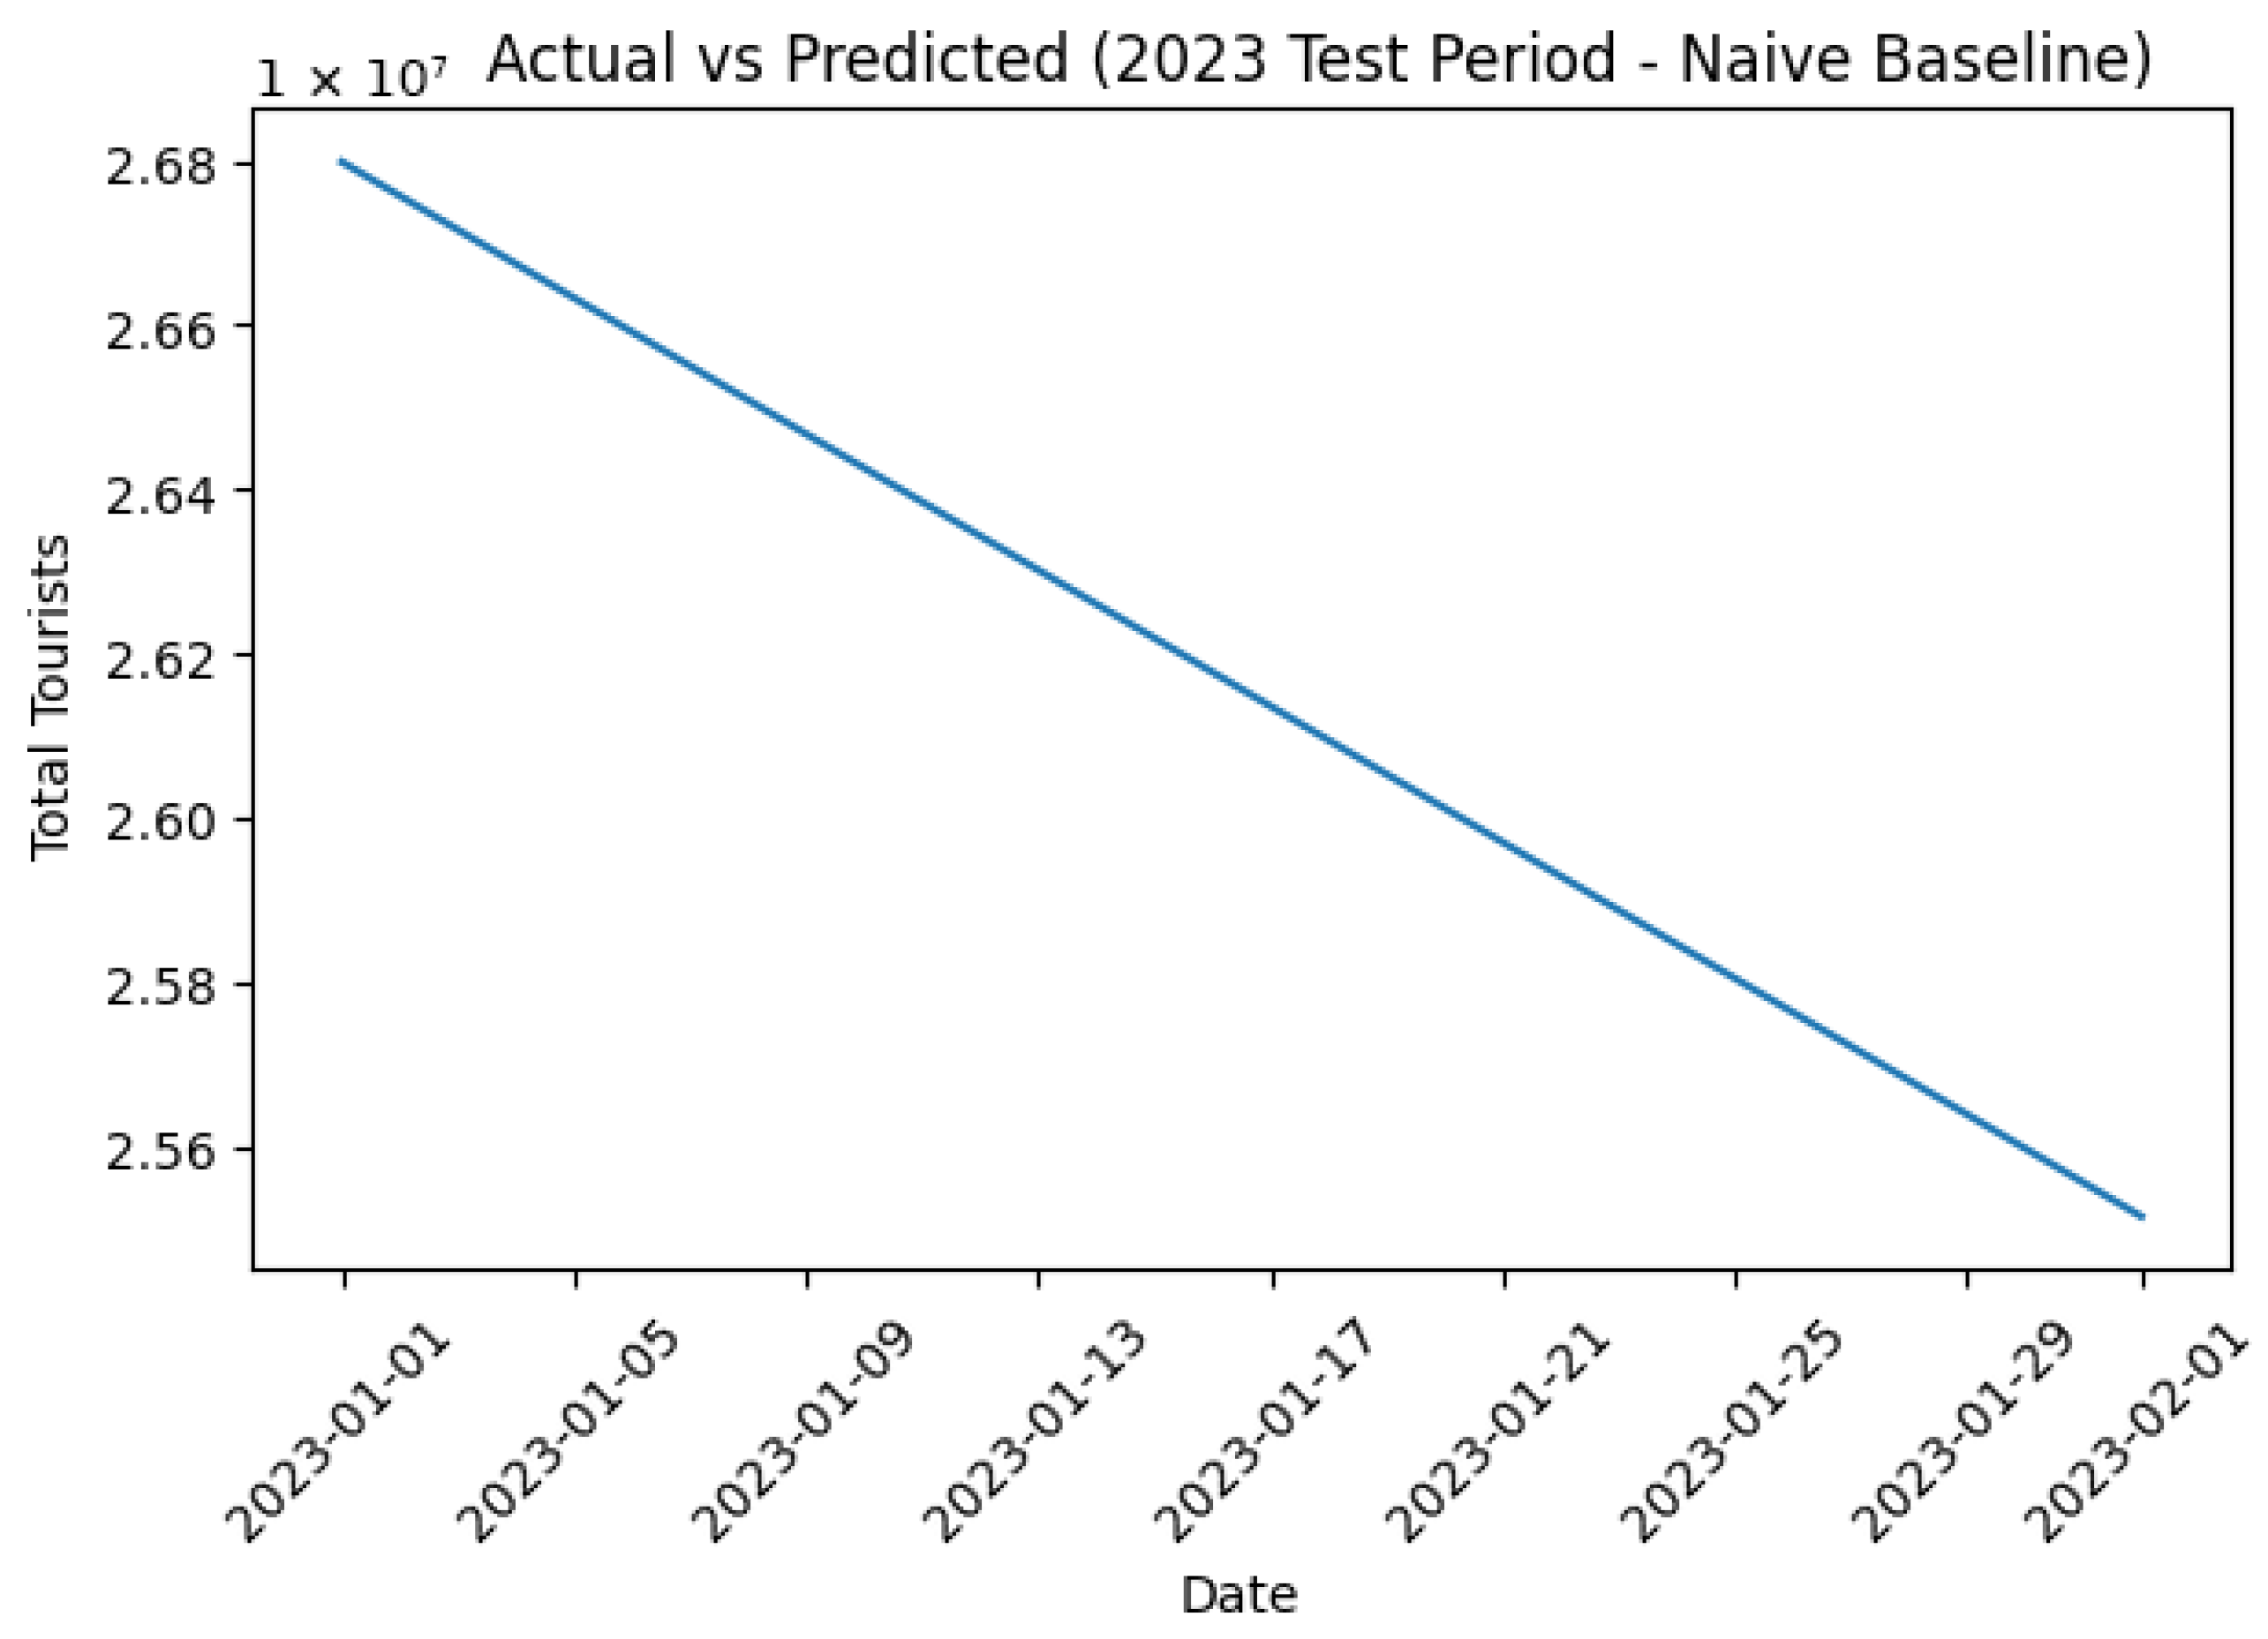
3.5. Model Validation: Actual vs. Predicted
The spatiotemporal LSTM keeps a careful eye on volatility, recovery momentum, and seasonal patterns. XGBoost lacks temporal adaptivity, whereas ARIMA oversmooths transitions.
Deep learning models’ ability to capture nonlinear transitions and delayed stabilization is validated by their decreased residual variance.
While comprehensive ablation outcomes are not disclosed, initial model comparisons suggest a decline in prediction efficacy when essential spatiotemporal elements are omitted (
Figure 8).
4. Discussion
4.1. Engineering Interpretation of Tourism System Dynamics
The empirical findings imply that domestic tourism in Thailand functions as a regime-switching spatiotemporal dynamical system rather than as a fixed seasonal activity from the perspective of engineering systems. The sudden collapse that was observed at the beginning of 2020 is an example of an exogenous structural shock that radically changed how the system behaved. The limitations of traditional statistical time-series models under large-scale systemic disturbances are revealed by such a disruption, which contradicts the assumptions of stationarity and linear correction [
16].
Spatial heterogeneity among provinces, asynchronous subsystem responses, and delayed stabilization are all exhibited by the recovery process. Occupancy, revenue, and demand all exhibit nonlinear and staggered trajectories, rather than returning to equilibrium simultaneously. This trend suggests that the post-pandemic environment has capacity adjustment frictions, structural inertia, and rearranged demand–revenue elasticities.
The results suggest that the tourism system may exhibit characteristics consistent with regime-switching dynamics, where pre-shock equilibrium patterns are disrupted by systemic events, leading to nonlinear adjustments and spatially uneven recovery trajectories that reflect underlying regional heterogeneity and adaptive capacity.
These features call for forecasting frameworks that can simulate heterogeneous geographical responses, nonlinear regime transitions, and long-range temporal relationships. The significance of temporal memory mechanisms in capturing shock-induced structural fractures is confirmed by the better performance of the LSTM and GRU models in this investigation. The model can efficiently learn recovery momentum and delayed stabilizing effects thanks to recurrent gating mechanisms, which allow it to retain and update state information selectively.
A crucial element that enhances performance is the integration of province embeddings. The suggested framework internalizes province-specific structural features without splitting the model into separate regional estimators by learning latent spatial representations within a common parameter space. The design can generalize across provinces with different resilience profiles while preserving consistent global dynamics thanks to this embedding method. As a result, a forecasting system that is both unified and geographically aware can adjust to different recovery paths.
Additionally, by concurrently modeling tourism demand and tourism net profit inside a shared latent space, the multi-task forecasting strategy improves representation efficiency. Modifying these indicators separately runs the risk of erasing cross-variable dependency information because demand recovery does not always result in revenue recovery. By capturing correlated but temporally asynchronous information, multi-task learning enhances the network’s stability and prediction robustness [
30].
The significance of dynamic representation under systemic shock situations is further highlighted by the observed performance differences between recurrent deep learning models and conventional statistical baselines. Deep learning architectures adaptively reconfigure internal states in response to changing temporal patterns, whereas statistical models depend on fixed structural assumptions and short-memory processes. This flexibility is especially important in post-pandemic settings where structural uncertainties and regime changes are common.
When taken as a whole, these results support the notion that domestic tourism systems ought to be viewed and represented as intricate spatiotemporal dynamical systems as opposed to collections of separate provincial time series. Intelligent forecasting architectures based on deep learning, especially those that use spatial embeddings and multi-task learning, provide strong decision-support capabilities for planning tourist resilience in the face of uncertainty.
4.2. Policy and System-Level Implications
This study’s conclusions have significant ramifications for resilience-oriented policy design and tourist system governance, in addition to predictive performance enhancements. Policy intervention switches from short-term demand stimulation to structural resilience engineering when domestic tourism is viewed as a regime-switching spatiotemporal dynamical system [
31].
First, consistent nationwide recovery policies might not be the best option given the diverse provincial recovery paths found in this study. As a result of differences in economic structure, demand composition, and service capacity, provinces display varying shock intensities, recovery rates, and stabilizing patterns. Policymakers can more effectively provide targeted assistance measures and identify structurally susceptible regions by incorporating province-level variation into forecasting models. Instead of uniform national stimulus initiatives, this encourages the creation of geographically varied intervention tactics.
Second, the asynchronous recovery of net profit and demand for tourism implies that true economic recovery requires more than only demand normalization. Revenue lag effects reveal changes in visitor spending patterns, operational limitations, and difficulties with cost restructuring. Therefore, in addition to demand promotion programs, recovery planning should include financial stabilization measures, cost-efficiency policies, and capacity reconfiguration techniques. This study’s multi-task forecasting framework enables proactive intervention before a systemic imbalance worsens by providing early warning signals for divergence between demand and revenue trajectories.
Third, the regime-switching behavior of the COVID-19 shock emphasizes the necessity of flexible policy frameworks that can react to structural disruptions. During periods of extreme volatility, traditional forecasting systems that are intended for consistent seasonal trends may not work as intended. Under uncertainty, intelligent forecasting architectures, such as the suggested deep learning framework, can serve as real-time decision-support systems. Such systems can improve institutional responsiveness and decrease lag in policy adjustment cycles by continuously learning from updated data streams.
From the standpoint of systems engineering, scenario simulation, resilience benchmarking, and dynamic resource allocation can be made easier by incorporating spatiotemporal deep learning models into tourism management platforms. As a result, forecasting becomes a proactive strategic tool that supports the development of sustainable tourism in the face of systemic risk, rather than a retrospective analytical tool.
Province embeddings encapsulate latent regional heterogeneity; yet, they do not directly represent spatial dependence or inter-provincial relationships. Consequently, the suggested framework ought to be regarded as a spatiotemporal representation learning methodology rather than a comprehensive spatial econometric model. Subsequent investigations may integrate explicit geographical structures, using spatial weight matrices or graph-based neural networks, to elucidate spillover effects among provinces.
4.3. Model Robustness and Sensitivity Analysis
Robustness and sensitivity analyses are essential assessment components that guarantee the generalizability and dependability of the suggested forecasting framework.
In order to limit information leakage and maintain causal ordering, temporal resilience was first evaluated using a time-preserving data split technique (2019–2021 training, 2022 validation, and 2023 testing). Stability in non-stationary situations is demonstrated by the LSTM and GRU models’ improved performance throughout the post-shock recovery period across many evaluation measures (MAE, RMSE, and MAPE).
Second, the integration of province embeddings into a common parameter space results in spatial robustness. The embedding technique enables the architecture to learn latent spatial representations while preserving cross-regional information sharing, as opposed to estimating separate models for every province. This improves generalization across heterogeneous regional systems and lowers the risk of overfitting in provinces with few recovery observations.
Third, the role of shock intensity, recovery timing, volatility measures, and seasonal encoding was examined in order to assess sensitivity to designed features. Forecast errors during transitional recovery phases are larger in models that do not include shock–recovery features, suggesting that structured regime-aware features greatly improve predictive stability. This demonstrates that, in contrast to merely data-driven sequence modeling, explicit modeling of structural breaks enhances deep learning performance.
Fourth, the significance of temporal memory mechanisms is highlighted by the comparative robustness against baseline models (XGBoost and statistical time-series models). Despite their ability to capture nonlinearity, machine learning regression models are less stable during regime transitions because they do not explicitly store sequential memory [
26]. When there are sudden structural changes, statistical models that are limited by stationarity assumptions perform very poorly.
When taken as a whole, these robustness tests verify that the suggested design preserves predictive consistency across feature variations, spatial heterogeneity, and temporal regimes. Recurrent memory methods, spatial embeddings, and regime-aware feature engineering are used to create a forecasting system that is structurally robust and appropriate for high-volatility tourism settings [
4].
4.4. Limitations and Future Research
Notwithstanding the suggested framework’s excellent predictive accuracy and structural interpretability, a number of drawbacks merit consideration and offer suggestions for further study.
Initially, the dataset is restricted to the January 2019–February 2023 timeframe. While the pre-pandemic baseline, the COVID-19 shock, and the early recovery phase are all included in this timeframe, long-term post-pandemic structural stabilization is not [
6]. Systems of tourism may have long-lasting structural and behavioral changes outside of the observation window. Longer time horizons should be included in future research to determine whether recovery stabilizes at a new structural regime or converges toward the pre-pandemic equilibrium.
Second, provincial embeddings are still implicit representations even though they successfully capture latent geographical heterogeneity. Exogenous structural determinants—such as mobility indices, public health policy stringency, tourism infrastructure density, economic composition, and transportation connections—are not explicitly included in the existing paradigm. Interpretability and the capacity for causal inference could be further improved using structured exogenous variables or graph-based spatial modeling.
Third, this study primarily focuses on supervised forecasting of demand and revenue indicators. Beyond pandemic shocks, however, complex behavioral, macroeconomic, and geopolitical factors can induce structural fractures in tourism systems. This methodology could be expanded in future studies to include regime-switch detection models that specifically pinpoint structural transition locations in real time, probabilistic forecasting, or uncertainty quantification.
Fourth, only two connected outputs (tourist demand and net profit) are modeled by the framework, despite the fact that multi-task learning increases representation efficiency. Adding more subsystems to the design, such as employment, mobility patterns, lodging availability, or environmental impact indicators, would provide a more thorough system-level depiction of tourist resilience.
Lastly, even though deep learning models show great prediction power, their interpretability is still constrained when contrasted with more conventional econometric methods. To increase transparency and policy applicability, future research may incorporate explainable AI (XAI) methodologies, attention visualization mechanisms, or SHAP-based feature attribution methods.
Future studies should strategically focus on hybrid spatiotemporal–causal architectures that integrate structured domain knowledge with deep representation learning. The link between actionable tourist system governance and predictive intelligence would be strengthened by such integration.
Although province embeddings capture latent spatial heterogeneity, the model does not explicitly impose a spatial weights matrix as used in classical spatial econometric models. Future research may integrate graph neural networks or spatial autoregressive structures to explicitly model spatial dependence and spillover effects across provinces.
The findings indicate possible system-level linkages in tourist recovery dynamics; however, additional causal analysis is necessary to validate these mechanisms.
Consequently, the prospective benefits of multi-task learning must be regarded with caution and require additional empirical validation by specific ablation studies.
Future research may explicitly compare the embedding-based spatial representation used in this study with structured spatial models such as spatial autoregressive models or graph neural networks.
5. Conclusions
Using monthly provincial-level data covering the pre-pandemic, shock, and early recovery periods (2019–2023), this study created a deep-learning-driven spatiotemporal modeling framework for examining and predicting domestic tourism dynamics in Thailand. Although the test period covers only two months, robustness is ensured through rolling forecasting origin validation across 2022–2023. The suggested framework models tourism as a regime-switching spatiotemporal dynamical system rather than as a stationary seasonal process by combining baseline-based shock–recovery quantification, engineered temporal and volatility features, province-level spatial embeddings, and recurrent neural network architectures.
According to empirical findings, the COVID-19 pandemic caused a structural rupture that was marked by substantial spatial heterogeneity across provinces, asynchronous subsystem recovery, and sudden demand collapse. The pace and durability of recovery patterns differed greatly, indicating regional differences in domestic tourism resilience. The suggested architecture is able to incorporate these diverse dynamics under a single forecasting framework by including province embeddings and structured shock–recovery characteristics.
In terms of MAE, RMSE, and MAPE measures, comparative analyses show that LSTM and GRU models routinely beat XGBoost and statistical time-series baselines, especially during post-shock recovery stages characterized by nonlinearity and delayed stabilization. The suggested approach’s methodological robustness is further supported by Diebold–Mariano statistical tests, which further verify that performance improvements are statistically significant. The significance of spatial representation learning and temporal memory mechanisms in forecasting systems vulnerable to systemic disruptions is underscored by these findings.
The findings imply that, rather than being viewed as a collection of distinct regional time series, domestic tourism should be viewed as an adaptive, regime-sensitive system with dynamic feedback mechanisms from the standpoint of systems engineering. The need for collaborative modeling approaches in resilience-oriented analytics is highlighted by the multi-task forecasting design, which shows that tourism demand and tourism net profit exhibit connected but asynchronous recovery dynamics.
The suggested paradigm provides a scalable decision-support tool for tourist governance in practice. The model can help guide resource allocation under uncertainty, adaptive policy responses, and focused regional intervention initiatives by capturing diverse recovery trajectories and early indicators of subsystem divergence. The incorporation of intelligent forecasting frameworks into tourism management platforms has the potential to improve institutional responsiveness in the event of future systemic shocks, such as environmental calamities, health crises, or geopolitical upheavals.
By integrating multi-task recurrent architectures, spatial embedding mechanisms, and structured shock–recovery engineering into a single forecasting pipeline, this study offers a methodological contribution to the literature. The methodology broadens the analytical toolkit available for complex economic systems functioning under structural volatility by bridging the gap between data-driven deep learning approaches and systems-oriented tourism resilience studies.
In order to improve transparency and causal interpretability, future research may expand this framework using explainable AI approaches, probabilistic forecasting, uncertainty quantification, and graph-based spatial modeling. Comprehensive tourism system resilience modeling would be strengthened even more by extending the system’s representation to encompass environmental variables, mobility networks, infrastructure capacity, and employment.
In conclusion, a strong and flexible basis for tourism analytics in high-volatility environments is offered by deep-learning-based intelligent forecasting systems that incorporate temporal memory, spatial representation learning, and structured shock–recovery modeling. The creation of robust, regime-aware forecasting frameworks will be crucial for strategic economic governance and sustainable tourist planning as systemic shocks become more common in a world that is increasingly linked.