Article

Optimization of Carbon Emission Reduction Task Allocation in China (2020–2030): A Cost-Based Inter-Provincial Cooperation Mechanism

College of Economics and Management, Qingdao University of Science and Technology, Qingdao 266061, China
*
Author to whom correspondence should be addressed.
Sustainability 2026, 18(7), 3455; https://doi.org/10.3390/su18073455
Submission received: 6 February 2026 / Revised: 20 March 2026 / Accepted: 29 March 2026 / Published: 2 April 2026

Abstract

Driven by the global mandates of the United Nations Sustainable Development Goals (particularly SDG 13 and SDG 17) and the climate targets established at COP summits, China strives to achieve its carbon peaking target by 2030 but faces significant challenges due to substantial regional disparities in abatement capacities. This paper proposes a cost-based inter-provincial cooperation mechanism to optimize carbon emission reduction (CER) task allocation. Using a marginal abatement cost curve model, we simulate provincial CER tasks from 2020 to 2030 under various cooperation scenarios. The results indicate that: (1) Cooperation significantly reduces the national total abatement cost compared to independent implementation. Specifically, the cost-saving ratio can reach approximately 60–70% when the cooperation proportion is high (80%). (2) There is a trade-off between economic efficiency and regional peaking targets. While an 80% cooperation proportion is economically optimal for 2020–2028, and a 60% proportion for 2029–2030, a 40% cooperation proportion is ultimately recommended as the balanced optimal ratio to ensure that most provinces achieve their carbon peaks before 2030. (3) The mechanism effectively narrows the disparity in abatement costs across regions. By offering a scalable paradigm for inter-regional climate collaboration, this study provides a theoretical basis for designing differentiated cooperation strategies to fulfill COP commitments and advance the global SDGs.

1. Introduction

The issue of climate change is urgent and requires the attention and actions of all economies. Since the independent actions of a single economy have proven to be limited, cooperation among different economies is a necessary method to solve this global environmental problem [1]. At the same time, carbon emission reduction (CER) cooperation can exist among several types of economies, such as between different countries or between different regions in the same country [2,3,4]. As the world’s largest emitter, China is actively engaged in climate mitigation, and a consensus has been reached that all regions need to bear certain responsibilities for CER. Inter-regional cooperation can not only better achieve the common goal of cutting emissions but is also a good way to narrow the gap in CER capacity between regions [4,5]. Given the difficulty for provinces to afford the CER tasks with their current economic capacity, the Chinese government has suggested that cooperation can help realize complementarity between regions [6,7].
However, there are still some issues that need attention: regions with lower marginal abatement costs (MAC) generally have higher carbon intensity and greater space for emission cutting, but lack funds and technologies [8]. Conversely, regions with higher MAC usually have lower carbon intensity and smaller space for emission reduction, but the cost to be paid for CER increases rapidly due to the increasing marginal feature of MAC [9]. The Chinese government is trying to explore a fair and reasonable CER cooperation scheme among different regions. Thus, the following research questions have been raised: What kind of CER cooperation mechanism is suitable and affordable for Chinese provinces? Can the CER cooperation effectively improve the country’s overall carbon mitigation performance and promote the carbon peak?
Different from current carbon trading in China, CER cooperation will be conducted between provinces, on a more voluntary basis, and CERs are the content of a transaction between partners. It is impractical to force all provinces to participate in the cooperation, for any cooperation is interest-driven, and this form of voluntary cooperation is not binding in itself [10]. Instead, this study aims to provide an idea of regional cooperation to reduce emissions, a kind of “Climate Club” [11] organized within countries, where all regions should consider the possibility of cooperating with other regions and benefiting from it.
This paper aims to shed more light on CER cooperation within countries by designing a cost-based partner matching and cooperation mechanism among regions. Based on dividing the CER cooperation proportion, this paper further opens the research direction of China’s inter-provincial CER cooperation: determining the optimal proportion of cooperation from different perspectives (economic, social, and environmental).
While previous studies have focused on static allocation, this paper contributes by: (1) developing a dynamic cost-based inter-provincial cooperation framework for the 2020–2030 period; and (2) quantifying the trade-off between national cost minimization and individual provincial carbon peaking targets.
The rest of this paper is organized as follows. Section 2 reviews the relevant literature. Section 3 introduces the methodology of CER task allocation and the inter-provincial cooperation mechanism. Section 4 presents the allocation results and the influences of CER cooperation. Section 5 provides a discussion on the cost-saving effects and optimal proportions. Section 6 summarizes the main conclusions and policy implications. Finally, Section 7 outlines the limitations and future research directions.

2. Literature Review

2.1. CER Task Allocation

Carbon emission reduction (CER) task allocation and carbon emission quota (CEQ) allocation are two sides of the same problem. CEQ allocation determines the amount of CO2 that each agent is allowed to emit, while CER task allocation focuses on the amount of CO2 that each agent is required to reduce [12]. There have been many studies focusing on the provincial-level allocation of CEQ. For example, Höhne et al. [13] compared regional reduction targets based on effort sharing. Kong et al. [14] provided theoretical references based on equality and efficiency, while Sun et al. [15] explored multi-scenario optimal behaviors for China’s regions.
Regardless of the number and scale of the agents involved, the allocation process needs to fully consider heterogeneity. To address this, Li et al. [16] and Ma et al. [17] developed bi-objective and multi-objective programming models, respectively, to balance conflicting goals. Similarly, Zhu et al. [18] applied a multi-objective decision approach to account for the social preferences of each entity. By considering these multiple allocation principles, the limited resources can be allocated as rationally as possible.
In the existing studies, there are two main types of allocation principles. The first emphasizes the overall effect of allocation results, particularly fairness and efficiency. For instance, Dong et al. [12] constructed an allocation model considering both equity and efficiency to determine provincial reduction targets. Similarly, Kong et al. [14] applied equality and efficiency principles to allocate quotas across Chinese provinces. Regarding other criteria, Zhu et al. [18] adopted a multi-objective decision approach to address feasibility for emitters, while Fang et al. [19] focused on sustainability by assessing China’s Intended Nationally Determined Contributions through multi-criteria allocation. Chen et al. [20] and Ye et al. [21] further emphasized cost-effectiveness in regional emission pathways.
The second type emphasizes the objective attributes of the participating entities, such as ability, responsibility, and potential. Specifically, Chang et al. [22] focused on economic welfare and ability through interregional emissions trading. Han et al. [23] highlighted regional responsibility using an integrated weighting approach. Furthermore, Tang et al. [24] examined the abatement potential based on an industry perspective. To integrate these principles, methodologies such as multi-objective programming [16,17] and ZSG-DEA [12,14] are commonly employed.

2.2. Cooperation on CER

To limit national GHG emissions, many binding international agreements have been proposed: the United Nations Framework Convention on Climate Change (UNFCCC, 1992), the Kyoto Protocol (1997), and the Paris Agreement (2015). However, these international agreements place greater emphasis on the contributions and targets of CER committed by countries, ignoring joint actions among state and non-state actors, as well as sub-national entities. In order to remedy this problem, the International Cooperative Initiatives (ICIs) have been put forward. For instance, Bakhtiari [25] analyzed the effectiveness of international cooperative initiatives, and Lim and Lee [26] examined cross-border cooperation cases in the energy sector. This option has been shown to have great GHG emission reduction potential [27,28].
Some studies focus on the conceptual framework of cooperative behavior in environmental governance among countries [8,29], but no consensus has been reached on specific international cooperation mechanisms and the maintenance of cooperative relationships [30]. In 2015, William Nordhaus proposed the International Climate Club in the form of incentives for participants to act on climate mitigation, and sanctions for those who do not act [11], which would greatly enhance the effectiveness of international cooperation.
For the cooperative governance of environmental problems within countries, scholars have explored mechanisms from different dimensions. In terms of horizontal cooperation, Shefer [7] investigated the implications of policy transfer in city-to-city cooperation. Di Gregorio et al. [9] analyzed the role of power in multi-level governance networks regarding climate policy. Regarding broader regional collaboration, Lintz [8] proposed a conceptual framework for analyzing inter-municipal cooperation on the environment. These studies indicate that cooperation is an effective way to overcome the decarbonization dilemma of a single region and open up the possibility of cooperation among smaller administrative units.
Regional joint governance has been proven to have significant cost-saving advantages, and regions with high carbon emissions and advanced technologies may bear more costs in the cooperation, while their counterparts should actively participate in such cooperation [31]. As the largest emitter, China has the potential to engage in inter-provincial cooperation in addition to actively participating in international cooperation [27,32]. Although all the provinces are subject to the management of the central government, differentiated levels of economic development and energy and resource endowments grant each provincial administrative unit a certain independence in decision-making. Some studies focusing on CER cooperation within countries examine inter-industry [33] and upstream and downstream supply chain (inter-enterprise) collaborations [34,35], while the conceptual framework of cooperative behavior in environmental governance among provinces has been neglected [9,28]. In the quantitative research of China’s inter-provincial cooperation on CER, Liu et al. [32] have explored the cost-sharing mechanism. However, more exploratory work is still needed on benefit distribution [36,37], which remains a key challenge for sustainable cooperation.
Based on the above literature review, several research gaps can be identified. First, existing studies primarily focus on the overall CER targets for a single target year, lacking attention to the dynamic trajectory of CER tasks from the present to the target year. However, each region requires a continuous, detailed, year-by-year CER plan to guide the orderly progression of emission reduction efforts. Second, most previous studies assume that provinces act independently in their emission reduction efforts, without any inter-provincial consultation or cooperation. In reality, the flow of energy and resources among Chinese provinces is inevitable, making inter-provincial cooperation indispensable. Furthermore, existing quantitative studies on CER cooperation mainly focus on the international, sub-national (city-level) [38], inter-industry, or supply-chain levels. Few studies have explicitly investigated cooperation at the provincial level (relatively independent administrative units within a country) and quantified the resulting economic, social, and environmental impacts.
To bridge these gaps, this paper aims to provide three main contributions. First, a continuous allocation of provincial CER tasks from 2020 to 2030 is calculated, explicitly considering the influence of cooperation on task allocation and partner matching in subsequent years. Second, focusing on inter-provincial collaboration within the country, we design a specific CER cooperation mechanism based on marginal abatement costs on the premise of generating mutual cooperative benefits. Finally, we set differentiated CER cooperation proportions and determine the optimal ones by comparing the national total abatement cost, carbon intensity, and the feasibility of achieving carbon peaking before 2030 under various scenarios.

3. Methodology

Prior to detailing the specific mathematical models and equations, we first define the core parameters and variables to establish a unified methodological framework. As presented in Table 1, the nomenclature used in this study is systematically categorized into four logical modules to facilitate readability: (1) fundamental indices and sets (e.g., provinces and time periods); (2) socio-economic prediction parameters serving as baseline inputs; (3) intermediate variables for the carbon quota allocation model; and (4) economic variables for evaluating marginal abatement costs (MAC) and inter-provincial cooperation mechanisms. This comprehensive summary serves as a foundational reference for all subsequent formulations.

3.1. Framework and Hypotheses

3.1.1. Methodological Framework

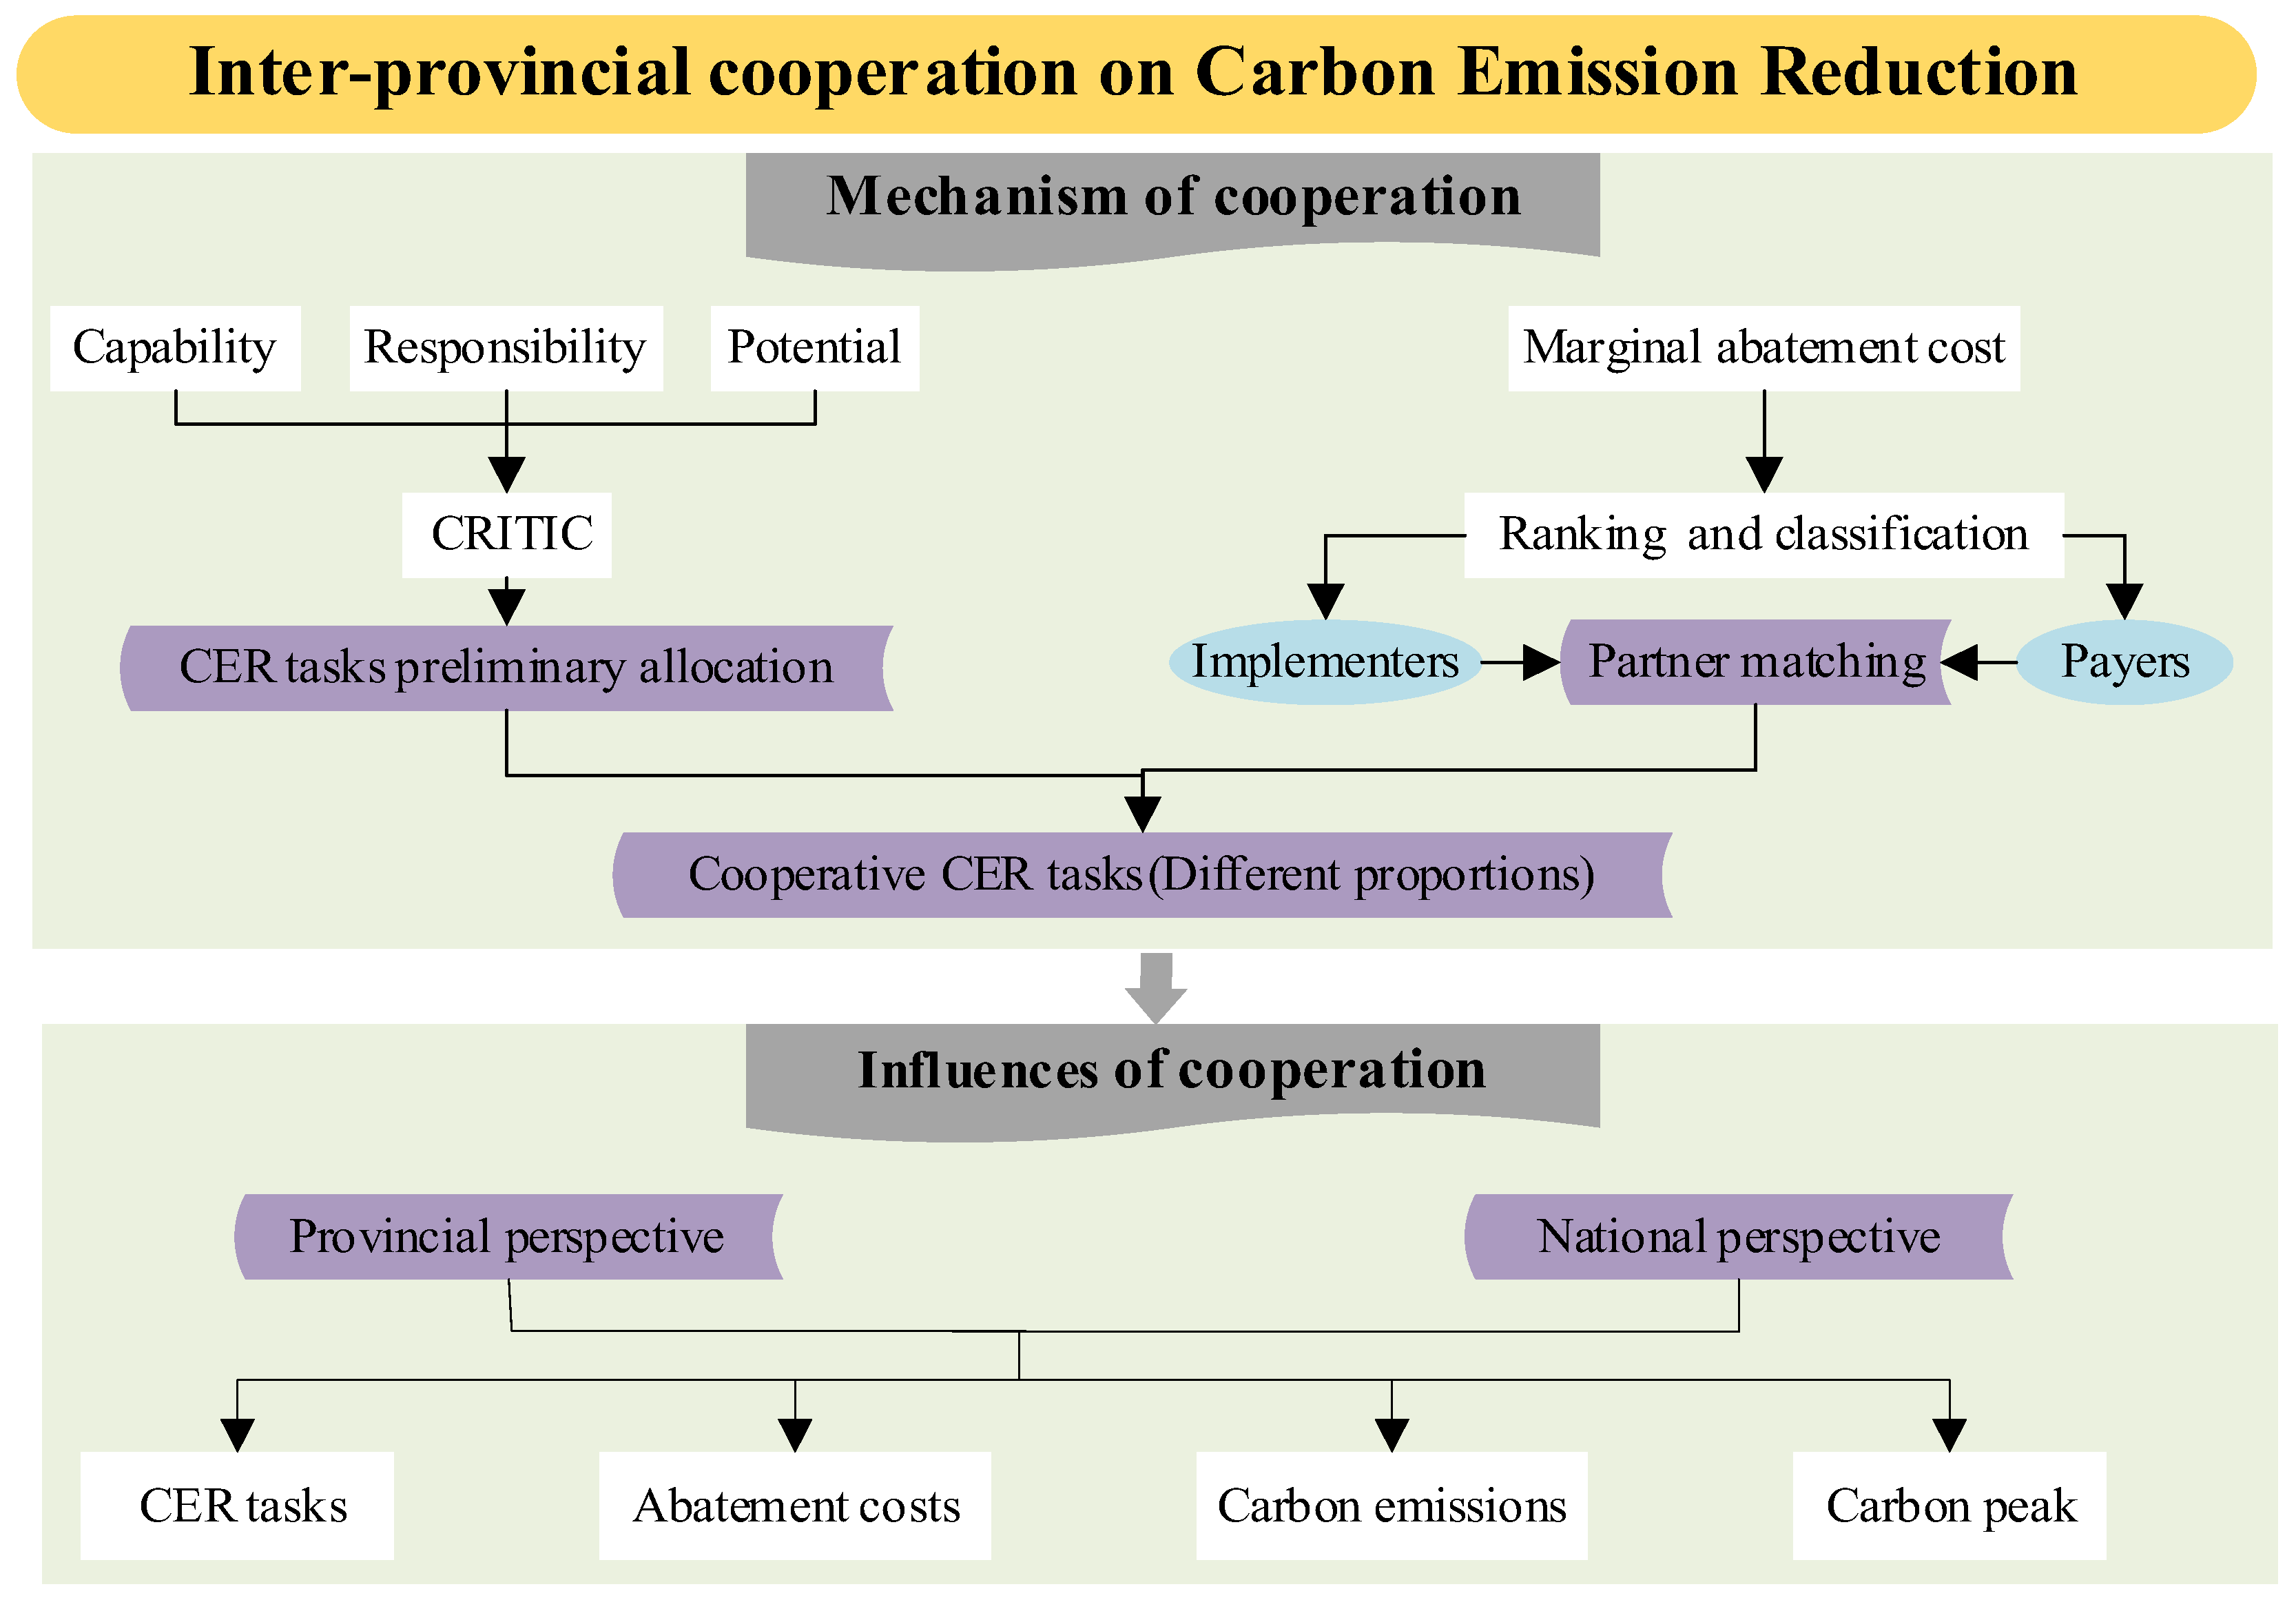
The methodological framework of this paper is illustrated in Figure 1. (1) Before designing the inter-provincial CER cooperation mechanism, it is necessary to determine the CER tasks allocated to each province. We allocate the national total CER tasks from 2020 to 2030 to each province by considering the principles of provincial carbon reduction capacity, responsibility, and potential. (2) We calculate the provincial marginal abatement costs for each year under the non-cooperation scenario, and match partners accordingly. (3) We determine the method for calculating the total cost of inter-provincial cooperation, and evaluate the multi-dimensional impacts under different cooperation proportions.

3.1.2. Research Hypotheses

The implementation of the proposed inter-provincial CER cooperation model is grounded in several operational premises: it is assumed that all provincial administrative units recognize their assigned CER tasks and are willing to participate in such cooperation. Partnerships are established only when mutually profitable and are maintained through negotiated contracts, where each province is limited to a single partner and is assumed to act with mutual trust. Building upon these premises and addressing the research gaps identified previously, this study formulates the following research hypotheses to guide the subsequent analysis:
H1. 
Compared with independent abatement, the inter-provincial CER cooperation mechanism based on marginal abatement costs significantly reduces the national total abatement cost.
H2. 
There exists an optimal cooperation proportion that balances the minimization of abatement costs with the constraint of achieving carbon peak targets for all provinces.

3.2. Total CER Tasks and Allocation

3.2.1. Annual National Total CER Tasks

The annual national Total Carbon Emission Reduction (TCER) tasks refer to the difference between the annual ideal emissions ( I E t ) under the 2030 carbon peak goal and the annual potential emissions ( P E t ) without additional policy intervention.
T C E R t = P E t I E t
The ideal total national carbon emissions for each year ( I E t ) can be projected based on the GDP growth rate and the national carbon intensity target. The International Monetary Fund (IMF) predicts that China’s actual growth rate will drop to around 5% by 2030 [39,40,41]. Drawing on these projections and combining them with the forecast results of the Chinese Academy of Sciences [42], we set China’s GDP growth rate at around 5.5% for the 2020–2030 period. In the “Action Plan for Peaking Carbon before 2030”, China’s State Council emphasized the goal of reducing carbon intensity (i.e., carbon emissions per unit of GDP) by more than 65% from 2005 levels by 2030. In this paper, we assume a linear reduction in carbon intensity for each year from 2020 to 2030. The ideal emissions can be calculated as follows:
I E t = [ ( t 2019 ) C I 2019 ( 1 0.65 ) C I 2005 11 + C I 2019 ] × ( 1 + 5.5 % ) t 2019 G D P 2019
The annual potential emissions ( P E t ) are set to equal the total expected carbon emissions of all provinces ( P E i t ) in the absence of policy constraints. Specifically, the ARIMA model is used to predict the carbon emissions of each province for the next ten years. This is based on historical carbon emission data from 2005 to 2019, which are available on the CEADs website [43,44,45,46]. The prediction of P E i t is conducted by utilizing the ARIMA function in MATLAB software (Version [R2022b]).
P E t = i = 1 30 P E i t

3.2.2. Provincial Allocation Principles and Indicators

The premise of inter-provincial cooperation in carbon emission reduction is to reasonably distribute CER tasks among provinces. The United Nations Framework Convention on Climate Change (UNFCCC) emphasized that different regions should follow the principle of “Common but differentiated responsibilities” when dealing with climate change issues. This principle also applies to China’s provinces in their efforts toward CER. In order to achieve equity and reflect regional differences in the distribution of CER tasks, capacity, responsibility, and potential are three aspects that have often been considered in previous studies [22,23,24]. With reference to the consensus reached in previous studies, this paper selects GDP per capita, historical cumulative emissions, and CO2 emissions per unit of industrial value added as the proxies for provincial carbon reduction capacity, responsibility, and potential (Table 2).

3.2.3. Calculation of Allocation

In this paper, the CRITIC method is used to calculate the weight of each indicator. First, the emission reduction capacity, responsibility, and potential indicators of each province need to be standardized. Since these three indicators are all positive (i.e., the larger the index value, the more emission reduction tasks will be allocated), the standardized calculation is carried out according to the following formula:
x   =   x x m i n / x m a x x m i n
The emission reduction capacity, responsibility, and potential indicators after standardization are denoted as C a p i t , R e s i t , and P o t i t respectively.
In the CRITIC weighting method, the standard deviation is used to express the variability (conflict) of a single indicator, and the correlation coefficient is used to express the correlation between indicators. The product of the conflict and correlation represents the comprehensive information of the indicators. The weights of the indicators ( w a ) are calculated as follows:
w a = S a   b = 1 n ( 1 r a b ) a = 1 n [ S a   b = 1 n ( 1 r a b ) ] , ( a b )
where r a b and a = 1 n ( 1 r a b ) are the coefficients of correlation and conflict between indicators, respectively. S a   represents the standard deviation of indicator α, and n is the total number of indicators.
By aggregating the standardized results and the weight information of each indicator, the CER tasks allocated to province i in t ( C E R i t ) can be determined based on its performance in terms of emission reduction capacity, responsibility, and potential in year t − 1 as follows:
C E R i t = ( w 1 C a p i ( t 1 ) + w 2 R e s i ( t 1 ) + w 3 P o t i ( t 1 ) ) × T C E R t
where w1, w2, and w3 represent the corresponding weights of emission reduction capacity, responsibility, and potential. T C E R t represents the national total CER tasks in year t.

3.3. Mechanism of Inter-Provincial Cooperation on CER

3.3.1. The Logic of Cooperation

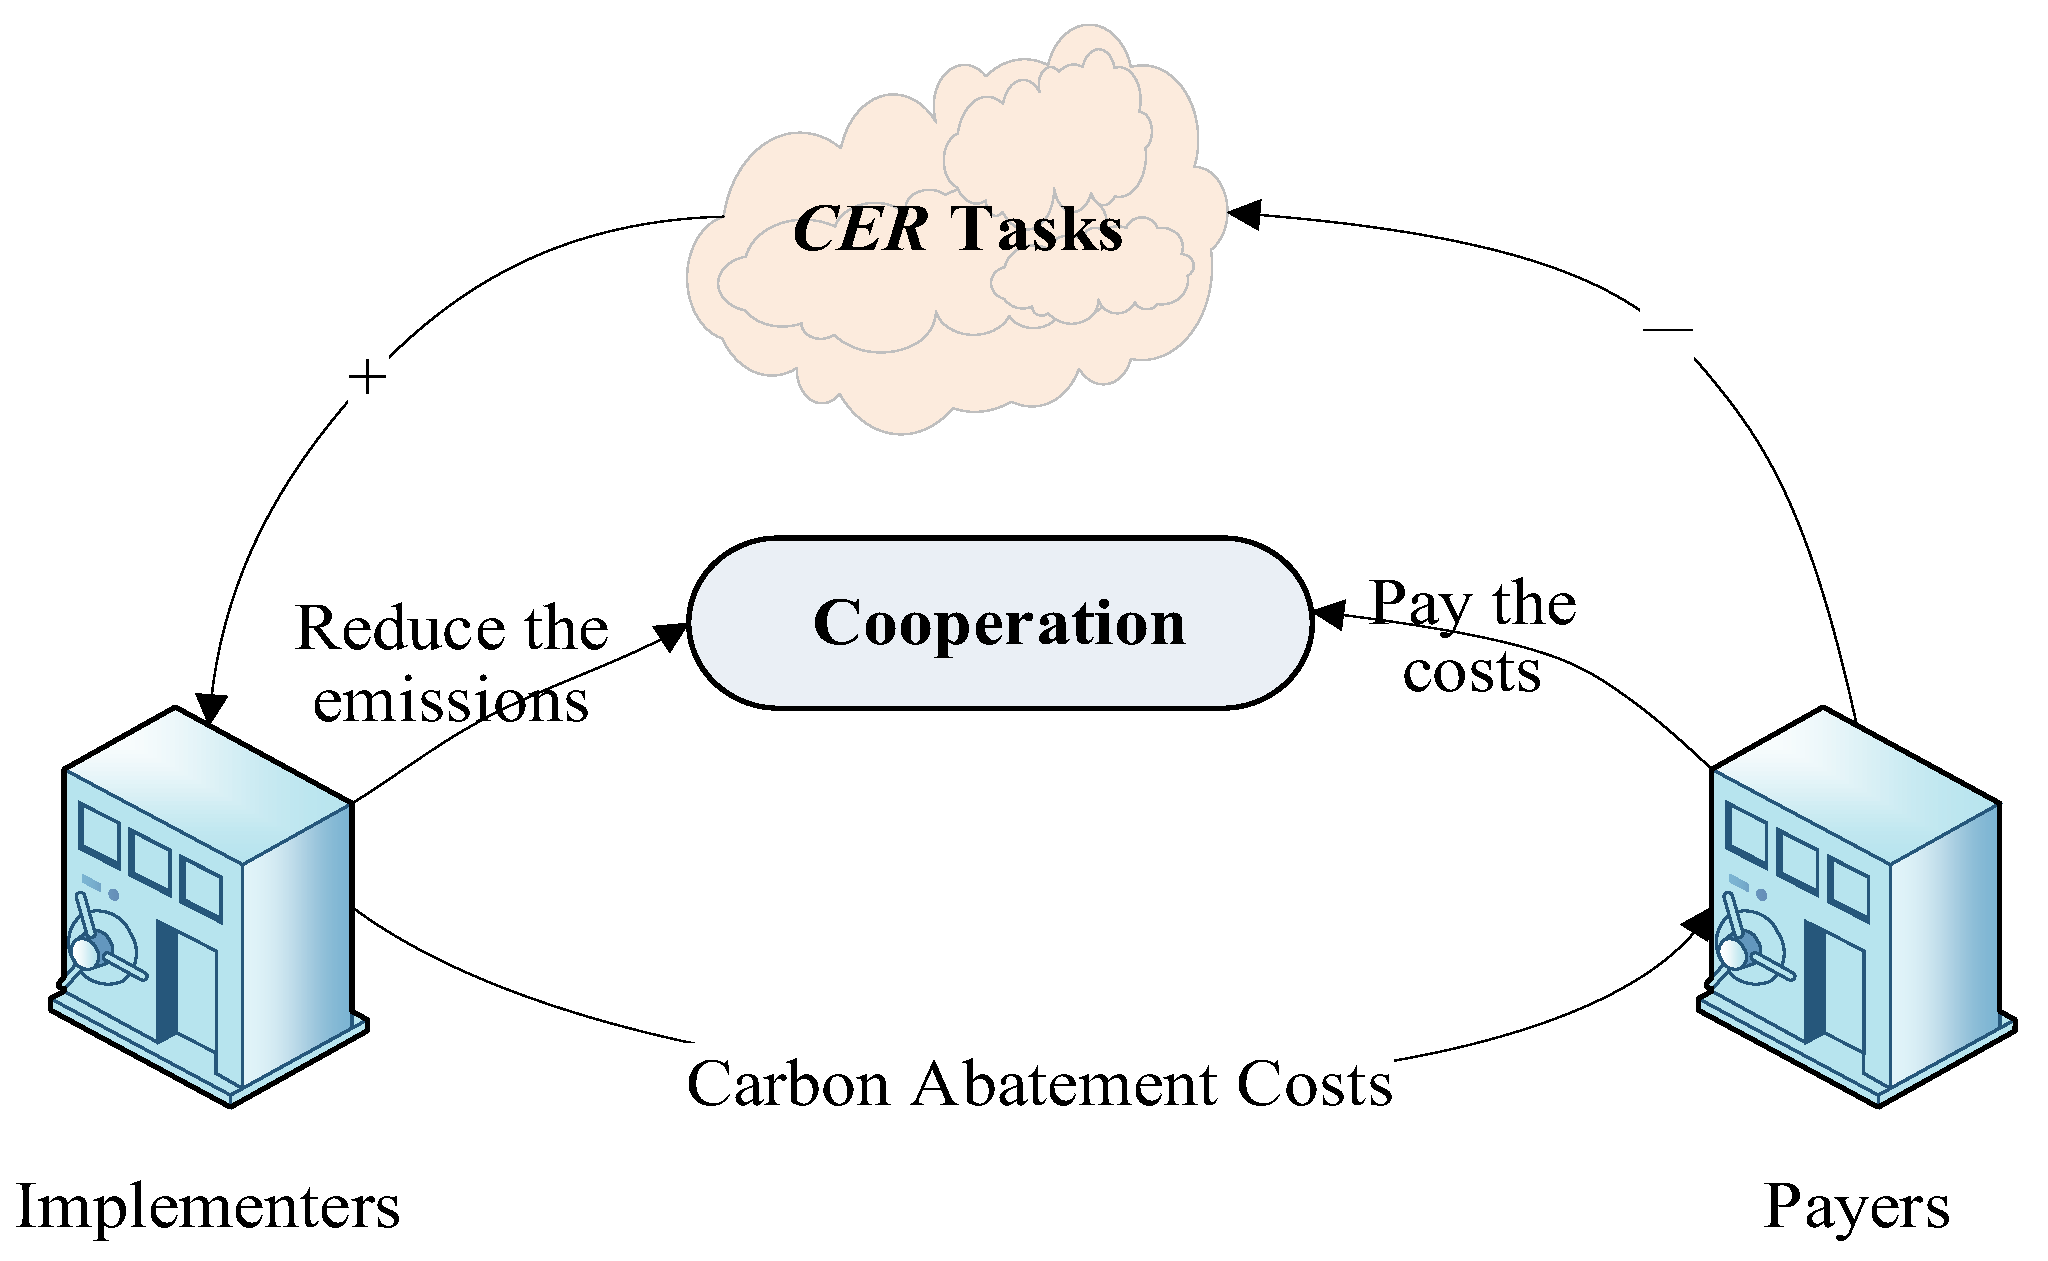
An important premise of building the cooperation relationship is the classification and definition of different provinces (Figure 2). Provinces with high marginal abatement costs outsource part of the CER tasks to provinces with low marginal abatement costs and pay the cooperation costs, while provinces with low marginal abatement costs obtain corresponding profits and can enhance their own carbon emissions reduction capacity by completing additional CER tasks [47]. In a one-to-one inter-provincial CER cooperative relationship, the province that implements the CER behavior is defined as the implementer province, and the province that pays the abatement cost is defined as the payer province. The purpose of inter-provincial emission reduction cooperation is mutual benefit. After establishing a partnership, implementers and payers can benefit from the following ways:
The implementers need to undertake part of the payers’ CER tasks in addition to completing their own CER tasks, and the cost of this part does not need to be paid by them. They can profit from pricing strategies that are favorable to them. With the support of cooperative benefits, the implementers will have more economic momentum to carry out low-carbon industrial upgrading and transformation.
Inter-provincial cooperation reduces the total number of CER tasks the payers need to undertake, thus reducing their total abatement costs and easing the environmental constraints on economic development to some extent. In addition, due to the gap in marginal abatement costs (MAC) between the two partners, the payers can pay for cooperation at a price lower than their own MAC. In short, the total abatement cost paid by payers is lower than that under non-cooperation; simultaneously, the allowable emissions in those provinces increase, so there will be more room for economic development.
In addition to reducing the abatement costs of both parties, we also hope that the inter-provincial cooperation can generate additional effects, such as reducing the national total abatement cost before reaching the carbon peak, narrowing the inter-provincial carbon intensity gap, improving the coordination of the whole society on CER, and achieving the national carbon emission peak faster and more effectively.

3.3.2. Partnerships Based on the Abatement Cost

The primary premise of inter-provincial cooperation on CER is to reduce abatement costs. At the same time, the influence of various factors on cooperation can be converted into costs. Thus, this paper establishes the cooperation mechanism based on abatement costs. The models for studying the marginal abatement costs can be roughly divided into bottom-up [48], top-down [49], and hybrid models [50]. The marginal abatement cost curve is usually expressed in the form of a logarithmic function [47] or a quadratic function [47]. In this paper, we use the logarithmic function proposed by William D. Nordhaus to express the marginal abatement cost (MAC):
M A C ( R ) = α + β ln ( 1 R )
where R is the proportion of emission reduction, and α and β are the parameters to be estimated [51]. The provincial marginal abatement cost function can be decomposed using the coordinate translation method [52]. We construct the provincial MAC function and set the relevant parameters according to existing research [16,21,51] as follows:
M A C ( A k ) = β ln ( 1 A k E k ( 1 r k ) )
where Ak is the actual emission reduction in province k, and Ek is its emission load. rk is the translation distance of the coordinate, and r k = 1 C I k C I ¯ , CIk is the carbon emission intensity ( C I k = C I k / G D P k ) of province k, and C I ¯ is the national average carbon emission intensity ( C I ¯ = E / G D P ). The value of β in 2030 is taken as −91.79 [53].
By integrating Equation (8), the total abatement cost of province k can be obtained:
T A C ( A k ) = β [ E k ( 1 r k ) A k ] ln ( 1 A k E k ( 1 r k ) ) β A k
In the cooperative relationship, all the payer provinces form set I ( j J ), and all the implementer provinces form set J ( j J ). The theoretical carbon emission reduction in each province is equal to the allocation result of CER tasks (i.e., A = C E R ) in this paper. Provinces i and j have a unique correspondence. When participating in the cooperation, the total abatement cost of the payer province ( T C i ) and the implementer province ( T C j ) are as follows:
T C i = C ( C E R i ) C ( Q i j ) + C O ( Q i j )   = β [ E i ( 1 r i ) ( C E R i Q i j ) ] ln ( 1 C E R i Q i j E i ( 1 r i ) ) β ( C E R i Q i j ) + C O ( Q i j )
T C j = C ( C E R j ) + C ( Q j i ) C O ( Q j i )   = β [ E j ( 1 r j ) ( C E R j + Q j i ) ] ln ( 1 C E R j + Q j i E j ( 1 r j ) ) β ( C E R j + Q j i ) C O ( Q j i )
s . t . Q i j = Q j i = η C E R i η = 0 % , 20 % , , 80 % , 100 %
where CERi and CERj represent the theoretical carbon emission reduction, and C(CERi) and C(CERj) are the corresponding abatement costs. Q i j and Q j i represent the quantity of the cooperative CER (Qij = Qji), and C(Qij) and C(Qji) are the corresponding abatement cost. CO(Qij) represents the cost paid for cooperation, and CO(Qji) represents the benefits derived from cooperation.
According to the total cost equations, when C ( Q i j ) C O ( Q i j ) > 0 , cooperation on emission reduction is profitable for province i; when C ( Q j i ) C O ( Q j i ) < 0 , cooperation on emission reduction is profitable for province j. Therefore, after the quantity of cooperative CER has been established, the range of mutually beneficial cooperation costs is between CO(Qij) and CO(Qji). While discussing the rationality of the CER cooperation mechanism, the optimal amount of inter-provincial CER will also be explored. From the perspective of payers (province i) outsourcing CER tasks, we define the proportion of annual cooperative CER in province i to its total CER tasks ( η ) as 0%, 20%, 40%, 60%, 80% and 100%.
Ideally, the payers can outsource all their CER tasks to the implementers, but the maximum quantity of CER (i.e., maximum CER potential) that the implementers can bear will be limited, so we must consider the upper limit of the amount of cooperative CER in the inter-provincial CER cooperation. Due to the gaps in economic development and resource endowment among provinces, the differences in CER potential are mainly determined by production levels and industrial structures. This paper calculates the CER potential of each industry in year t by using the industry benchmarking method [42,54]. It captures the difference between the carbon intensity of each industry in each province and that of the industry benchmark. The benchmark carbon intensity of a certain industry is the lowest carbon intensity of that industry among all provinces. Combining this with the industrial output value in year t, the maximum CER potential of each industry in year t + 1 is obtained. The maximum CER potential of all industries in the province is summed to obtain the maximum quantity of CER.
To sum up, the establishment of the partnership needs to meet the following constraint conditions.
s . t . C ( Q j i ) < C O ( Q j i ) = C O ( Q i j ) < C ( Q i j ) Q i j = Q j i Q i j u = Q j i u Q j i u C E R j
where Q i j u and Q j i u are the upper limits of the amount of cooperative CER of provinces i and j.
To determine the specific transaction value within the range defined in Equation (12), this paper assumes a market equilibrium where the marginal abatement costs of trading partners are equalized. The transaction payment CO(Qij) is calculated based on the shadow price (P) of carbon at the equilibrium point:
C O ( Q i j ) = P × Q i j
where P satisfies the condition:
M A C i ( C E R i Q i j ) = M A C j ( C E R j + Q i j ) = P

3.3.3. Partner Matching and Updating

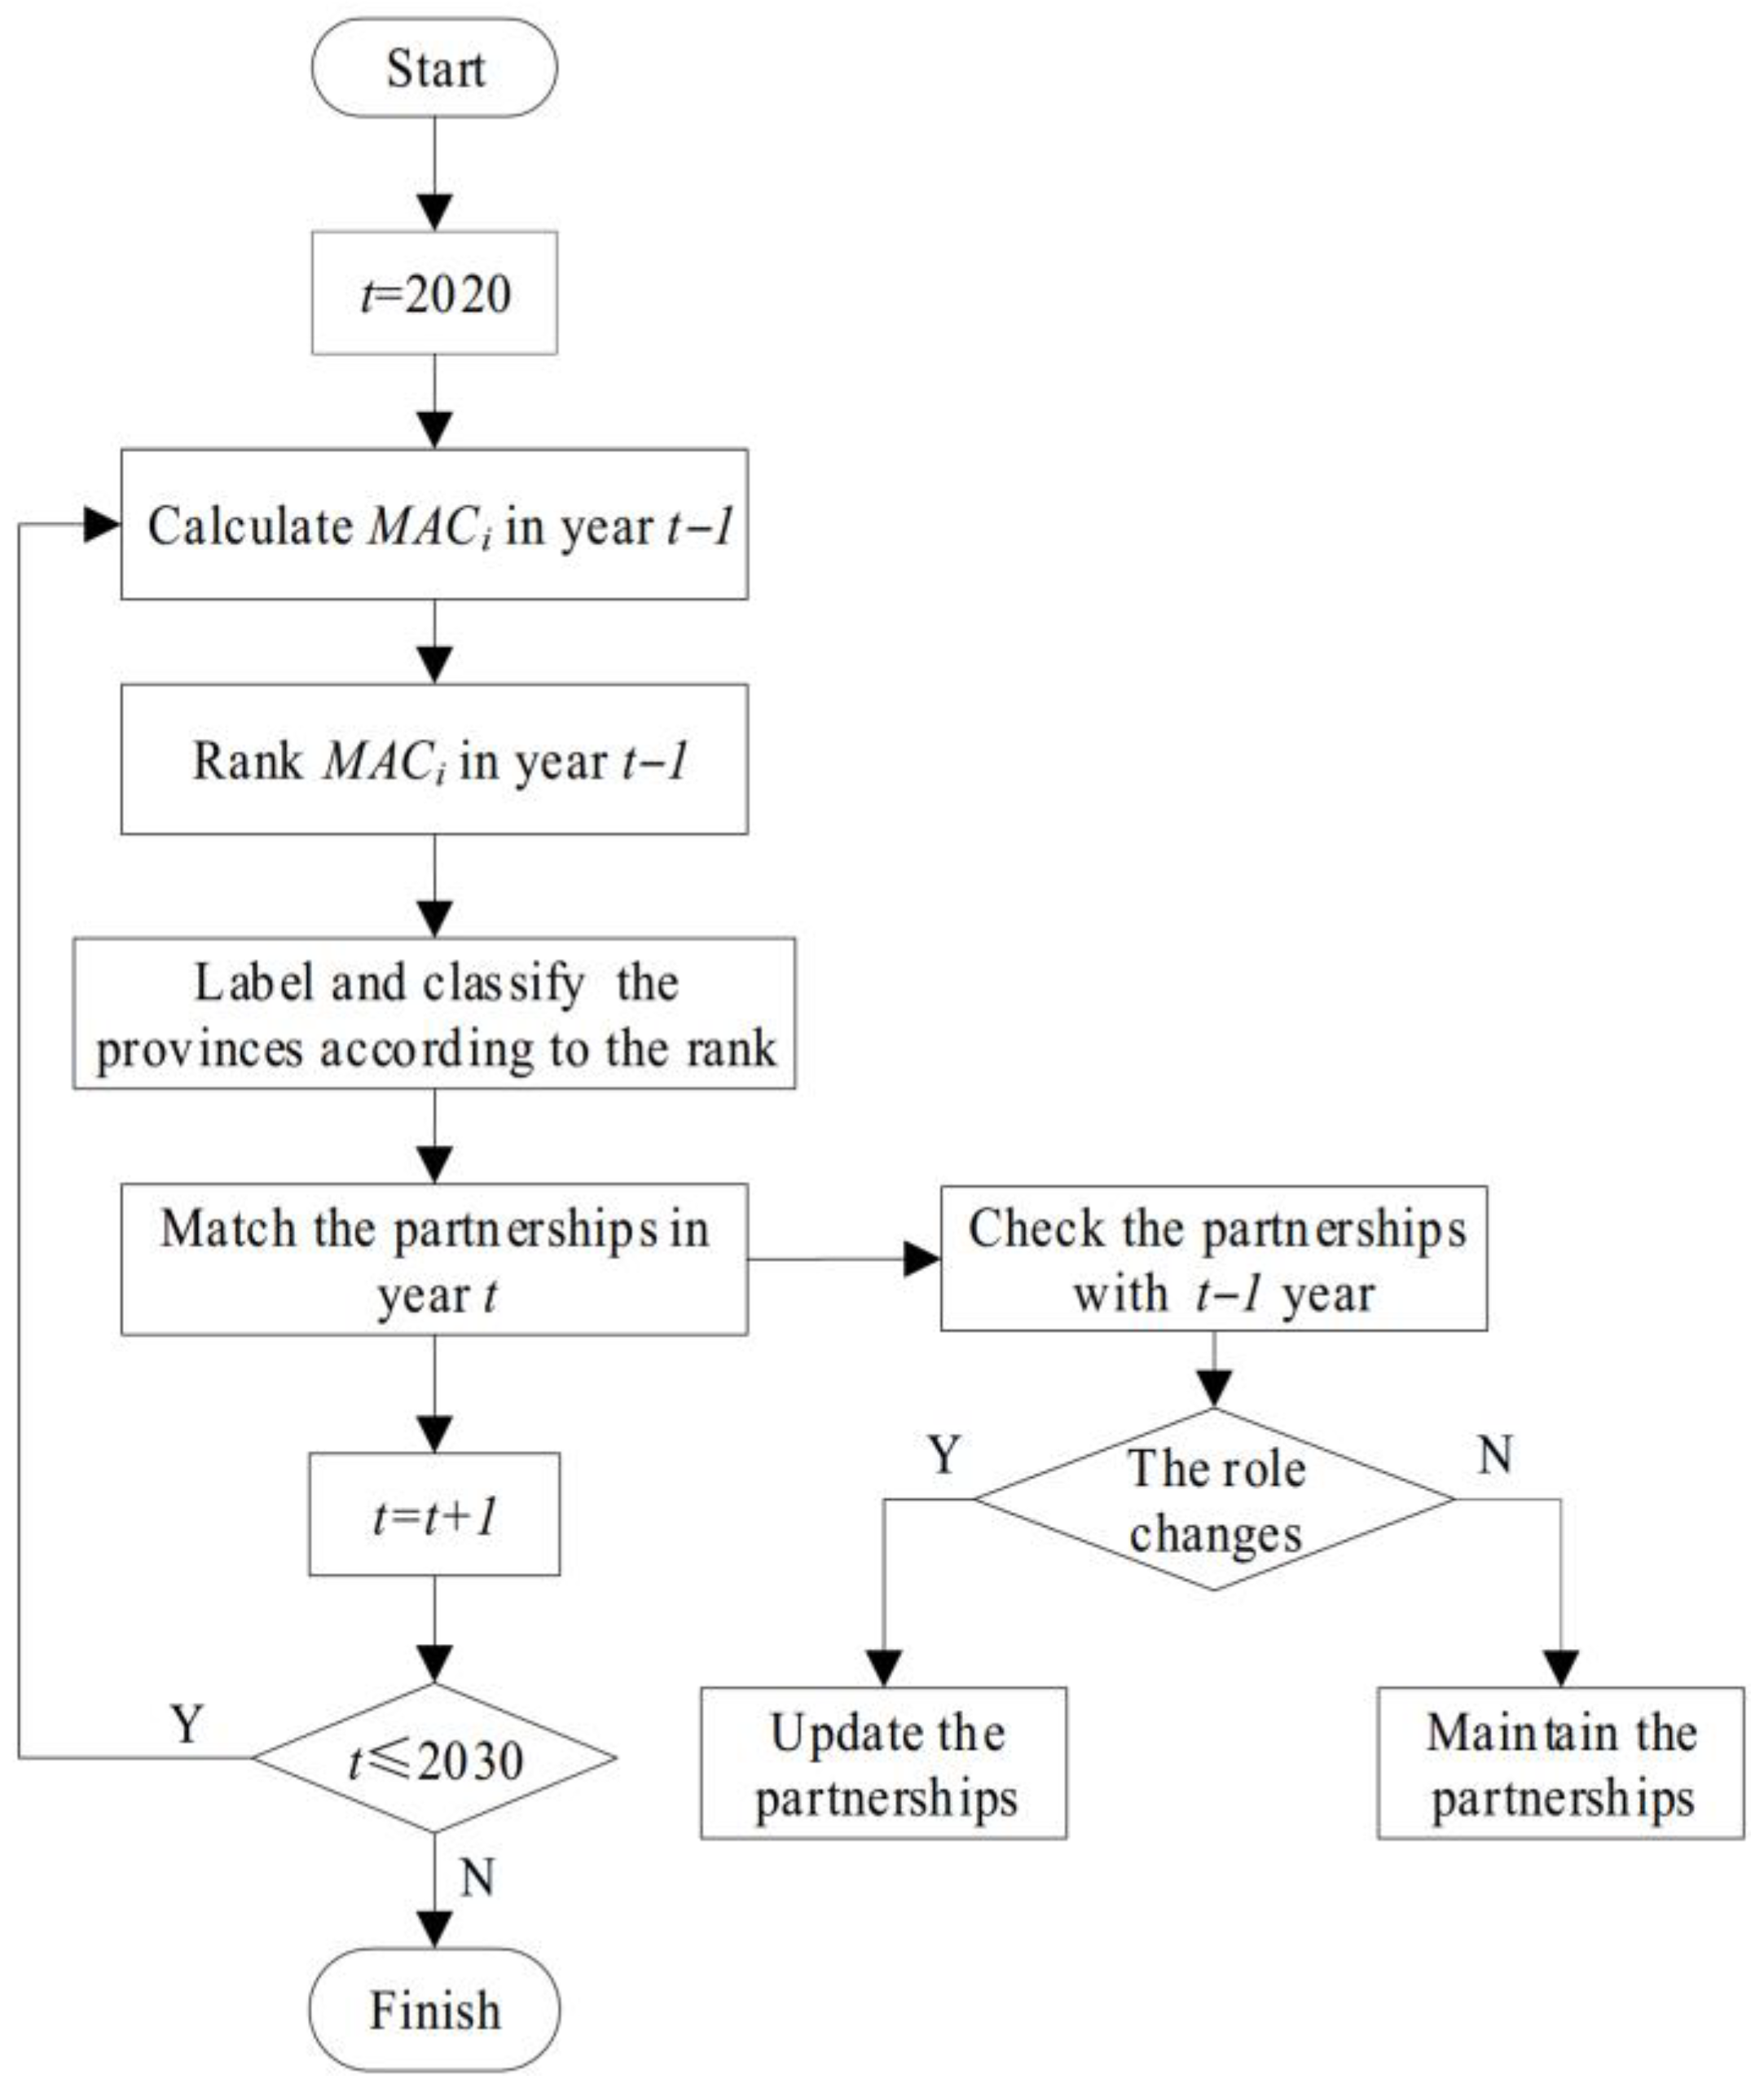
An effective cooperation relationship can bring additional economic benefits or greater CER compared with non-cooperation. For a payer province, all provinces with lower marginal abatement costs are potential partners; however, cooperation between provinces with the largest difference in marginal abatement costs will maximize abatement cost savings. This paper takes 2019 as the base year and matches cooperation partners from 2020 to 2030 according to their marginal abatement costs. The optimal partner matching and updating process in year t is as follows (Figure 3):
Step 1: Calculate the provincial marginal abatement cost MACi in year t − 1 (2020 ≤ t ≤ 2030) according to Equation (9).
Step 2: Rank the MACi calculation results for year t − 1 in ascending order as: MAC1, MAC2, …, MAC30.
Step 3: Establish the optimization model. To determine the optimal cooperation scheme based on the ranked MACs, we establish a cost minimization model subject to emission reduction constraints. The objective function and constraints are defined as follows:
min i = 1 30 T A C i t
s . t . i = 1 30 ( E i t A i t ) T C E R t 0 Q i j η C E R i t
Step 4: The provinces are labeled as P1, P2 …, P30 according to this rank. The first 15 provinces (P1, P2, …, P15) are defined as implementers, and the remaining 15 provinces (P16, P17, …, P30) are defined as payers.
Step 5: The provinces corresponding to MAC1 and MAC30 in t − 1 year form the first partnership (P1P30); the provinces corresponding to MAC2 and MAC29 in year t − 1 form the second partnership (P2P29). Continue this matching until the fifteenth partnership (P15P16) is formed.
Step 6: Check the best partner every year by comparing it with the previous year’s ranking, and update it only when the role of a province in the cooperative relationship changes (i.e., changes from a payer to an implementer or vice versa).

3.4. Data Sources and Parameter Settings

The data of GDP, population, and industrial added value (IAV) are primarily sourced from the National Statistical Yearbook and provincial statistical yearbooks. The provincial and national carbon emission data are from the CEADs website (https://www.ceads.net/, accessed on 17 August 2024) and have been updated through 2019. In addition, the Chinese government has set the goal of reducing carbon intensity by at least 65% by 2030 compared with 2005. Therefore, this paper takes 2019 as the base year and uses 2020–2030 as the study period for inter-provincial CER cooperation. Based on the cooperation models above, we establish the following parameters from 2020 to 2030. All the economic indicators are measured based on 2005 constant prices. Considering the availability of provincial carbon emission data, this paper finally selects 30 provinces for the inter-provincial CER cooperation research, excluding Hong Kong, Macao, Tibet, and Taiwan.
To ensure the reliability of the baseline inputs for the 2020–2030 period, we have rigorously audited the projection methods for GDP, population, and emission inventories. Specifically, the population projections are strictly calibrated based on the official targets of the National Population Development Plan (2016–2030), and the economic growth rates are closely aligned with the targets outlined in China’s 14th Five-Year Plan. A comprehensive summary of all key variables—including their specific units, base years, data sources, and corresponding projection methods—is explicitly listed in Table 3.
We collect and compile the economic development framework in the provincial 14th Five-Year Plan reports, and summarize the planned GDP growth rates for each province from 2021 to 2025. Then, we extend these growth rates to 2030 and calculate the provincial planned GDP. To match provincial economic development plans with national targets, we revise the provincial planned GDP in conjunction with the national annual GDP growth target of 5.5% by 2030 and calculate the GDP of each province (GDPit) from 2020 to 2030 as follows:
G D P i t = G D P i , 2019 × ( 1 + θ i t ) t 2019 × λ t
where θ i t is the planned GDP growth rate of province i in year t. λ t is the provincial GDP correction factor in year t and can be calculated as follows:
λ t = G D P i , 2019 × ( 1 + 5.5 % ) t 2019 i = 1 30 G D P i , 2019 × ( 1 + θ ) t 2019
where the denominator represents the total national GDP of each year calculated and summed based on the provincial planned growth rates, while the numerator represents the total national GDP of each year calculated by the national planned growth rate (5.5%).
popt and popit are the national and provincial populations in year t, respectively. According to the National Population Development Plan (2016–2030) issued by the State Council and the World Population Prospects issued by the United Nations, China’s total population will be controlled at around 1.45 billion by 2030. Based on the official forecast results [55,56], the total population of China in 2030 (POP2030) is set at 1.45 million. The total population of China in 2020 (POP2020) is 1412 million (data from the China Statistical Yearbook). The total population of China in year t ( p o p t ) can be obtained by assuming a linear growth trend for the total population from 2020 to 2030. Assuming that the share of each province’s population will not change in the short term [39], this paper assumes this share will remain unchanged until 2030. The annual population of each province ( p o p i t ) can be obtained as follows:
p o p t = p o p 2020 + p o p 2030 p o p 2020 10 × ( t 2020 ) , 2020 t 2030  
p o p i t = p o p i 2020 p o p 2020 × p o p t
IAVit represents the industrial added value of province i in year t. In order to ensure the consistency of parameters, this paper does not consider changes in the industrial structure and sets the growth rate of industrial added value to be the same as that of the provincial GDP.
I A V i t = I A V i ( t 1 ) × G D P i t G D P i ( t 1 )
E(ind)it is the industrial carbon emissions of province i in year t. After verification, the provincial share of E(ind)it in its total emissions remains at a relatively stable level in the short term, so this paper sets the average E(ind)it share of province i from 2015 to 2019 as the share from 2020 to 2030. The E(ind)it can be calculated based on the provincial potential emissions (PEit) and the share of industrial carbon emissions.

4. Results

4.1. Allocation of CER Tasks and the Influences of Cooperation

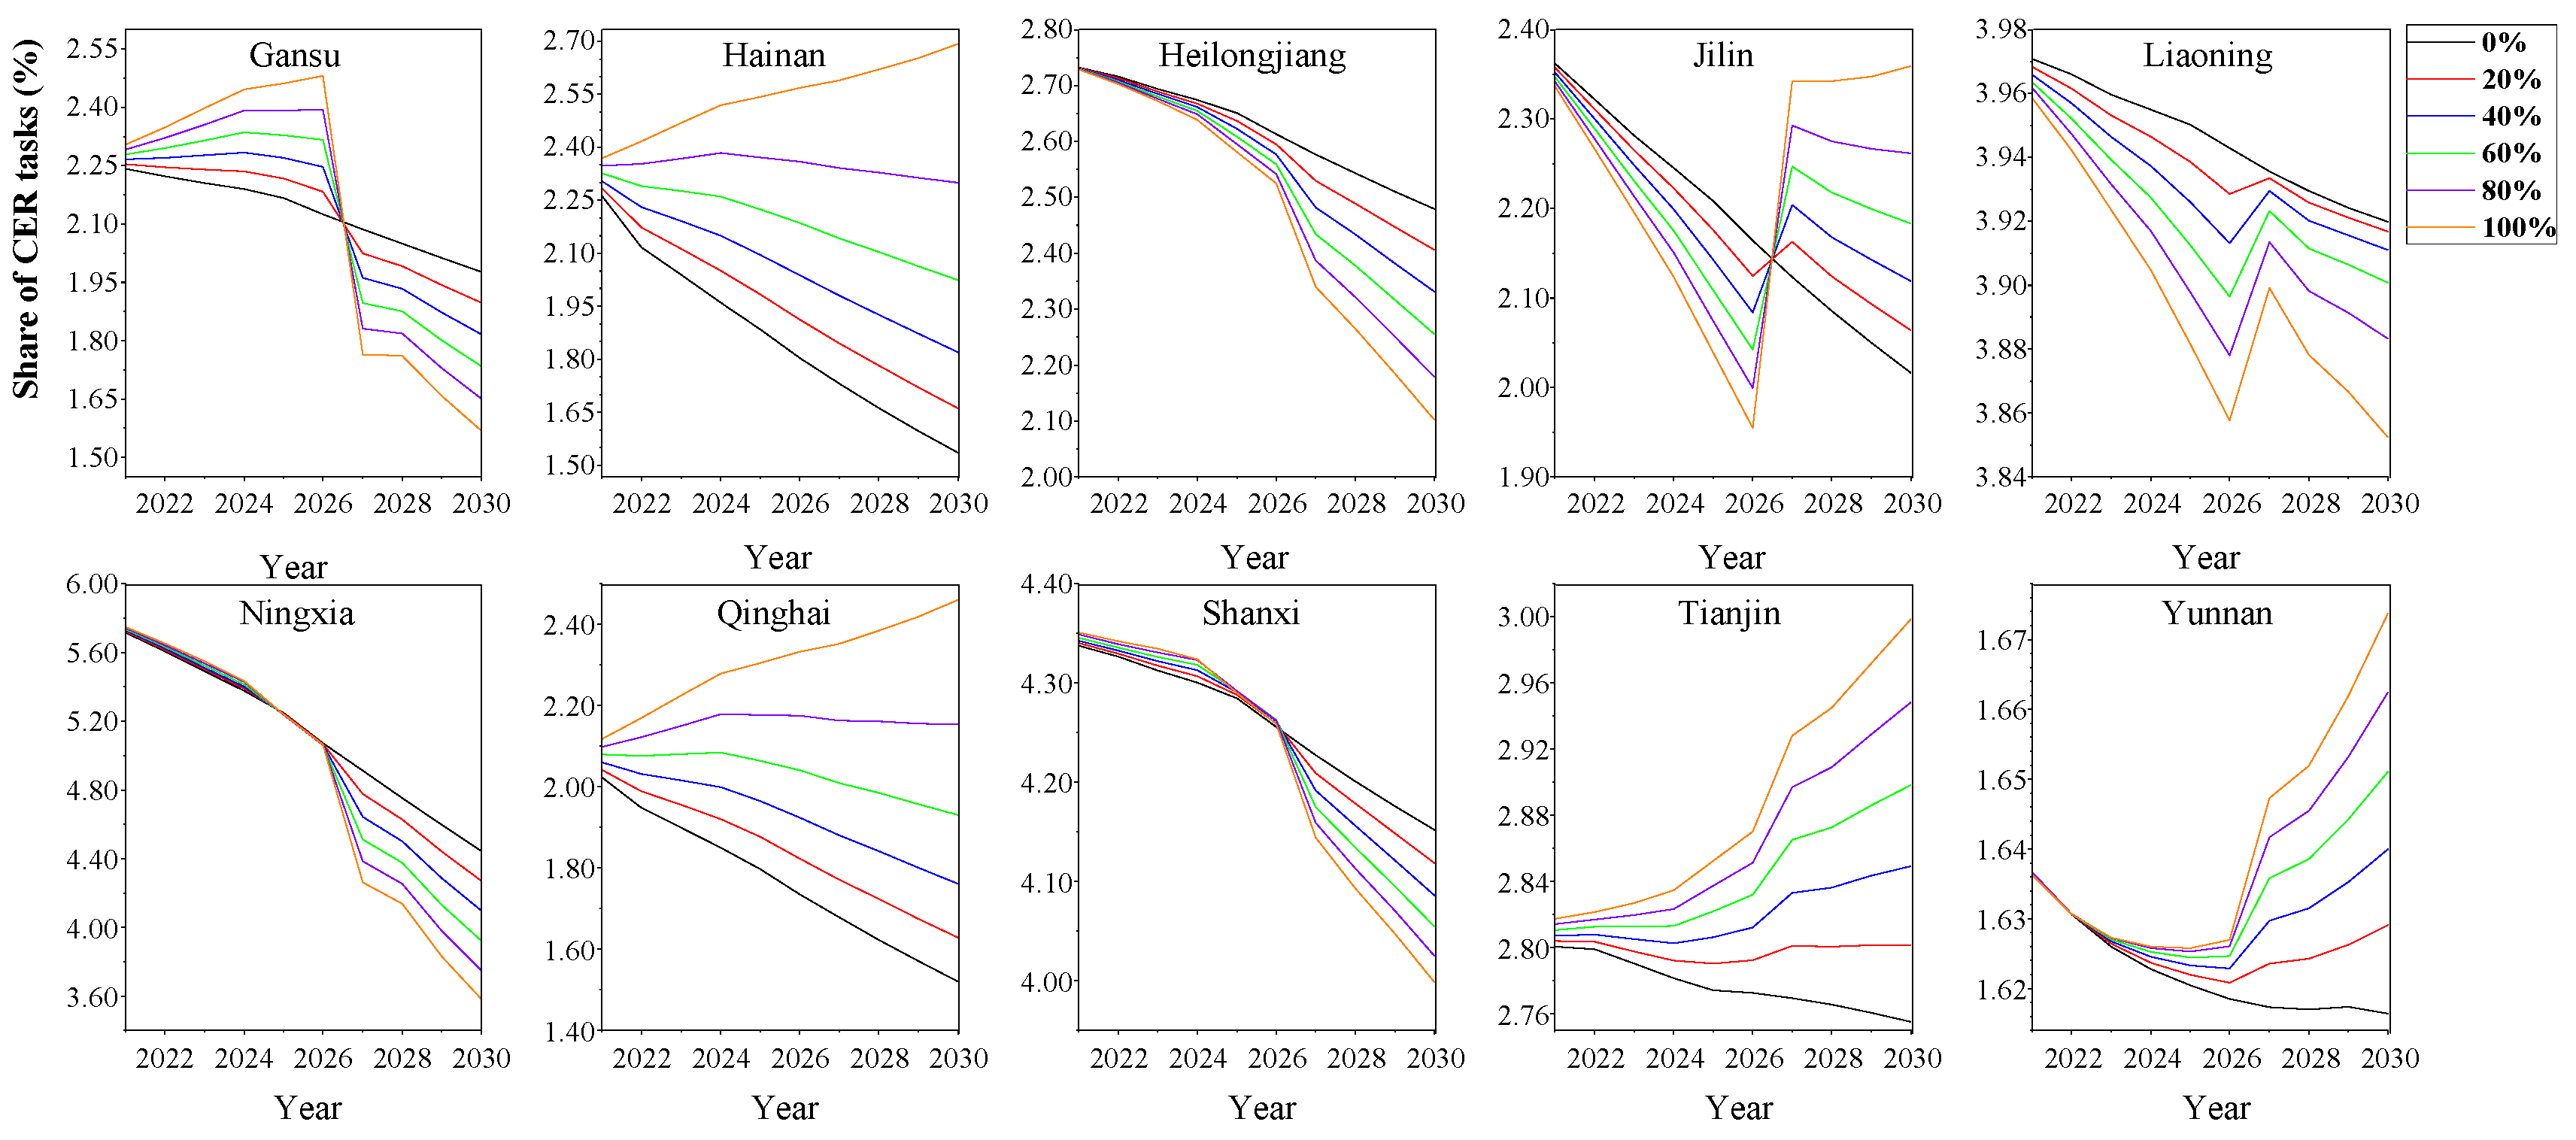
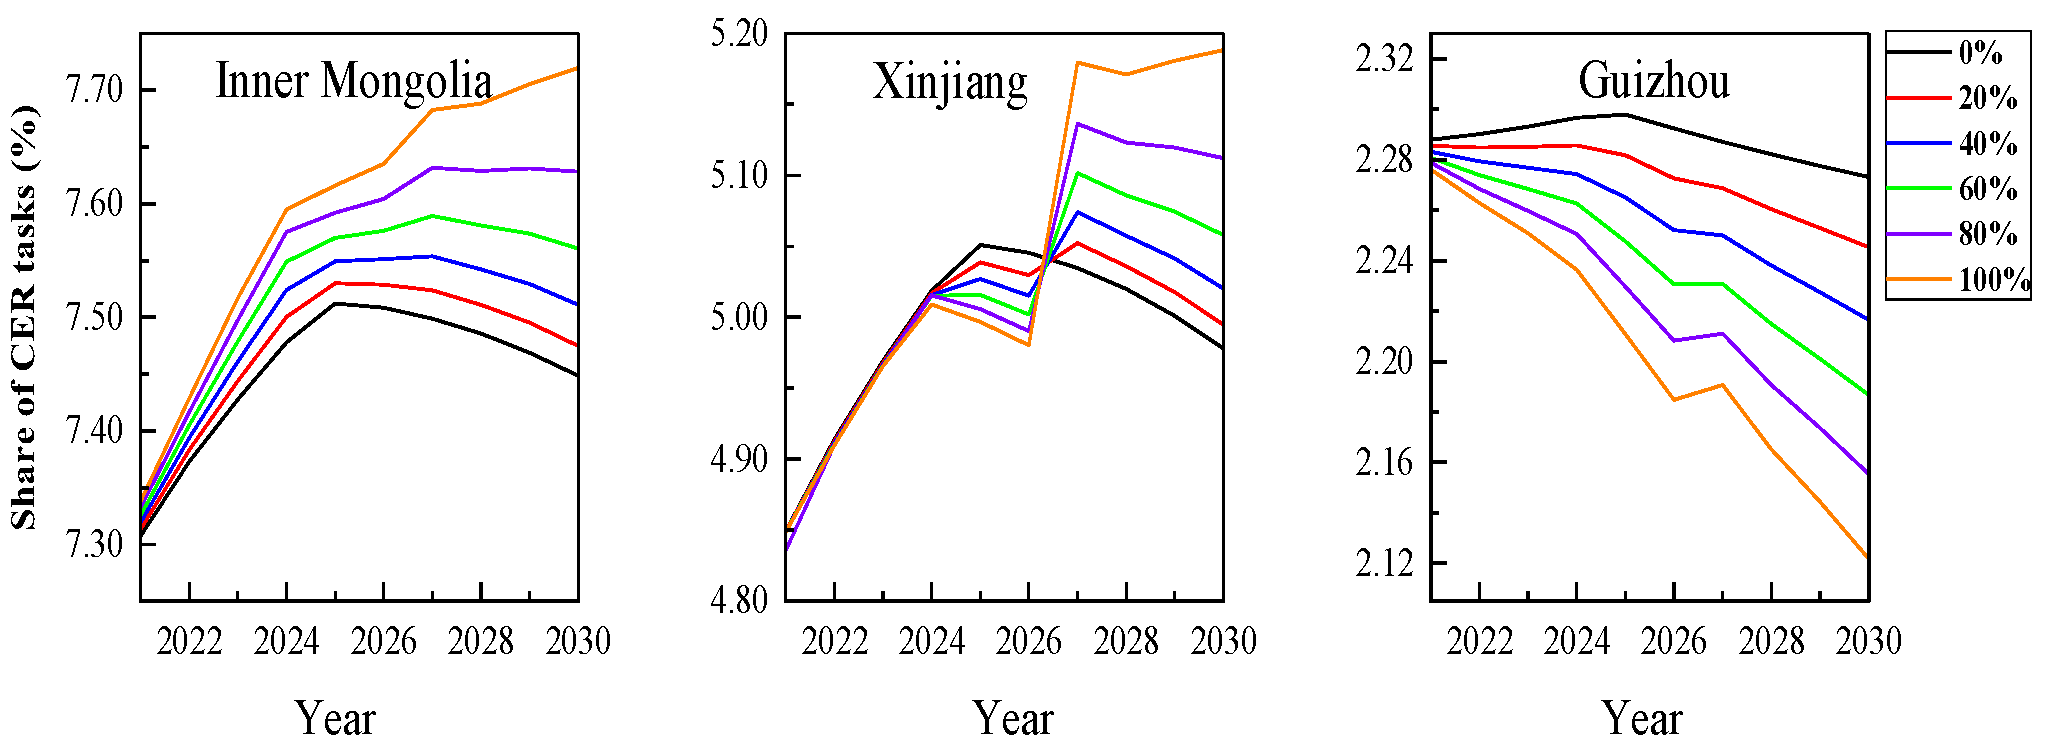
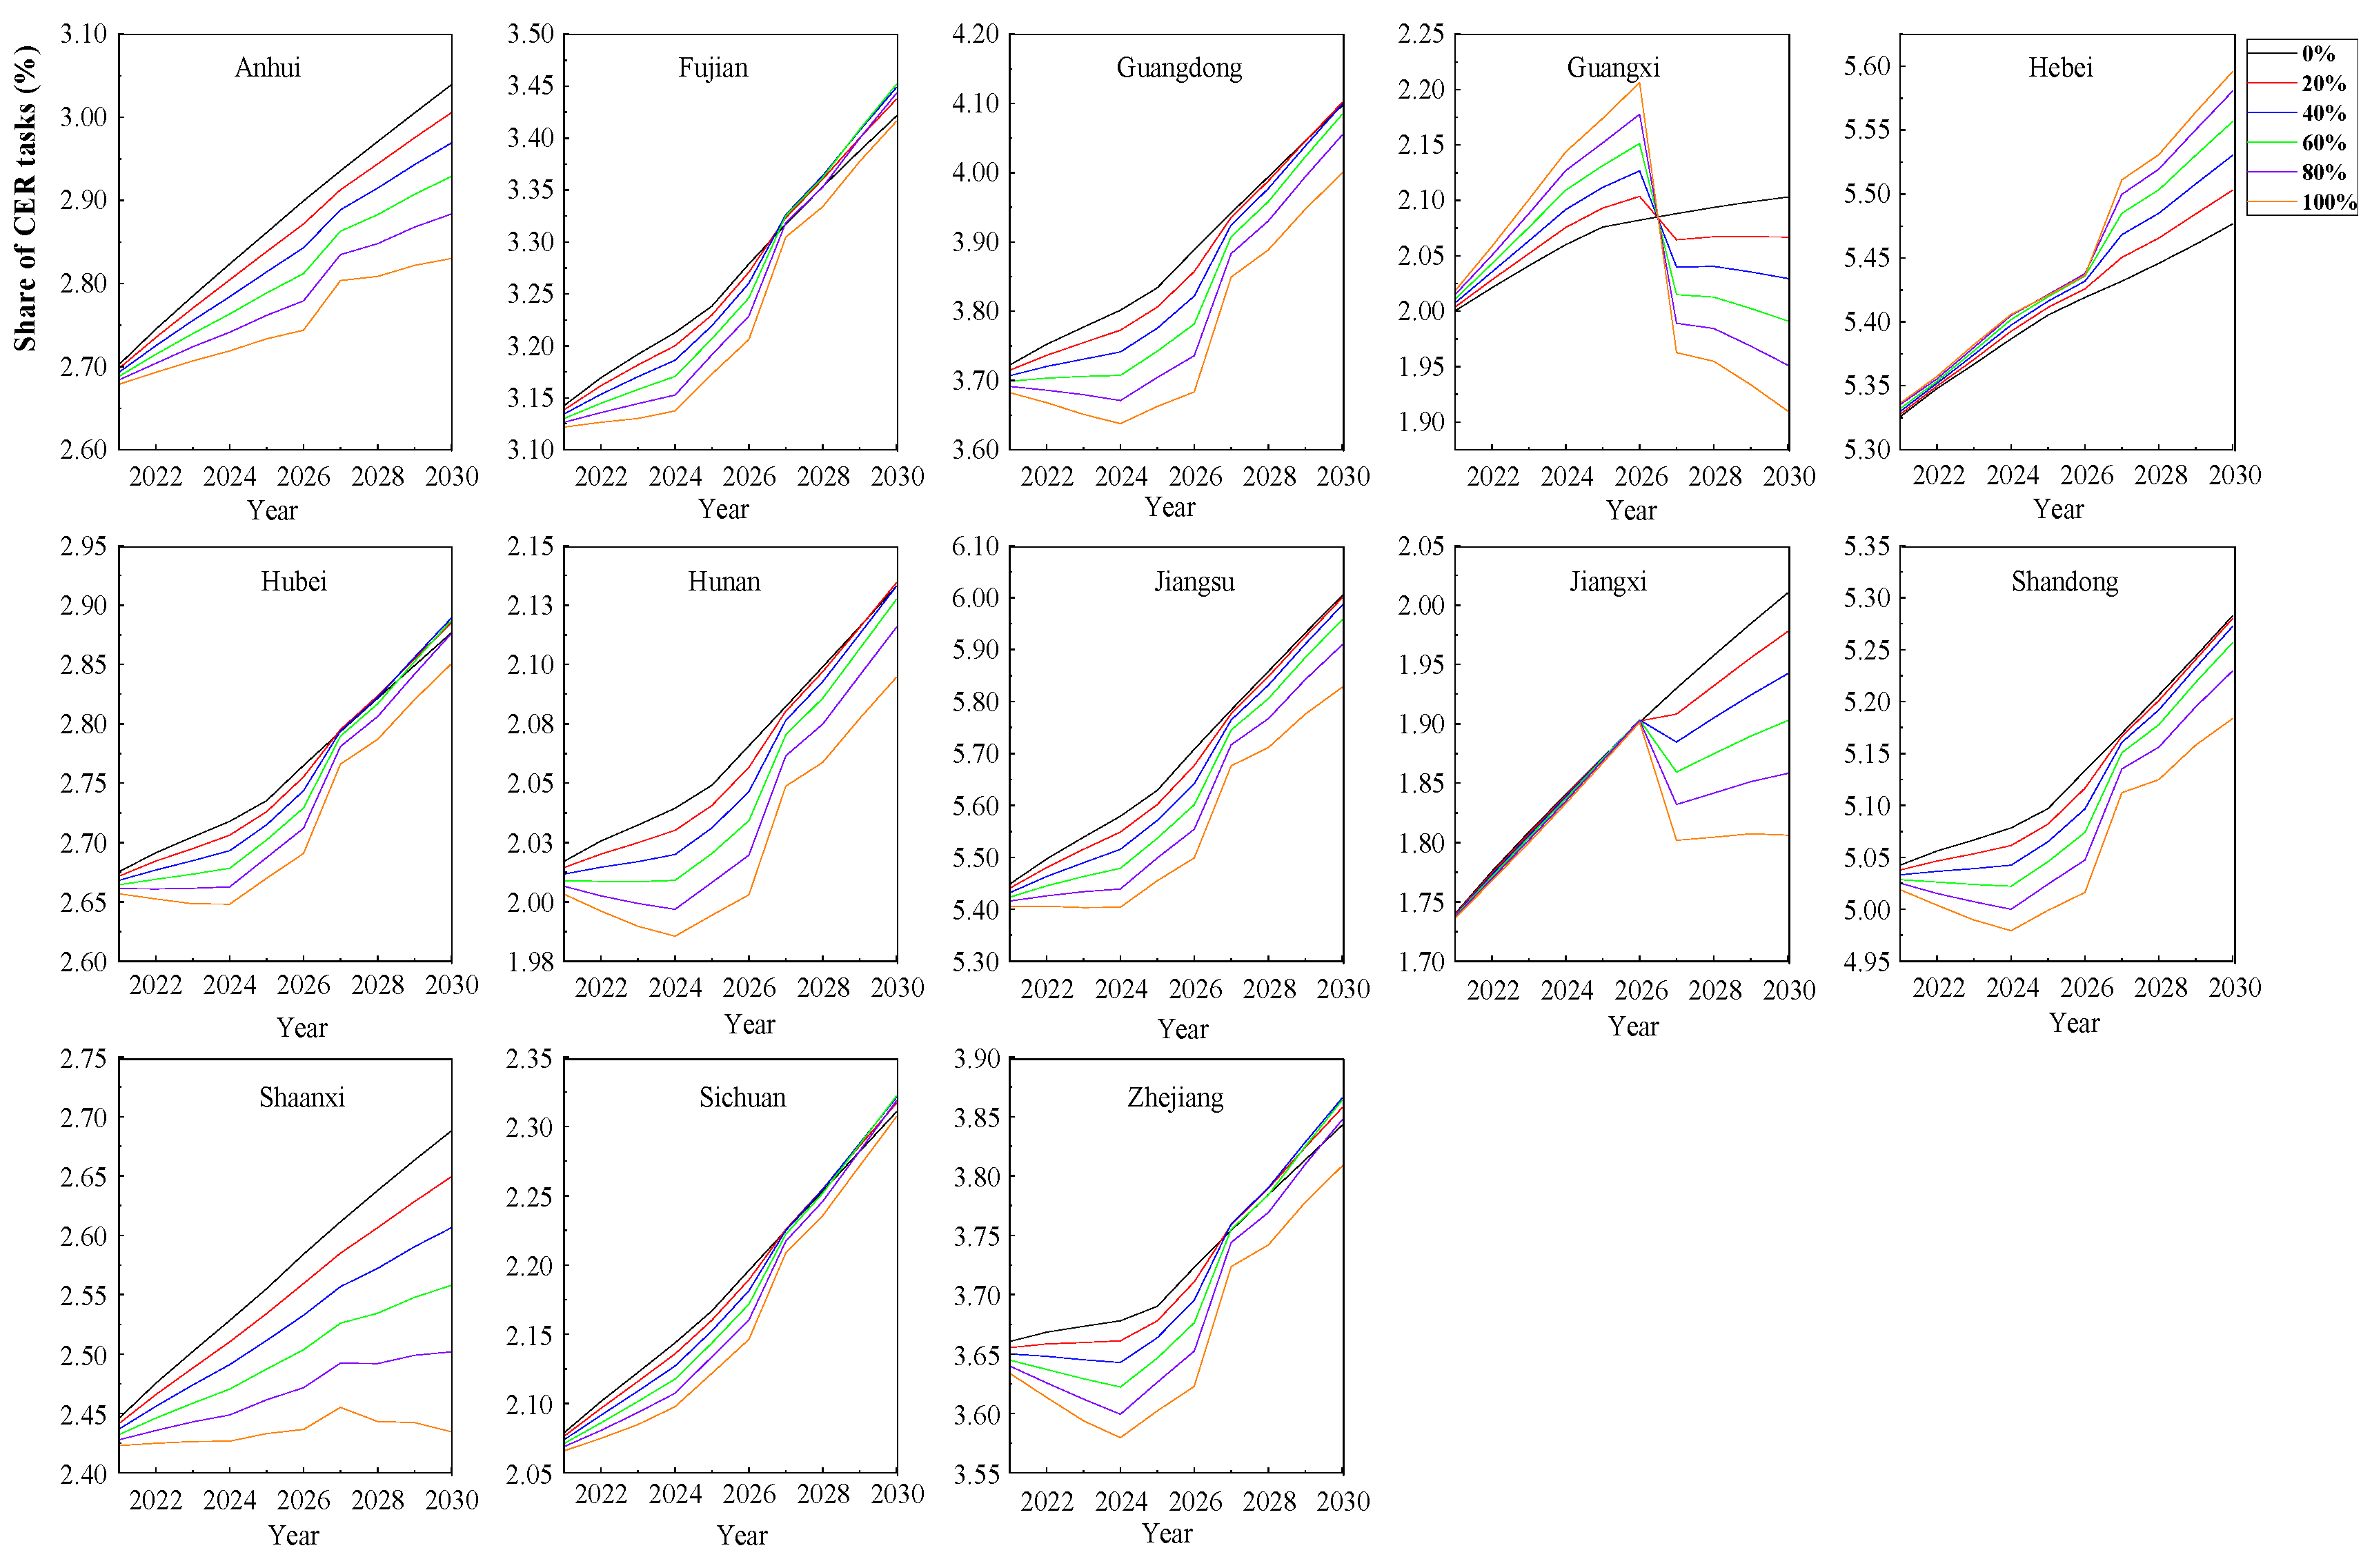
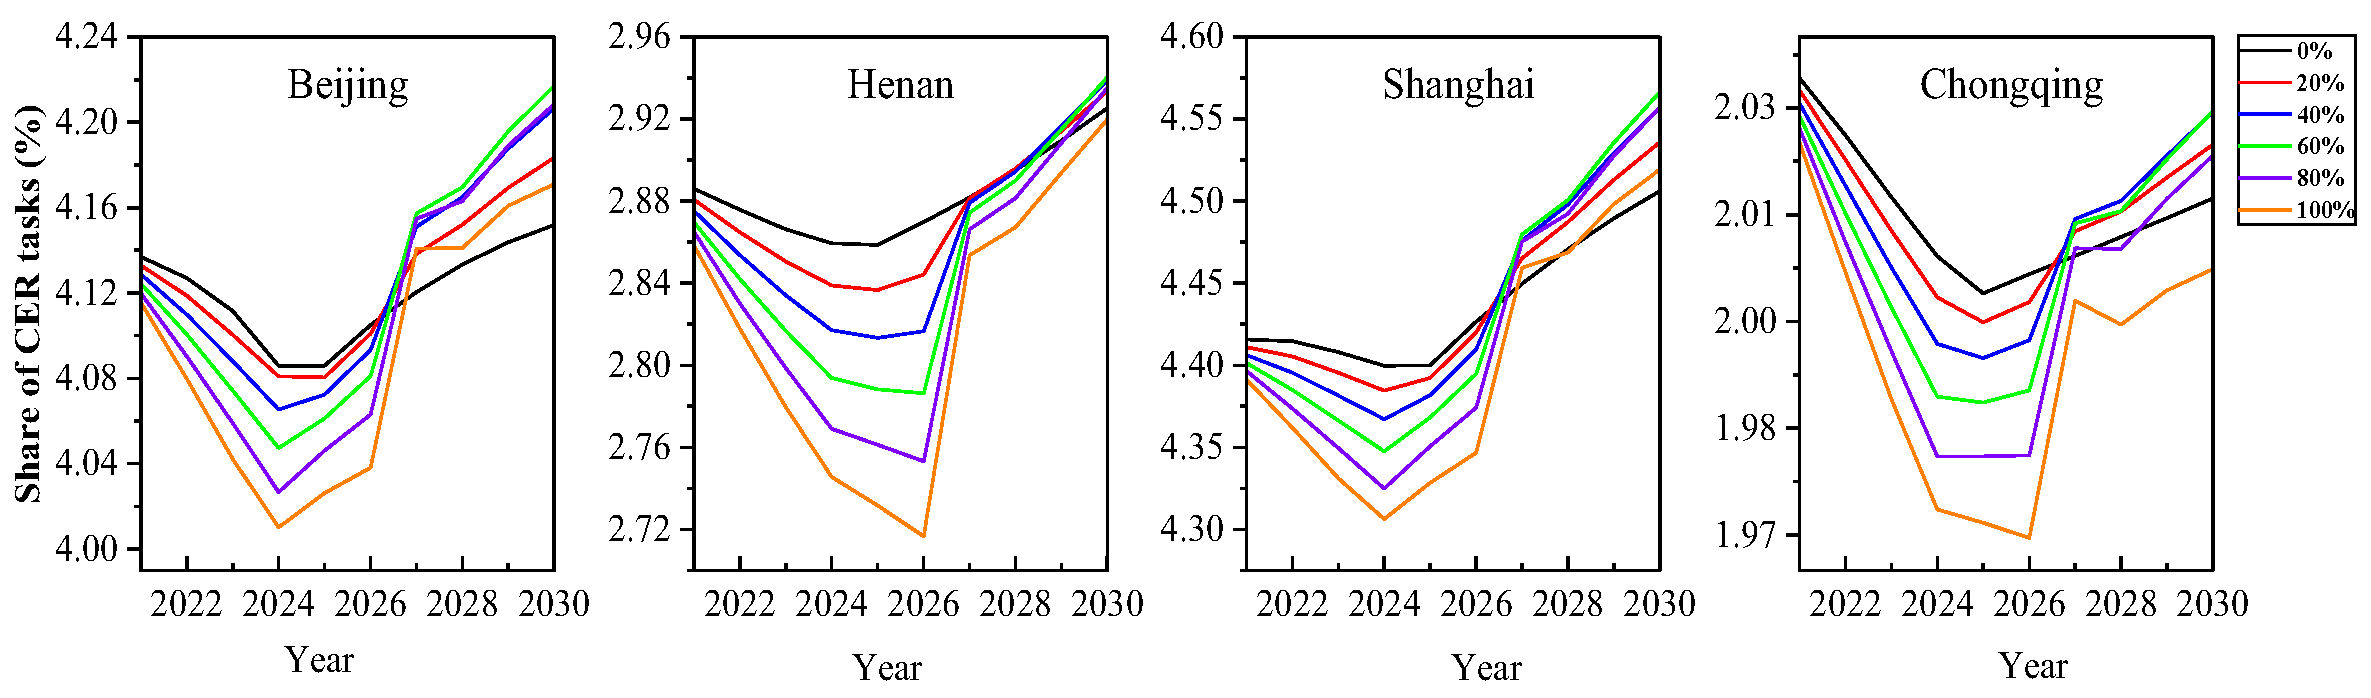
From 2020 to 2030, China’s total CER tasks will continue to rise. Figure 4, Figure 5, Figure 6 and Figure 7 show that there are four types of changes in the share of provincial CER tasks from 2020 to 2030: a continuous increase, a continuous decrease, an initial decrease followed by an increase, and an initial increase followed by a decrease.
Among them, the first type includes 13 provinces (Figure 4). Due to high Cit and Rit, they show significant upward trends in the next decade. These provinces are key to supporting China’s economic growth and will continue to be dominated by energy-intensive industries for at least the next decade.
The second type includes ten provinces (Figure 5), whose common features are low Cit or high Pit. Under the trend of green industry upgrading and low-carbon process transformation, the growth rate of Cit will be limited, and the Pit will decrease significantly, so the allocated value of CER tasks will decrease year by year.
The lower industrial development scale of the provinces in the third category (Figure 6) leads to a smaller Pit, so their CER task allocation scores gradually decrease in the early period. In addition, due to the large base of Cit and Rit, the contribution of these two indicators will be more prominent in the later period, and the allocation of CER tasks will increase significantly.
Provinces included in the fourth type (Figure 7) are typical resource-based provinces with large bases of Rit and Pit, so they will maintain an upward trend of CER allocation score in the early period. However, due to the low Cit, the relative gap with other provinces gradually widens, and their scores also gradually decrease.
Inter-provincial cooperation can significantly affect the share of CER tasks allocated to each province. Theoretically, the implementing provinces will undertake additional CER tasks due to cooperation, and their emissions will be effectively controlled. The Rit and Pit will also be smaller than those under non-cooperation. As the payer provinces outsource and transfer the CER tasks, their allocated CER tasks will be larger. The Rit and Pit become larger than those under non-cooperation. Cooperation affects both the indicator values and their weights, and the CER task allocation scores will have many possible changes, and may even subvert the results compared to the non-cooperation scenario.
To sum up, inter-provincial cooperation has a significant impact on the proportion of CER tasks allocated to each province, but cooperation does not necessarily lead to a decrease in the proportion of CER tasks for implementer provinces, and vice versa.

4.2. The Partner Matching

The partnership is determined by ranking the marginal abatement costs of each province. The marginal abatement cost in the base year is calculated according to the carbon emissions in 2019, and those in the 2020–2030 period can be calculated based on the CER tasks allocated to each province. Given that changing partners is costly, only when the benefits of cooperation are considerably affected by the changing roles of the provinces will the partners be rearranged.
The partner matching results show that the cooperative relationships will remain unchanged during 2020–2025, as the partnership roles of the provinces will not change. In 2026, Jiangxi, Guangxi, and Gansu will change from payers to implementers, while Guangdong, Jilin, and Henan will change from implementers to payers. Therefore, after 2026, the partnerships will change and be maintained until 2030. Table 4 shows the partnerships between 2020 and 2030.
Only Beijing_Inner Mongolia and Hainan_Hebei will maintain a stable cooperation relationship for the next decade. Except for these four provinces, the rankings of marginal abatement costs in the other provinces will change to some extent. Although there is no obvious geographical proximity between the partners, the spatial distance between them in the second stage (2026–2030) is significantly reduced compared with the first stage (2020–2025).

4.3. Abatement Costs Under Different Cooperation Proportions

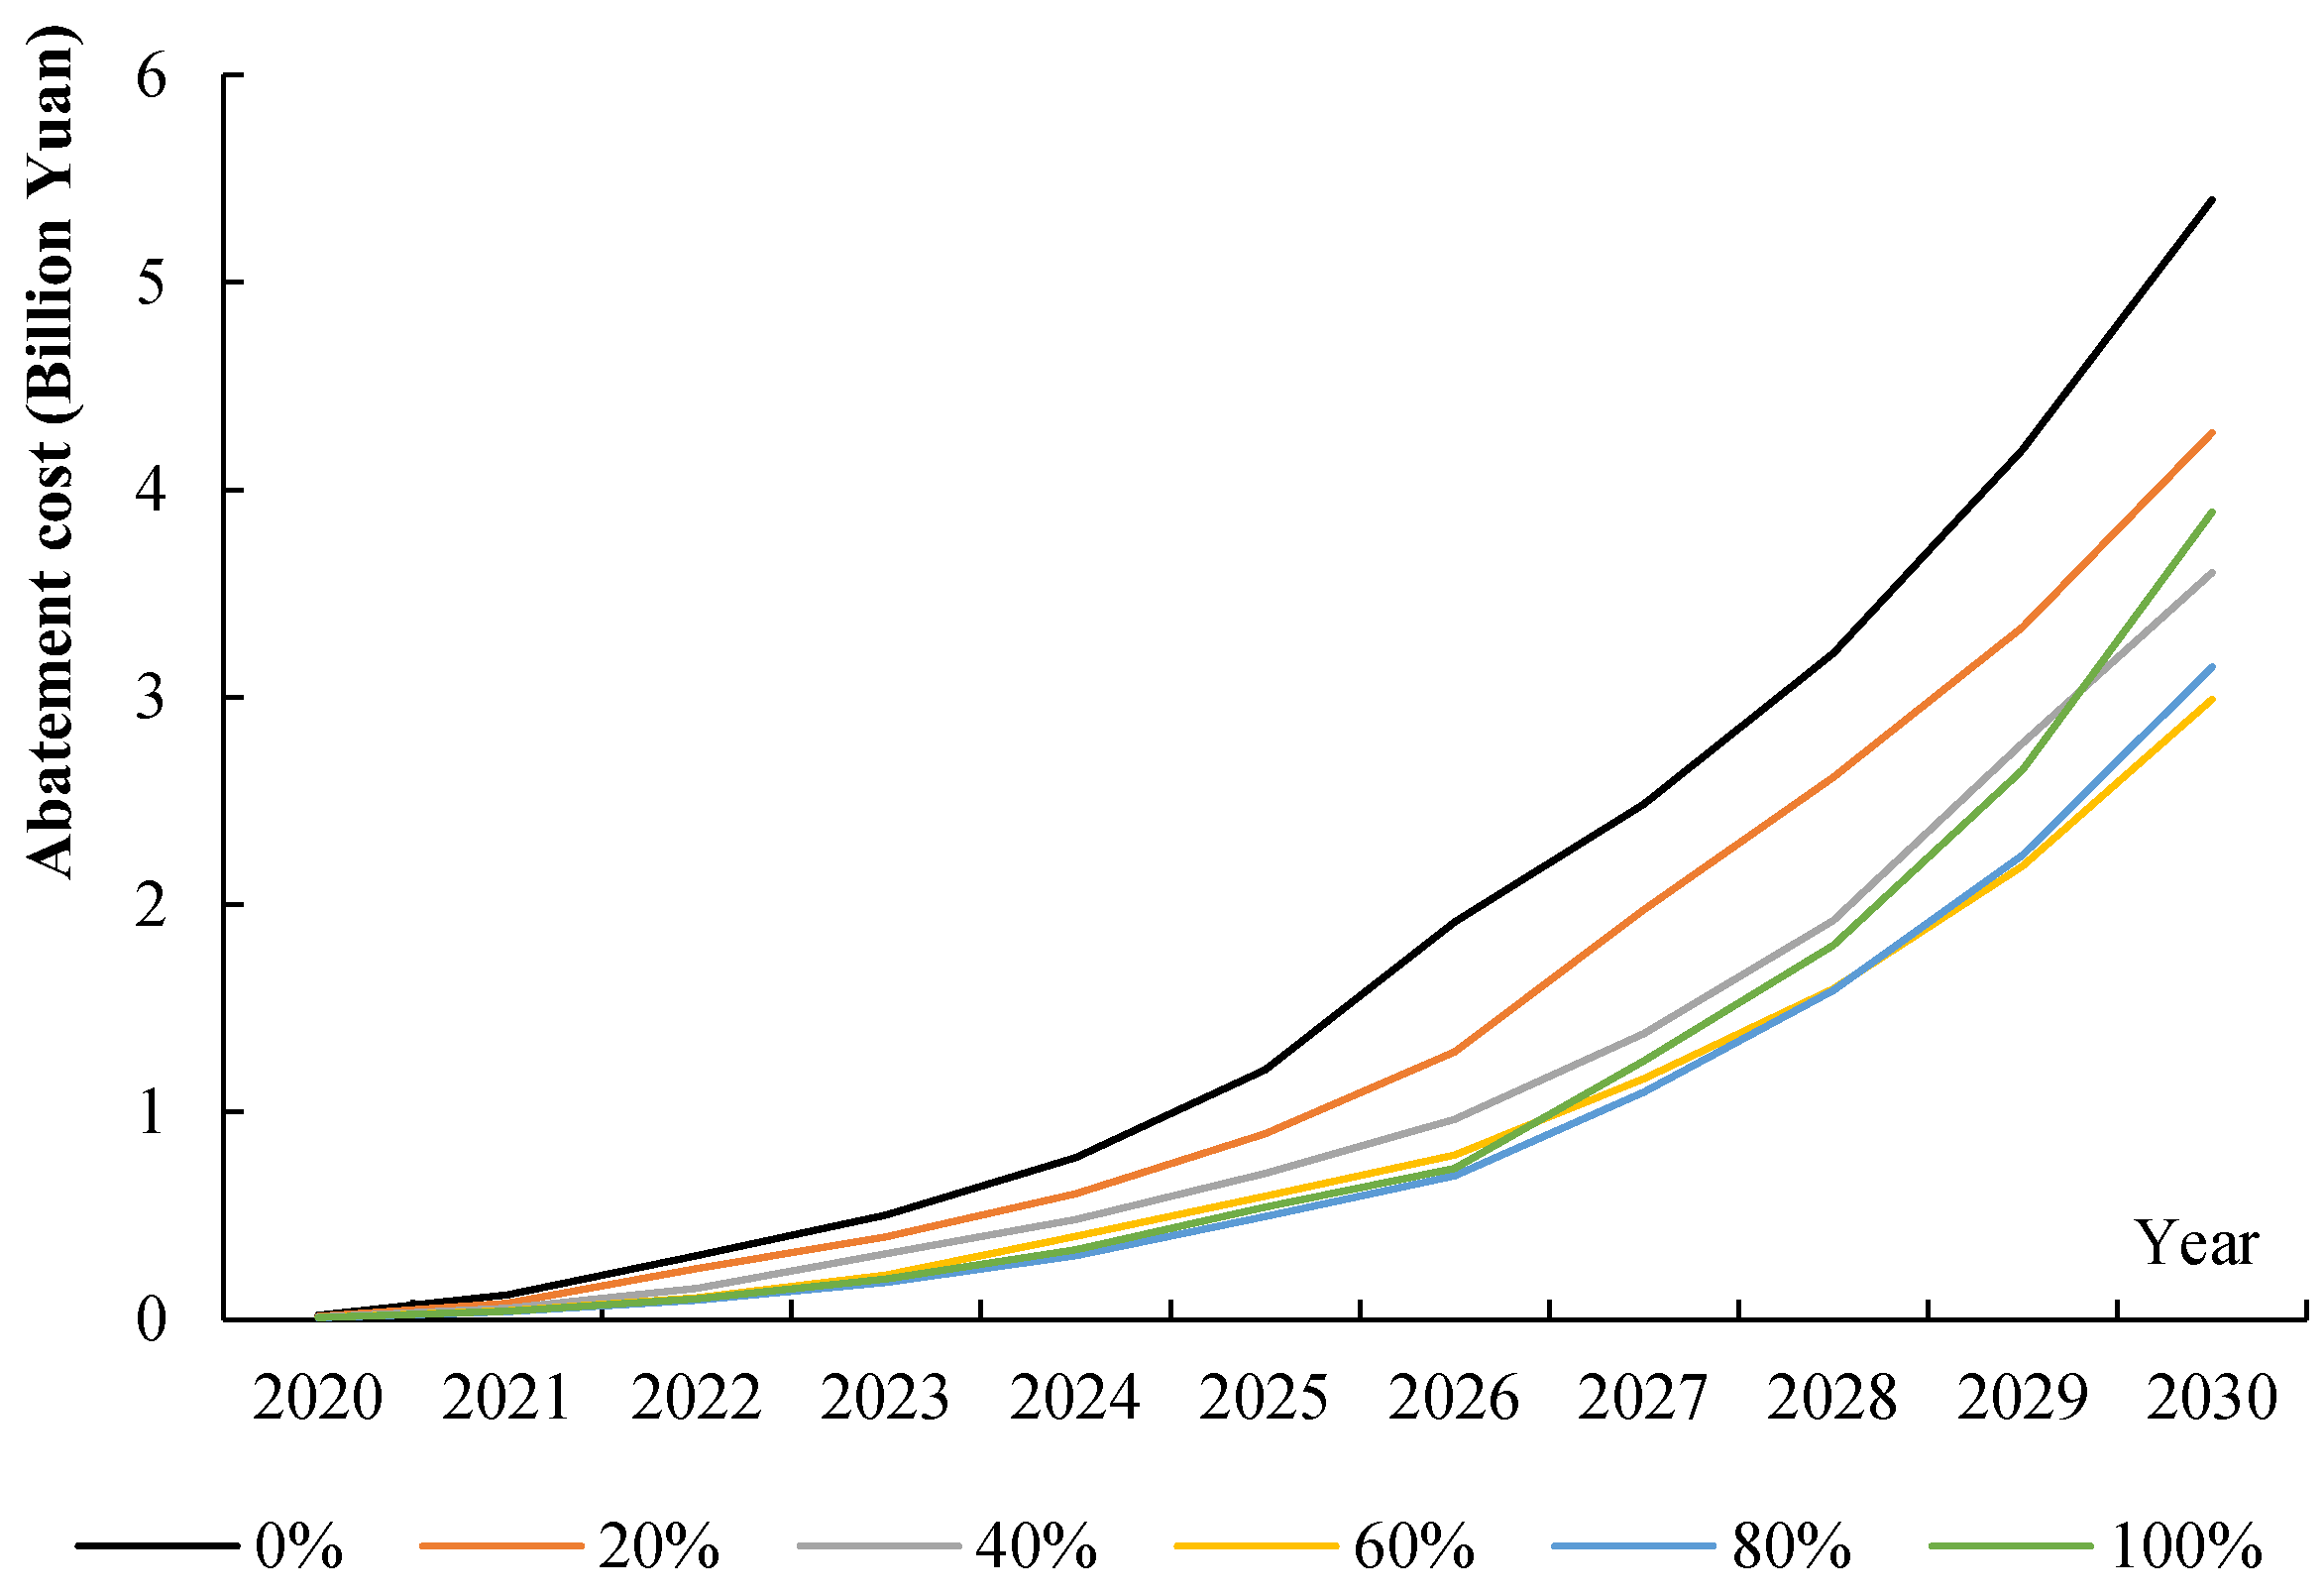
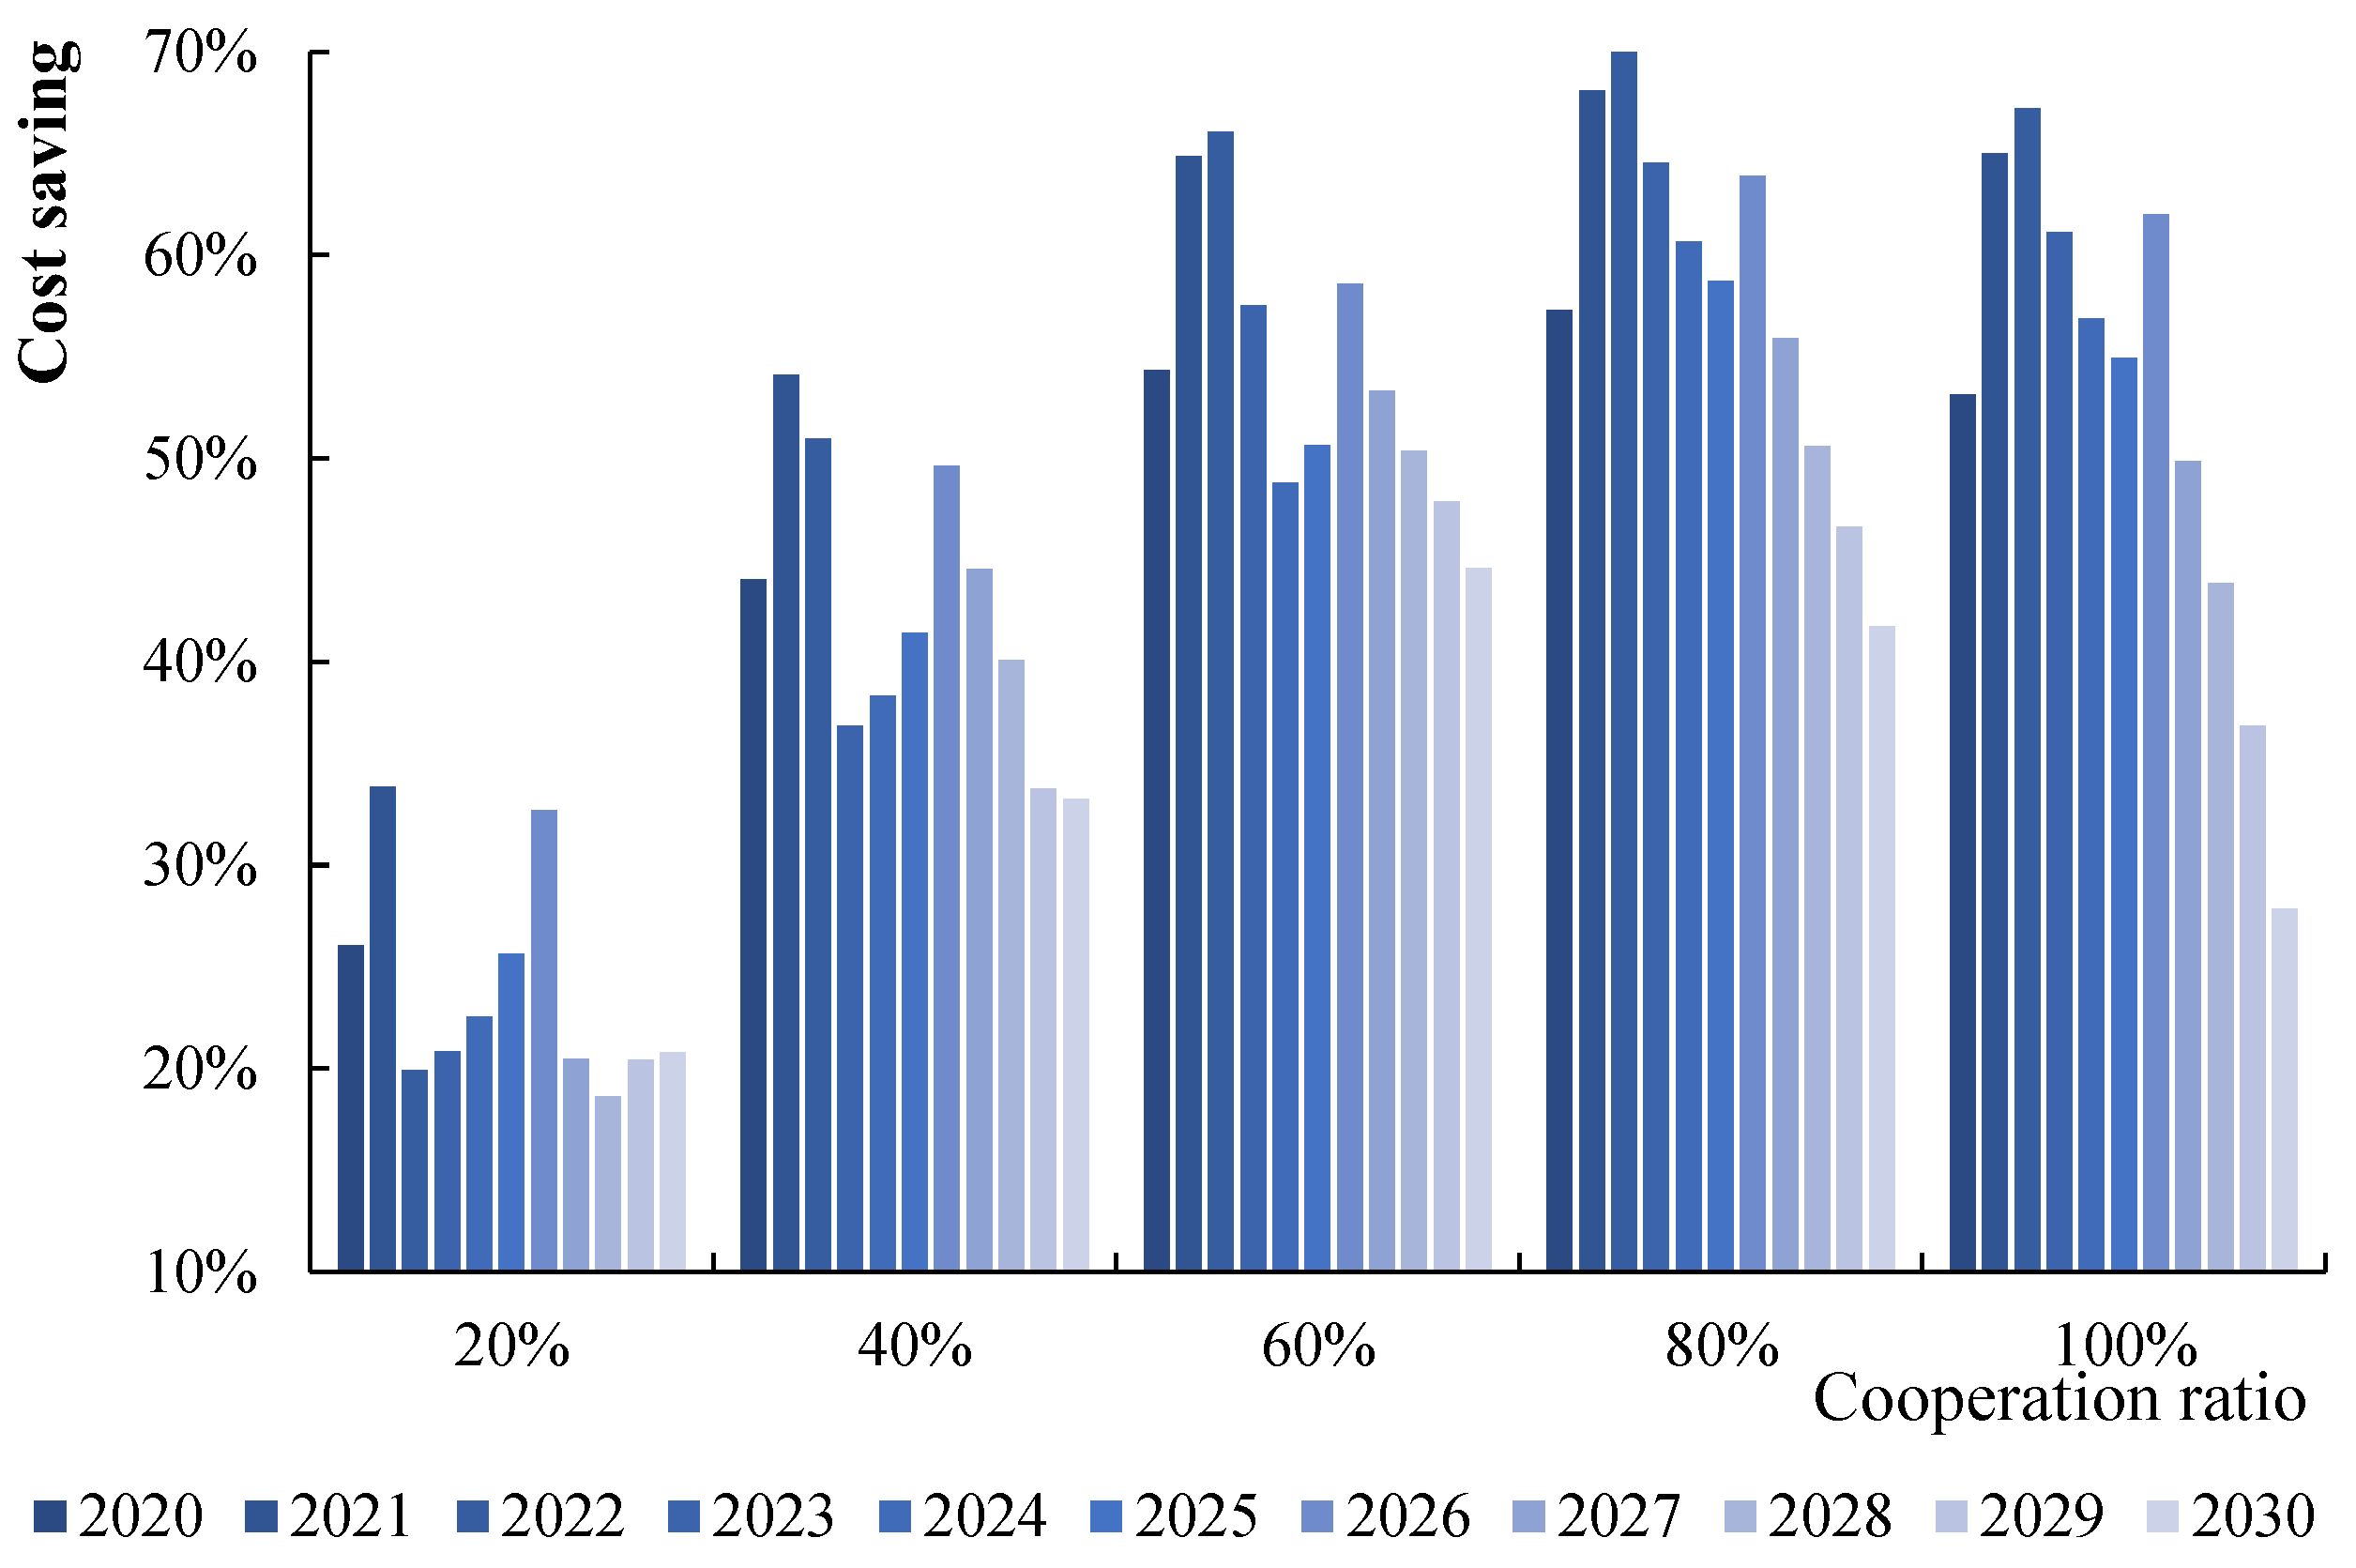
As the total CER tasks increase every year, the national total abatement cost shows a significant upward trend (Figure 8). Even under different proportions of cooperation, the total abatement cost in 2030 will increase by 200–400 times compared to 2020. In addition, compared with non-cooperation, all proportions of inter-provincial CER cooperation can effectively reduce the national total abatement cost. Figure 9 shows that when the implementers undertake 20% of the payers’ CER tasks (i.e., the cooperation proportion is 20%), the national total abatement cost can be saved by 20–30% compared with non-cooperation; when the cooperation proportion is 80%, the national total abatement cost can be saved by about 60%.
However, this does not indicate that a higher cooperation proportion always yields greater total abatement cost savings. When the cooperation proportion is 100% (i.e., the payers outsource all the CER tasks to the implementers), the national total abatement cost is instead greater than the abatement cost corresponding to a cooperation proportion of 80%, and, in some years, greater than that corresponding to a cooperation proportion of 60%. The main reason for this phenomenon is the marginal increasing nature of abatement costs. When an implementer province undertakes more than a certain amount of cooperative CER tasks, its marginal emission reduction cost will be higher than that of the payer province. In this case, inter-provincial cooperation on CER is uneconomical, and the partnership should be adjusted or terminated.
By comparing the national total abatement costs corresponding to the six cooperation proportions (Table 5), it can be found that the national total abatement cost will be the lowest if the implementers undertake about 80% of the payers’ CER tasks during 2020–2028. In other words, from the perspective of saving the national total abatement cost, the optimal cooperation proportion is about 80%. From 2029 to 2030, the optimal cooperation proportion will decrease to about 60%. This indicates that inter-provincial CER cooperation effectively narrows the gap in marginal abatement costs among provinces. As the marginal abatement costs of provinces gradually converge, the optimal cooperation proportion gradually decreases.
Therefore, the saving effect of inter-provincial CER cooperation on the total abatement cost exhibits diminishing marginal returns. It can be inferred that when the cooperation is carried out to a certain extent, the optimal proportion will drop to 0, the participants will no longer be able to profit from the CER cooperation, and the partnerships should be terminated.

4.4. Other Influences of CER Cooperation

4.4.1. The Influence on Provincial Carbon Intensity (CI) Control

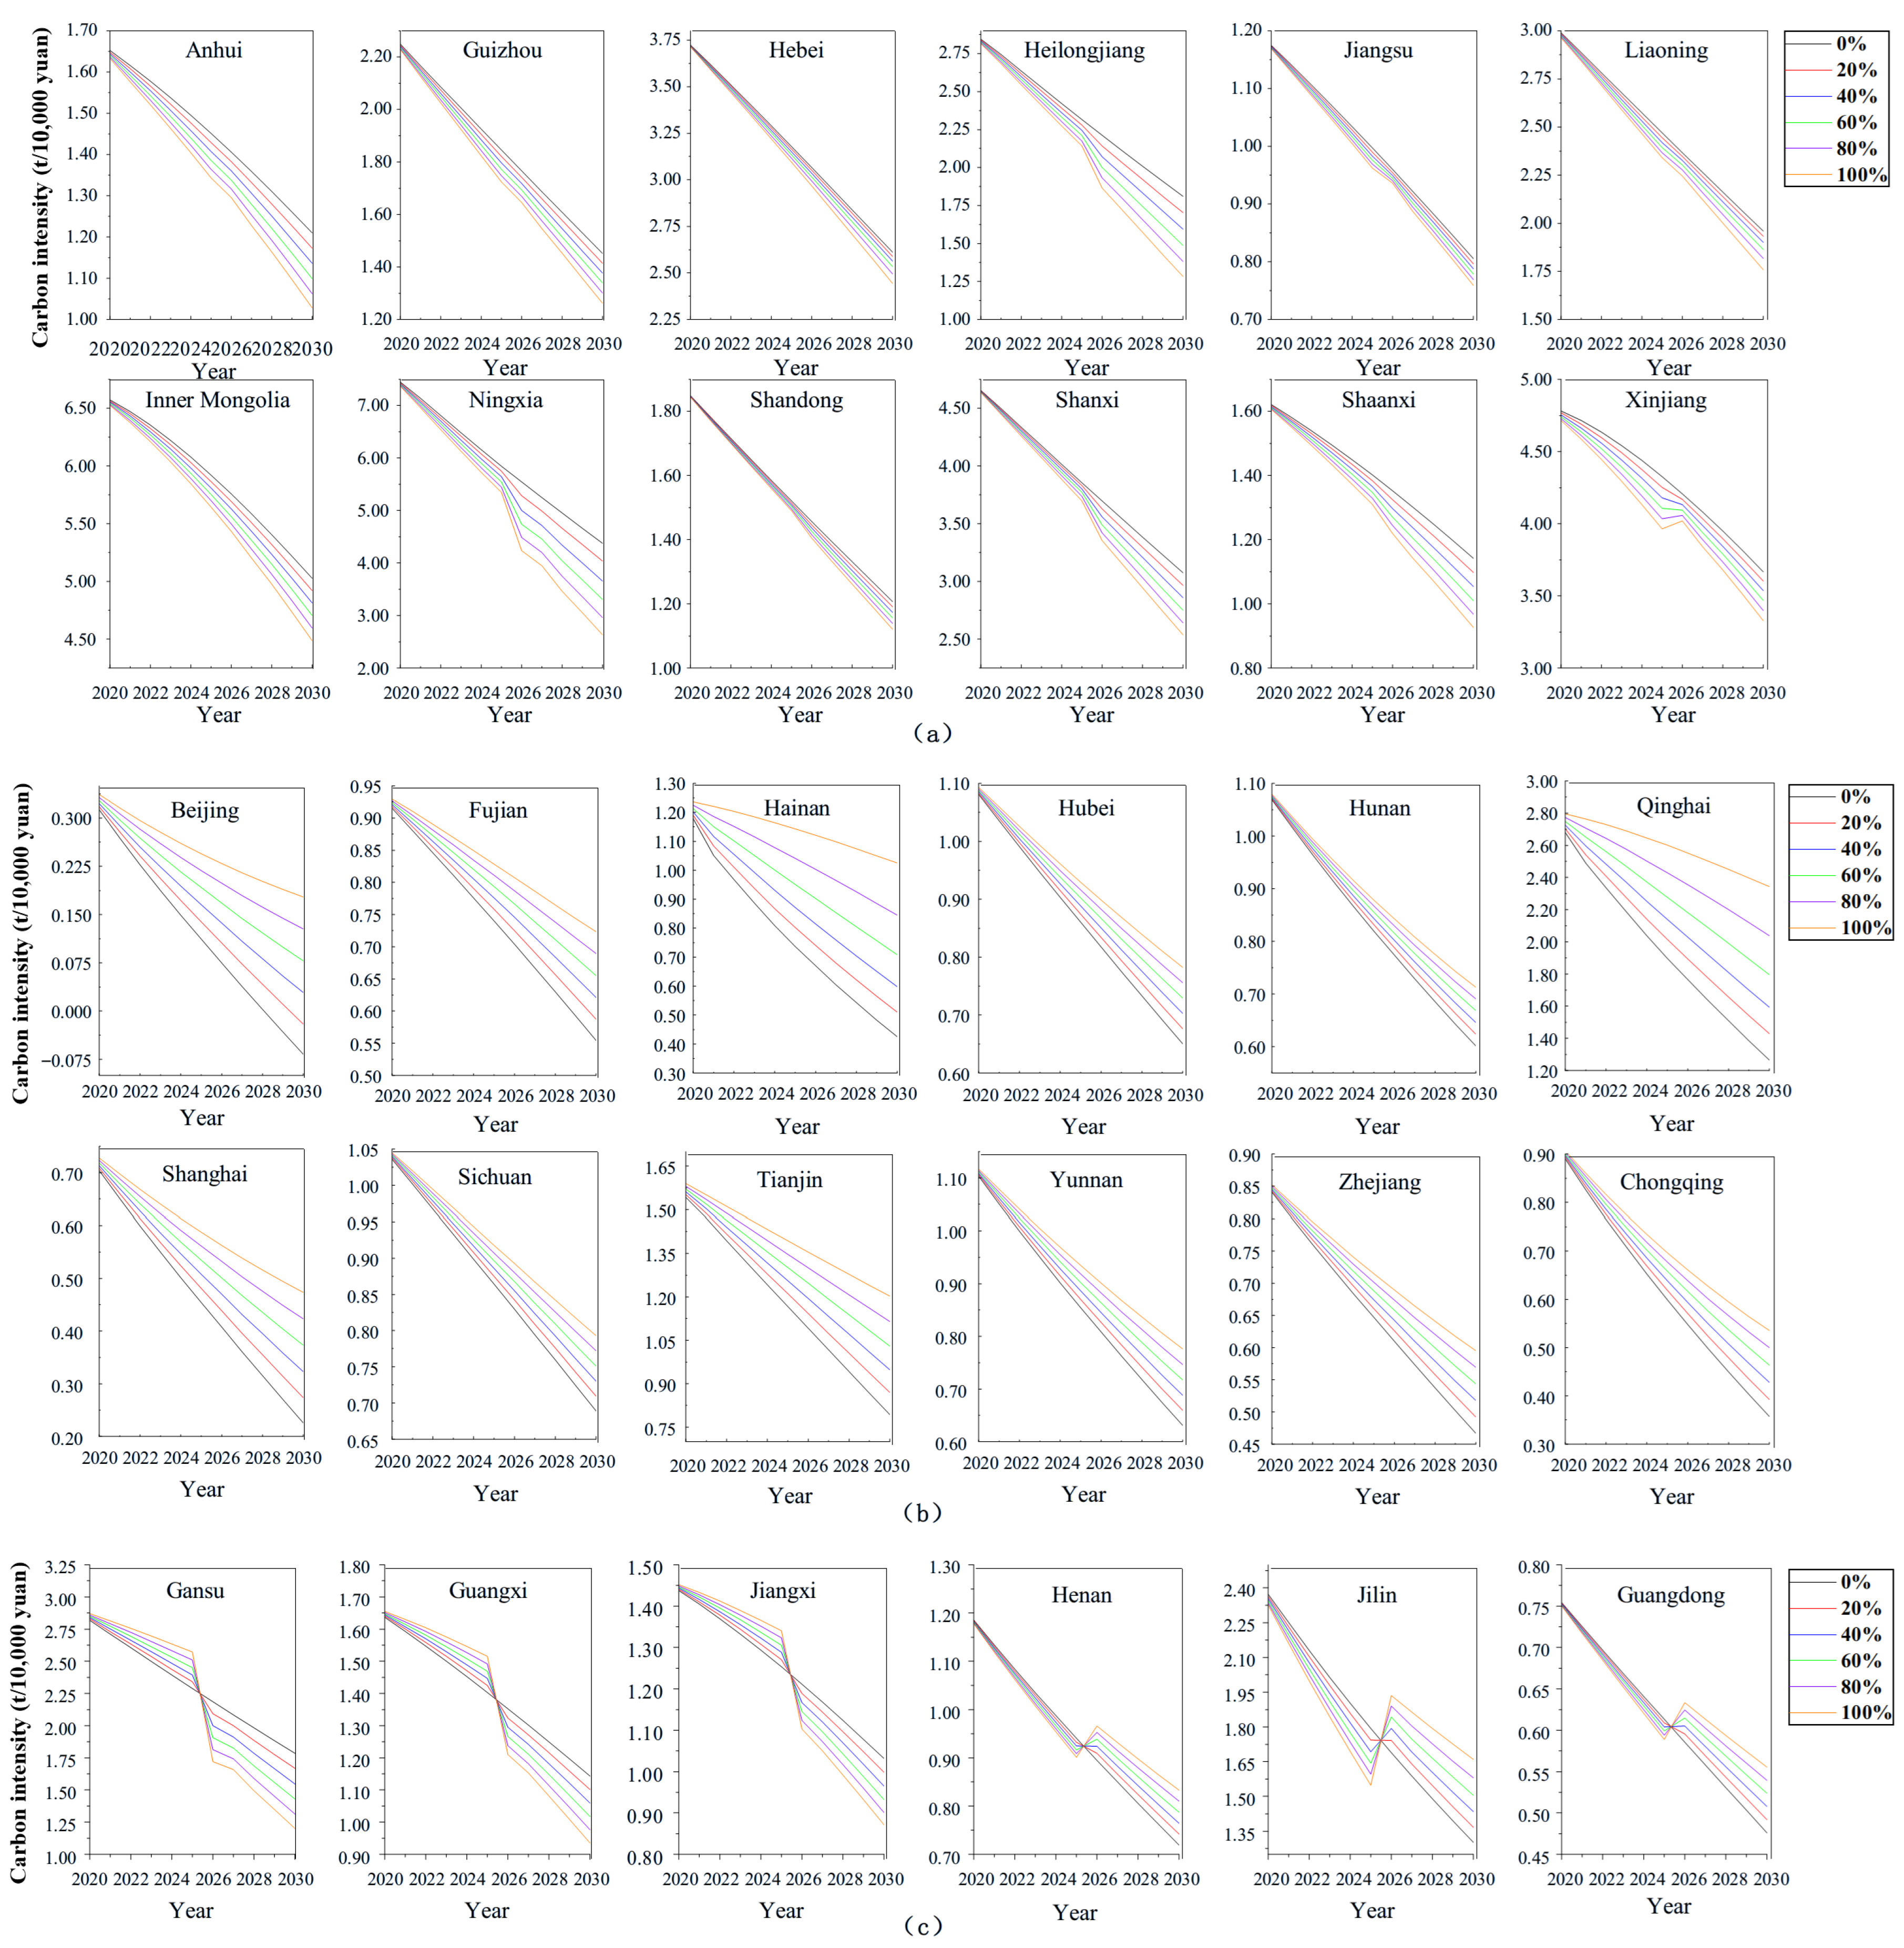
Figure 10 shows that in order to achieve the national carbon intensity target by 2030, all the provinces have a significant reduction in carbon intensity between 2020 and 2030, even without cooperation (black lines in each figure). Inter-provincial CER cooperation effectively regulates the speed and amplitude of carbon intensity reduction in provinces with different cooperation roles.
The provinces that have been implemented until 2030 (Figure 10a) will have lower carbon emissions intensity than they would have if they did not cooperate, because they undertake some of the payers’ CER tasks. In addition, with the increase in cooperation proportion, implementers’ carbon emission intensity will decrease more obviously. While the provinces that have been the payers until 2030 (Figure 10b) realize inter-provincial cooperation by outsourcing part of their CER tasks. Since this part of the CER tasks outsourced does not have to be performed by themselves, their actual carbon emissions are higher than when they do not cooperate. As the proportion of cooperation rises, their carbon intensity rises more obviously.
Figure 10c shows that after 2025, the roles of Jiangxi, Guangxi and Gansu in inter-provincial cooperation will change from payers to implementers, and the trend of carbon intensity under different cooperation proportions will also reverse in 2026. Specifically, the decreasing range of the three provinces’ carbon intensity will decrease due to the increasing proportion of inter-provincial CER cooperation; while after 2026, the decline in carbon intensity will reverse due to the change in roles. The decline in carbon intensity in Guangdong, Jilin and Henan provinces is completely opposite, as their roles in inter-provincial cooperation will change from implementers to payers after 2025.
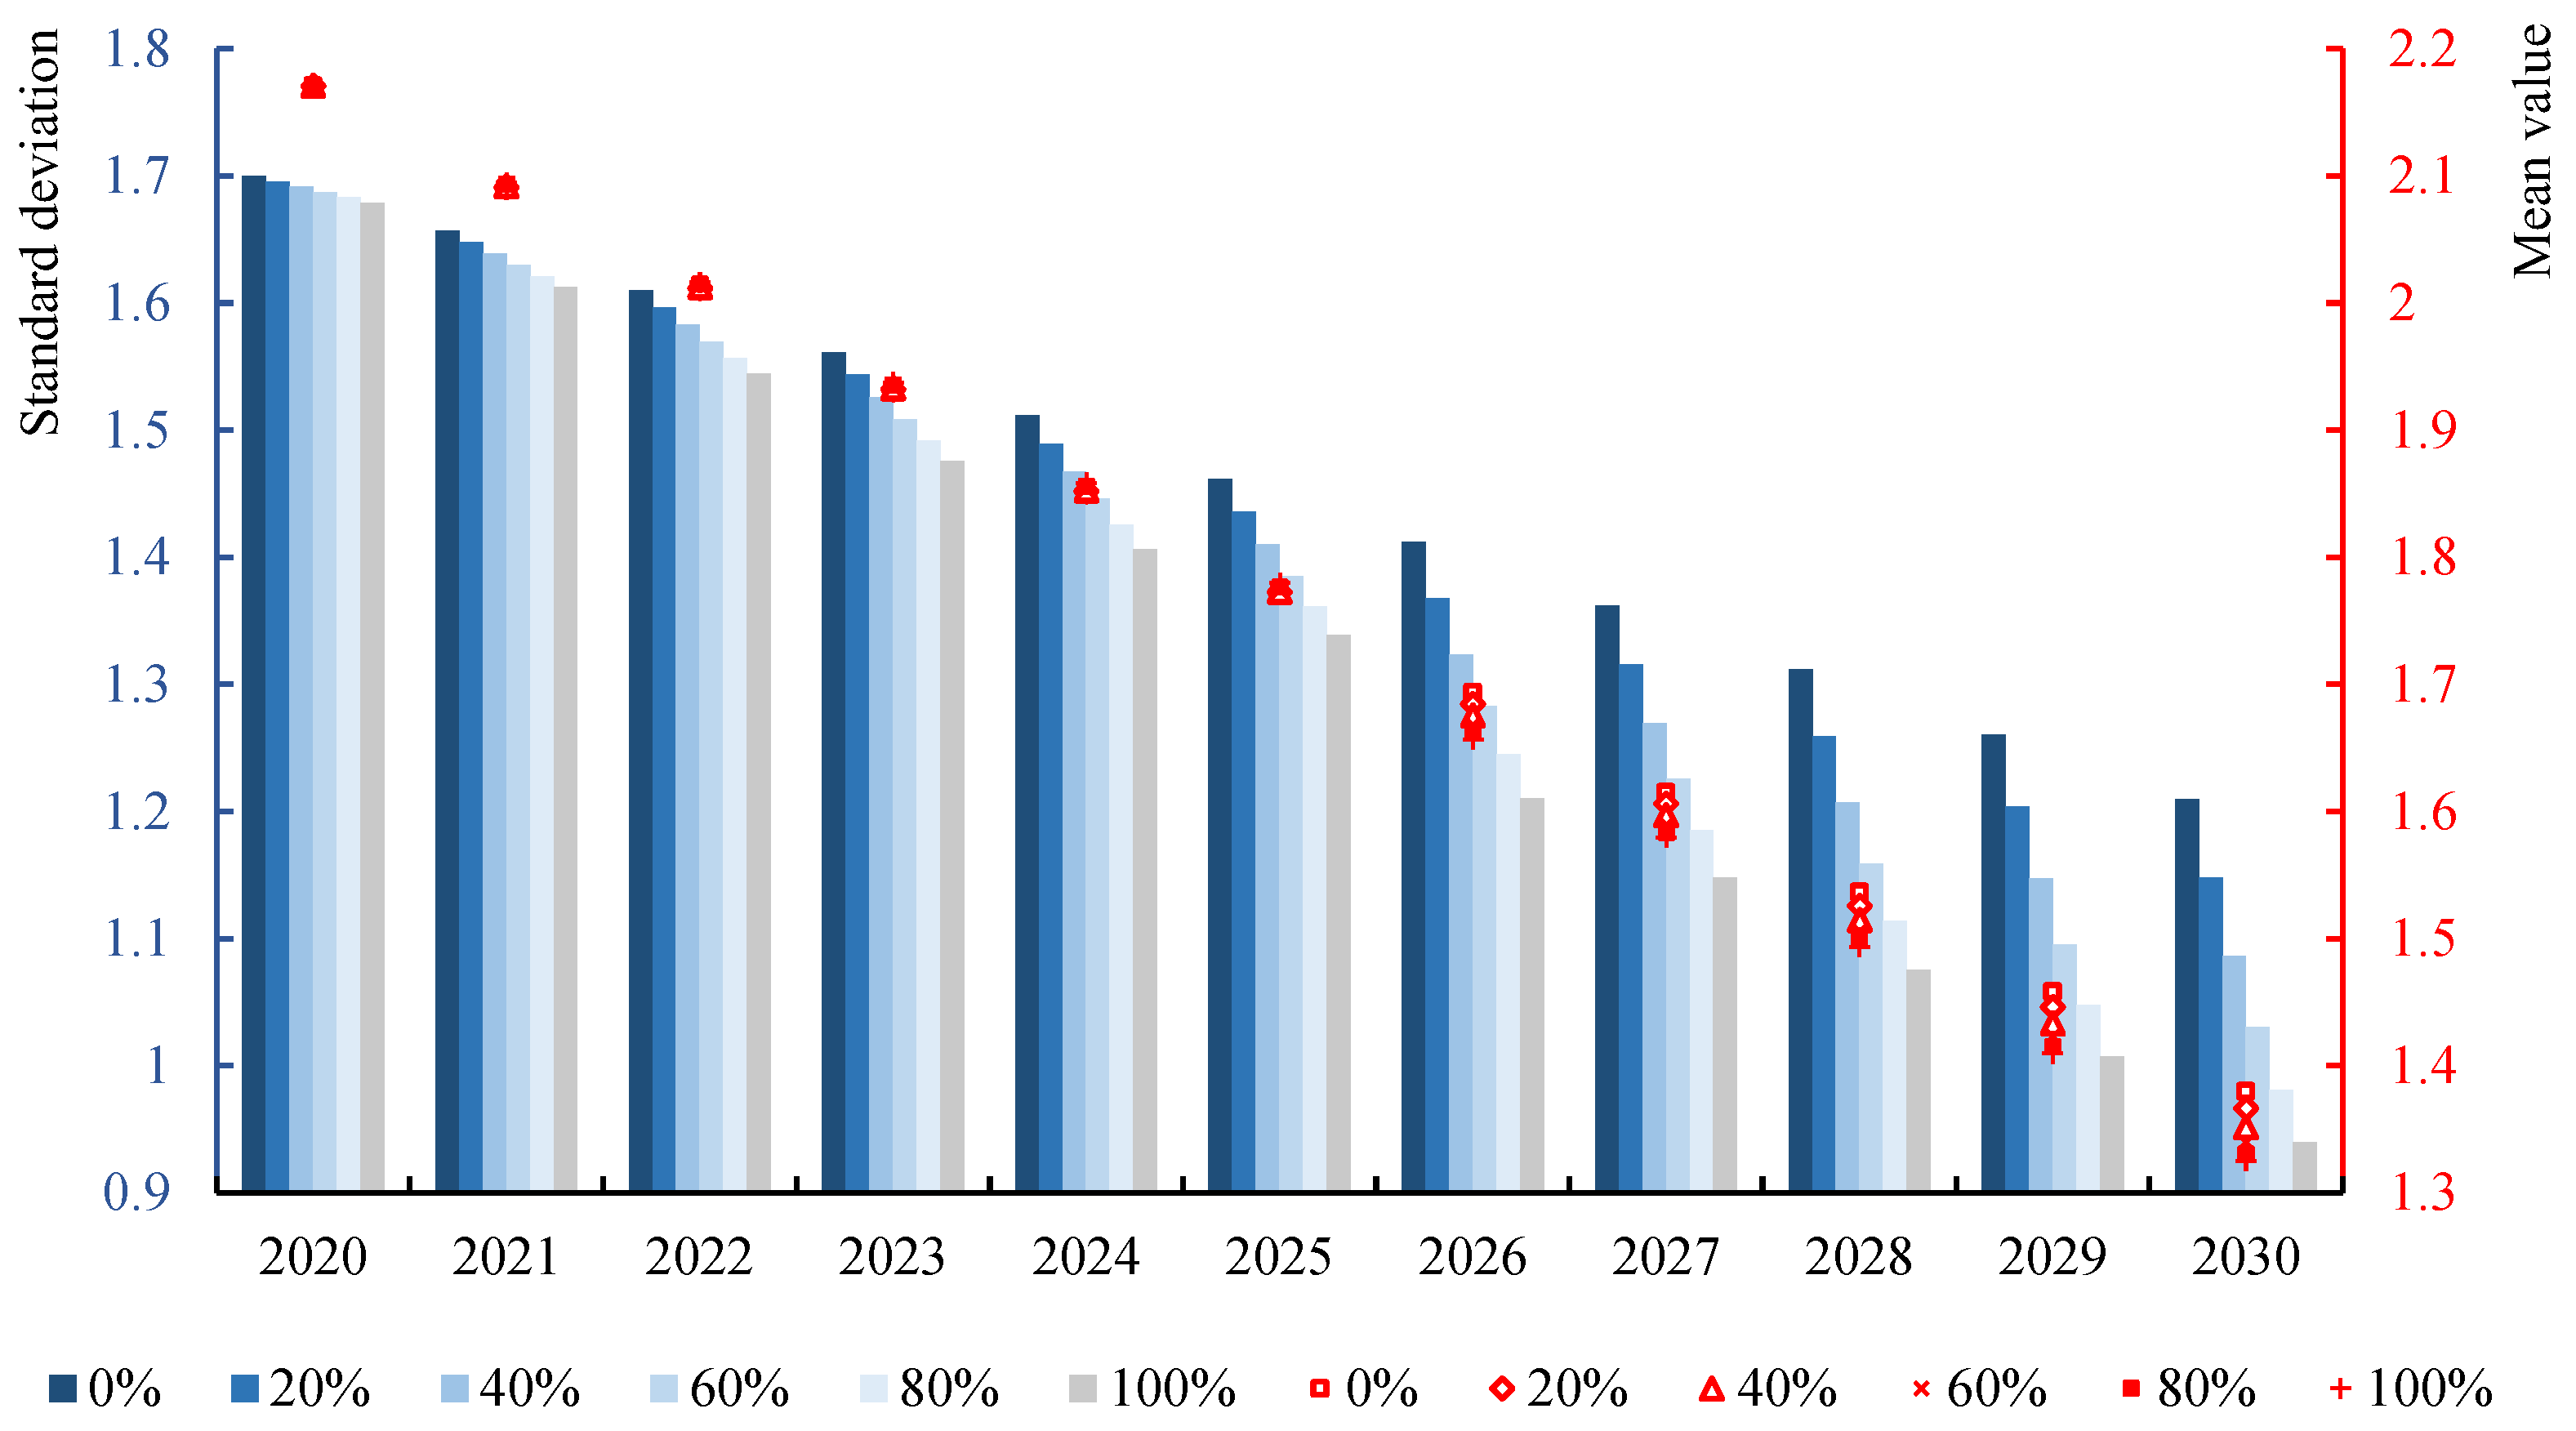
To explore the central tendency and dispersion degree of provincial carbon intensity (CI), we calculate the mean value and standard deviation of CI in 30 provinces under different cooperation proportions. The bar charts and scatter charts (Figure 11) are drawn to reflect the changes from 2020 to 2030. Even if there is no inter-provincial cooperation (the cooperation proportion is 0%), the mean value of CI decreases year by year, and the degree of dispersion becomes smaller year by year. This is because, within the constraints of the 2030 carbon peak and CI targets, all the provinces need to strictly control the growth of total carbon emissions. As the CI of the provinces with high carbon emissions is controlled, the dispersion degree of carbon emissions intensity in the 30 provinces can be gradually reduced.
In addition, inter-provincial CER cooperation can further reduce the mean and standard deviation of provincial CI. This is because most of the payer provinces have low CI, and inter-provincial cooperation will increase their CI to some extent. On the contrary, most of the implementing provinces have high CI, and inter-provincial cooperation will effectively reduce their CI. Thus, the inter-provincial cooperation can significantly reduce inter-provincial CI differences and effectively avoid the situation of two levels of differentiation. In addition, the higher the proportion of cooperation, the more significant the effect of improving the balance of CI reduction among the 30 provinces.
To sum up, inter-provincial CER cooperation can effectively adjust the speed and amplitude of provincial CI reduction, narrow the gap between provinces, and thus promote the balance of CI reduction.

4.4.2. The Influence on Provincial Carbon Emissions and Peaking Time

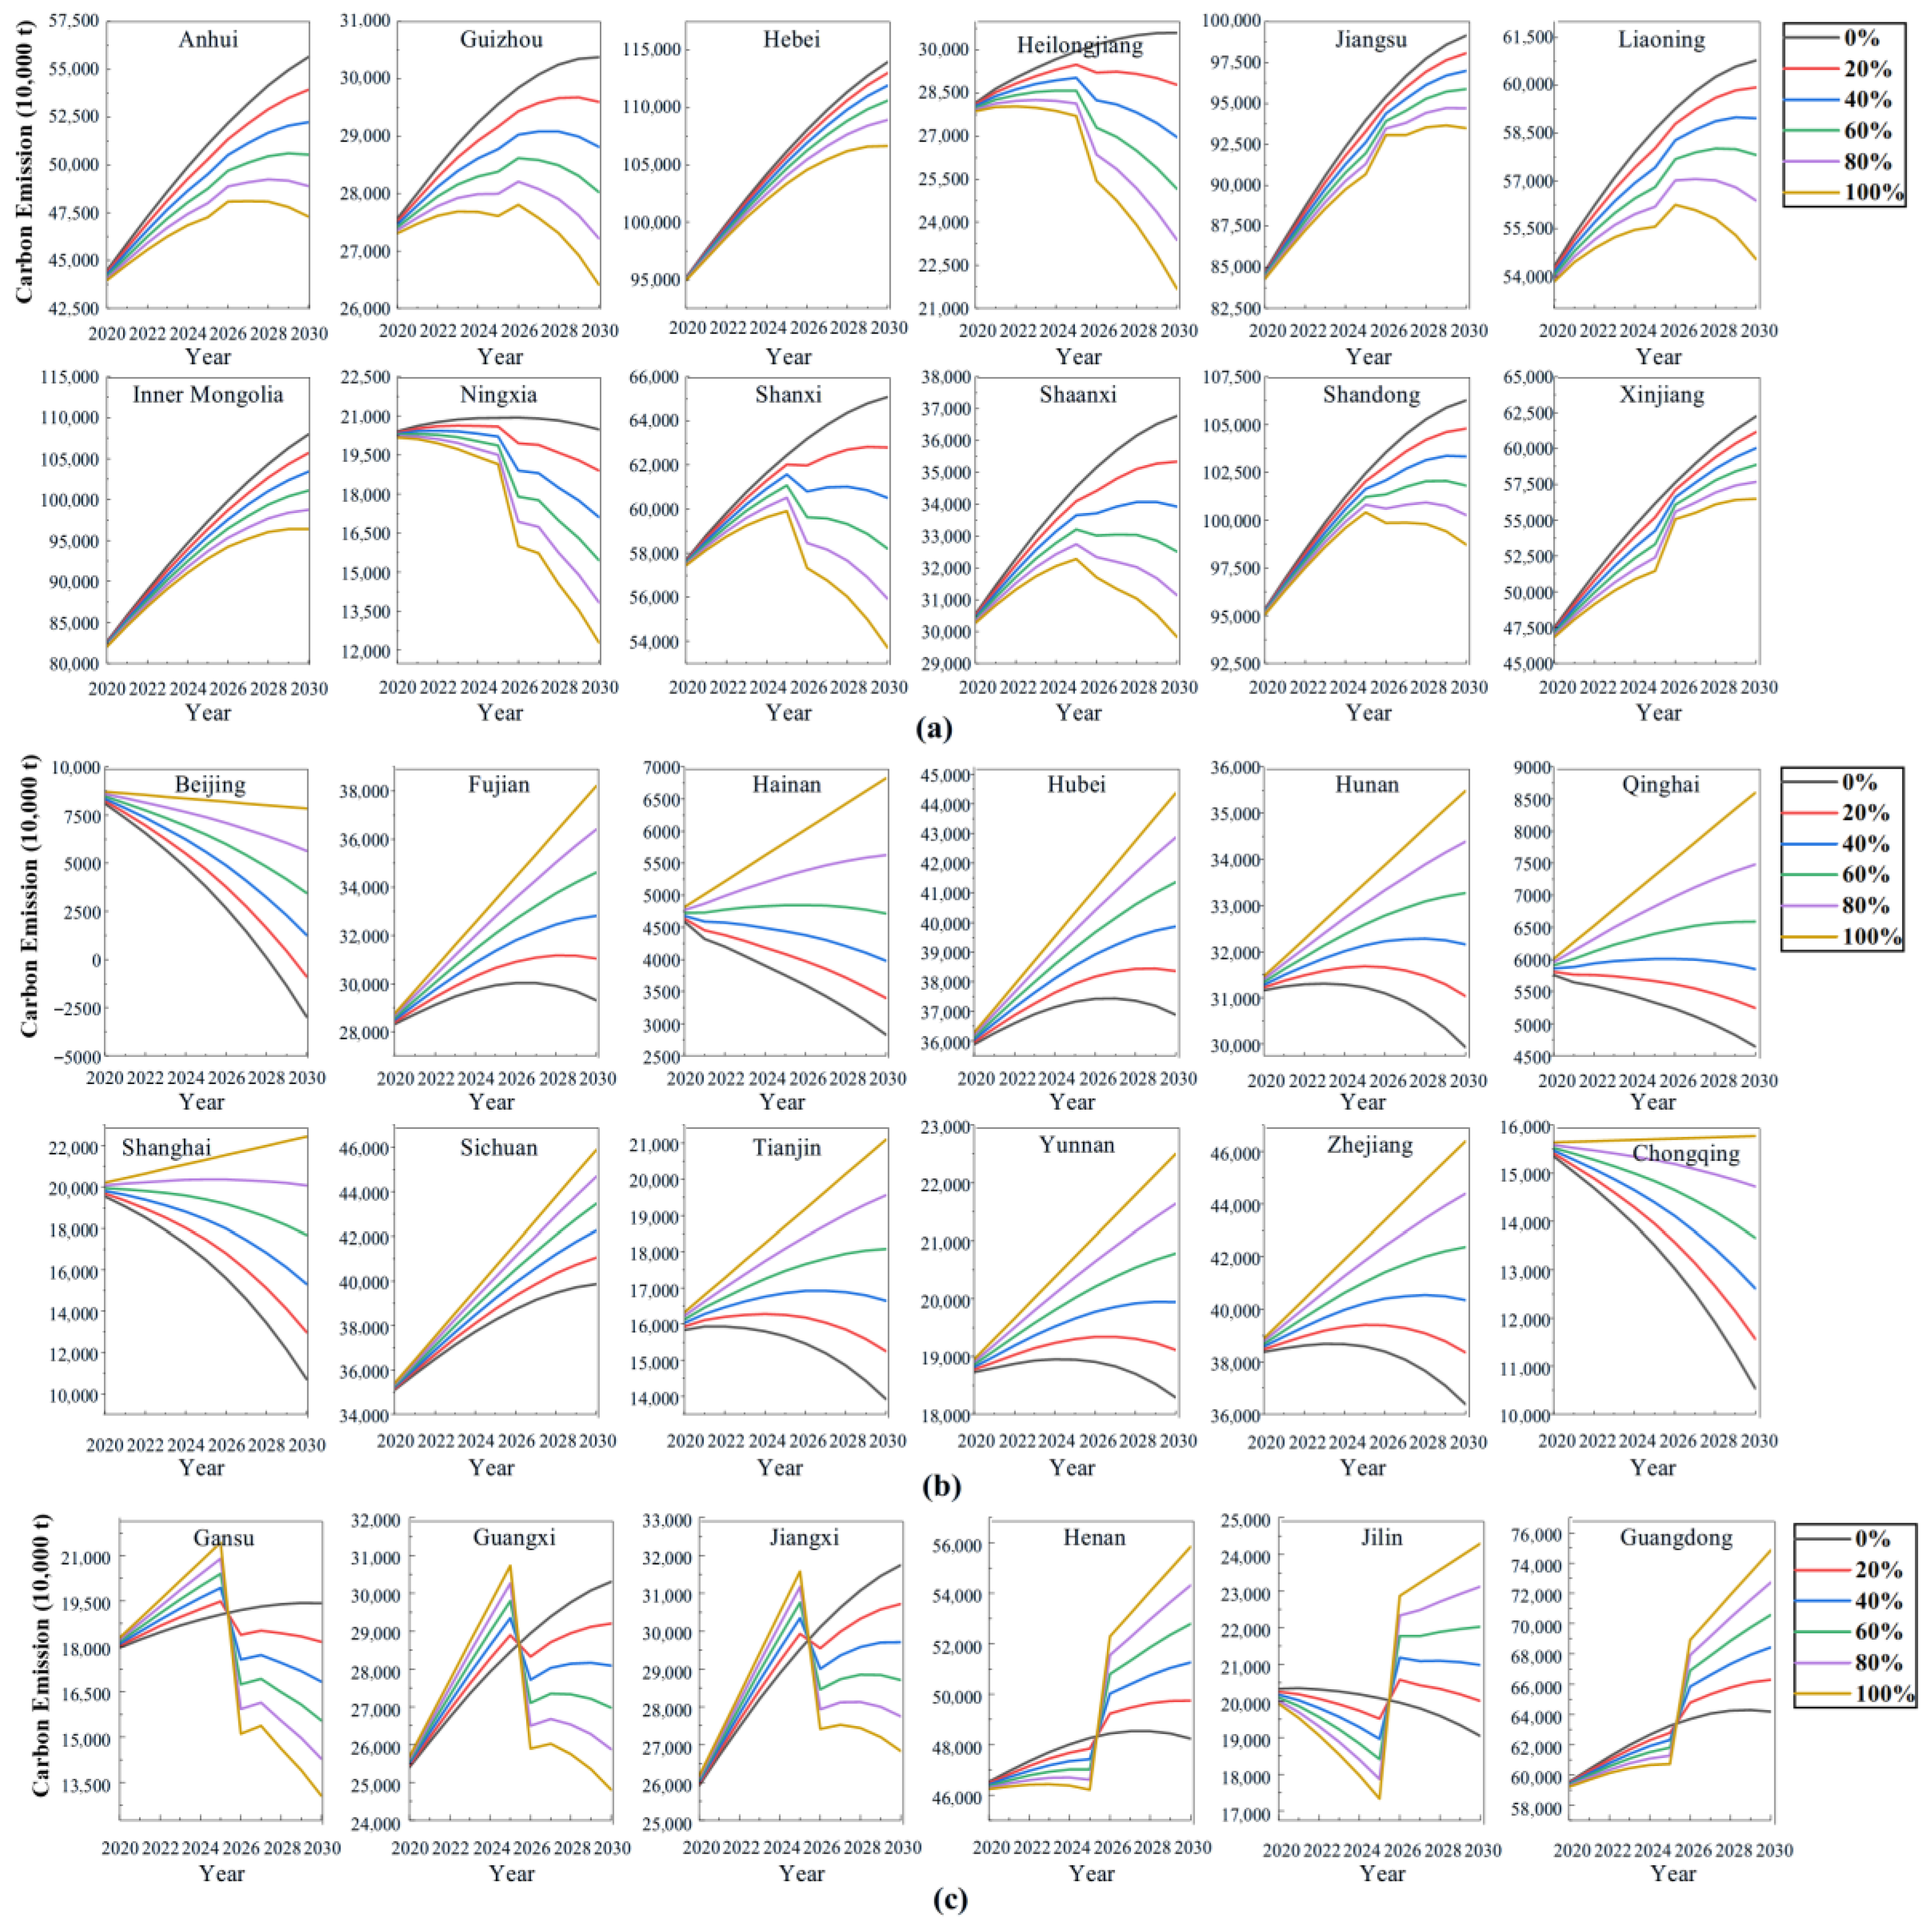
The total carbon emissions of some implementer provinces will fluctuate significantly or even reverse in 2025 (Figure 12a). As some provinces change their roles in the cooperation after 2025 (Figure 12c), there will be a partnership rematch. The rematch can cause changes in implementer provinces’ cooperative CER tasks and their actual carbon emissions in 2026. The rematch will only affect the payer provinces’ contract price and total cooperation cost, but will not affect the trend of their total carbon emissions (Figure 12b).
Figure 12 shows that inter-provincial CER cooperation can adjust the actual carbon emissions of each province by influencing their total CER value. Specifically, inter-provincial cooperation will lead to the reduction in implementer provinces’ total carbon emissions, and the greater the proportion of cooperation, the more obvious the reduction. On the contrary, the cooperation will lead to an increase in the payer provinces’ total emissions, and the greater the cooperation proportion, the more obvious the increase.
Due to the impact on the actual carbon emissions, inter-provincial cooperation has a significant intervention effect on the carbon peaking rhythm of the provinces, and the impact becomes more obvious with the increase in the cooperation proportion. Without cooperation, only about 1/5 of the implementer provinces can reach the carbon peak by 2030. After participating in the cooperation, most implementer provinces can reach the carbon peak in advance, and the higher the cooperation proportion, the lower the peak value. As the cooperation proportion increases, the payer provinces’ carbon emissions will continue to rise, and some provinces will fail to reach the target of peaking carbon emissions before 2030. This indicates that an unscientific cooperation proportion will have a negative effect on the realization of the carbon emission gradient peak in provinces. Therefore, we need to combine the changes in the total carbon emissions of implementers and payers, and select a relatively appropriate cooperation proportion, to ensure that most provinces peak their carbon emissions by 2030.
After comparing the provincial total carbon emissions corresponding to no cooperation and the five cooperation proportions, we find that the number of peaking provinces corresponding to the cooperation proportions of 40% and 80% is greater than that under no cooperation. It indicates that inter-provincial CER cooperation can, to some extent, promote the realization of the national total carbon emission peak goal before 2030. If the cooperation proportion is 40%, a maximum of 17 provinces could reach the carbon peak target by 2030. With the increase in cooperation proportion, the peak value of implementer provinces will decrease continuously, while that of payer provinces will increase significantly. The gap and imbalance between the two types of provinces will expand, and it will be difficult to ensure that most provinces can reach the carbon peak target before 2030.
In conclusion, considering the provincial gradient peak and the number of provinces reaching the carbon peak target, the best inter-provincial CER cooperation proportion is 40%.

5. Discussion

5.1. Validation of Cost-Saving Effects (H1)

The simulation results provide strong evidence for Hypothesis 1. Cooperation significantly reduces abatement costs. As shown in Figure 9, the cost-saving ratio under the 80% cooperation scenario reaches a peak of nearly 70% and maintains an average above 60%. This empirical result validates the theoretical benefits of collaborative mechanisms discussed by Nordhaus [11,51], confirming that eliminating regional barriers allows abatement to occur where it is most cost-effective. By unifying marginal abatement costs across regions, the cost-based cooperation mechanism effectively approaches the theoretical optimum for climate policy.
Specifically, our simulation shows that cooperation can alleviate the financial burden on less developed provinces while helping developed provinces achieve their targets efficiently. This aligns with the findings of Chang et al. [22], who estimated the economic welfare of interregional emissions trading in China and concluded that such mechanisms improve both equity and efficiency.

5.2. Validation of the Optimal Proportion (H2)

Hypothesis 2 is also supported. Our results show a divergence between the purely economic optimum (80%) and the feasibility-constrained optimum (40%). While 80% cooperation yields the lowest cost (Figure 8), Figure 9 shows diminishing marginal returns compared to the 40–60%. Regarding the optimal cooperation intensity, our study suggests a dynamic range rather than full unrestricted trading. This echoes the research by Dong et al. [12], who argued that carbon allowance allocation must balance equity and efficiency, and that moderate cooperation may be more feasible than radical integration in the early stages.
More importantly, excessive outsourcing delays the peak timeline for receiving provinces. Therefore, the 40% proportion balances these goals. From a methodological perspective, our use of the Marginal Abatement Cost (MAC) curve to simulate trading behaviors is supported by Ellerman and Decaux [47], and our results regarding the “diminishing marginal utility” of cooperation are consistent with the observations of Zhu et al. [18] in their multi-objective decision analysis.

6. Conclusions and Policy Implications

6.1. Main Conclusions

Each province faces unique difficulties in meeting carbon emission reduction targets, but these difficulties can be translated into costs. As cooperation offers a pathway for inter-provincial complementarity, this paper explores a cost-based cooperation mechanism for inter-provincial carbon emission reduction. The main conclusions are as follows:
(1)
Impact on Capacity and Responsibility: CER cooperation significantly impacts provincial emission reduction capacity, responsibility, and potential in the current year, subsequently affecting the allocation of CER tasks in the following year. The cost-based cooperation mechanism can, to some extent, adjust for differences in CER tasks and carbon intensity.
(2)
Optimal Proportion for Cost Minimization: From the perspective of minimizing national total abatement costs, the optimal provincial CER cooperation proportion is 80% from 2020 to 2028 and 60% from 2029 to 2030. However, the cost-saving effect exhibits diminishing marginal returns. The preferential cooperative CER that implementer provinces can afford is limited; once this limit is exceeded, cooperation no longer yields cost savings for either party and should be terminated.
(3)
Optimal Proportion for Peaking Targets: In terms of driving the majority of provinces to achieve their carbon peak targets before 2030, the optimal proportion of CER cooperation is 40%, allowing a total of 17 provinces to meet the target. While inter-provincial collaboration effectively accelerates implementation for implementer provinces, it may delay peaking for payer provinces. A relatively modest trade-off (40%) is therefore necessary for the collective benefit of most provinces.

6.2. Theoretical Contributions

This study contributes to the literature on regional collaborative governance and environmental federalism. The specific contributions are as follows:
(1)
Providing empirical evidence for market-oriented mechanisms: By quantifying the cost-saving potential of inter-provincial cooperation, this study provides empirical evidence that market-oriented allocation mechanisms can effectively supplement administrative commands.
(2)
Offering a theoretical framework for balancing objectives: It reveals the dynamic nature of the optimal cooperation proportion, offering a theoretical framework for balancing long-term cost minimization with short-term peaking constraints.

6.3. Policy Implications

Based on the empirical results, this study proposes three key policy recommendations to optimize China’s carbon emission reduction strategies:
(1)
Establish a National Mechanism for Inter-provincial Cooperation: The results demonstrate that inter-provincial cooperation significantly reduces the national total abatement cost and narrows regional disparities in abatement capacities. Therefore, the central government should establish a formalized platform to facilitate cross-provincial carbon trading and technical cooperation. Policies should prioritize matching high-cost provinces (Payers) with low-cost provinces (Implementers) to maximize economic efficiency.
(2)
Implement Differentiated Cooperation Thresholds: A “one-size-fits-all” approach is inefficient. Policymakers should adopt differentiated cooperation proportions based on each province’s marginal abatement cost curve and economic development stage. For example, provinces with high abatement potential should be encouraged to take on more external tasks (up to a 40–60% cooperation ratio), while provinces struggling with their own peaking targets should maintain lower cooperation levels to ensure local compliance. Dynamic adjustment mechanisms should be introduced to update these ratios every 3–5 years.
(3)
Clarify Roles and Responsibilities for Participants: Provincial governments must align their strategies with their specific roles in the cooperation network. Implementer provinces should leverage financial transfers from cooperation to upgrade their industrial structures and invest in low-carbon technologies, avoiding the “low-carbon trap” where they only sell quotas without actual decarbonization. Payer provinces, while outsourcing part of their abatement burden, must not relax their local efforts; they should focus on high-tech innovation and gradually decouple economic growth from carbon emissions to achieve an early peak.

7. Limitations and Future Work

Despite the theoretical and practical contributions, this study has several limitations that point to directions for future research:
(1)
Simplified Cooperation Models: This paper primarily explores “one-to-one” partnerships between provinces. In reality, complex “one-to-many” or “many-to-many” cooperation networks may emerge, involving multilateral negotiations. Future studies could employ complex network theory or cooperative game theory to simulate these multi-party interactions and optimize the stability of cooperation coalitions.
(2)
Data Uncertainty and Projections: The simulation relies on projections of GDP, population, and energy consumption from 2020 to 2030 based on historical trends and policy targets (e.g., the 14th Five-Year Plan). These projections may deviate from actual future developments due to unforeseen economic shocks or policy shifts. Future research should incorporate uncertainty analysis and robust optimization methods to test the reliability of cooperation mechanisms under various socioeconomic scenarios.
(3)
Scope of Emissions and Technology: Currently, the analysis focuses on energy-related CO2 emissions. It does not fully account for non-energy emissions (e.g., industrial processes, agriculture) or the potential impact of disruptive technologies such as Carbon Capture, Utilization, and Storage (CCUS). Incorporating a broader range of greenhouse gases and explicit technology learning curves would provide a more comprehensive assessment of abatement costs.
(4)
Micro-level Implementation: While this study operates at the provincial level, actual emission reduction actions occur at the enterprise and industry levels. Future work should extend the analysis to sector-specific cooperation (e.g., power sector trading) and investigate how provincial targets can be effectively decomposed to micro-entities to ensure the feasibility of the proposed cooperation mechanisms.

Author Contributions

X.W.: Conceptualization, Investigation, Methodology, Writing—Original draft preparation. H.Z.: Investigation, Methodology, Software. P.J.: Investigation, Writing—Original draft preparation. All authors have read and agreed to the published version of the manuscript.

Funding

This research received no external funding.

Institutional Review Board Statement

Not Applicable.

Informed Consent Statement

Not Applicable.

Data Availability Statement

The data presented in this study are openly available in [National Statistical Yearbook] [https://www.stats.gov.cn/sj/ndsj/2019/indexch.htm, accessed on 19 August 2024].

Conflicts of Interest

The authors declare that they have no known competing financial interests or personal relationships that could have appeared to influence the work reported in this paper.

Abbreviations

CERCarbon emission reduction
MACThe marginal abatement cost
GDPGross domestic product
IAVThe industry added value
CICarbon intensity
CRITICCriteria importance through intercriteria correlation
TACThe total abatement cost
TCThe total abatement cost after cooperation
CEQCarbon emission quota

References

  1. Kalirajan, K.; Zaman, K.A.U.; Anbumozhi, V. Geo-Economic Importance Index for Doubling the Efforts by 2030. In Sustainable Development Goals and Pandemic Planning; Anbumozhi, V., Kalirajan, K., Kimura, F., Eds.; Springer Nature: Singapore, 2022; pp. 479–503. [Google Scholar] [CrossRef] [Scilit]
  2. Beermann, J. Urban partnerships in low-carbon development: Opportunities and challenges of an emerging trend in global climate politics. URBE-Rev. Bras. Gestão Urbana 2014, 6, 170. [Google Scholar] [CrossRef] [Scilit]
  3. Negacz, K.; Petersson, M.; Widerberg, O.; Kok, M.; Pattberg, P. The potential of international cooperative initiatives to address key challenges of protected areas. Environ. Sci. Policy 2022, 136, 620–631. [Google Scholar] [CrossRef] [Scilit]
  4. Pan, L.; Hu, H.; Jing, X.; Chen, Y.; Li, G.; Xu, Z.; Zhuo, Y.; Wang, X. The Impacts of Regional Cooperation on Urban Land-Use Efficiency: Evidence from the Yangtze River Delta, China. Land 2022, 11, 915. [Google Scholar] [CrossRef] [Scilit]
  5. Sun, X.; Zhang, H.; Wang, X.; Qiao, Z.; Li, J. Towards Sustainable Development: A Study of Cross-Regional Collaborative Carbon Emission Reduction in China. Sustainability 2022, 14, 9624. [Google Scholar] [CrossRef] [Scilit]
  6. Homsy, G.C.; Liu, Z.; Warner, M.E. Multilevel Governance: Framing the Integration of Top-Down and Bottom-Up Policymaking. Int. J. Public Adm. 2019, 42, 572–582. [Google Scholar] [CrossRef] [Scilit]
  7. Shefer, I. Policy transfer in city-to-city cooperation: Implications for urban climate governance learning. J. Environ. Policy Plan. 2019, 21, 61–75. [Google Scholar] [CrossRef] [Scilit]
  8. Lintz, G. A Conceptual Framework for Analysing Inter-municipal Cooperation on the Environment. Reg. Stud. 2016, 50, 956–970. [Google Scholar] [CrossRef] [Scilit]
  9. Di Gregorio, M.; Fatorelli, L.; Paavola, J.; Locatelli, B.; Pramova, E.; Nurrochmat, D.R.; May, P.H.; Brockhaus, M.; Sari, I.M.; Kusumadewi, S.D. Multi-level governance and power in climate change policy networks. Glob. Environ. Change 2019, 54, 64–77. [Google Scholar] [CrossRef] [Scilit]
  10. Paroussos, L.; Mandel, A.; Fragkiadakis, K.; Fragkos, P.; Hinkel, J.; Vrontisi, Z. Climate clubs and the macro-economic benefits of international cooperation on climate policy. Nat. Clim. Change 2019, 9, 542–546. [Google Scholar] [CrossRef] [Scilit]
  11. Nordhaus, W. Climate Clubs: Overcoming Free-riding in International Climate Policy. Am. Econ. Rev. 2015, 105, 1339–1370. [Google Scholar] [CrossRef] [Scilit]
  12. Dong, F.; Long, R.; Yu, B.; Wang, Y.; Li, J.; Wang, Y.; Dai, Y.; Yang, Q.; Chen, H. How can China allocate CO2 reduction targets at the provincial level considering both equity and efficiency? Evidence from its Copenhagen Accord pledge. Resour. Conserv. Recycl. 2018, 130, 31–43. [Google Scholar] [CrossRef] [Scilit]
  13. Höhne, N.; den Elzen, M.; Escalante, D. Regional GHG reduction targets based on effort sharing: A comparison of studies. Clim. Policy 2014, 14, 122–147. [Google Scholar] [CrossRef] [Scilit]
  14. Kong, Y.; Zhao, T.; Yuan, R.; Chen, C. Allocation of carbon emission quotas in Chinese provinces based on equality and efficiency principles. J. Clean. Prod. 2019, 211, 222–232. [Google Scholar] [CrossRef] [Scilit]
  15. Sun, Z.; Liu, Y.; Yu, Y. China’s carbon emission peak pre-2030: Exploring multi-scenario optimal low-carbon behaviors for China’s regions. J. Clean. Prod. 2019, 231, 963–979. [Google Scholar] [CrossRef] [Scilit]
  16. Li, L.; Ye, F.; Li, Y.; Tan, K.H. A bi-objective programming model for carbon emission quota allocation: Evidence from the Pearl River Delta region. J. Clean. Prod. 2018, 205, 163–178. [Google Scholar] [CrossRef] [Scilit]
  17. Ma, G.; Li, X.; Zheng, J. Efficiency and equity in regional coal de-capacity allocation in China: A multiple objective programming model based on Gini coefficient and Data Envelopment Analysis. Resour. Policy 2020, 66, 101621. [Google Scholar] [CrossRef] [Scilit]
  18. Zhu, B.; Jiang, M.; He, K.; Chevallier, J.; Xie, R. Allocating CO2 allowances to emitters in China: A multi-objective decision approach. Energy Policy 2018, 121, 441–451. [Google Scholar] [CrossRef] [Scilit]
  19. Fang, K.; Zhang, Q.; Long, Y.; Yoshida, Y.; Sun, L.; Zhang, H.; Dou, Y.; Li, S. How can China achieve its Intended Nationally Determined Contributions by 2030? A multi-criteria allocation of China’s carbon emission allowance. Appl. Energy 2019, 241, 380–389. [Google Scholar] [CrossRef] [Scilit]
  20. Chen, X.; Yang, F.; Zhang, S.; Zakeri, B.; Chen, X.; Liu, C.; Hou, F. Regional emission pathways, energy transition paths and cost analysis under various effort-sharing approaches for meeting Paris Agreement goals. Energy 2021, 232, 121024. [Google Scholar] [CrossRef] [Scilit]
  21. Ye, F.; Fang, X.; Li, L.; Li, Y.; Chang, C.-T. Allocation of carbon dioxide emission quotas based on the energy-economy-environment perspective: Evidence from Guangdong Province. Sci. Total Environ. 2019, 669, 657–667. [Google Scholar] [CrossRef] [Scilit] [PubMed]
  22. Chang, K.; Zhang, C.; Chang, H. Emissions reduction allocation and economic welfare estimation through interregional emissions trading in China: Evidence from efficiency and equity. Energy 2016, 113, 1125–1135. [Google Scholar] [CrossRef] [Scilit]
  23. Han, R.; Tang, B.-J.; Fan, J.-L.; Liu, L.-C.; Wei, Y.-M. Integrated weighting approach to carbon emission quotas: An application case of Beijing-Tianjin-Hebei region. J. Clean. Prod. 2016, 131, 448–459. [Google Scholar] [CrossRef] [Scilit]
  24. Tang, B.-J.; Hu, Y.-J.; Yang, Y. The Initial Allocation of Carbon Emission Quotas in China Based on the Industry Perspective. Emerg. Mark. Financ. Trade 2021, 57, 931–948. [Google Scholar] [CrossRef] [Scilit]
  25. Bakhtiari, F. International cooperative initiatives and the United Nations Framework Convention on Climate Change. Clim. Policy 2018, 18, 655–663. [Google Scholar] [CrossRef] [Scilit]
  26. Lim, S.; Lee, K.T. Implementation of biofuels in Malaysian transportation sector towards sustainable development: A case study of international cooperation between Malaysia and Japan. Renew. Sustain. Energy Rev. 2012, 16, 1790–1800. [Google Scholar] [CrossRef] [Scilit]
  27. Liming, H. A study of China–India cooperation in renewable energy field. Renew. Sustain. Energy Rev. 2007, 11, 1739–1757. [Google Scholar] [CrossRef] [Scilit]
  28. Liu, H.; Yao, P.; Wang, X.; Huang, J.; Yu, L. Research on the Peer Behavior of Local Government Green Governance Based on SECI Expansion Model. Land 2021, 10, 472. [Google Scholar] [CrossRef] [Scilit]
  29. Bel, G.; Warner, M.E. Inter-municipal cooperation and costs: Expectations and evidence. Public Adm. 2015, 93, 52–67. [Google Scholar] [CrossRef] [Scilit]
  30. Mason, C.F.; Polasky, S.; Tarui, N. Cooperation on climate-change mitigation. Eur. Econ. Rev. 2017, 99, 43–55. [Google Scholar] [CrossRef] [Scilit]
  31. Bandeiras, F.; Pinheiro, E.; Gomes, M.; Coelho, P.; Fernandes, J. Review of the cooperation and operation of microgrid clusters. Renew. Sustain. Energy Rev. 2020, 133, 110311. [Google Scholar] [CrossRef] [Scilit]
  32. Liu, X.; Wang, W.; Wu, W.; Zhang, L.; Wang, L. Using cooperative game model of air pollution governance to study the cost sharing in Yangtze River Delta region. J. Environ. Manag. 2022, 301, 113896. [Google Scholar] [CrossRef] [Scilit]
  33. Pyakurel, P.; Wright, L. Energy and resources cooperation for greenhouse gases emissions reduction of industrial sector. Energy Environ. 2021, 32, 635–647. [Google Scholar] [CrossRef] [Scilit]
  34. Ming, Y.; Grabot, B.; Houé, R. A typology of the situations of cooperation in supply chains. Comput. Ind. Eng. 2014, 67, 56–71. [Google Scholar] [CrossRef] [Scilit]
  35. Salcedo-Diaz, R.; Ruiz-Femenia, J.R.; Amat-Bernabeu, A.; Caballero, J.A. A cooperative game strategy for designing sustainable supply chains under the emissions trading system. J. Clean. Prod. 2021, 285, 124845. [Google Scholar] [CrossRef] [Scilit]
  36. Li, J.; Piao, S.R. Research on Regional Synergy Carbon Reduction Cost Allocation Based on Cooperative Game. Adv. Mater. Res. 2013, 781–784, 2569–2572. [Google Scholar] [CrossRef] [Scilit]
  37. Qu, Y.; Cang, Y. Cost-benefit allocation of collaborative carbon emissions reduction considering fairness concerns—A case study of the Yangtze River Delta, China. J. Environ. Manag. 2022, 321, 115853. [Google Scholar] [CrossRef] [Scilit]
  38. Liu, M.; Lo, K. Governing eco-cities in China: Urban climate experimentation, international cooperation, and multilevel governance. Geoforum 2021, 121, 12–22. [Google Scholar] [CrossRef] [Scilit]
  39. Chen, S.; Zhang, H.; Wang, S. Trade openness, economic growth, and energy intensity in China. Technol. Forecast. Soc. Change 2022, 179, 121608. [Google Scholar] [CrossRef] [Scilit]
  40. Shahbaz, M.; Song, M.; Ahmad, S.; Vo, X.V. Does economic growth stimulate energy consumption? The role of human capital and R&D expenditures in China. Energy Econ. 2022, 105, 105662. [Google Scholar] [CrossRef] [Scilit]
  41. Ye, Y.; Xu, S.; Mariani, M.S.; Lü, L. Forecasting countries’ gross domestic product from patent data. Chaos Solitons Fractals 2022, 160, 112234. [Google Scholar] [CrossRef] [Scilit]
  42. Zhang, Y. Research on China’s Regional Carbon Emission Quota Allocation in 2030 under the Constraint of Carbon Intensity. Math. Probl. Eng. 2020, 2020, 8851062. [Google Scholar] [CrossRef] [Scilit]
  43. Guan, Y.; Shan, Y.; Huang, Q.; Chen, H.; Wang, D.; Hubacek, K. Assessment to China’s Recent Emission Pattern Shifts. Earth’s Future 2021, 9, e2021EF002241. [Google Scholar] [CrossRef] [Scilit]
  44. Shan, Y.; Liu, J.; Liu, Z.; Xu, X.; Shao, S.; Wang, P.; Guan, D. New provincial CO2 emission inventories in China based on apparent energy consumption data and updated emission factors. Appl. Energy 2016, 184, 742–750. [Google Scholar] [CrossRef] [Scilit]
  45. Shan, Y.; Guan, D.; Zheng, H.; Ou, J.; Li, Y.; Meng, J.; Mi, Z.; Liu, Z.; Zhang, Q. China CO2 emission accounts 1997–2015. Sci. Data 2018, 5, 170201. [Google Scholar] [CrossRef] [Scilit]
  46. Shan, Y.; Huang, Q.; Guan, D.; Hubacek, K. China CO2 emission accounts 2016–2017. Sci. Data 2020, 7, 54. [Google Scholar] [CrossRef] [Scilit]
  47. Ellerman, A.; Decaux, A. Analysis of Post-Kyoto CO2 Emissions Trading Using Marginal Abatement Curves. 1 October 1998. Available online: https://www.semanticscholar.org/paper/Analysis-of-post-Kyoto-CO%E2%82%82-emissions-trading-using-Ellerman-Decaux/d17ad30a34ac13143ca3dc941bde38527fc2fc4b (accessed on 19 August 2024).
  48. Hanaoka, T.; Kainuma, M. Low-carbon transitions in world regions: Comparison of technological mitigation potential and costs in 2020 and 2030 through bottom-up analyses. Sustain. Sci. 2012, 7, 117–137. [Google Scholar] [CrossRef] [Scilit]
  49. Guo, J.-X.; Zhu, L.; Fan, Y. Emission path planning based on dynamic abatement cost curve. Eur. J. Oper. Res. 2016, 255, 996–1013. [Google Scholar] [CrossRef] [Scilit]
  50. Nordhaus, W.D. The Cost of Slowing Climate Change: A Survey. Energy J. 1991, 12, 37–66. [Google Scholar] [CrossRef] [Scilit]
  51. Nordhaus, W. Climate Change: The Ultimate Challenge for Economics. Am. Econ. Rev. 2019, 109, 1991–2014. [Google Scholar] [CrossRef] [Scilit]
  52. Okada, A. International Negotiations on Climate Change: A Noncooperative Game Analysis of the Kyoto Protocol; Avenhaus, R., Zartman, I.W., Eds.; Springer: Berlin/Heidelberg, Germany, 2007; pp. 231–250. [Google Scholar] [CrossRef] [Scilit]
  53. Jiang, M.; Zhu, B.; Chevallier, J.; Xie, R. Allocating provincial CO2 quotas for the Chinese national carbon program. Aust. J. Agric. Resour. Econ. 2018, 62, 457–479. [Google Scholar] [CrossRef] [Scilit]
  54. Masoomi, M.; Panahi, M.; Samadi, R. Scenarios evaluation on the greenhouse gases emission reduction potential in Iran’s thermal power plants based on the LEAP model. Environ. Monit. Assess. 2020, 192, 235. [Google Scholar] [CrossRef] [Scilit] [PubMed]
  55. Li, Z.; Zhao, T.; Wang, J.; Cui, X. Two-step allocation of CO2 emission quotas in China based on multi-principles: Going regional to provincial. J. Clean. Prod. 2021, 305, 127173. [Google Scholar] [CrossRef] [Scilit]
  56. Wang, S.; Wang, Y.; Zhou, C.; Wang, X. Projections in Various Scenarios and the Impact of Economy, Population, and Technology for Regional Emission Peak and Carbon Neutrality in China. Int. J. Environ. Res. Public Health 2022, 19, 12126. [Google Scholar] [CrossRef] [Scilit] [PubMed]
Figure 1. Graphical framework.
Sustainability 18 03455 g001
Figure 2. Logical diagram of inter-provincial cooperation on CER.
Sustainability 18 03455 g002
Figure 3. The partner matching and updating process.
Sustainability 18 03455 g003
Figure 4. The CER allocation—continuous increase.
Sustainability 18 03455 g004
Figure 5. The initial CER allocation—continuous decrease.
Sustainability 18 03455 g005
Figure 6. The initial CER allocation—an initial decrease followed by an increase.
Sustainability 18 03455 g006
Figure 7. The initial CER allocation—an initial increase followed by a decrease.
Sustainability 18 03455 g007
Figure 8. Change in total abatement cost corresponding to different cooperation proportions.
Sustainability 18 03455 g008
Figure 9. Cost-saving ratio compared with no cooperation.
Sustainability 18 03455 g009
Figure 10. Changes in provincial carbon intensity: (a) provinces acting as continuous implementers; (b) provinces acting as continuous payers; (c) provinces experiencing a change in cooperation roles.
Sustainability 18 03455 g010
Figure 11. The mean and standard deviation of CI.
Sustainability 18 03455 g011
Figure 12. Changes in provincial carbon emissions among: (a) provinces acting as continuous implementers; (b) provinces acting as continuous payers; and (c) provinces experiencing a change in cooperation roles.
Sustainability 18 03455 g012
Table 1. Nomenclature and symbols.
SymbolDefinitionUnit
Indices and Sets
i, jIndices for provinces-
kIndex for a general province-
tIndex for years-
Socio-Economic and Prediction Parameters
GDPitGross Domestic Product of province i in year tBillion Yuan
θitThe provincial planned GDP growth rate in year t%
λ t Provincial GDP correction factor in year t
popitPopulation of province i in year tMillion
IAVitIndustrial added valueBillion Yuan
E(ind)itIndustrial carbon emissionsMtCO2
CICarbon intensitytCO2/ 10 4 Yuan
C I ¯ National average carbon intensitytCO2/ 10 4 Yuan
Allocation Model Variables
TCERtNational total carbon emission reduction tasksMtCO2
PEitPotential carbon emissionsMtCO2
IEtIdeal national total carbon emission targetMtCO2
Cap, Res, PotIndicators: capacity, responsibility, potential-
waThe weights of indicators-
Sa, rabStandard deviation, Correlation coefficient in CRITIC-
CERitTheoretically allocated CER task for province iMtCO2
Abatement Cost and Cooperation Variables
MACThe marginal abatement cost Yuan/tCO2
RProportion of emission reduction%
α ,  β Coefficients of the MAC curve-
rkCoordinate translation distance for the MAC curve-
Ek, AkEmission load, Actual emission reduction amountMtCO2
TACThe total abatement costTrillion Yuan
Qij, QjiThe quantity of the cooperative CER taskMtCO2
CO(Qij)Financial payment or benefit derived from cooperationTrillion Yuan
PShadow Price (Equilibrium Carbon Price)Yuan/tCO2
ηPreset cooperation proportion ratio%
Table 2. Principles and indicators calculation.
PrinciplesSymbolsIndicatorsCalculation
Capacity C a p i t provincial GDP per capita G D P i t / p o p i t
Responsibility R e s i t Historical cumulative carbon emissions f = 2005 t E i f
Potential P o t i t CO2 emission per unit of industrial added value E ( i n d ) i t / I A V i t
Note: The subscripts i and t denote the province and year, respectively. GDPit and popit represent the GDP and population of province i in year t. Eif is the historical carbon emission of province i in year f, f ∈ (2005, 2019). E(ind)it and IAVit are the industrial carbon emissions and industrial added value. The calculation methods of each parameter are detailed in Section 3.4, Data source and variable setting.
Table 3. Summary of key variables and data sources.
VariableUnitBase YearSourceProjection Method
Carbon Emissions ( E i t )Mt C O 2 2019CEADs DatabaseExtrapolated based on intensity targets and GDP growth
GDP ( G D P i t )Billion Yuan
(2005 constant price)
2019National/Provincial Statistical YearbooksAdjusted based on 14th Five-Year Plan targets and 5.5% national growth rate
Population ( p o p i t )Million2020China Statistical YearbookLinear interpolation based on the National Population Development Plan (2016–2030) target (1.45 billion)
Industrial Added Value ( I A V i t )Billion Yuan2019National/Provincial Statistical YearbooksAssumed to grow at the same rate as provincial GDP
Table 4. Partnerships from 2020 to 2030.
Payer_Implementer
2020–20252026–2030
Beijing_Inner MongoliaBeijing_Inner Mongolia
Hainan_HebeiHainan_Hebei
Qinghai_ShanxiShanghai_Shanxi
Shanghai_XinjiangChongqing_Xinjiang
Chongqing_ShandongQinghai_Liaoning
Yunnan_NingxiaTianjin_Shandong
Tianjin_LiaoningZhejiang_Heilongjiang
Fujian_JiangsuFujian_Anhui
Sichuan_HeilongjiangYunnan_Guizhou
Zhejiang_AnhuiGuangdong_Ningxia
Jiangxi_GuizhouHubei_Gansu
Hunan_HenanHunan_Jiangxi
Hubei_JilinSichuan_Guangxi
Guangxi_ShaannxiHenan_Shaannxi
Gansu_GuangdongJilin_Jiangsu
Table 5. National total abatement costs under different cooperation proportions (Unit: Billion Yuan).
YearNo Cooperation (0%)Recommended (40%)Economic Optimal (80%)
20200.050.040.02
20251.200.900.65
20305.403.903.10
Disclaimer/Publisher’s Note: The statements, opinions and data contained in all publications are solely those of the individual author(s) and contributor(s) and not of MDPI and/or the editor(s). MDPI and/or the editor(s) disclaim responsibility for any injury to people or property resulting from any ideas, methods, instructions or products referred to in the content.