1. Introduction
Ports play a central role in global trade, acting as key hubs for both maritime and land transport. While port activities represent a significant source of income and employment for surrounding areas, they also generate negative externalities such as traffic congestion, air pollution, noise, and infrastructure degradation, which significantly impact the quality of life of local residents [
1,
2]. This issue becomes particularly acute in urban port contexts, where port operations are closely integrated with the surrounding city. In these settings, effective management of land-side connectivity is fundamental to ensuring the port’s integration with the city while maintaining operational efficiency and minimizing negative impacts on citizens [
3]. Improving gate management therefore has direct implications for both environmental sustainability, through reductions in vehicle emissions from idling traffic at congested gates, and social sustainability, through reduced congestion and improved quality of life in the surrounding urban area.
A factor that can significantly influence port efficiency, and gate management in particular, is the regulatory and fiscal framework in which the port operates. Free ports, characterized by special customs regimes and the absence of duties on incoming and outgoing goods, confer significant fiscal and competitive benefits but also introduce considerable procedural complexity into port operations [
4,
5]. In free port settings, port gates function as effective borders of the customs territory, meaning that all vehicles entering or leaving are subject to additional controls and procedures compared to standard port operations. Despite the relevance of this complexity, the existing literature has addressed gate management and free port operations as two separate and largely disconnected fields, leaving a significant gap in understanding how special customs regimes affect gate throughput and congestion.
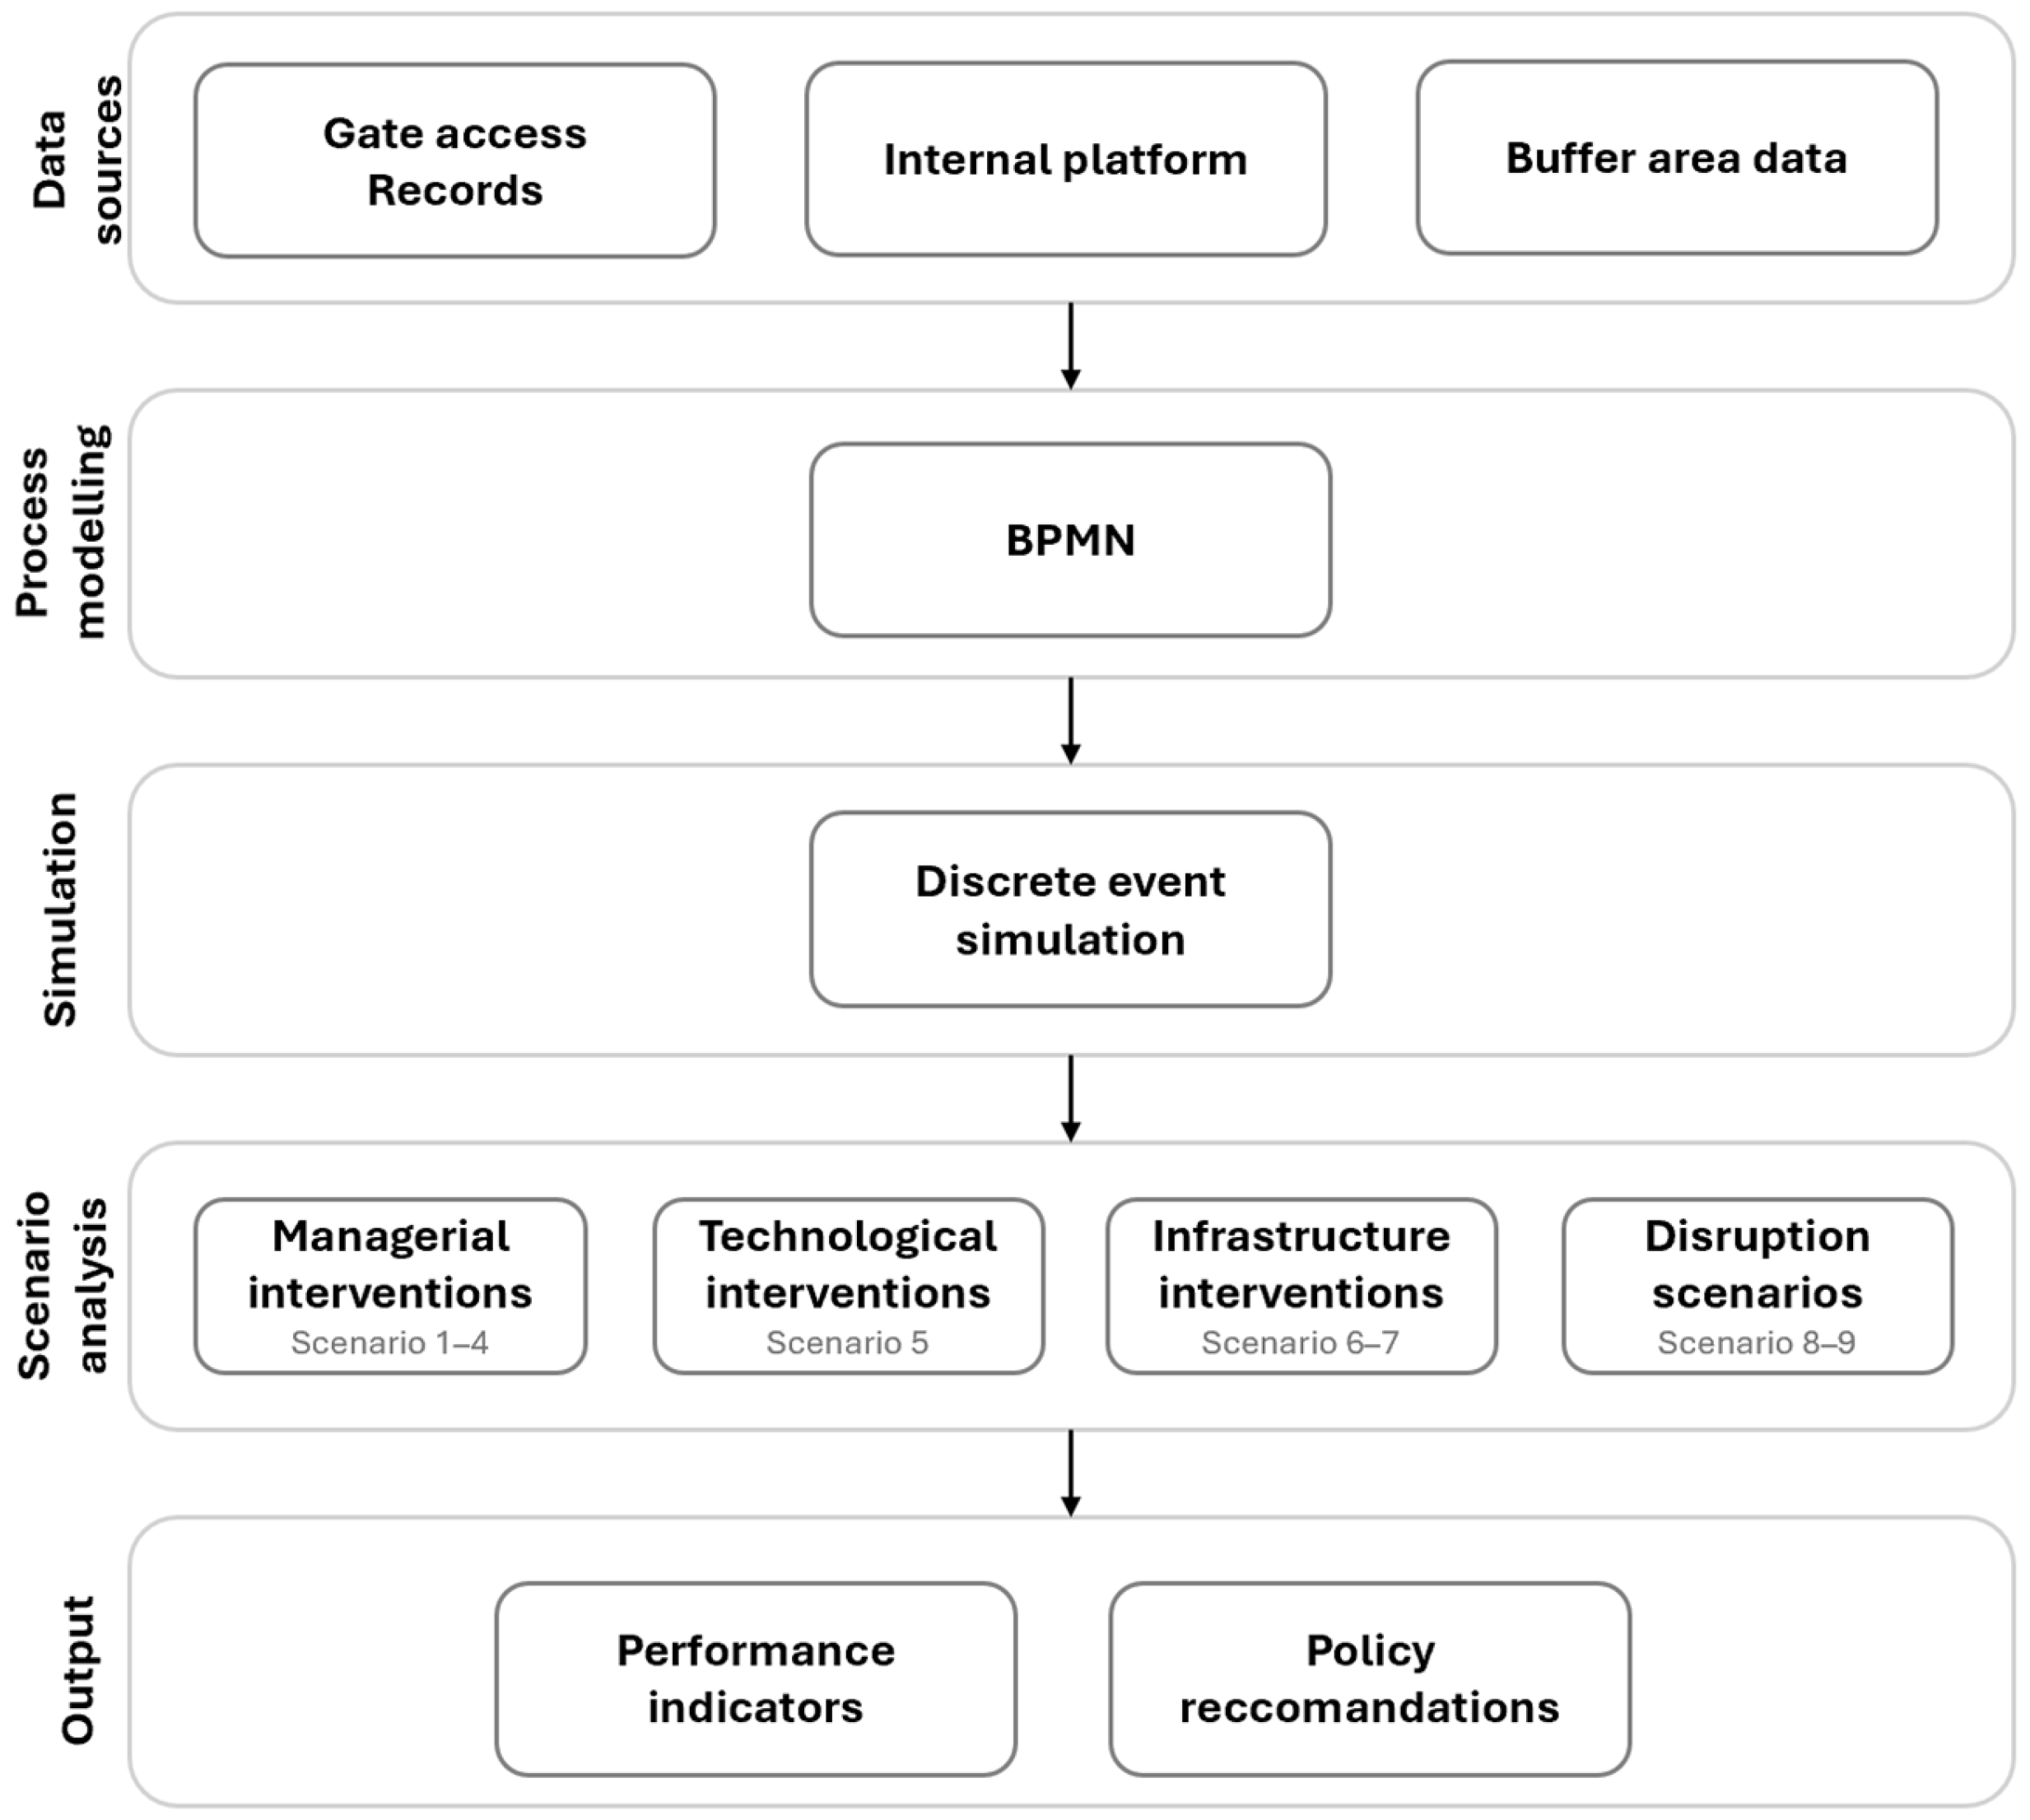
This paper aims to fill this gap by investigating how gate procedures in free ports can be managed more efficiently, using the Port of Trieste as a case study. The analysis combines Business Process Model and Notation (BPMN) with Discrete Event Simulation (DES) to analyse the current situation and evaluate a range of managerial, technological, infrastructural, and disruption-related scenarios. While the combination of BPMN and DES is established in logistics research, its application to free port gate management represents a novel contribution: existing studies on port gate management have focused exclusively on standard port settings, while the literature on free ports has addressed predominantly fiscal and economic dimensions. This study bridges these two disconnected research streams, demonstrating how the additional procedural complexity introduced by special customs regimes requires dedicated analytical frameworks that go beyond standard gate management approaches. The contribution of this paper is therefore both thematic, in bridging two previously separated research streams, and empirical, in providing practical guidance on how free port gates can be organized to balance regulatory obligations with operational efficiency. The results of the paper represent a valid tool to evaluate various scenarios that will drive different choices of investment to enhance port gates.
The remainder of the paper is structured as follows:
Section 2 reviews the relevant literature;
Section 3 describes the methodology;
Section 4 presents the case study, data, and model;
Section 5 reports the results of the scenario analysis; and
Section 6 discusses the findings and presents the conclusions.
4. Case Study
4.1. Study Area
The Port of Trieste is strategically located at the meeting point of maritime routes and the European Adriatic-Baltic and Mediterranean corridors. This position makes it an international hub for land–sea trade flows connecting Southern Europe with Central and Eastern European markets. According to Assoporti [
41], Trieste is the first port in Italy by total tonnage, rail traffic, and short sea shipping volumes.
The port positioned closely to the city of Trieste, a city of approximately 200,000 inhabitants, making the management of land accesses and gate operations particularly critical not only for port efficiency but also for the impact on the citizens.
The port has operated as a free zone since 1719, when Emperor Charles VI established it as a competitive outlet to the sea for the Habsburg Empire. Its international free port status was subsequently confirmed by the 1947 Treaty of Paris and the 1954 London Memorandum, making it one of the few remaining institutions of its kind in Europe [
4]. Under the current regime, the port offers significant fiscal and competitive advantages, including exemption from customs duties, customs credit, and the possibility of industrial processing of goods within the zone. These benefits continue to make Trieste an attractive hub for international trade to this day. However, the free port regime also introduces specific procedural requirements for all vehicles and goods entering and exiting the free zone. In particular, the port gates function as an effective border of European territory from the Customs point of view, meaning that all vehicles entering or leaving are subject to additional customs controls and security checks compared to standard port operations. While these procedures are necessary for regulatory compliance and security, they represent a significant source of operational complexity that directly affects gate throughput and the risk of congestion. Managing these flows efficiently is therefore essential not only for port operations, but also for minimizing the impact on the surrounding urban environment, given the close integration between the port and the city of Trieste.
To manage these complexities, the Port of Trieste is equipped with a Port Community System (PCS) called Sinfomar, which plays a central role in the port’s digitalization strategy. Sinfomar functions as a neutral platform overseen by the Port Authority, facilitating direct communication between public authorities and private stakeholders while ensuring data ownership and neutrality. Designed around the specific needs of the free zone, it integrates customs, police, and logistics procedures into a single digital environment. Customs declarations are submitted electronically via the PCS, utilizing real-time feedback mechanisms and barcode-based controls at the gates.
The access procedure differs significantly depending on the type of vehicle. Ro-Ro semi-trailers follow the most complex procedure: they are governed by a system of “virtual traffic lights” that links gate access to both customs clearance status and terminal availability. Trucks are initially directed to designated buffer areas located outside the port, where they await confirmation from the PCS that all required procedures are complete and that capacity is available at both the gate and the destination terminal. Only when all conditions are satisfied does the system display a “green light”, authorizing the vehicle to proceed to the port. Once authorization is granted, the vehicle has a limited time window, currently six hours, to reach the port gate, while the average travel time from the buffer area is approximately 40 thirty minutes. This time margin, while providing flexibility, does not allow the precise arrival time of vehicles at the gate to be determined with certainty, which can contribute to queue formation during peak periods. By directing trucks to buffer areas rather than allowing them to queue at the gates or on surrounding urban roads, the system averts uncontrolled inflows, reducing both queue formation at the port entrance and traffic spillover into the city.
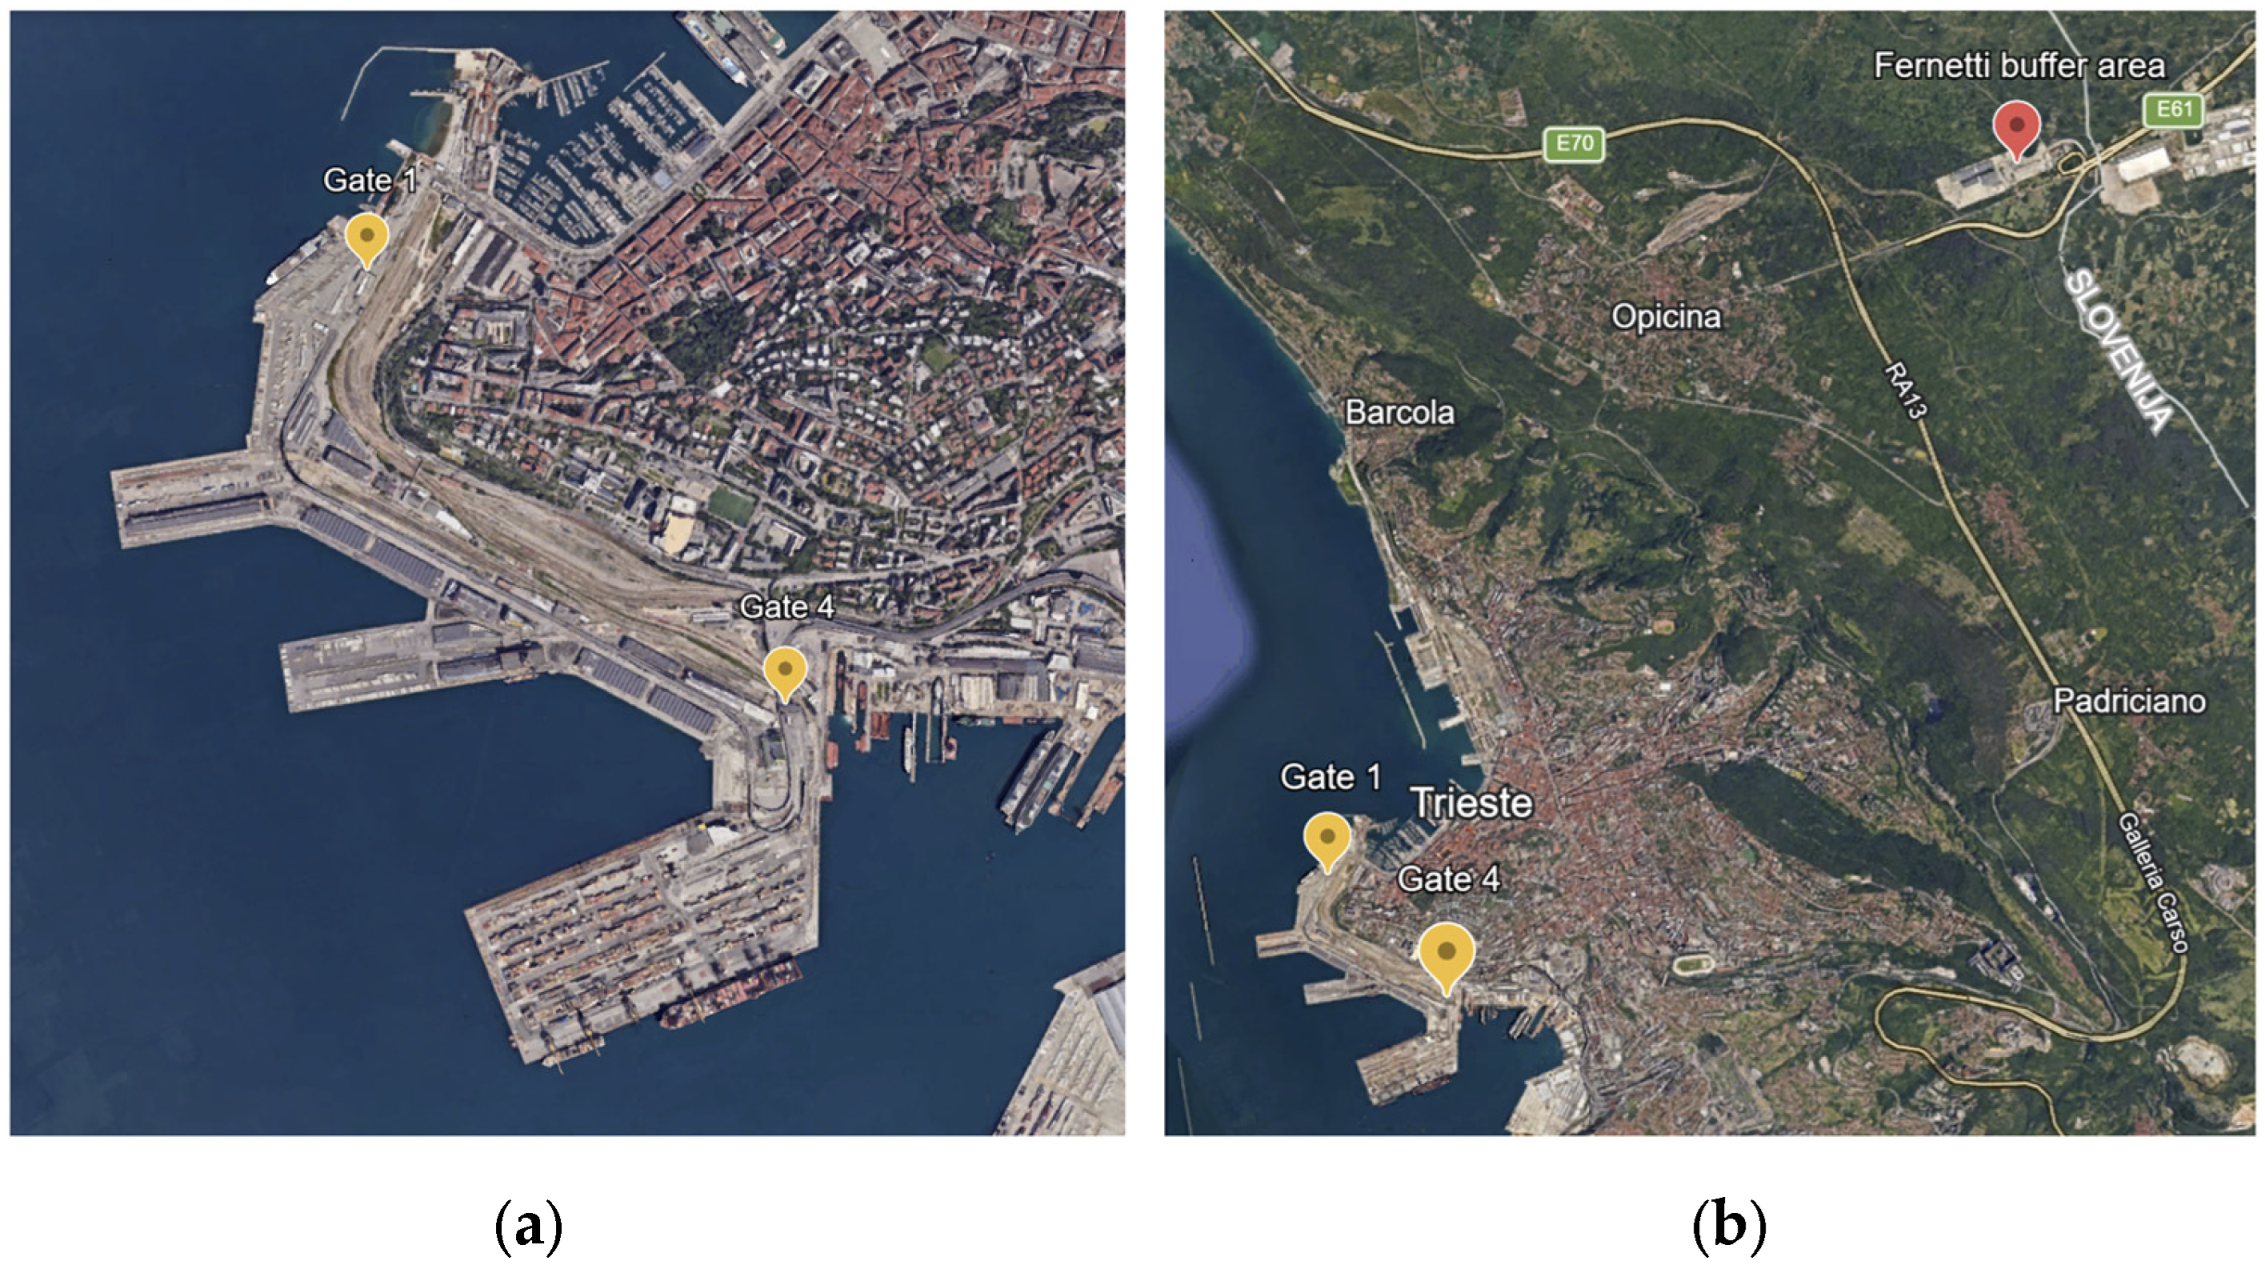
The largest and most important buffer area is Fernetti (
Figure 2b), located approximately 20 km from the port and directly connected to the motorway, allowing authorized vehicles to reach the port in less than one hour.
Container trucks follow a simpler procedure: they must complete a registration in the PCS and submit an arrival notification before reaching the gate, after which they can proceed directly without waiting for further authorizations. This notification remains valid for seven days once entered into the system. Empty vehicles and private cars of port employees follow the simplest procedure of all, accessing the port directly upon presentation of a dedicated document, without any prior registration or customs procedure required. Unlike Ro-Ro vehicles, whose arrival at the gate is regulated by the virtual traffic light system, container trucks and empty vehicles can present themselves at the gate at any time within the validity period of their registration, making their arrival patterns less predictable and introducing uncontrolled variability into gate queue dynamics.
This study focuses on the port access at Punto Franco Nuovo area, which is served by two port gates: Gate 1 and Gate 4 (
Figure 2a).
The main vehicle categories accessing this area are containers, Ro-Ro semi-trailers, and private vehicles of port employees. The two gates differ significantly in their operational characteristics. Gate 1 has five dedicated waiting lanes in addition to the access lanes, allowing vehicles to accumulate and queue without causing major disruption to city traffic. It operates from Monday to Friday, 7 a.m. to 7 p.m., and on Saturdays from 7 a.m. to 1 p.m. Gate 4, by contrast, has a more limited waiting area but operates continuously, 24 h a day, seven days a week. Both gates are equipped with two access lanes: one dedicated to full vehicles and one reserved for empty vehicles and private cars.
4.2. Data Description
The model was calibrated using several datasets relating to vehicle access at the Port of Trieste, collected between January and March 2025. This section describes the data sources used, how they were combined, and the parameters derived from them. The primary data source consists of gate access records, which log the timestamp at which each vehicle enters the gate, specifically, the moment at which the barrier is raised, for each lane at both Gate 1 and Gate 4. This dataset allows the total number of vehicles entering each gate to be calculated for each time period. However, it does not distinguish between Ro-Ro vehicles and containers within the lanes designated for full vehicles. To overcome this limitation, a second dataset was used, drawn from the port’s internal management platform, which provides a breakdown of traffic volumes by vehicle type and company. By tracing each company’s flows back to the relevant access gate based on their location, it was possible to estimate the proportion of Ro-Ro and container traffic at each gate. These percentages were then applied to the gate access data to obtain disaggregated vehicle counts by type. A third dataset, relating to the Fernetti buffer area, provided information on both the time at which the green light authorization was granted and the time at which the vehicle subsequently accessed the port. As this dataset does not allow the gate used to be accurately identified, it was used exclusively to estimate the distribution of travel times between the buffer area and the port gates.
Table 1 and
Table 2 provide a summary of the descriptive statistics of the raw data, including total vehicle volumes by type and gate, average inter-arrival times, and peak hour distributions.
The data show consistent traffic patterns across the three months. January records slightly lower volumes due to the holiday period at the beginning of the year, while February and March show closely aligned patterns. For this reason, the parameters of the simulation model were estimated using March 2025 data, which is considered the most representative of normal operating conditions at the port. By combining these sources and analysing their temporal distribution, vehicle generation functions were estimated for each vehicle type, gate, and time slot (daytime and night-time, the latter including weekends). The most suitable distribution was found to be exponential in all cases, with parameters varying by vehicle type, gate, and time slot. The estimated parameters are reported in
Table 3.
Service times at the gates were estimated as the time interval between two successive vehicles during periods of continuous queuing. The most representative distribution was found to be gamma, with parameters that were almost identical for both gates: gamma (1.9; 1.337; 0.35). For Ro-Ro vehicles, an additional average service time of three minutes was considered, reflecting the more complex customs procedures associated with their predominantly non-EU origin. For empty and private vehicles, service time estimates were based on observed values, assuming a total volume of approximately 10,000 vehicles per gate over the observation period, due to inconsistencies in the available data. Finally, travel times between the buffer area and the port gates were estimated from the buffer area dataset. A triangular distribution was found to be the most appropriate, with a minimum of 60 min, a maximum of 300 min, and a mode of 80 min. It is worth noting some limitations in the data used. The three-month observation period may not fully capture seasonal variations in traffic patterns. Furthermore, the dataset for empty and private vehicles presented some inconsistencies that required assumptions to be made, as described above. These aspects are discussed further in
Section 5.
4.3. Business Process Model and Notation Diagram
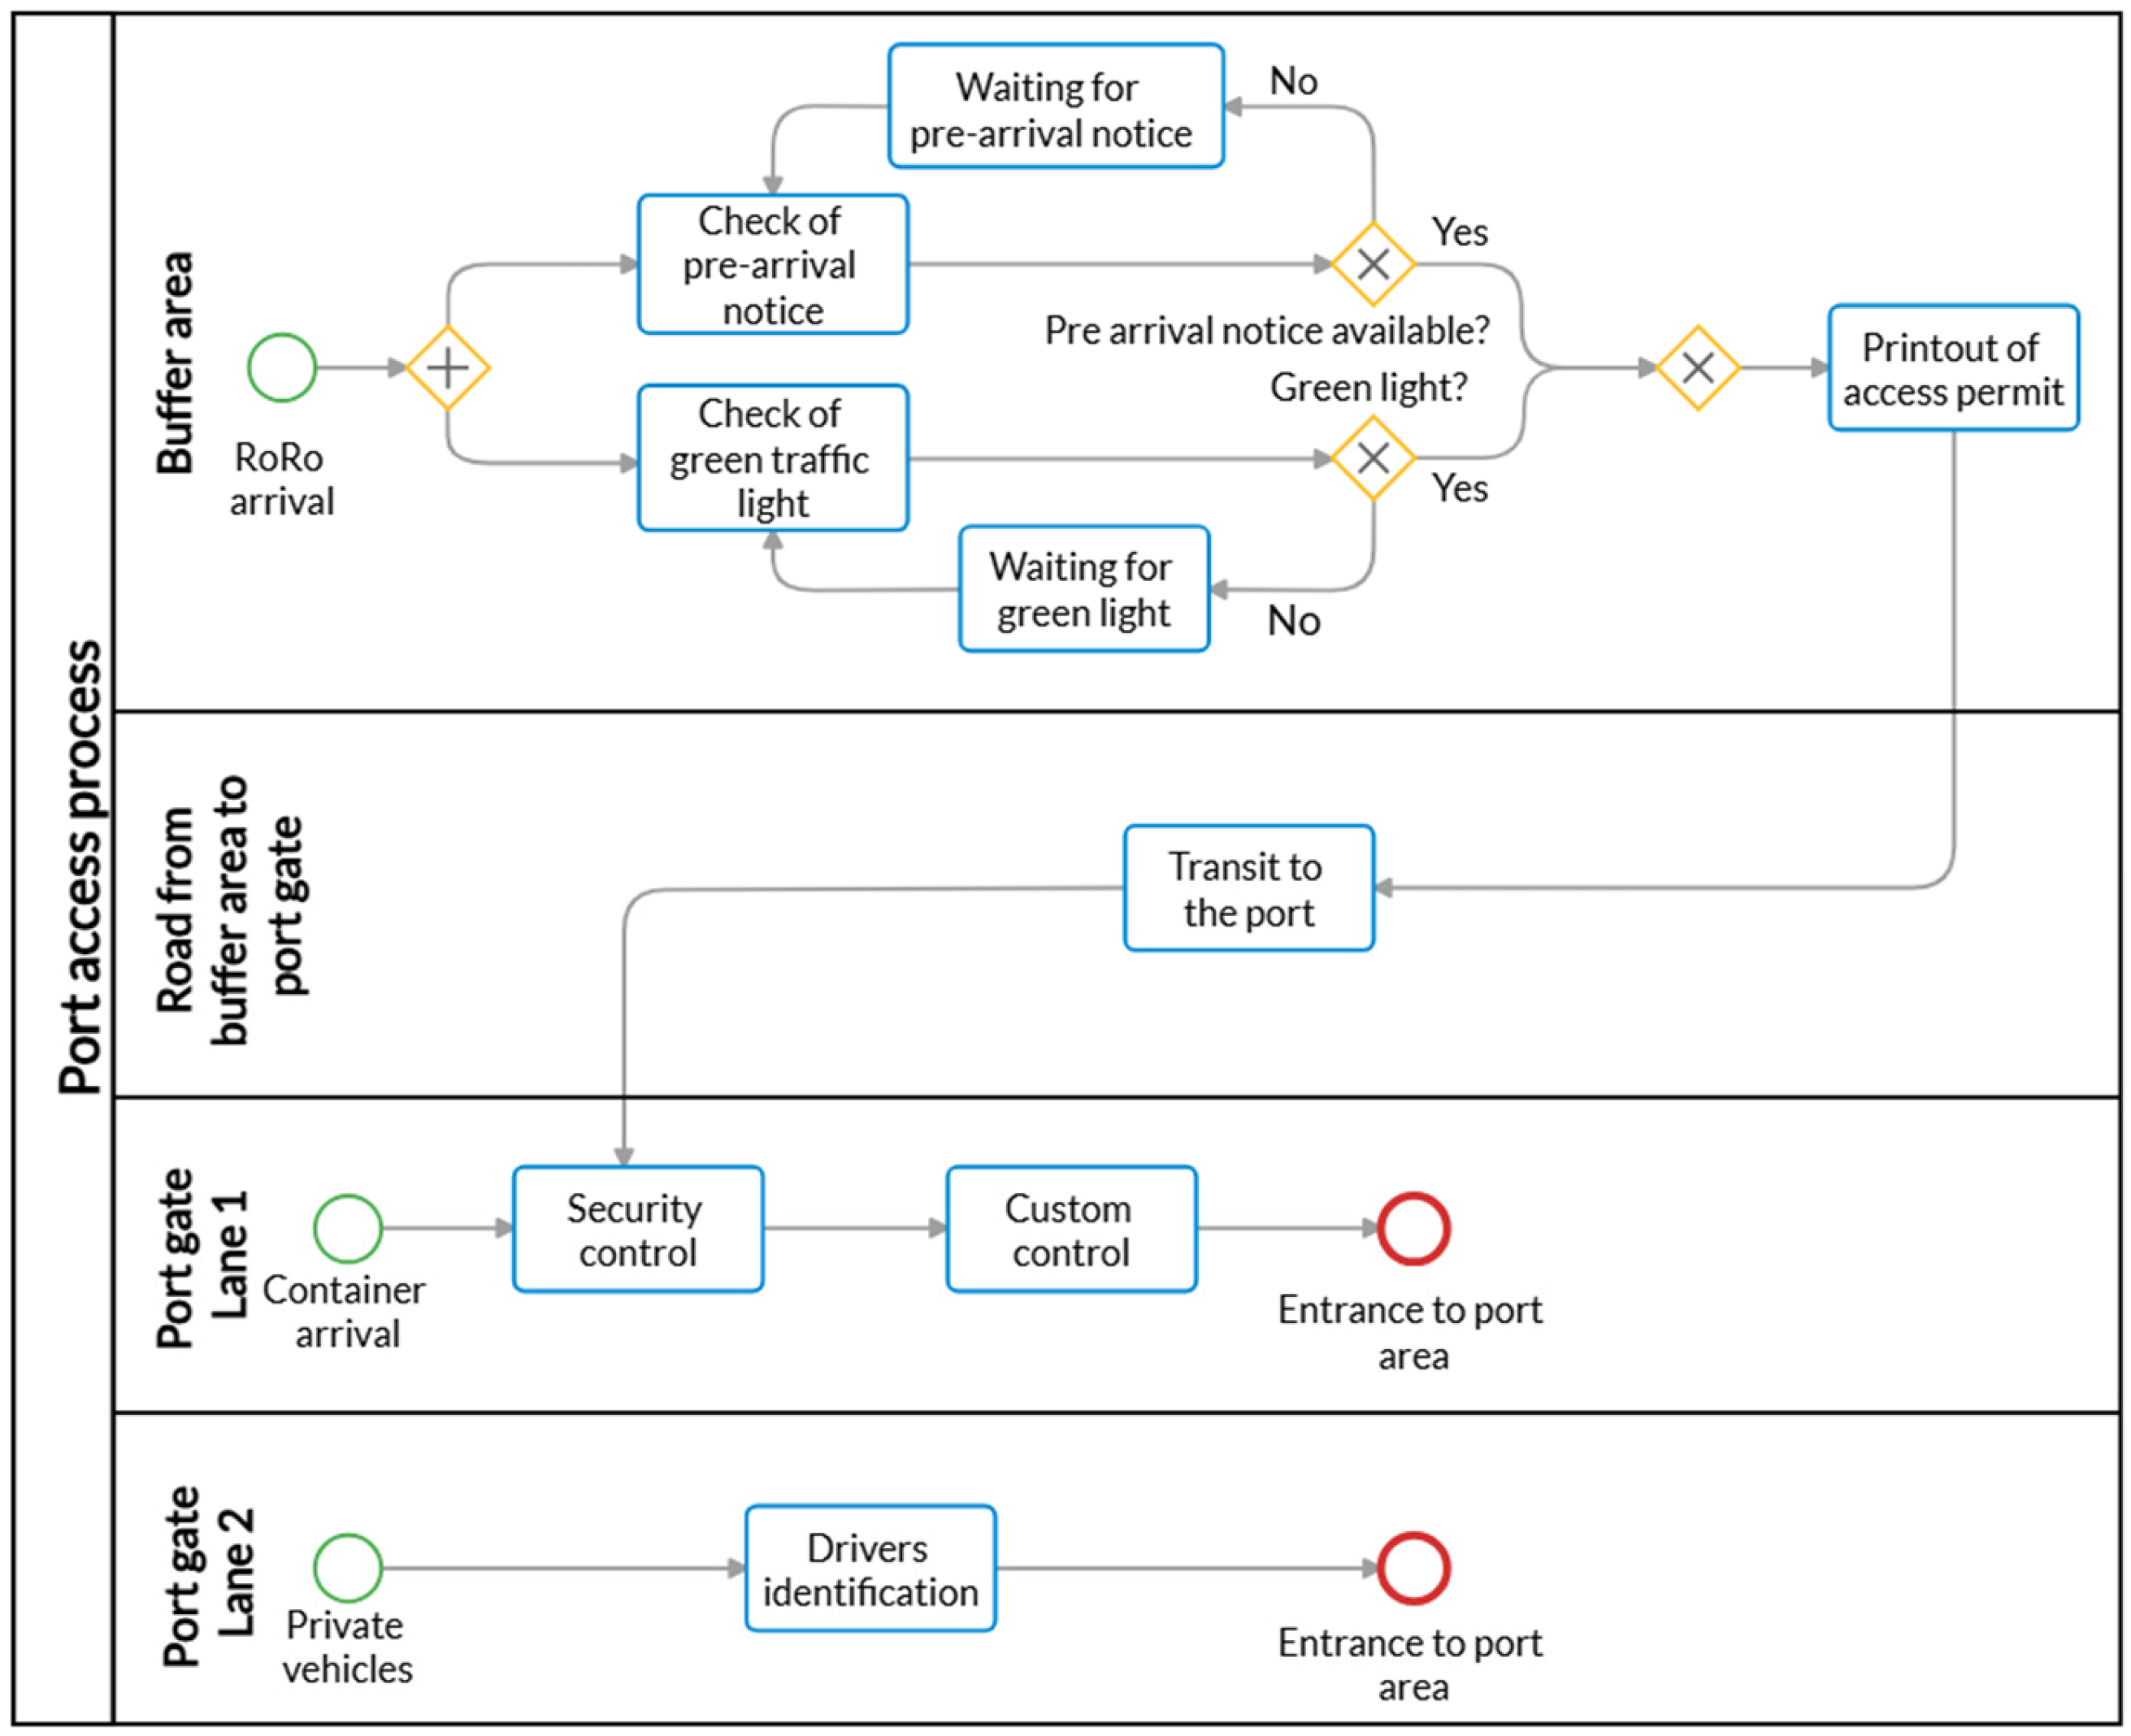
The BPMN diagram representing the current situation is shown in
Figure 3. The diagram follows standard BPMN: the green circle indicates the start of the activities, corresponding to vehicle generation; the red circle indicates the end; rectangles represent specific activities; and diamond shapes represent decision points. A diamond with a cross indicates a parallel gateway, meaning both branches must be followed simultaneously; a diamond with an X indicates an exclusive gateway, meaning only one branch can be followed. The diagram is divided into horizontal lanes, each representing a different area in which activities are carried out. As described in
Section 4.1, the process distinguishes between three categories of vehicles, private vehicles and empty trucks, containers, and Ro-Ro, each following a distinct access procedure. Private vehicles and empty trucks proceed directly to the gate; container trucks register in the PCS and proceed directly without passing through buffer areas; Ro-Ro vehicles must obtain authorization from the virtual traffic light system and wait in the buffer area before descending to the port. Upon entering the port, both container and Ro-Ro vehicles are subject to security and customs checks, with Ro-Ro procedures being on average longer and more complex due to the predominantly non-EU origin of this traffic. The BPMN diagram served a dual purpose in this study. First, it allowed the current process to be analysed in depth, identifying the main sources of complexity and potential bottlenecks, in particular, the additional customs procedures associated with the free port regime and the differentiated treatment of vehicle types. Second, it provided the logical foundation for the construction of the discrete event simulation model, ensuring that the model faithfully reproduces the actual decision logic and sequence of operations. It is worth noting that the future scenarios analysed in
Section 5 do not alter the fundamental logic of the process represented in the BPMN diagram. The scenarios involve changes to service time parameters, infrastructure capacity, and traffic management rules, but the sequence of activities and decision points remains the same. The BPMN model therefore serves as a stable reference framework for all scenarios considered in this study.
4.4. Discrete Event Simulation
Based on the BPMN model described in
Section 4.3, a discrete event simulation model was developed using AnyLogic software (version 8.9.7) [
42]. The model represents the port gate system as a set of interacting agents, individual vehicles, that move through a series of operations according to the logic defined in the BPMN diagram. The BPMN model served as the logical foundation for the construction of the simulation model, ensuring that the decision logic and sequence of operations identified during the process analysis phase were faithfully reproduced in the quantitative model.
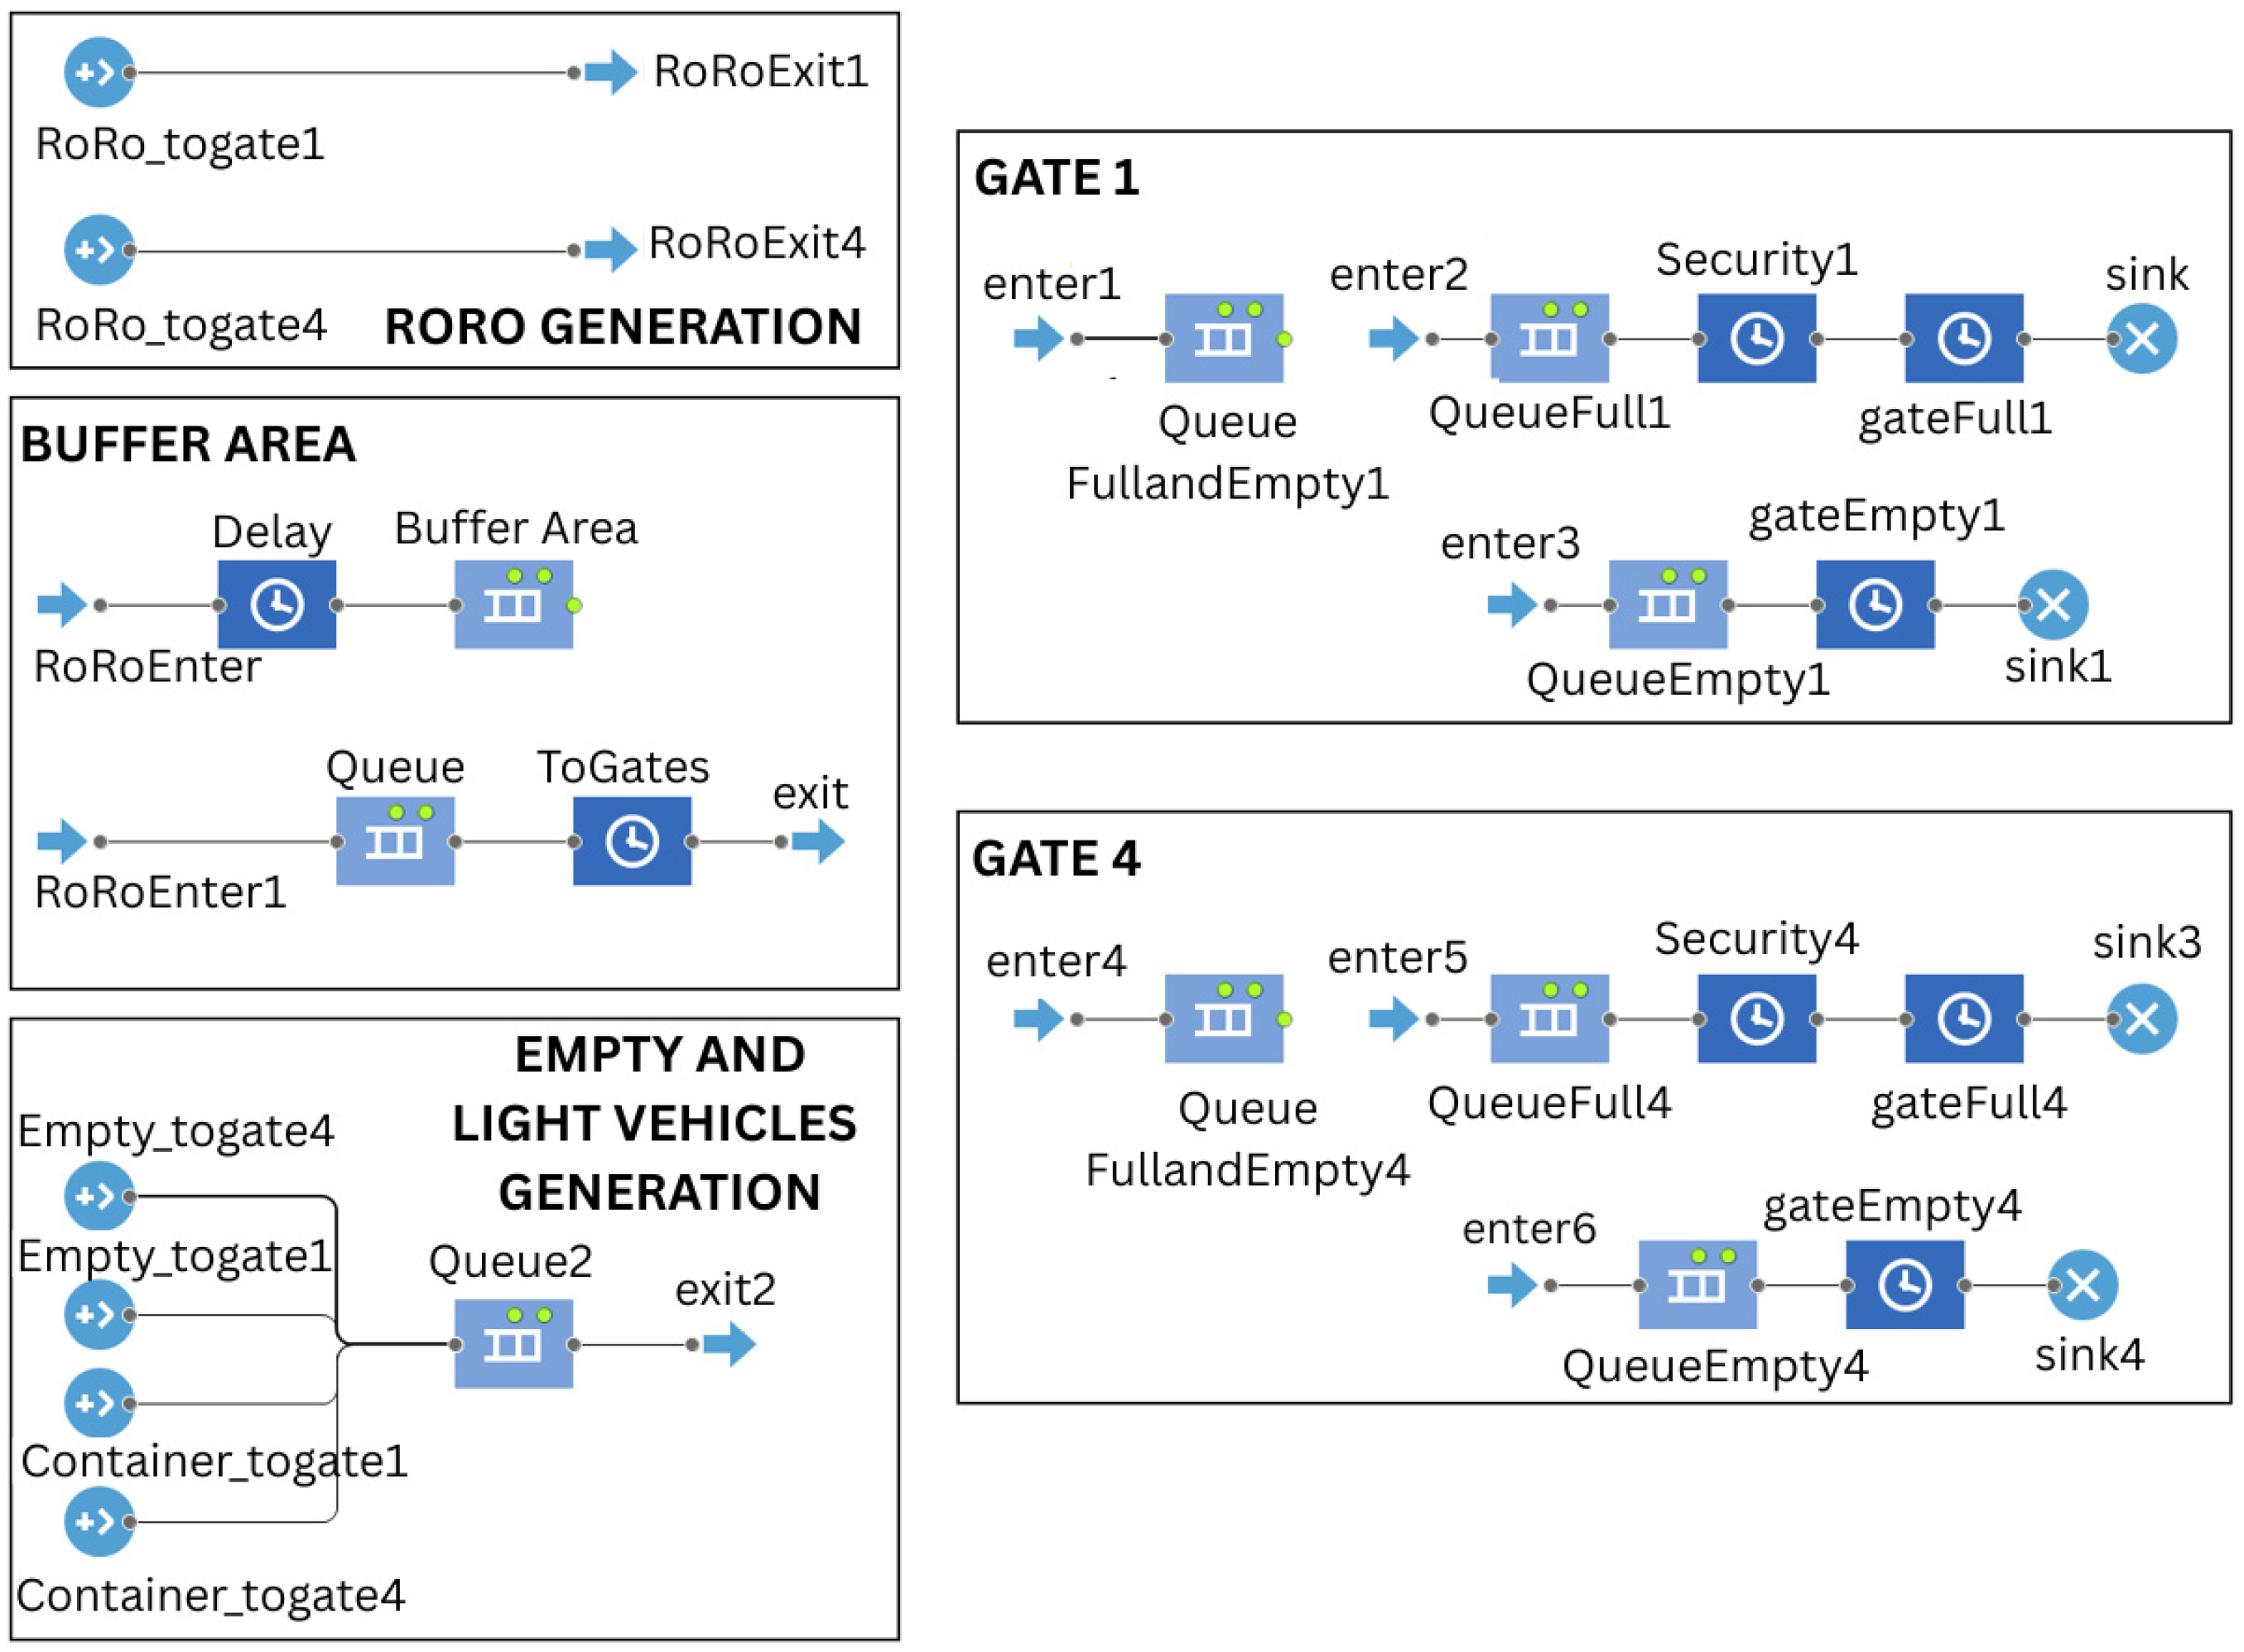
The model structure is shown in
Figure 4. It comprises the following main components:
Vehicle generators: one for each vehicle type (Ro-Ro, container, empty and private vehicles), producing agents according to the exponential distributions described in
Section 4.2, differentiated by gate and time slot.
Buffer area: Ro-Ro vehicles enter a queue in the buffer area and wait for authorization from the virtual traffic light system. The traffic light is activated based on the length of the queue at the gate, which cannot exceed a pre-set maximum threshold. Once authorized, vehicles are assigned a travel time drawn from the triangular distribution described in
Section 4.2 before proceeding to the gate.
Gate queues: upon arriving at the gate, vehicles merge into a single queue that then splits into two lanes, one for full vehicles and one for empty and private vehicles.
Service blocks: in the lane for full vehicles, two sequential delay blocks represent the security check and the gate service time, respectively, with parameters drawn from the gamma distribution described in
Section 4.2. For Ro-Ro vehicles, an additional fixed delay of three minutes is applied to account for the more complex non-EU customs procedures. Empty and private vehicles bypass the security check and proceed directly to the gate service block.
Gate opening hours: container and empty vehicle generators are differentiated by destination gate in order to comply with the respective opening hours of Gate 1 and Gate 4.
Figure 4.
Discrete-event simulation model—current situation. In the mode circles represent agent generation and termination; rectangles denote activities and queues (delays and waiting); arrows indicate transitions between blocks, allowing agents to move from one stage to the next [source: author’s elaboration].
Figure 4.
Discrete-event simulation model—current situation. In the mode circles represent agent generation and termination; rectangles denote activities and queues (delays and waiting); arrows indicate transitions between blocks, allowing agents to move from one stage to the next [source: author’s elaboration].
The performance indicators derived from the model include the mean queue length, maximum queue length, standard deviation of queue length, and maximum waiting time in queue, calculated overall and separately for the full vehicle and empty vehicle lanes, at both gates and at the buffer area. To account for the stochastic nature of the model, each scenario was run for 30 replications. Results are reported as means across replications, together with the standard deviation and 95% confidence intervals. Model validation was carried out through two complementary approaches. First, a quantitative comparison was performed between the simulated total vehicle volumes and the observed volumes reported in
Section 4.2, showing substantial consistency between simulated and observed volumes (
Table 4).
The comparison shows errors ranging from 0.3% to 5.6% across all vehicle types and gates, well within the 10% threshold commonly adopted in discrete event simulation validation studies, confirming that the model provides a reliable representation of the observed traffic volumes. Second, given the absence of independent observed data on queue lengths, face validity was ensured through expert review: the model behaviour and outputs were assessed by port operations staff with direct knowledge of gate dynamics at the Port of Trieste, who confirmed that the simulated patterns are consistent with observed operational conditions. Together, these two approaches provide sufficient confidence in the model’s ability to represent the current system and serve as a reliable basis for scenario analysis. The results of the simulation for the current situation are reported in
Table 5.
The maximum queue at Gate 1 is very high (70.21 vehicles), with an average queue of 6.22 vehicles. This is mainly because Gate 1 is primarily used by Ro-Ro vehicles, which require longer service and security times than containers. Gate 4 also shows high maximum queue values (63.36 vehicles), although to a lesser extent. These results highlight the critical role of Ro-Ro traffic in determining congestion levels at the gates and provide the baseline against which the future scenarios described in
Section 5 are evaluated.
5. Future Scenarios and Results
To improve port gate management, various intervention scenarios were defined and simulated. These scenarios are categorized as managerial, technological, infrastructural, and disruption-related. For each scenario, the description of the intervention is followed immediately by the analysis of the simulation results, allowing a direct comparison with the baseline values reported in
Table 5. The results for Gate 1, Gate 4, and the buffer area are reported in
Table 6,
Table 7 and
Table 8, respectively.
5.1. Managerial Interventions
This scenario introduces a preventive control mechanism to complement the existing virtual traffic light system. Rather than activating the traffic light only in response to visible queue build-up at the gate, this mechanism counts the number of vehicles already in transit between the buffer area and the gate to prevent additional vehicles from descending once a pre-set threshold is reached. Two threshold values were tested: 20 and 30 vehicles.
The results show that this intervention produces a significant improvement at Gate 1, where Ro-Ro traffic is concentrated. With a threshold of 30, the mean queue drops from 6.22 to 2.61 vehicles and the maximum queue from 70.21 to 34.97 vehicles. With a threshold of 20, the improvement is even more pronounced, with a mean queue of 1.25 vehicles and a maximum of 16.33 vehicles. However, these benefits come at the cost of increased congestion in the buffer area: with a threshold of 20, the mean queue in the buffer area rises from 2.43 to 33.02 vehicles and the maximum from 66.80 to 121.37 vehicles. This highlights the importance of calibrating the threshold carefully according to the capacity of the hinterland area. It should also be noted that lowering the threshold does not linearly improve gate performance, as container traffic, which is not subject to the traffic light control, introduces variability that limits the overall effectiveness of the mechanism.
This scenario assigns Gate 1 exclusively to Ro-Ro vehicles and Gate 4 exclusively to containers, while maintaining the empty vehicle and private car lanes at both gates. To accommodate the full Ro-Ro traffic volume, Gate 1 operating hours would need to be extended to 24/7.
The results show that gate specialization produces a marked improvement at Gate 4, where the mean queue drops from 4.60 to 0.32 vehicles and the maximum from 63.36 to 11.07 vehicles. However, the situation at Gate 1 deteriorates, with the mean queue rising from 6.22 to 13.47 vehicles and the maximum from 70.21 to 82.27 vehicles. This outcome reflects the imbalance between Ro-Ro and container traffic volumes in the current context. Furthermore, Ro-Ro vehicles require longer inspection times than containers due to their predominantly non-EU origin, which causes queues at the dedicated Ro-Ro gate to grow rapidly. Gate specialization therefore does not appear suitable for the current traffic composition, unless accompanied by measures to reduce Ro-Ro service times or rebalance traffic volumes.
This scenario converts the lane currently reserved for empty vehicles at Gate 1 into a mixed-use lane that can be activated for full vehicles when needed, providing additional capacity during peak periods.
The results show a clear improvement at Gate 1, with the mean queue reduced from 6.22 to 3.52 vehicles and the maximum from 70.21 to 37.30 vehicles. The maximum waiting time in the full vehicle lane also decreases from 23.91 to 16.88 min. The impact on Gate 4 and the buffer area is minimal, confirming that this intervention acts locally on the most congested access point. This scenario appears particularly promising given its low implementation cost. However, further analysis would be needed to identify the optimal time slots for activating the mixed-use lane in order to maximize its effectiveness without disrupting empty vehicle flows.
This scenario redirects all incoming vehicle flows to Gate 4, while Gate 1 would be reserved exclusively for outgoing traffic. This configuration would create a directional traffic flow within the port, separating inbound and outbound movements and potentially reducing interference between entering and exiting vehicles. Although the simulation focuses on the inbound side assessing the impact of concentrating all incoming traffic at a single gate, the results provide useful insight into the capacity limits of the current infrastructure under this type of operational reorganization.
The results show that concentrating all traffic at a single gate is not a viable solution given the current infrastructure. The mean queue at Gate 4 rises sharply from 4.60 to 16.79 vehicles, and the maximum reaches 153.47 vehicles. The buffer area is also severely affected, with the mean queue increasing from 2.43 to 35.84 vehicles and the maximum reaching 222.27 vehicles. The maximum waiting time in the empty lane reaches 332.99 min, reflecting severe interference between queues. Directing all traffic to a single access point would also have critical implications for the surrounding urban area, increasing the risk of traffic spillover into the city.
5.2. Technological Interventions
This scenario simulates the introduction of digital systems to speed up access procedures at the gates, through the use of cameras, automated document reading, and digitization of customs paperwork. The intervention is modelled as a percentage reduction in gate service times, tested at three levels: 5%, 10%, and 15%.
The results show that reductions in service times alone produce limited benefits at both gates. At Gate 1, the mean queue remains substantially similar to the baseline across all three levels, ranging from 4.26 to 5.26 vehicles. At Gate 4, a modest improvement is observed only at the 15% reduction level, where the mean queue drops from 4.60 to 2.61 vehicles. This limited impact is explained by the fact that security checks, particularly for Ro-Ro vehicles, remain a determining factor in overall service time and are not affected by document digitization alone. These results suggest that technological interventions are most effective when combined with other measures, as confirmed by the combined scenario discussed in
Section 5.5. These results strengthen the importance of defining integrated interventions concerning infrastructural as well as operational and procedural future investments.
5.3. Infrastructure Interventions
This scenario introduces an additional lane at Gate 4 for mixed use by Ro-Ro vehicles and containers, increasing the gate’s total capacity.
The results show a substantial improvement at Gate 4, where the mean queue drops from 4.60 to 0.38 vehicles and the maximum from 63.36 to 13.13 vehicles. The buffer area also benefits, with the mean queue reducing from 2.43 to 2.08 vehicles. The impact on Gate 1 is limited, as the intervention only directly affects Gate 4. However, as discussed in
Section 5.4, this scenario proves particularly valuable in disruption conditions, where the additional lane significantly accelerates the port’s recovery time.
This scenario reorganizes the lanes at Gate 4 into three dedicated lanes: one exclusively for Ro-Ro vehicles, one for containers, and one for empty vehicles.
Compared to Scenario 6, the results show a less pronounced improvement. The mean queue at Gate 4 decreases from 4.60 to 1.06 vehicles, but the maximum queue remains high at 53 vehicles, and the maximum waiting time in the full vehicle lanes reaches 162.18 min. This suggests that dedicated lanes perform less efficiently than mixed-use lanes in the current traffic composition, as they reduce flexibility in managing fluctuating flows between vehicle types. Scenario 6 therefore appears preferable to Scenario 7 both in terms of performance and operational flexibility.
5.4. Disruption Scenarios
Ports are increasingly exposed to disruptions caused by extreme weather events, accidents, and other unpredictable factors [
17]. In the case of Trieste, two types of disruption are particularly relevant and realistic given the specific geographical and operational context of the port. The first concerns strong Bora wind events, a well-documented meteorological phenomenon in the northern Adriatic region that regularly causes operational disruptions, particularly affecting container handling due to the suspension of crane operations above certain wind speed thresholds. The second concerns more severe events, such as wildfires or extreme weather conditions, that can compromise all road and rail access to the port, potentially leading to a complete suspension of operations. While less frequent, such events have concrete precedent in the area, as demonstrated by the wildfire that affected the Carso region in August 2024. These two disruption types are reflected in the two scenarios analysed below.
To assess the impact of disruptions, a metric called recovery time was introduced, defined as the number of hours required for the port to return to normal operating conditions. Normal conditions are defined as queues returning below the maximum capacity of the gates and no accumulation of vehicles in areas outside the port. The recovery time results for each scenario are reported in
Table 9.
This scenario simulates a one-day partial closure affecting container handling only, reflecting the operational impact of strong Bora wind events at the Port of Trieste. The Bora is a well-documented meteorological phenomenon characteristic of the northern Adriatic region, with gusts in the city of Trieste regularly exceeding 120 km/h and an official record of 171 km/h. Given that crane operations for container handling must generally cease when wind speeds exceed approximately 60–70 km/h, strong Bora events routinely cause partial interruptions to container terminal operations. Ro-Ro traffic, which does not rely on crane operations, continues normally during these periods.
The results show that recovery from a one-day partial disruption is relatively consistent across most scenarios, with recovery times ranging from approximately 33.06 to 52.81 h. This is because the disruption affects only half of the total traffic volume, and the existing buffer area and traffic light system help absorb the backlog progressively. The baseline recovery time is 45.09 h. The only scenario showing a clear improvement is Scenario 6, where the additional lane at Gate 4 reduces recovery time to 33.06 h, enabling a significantly faster return to normal conditions. Scenario 4, by contrast, shows the worst performance with a recovery time of 52.81 h, confirming that concentrating all traffic at a single gate increases vulnerability to disruptions.
This scenario simulates a total closure of the port for three days, reflecting more severe events that require a complete suspension of operations and affect all road and rail access to the port. A recent and particularly relevant example occurred on 31 August 2024, when a large wildfire broke out in the hinterland area north of Trieste, causing the simultaneous closure of the main motorway and railway line serving the port, as well as the border crossings used by heavy vehicles to access the Fernetti buffer area. This event exposed a structural vulnerability of the Port of Trieste: its land connectivity depends on a single geographical corridor, meaning that any major disruption in that area can simultaneously affect all road, rail, and buffer area access.
The results show much greater differentiation between scenarios in this more severe case, with recovery times ranging from 114.98 to 268.24 h. The baseline recovery time is 217.20 h. The most effective scenarios are Scenario 6 (114.98 h) and Scenario 2 (178.01 h), both of which significantly reduce recovery time compared to the baseline. Scenario 6 benefits from the additional lane capacity, which allows the large backlog of vehicles to be processed more quickly once the port reopens. Scenario 2 benefits from gate specialization, which reduces interference between vehicle types during the recovery phase. Scenario 1 with a threshold of 30 shows the worst performance (268.24 h), as the restrictive flow control from the buffer area slows down the reabsorption of the accumulated backlog after reopening.
These results highlight an important trade-off: measures that improve performance under normal conditions, such as Scenario 1, may actually reduce resilience in the event of severe disruptions. Infrastructure interventions, despite their higher implementation cost, prove to be the most effective in ensuring rapid recovery, and should therefore be considered as a priority investment for ports seeking to improve their resilience to extreme events.
The complete numerical results for all scenarios are summarized in
Table 2,
Table 3,
Table 4 and
Table 5, reporting performance indicators for Gate 1, Gate 4, the buffer area, and disruption recovery times, respectively. These are discussed comparatively in
Section 5.5.
5.5. Overall Analysis
An overall reading of the simulation results reveals that no single intervention is capable of producing significant improvements across all performance indicators simultaneously. The effectiveness of each measure depends strongly on the specific characteristics of the traffic composition at the Port of Trieste, particularly the predominance of Ro-Ro vehicles at Gate 1 and their longer service times due to non-EU customs procedures.
Among the managerial interventions, Scenario 3 emerges as the most immediately implementable, offering a meaningful reduction in queue lengths at Gate 1 at virtually no infrastructure cost. Scenario 1 produces significant improvements at the gates but must be calibrated carefully to avoid overloading the buffer area. Scenario 2 improves Gate 4 performance substantially but worsens Gate 1, making it unsuitable for the current traffic composition. Scenario 4 proves clearly unsustainable given the current infrastructure.
Among the technological interventions, Scenario 5 alone produces limited benefits, as security checks remain the dominant factor in Ro-Ro service times regardless of document digitization. However, when combined with managerial interventions, specifically Scenario 1 with a threshold of 30, the results improve considerably. At Gate 1, the combined scenario reduces the mean queue from 6.22 to 2.32 vehicles and the maximum from 70.21 to 29.20 vehicles. At Gate 4, the mean queue drops from 4.60 to 2.63 vehicles and the maximum from 63.36 to 40.17 vehicles. This confirms that technological interventions are most effective as part of an integrated approach rather than as standalone measures.
Among the infrastructure interventions, Scenario 6 consistently outperforms Scenario 7, suggesting that mixed-use lanes are more effective than dedicated lanes in managing the variable traffic composition at the port. While infrastructure interventions incur higher implementation costs, their value becomes particularly evident in disruption conditions, where additional lane capacity significantly accelerates recovery times.
The disruption analysis reveals an important trade-off between normal operating performance and resilience. Measures that restrict vehicle flows from the buffer area, such as Scenario 1, improve day-to-day queue management but slow down recovery after severe disruptions by limiting the rate at which the accumulated backlog can be reabsorbed. Conversely, infrastructure interventions that increase gate capacity improve both normal operations at the gate where they are applied and resilience in extreme events.
In conclusion, the most effective strategy for the Port of Trieste under normal operating conditions is the combined application of preventive flow monitoring from the buffer area (Scenario 1, threshold 30) and a moderate reduction in gate service times through digitization (Scenario 5, 5% reduction). This combination delivers meaningful improvements without requiring substantial infrastructure investment. To improve resilience against extreme events, these measures should be complemented by infrastructure projects to increase the number of access lanes, particularly at Gate 4, which would significantly reduce recovery times in the event of severe disruptions.
6. Discussion and Conclusions
6.1. Discussion
This study investigated how gate procedures in free ports can be managed more efficiently, using the Port of Trieste as a case study. The results confirm that the free port regime is not a neutral backdrop to gate operations but a direct determinant of their performance, introducing a layer of operational complexity that is not merely procedural but structural, as it derives from the legal status of the port gates as effective borders of European territory. This complexity manifests concretely in the data: the longer service times for Ro-Ro vehicles, which drive the congestion patterns observed at Gate 1, are a direct consequence of the non-EU customs procedures associated with the free port status, while the buffer area functions not merely as a logistical tool but as a regulatory buffer whose role is inseparable from the customs obligations governing vehicle access to the free zone. These dynamics would not exist in the same form in a standard port setting, making standard gate management frameworks insufficient to capture this layer of complexity. Managing the gate processes efficiently and in an integrated way is therefore not only an operational priority but also a regulatory and institutional one and requires an approach that starts from a rigorous understanding of the underlying customs processes before modelling queuing dynamics. The findings show that no single intervention is sufficient to produce significant improvements across all performance indicators. This result is consistent with the broader literature on port gate management, which highlights the multifaceted nature of congestion and the need for integrated approaches combining managerial, technological, and infrastructural measures. In this study, the combination of preventive flow monitoring from the buffer area and moderate reductions in gate service times through digitization proved to be the most effective strategy under normal operating conditions, delivering meaningful improvements without requiring substantial infrastructure investment. This finding aligns with recent evidence on the benefits of digital transformation in port gate operations, while also highlighting the limits of purely technological solutions when security checks remain a dominant factor in service times. The model proposed in this paper and the simulated scenarios offer a valid tool for the Port Authority to evaluate the impact of different choices and therefore to decide the priority of the investments related to the enhancement of port gates.
From a sustainability perspective, the improvements in gate management identified in this study have significant implications beyond operational efficiency. Reduced queue lengths and waiting times directly translate into lower vehicle idling times at and around the port gates, with consequent reductions in fuel consumption and exhaust emissions. At the same time, these improvements have a direct effect also on the working conditions of the involved stakeholders, such as port workers as well as truck drivers. Given the close integration between the Port of Trieste and the urban environment, these reductions have a direct positive impact on air quality and noise levels in the surrounding residential areas. Furthermore, more efficient gate management reduces the risk of traffic spillover onto urban roads, contributing to lower congestion and improved quality of life for local residents. These sustainability benefits reinforce the case for investing in integrated gate management solutions, particularly in urban port contexts where the port-city interface is a critical factor.
The results of this study should also be interpreted in the broader context of current global supply chain dynamics. The period analysed falls within a phase of significant restructuring of international trade flows, driven by a combination of factors including the aftermath of the COVID-19 pandemic, the ongoing conflict between Russia and Ukraine, and the disruptions caused by the partial closure of the Suez Canal. These events have introduced unprecedented volatility in freight flows through European ports, making the ability to manage disruptions and recover quickly a strategic priority. The disruption scenarios analysed in this study are therefore particularly relevant in this context: they demonstrate that infrastructure investments, while costly, provide a decisive advantage in terms of resilience and recovery speed under extreme conditions. This finding has implications beyond Trieste, suggesting that ports along the Adriatic-Baltic and Mediterranean corridors, which are increasingly important as alternative routing options in a restructured global supply chain, should prioritize resilience as a key dimension of their development strategies.
From a methodological perspective, the integration of BPMN and discrete event simulation proved to be a particularly effective approach for analysing the complexity of free port gate operations. While both methods have been used individually in port and logistics contexts, their combined application to a free port setting, where additional customs and security procedures introduce decision logic that is difficult to capture through simulation alone, represents a novel contribution of this study. The BPMN model ensured that the simulation faithfully reproduced the actual process logic, including the differentiated treatment of vehicle types and the role of the virtual traffic light system, while the simulation model provided the quantitative indicators necessary for scenario comparison. This methodological combination is particularly well-suited to contexts characterized by regulatory complexity, and could be applied to other free port settings or similarly complex logistics environments, as discussed further in
Section 6.3.
6.2. Conclusions
This study examined gate management in free port contexts, combining BPMN process modelling with discrete event simulation to analyse the current situation at the Port of Trieste and evaluate a range of managerial, technological, infrastructural, and disruption-related scenarios. The results demonstrate that the free port regime introduces a layer of structural operational complexity that standard gate management frameworks are not designed to address, and that effective management of this complexity requires integrated approaches combining multiple interventions rather than standalone measures. Infrastructure investments, while more costly, prove particularly valuable in improving port resilience under severe disruption conditions.
6.3. Limitations and Future Work
While the methodological approach developed in this study, combining BPMN process modelling with discrete event simulation to analyse gate operations and evaluate intervention scenarios, is transferable to other free port settings, the specific results and optimal intervention strategies identified for the Port of Trieste should not be applied directly to other contexts without recalibration. The effectiveness of each scenario depends strongly on context-specific factors that vary across free ports. In particular, the traffic composition at the Port of Trieste, characterized by a predominance of Ro-Ro vehicles originating from non-EU routes, which require longer and more complex customs procedures, is a key factor of the congestion patterns observed and may differ substantially in other free port settings with different cargo mixes. Furthermore, the geographical position of Trieste, whose land connectivity depends on a single overland corridor, poses specific resilience challenges that are not common to all free ports. Finally, the gate configuration is specific to this port and would need to be re-mapped through a dedicated BPMN analysis before the simulation framework could be applied elsewhere. The analytical categories used to structure the scenario analysis, i.e., managerial, technological, infrastructural, and disruption-related interventions, do however provide a reusable framework that can guide the design of similar studies in other free port contexts.
Several limitations of this study should be acknowledged. The three-month data collection period (January–March 2025) may not fully capture seasonal variations in traffic patterns, as freight flows at the Port of Trieste are subject to fluctuations throughout the year. The model assumes current traffic patterns and compositions, which may change over time in response to shifts in trade routes, regulatory changes, or port development projects. Additionally, the dataset for empty and private vehicles presented inconsistencies that required assumptions to be made, and the buffer area data did not allow the gate used by each vehicle to be accurately identified. Furthermore, the validation of the model was constrained by the absence of independent observed data on queue lengths at the port gates. While face validity was ensured through expert review and quantitative consistency was confirmed for vehicle volumes, future work should include a dedicated data collection campaign to measure queue lengths and waiting times directly at the gates over a representative period. This would allow a more rigorous quantitative validation of the model’s outputs and further strengthen its reliability as a decision-support tool.
Future developments of this study should address these limitations in several ways. Extending the observation period to cover a full year would allow seasonal patterns to be captured and the model to be recalibrated accordingly. Fleet management systems could be integrated to improve the prediction of container arrival times, which currently introduce uncontrolled variability into the gate queue. Finally, digital twin models could be developed to provide a continuous and dynamic representation of the port-buffer area system, enabling real-time monitoring and adaptive management of gate operations. Given the increasing volatility of global trade flows and the growing frequency of supply chain disruptions, such tools would represent a valuable contribution to the resilience and competitiveness of free ports in the current international context.