Article

Identifying Significant Meteorological Predictors for the Monthly Number of Hotspots in Brazilian Biomes


1
Department of Chemistry, University of Osijek, Cara Hadrijana 8A, 31000 Osijek, Croatia
2
School of Applied Mathematics and Informatics, University of Osijek, Trg Ljudevita Gaja 6, 31000 Osijek, Croatia
3
Faculty of Geotechnical Engineering, University of Zagreb, Hallerova aleja 7, 42000 Varaždin, Croatia
4
Institute of Physics, Federal University of Mato Grosso do Sul, Campo Grande 79070-900, MS, Brazil
*
Author to whom correspondence should be addressed.
Sustainability 2026, 18(7), 3363; https://doi.org/10.3390/su18073363
Submission received: 20 January 2026 / Revised: 21 March 2026 / Accepted: 26 March 2026 / Published: 31 March 2026
(This article belongs to the Section Air, Climate Change and Sustainability)

Abstract

Forest fires release various chemical compounds that directly degrade air quality and endanger human health. This study examines the occurrence of forest fires in six Brazilian biomes over a 22-year period (1999–2021). The primary purpose is to identify significant meteorological predictors for the monthly number of hot spots using a standardized statistical framework. Fire hotspots were identified using satellite thermal sensors (AVHRR and MODIS), and we employed a standardized negative binomial regression modeling approach to analyze the relationship between meteorological variables and fire hotspots in all six Brazilian biomes simultaneously, providing a comprehensive comparative perspective often lacking in studies focused on isolated regions. The results show that the Amazon and Cerrado biomes have the highest absolute number of fires, which is consistent with their size and vegetation structure. To avoid bias associated with biome size, fire occurrence was additionally estimated using hotspot density normalized by biome area (hotspots per km2). Using these models, significant factors for fire occurrence were identified, namely the main meteorological variables—temperature, precipitation and wind speed. By comparing the performance of the models in different biomes, we aimed to better understand regional fire dynamics. The model’s ability to predict the expected number of fires based on these variables provides a key tool for preventive air quality monitoring. Such a predictive model serves as a basis for developing early warning systems, assessing potential health risks for the population, and adopting targeted fire management policies.

1. Introduction

Throughout history, fires have been a natural phenomenon that has affected biodiversity and ecosystem dynamics, and today, forest fires have a negative impact on the environment, with multiple and long-term consequences. With the increase in human activity and climate change, the number of fires has increased and their intensity has changed globally, leading to changes in land succession, vegetation type and the amount of combustible biomass [1,2,3,4]. More frequent and intense fires have resulted in changes in biodiversity, degradation of soil and water quality, and disruption of biogeochemical cycles and climate [5,6,7]. Sometimes fires cover large areas and are difficult to control, leading to significant economic losses, from agriculture and forestry to water resources, and posing a risk to human health, especially in regions with frequent fires [8]. One of the most critical consequences of fires is air pollution, which directly affects human health. During fires, chemical species such as particulate matter, nitrogen oxides (NOx), carbon monoxide and carbon dioxide, and volatile organic compounds (VOCs) are released, altering atmospheric processes and contributing to aerosol formation and wet deposition [9,10,11,12,13,14].
Fires can be caused by human activity and spread uncontrollably, especially under extreme weather conditions such as high air temperatures, lack of precipitation and low air humidity [15]. Although anthropogenic activities are the main cause of fire outbreaks in most Brazilian biomes, meteorological conditions influence fuel flammability and further spread of fires. The relationship between climate variability and fire dynamics is further shaped by the vegetation structures characteristic of individual biomes, from the humid Amazon rainforest to the fire-adapted savannas of the Cerrado. Therefore, understanding meteorological predictors is not only important for atmospheric chemistry research, but also for determining the areas where human-caused fires are most likely to develop into major ecological disasters. A better understanding of the relationship between meteorological parameters and hotspot occurrence is essential for identifying periods of increased fire risk and developing effective mitigation strategies.
Various methodologies have been developed for assessing and predicting wildfires, from remote sensing techniques to advanced machine learning algorithms, as reviewed in [16]. Although these methods offer high predictive power, they often require extensive computational resources. In this study, we employ a statistical approach using negative binomial regression, which provides a robust framework for count data while maintaining the interpretability of individual meteorological predictors. Unlike the standard Poisson approach, this model effectively addresses the problem of overdispersion inherent in wildfire data, providing more reliable estimates of environmental risk.
The highest number of fire hotspots in South America occurs in Brazil [17]. In the Cerrado biome, fire plays a key role in maintaining ecosystems in which fire-resistant plants have evolved. However, large fires have destroyed large areas in the past not only in the Cerrado, but also in the Amazon [4] and the Pantanal [18]. These three biomes experienced significant forest fires during the dry seasons of 2019 and 2020, although these years were not as dry seasons in the Amazon compared to the severe droughts of 2005, 2010, and 2015. In 2019, smoke from forest fires in the Amazon was first detected in São Paulo, the largest city in South America, located more than 2.7 thousand kilometres southeast of the affected area. In 2020, fires have already severely affected the Pantanal biome, burning a third of its surface area [4,18].
Although many existing studies focus on isolated regions or individual biomes, an integrated study that applies a consistent methodology to all Brazilian regions simultaneously is lacking. To fill this gap, the primary purpose of this study is to identify significant meteorological predictors of the monthly number of hot spots in the Amazon, Cerrado, Pantanal, Atlantic Forest, Caatinga, and Pampas. Using a 22-year longitudinal dataset (1999–2021) and a standardized negative binomial regression framework, we aim to quantify the specific contributions of variables such as air temperature, precipitation, evaporation, and wind speed. This long-term longitudinal perspective allows for a comprehensive comparison of how meteorological variables vary across different ecological landscapes, providing a robust basis for regional fire risk assessments. Although air pollution is a key consequence of wildfires, this quantitative analysis focuses exclusively on identifying meteorological drivers that control fire occurrence, thereby establishing a basis for future predictive monitoring of air quality and public health.

2. Materials and Methods

2.1. Study Area

The study area comprises six Brazilian biomes: Amazon, Atlantic Forest, Cerrado, Caatinga, Pampa and Pantanal. Figure 1 is a schematic map and is intended only for biome localization. These biomes cover the entire country, with the Amazon occupying the largest part (49.3%), followed by Cerrado (23.9%), Atlantic Forest (13.0%), Caatinga (9.9%), Pampa (2.1%) and the smallest part, the Pantanal (1.8%) [19].
Amazon biome: The Amazon biome is one of the largest river basins in the world and is home to over 2500 tree species, a third of the world’s tropical timber and over 30,000 plant species (MMA 2022). In Brazil, the Amazon biome covers 4,100,000 km2 in the northern region, where dense, ombrophilous forests predominate. According to the Köppen classification updated by Alvares et al. 2013 [20], the climate falls into category “A” with four main subclimates: tropical monsoon (Am), dry and humid tropical climate (Aw), rainy equatorial climate (Af) and hot tropical humid climate (AS).
Cerrado biome: The Cerrado is a large ecoregion of tropical savannah that stretches across the highlands of eastern and central Brazil. This biome is the source of the three largest hydrographic basins in South America, which have a high groundwater potential. According to the [21], the Brazilian Cerrado is the most biodiverse and endemic savannah in the world, with 11,627 native plant species. As per the Köppen climate classification, the Cerrado is predominantly tropical-seasonal (Aw) with rainy summer and dry winter. The more recent classification by [20] MMA 2022 divides the Cerrado into seven climatic subtypes: temperate climate with mild summer (Cfb), subtropical climate with hot summer (Cfa), high altitude climate (Cwb), hot semi-arid climate (BSh), humid subtropical climate (Cwa), tropical climate with dry winter (Aw) and humid and sub-humid tropical climate (Am). This climate division, based on the updated Köppen–Geiger classification of Alvares et al. (2013) [20], is significant for the analysis of the heterogeneous fire patterns observed in our results for the Cerrado biome.
Atlantic Forest Biome: The Atlantic Forest covers more than 17 Brazilian states and stretches partly along the Brazilian coast. Its forests consist of dense ombrophilous forests, mixed and open forests, seasonal deciduous forests and broadleaf forests and are home to around 20,000 plant species, corresponding to about 35% of Brazil’s total plant diversity, including numerous endemic and endangered species. According to the Köppen climate classification, the Atlantic Forest has a humid tropical climate that is directly influenced by the air masses from the Atlantic Ocean [21]. The climate classification by Alvares et al. 2013 [20] identifies eight climatic subtypes within this biome: temperate climate with mild summer (Cfb), subtropical climate with hot summer (Cfa), high altitude climate (Cwb), hot semi-arid climate (BSh), subtropical humid climate (Cwa), tropical climate with dry winter (Aw) and humid tropical climate, subhumid climate (Am) and humid or superhumid tropical climate (Af). The specific environmental characteristics of the Atlantic Forest are essential for interpreting the importance of the predictors, as high humidity levels in this biome significantly reduce the risk of temperature-induced fires.
Caatinga biome: The Caatinga biome is located in the north-east of Brazil and borders the Atlantic coast. Around 27 million people live here, many of whom depend on the natural resources of this biome for their livelihood. The biodiversity of the Caatinga supports a variety of economic activities, particularly in agroforestry and industry, including the pharmaceutical, cosmetics, chemical and food industries. The landscape is characterized by steppe savannah vegetation, consisting mainly of low trees and shrubs that shed their leaves during the dry season (deciduous tree species), with a large variety of cacti. According the Köppen classification, the Caatinga has a tropical semi-arid climate, which includes three subtypes: warm semi-arid climate (BSh), hot desert climate (BWh) and tropical climate with dry winter (Aw) [21].
Pampa biome: The Pampa biome is characterized by low grassland vegetation in flat terrain. It occurs exclusively in the southern region of Brazil and is home to a unique but not fully classified flora and fauna. The largest part of the Guarani aquifer, one of the most important groundwater reserves in the world, is located in Pampa biome. The Köppen climate classification, the Pampa has a temperate climate with an average temperature of 18 °C. It was recently reclassified as a subtropical climate with hot summers (Cfa) [21].
Pantanal biome: The Pantanal biome is the largest wetland in the world. It stretches across central and southern Brazil [21] and extends into parts of Bolivia and Paraguay. It is characterized by an extraordinary wealth of terrestrial and aquatic biodiversity, and the vegetation is very diverse due to seasonal flooding and different soil conditions. According to the Köppen climate classification and the update proposed by Alvares et al. 2013 [20], the Pantanal biome has a tropical climate with dry winters (Aw).
The study area encompasses all biomes with distinct seasonal patterns. In general, the rainy season in the Amazon and Cerrado biomes lasts from October to April, while the dry season, which is crucial for hotspots, prevails from May to September [20]. These periods are characterized by significant variations in monthly precipitation, which often falls below 60 mm during the peak of the dry season in the Cerrado. In contrast, biomes such as the Pantanal and Caatinga experience more concentrated dry periods, while the Atlantic Forest and Pampas show a more distributed pattern of precipitation throughout the year, although they remain vulnerable to fires during specific seasonal water shortages. These regional differences in the onset and duration of the dry season are key to explaining the temporal shifts in fire peaks observed across the country.

2.2. Data Collection

The meteorological variables analyzed come from the Geographic Information System of the meteorological database maintained by the National Institute of Meteorology (INMET) (https://portal.inmet.gov.br/, accessed on 25 March 2026), consisting of daily observations for the period from 1999 to 2021. Missing values were imputed using linear interpolation, applied only when they constituted less than 5% of the total data series.
The data of the environmental variables, in particular the number of hotspots, were obtained from the Imaging Division (DGI) of the National Institute for Space Research (INPE) Burning Program (https://www.gov.br/inpe/pt-br, accessed on 25 March 2026), and this division collects and processes satellite images from the AQUA satellites of the National Oceanic Atmospheric Administration (NOAA-12) and the National Aeronautics and Space Administration (NASA) using the Advanced Very High Resolution Radiometer (AVHRR) and Moderate Resolution Spectrometerradio (MODIS) sensors. Quality control included removal of industrial heat sources and standardization of detection thresholds to reduce false positives, following official INPE validation protocols.
The sensors were launched at different periods, resulting in temporal variability in fire detection ability, so area normalization was applied. The number of detected hotspots was normalized by biome area (hotspots per km2), and detection thresholds were standardized to reduce sensor-related bias.

2.3. Method

Count data models are a subset of discrete response regression models and are intended to explain the number of occurrences of an event. In this study, Poisson and a negative binomial model were used to model the relationship between the monthly number of hotspots and available predictors. It is concluded that the Poisson model is not appropriate for these data since the variance does not match the expectation, which is the basic assumption of the Poisson model. Specifically, the negative binomial model was preferred over the Poisson model due to the observed overdispersion in the fire count data (variance significantly exceeding the mean). Unlike the standard Poisson model, the negative binomial model includes a dispersion parameter that allows for more accurate standard errors and prevents underestimation of uncertainty in hot spot estimates. Therefore, the negative binomial model was chosen for the final modelling. The following climate variables were used as predictors: minimum and maximum monthly temperature (Tmin, Tmax), average monthly wind speed (S in m/s), monthly precipitation (Pr in mm), monthly evaporation (E in mm), and atmospheric pressure (p in kPa). Due to significant seasonality and time dependence, year (Y) and month (M) are also included as predictors.

2.3.1. Poisson Model

The Poisson model is the simplest model for counting data, and the probability mass function (PMF) for a Poisson is defined by:
P Y = y = e λ λ y y ! ,
where Y refers to the random variable of count response, y is from the set {0,1,2, 3, …} and λ > 0. A Poisson regression model is obtained by relating the mean of Y (i.e., λ) to a vector of independent variables (predictors) X, by λ(X) = Exp(X’β). Here β is a vector of regression coefficients to be estimated and X’ the transpose of the vector X. A characteristic of Poisson’s probability function (Equation (1)) is that the mean and variance are equal, i.e., Var [Y|X] = E [Y|X] = λ(X). When the data does not fit the Poisson distribution, it is usually the result of overdispersion, which means that the variance of the data exceeds the mean value.

2.3.2. Negative Binomial Model

A negative binomial model (NB) can be considered as a generalization of the Poisson model and addresses the issue of overdispersion by including a dispersion parameter to accommodate the heterogeneity not observed in the counting data [22]. The PMF for the negative binomial is given as follows:
P Y = y = Γ y + θ Γ y + 1 Γ θ θ θ + λ θ λ θ + λ y
where θ > 0 represents the dispersion parameter. As in the Poisson model, y is from the set {0, 1, 2, 3, …}, the mean is λ but the variance is λ + λ2/θ, thus allowing the variance to exceed λ. The NB model is obtained by relating the mean λ to a vector of independent variables in the same way as in Poisson regression: λ(X) = Exp(X’β).

2.3.3. Model Selection

The R programming language (v4.5.2) was employed for modelling purposes [23]. A range of criteria was applied to select the most suitable model. Initially, Poisson regression modelling was performed, with overdispersion tested through the sum of squares of standardized residuals and the chi-square test, as outlined in [24]. For this analysis, the R function check_overdispersion from the performance library was utilized [25]. Since overdispersion was confirmed in all Poisson regression models, the analysis proceeded using its generalized form, negative binomial regression.
To identify significant predictors for the monthly number of fires, the negative binomial models were compared using information criteria such as Akaike’s Information Criterion (AIC) and Bayesian Information Criterion (BIC). Additionally, an Analysis of Deviance was performed to compare nested models through likelihood ratio tests [26]. The glm.nb function from the MASS library (v7.3.65) in R was employed for the final modelling [27].

3. Results

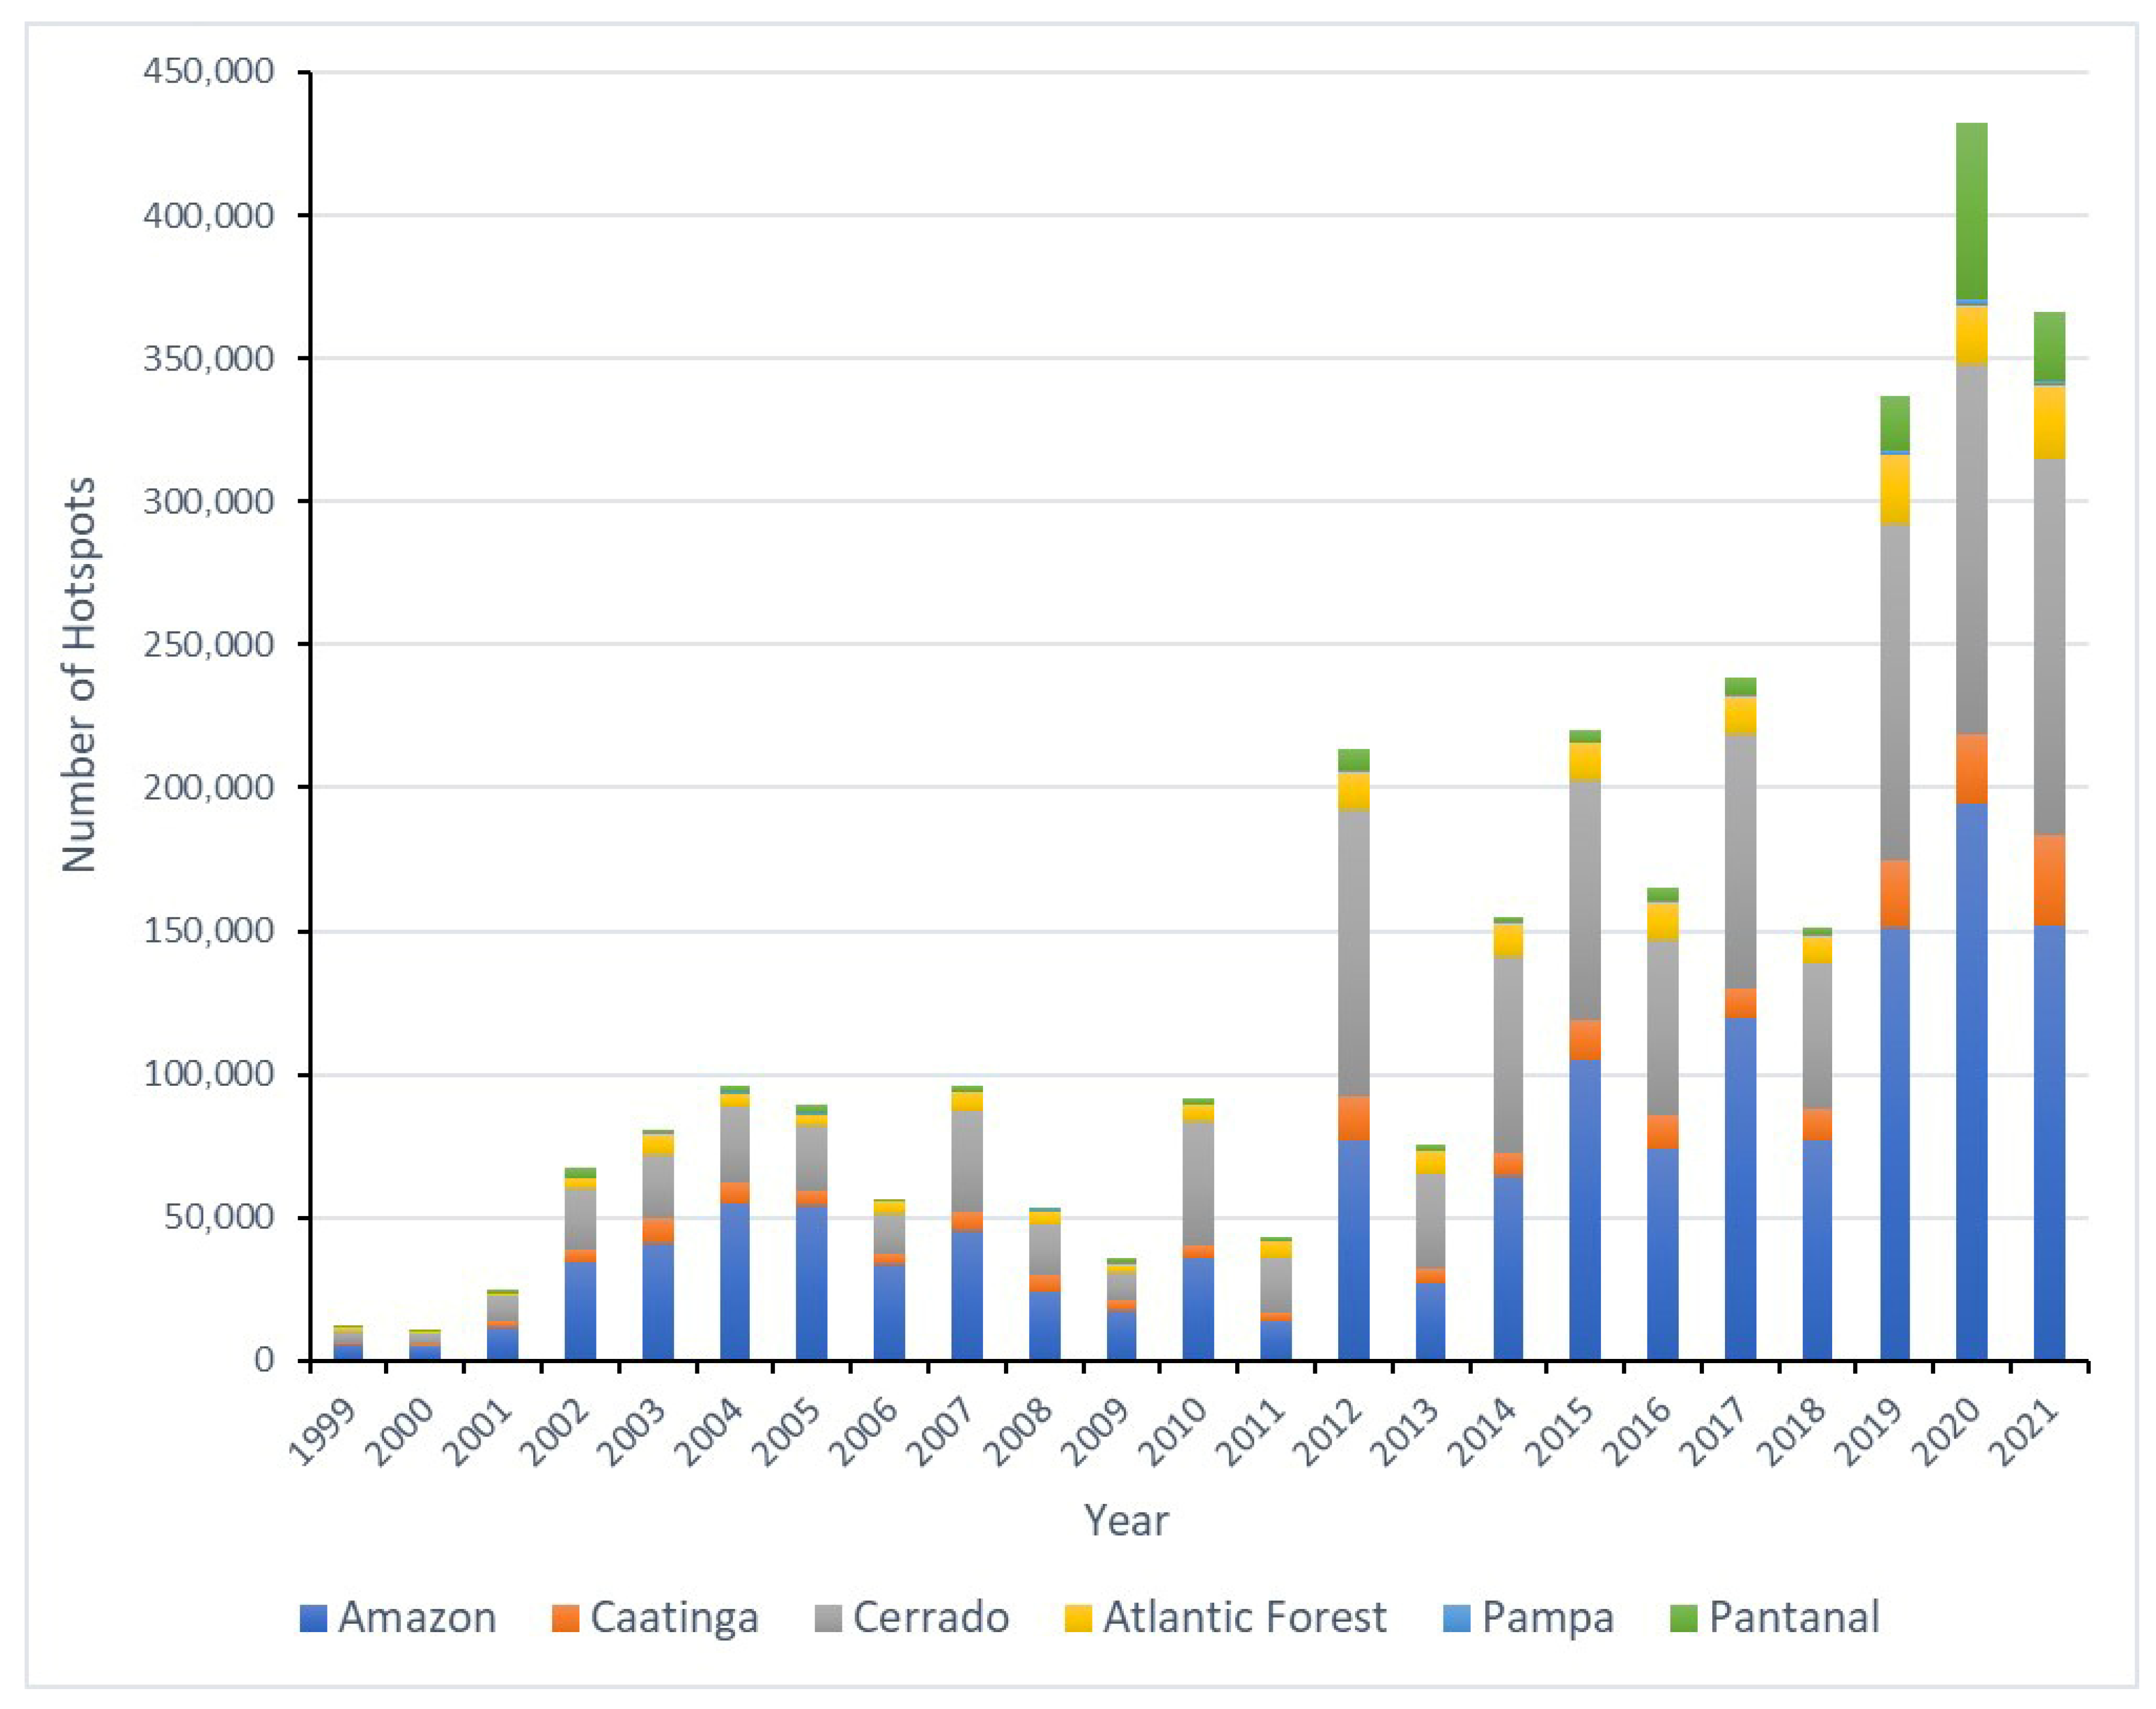
The burned area data in this study are used only for descriptive comparisons across biomes and are based on previously published satellite estimates cited in the literature. Burned area data were not included as predictors in the regression models, which were developed using meteorological variables only, and predictive modelling of hotspot occurrence can serve as an indicator for air quality degradation and health risk assessment. Among the Brazilian biomes, the Amazon and the Cerrado had the highest number of hotspots throughout the analyzed time series, with over 100,000 hotspots for the Cerrado in 2012, 2019, 2020, and 2021 and over 100,000 for the Amazon biome in 2015, 2019, 2020 and 2021 (Figure 2). Other biomes such as Pantanal, Caatinga, Atlantic Forest and Pampa also showed significant peaks, especially in the period from 2019 to 2021. The analysis shows annual fluctuations with periods of increase and decrease in the number of fires, with clear peaks in the last three years of the analysis.
The descriptive statistics for the number of hotspots in the studied Brazilian biomes are presented in Table 1. The data confirm that the hotspot distributions in all regions show significant positive skewness. This skewness, characterized by mean values that are significantly higher than the median, reflects a distribution where fewer hotspots are more common, but punctuated by occasional extreme fires during peak dry periods. Such a pattern of positive skewness is a consistent feature across all the different ecological regions studied.
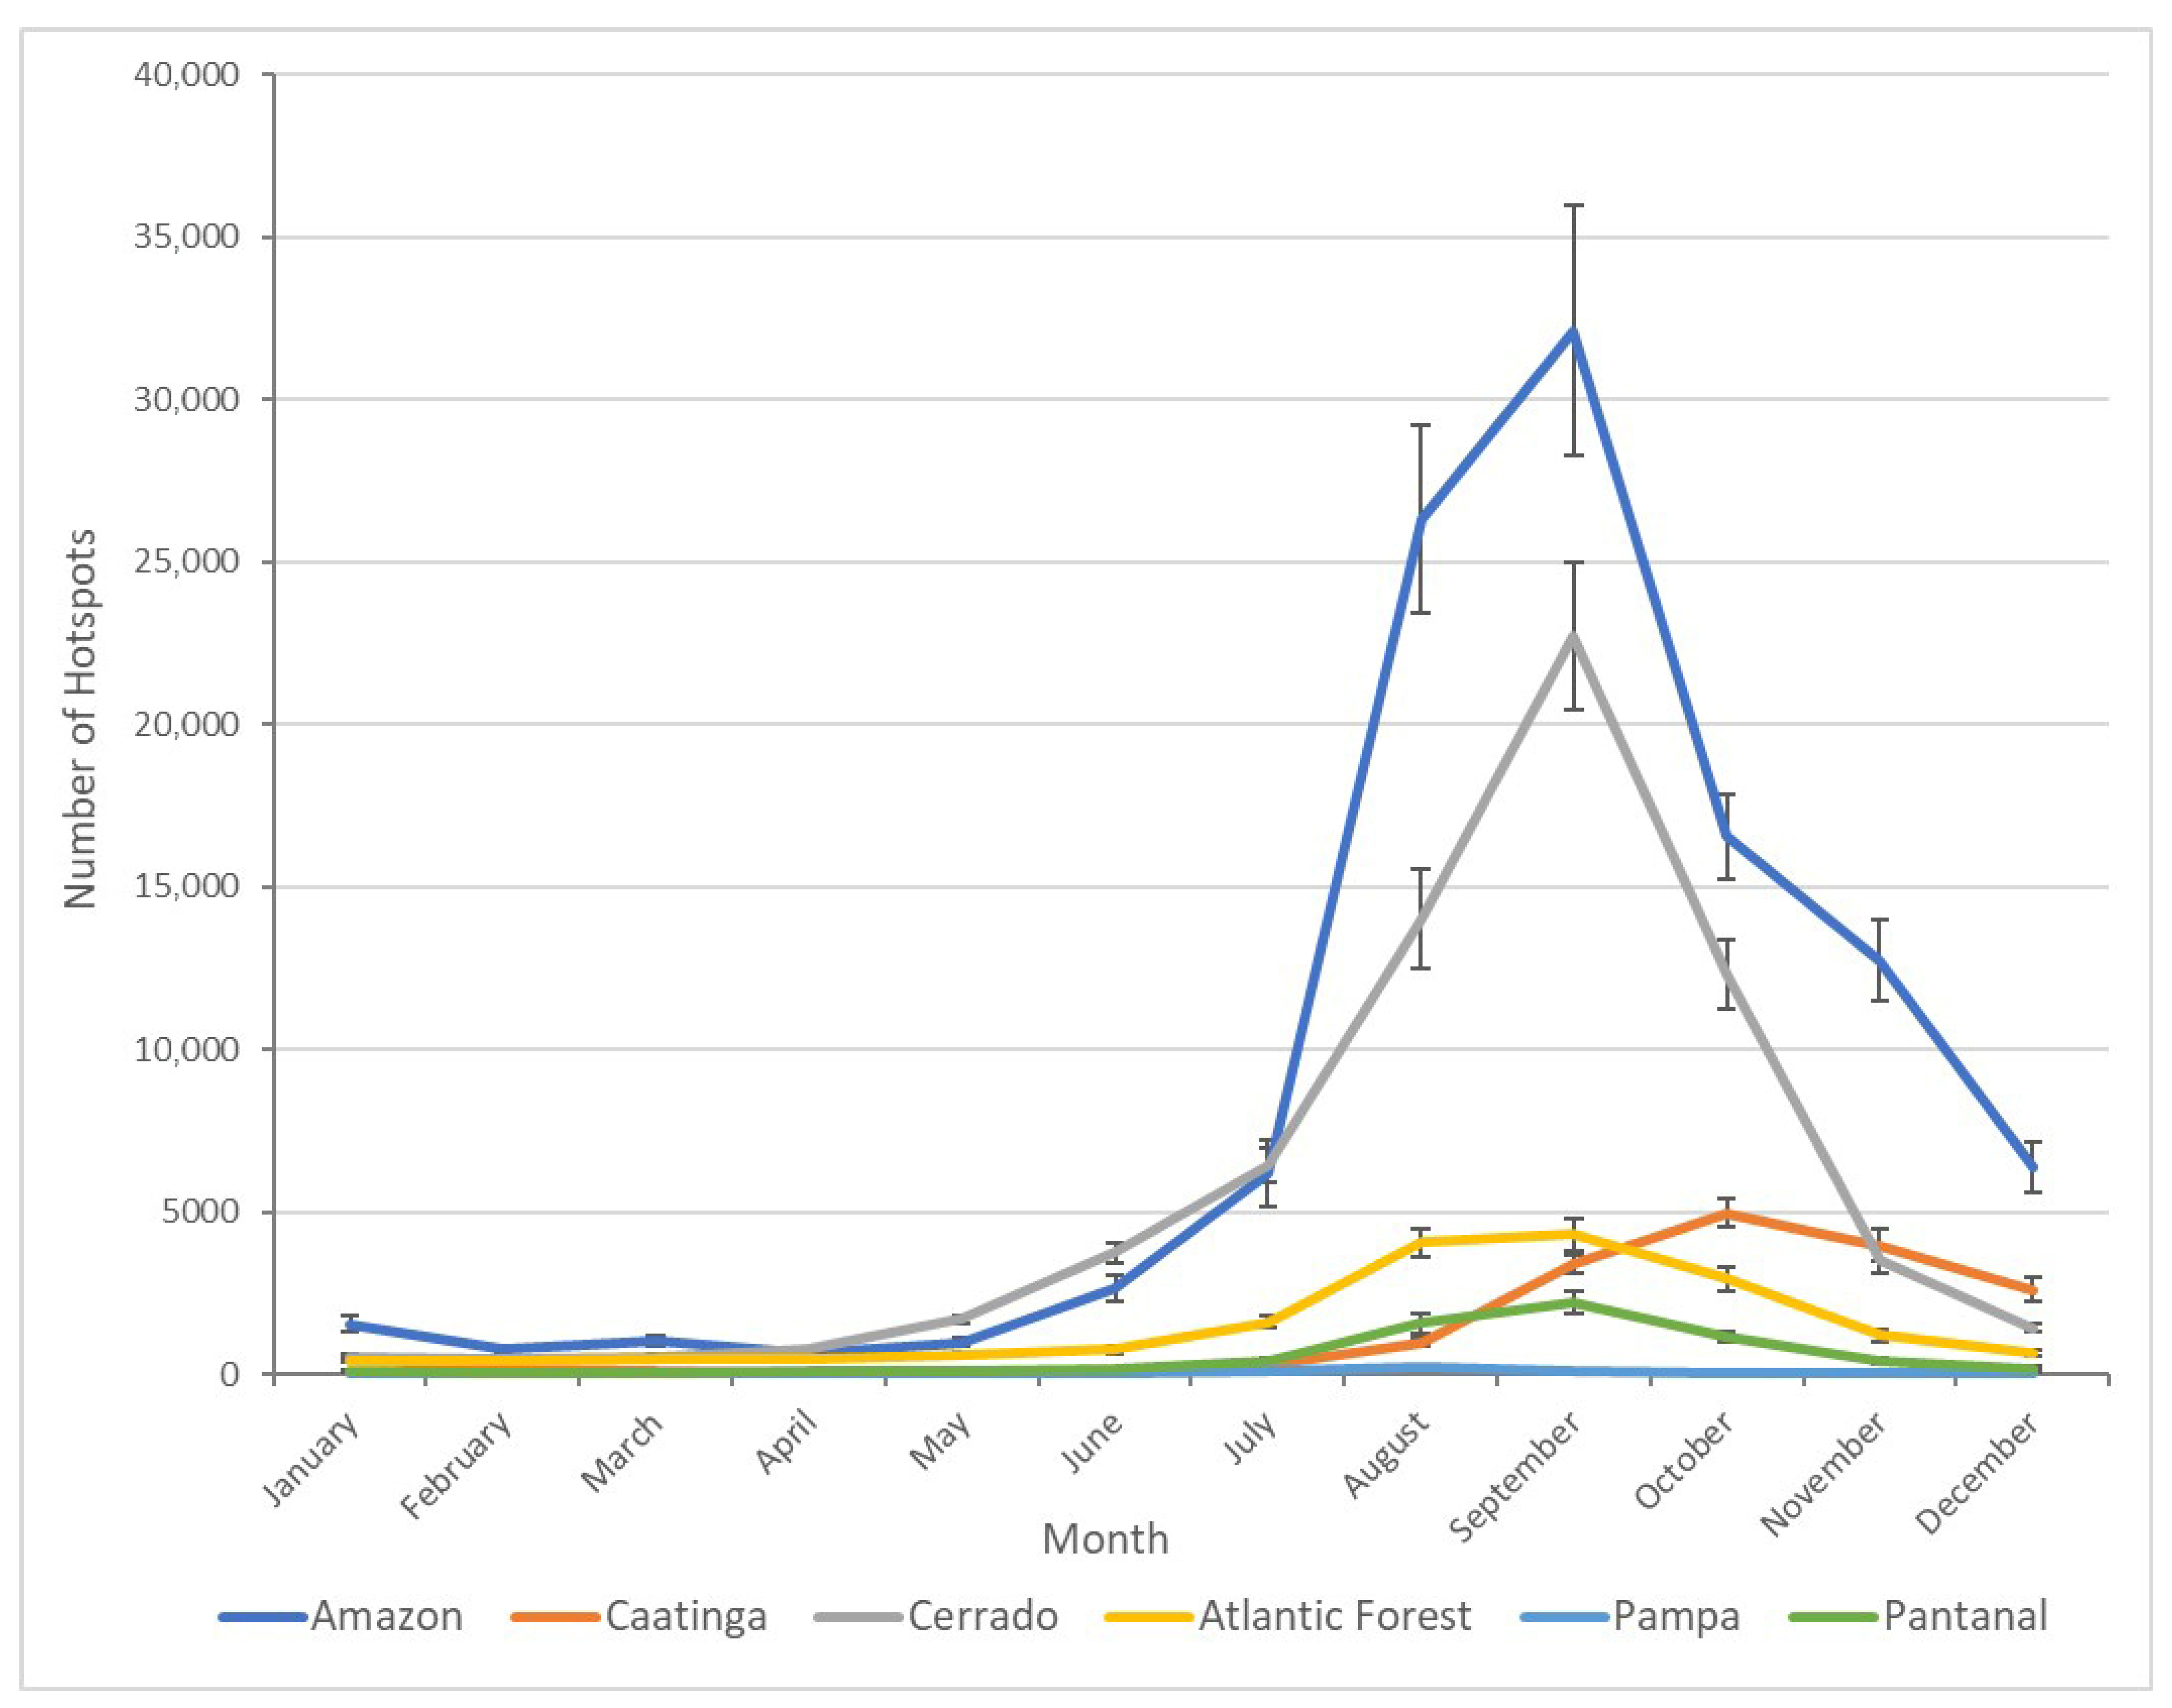
When evaluating the monthly occurrence of fires, it was found that the seasonal fluctuations in the average number of hotspots and burned areas are similar for all biomes (Figure 3 and Figure 4). Figure 3 shows the monthly fluctuations in the number of hotspots in all biomes during the observation period. Seasonal fluctuations are clearly visible, with the highest concentration of hotspots occurring in the dry months. For a better understanding, it is important to consider the long-term climatic context of the regions. For example, in the Amazon and Cerrado, a well-defined dry season, most often from May to September, is directly associated with the observed increase in fire activity. However, Figure 3 reveals that fire peaks often occur in September, although the lowest precipitation levels can be recorded earlier in the season. This difference can be explained by the cumulative moisture deficit in the vegetation, which becomes easily flammable only after several consecutive months of drought. Furthermore, the persistence of hot spots in the early rainy season (e.g., October) in some biomes likely reflects a lag effect where fires continue until soil moisture is fully restored by consistent rainfall. In the Amazon region, hotspots are most frequent between August and October, with a peak in September. In the Cerrado, the highest activity is similarly concentrated in the dry months from June to October, with fire peaks in September. The relatively small standard errors across the monthly data indicate that these seasonal peaks are consistent and recurring patterns within the 22-year time frame.
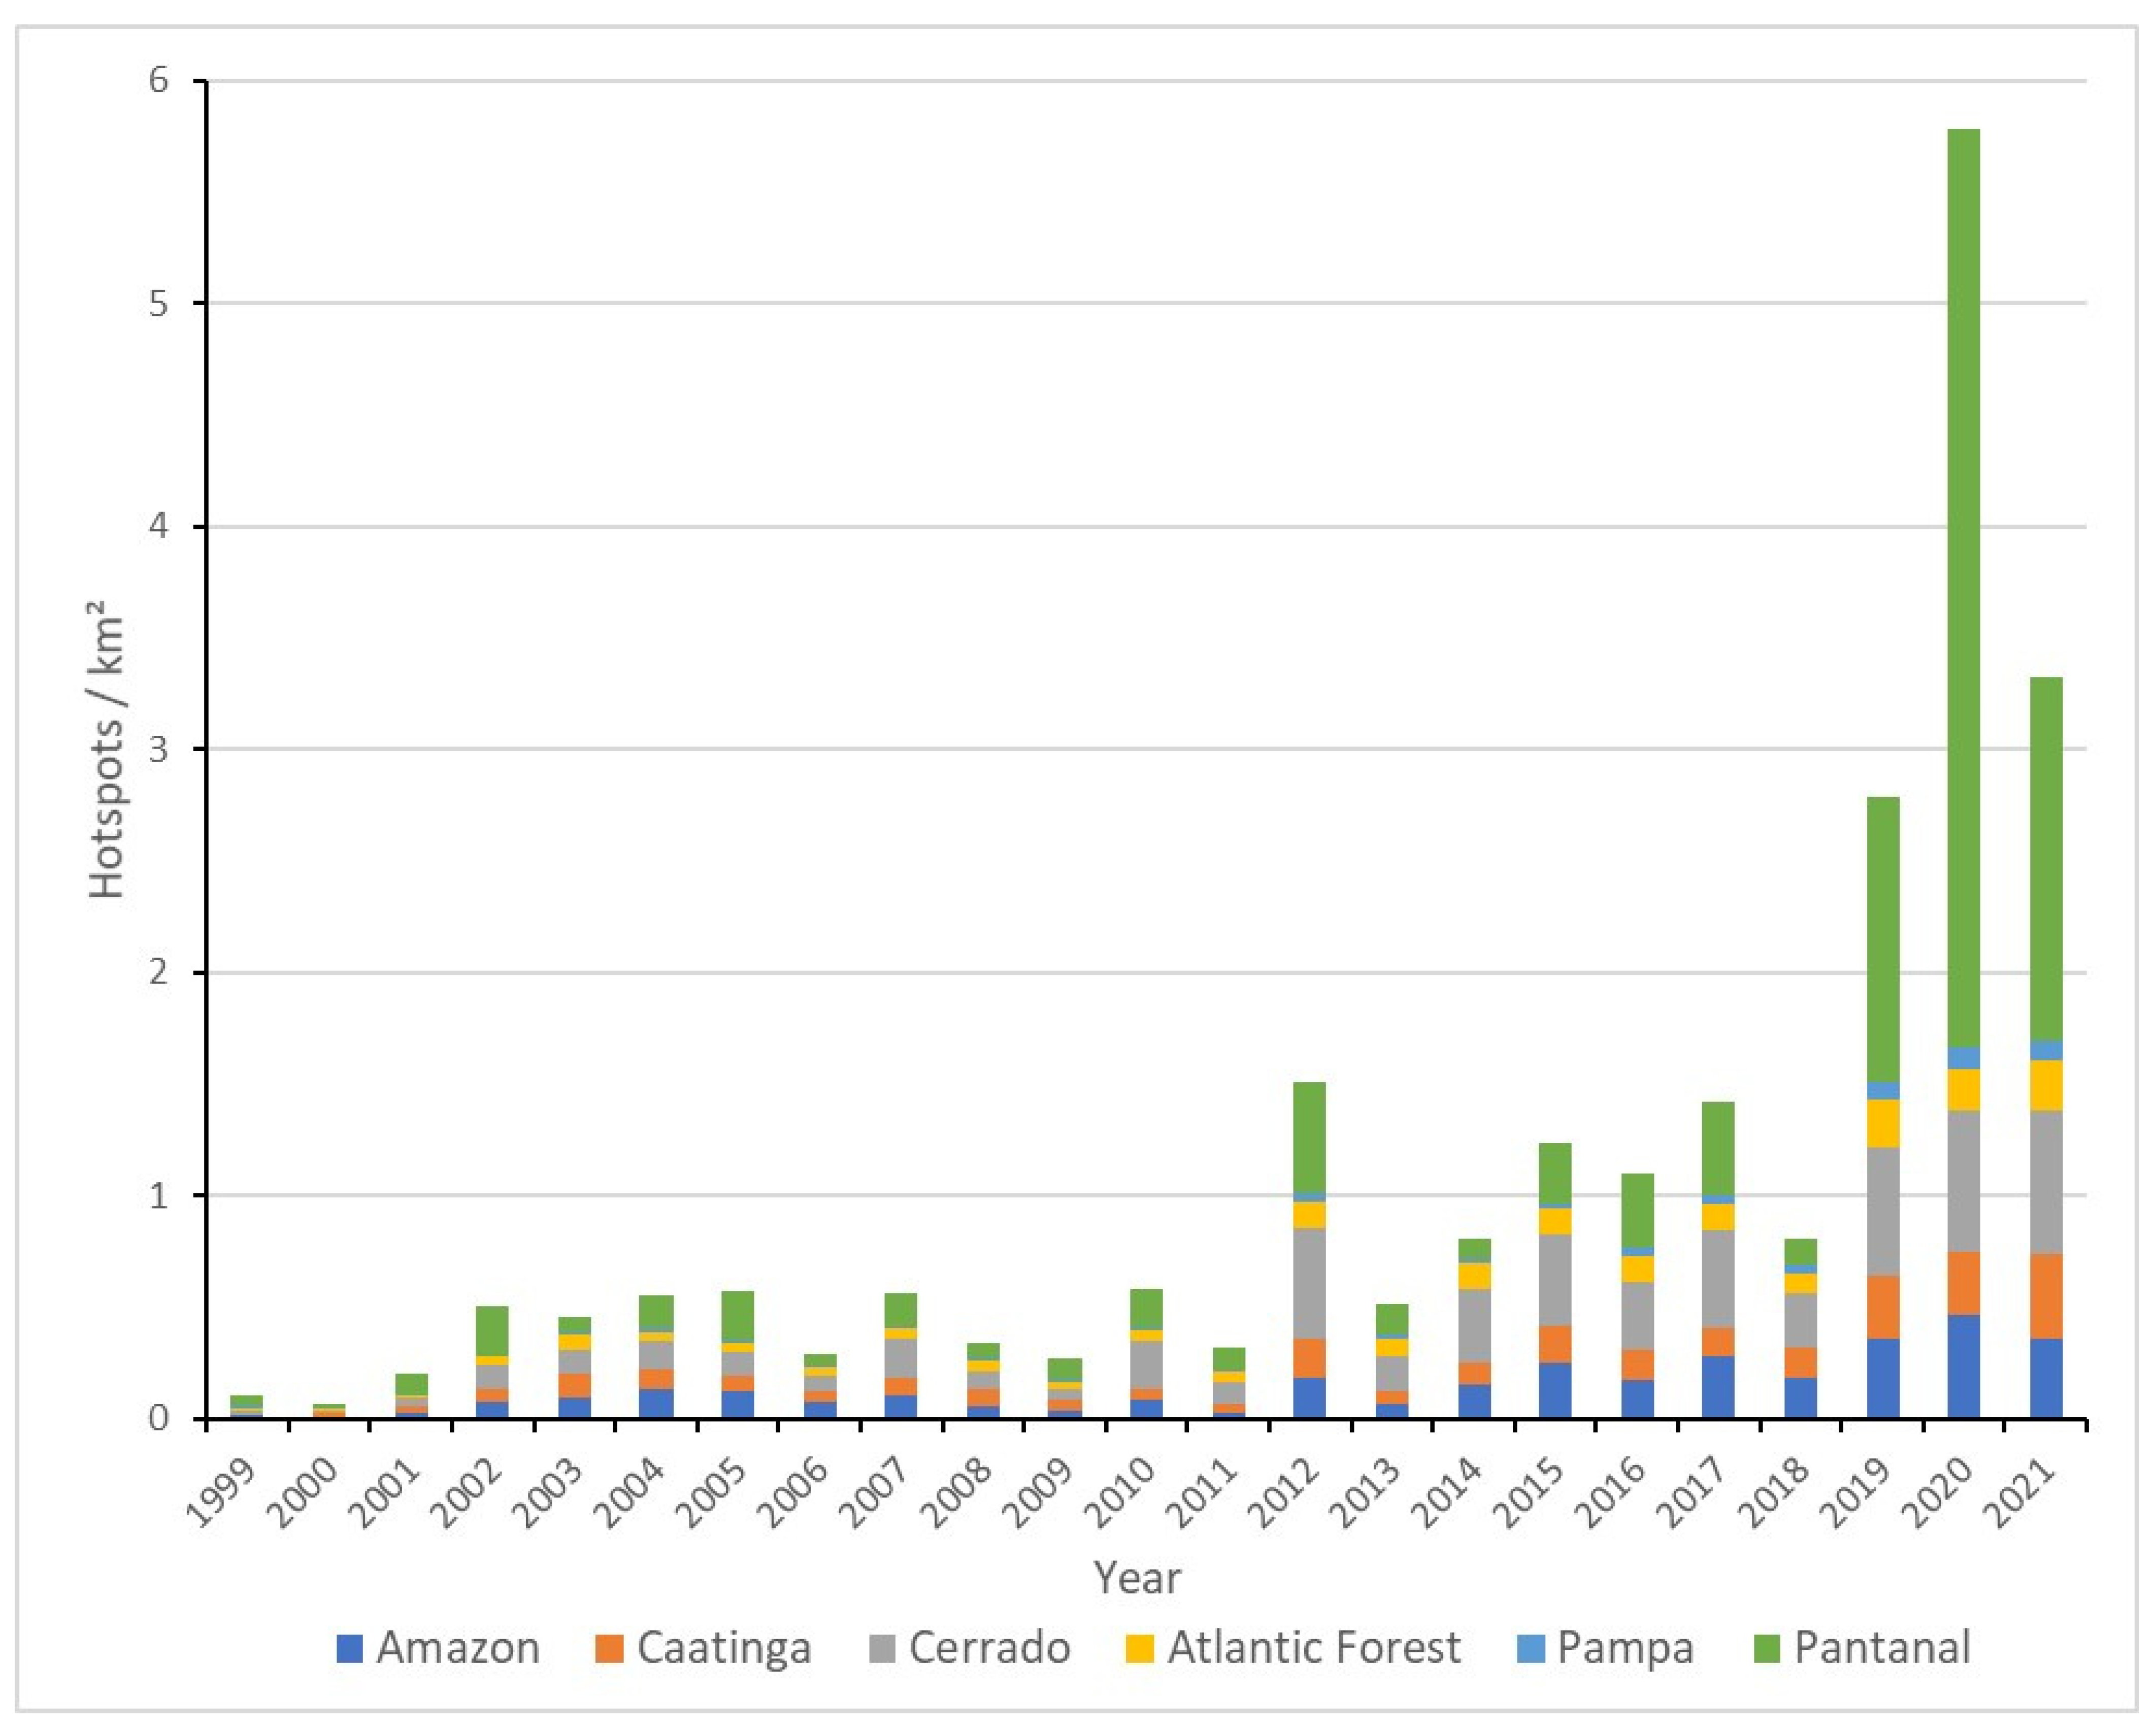
Figure 4 shows the density of hot spots normalized by biome area, not directly by burned area. Most fires occurred in the Amazon basin (46.3%) and in the Cerrado in the Brazilian savannah (28.6%), while in the Pantanal 13% of all fires occurred at the national scale, which is unprecedented. Following a period of relative stability between 1999 and 2011, fire density began to fluctuate more intensely, culminating in a historical peak in 2020 where they reached nearly 6 hotspots per km2. This surge highlights a significant shift in fire dynamics likely driven by a combination of changing land use, extreme climate conditions, and human activities.

Modelling Results

Previous analyses revealed significant differences in hotspot occurrence across biomes. Besides biome, the regions also vary significantly in size. The variable “area” represents the total area of each biome. Although it showed a moderate positive correlation with the number of hotspots, its removal in the reduced model did not reduce the predictive power, indicating that the climatic characteristics of each biome are more dominant predictors than size alone. A positive correlation between the number of hotspots and area size was confirmed (Pearson’s product-moment correlation = 0.325, with a 95% confidence interval of 0.280 to 0.369). This makes it reasonable to include area size as a predictor in the modelling process.
The initial model, built without interaction terms, used predictors such as year, month, area, precipitation, evaporation, pressure, air temperature, and wind speed. Table 2 presents the model’s quality measures. While we do not include the estimated coefficients of this model here, as more refined models were selected for prediction, some key insights from the modelling process are worth noting. One such insight concerns predictor selection. Since the predictors are not independent, some of their information overlaps. Therefore, a smaller model (which selects certain predictors from the larger model) is shown in the same table and is just as valid as the initial model. The likelihood ratio tests of the negative binomial models do not prefer the larger model (p-value 0.909). This suggests that removing evaporation and area as predictors does not compromise the model’s predictive accuracy.
The exclusion of area as a predictor in the smaller model is noteworthy. Area and biome are related predictors, and information about the area is captured through the biome. However, the biome has additional characteristics beyond size that significantly affect the number of hotspots. The smaller model confirms that the biome influences hotspot occurrence in ways not solely tied to its area.
In further modelling, it was found that introducing interactions between the biome and other predictors significantly improves the model’s fit. For instance, adding interactions between the biome and all other predictors to the smaller model from Table 2 results in a model where all interaction terms are statistically significant. The likelihood ratio tests for the negative binomial models strongly favour the model with interactions (p-value < 10−6).
The importance of these interactions, along with the fact that many predictors are highly correlated, suggests the need to build separate models for each biome. The selected models for each biome are presented and discussed below. The tables (Table 3, Table 4, Table 5, Table 6, Table 7 and Table 8) show the values for the logarithm of the Incidence Rate Ratio (IRR), the standard error (Std. Err.) of the estimated coefficients, and the p-value from the z-test, which tests whether the corresponding coefficients are statistically significantly different from zero. To provide a practical interpretation of these statistical measures, it is important to note how the IRR relates to actual fire risk. For example, in the Amazon biome (Table 3) the positive coefficient indicates a strong sensitivity to temperature. Specifically, the IRR for maximum temperature (Tmax) suggests that a 1 °C increase during the dry season is associated with more than a twofold increase in the expected number of hotspots, holding other variables constant. The large magnitude of some of the interaction coefficients, particularly during peak dry season months such as September, indicates a strong nonlinear fire response when the ecosystem approach critical flammability thresholds. During such periods, even small increases in temperature can lead to substantial increases in fire activity, which is captured by the negative binomial model through elevated interaction terms.
As noted above, meteorological variables exhibit strong correlation and pronounced seasonality; therefore, some degree of multicollinearity is to be expected in the fitted models. Indeed, all models showed evidence of multicollinearity to a certain extent. For illustration, in the Amazon model the adjusted generalized variance inflation factors ( G V I F 1 2 D f ) for selected meteorological variables were 1.97 for precipitation, 6.25 for Tmax, and 3.29 for evaporation. However, these variables were retained due to their distinct physical interpretation, and coefficient estimates remained stable in sensitivity analyses.
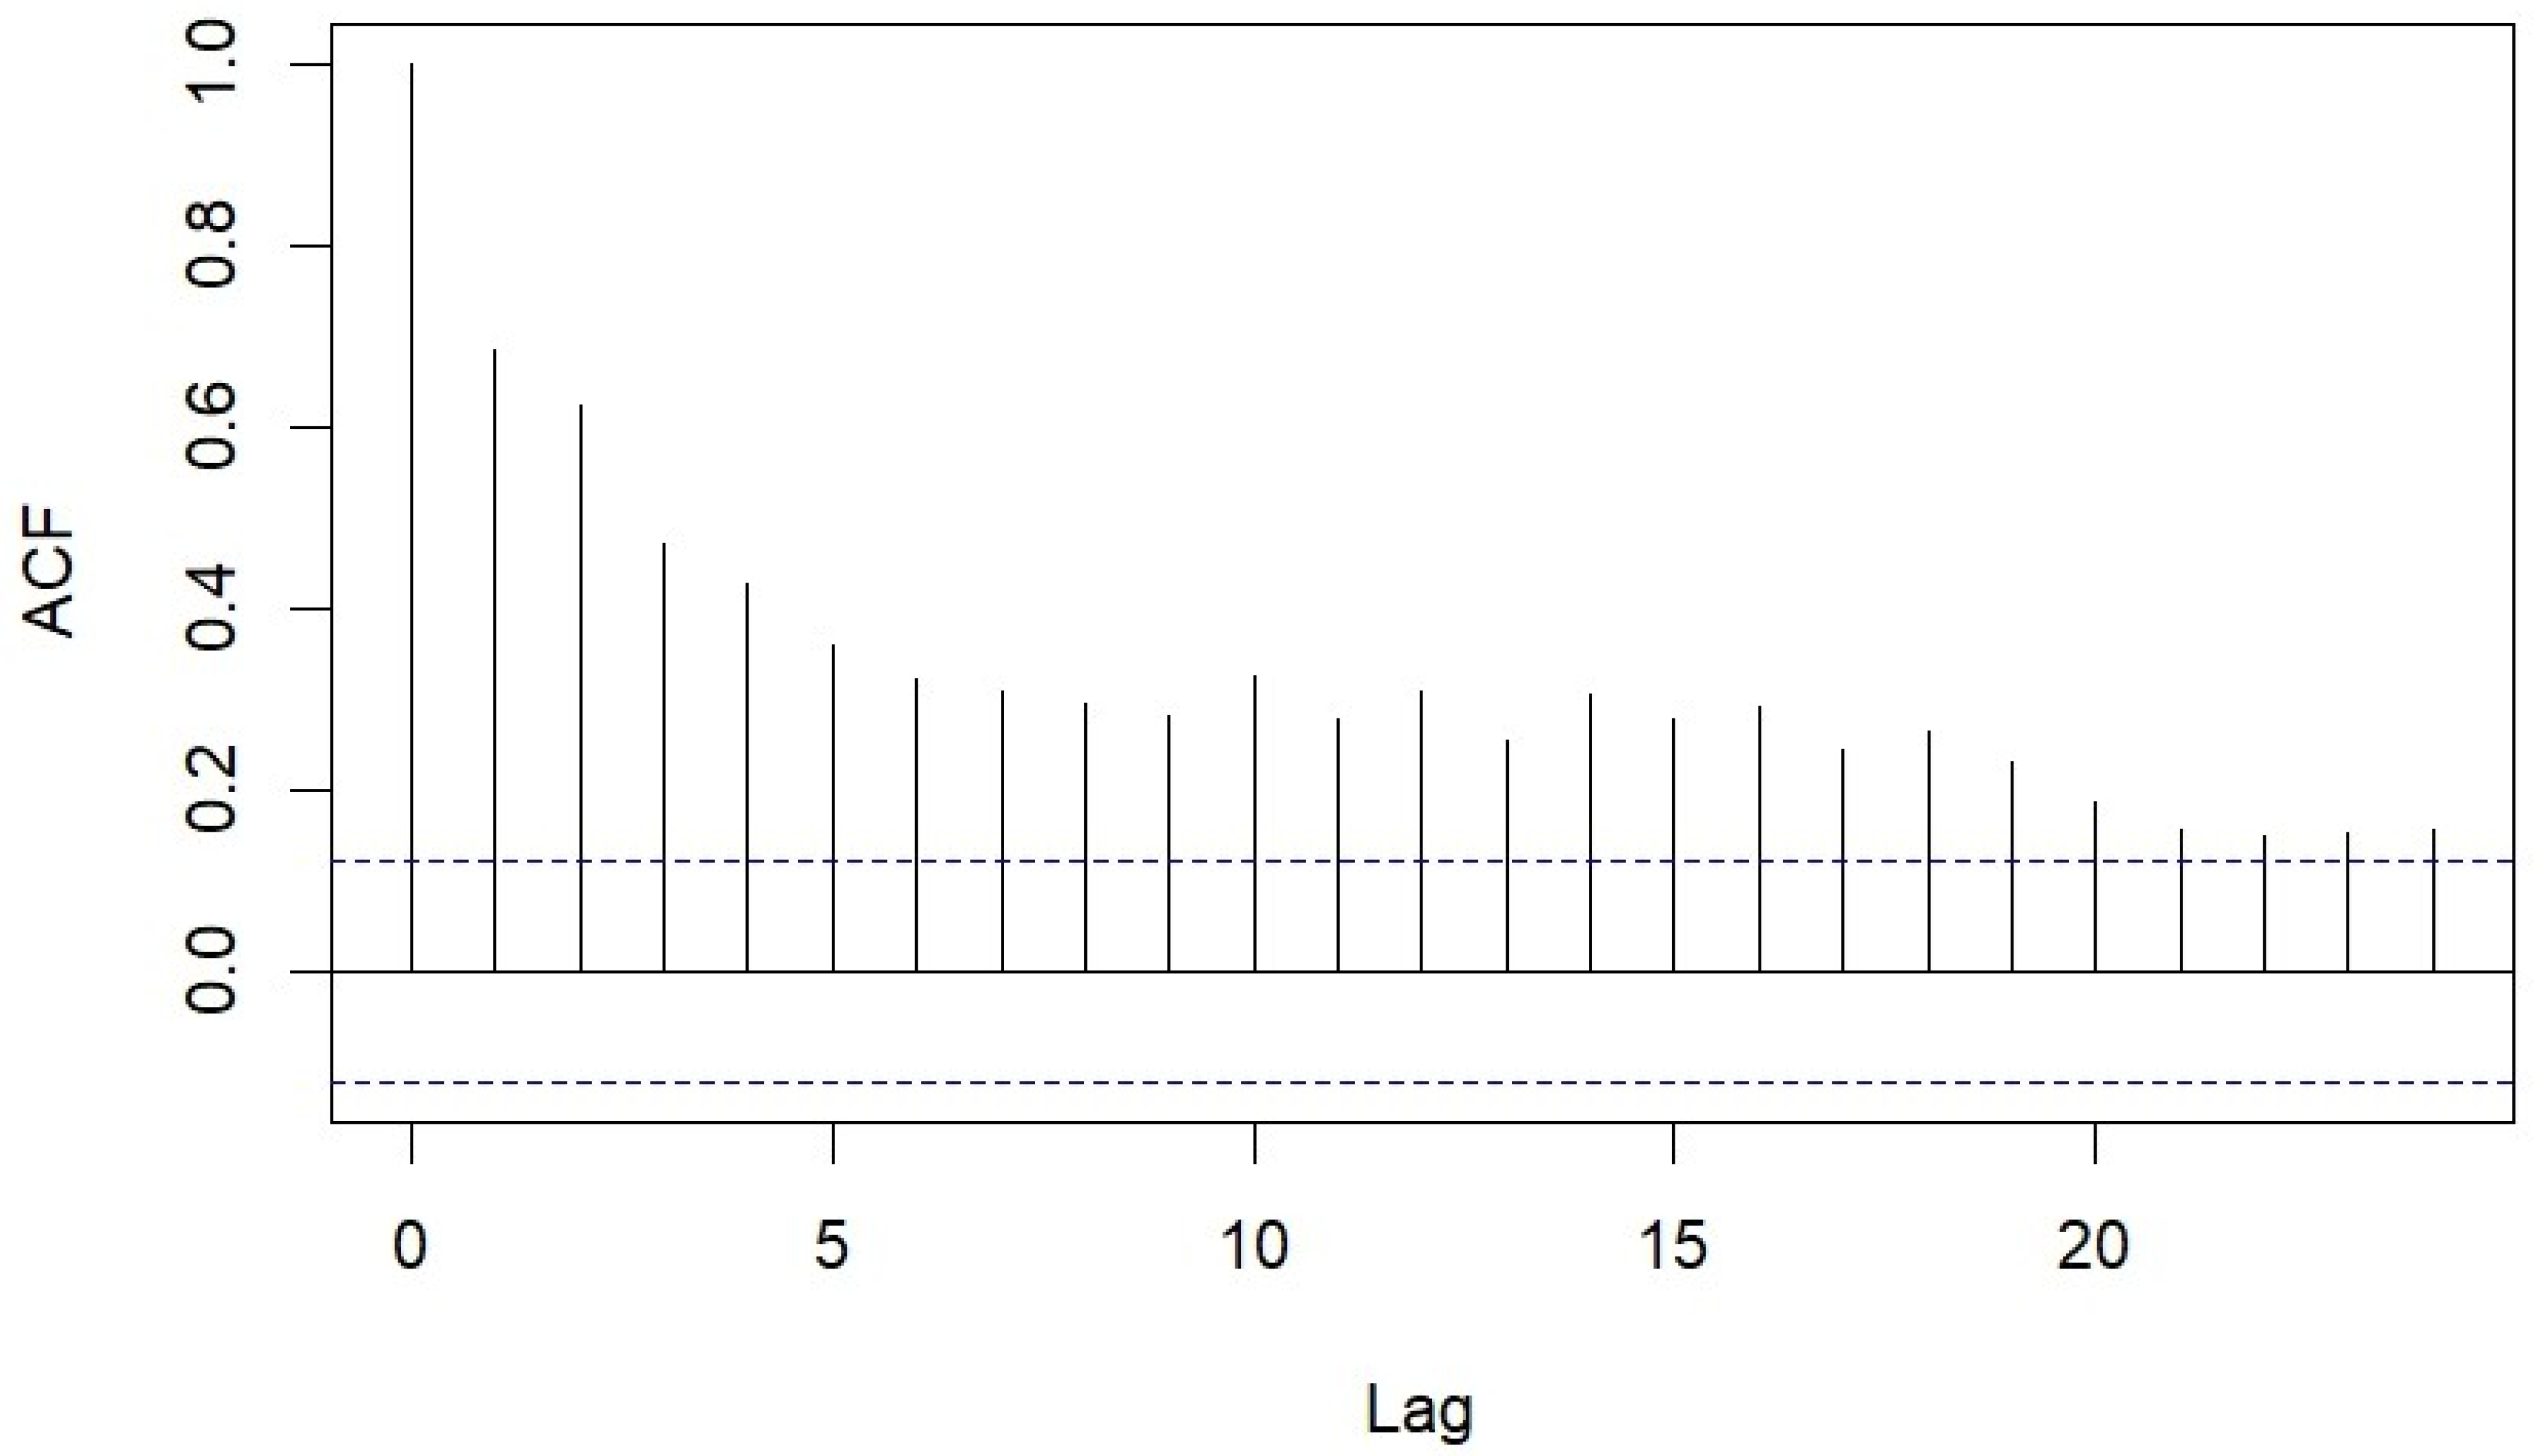
Residual diagnostics indicated the presence of temporal autocorrelation. The autocorrelation function (ACF) of Pearson residuals for the Amazon model is shown in Figure 5, while the Ljung–Box test suggested a departure from complete independence (χ2 = 670, df = 21, p < 10−16). Similar patterns were observed across the other fitted models. Although some residual autocorrelation was detected, the primary aim of the analysis was to estimate associations between meteorological variables and fire incidence rather than to develop a fully specified time-series model. The inclusion of the categorical month variable accounted for the dominant seasonal pattern, and the main conclusions were robust to the observed level of temporal dependence.
The results of the analysis of fires in the different Brazilian biomes (Table 2, Table 3, Table 4, Table 5, Table 6, Table 7 and Table 8) show a strong relationship between the occurrence of fires and specific climatic conditions. Using the models developed for each biome, key variables were identified that significantly influence hotspot occurrence. In the Amazon biome (Table 3), the risk of a high number of hotspots is particularly high in the months with high temperatures. The peaks in fire activity were recorded in August and September, which coincides with the dry period in this region. The correlation between the maximum temperature and certain months is also significant, indicating that the hot months are the main driver of hotspots in this biome. In the Cerrado biome (Table 6), which is known for its fire resistance, the highest fire hotspot occurrence was recorded in the dry months (especially July, August, and September), which is expected for a savanna area where fires occur naturally as part of ecosystem processes. However, the evaporation and low precipitation further contribute to the dryness of the soil, which increases the risk of fires spreading. The Pampa and Caatinga biomes (Table 4 and Table 5) show a different influence of climate variables on fire hotspot counts. In the Pampa, a strong correlation was found between lower atmospheric pressure, precipitation and fire risk, while in the Caatinga, precipitation has a negative effect on the number of hotspots, which is to be expected as higher precipitation reduces the amount of dry vegetation. In the Pantanal (Table 8), fire activity is associated with high temperatures and low precipitation. Seasonal flooding occurs here; on the other hand, the Pantanal is also prone to dry periods and the vegetation becomes highly flammable, allowing fires to spread quickly, thus increasing hotspot occurrence and affect biodiversity.
The results show that the occurrence and intensity of hotspots in these biomes depend not only on climatic conditions but also on the characteristics of the environment, which are different for each biome. The interactions between temperature, precipitation and evaporation are important for determining the seasonal patterns that indicate a higher fire risk during the dry season, and the results obtained will help in the development of fire management strategies for each biome, allowing better land management and better preparation for the peaks of the season.
Table 9 shows the differences in climatic conditions between all biomes, and it is clearly seen that the median and quartile values of the most important climatic variables significantly affect hotspot occurrence. In the Cerrado and Caatinga biomes, the dry season predominates, and here, as expected, high temperatures and low precipitation significantly affect the occurrence of fires, while the Atlantic Forest, where precipitation is more frequent, is less sensitive to fires; however, anthropogenic activities, such as agricultural expansion, may further exacerbate fire risk in this region.

4. Discussion

The analysis of fire dynamics across Brazilian biomes from 1999 to 2021 indicates a pronounced seasonality in fire occurrences across all observed biomes. Hotspots occur most often during the dry months, which is directly related to climatic conditions and increased vegetation dryness [28]. The Amazon and Cerrado dominate the total number of hotspots, with activity peaking in September. In the Amazon, the most intensive period is recorded from August to October, as previously demonstrated in the study by Vasconcelos et al. (2013) [29]. The significant interaction between maximum temperature (Tmax) and specific months of the dry season (e.g., September) in the Amazon model provides statistical confirmation of the phenomenon of “cumulative water deficit”. Our results indicate that forest sensitivity to temperature increases nonlinearly as the dry season progresses. This is consistent with the findings of Aragão et al. (2018) [30], who point out that drought associated with climate variability can promote fire spread even during periods of reduced deforestation, as accumulated heat stress drastically increases biomass flammability. This suggests that by late winter the moisture content of the fuel falls below a critical threshold, as confirmed by the high IRR values in our model.
The corresponding Standard Errors, shown in Figure 3, reach their maximum during these specific months, indicating significant interannual variability. This is further reflected in the high IRR values for the Sep × Tmax interaction (Table 3), which show how the synergistic effect of heat and seasonal dryness increases fire occurrence. High standard error values in the Amazon during September suggest that extreme climatic events in certain years drastically affect the number of hotspots, making this biome the most sensitive to annual oscillations in precipitation.
In the Cerrado, fires are also most frequent in the dry months from June to October, but with varying months of intense activity, as observed by Araújo and Ferreira (2015) [31], and with fire peaks in September, which was confirmed by Alvarado et al. (2017) [32]. The presence of pronounced error bars on Figure 3 indicates that these ecosystems are also prone to large fluctuations depending on the intensity of drought. In contrast, biomes such as the Pantanal, Pampa, and Atlantic Forest show significantly lower levels of activity and smaller standard errors. During the rainy season from January to May, the standard error for all biomes is minimal, indicating high stability and predictability of low hotspot occurrence due to high fuel moisture. Furthermore, although the Pantanal exhibits smaller standard errors in terms of absolute numbers (Figure 3), its normalized density (Figure 4) reveals a high sensitivity to extreme fire pressure per unit area during drought peaks. The disproportionately high density of hotspots in the Pantanal during 2020, despite lower absolute numbers compared to the Amazon, suggests a breakdown of traditional hydrological buffers. In this biome, the ability of the negative binomial model to capture overdispersion (Table 8) is crucial. The extreme fire activity in the last three-year period of our study (2019–2021) suggests that there is a range in the Pantanal biome from a flood-pulse-regulated system to a system vulnerable to fires under extreme climate conditions. This difference is important because it highlights that although the total number of fires may be lower than in the Amazon, the environmental impact per square kilometer in the Pantanal is significantly more intense. These results confirm that the duration and intensity of the fire season in Brazil are largely defined by seasonal changes in precipitation [33]. The robustness of these findings is further supported by the diagnostic stability of the models across biomes. Although some predictors such as evaporation and maximum temperature show multicollinearity, they are retained because they represent different ecological processes. Maximum temperature directly influences leaf litter flammability through thermal stress, while evaporation rates reflect the total atmospheric water demand. The consistency of these variables across all six biomes reinforces the argument that climate is the primary condition enabling fire spread, providing a stable foundation regardless of different human ignition sources. The temporal variations in fire peaks observed in the biomes in Figure 3 reflect the progression of the South American monsoon system, which dictates the gradual onset and duration of the dry season in each region. While the critical fire window in the northern biomes coincides with severe water shortages in late winter, fire dynamics in other regions are influenced by different transitional climate patterns and agricultural cycles. In these areas, human-caused fires, such as land clearing or harvest preparation, are strategically timed with local dry periods to facilitate land management, further explaining the monthly variations in the occurrence of hotspots in different ecological landscapes.
In the Pantanal, Caatinga, Atlantic Forest, and Pampa, the highest number of hotspots was observed in 2019, 2020, and 2021. Annual oscillations with notable peaks in this period are shown in Figure 2. When analyzing the area burned, the Cerrado recorded the largest total area, followed by the Amazon and the Pantanal. It should be noted that the Cerrado is an ecosystem that evolved with fire; in contrast, the Amazon and the Pantanal are considered more ecologically sensitive because their biodiversity is not naturally adapted to recurrent fires. This lack of adaptation leads to more permanent forest loss and habitat degradation. Furthermore, Amazonian vegetation generally maintains a lower water deficit than that of the Cerrado, which limits the expansion of the burned area. This quantitative behaviour is consistent with the results of Araújo, Ferreira, and Arantes (2012) [34].
These extensive fires have an impact on biodiversity, ecosystem services, and human health. They are caused by a combination of land-use change, climatic conditions, and natural causes, but are increasingly linked to human activities [7,35,36,37]. However, the omission of direct variables for land use policy and enforcement limits the causal interpretation of our models. In biomes such as the Amazon and Pantanal, fire peaks often coincide not only with climate anomalies but also with changes in environmental management and land clearing practices. Therefore, our results should be interpreted as defining the meteorological opportunity for fire spread, while actual ignition and frequency remain highly dependent on these unquantified socioeconomic and political drivers. Once ignited, fires can spread rapidly and become uncontrollable. Spatial density analysis, as shown in Figure 4, reveals a critical shift in regional fire dynamics that absolute numbers often mask. While the Amazon and Cerrado record the highest totals, normalized density highlights the extreme vulnerability of the Pantanal, which accounted for an unprecedented 13% of fire activity relative to its area. The historic peak in 2020 (almost 6 fires/km2) suggests that smaller biomes are facing increased ecological pressure. As discussed by Pivello et al. (2021) [28], this increase is not only a result of climate variability, but also points to a dangerous synergy between extreme drought and land-use change that threatens the resilience of these ecosystems. Although forest fires can occur naturally (e.g., lightning strikes), they have increasingly transitioned from a natural phenomenon to a human-induced hazard. This shift is either a direct consequence of land management practices [35] or an indirect result of climate change [38]. Recent research indicates that anthropogenic disturbances, such as selective logging, significantly enhance fire activity by altering the forest microclimate and increasing the accumulation of dry biomass, which lowers the threshold for fire ignition even during moderate droughts [39]. In addition to these factors, topography and climate also play an important role in determining the effectiveness of management strategies [40].
The results highlight the importance of climatic variables and biome characteristics for fire risk analysis and prediction, as detailed in Table 2, Table 3, Table 4, Table 5, Table 6, Table 7, Table 8 and Table 9. Consequently, it is essential to implement a clear national fire management policy. This should include the integration of fire management into protected area plans and the promotion of research, as previously demonstrated in the Cerrado [41].
The significance of the meteorological predictors identified in our models is consistent with established regional climate frameworks and fire risk systems used in South America. While regional models often focus on predicting climate anomalies and extreme droughts, such as those analyzed by Marengo et al. [42], our negative binomial approach provides a complementary statistical quantification. By comparing our model parameters with the established Köppen climate classification for Brazil [20], we confirm that predictors such as air temperature and vapor pressure deficit are robust indicators that align with the specific ecological vulnerability of each biome. This comparison highlights that, while climate models themselves predict meteorological variables, our study identifies the statistical sensitivity of hotspot occurrence to these changes, offering a refined tool for regional risk assessment.
Despite the high prediction accuracy and extensive 22-year dataset, some limitations should be acknowledged. Among these limitations, the presence of residual temporal autocorrelation suggests that fire dynamics are influenced by conditions that carry over from one month to the next. However, by including the categorical variable “month”, our negative binomial approach successfully captured the dominant seasonal cycles, allowing us to effectively isolate the impact of specific meteorological anomalies from the expected seasonal background. Consequently, the models provide a statistical quantification of how interannual climate variability drives fire deviations from the norm in each biome. Our model focused exclusively on meteorological predictors, but fires in Brazil are also driven by land-use changes and socioeconomic factors for which we did not have data for the entire period. This limitation is significant because it means that our model cannot distinguish between increases in fire numbers caused by more severe drought and those caused by more intense deforestation or lack of environmental monitoring. Although our 22-year meteorological baseline is robust, the predictive applicability of such a model in real-world scenarios must be viewed with caution, as it provides only one piece of the complex puzzle of fire causation in tropical biomes. Future research could integrate these anthropogenic variables with the current negative binomial model. Nevertheless, by quantifying meteorological drivers, this study provides a key basis for understanding the contribution of climate alone to fire risk. Overall, the results indicate that forest fire activity in Brazilian biomes is primarily determinate by the interaction between seasonal climate dynamics and specific ecological characteristic of the biome, with temperature and precipitation as dominant and consistently strong predictors.

5. Conclusions

This study demonstrates the complex relationships between climate factors and hotspot occurrence across six Brazilian biomes using a 22-year longitudinal dataset. The primary contribution of this research is in the systematic comparison of different ecological regions and the application of negative binomial models, which have been shown to be superior to standard methods in handling overdispersion of fire data. The modelling has shown that climate variables such as temperature, precipitation and wind speed, together with the size of the area, significantly influence the number of hotspots. Our findings confirm that the Cerrado showed the highest number of hotspots due to its fire-adapted vegetation, the Amazon and Pantanal are the most ecologically sensitive areas, as their ecosystems are not naturally adapted to frequent fire activity and can suffer long-term structural degradation. Despite the high predictive accuracy of the developed models, this study primarily focused on meteorological factors. We acknowledge that the exclusion of quantitative socioeconomic data, such as direct human activities and land use changes, is a limitation of the study, given that these factors, in synergy with climatic conditions, further increase fire risk. Future research should focus on integrating anthropogenic variables with the meteorological predictors identified in this study. Such a comprehensive framework would significantly contribute to the development of more effective strategies for mitigating climate-induced fires in tropical ecosystems. We acknowledge that the models considered in this study have certain limitations, particularly with respect to residual temporal dependence. In future work, we plan to extend the analysis by incorporating additional predictors and by developing dynamic models that explicitly account for temporal autocorrelation. The results presented in this study suggest that such an approach could provide a useful and potentially more parsimonious modeling framework, as incorporating time-dependent error structures may offer an alternative way to capture seasonal patterns and reduce the need for interaction terms with the month variable.

Author Contributions

Conceptualization, E.K.-A. and A.d.S.; methodology, A.d.S.; software, M.B.; validation, M.B., V.G. and N.S.; formal analysis, M.B., E.K.-A. and A.d.S.; investigation, A.d.S. and E.K.-A.; resources, A.d.S.; data curation, M.B.; writing—original draft preparation, E.K.-A. and A.d.S.; writing—review and editing, V.G., M.J. and N.S.; visualization, M.J. and A.d.S.; supervision, E.K.-A. All authors have read and agreed to the published version of the manuscript.

Funding

This research received no external funding.

Institutional Review Board Statement

Not applicable.

Informed Consent Statement

Not applicable.

Data Availability Statement

The raw data analyzed in this study are available from the INMET (https://portal.inmet.gov.br/, accessed on 25 March 2026) and INPE (https://www.gov.br/inpe/pt-br, accessed on 25 March 2026) databases. The processed datasets generated during the current study are available from the au-thors on request.

Acknowledgments

We would like to thank the National Institute of Meteorology, Imaging Division of the National Institute of Space Research, the National Oceanic Atmospheric Administration (NOAA−12) and the National Aeronautics and Space Administration.

Conflicts of Interest

The authors declare no conflicts of interest.

References

  1. Li, P.; Xiao, C.; Feng, Z.; Li, W.; Zhang, X. Occurrence Frequencies and Regional Variations in Visible Infrared Imaging Radiometer Suite (VIIRS) Global Active Fires. Glob. Change Biol. 2020, 26, 2970–2987. [Google Scholar] [CrossRef] [PubMed]
  2. Pye, H.O.T.; Appel, K.W.; Seltzer, K.M.; Ward-Caviness, C.K.; Murphy, B.N. Human-Health Impacts of Controlling Secondary Air Pollution Precursors. Environ. Sci. Technol. Lett. 2022, 9, 96–101. [Google Scholar] [CrossRef] [PubMed]
  3. Pausas, J.G.; Fernández-Muñoz, S. Fire Regime Changes in the Western Mediterranean Basin: From Fuel-Limited to Drought-Driven Fire Regime. Clim. Change 2012, 110, 215–226. [Google Scholar] [CrossRef]
  4. Schmidt, I.B.; Eloy, L. Fire Regime in the Brazilian Savanna: Recent Changes, Policy and Management. Flora Morphol. Distrib. Funct. Ecol. Plants 2020, 268, 151613. [Google Scholar] [CrossRef]
  5. Harper, A.R.; Doerr, S.H.; Santin, C.; Froyd, C.A.; Sinnadurai, P. Prescribed Fire and Its Impacts on Ecosystem Services in the UK. Sci. Total Environ. 2018, 624, 691–703. [Google Scholar] [CrossRef]
  6. Pellegrini, A.F.A.; Hein, A.M.; Cavender-Bares, J.; Montgomery, R.A.; Staver, A.C.; Silla, F.; Hobbie, S.E.; Reich, P.B. Disease and Fire Interact to Influence Transitions between Savanna–Forest Ecosystems over a Multi-Decadal Experiment. Ecol. Lett. 2021, 24, 1007–1017. [Google Scholar] [CrossRef]
  7. Brando, P.M.; Soares-Filho, B.; Rodrigues, L.; Assunção, A.; Morton, D.; Tuchschneider, D.; Fernandes, E.C.M.; Macedo, M.N.; Oliveira, U.; Coe, M.T. The Gathering Firestorm in Southern Amazonia. Sci. Adv. 2020, 6, eaay1632. [Google Scholar] [CrossRef]
  8. de Oliveira, A.S.; Rajão, R.G.; Soares Filho, B.S.; Oliveira, U.; Santos, L.R.S.; Assunção, A.C.; van der Hoff, R.; Rodrigues, H.O.; Ribeiro, S.M.C.; Merry, F.; et al. Economic Losses to Sustainable Timber Production by Fire in the Brazilian Amazon. Geogr. J. 2019, 185, 55–67. [Google Scholar] [CrossRef]
  9. Briggs, N.L.; Jaffe, D.A.; Gao, H.; Hee, J.R.; Baylon, P.M.; Zhang, Q.; Zhou, S.; Collier, S.C.; Sampson, P.D.; Cary, R.A. Particulate Matter, Ozone, and Nitrogen Species in Aged Wildfire Plumes Observed at the Mount Bachelor Observatory. Aerosol Air Qual. Res. 2016, 16, 3075–3087. [Google Scholar] [CrossRef]
  10. Jaffe, D.A.; O’Neill, S.M.; Larkin, N.K.; Holder, A.L.; Peterson, D.L.; Halofsky, J.E.; Rappold, A.G. Wildfire and Prescribed Burning Impacts on Air Quality in the United States. J. Air Waste Manag. Assoc. 2020, 70, 583–615. [Google Scholar] [CrossRef]
  11. Juncosa Calahorrano, J.F.; Lindaas, J.; O’Dell, K.; Palm, B.B.; Peng, Q.; Flocke, F.; Pollack, I.B.; Garofalo, L.A.; Farmer, D.K.; Pierce, J.R.; et al. Daytime Oxidized Reactive Nitrogen Partitioning in Western U.S. Wildfire Smoke Plumes. J. Geophys. Res. Atmos. 2021, 126, e2020JD033484. [Google Scholar] [CrossRef]
  12. Selimovic, V.; Yokelson, R.J.; Warneke, C.; Roberts, J.M.; De Gouw, J.; Reardon, J.; Griffith, D.W.T. Aerosol Optical Properties and Trace Gas Emissions by PAX and OP-FTIR for Laboratory-Simulated Western US Wildfires during FIREX. Atmos. Chem. Phys. 2018, 18, 2929–2948. [Google Scholar] [CrossRef]
  13. Tomaz, S.; Cui, T.; Chen, Y.; Sexton, K.G.; Roberts, J.M.; Warneke, C.; Yokelson, R.J.; Surratt, J.D.; Turpin, B.J. Photochemical Cloud Processing of Primary Wildfire Emissions as a Potential Source of Secondary Organic Aerosol. Environ. Sci. Technol. 2018, 52, 11027–11037. [Google Scholar] [CrossRef] [PubMed]
  14. Li, W.; Shi, Z.; Liu, L.; Zhang, J.; Xu, L.; Wang, Y.; Sun, Y. Microscopic Evidence for Phase Separation of Organic Species and Inorganic Salts in Fine Ambient Aerosol Particles. Environ. Sci. Technol. 2021, 55, 2234–2242. [Google Scholar] [CrossRef]
  15. Cullen, A.C.; Axe, T.; Podschwit, H. High-Severity Wildfire Potential-Associating Meteorology, Climate, Resource Demand and Wildfire Activity with Preparedness Levels. Int. J. Wildl. Fire 2020, 30, 30–41. [Google Scholar] [CrossRef]
  16. Ma, C.; Pu, R.; Downs, J.; Jin, H. Characterizing Spatial Patterns of Amazon Rainforest Wildfires and Driving Factors by Using Remote Sensing and GIS Geospatial Technologies. Geosciences 2022, 12, 237. [Google Scholar] [CrossRef]
  17. Li, C.; Li, Q.; Tong, D.; Wang, Q.; Wu, M.; Sun, B.; Su, G.; Tan, L. Environmental Impact and Health Risk Assessment of Volatile Organic Compound Emissions during Different Seasons in Beijing. J. Environ. Sci. China 2020, 93, 1–12. [Google Scholar] [CrossRef]
  18. Libonati, R.; DaCamara, C.C.; Peres, L.F.; Sander de Carvalho, L.A.; Garcia, L.C. Rescue Brazil’s Burning Pantanal Wetlands. Nature 2020, 588, 217–219. [Google Scholar] [CrossRef]
  19. Guerra, A.; Reis, L.K.; Borges, F.L.G.; Ojeda, P.T.A.; Pineda, D.A.M.; Miranda, C.O.; de Lima Maidana, D.P.F.; dos Santos, T.M.R.; Shibuya, P.S.; Marques, M.C.M.; et al. Ecological Restoration in Brazilian Biomes: Identifying Advances and Gaps. For. Ecol. Manag. 2020, 458, 117802. [Google Scholar] [CrossRef]
  20. Alvares, C.A.; Stape, J.L.; Sentelhas, P.C.; de Moraes Gonçalves, J.L.; Sparovek, G. Köppen’s climate classification map for Brazil. Meteorol. Z. 2013, 22, 711–728. [Google Scholar] [CrossRef]
  21. Ministério Do Meio Ambiente (MMA). Bioma Amazônia. 2022. Available online: https://www.gov.br/mma/pt-br/assuntos/biodiversidade-e-biomas/biomas-e-ecossistemas/biomas/amazonia (accessed on 25 March 2026).
  22. MacNeil, M.A.; Carlson, J.K.; Beerkircher, L.R. Shark Depredation Rates in Pelagic Longline Fisheries: A Case Study from the Northwest Atlantic. ICES J. Mar. Sci. 2009, 66, 708–719. [Google Scholar] [CrossRef]
  23. The R Project for Statistical Computing. 2024. Available online: https://www.r-project.org/ (accessed on 25 March 2026).
  24. Gelman, A.; Hill, J. Data Analysis Using Regression and Multilevel/Hierarchical Models; Cambridge University Press: New York, NY, USA, 2006; ISBN 9780521867061. [Google Scholar]
  25. Lüdecke, D.; Ben-Shachar, M.; Patil, I.; Waggoner, P.; Makowski, D. Performance: An R Package for Assessment, Comparison and Testing of Statistical Models. J. Open Source Softw. 2021, 6, 3139. [Google Scholar] [CrossRef]
  26. Dobson, A.J. An Introduction to Generalized Linear Models, 2nd ed.; Chapman and Hall/CRC: New York, NY, USA, 2002; ISBN 1584881658. [Google Scholar]
  27. Venables, W.N.; Ripley, B.D. Modern Applied Statistics with S. Fourth, 4th ed.; Springer: New York, NY, USA, 2002; ISBN 0-387-95457-0. [Google Scholar]
  28. Pivello, V.R.; Vieira, I.; Christianini, A.V.; Ribeiro, D.B.; da Silva Menezes, L.; Berlinck, C.N.; Melo, F.P.L.; Marengo, J.A.; Tornquist, C.G.; Tomas, W.M.; et al. Understanding Brazil’s Catastrophic Fires: Causes, Consequences and Policy Needed to Prevent Future Tragedies. Perspect. Ecol. Conserv. 2021, 19, 233–255. [Google Scholar] [CrossRef]
  29. de Vasconcelos, S.S.; Fearnside, P.M.; de Alencastro Graça, P.M.L.; Dias, D.V.; Correia, F.W.S. Variability of Vegetation Fires with Rain and Deforestation in Brazil’s State of Amazonas. Remote Sens. Environ. 2013, 136, 199–209. [Google Scholar] [CrossRef]
  30. Aragão, L.E.O.C.; Anderson, L.O.; Fonseca, M.G.; Rosan, T.M.; Vedovato, L.B.; Wagner, F.H.; Silva, C.V.J.; Silva Junior, C.H.L.; Arai, E.; Aguiar, A.P.; et al. 21st Century drought-related fires counteract the decline of Amazon deforestation carbon emissions. Nat. Commun. 2018, 9, 536. [Google Scholar] [CrossRef]
  31. de Araújo, F.M.; Ferreira, L.G. Satellite-Based Automated Burned Area Detection: A Performance Assessment of the MODIS MCD45A1 in the Brazilian Savanna. Int. J. Appl. Earth Obs. Geoinf. 2015, 36, 94–102. [Google Scholar] [CrossRef]
  32. Alvarado, S.T.; Fornazari, T.; Cóstola, A.; Morellato, L.P.C.; Silva, T.S.F. Drivers of Fire Occurrence in a Mountainous Brazilian Cerrado Savanna: Tracking Long-Term Fire Regimes Using Remote Sensing. Ecol. Indic. 2017, 78, 270–281. [Google Scholar] [CrossRef]
  33. Ramos-Neto, M.B.; Pivello, V.R. Lightning Fires in a Brazilian Savanna National Park: Rethinking Management Strategies. Environ. Manag. 2000, 26, 675–684. [Google Scholar] [CrossRef]
  34. de Araújo, F.M.; Ferreira, L.G.; Arantes, A.E. Distribution Patterns of Burned Areas in the Brazilian Biomes: An Analysis Based on Satellite Data for the 2002-2010 Period. Remote Sens. 2012, 4, 1929–1946. [Google Scholar] [CrossRef]
  35. Pivello, V.R. The Use of Fire in the Cerrado and Amazonian Rainforests of Brazil: Past and Present. Fire Ecol. 2011, 7, 24–39. [Google Scholar] [CrossRef]
  36. Balch, J.K.; Bradley, B.A.; Abatzoglou, J.T.; Chelsea Nagy, R.; Fusco, E.J.; Mahood, A.L. Human-Started Wildfires Expand the Fire Niche across the United States. Proc. Natl. Acad. Sci. USA 2017, 114, 2946–2951. [Google Scholar] [CrossRef]
  37. Rosan, T.M.; Aragão, L.E.O.C.; Oliveras, I.; Phillips, O.L.; Malhi, Y.; Gloor, E.; Wagner, F.H. Extensive 21st-Century Woody Encroachment in South America’s Savanna. Geophys. Res. Lett. 2019, 46, 6594–6603. [Google Scholar] [CrossRef]
  38. Field, C.B.; Lobell, D.B.; Peters, H.A.; Chiariello, N.R. Feedbacks of Terrestrial Ecosystems to Climate Change. Annu. Rev. Environ. Resour. 2007, 32, 1–29. [Google Scholar] [CrossRef]
  39. Machado, M.S.; Hethcoat, M.G.; Macedo, M.N.; Peres, C.A.; Edwards, D.P. Experimental assessment of forest flammability after selective logging in the Brazilian Amazon. Commun. Earth Environ. 2025, 6, 696. [Google Scholar] [CrossRef]
  40. de Vasconcelos, M.F. O Que São Campos Rupestres e Campos de Altitude Nos Topos de Montanha Do Leste Do Brasil? Rev. Bras. Bot. 2011, 34, 241–246. [Google Scholar] [CrossRef]
  41. Durigan, G.; Ratter, J.A. The Need for a Consistent Fire Policy for Cerrado Conservation. J. Appl. Ecol. 2016, 53, 11–15. [Google Scholar] [CrossRef]
  42. Marengo, J.A.; Cunha, A.P.; Cuartas, L.A.; Deusdará Leal, K.R.; Broedel, E.; Seluchi, M.E.; Michelin, C.M.; De Praga Baião, C.F.; Chuchón Angulo, E.; Almeida, E.K.; et al. Extreme Drought in the Brazilian Pantanal in 2019–2020: Characterization, Causes, and Impacts. Front. Water 2021, 3, 639204. [Google Scholar] [CrossRef]
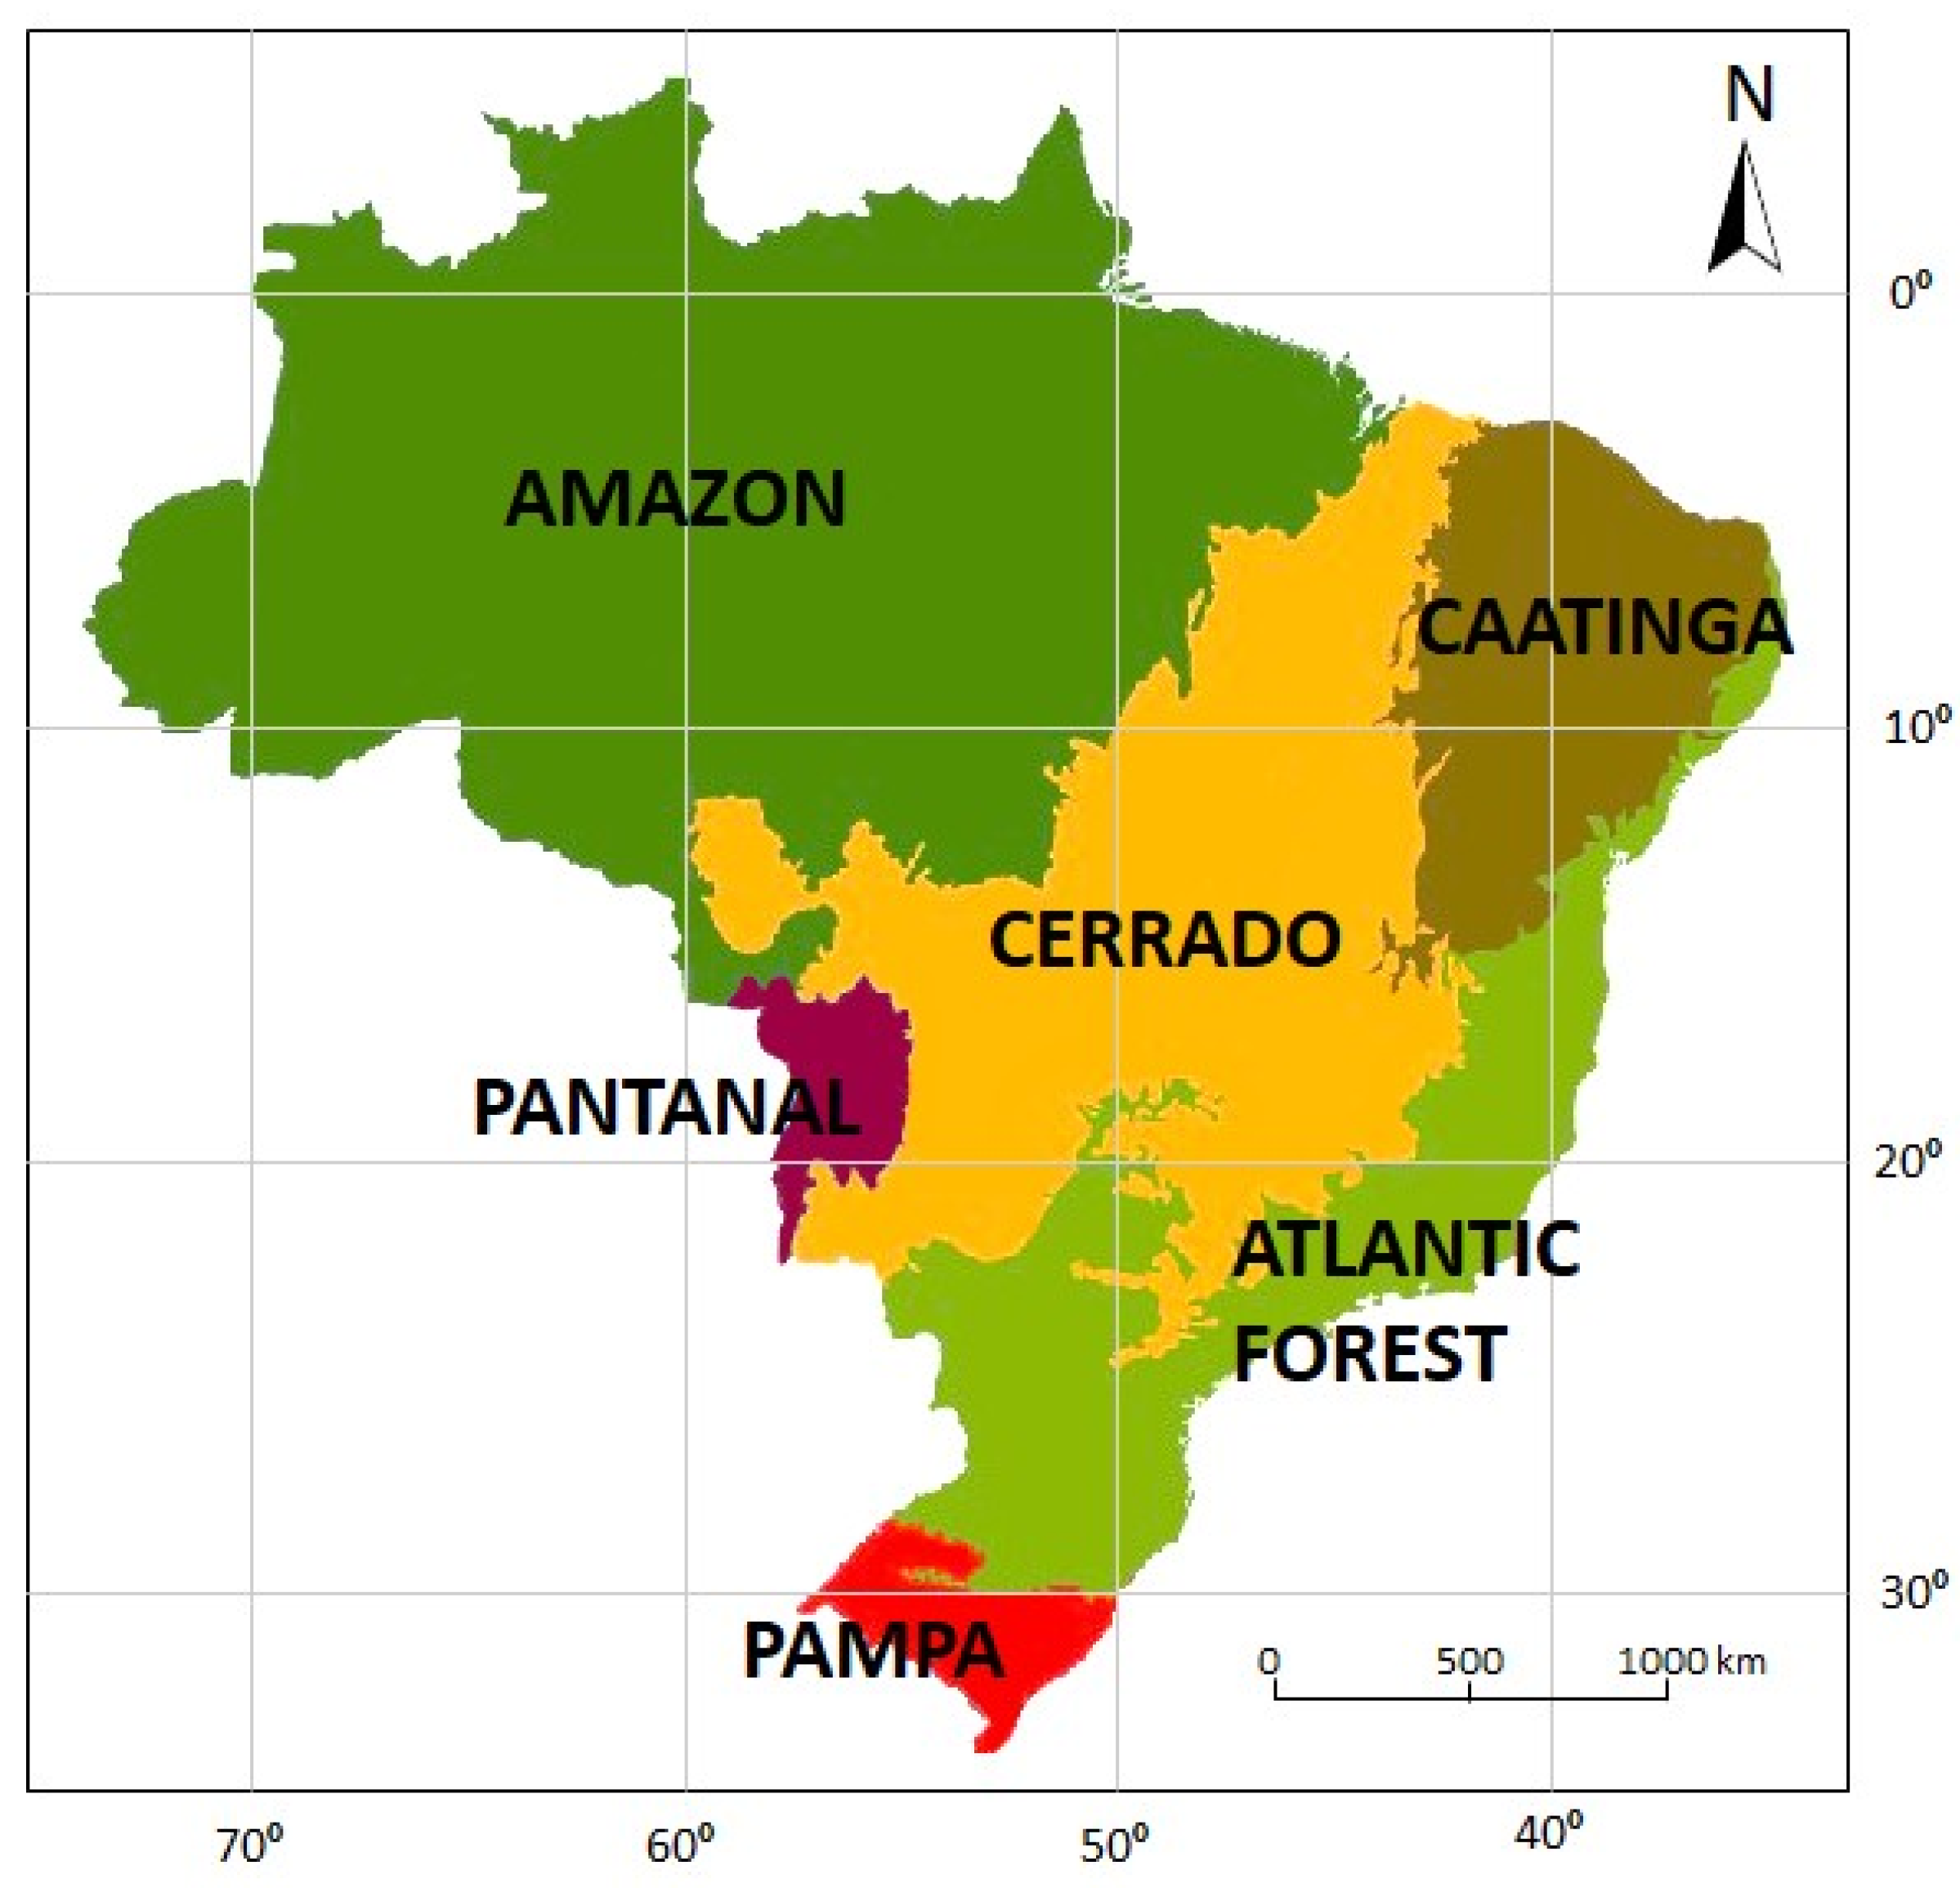
Figure 1. Map of the Brazilian biomes.
Sustainability 18 03363 g001
Figure 2. Annual distribution of fire hotspots across Brazilian biomes from 1999 to 2021.
Sustainability 18 03363 g002
Figure 3. Monthly distribution of hotspots across Brazilian biomes (1999–2021), where error bars indicate the Standard Error of the mean.
Sustainability 18 03363 g003
Figure 4. Annual density of fire hotspots per unit area (hotspots per km2) for each Brazilian biome from 1999 to 2021.
Sustainability 18 03363 g004
Figure 5. Autocorrelation function (ACF) of Pearson residuals from the Amazon negative binomial model.
Sustainability 18 03363 g005
Table 1. Descriptive statistics of the number of fire hotspots detected across the six biomes of Brazil, from January 1999 to December 2021.
VariableMeanStDevCvarMinQ1MedianQ3MaxSkewnessKurtosis
Cerrado48,21894,415195.884308011,65541,515584,6373.3712.78
Atlantic Forest894712,1671361521989463510,34985,0163.0611.72
Pantanal676123,214343.312409593608256,3717.1762.21
Amazon61,6011 × 105185.280415516,28965,826806,8223.7317.29
Pampa447.3633.9141.718720252643592.9210.57
Caatinga931516,455176.618585224110,479115,5833.4515.41
Note: standard deviation (StDev), minimum (Min), maximum (Max), 1st quartile (Q1), median, 3rd quartile (Q3). All parameters refer to the monthly number of hotspots (1999–2021).
Table 2. Predictors in initial and smaller model.
Predictors and ThetaInitial ModelCriteriaSmaller ModelCriteria
area+AIC: 28,435
BIC: 29,025
2LL: −28,215
AIC: 28,911
BIC: 29,039
2LL: −28,862
biome++
year++
month++
precipitation++
pressure++
Tmin++
Tmax++
evaporation+
wind speed++
Theta1.5613 (Std. Err.: 0.05) 1.5613 (Std. Err.: 0.05)
Table 3. Negative binomial regression results for the monthly number of hotspots in the Amazon biome (1999–2021).
Variable Log (IRR)Std. Errorp-ValueInteraction TermLog (IRR)Std. Errorp-Value
year0.09740.0073<0.001
month month × Tmax
Jan Jan × Tmax
Apr−28.844313.07550.027Apr × Tmax0.91830.91830.030
Aug34.77819.3379<0.001Aug × Tmax−1.0302−1.0302<0.001
Dec23.542510.12480.020Dec × Tmax−0.7145−0.71450.027
Feb5.59489.33950.5Feb × Tmax−0.1837−0.18370.5
Jul36.344312.74990.004Jul × Tmax−1.1218−1.12180.005
Jun31.313810.05940.002Jun × Tmax−0.9846−0.98460.002
Mar−7.898810.03530.4Mar × Tmax0.26140.26140.4
May23.452810.16590.021May × Tmax−0.7567−0.75670.020
Nov21.88368.96420.015Nov × Tmax−0.6526−0.65260.021
Oct34.30899.2580<0.001Oct × Tmax−1.0260−1.0260<0.001
Sep39.20948.1861<0.001Sep × Tmax−1.1538−1.1538<0.001
precipitation−0.00120.00060.063
Tmax0.88810.2166<0.001
evaporation0.01070.00700.13
Note: Incidence Rate Ratio (IRR), Monthly Maximum Temperature (Tmax), Standard Error (Std. Error). Model Diagnostics: AIC: 5705.9, 2 × log-likelihood: −5649.940, Theta: 2.382 (Std. Err.: 0.195).
Table 4. Negative binomial regression results for the monthly number of hotspots in the Pampa biome (1999–2021).
VariableLog (IRR)Std. ErrorPr (>|z|)
year0.14090.0072<0.0001
month
Jan
Apr0.00140.28500.9960
Aug1.09020.44880.0151
Dec0.16400.23090.4777
Feb0.06010.22460.7891
Jul0.70560.50710.1641
Jun0.24530.48660.6141
Mar0.51190.23930.0324
May0.34090.41760.4143
Nov−1.18950.2711<0.0001
Oct−0.01810.31080.9536
Sep0.49360.38680.2019
precipitation−0.00400.0008<0.0001
pressure−4.84030.7055<0.0001
Tmax0.51250.0810<0.0001
Note: Incidence Rate Ratio (IRR), Monthly Maximum Temperature (Tmax), Standard Error (Std. Error). Model Diagnostics: AIC: 3364, 2 × log-likelihood: −3330, Theta: 1.983 (Std. Err.: 0.166).
Table 5. Negative binomial regression results for the monthly number of hotspots in the Caatinga biome (1999–2021).
VariableLog (IRR)Std. ErrorPr (>|z|)Interaction TermLog (IRR)Std. ErrorPr (>|z|)
year0.13620.0061<0.0001
month month × evaporation
Jan Jan × evaporation
Apr−3.41822.53230.1771Apr × evaporation0.01850.90480.3655
Aug−7.55392.99910.0118Aug × evaporation0.07313.02070.0025
Dec−9.56243.18480.0027Dec × evaporation0.07623.39580.0007
Feb−2.69682.85800.3454Feb × evaporation0.01850.84610.3975
Jul−5.81362.40980.0158Jul × evaporation0.04822.31270.0207
Jun−3.83572.37990.1070Jun × evaporation0.03061.45000.1470
Mar−0.02722.94160.9926Mar × evaporation−0.0067−0.31150.7554
May−4.69412.39360.0499May × evaporation0.03151.59200.1114
Nov−8.94123.53490.0114Nov × evaporation0.07623.07430.0021
Oct−4.73373.27450.1483Oct × evaporation0.04562.03000.0424
Sep−3.28963.28370.3164Sep × evaporation0.03561.48330.1380
precipitation−0.00120.00060.0345
pressure5.73530.7902<0.0001
Tmax−1.14880.1588<0.0001
evaporation0.03430.01260.0066
Note: Incidence Rate Ratio (IRR), Monthly Maximum Temperature (Tmax), Standard Error (Std. Error). Model Diagnostics: AIC: 4601, 2 × log-likelihood: −4543.010, Theta: 2.964 (Std. Err.: 0.246).
Table 6. Negative binomial regression results for the monthly number of hotspots in the Cerrado biome (1999–2021).
VariableLog (IRR)Std. ErrorPr (>|z|)
year0.11980.0050<0.0001
month
Jan
Apr0.57260.15840.0003
Aug3.41430.2321<0.0001
Dec1.23690.1560<0.0001
Feb−0.01210.15840.9390
Jul3.51080.2998<0.0001
Jun3.13470.2622<0.0001
Mar−0.06410.15480.6790
May1.99990.2267<0.0001
Nov2.11120.1549<0.0001
Oct2.83730.1701<0.0001
Sep3.49920.1732<0.0001
Tmin0.16290.05560.0034
evaporation0.01820.0040<0.0001
Note: Incidence Rate Ratio (IRR), Monthly Maximum Temperature (Tmax), Standard Error (Std. Error). Model Diagnostics: AIC: 5345.5, 2 × log-likelihood: −5313.472, Theta: 3.923 (Std. Err.: 0.329).
Table 7. Negative binomial regression results for the monthly number of hotspots in the Atlantic Forest biome (1999–2021).
VariableLog (IRR)Std. ErrorPr (>|z|)Interaction termLog (IRR)Std. ErrorPr (>|z|)
year0.11930.0052<0.0001
month month × precipitation
Jan Jan × precipitation
Apr0.40690.56490.4713Apr × precipitation0.00190.00260.4786
Aug2.47690.5885<0.0001Aug × precipitation0.00180.00230.4150
Dec−1.30910.49680.0084Dec × precipitation0.00970.00270.0003
Feb−0.42930.49210.3829Feb × precipitation0.00400.00220.0758
Jul1.99740.66400.0026Jul × precipitation0.00080.00290.7888
Jun1.39730.68210.0405Jun × precipitation0.00140.00260.5898
Mar−0.24530.53430.6461Mar × precipitation0.00310.00270.2522
May1.17740.61280.0547May × precipitation−0.00070.00230.7586
Nov0.37040.53670.4901Nov × precipitation0.00460.00340.1725
Oct1.49460.52940.0048Oct × precipitation0.00420.00250.0911
Sep2.75980.5786<0.0001Sep × precipitation0.00000.00250.9990
precipitation−0.00320.00180.0695
evaporation0.02110.00560.0002
Note: Incidence Rate Ratio (IRR), Monthly Maximum Temperature (Tmax), Standard Error (Std. Error). Model Diagnostics: AIC: 4879, 2 × log-likelihood: −4824.984, Theta: 3.716 (Std. Err.: 0.311).
Table 8. Negative binomial regression results for the monthly number of hotspots in the Pantanal biome (1999–2021).
VariableLog (IRR)Std. ErrorPr (>|z|)
year0.14220.0089<0.0001
month
Jan
Apr−0.79090.32460.0148
Aug1.81580.52620.0006
Dec0.04200.27600.8791
Feb0.00250.28480.9931
Jul1.67450.62180.0071
Jun0.56130.54450.3025
Mar−0.74530.28020.0078
May−0.01910.45670.9666
Nov0.41120.28180.1445
Oct1.23920.39900.0019
Sep1.37750.37000.0002
precipitation−0.00630.0010<0.0001
Tmin0.21640.07070.0022
evaporation0.03480.0069<0.0001
Note: Incidence Rate Ratio (IRR), Monthly Maximum Temperature (Tmax), Standard Error (Std. Error). Model Diagnostics: AIC: 4364, 2 × log-likelihood: −4329.983, Theta: 1.293 (Std. Err.: 0.102).
Table 9. Median and quartile values of climate variables for six Brazilian biomes, from January 1999 to December 2021.
Amazon
Median (IQR)
Pampa
Median (IQR)
Caatinga
Median (IQR)
Cerrado
Median (IQR)
Atlantic Forest Median (IQR)Pantanal
Median (IQR)
precipitation190
(87, 289)
124
(85, 162)
116
(51, 232)
107
(13, 231)
127
(89, 178)
102
(27, 181)
evaporation95
(81, 111)
98
(67, 129)
128
(111, 140)
113
(105, 130)
84
(60, 112)
108
(95, 124)
pressure3.00
(2.91, 3.11)
1.83
(1.50, 2.19)
2.67
(2.55, 2.75)
2.24
(1.76, 2.39)
2.02
(1.73, 2.37)
2.57
(2.05, 2.77)
Tmax31.90
(31.00, 32.70)
25.2
(21.5, 28.4)
29.70
(28.80, 30.30)
29.60
(29.00, 30.40)
23.80
(21.10, 27.10)
31.60
(30.90, 32.53)
Tmin23.65
(23.10, 24.20)
15.9
(12.9, 19.2)
22.10
(21.30, 22.60)
19.00
(17.18, 19.90)
17.60
(14.70, 20.20)
21.10
(18.20, 22.20)
wind speed1.20
(1.03, 1.32)
3.05
(2.80, 3.39)
3.19
(2.82, 3.70)
1.81
(1.58, 2.07)
3.12
(2.81, 3.57)
1.46
(1.26, 1.67)
Disclaimer/Publisher’s Note: The statements, opinions and data contained in all publications are solely those of the individual author(s) and contributor(s) and not of MDPI and/or the editor(s). MDPI and/or the editor(s) disclaim responsibility for any injury to people or property resulting from any ideas, methods, instructions or products referred to in the content.