Article

A Decision Support System for Sustainable Circular Economy Transition in Italian Historical Small Towns: The H-SMA-CE Project


1
Department of Economics, University of Messina, 98122 Messina, Italy
2
Department of Human and Social Sciences (DiSUS), University of Naples “L’Orientale”, 80134 Naples, Italy
*
Author to whom correspondence should be addressed.
Sustainability 2026, 18(7), 3302; https://doi.org/10.3390/su18073302
Submission received: 10 February 2026 / Revised: 13 March 2026 / Accepted: 24 March 2026 / Published: 28 March 2026

Abstract

Historical small towns (HSTs) embody irreplaceable cultural heritage and territorial identity, facing depopulation, economic marginalization, and infrastructure decay. Improving their liveability and attractiveness is essential to reverse these trends and boost sustainable development. In this context, HSTs are potential drivers of circular and sustainable socio-technical systems, where the circular economy (CE) offers a framework for local sustainability. However, HSTs lack adequate sustainable CE implementation tools. This study, the culmination of the H-SMA-CE project, develops a Decision Support System (DSS) to assist local policymakers in planning CE transitions in Italian HSTs. The DSS integrates three building blocks: context analysis (metabolic flows, stakeholder networks), an intervention library with cost–benefit data, and a composite Municipal Circular Economy Index (MCEI). The tool enables users to assess baseline circularity, simulate scenarios, and identify optimal investment portfolios through multi-objective optimization. This approach allows for the simultaneous evaluation of the benefits of each sustainability aspect, i.e., environmental, economic and social. Tested on the municipality of Taurasi (Italy), an HST with a wine-based economy, the results show that balanced intervention strategies yield greater circularity improvements than single-objective approaches. The paper contributes to the discourse on digital tools for sustainability transitions, offering a replicable model for evidence-based CE governance in heritage-rich territorial contexts.

1. Introduction

Historical small towns (HSTs) constitute a distinctive component of the European territorial landscape, embodying centuries of accumulated cultural heritage, architectural tradition, and place-based identity [1]. Italy, with its layered history and cultural density, represents a particularly significant case. The peninsula’s political fragmentation until unification in 1861 produced a polycentric settlement pattern [2], where HSTs served as autonomous centers of governance, commerce, and cultural production. This legacy persists in contemporary territorial structure, as settlements with populations under 5000 inhabitants account for approximately 70% of Italian municipalities, occupying 54.5% of the national territory, and hosting around 9.6 million people [3,4,5].
These figures position Italy as a relevant context for examining how HSTs contribute to socio-economic fabric and how they might navigate sustainability transitions while preserving their peculiarities.
Often referred to as “Borghi”, HSTs have preserved architectural heritage, traditional building techniques, and cultural continuity that has evolved over centuries. Their spatial patterns and material cultures reflect unique historical trajectories that cannot be replicated elsewhere.
However, HSTs may be afflicted by issues like population decline, aging demographics, and economic stagnation [6,7]. Infrastructure decay compounds these trends, as limited fiscal capacity constrains maintenance and modernization efforts. Furthermore, the tension between preservation requirements and development needs creates governance challenges that small municipality administrations struggle to navigate [8].
In this regard, the circular economy (CE) promotes systemic transformation of production, consumption, and end-of-life processes toward closed-loop resource flows [9]. For HSTs, this framework resonates with existing territorial conditions rather than imposing external logic. Settlements built around agricultural production already manage organic residue streams that CE reframes from disposal problem to valorization opportunity. Heritage buildings embody centuries of material investment that adaptive reuse extends rather than replaces. The fiscal constraints limiting infrastructure maintenance become arguments for decentralized, locally managed resource systems. At the urban scale more broadly, CE principles have informed waste management optimization, industrial symbiosis networks, and regenerative land use practices [10,11]. The alignment between CE goals and heritage preservation logic is notable: both emphasize longevity, adaptive reuse, and resource stewardship over disposability. In this sense, CE functions as an operational framework for translating abstract sustainability commitments into place-based interventions [12] that address the specific vulnerabilities of heritage-rich territories.
Most CE assessment frameworks target metropolitan areas or industrial districts. Vanhuyse [13] proposed an Urban Circularity Assessment Framework for cities, while Van Bueren et al. [14] systematically reviewed macro-level CE assessments of regions. At the intersection of CE and land use, D’Alessandro et al. [15] developed a model for reconciling industrial expansion with agricultural heritage. These frameworks share a common limitation: they not only assume economies of scale that small municipalities cannot access but also do not focus on small towns.
This gap creates a practical problem. Local administrators in HSTs recognize the relevance of sustainability transitions but lack operational instruments to plan and evaluate CE interventions. Without decision support tools calibrated to their scale and constraints, policy choices remain ineffective and fragmented. The need for accessible, context-tailored, and evidence-based planning instruments is pressing. Digital tools offer a pathway to bridge this capacity gap, enabling local administrators to access analytical capabilities previously reserved for better-resourced municipalities and supporting evidence-based governance without requiring specialized technical expertise [16].
The present study addresses this need by presenting a Decision Support System (DSS) developed within the H-SMA-CE (Historical Small Towns for Circular Economy) project (the project “H-SMA-CE, a decision support system for circular economy transition”, aims at building a DSS to foster the circular economy transition in historical small towns: http://hsmaceprin22.github.io/ (accessed on 5 February 2026)). Specifically, this study addresses the following research question: “How can a DSS be designed and applied to support CE transitions in HSTs, considering their unique characteristics and requirements?” The research question can be further split into the following sub-questions: (i) What are the key material flows, governance structures, and HST typologies that define the context for CE interventions in Italian HSTs? (ii) How can an “Ideal Circular Scenario” be structured for Italian HSTs? (iii) How can the initial CE level of HSTs and the impacts of the initiatives on its improvement be synthesized into a measurable and composite index?; (iv) How can the DSS operationalize the index, simulate intervention scenarios, and optimize portfolios to support evidence-based decision-making for CE governance in HSTs?. The research activities have been structured to specifically answer these questions.
The DSS is informed by the outcomes of these components: context analysis modules for metabolic flows and stakeholder mapping; an intervention library containing cost–benefit data for CE practices applicable to HSTs; and a composite Municipal Circular Economy Index (MCEI) for baseline assessment and scenario simulation. The tool enables local policymakers to evaluate current circularity levels, compare intervention portfolios, and identify optimal investment strategies through multi-objective optimization.
The DSS was tested on the municipality of Taurasi in Campania, Italy. Taurasi is a hill borgo of approximately 2100 inhabitants with a wine-based economy and an active network of local stakeholders. This case study allowed validation of the tool’s functionality and provided initial evidence on the relative performance of different intervention strategies.
The paper contributes to the emerging literature on digital tools for sustainability transitions in heritage-rich territorial contexts [16,17,18,19]. Previous studies have particularly emphasized the role of digital technologies in enhancing urban metabolism efficiency [16] and the use of multicriteria approaches to guide the adaptive reuse of urban heritage [17]. Additionally, the literature has been developing tools to evaluate circular actions in specific contexts—such as historical port cities [18]—as well as frameworks to assess the impacts of heritage conservation governance in historic cities [19]. Nevertheless, none of the mentioned studies addressed the limitations and difficulties characterizing HSTs. By structuring a specific tool applicable to HSTs, the present paper addresses this literature gap and offers a replicable model for supporting CE governance at the municipal scale, with particular attention to the constraints and opportunities that characterize Italian HSTs.
The remainder of the article is organized as follows. Section 2 reviews the theoretical background on CE measurement, the research design and presented case study. Section 3 presents the results of baseline assessment and scenario analysis. Section 4 discusses implications. Section 5 concludes with limitations and directions for future research.

2. Materials and Methods

2.1. Theoretical Background

The operationalization of CE principles requires robust measurement frameworks capable of capturing multidimensional performance across environmental, economic, and social domains. Kirchherr [20] analyzed 114 CE definitions and found substantial conceptual heterogeneity, with implications for indicator selection and index construction. This definitional plurality translates into measurement diversity: De Pascale [21] systematically reviewed 61 distinct indicators employed across CE assessment studies, finding that most focus on waste and material flows while underrepresenting social and institutional dimensions. Saidani et al. [22] identified 55 sets of circularity indicators and proposed a comprehensive taxonomy organizing them by scale (micro, meso, macro), circularity loop (maintain, reuse, remanufacture, recycle), and performance dimension, uncovering that meso-level territorial indicators are the least frequent despite their relevance for urban and municipal planning. Moraga et al. [23] examined what CE indicators actually measure, finding that most focus on material preservation while none addresses the preservation of functions, a core element that CE theory emphasizes but measurement practice neglects. Collectively, these reviews point to a fragmented landscape where the absence of a universally accepted standard creates both flexibility for context-specific adaptation and barriers for cross-study comparison and policy benchmarking. Ghinoi et al. [24] proposed the Municipality Indicator of Circular Economy (MICE), integrating domains including green enterprise, sustainable mobility, and biodiversity within a statistically derived weighting framework. Wang et al. [25] developed an Urban Circular Development Index applied across 40 Chinese cities, incorporating governance and institutional dimensions alongside resource efficiency metrics. Vanhuyse [13] proposed the Urban Circularity Assessment Framework specifically for planning and monitoring CE transitions. Heshmati and Rashidghalam [26] constructed an aggregate CE Index for Swedish municipalities covering waste management, infrastructure, and clean transport.
These frameworks share common features: multi-domain structure, composite indicator aggregation, and attention to data availability constraints. However, limitations remain. Most index-based methodologies prioritize environmental dimensions [27], but social and governance factors should be considered as well. Heritage and cultural dimensions receive minimal attention despite their relevance to urban identity. Foster and Saleh [28] represent an exception, developing the Circular City Adaptive Reuse of Cultural Heritage Index that explicitly incorporates cultural stock alongside environmental and socioeconomic indicators. Yet their operationalization focuses on tangible heritage: historic buildings, conservation status, architectural assets. This framing overlooks intangible heritage as recognized by the Faro Convention [29]: traditional knowledge, artisanal practices, and agricultural expertise transmitted across generations. For HSTs with agricultural economic bases, such as wine-producing settlements, the persistence of traditional enterprises embodies living heritage no less significant than built patrimony. None of the existing tools captures this dimension while simultaneously addressing the distinctive constraints of small municipalities: limited administrative capacity, data scarcity, and fiscal constraints. The present study attempts to address this gap.

2.2. Research Design

The H-SMA-CE project followed a sequential mixed-methods design organized into four research activities (RAs). Figure 1 illustrates the workflow and relationships between phases. Each RA specifically answered the research sub-questions (i–iv).
The first phase (RA1, “Context Analysis”) established the empirical foundation through field investigation of the pilot municipality. This involved quantifying metabolic flows using Material Flow Analysis (MFA) [30] and mapping stakeholder networks to characterize governance structures. Data sources included national statistics (ISTAT), regional environmental agencies, municipal service operators, and direct surveys.
Furthermore, the research led to the identification of prevalent HST types within the Italian system, providing the basis for SWOT-based assessment within the circular transition.
The second phase (RA2, Defining “Circular Scenario”) pursued several complementary objectives. Firstly, the process begins with the conceptualization of HST types to establish a theoretical basis for the model’s broader applicability, followed by an analysis of Urban Metabolism and Symbiosis tools to ensure technical compatibility with historical constraints. To enable quantitative assessment, a scoping review following PRISMA-ScR protocols [31] identified CE indices at micro–meso levels, providing the foundation for indicator construction in RA3, while a review of actor dynamics clarifies the socio-relational drivers behind circular production and consumption. Via a systematic literature review and public report analysis, CE best practices were examined, leading to the construction of an “Ideal Circular Scenario” for normative benchmark. From this benchmark, six archetypal interventions (Table 1) were selected for the DSS library based on criteria of local manageability, reasonable implementation costs, heritage compatibility, and transferability to HST contexts. Third, cost–benefit analysis (CBA) following European Commission guidelines [32] evaluated these interventions for Taurasi, quantifying investment costs, environmental and social benefits, and economic returns over a 20-year horizon. From this CBA, unit cost coefficients were derived (e.g., €/inhabitant for population-driven interventions, €/ton for waste-driven interventions), enabling the DSS to rescale costs dynamically for any municipality based on its specific parameters.
The third phase (RA3, “Method and Modelling”) constructed the Municipal Circular Economy Index (MCEI) following OECD guidelines for composite indicators [33]. Domain selection balanced comprehensiveness with data availability for small municipalities. Six domains capture circularity dimensions: Green Enterprise, Sustainable Mobility, Biodiversity and Resource Saving, Water Management, Collected Waste, and Digitalization, Efficiency, Competitiveness and Innovation (DECI). Table 2 summarizes the index architecture.
The Green Enterprise domain warrants attention. For agricultural HSTs, the prevalence of farms with utilized agricultural area functions as a proxy for intangible heritage. In wine-producing settlements like Taurasi, this indicator captures the persistence of viticultural knowledge, traditional land management, and artisanal practices transmitted across generations. Thus, heritage enters the assessment not through building inventories but through the continuity of productive traditions that constitute living cultural patrimony.
Following the OECD procedure [33], raw indicator values undergo z-score standardization. Weighting employs Principal Component Analysis (PCA) with Varimax rotation, deriving weights from empirical covariance structure following methodology validated by Arbolino et al. [34]. Factors were extracted using Kaiser’s criterion (eigenvalues > 1), selecting those accounting for over 60% of total variance. Varimax rotation was applied to enhance factor interpretability by minimizing cross-loadings. Weights were then calculated as the ratio of each factor’s explained variance to total explained variance. Each weight was multiplied by factor scores derived from regression-based component scores.
Finally, the MCEI composite index was constructed using the Simple Additive Weighting (SAW) method, aggregating weighted factor scores for each year.
Because the dataset includes only a few observations over time (5) relative to the number of variables (17), the correlation matrix is necessarily singular, making classical adequacy tests such as KMO and Bartlett unreliable. Therefore, the PCA results should be treated as exploratory rather than confirmatory. Further discussion is provided in Section 4.2.
This phase also defined as the theoretical framework for multi-objective optimization, implemented through What’s Best (LINDO Systems), a linear programming solver. The model adopts a multi-criteria approach and identifies optimal solutions for competing objectives—MCEI improvement, environmental benefits, social benefits, and Net Present Value (NPV)—subject to budget constraints.
To operationalize this framework, the multi-objective and multidimensional decision problem is reformulated into a mono-objective structure through the definition of an aggregate objective function to be maximized or minimized, while respecting a set of constraints expressed through relative indicators [35]. This transformation enables the simulation and comparison of alternative scenarios and supports a structured interaction between analysts and decision-makers. The procedure is iterative and may yield either Pareto-efficient solutions or outcomes requiring the introduction of additional constraints or objectives. The model is formulated as a linear integer programming problem, solved through the simplex algorithm [36], with binary decision variables indicating the inclusion or exclusion of projects within the action plan.
The framework generates four scenarios, compared to an “ideal” benchmark scenario that is theoretically defined but infeasible due to conflicts among objectives. The ideal scenario allows each objective to reach its individual optimum in the absence of constraints; however, simultaneous maximization and minimization of conflicting objectives is not attainable. Accordingly, four alternative scenarios are identified: (i) the “Best Compromise” scenario, obtained by minimizing the distance from the ideal solution; (ii) the “Economic” scenario, based on the maximization of aggregated NPV; (iii) the “Environmental” scenario, focused on maximizing environmental benefits; and (iv) the “Social” scenario, aimed at maximizing social benefits.
The fourth phase (RA4, “DSS Development”) translated the analytical framework into an operational spreadsheet-based tool. Microsoft Excel (Microsoft Excel per Microsoft 365 MSO (Version 2603 Build 16.0.19822.20086)) with Visual Basic for Applications (VBA) macros was chosen to ensure accessibility for municipal administrators lacking specialized software, replacing the external optimization software used in RA3. The DSS implements three computational modules. The first module performs PCA calibration to derive the weighting structure for index aggregation from normalized historical data. The second module enables what-if simulation. When users select interventions, the system applies predefined impacts to relevant indicators (e.g., E-waste Hub adds one firm to the Green Enterprise count and increases waste management expenditure). Modified indicators are re-standardized using z-scores, then aggregated through the PCA weights to produce domain scores. Domain scores sum to the raw MCEI, which is normalized to a 0–100 scale using theoretical bounds set at ±3 standard deviations. The third module performs multi-criteria optimization through exhaustive enumeration. With six binary intervention choices, 64 unique portfolios exist (26). For each portfolio, the system calculates public cost and, if within budget, computes environmental benefits, social benefits, NPV, and projected MCEI. The algorithm identifies optimal portfolios for four objectives: maximizing MCEI improvement, environmental benefits, social benefits, or NPV. Intervention costs and benefits are not hardcoded but calculated dynamically using unit coefficients derived from the Taurasi CBA. A specific CBA was implemented for each intervention in the Taurasi municipality, based on local data on population, waste production, and agricultural firms. For example, Bike Paths’ costs scale with population (€97/inhabitant), Packaging Hub with total MSW (€333/ton), and Sustainable Wineries with the number of agricultural firms (€342,849/firm). This design enables transferability: when a different municipality enters its calibration data, all cost–benefit calculations adjust automatically, producing context-specific optimization results without requiring new CBA studies. The architecture comprises a user-facing Dashboard for interaction, a Calibration sheet for raw data entry, an Indicators sheet containing the PCA calculation engine (hidden sheet), a Benchmarks sheet storing normalization bounds (hidden sheet), and an Optimize sheet displaying results. The tool addresses three policy questions: baseline assessment (“Where are we now?”), scenario simulation (“What could we do?”), and strategy optimization (“What is the best course of action?”).
The RAs form a sequential chain where each phase produces outputs informing subsequent phases. RA1 provided the empirical foundation, RA2 established the normative framework and intervention parameters, RA3 synthesized these inputs into measurement and optimization instruments, and RA4 integrated everything into an operational platform. This cumulative architecture ensures that the DSS recommendations are grounded in context-specific evidence rather than generic prescriptions.

2.3. The Case Study of Taurasi

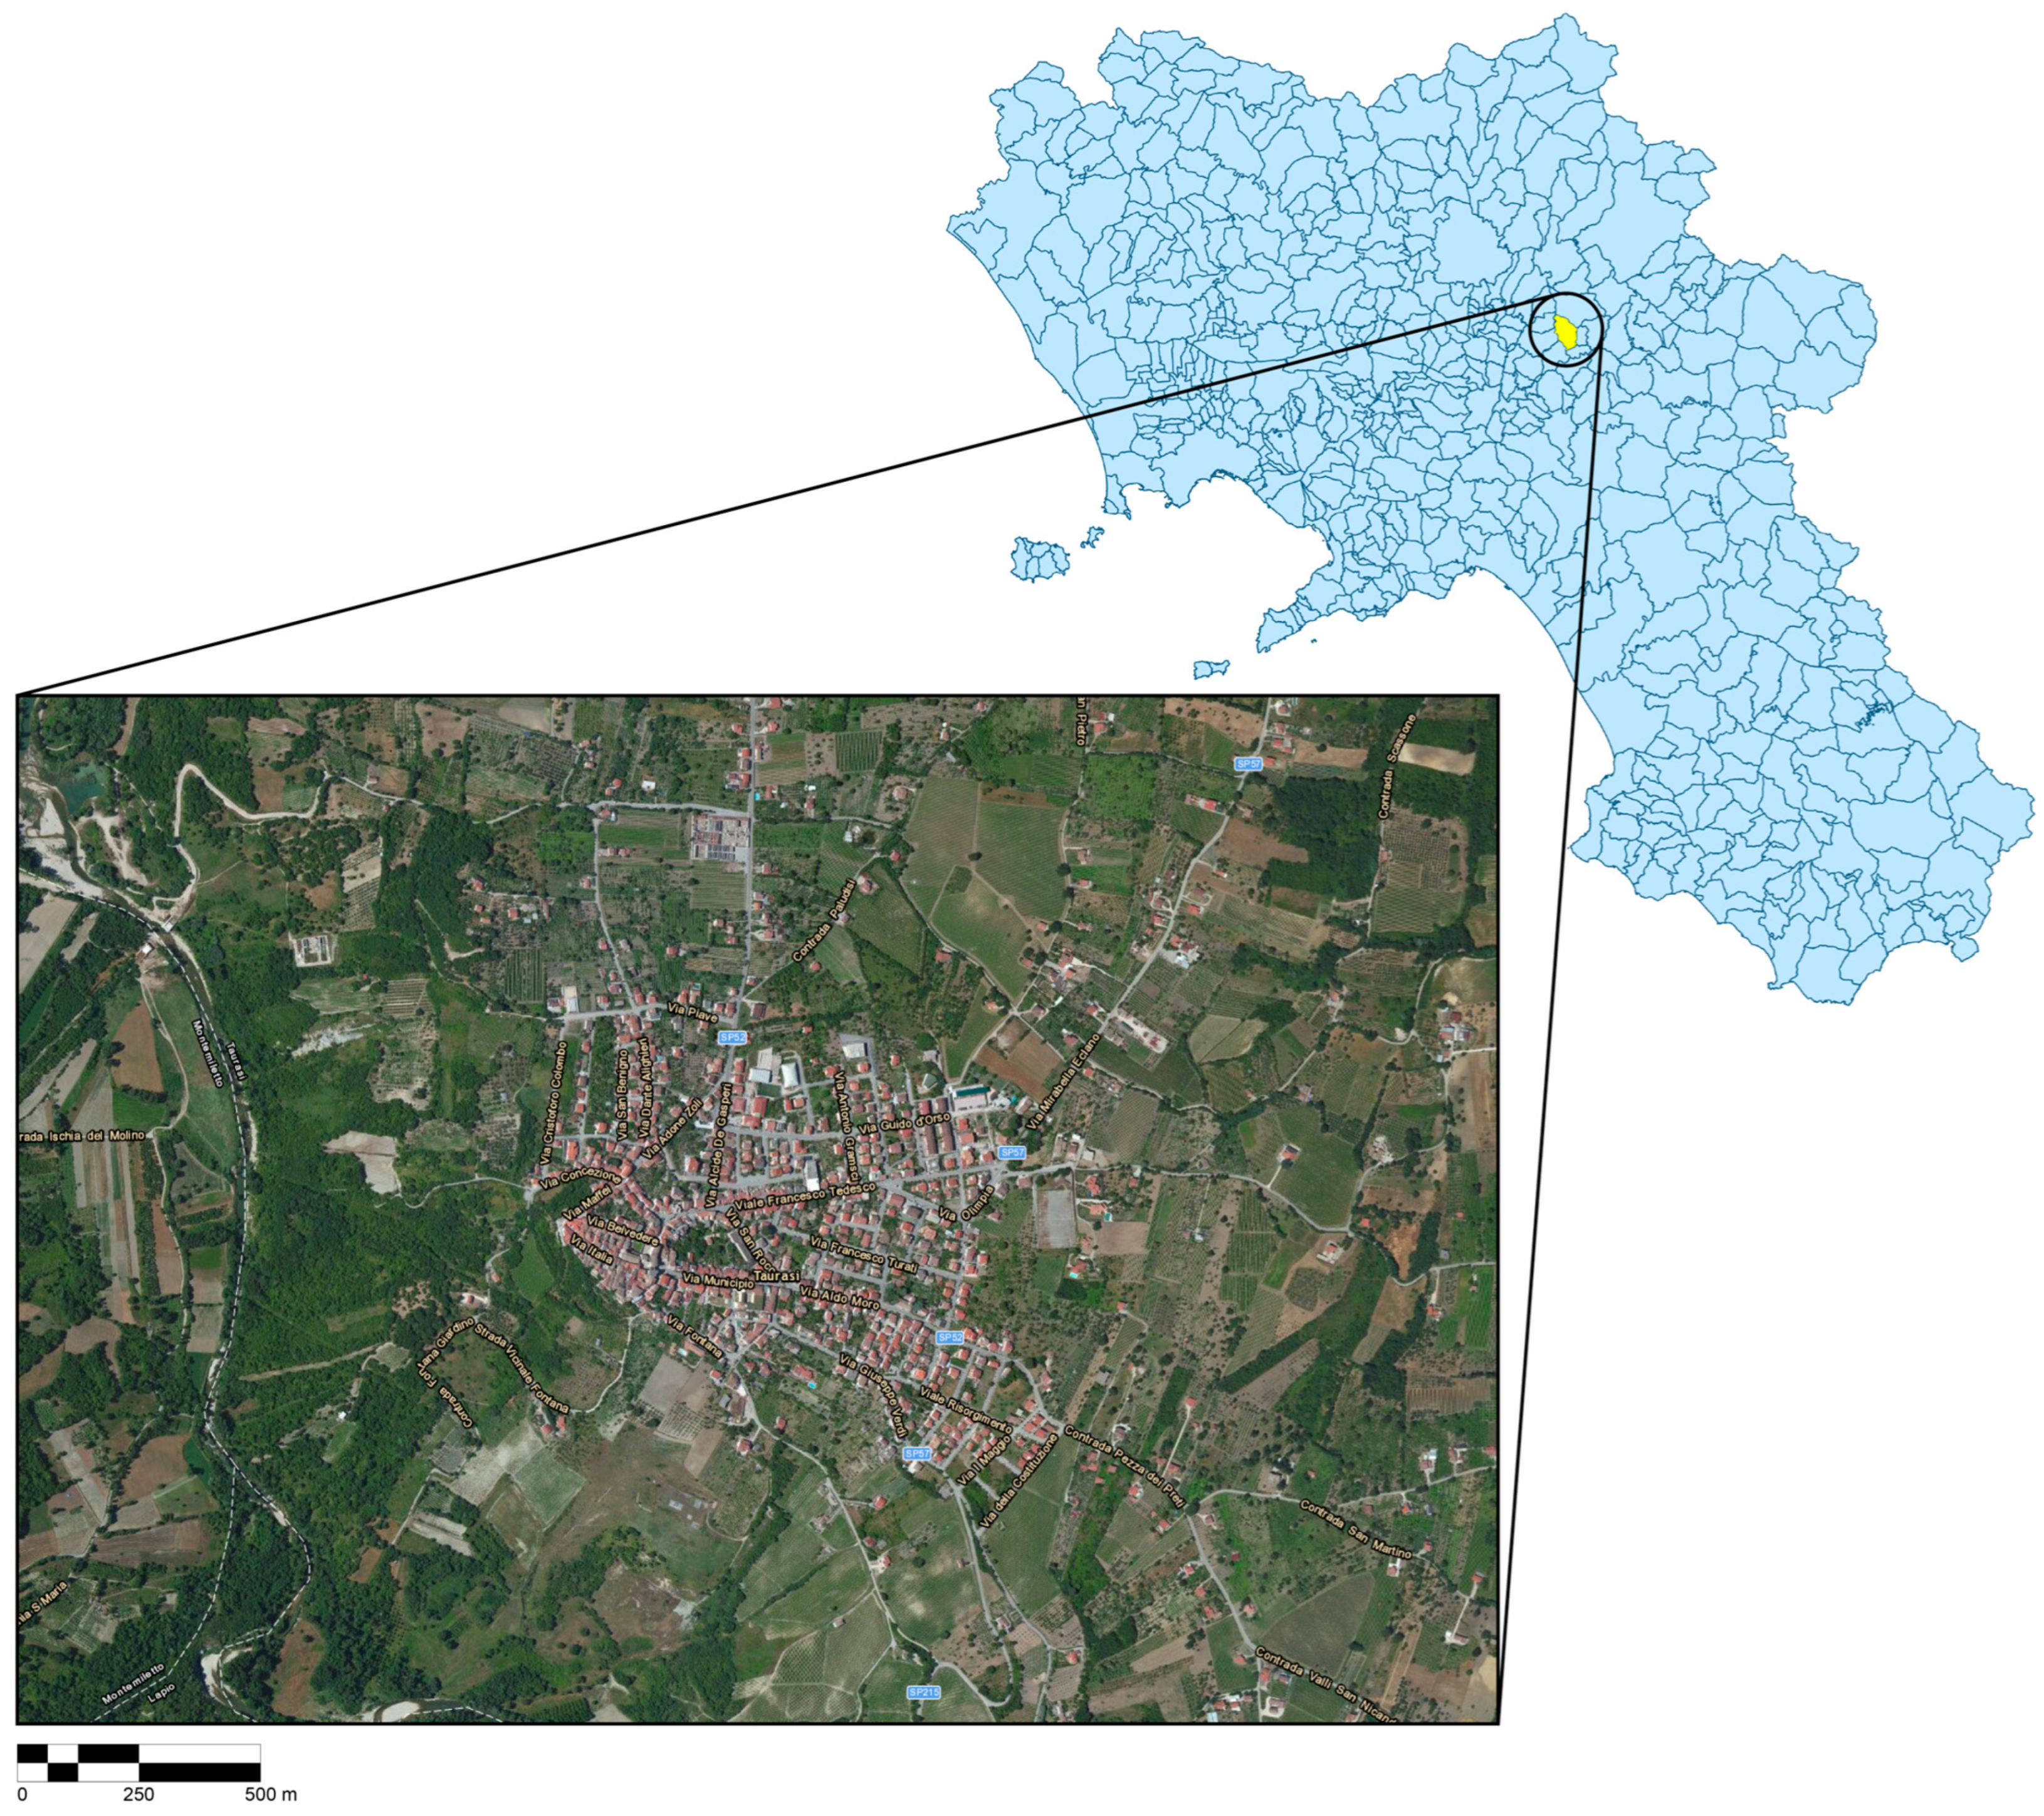
Taurasi is a municipality in the Avellino province, Campania region, southern Italy (Figure 2). Classified as a hill Borgo at 398 m elevation, the settlement has medieval origins centered on the Castello Marchionale from the Lombard period, with subsequent Renaissance and Baroque architectural elements including the 17th century Collegiate Church of San Marciano and the late 16th century Church of Santissimo Rosario.
The municipality has approximately 2100 inhabitants distributed across 975 households. Demographic indicators reflect patterns common to Italian HSTs: negative population growth (−1.36% annually), pronounced aging (old-age index 183.78, average age 47.5 years), and generational imbalance with nearly half the population (47.93%) aged 55 or older while youth (0–17 years) constitute only 7.45%.
The economic identity centers on viticulture. Taurasi wine achieved Denominazione di Origine Controllata e Garantita (DOCG) status in 1993, being the first from Campania to receive this classification. Production follows rigorous standards requiring minimum 36 months aging. The local business ecosystem includes 15 wine production facilities and six grape cultivation operations, complemented by olive cultivation featuring the indigenous Ravece variety. Annual events including the Taurasi Wine Fair position the municipality within regional enogastronomic tourism circuits.
This typological profile, combining Hill Borgo geography, medieval heritage, and specialized agricultural production, makes Taurasi representative of a common HST category within Italian territorial systems. However, it is worth clarifying that Taurasi is used as an exploratory case study to test the proposed procedure and the DSS. Therefore, the findings are not intended to be statistically generalizable, but to assess the applicability of the methodological framework and the DSS.

3. Results

This section presents the DSS application on Taurasi, demonstrating the operational integration of the RAs described above. The study focused on the 2018–2022 period, which corresponds to the most recent available data. As mentioned above, Taurasi is used as an exploratory case study to test the proposed procedure and the DSS. Therefore, the findings are not intended to be statistically generalizable, but to assess the applicability of the methodological framework and the DSS, rather than produce stable, population-level parameter estimates.

3.1. Taurasi MCEI

Table 3 reports the results of the Taurasi MCEI calculation through the years. The first six columns report the standardized values of the index’s domains whilst the last column shows the standardized value of the MCEI.
The overall MCEI showed a steady increase until 2021, peaking in that year, with 2022 reflecting the culmination of ongoing efforts across several domains. “Sustainable Mobility,” “Water Management,” and “Digitalization, Efficiency, Competition, and Innovation” reached their maximum values, indicating continued progress toward circular economy goals. In contrast, the “Collected Waste,” “Green Enterprise,” and “Biodiversity and Resource-Saving” domains declined.
In the “Collected Waste” domain, reductions in variables with negative weights, such as municipal and unsorted waste per capita, contributed positively to the index, reflecting improved separate collection and post-pandemic adjustments in waste generation. However, lower per capita expenditure signals reduced municipal investment, highlighting the need for targeted policies and citizen engagement to sustain performance.
“Sustainable Mobility” and “Digitalization, Efficiency, Competition, and Innovation” remained stable, suggesting strong performance but a potential risk of stagnation, which could be mitigated through infrastructure and digital service enhancements. “Water Management” continued to grow, illustrating effective resource efficiency and network management. Conversely, the “Green Enterprise” and “Biodiversity and Resource-Saving” domains exhibited volatility, influenced by external shocks and highlighting the importance of resilient, long-term strategies, such as habitat preservation and resource-saving initiatives.
These findings suggest that, while some sectors demonstrate sustained improvement, targeted interventions and investments are required in waste management, green enterprise, and biodiversity to enhance Taurasi’s circular economy performance and reduce environmental impacts.

3.2. Taurasi Optimization Model

The proposed model considers the six projects, analyzed in previous activities, as alternatives to be selected. Table 4 lists the values achieved by each objective under the solution generated by the model, along with the deviation (Δ) from the corresponding ideal vectors. The Δ values indicate the distance from the “ideal” scenario, highlighting the trade-offs necessary when selecting solutions to optimize the efficiency of an investment plan from economic, environmental, and social perspectives.
The Best Compromise Solution maintains a balanced performance across all objectives, with four projects financed and a high utilization of the total budget (97.9% of public resources). It is socially preferred compared to the other scenarios, achieving the maximum social benefits (€ 1,171,311.44) with no deviation from the ideal (Δ = 0.0%). Financial indicators, such as NPVe (€ 8,641,983.70, Δ = −0.4%) and IRRe (1.82%, Δ = −2.2%), show minor deviations from the ideal, indicating robust economic performance alongside social and environmental considerations.
The economic scenario emphasizes financial performance, with NPVe achieving the ideal value (€ 8,680,317.89, Δ = 0.0%) and IRRe slightly above the compromise solution (1.83%, Δ = −1.9%). However, this comes into conflict with environmental objectives, which deviate more substantially from the ideal (environmental benefits: € 527,216.59, Δ = −10.0%).
The environmental scenario achieves the highest environmental benefits (€ 585,501.63, Δ = 0.0%) and revenue from production (€4,653,555.23, Δ = 0.0%), but with reduced public resource utilization (79.9%) and a decrease in economic indicators, particularly NPVe (€ 8,144,352.20, Δ = −6.2%) and IRRe (1.73, Δ = −7.4%).
The social scenario maximizes public resource allocation (97.4%) and maintains a high level of social benefits (€ 1,166,892.48, Δ = −0.4%). Nevertheless, it exhibits the largest deviation in IRRe (−26.2%), suggesting that prioritizing social outcomes can substantially reduce investment efficiency.

3.3. Impacts on Taurasi MCEI

Once scenarios were built, the MCEI for Taurasi was reconstructed for each scenario generated by the optimization model. Consequently, the observed differences across pillars and in the overall index reflect alternative allocation strategies under the same budgetary constraints (Table 5).
The “Best compromise” scenario, which maximizes a composite objective function, achieves the highest MCEI value (43.05). This outcome suggests that a balanced project selection across multiple dimensions yields the strongest overall performance. High scores in the Water Management (WM), Collected Waste (CW), and Digitalization, Efficiency, Competitiveness and Innovation (DECI) pillars, combined with solid contributions from the remaining dimensions, underpin the superior aggregate result.
The “Environmental” scenario, designed to prioritize environmental objectives, attains an MCEI value very close to that of the “Best compromise” scenario (42.61). Despite comparatively lower scores in the Green Enterprises (GE) and Biodiversity Resources Saving (BRS) pillars, the selection of environmentally oriented projects produces exceptionally high performance in the Collected Waste (CW) pillar, along with robust outcomes in Water Management (WM) and Digitalization, Efficiency, Competitiveness and Innovation (DECI9). This pattern highlights the presence of compensatory effects among the different dimensions of the index.
The “Social” scenario, which maximizes the social dimension, yields a lower overall MCEI (40.53). The notably high score in the Sustainable Mobility (SM) pillar is fully consistent with the underlying objective function; however, compliance with the budget constraint limits the resources available for projects targeting other pillars, thereby constraining the overall impact on the composite index.
Finally, the “Economic” scenario records the lowest MCEI value (39.35), despite a strong contribution from the Green Enterprises (GE) pillar. This finding indicates that a project portfolio primarily oriented toward economic objectives, when not accompanied by adequate investments in environmental and circularity-related dimensions, is less effective in enhancing overall territorial performance.
Overall, the results confirm that, under a common budget constraint, the choice of the objective function plays a pivotal role in shaping outcomes. Scenarios adopting an integrated, multi-objective approach to project selection tend to generate higher MCEI values, reinforcing the effectiveness of balanced policy strategies relative to narrowly focused alternatives.

3.4. Sensitivity Analysis

To assess the robustness of the optimization results and evaluate the impact of tighter financial constraints on project selection and overall performance, a sensitivity analysis was carried out. This involved reducing the available public budget by 10% relative to the baseline scenario.
The following table (Table 6) illustrates the results of the optimization model for each scenario.
The results indicate that the 10% budget reduction partially modifies the composition of the selected project portfolios, while largely confirming the patterns observed in the previous analysis. In the “Best Compromise” scenario, the model selects five projects instead of four; however, public resource utilization decreases to 84.1% (from 97.9% in the previous analysis), reflecting the inclusion of less expensive projects. This configuration maintains the maximum environmental benefits at €585,501.63 (Δ = 0.0%), but reduces economic performance, with NPVe equal to €8,144,352.20 (Δ = −6.2%) and IRRe equal to 1.73 (Δ = −7.4%). Overall, tighter budget constraints induce a reallocation toward projects generating stronger environmental outcomes, albeit at the expense of financial efficiency.
The “Economic” scenario is more sensitive to the budget contraction. The number of selected projects decreases from four to three (Table 6), with a corresponding deterioration in financial indicators. Specifically, IRRe declines to 1.10, representing a substantial deviation from the ideal value (Δ = −40.8%), while environmental benefits fall to €499,595.23 (Δ = −14.7%). These findings confirm that strategies prioritizing financial objectives produce weaker environmental outcomes under tighter budget conditions.
By contrast, the “Environmental” scenario remains largely stable. Five projects are selected, preserving maximum environmental benefits and production revenues (Δ = 0.0%). Economic indicators are lower than in the ideal scenario, underscoring the inherent trade-offs between environmental and financial objectives under resources constrained.
In the “Social” scenario, three projects are selected, utilizing almost all available public resources (99.0%). Social benefits remain relatively high at €1,146,642.08 (Δ = −2.1%), but financial efficiency declines substantially (IRRe = 1.10; Δ = −41%). This pattern aligns with baseline results and confirms that prioritizing social objectives compromises investment profitability when resources are limited.
The budget reduction also impacts the MCEI outcomes. As illustrated in Table 7, the “Best Compromise” scenario attains the highest index value (55.03), driven by strong performance in the Green Enterprises (GE) and Collected Waste (CW) pillars. The “Environmental” and “Social” scenarios achieve similar values (42.61 and 43.86, respectively), whereas the “Economic” scenario records the lowest performance (40.17).
Overall, the sensitivity analysis confirms the robustness of the baseline findings. Even under stricter budget constraints, multi-objective scenarios—particularly the “Best Compromise” configuration—deliver superior overall territorial performance. In contrast, single objective strategies prove more vulnerable to financial limitations, exhibiting pronounced trade-offs among economic, environmental, and social dimensions. These results underscore the optimization model’s capacity to identify efficient project portfolios under varying conditions, affirming its stability and methodological reliability for decision-making.

4. Discussion

4.1. Multi-Criteria Tradeoffs and Budget Constraints

The optimization results display fundamental tensions in CE intervention selection. Rather than prescribing a single “best” answer, the multi-criteria presentation enables administrators to align choices with local priorities. This finding resonates with the challenge addressed by the Sustainability Balanced Scorecard framework [37]. When environmental and social dimensions are managed through separate systems rather than integrated strategically, the value trade-offs inherent in sustainability assessment remain obscured from deliberative scrutiny.
The gap between diagnostic assessment and optimization outcomes warrants attention. Baseline analysis identified Water Management as the most critical domain, yet budget constraints excluded the only intervention addressing this gap. This disconnect is amplified in small municipalities, where CE governance remains fragmented and predominantly limited to waste management functions [38].
The compensatory effects observed across index dimensions expose a known limitation of additive aggregation: strong performance in one domain can fully offset poor performance in another [39]. In sustainability assessment, this implies that economic gains could theoretically compensate environmental degradation, which is precisely what CE transition aims to prevent [40]. In the Taurasi baseline, the MCEI increases from near-zero to 35.4 over the study period, yet this upward trend is driven entirely by three domains (Water Management, Collected Waste, DECI), while Green Enterprise declines from 41.7 to near-zero and Biodiversity remains stagnant. The additive composite conceals this divergence [39,40].
The PCA-based weighting merits reflection. Factor loadings derived from historical data reflect past performance patterns rather than normative priorities. Alternative approaches such as equal weighting or expert-based Analytic Hierarchy Process [33] would produce different rankings. PCA-derived weights reflect statistical correlation, not normative importance: a critical dimension that weakly correlated with others receives low weight regardless of its policy relevance [41]. Moreover, PCA weights are sensitive to sample composition and tend to be inconsistent across time and space [39], reinforcing the preliminary character of the present calibration. User-adjustable weight configurations would allow municipalities to align the index with local priorities.

4.2. Transferability and Limitations

The DSS architecture follows composite indicator construction principles, emphasizing cross-context comparability [33]. Standardized input parameters available through national databases (ISTAT, ISPRA) reduce data collection burden for potential adopters. Nevertheless, transferring CE solutions across territories involves geographic, socio-economic, socio-cultural, legal, and governance barriers that can render direct replication suboptimal [42]. Transferability is higher when the tool builds on resources and institutional features present in the recipient context rather than on place-specific characteristics of the pilot site.
However, limitations warrant acknowledgment. The PCA calibration on Taurasi’s historical series (namely, 2018–2022) produces benchmarks reflecting single-case trajectories rather than cross-municipal variation. Given the very limited number of time observations relative to the number of variables (n = 5; p = 17), the correlation matrix is necessarily singular. Consequently, classical adequacy tests such as KMO and Bartlett’s test are not computable or statistically reliable. For this reason, the PCA must be interpreted as an exploratory dimensionality-reduction exercise rather than as a confirmatory factor structure.
Normalized scores indicate performance relative to this baseline, constraining interpretation until validation across diverse municipalities establishes broader reference points. An important consequence of this approach is visible in the DECI domain of the Taurasi case-study, which reached a maximum score of 100.00. This reflects a “ceiling effect” where the municipality has saturated its own historical benchmark, potentially obscuring remaining gaps when compared to higher-performing external contexts. To mitigate this in future iterations, integrating regional or national benchmarks would prevent score saturation and provide a more rigorous assessment of relative performance. Output quality depends on input data availability; agricultural waste streams and informal activities resist capture through official statistics.
Quantitative models often fail to capture context-sensitive factors. Moreover, standardized parameters cannot fully reflect the variation in governance arrangements. For instance, Fratini et al. [43] emphasized how urban imaginaries and political coalitions shape CE pathways. These factors may be hard to quantify but are proven to be decisive for implementation success. Indeed, these qualitative dimensions suggest the tool functions most effectively within broader planning processes incorporating participatory elements [44].
Application to distinct HST typologies such as coastal settlements, mountain communities, or industrial heritage towns would require intervention library recalibration and potentially indicator revision. Future research should prioritize multi-municipality validation to strengthen transferability claims and refine PCA parameters through expanded empirical bases.
Lastly, the results reflect the specific municipality selected as the case study and are not intended to be generalized. Applying the DSS to a different municipality could lead to different trends in the MCEI and its domains.

5. Conclusions

This study presented a DSS for CE transition in Italian HSTs, developed through the H-SMA-CE project and tested on Taurasi territory. The DSS is by the context analysis, an intervention library with cost–benefit data, and a composite MCEI within an accessible spreadsheet platform designed for small municipal administrations lacking specialized technical resources.
The Taurasi application demonstrated the tool’s evaluative and explorative functions. Baseline assessment identified substantial heterogeneity across circularity domains, with “Water Management” at the theoretical minimum and DECI at maximum. Multi-criteria optimization revealed that the “best” intervention depends fundamentally on strategic priorities: MCEI maximization and NPV maximization selected different interventions with divergent outcomes. This finding underscores the value of presenting parallel solutions rather than embedding implicit value judgments in single recommendations.
The analysis also exposed a practical tension between diagnosis and prescription. Budget constraints excluded the only intervention addressing the lowest-performing domain, redirecting optimization toward achievable improvements elsewhere. This transparency constitutes a core strength of the tool: by making these socio-economic and environmental trade-offs explicit, the DSS empowers local policymakers to transition from intuitive decision-making to evidence-based governance. It ensures that even when budget limits prevent addressing the most critical gaps, the chosen interventions are part of a coherent, optimized strategy for territorial resilience. Administrators can use this information to pursue phased implementation or budget reallocation strategies, effectively bridging the gap between diagnostic evidence and political feasibility.
The heritage–circularity relationship emerged as synergy rather than tension. Taurasi’s viticultural identity provides foundations for circular interventions that build upon traditional practices rather than imposing external solutions. This alignment suggests that HSTs may possess underutilized assets for CE transition when interventions respect local productive systems.
The main limitation of the study is its focus on a single case study, which limits the generalizability of the findings. To overcome this limitation, future research should prioritize multi-municipality validation to establish cross-contextual benchmarks and refine the empirical calibration of the model. Additional limitations include data availability (particularly concerning informal or unrecorded activities), context-specific governance and cultural factors, and the need to adapt interventions for different HST typologies. Future research could address these limitations through the integration of primary or crowd-sourced data, incorporation of qualitative governance indicators, and longitudinal ex-post evaluations, thereby enhancing transferability and the robustness of the DSS. Expanding the intervention library through collaborative applications would further enhance applicability across diverse HST typologies and reduce context-specific constraints associated with limited data availability. Longitudinal studies tracking implementation outcomes would address a gap in the literature where ex-ante assessment tools predominate over ex-post evaluation.

Author Contributions

Conceptualization, G.I., G.C. (Grazia Calabrò), G.C. (Giuseppe Caristi), C.C., R.A., A.L., L.D.S. and I.R.; methodology, G.I., G.C. (Grazia Calabrò), G.C. (Giuseppe Caristi), C.C., R.A., A.L., L.D.S. and I.R.; software, G.I., G.C. (Grazia Calabrò), G.C. (Giuseppe Caristi), C.C., R.A., A.L., L.D.S. and I.R.; validation, G.I., G.C. (Grazia Calabrò), G.C. (Giuseppe Caristi), C.C., R.A., A.L., L.D.S. and I.R.; formal analysis, G.I., G.C. (Grazia Calabrò), G.C. (Giuseppe Caristi), C.C., R.A., A.L., L.D.S. and I.R.; investigation, G.I., G.C. (Grazia Calabrò), G.C. (Giuseppe Caristi), C.C., R.A., A.L., L.D.S. and I.R.; resources, G.I., G.C. (Grazia Calabrò), G.C. (Giuseppe Caristi), C.C., R.A., A.L., L.D.S. and I.R.; data curation, G.I., G.C. (Grazia Calabrò), G.C. (Giuseppe Caristi), C.C., R.A., A.L., L.D.S. and I.R.; writing—original draft preparation, G.I., G.C. (Grazia Calabrò), G.C. (Giuseppe Caristi), C.C., R.A., A.L., L.D.S. and I.R.; writing—review and editing, G.I., G.C. (Grazia Calabrò), G.C. (Giuseppe Caristi), C.C., R.A., A.L., L.D.S. and I.R.; visualization, G.I., R.A., G.C. (Grazia Calabrò), A.L. and G.C. (Giuseppe Caristi); supervision, G.I. and R.A.; project administration, G.I. and R.A.; funding acquisition, G.I. and R.A. All authors have read and agreed to the published version of the manuscript.

Funding

This research was funded by Project “H-SMA-CE: a decision support system for circular economy transition”, PNRR—Missione 4, Componente 2, Investimento 1.1—Bando Prin 2022—Decreto Direttoriale n. 104 del 02-02-2022, grant number CUP J53D23009390006—codice identificativo 2022JZLL7J.

Institutional Review Board Statement

Not applicable.

Informed Consent Statement

Not applicable.

Data Availability Statement

The original contributions presented in this study are included in the article. Further inquiries can be directed to the corresponding author.

Conflicts of Interest

The authors declare no conflicts of interest.

Abbreviations

The following abbreviations are used in this manuscript:
CECircular Economy
HSTsHistorical Small Towns
DSSDecision Support System
MCEIMunicipal Circular Economy Index
RAResearch Activity
MFAMaterial Flow Analysis
DECIDigitalization, Efficiency, Competitiveness and Innovation
NPVNet Present Value
PCAPrincipal Component Analysis
DOCGDenominazione di Origine Controllata e Garantita

References

  1. Rotondo, F.; Selicato, F.; Marin, V.; Lopez Galdeano, J. Cultural Territorial Systems: Landscape and Cultural Heritage as a Key to Sustainable and Local Development in Eastern Europe; Springer: Cham, Switzerland, 2016; ISBN 978-3-319-20752-0. [Google Scholar] [CrossRef]
  2. Accetturo, A.; Mocetti, S. Historical Origins and Developments of Italian Cities. Ital. Econ. J. 2019, 5, 205–222. [Google Scholar] [CrossRef]
  3. IFEL. Piccoli Comuni 2024; Istituto per la Finanza e l’Economia Locale: Rome, Italy, 2024. [Google Scholar]
  4. ANCI. Small City & Smart Land. In Proceedings of the XVIII Conferenza nazionale Piccoli Comuni, Viverone, Italy, 13 July 2018. [Google Scholar]
  5. ISTAT. Censimento e Dinamica Della Popolazione Anno 2024; Censimenti Permanenti—L’italia, Giorno Dopo Giorno; Istituto Nazionale di Statistica: Rome, Italy, 2025. [Google Scholar]
  6. Wolff, M.; Haase, A.; Leibert, T. Contextualizing Small Towns—Trends of Demographic Spatial Development in Germany 1961–2018. Geogr. Ann. Ser. B Hum. Geogr. 2021, 103, 196–217. [Google Scholar] [CrossRef]
  7. Martinez-Fernandez, C.; Audirac, I.; Fol, S.; Cunningham-Sabot, E. Shrinking Cities: Urban Challenges of Globalization. Int. J. Urban Reg. Res. 2012, 36, 213–225. [Google Scholar] [CrossRef]
  8. Pendlebury, J.; Short, M.; While, A. Urban World Heritage Sites and the Problem of Authenticity. Cities 2009, 26, 349–358. [Google Scholar] [CrossRef]
  9. Korhonen, J.; Nuur, C.; Feldmann, A.; Birkie, S.E. Circular Economy as an Essentially Contested Concept. J. Clean. Prod. 2018, 175, 544–552. [Google Scholar] [CrossRef]
  10. Fusco Girard, L.; Nocca, F. Moving Towards the Circular Economy/City Model: Which Tools for Operationalizing This Model? Sustainability 2019, 11, 6253. [Google Scholar] [CrossRef]
  11. Ellen MacArthur Foundation. Delivering the Circular Economy: A Toolkit for Policymakers; Ellen MacArthur Foundation: Cowes, UK, 2015; p. 177. Available online: https://www.ellenmacarthurfoundation.org/a-toolkit-for-policymakers (accessed on 5 February 2026).
  12. D’Alessandro, C.; Szopik-Depczyńska, K.; Tarczyńska-Łuniewska, M.; Silvestri, C.; Ioppolo, G. Exploring Circular Economy Practices in the Healthcare Sector: A Systematic Review and Bibliometric Analysis. Sustainability 2024, 16, 401. [Google Scholar] [CrossRef]
  13. Vanhuyse, F. The Urban Circularity Assessment Framework (UCAF): A Framework for Planning, Monitoring, Evaluation, and Learning from CE Transitions in Cities. Circ. Econ. Sustain. 2024, 4, 1069–1092. [Google Scholar] [CrossRef]
  14. Van Bueren, B.J.A.; Iyer-Raniga, U.; Leenders, M.A.A.M.; Argus, K. Comprehensiveness of Circular Economy Assessments of Regions: A Systematic Review at the Macro-Level. Environ. Res. Lett. 2021, 16, 103001. [Google Scholar] [CrossRef]
  15. D’Alessandro, C.; Licastro, A.; Arbolino, R.; Calabrò, G.; Ioppolo, G. A Circular Land Use Model for Reconciling Industrial Expansion with Agricultural Heritage in Italian Industrial Parks. Sustainability 2025, 17, 8830. [Google Scholar] [CrossRef]
  16. D’Amico, G.; Arbolino, R.; Shi, L.; Yigitcanlar, T.; Ioppolo, G. Digital Technologies for Urban Metabolism Efficiency: Lessons from Urban Agenda Partnership on Circular Economy. Sustainability 2021, 13, 6043. [Google Scholar] [CrossRef]
  17. Della Spina, L. Adaptive Sustainable Reuse for Cultural Heritage: A Multiple Criteria Decision Aiding Approach Supporting Urban Development Processes. Sustainability 2020, 12, 1363. [Google Scholar] [CrossRef]
  18. Gravagnuolo, A.; Angrisano, M.; Fusco Girard, L. Circular Economy Strategies in Eight Historic Port Cities: Criteria and Indicators Towards a Circular City Assessment Framework. Sustainability 2019, 11, 3512. [Google Scholar] [CrossRef]
  19. Tira, Y.; Türkoğlu, H. Circularity-Based Decision-Making Framework for the Integrated Conservation of Built Heritage: The Case of the Medina of Tunis. Built Herit. 2023, 7, 16. [Google Scholar] [CrossRef]
  20. Kirchherr, J.; Reike, D.; Hekkert, M. Conceptualizing the Circular Economy: An Analysis of 114 Definitions. Resour. Conserv. Recycl. 2017, 127, 221–232. [Google Scholar] [CrossRef]
  21. De Pascale, A.; Arbolino, R.; Szopik-Depczyńska, K.; Limosani, M.; Ioppolo, G. A Systematic Review for Measuring Circular Economy: The 61 Indicators. J. Clean. Prod. 2021, 281, 124942. [Google Scholar] [CrossRef]
  22. Saidani, M.; Yannou, B.; Leroy, Y.; Cluzel, F.; Kendall, A. A Taxonomy of Circular Economy Indicators. J. Clean. Prod. 2019, 207, 542–559. [Google Scholar] [CrossRef]
  23. Moraga, G.; Huysveld, S.; Mathieux, F.; Blengini, G.A.; Alaerts, L.; Van Acker, K.; de Meester, S.; Dewulf, J. Circular Economy Indicators: What Do They Measure? Resour. Conserv. Recycl. 2019, 146, 452–461. [Google Scholar] [CrossRef]
  24. Ghinoi, S.; Silvestri, F.; Spigarelli, F.; Tassinari, M. A Methodological Proposal for Developing a Municipality Indicator of Circular Economy (MICE). Resour. Conserv. Recycl. 2024, 211, 107871. [Google Scholar] [CrossRef]
  25. Wang, N.; Lee, J.C.K.; Zhang, J.; Chen, H.; Li, H. Evaluation of Urban Circular Economy Development: An Empirical Research of 40 Cities in China. J. Clean. Prod. 2018, 180, 876–887. [Google Scholar] [CrossRef]
  26. Heshmati, A.; Rashidghalam, M. Assessment of the Urban Circular Economy in Sweden. J. Clean. Prod. 2021, 310, 127475. [Google Scholar] [CrossRef]
  27. Elia, V.; Gnoni, M.G.; Tornese, F. Measuring Circular Economy Strategies through Index Methods: A Critical Analysis. J. Clean. Prod. 2017, 142, 2741–2751. [Google Scholar] [CrossRef]
  28. Foster, G.; Saleh, R. The Circular City and Adaptive Reuse of Cultural Heritage Index: Measuring the Investment Opportunity in Europe. Resour. Conserv. Recycl. 2021, 175, 105880. [Google Scholar] [CrossRef]
  29. Cleere, H. Council of Europe Framework Convention on the Value of Cultural Heritage for Society 2005. In Encyclopedia of Global Archaeology; Springer International Publishing: Cham, Switzerland, 2020. [Google Scholar]
  30. Barles, S. Urban Metabolism of Paris and Its Region. J. Ind. Ecol. 2009, 13, 898–913. [Google Scholar] [CrossRef]
  31. Tricco, A.C.; Lillie, E.; Zarin, W.; O’Brien, K.K.; Colquhoun, H.; Levac, D.; Moher, D.; Peters, M.D.J.; Horsley, T.; Weeks, L.; et al. PRISMA Extension for Scoping Reviews (PRISMA-ScR): Checklist and Explanation. Ann. Intern. Med. 2018, 169, 467–473. [Google Scholar] [CrossRef] [PubMed]
  32. European Commission. Guide to Cost-Benefit Analysis of Investment Projects: Economic Appraisal Tool for Cohesion Policy 2014–2020; Directorate-General for Regional and Urban Policy: Brussels, Belgium, 2014. [Google Scholar]
  33. OECD. Handbook on Constructing Composite Indicators: Methodology and User Guide; OECD Publishing: Paris, France, 2008; ISBN 978-92-64-04345-9. [Google Scholar]
  34. Arbolino, R.; Boffardi, R.; De Simone, L.; Ioppolo, G.; Lopes, A. Circular Economy Convergence across European Union: Evidence on the Role Policy Diffusion and Domestic Mechanisms. Socio-Econ. Plan. Sci. 2024, 96, 102051. [Google Scholar] [CrossRef]
  35. Boffardi, R.; De Simone, L.; De Pascale, A.; Ioppolo, G.; Arbolino, R. Best-Compromise Solutions for Waste Management: Decision Support System for Policymaking. Waste Manag. 2021, 121, 441–451. [Google Scholar] [CrossRef]
  36. Dantzig, G.B.; Thapa, M.N. Linear Programming: 2: Theory and Extensions; Springer: New York, NY, USA, 2003. [Google Scholar]
  37. Figge, F.; Hahn, T.; Schaltegger, S.; Wagner, M. The Sustainability Balanced Scorecard—Linking Sustainability Management to Business Strategy. Bus. Strategy Environ. 2002, 11, 269–284. [Google Scholar] [CrossRef]
  38. Dagilienė, L.; Varaniūtė, V.; Bruneckienė, J. Local Governments’ Perspective on Implementing the Circular Economy: A Framework for Future Solutions. J. Clean. Prod. 2021, 310, 127340. [Google Scholar] [CrossRef]
  39. Greco, S.; Ishizaka, A.; Tasiou, M.; Torrisi, G. On the Methodological Framework of Composite Indices: A Review of the Issues of Weighting, Aggregation, and Robustness. Soc. Indic. Res. 2019, 141, 61–94. [Google Scholar] [CrossRef]
  40. Munda, G. “Measuring Sustainability”: A Multi-Criterion Framework. Environ. Dev. Sustain. 2005, 7, 117–134. [Google Scholar] [CrossRef]
  41. Gan, X.; Fernandez, I.C.; Guo, J.; Wilson, M.; Zhao, Y.; Zhou, B.; Wu, J. When to Use What: Methods for Weighting and Aggregating Sustainability Indicators. Ecol. Indic. 2017, 81, 491–502. [Google Scholar] [CrossRef]
  42. Dąbrowski, M.; Varjú, V.; Amenta, L. Transferring Circular Economy Solutions across Differentiated Territories: Understanding and Overcoming the Barriers for Knowledge Transfer. Facil. Circ. Econ. Urban Plan. 2019, 4, 52–62. [Google Scholar] [CrossRef]
  43. Fratini, C.F.; Georg, S.; Jørgensen, M.S. Exploring Circular Economy Imaginaries in European Cities: A Research Agenda for the Governance of Urban Sustainability Transitions. J. Clean. Prod. 2019, 228, 974–989. [Google Scholar] [CrossRef]
  44. Poljak Istenič, S.; Kozina, J. Participatory Planning in a Post-Socialist Urban Context: Experience from Five Cities in Central and Eastern Europe. In Participatory Research and Planning in Practice; Nared, J., Bole, D., Eds.; The Urban Book Series; Springer International Publishing: Cham, Switzerland, 2020; pp. 31–50. ISBN 978-3-030-28013-0. [Google Scholar]
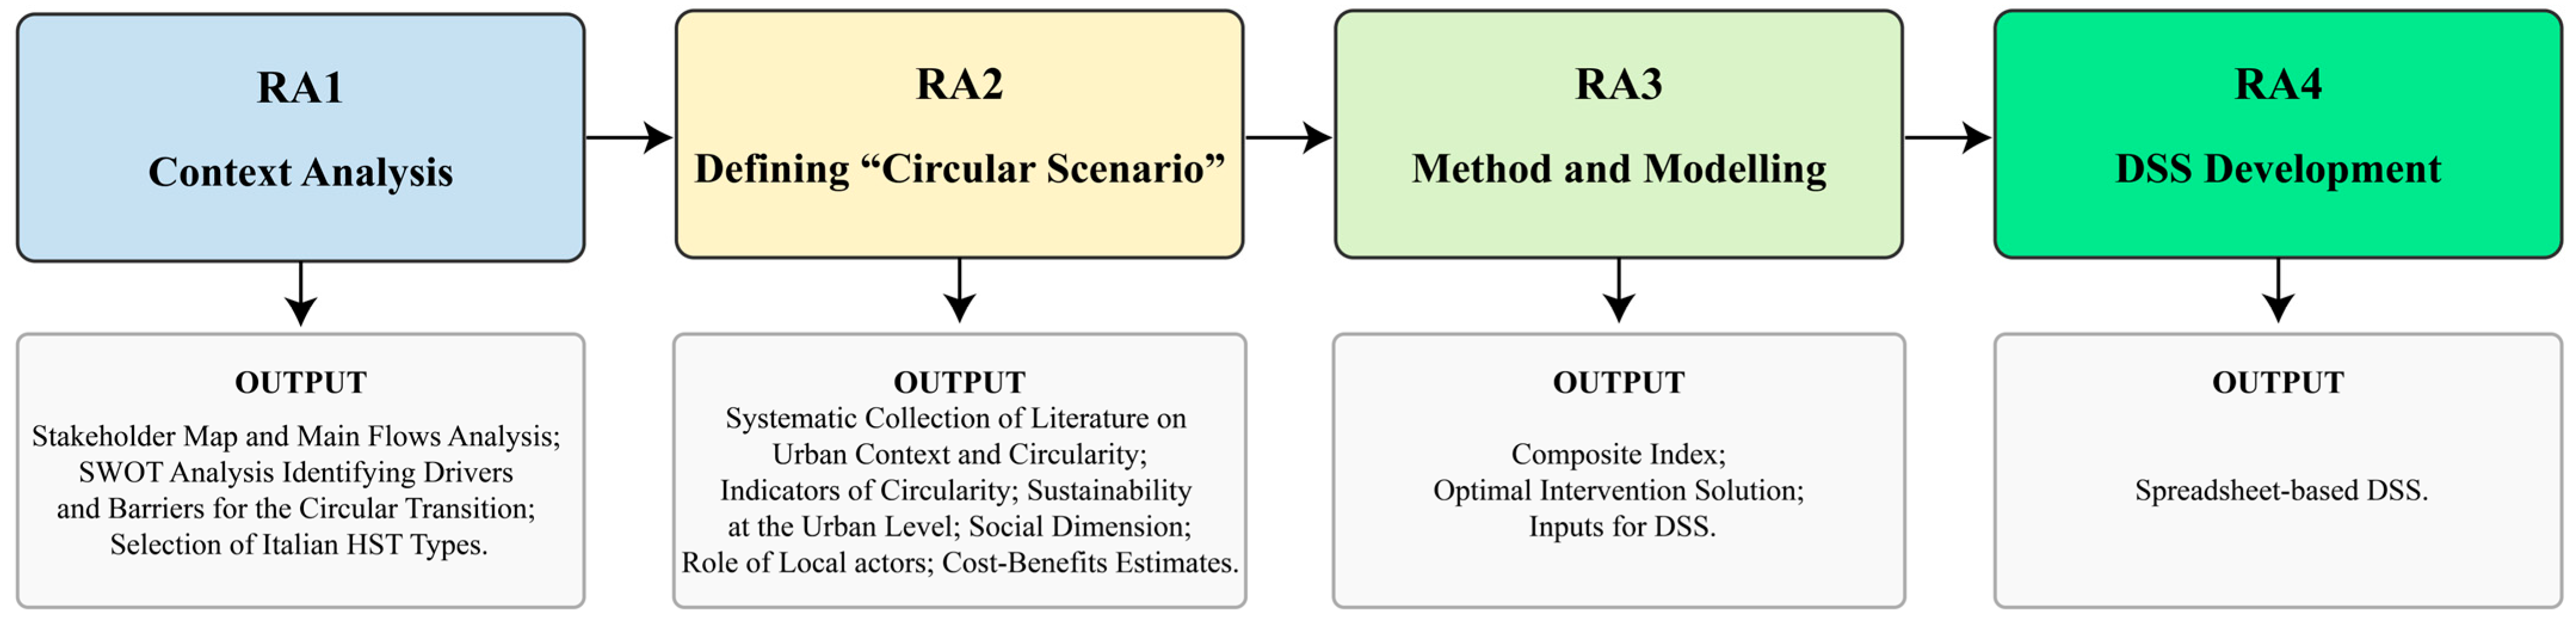
Figure 1. Research design of the H-SMA-CE project. Source: authors’ elaboration.
Sustainability 18 03302 g001
Figure 2. Taurasi location. Source: authors’ elaboration using Esri system via ArcGIS Online (available at https://www.arcgis.com/index.html, accessed on 5 February 2026).
Sustainability 18 03302 g002
Table 1. Intervention library selected for Taurasi informing the DSS.
InterventionDescription
Community CompostingDecentralized organic waste treatment facility transforming household and commercial waste into agricultural inputs
Rainwater HarvestingCollection and storage infrastructure capturing precipitation for non-potable uses and irrigation
Bike PathsLow-emission mobility infrastructure reducing motorized transport in historical centers
Packaging HubReusable packaging facility for local commercial activities
E-waste HubWEEE collection and recovery center enabling material valorization
Sustainable WineriesCE practices in viticulture: by-product valorization, renewable energy, closed-loop resource management
Table 2. Municipal Circular Economy Index (MCEI) construction framework.
DomainN. IndicatorsKey VariablesCE Dimension CapturedSource
Green Enterprise1Agricultural firms with utilized agricultural area/total firmsProductive land stewardship, traditional knowledge continuityISTAT
Sustainable Mobility1High-emission motorization rateTransport decarbonization, urban qualityISTAT
Biodiversity and Resource Saving1Public funds granted for environmental projects per capitaInvestment in natural capitalOpenCoesione
Water Management3Water leakage, water input per capita, supplied water per capitaResource efficiency, infrastructure qualityISTAT
Collected Waste6Municipal solid waste (MSW) per capita, MSW Sorted/MSW, Sorted MSW per capita, Unsorted MSW per capita, Collected hazardous waste, Per capita historical expenditure for waste management, Per capita standard expenditure for waste managementMaterial flow management, service capacityCatasto rifiuti—Isprambiente; Opencivitas
DECI5Accessibility of local government digital properties,
Population aged between 25 and 64 with no more than a lower secondary school diploma or vocational training certificate,
Employment rate (20–64 years old),
Employees in low-productivity local units in the industry and services sector—(ventile)
Enabling conditions for CE transitionOpenData IPA; ISTAT
Table 3. Taurasi MCEI and domains through the years.
Domains Indexes
YearGreen EnterpriseSustainable
Mobility
Biodiversity
Resource-Saving
Water
Management
Collected
Waste
DECIMCEI
201841.670.0100.1000.0100.0100.0100.010
201932.7611.1528.17513.89813.68921.30810.331
202060.5218.250.10046.07257.49134.43826.359
202111.8225.3410.47660.05673.71457.94835.856
20220.1025.340.10069.76663.58657.94835.418
Note: the table reports the values obtained with the minimum shift approach. This technique shifts all values in a series to be strictly positive by subtracting the minimum and adding a small margin (0.01), preserving absolute differences and relative rankings across years. For Taurasi, this approach is preferred over standard normalization, as it emphasizes year-to-year variations rather than mapping values to a fixed interval.
Table 4. Best compromise scenario, economic scenario, environmental scenario, social scenario, and deviation from the ‘ideal’ solution. Taurasi Municipality.
ScenarioBest CompromiseΔ IdealEconomicΔ IdealEnvironmentalΔ IdealSocialΔ Ideal
N. projects4 4 5 4
% Pub. resources97.9% 96.5% 79.9% 97.4%
Public resources4,404,294.39 −8.9%4,344,596.59 −10.2%3,596,838.51 −25.6%4,381,157.79 −9.4%
Private resourcees3,373,049.23 −3.0%3,382,401.43 −2.7%3,327,186.91 −4.3%3,477,854.23 0.0%
Revenue from production4,606,269.61 −1.0%4,374,108.20 −6.0%4,653,555.23 0.0%4,627,741.61 −0.6%
Environmental benefits537,563.59 −8.2%527,216.59 −10.0%585,501.63 0.0%541,473.31 −7.5%
Social benefits1,171,311.44 0.0%1,161,099.77 −0.9%1,125,141.84 −3.9%1,166,892.48 −0.4%
NPVe8,641,983.70 −0.4%8,680,317.89 0.0%8,144,352.20 −6.2%8,656,155.94 −0.3%
IRRe1.82 −2.2%1.83−1.9%1.73 −7.4%1.37−26.2%
Table 5. Taurasi MCEI and its pillars in the four scenarios.
ScenarioGE PillarSM PillarBRS PillarWM PillarCW PillarDECI PillarTaurasi MCEI
Best44.6030.0123.4877.3475.7067.3643.05
Env16.5731.4512.8865.0889.5955.8842.61
Social15.1941.5219.6161.2871.7456.0440.53
Econ39.0731.5619.5260.0170.5060.1239.35
Table 6. Optimization model results under a 10% reduction in the available public budget.
ScenarioBest CompromiseΔ IdealEconomicΔ IdealEnvironmentalΔ IdealSocialΔ Ideal
N. projects5 3 5 3
% Pub. resources84.1% 97.6% 84.1% 99.0%
Public resources3,596,838.51−15.9%4,174,007.79 −13.8%3,596,838.51 −15.9%4,233,705.59 −1.0%
Private resourcees3,327,186.91−4.3%3,339,754.23 −4.0%3,327,186.91 −4.3%3,330,402.03 −4.2%
Revenue from production4,653,555.230.0%4,318,108.20 −7.2%4,653,555.23 0.0%4,550,269.61 −2.2%
Environmental benefits585,501.630.0%499,595.23 −14.7%585,501.63 0.0%509,942.23 −12.9%
Social benefits1,125,141.84−3.9%1,136,430.41 −3.0%1,125,141.84 −3.9%1,146,642.08 −2.1%
NPVe8,144,352.20−6.2%8,408,997.05 −3.1%8,144,352.20 −6.2%8,370,662.85 −3.6%
IRRe1.73−7.4%1.10−40.8%1.73−7.4%1.10−41.0%
Table 7. MCEI impacts under a 10% reduction in the available public budget.
ScenarioGE PillarSM PillarBRS PillarWM PillarCW PillarDECI PillarTaurasi MCEI
Best51.6938.2217.5564.8591.2165.3555.03
Env16.5731.4512.8865.0889.5955.8842.61
Social27.1040.9314.0550.4292.4457.8943.86
Econ35.2531.0219.5460.0871.8460.6940.17
Disclaimer/Publisher’s Note: The statements, opinions and data contained in all publications are solely those of the individual author(s) and contributor(s) and not of MDPI and/or the editor(s). MDPI and/or the editor(s) disclaim responsibility for any injury to people or property resulting from any ideas, methods, instructions or products referred to in the content.