Article

Meteorological Drought Variability in the Upper Vistula Basin During Period 1961–2022

1
Department of Ecology, Climatology and Air Protection, University of Agriculture in Krakow, St. Mickiewicza 24-28, 30-059 Krakow, Poland
2
Department of Sanitary Engineering and Water Management, University of Agriculture in Krakow, St. Mickiewicza 24-28, 30-059 Krakow, Poland
3
Territorial Research Area of Cosenza, National Research Council of Italy, Via Cavour 4/6, 87036 Rende, CS, Italy
4
Research Institute for Geo-Hydrological Protection (CNR-IRPI), National Research Council of Italy, Via Cavour 4/6, 87036 Rende, CS, Italy
*
Author to whom correspondence should be addressed.
Sustainability 2026, 18(7), 3288; https://doi.org/10.3390/su18073288
Submission received: 25 February 2026 / Revised: 23 March 2026 / Accepted: 25 March 2026 / Published: 27 March 2026
(This article belongs to the Section Sustainable Water Management)

Abstract

The study presents a comprehensive spatio-temporal assessment of meteorological drought in the Upper Vistula basin, a region located in southern Poland. The analysis was based on monthly precipitation data from 30 meteorological stations covering the period 1961–2022. These data were used to calculate the Standardized Precipitation Index (SPI) for accumulation periods of 3, 6, 9, 12, 24, and 48 months. Drought events were identified using run theory, adopting a threshold of SPI < −1 for all accumulation periods. On this basis, drought characteristics were determined, including the number of identified drought episodes (N), average drought duration (ADD), average drought severity (ADS), and average drought intensity (ADI). The multi-scale analysis revealed a clear dependence of drought characteristics on the time scale. Short-term droughts (SPI-3 and SPI-6) occurred frequently and were characterized by high monthly intensity but short duration. In contrast, long-term droughts (SPI-24 and SPI-48) occurred less frequently, but were marked by much longer duration and greater cumulative severity, despite lower average intensity. Spatial analyses showed substantial heterogeneity of drought characteristics within the Upper Vistula basin. The western and south-western parts of the region were particularly exposed to frequent short-term droughts, whereas long-term droughts were less frequent, but more regional in nature and resulted from accumulated, multi-year precipitation deficits affecting groundwater resources and catchment retention. The presented findings provide valuable information for improving drought monitoring systems and adaptation strategies in the Upper Vistula basin and in other climatically diverse regions of Central Europe.

1. Introduction

Drought is one of the most serious natural hazards affecting modern societies, as it carries far-reaching consequences for water resources, agriculture, ecosystems, and the economy. In Europe, particularly in temperate climate regions, as a result of climate change which causes rising air temperatures, changes in precipitation frequency and intensity, and increased evapotranspiration, drought risk has intensified [1,2]. These processes favor more frequent, longer, and more intense dry periods, posing growing challenges for water management, food security, and ecosystem resilience. Economic estimates indicate that without effective mitigation and adaptation measures, drought-related losses in the European Union and the United Kingdom may exceed €65 billion per year [3], while agricultural productivity across large parts of Europe may decline due to increasing drought stress [4]. In recent years, a growing number of studies have highlighted the significant role of atmospheric circulation changes in shaping the occurrence of meteorological droughts in Europe, including the latitudinal belt covering Central Europe [5,6]. Central Europe has been identified as a region especially exposed to increasing hydroclimatic variability. Severe drought episodes were observed especially in 2018–2019, with their development driven by the complex interaction of atmospheric circulation patterns, precipitation seasonality, rising temperatures and evapotranspiration, and physiographic conditions [5,7,8,9,10]. The region is highly sensitive to changes in large-scale circulation patterns, including the dominance of anticyclonic systems and atmospheric blocking, which favor prolonged precipitation deficits [11,12,13]. As a result, droughts in Central Europe often exhibit strong spatial heterogeneity and a pronounced dependence on time scale. Short-term meteorological droughts mainly affect soil moisture and crops, whereas long-term droughts influence groundwater recharge and surface water retention [14,15,16]. The Upper Vistula basin covers areas with highly heterogeneous physiography, including the Carpathian Mountains, Subcarpathian Basins, and Polish Uplands. This orography influences precipitation distribution, seasonality, and interannual variability, which may enhance the spatial variability of drought metrics, particularly at shorter aggregation scales. In the Polish Carpathians, in spite of relatively high annual precipitation sums, significant drought trends and episodes have been observed, and mountain sensitivity to climate change may be reflected in an increased drought risk in recent decades [17]. Historical records document several severe drought episodes in 1983, 2000, 2003, and 2006, which led to substantial reductions in river flows, declines in groundwater levels, and agricultural losses [18]. Studies indicate that drought impacts in this region have intensified in recent decades, potentially affecting the long-term sustainability of water resources under ongoing climate change [17]. Meteorological droughts in the Upper Vistula basin have been widely analyzed using standardized drought indices, particularly the Standardized Precipitation Index (SPI). Previous studies have shown an increase in drought frequency and identified several major drought periods, including 1984–1986, 1991–1992, 1997–2003, 2007–2008, and 2012–2013 [13,18]. Despite the widespread application of SPI [19,20,21], there is still a lack of comprehensive studies jointly analyzing drought frequency, duration, severity, and intensity across a broad range of time scales, especially in climatically heterogeneous catchments such as the Upper Vistula basin. Many drought studies focus on single or short SPI time scales, which are suitable for agricultural drought monitoring but may not capture the cumulative effects of long-term precipitation deficits. Such an approach may lead to underestimation of risks associated with long-lasting droughts that develop gradually but strongly affect groundwater resources, retention reservoirs, and catchment water balance [22,23]. Therefore, a multi-scale approach is a crucial element for a comprehensive understanding of drought processes and for effective monitoring, early warning, and long-term water resources planning. Adopting a multi-scale perspective, the aim of this study is to conduct a comprehensive spatio-temporal assessment of meteorological droughts in the Upper Vistula basin using long-term monthly precipitation data from 1961–2022. The Standardized Precipitation Index (SPI) was applied at six accumulation scales (3, 6, 9, 12, 24, and 48 months) to capture both short-term and multi-year precipitation deficits. Drought events were identified using run theory, and for each station and time scale, drought characteristics were determined, including the number of identified episodes, average duration, average severity, and average intensity. By combining multi-scale SPI analysis with spatial assessment, this study aims to deepen the understanding of drought variability in the Upper Vistula basin and to provide a robust scientific basis for drought risk assessment and water resources management in Central Europe.

2. Materials and Methods

2.1. Study Area and Data

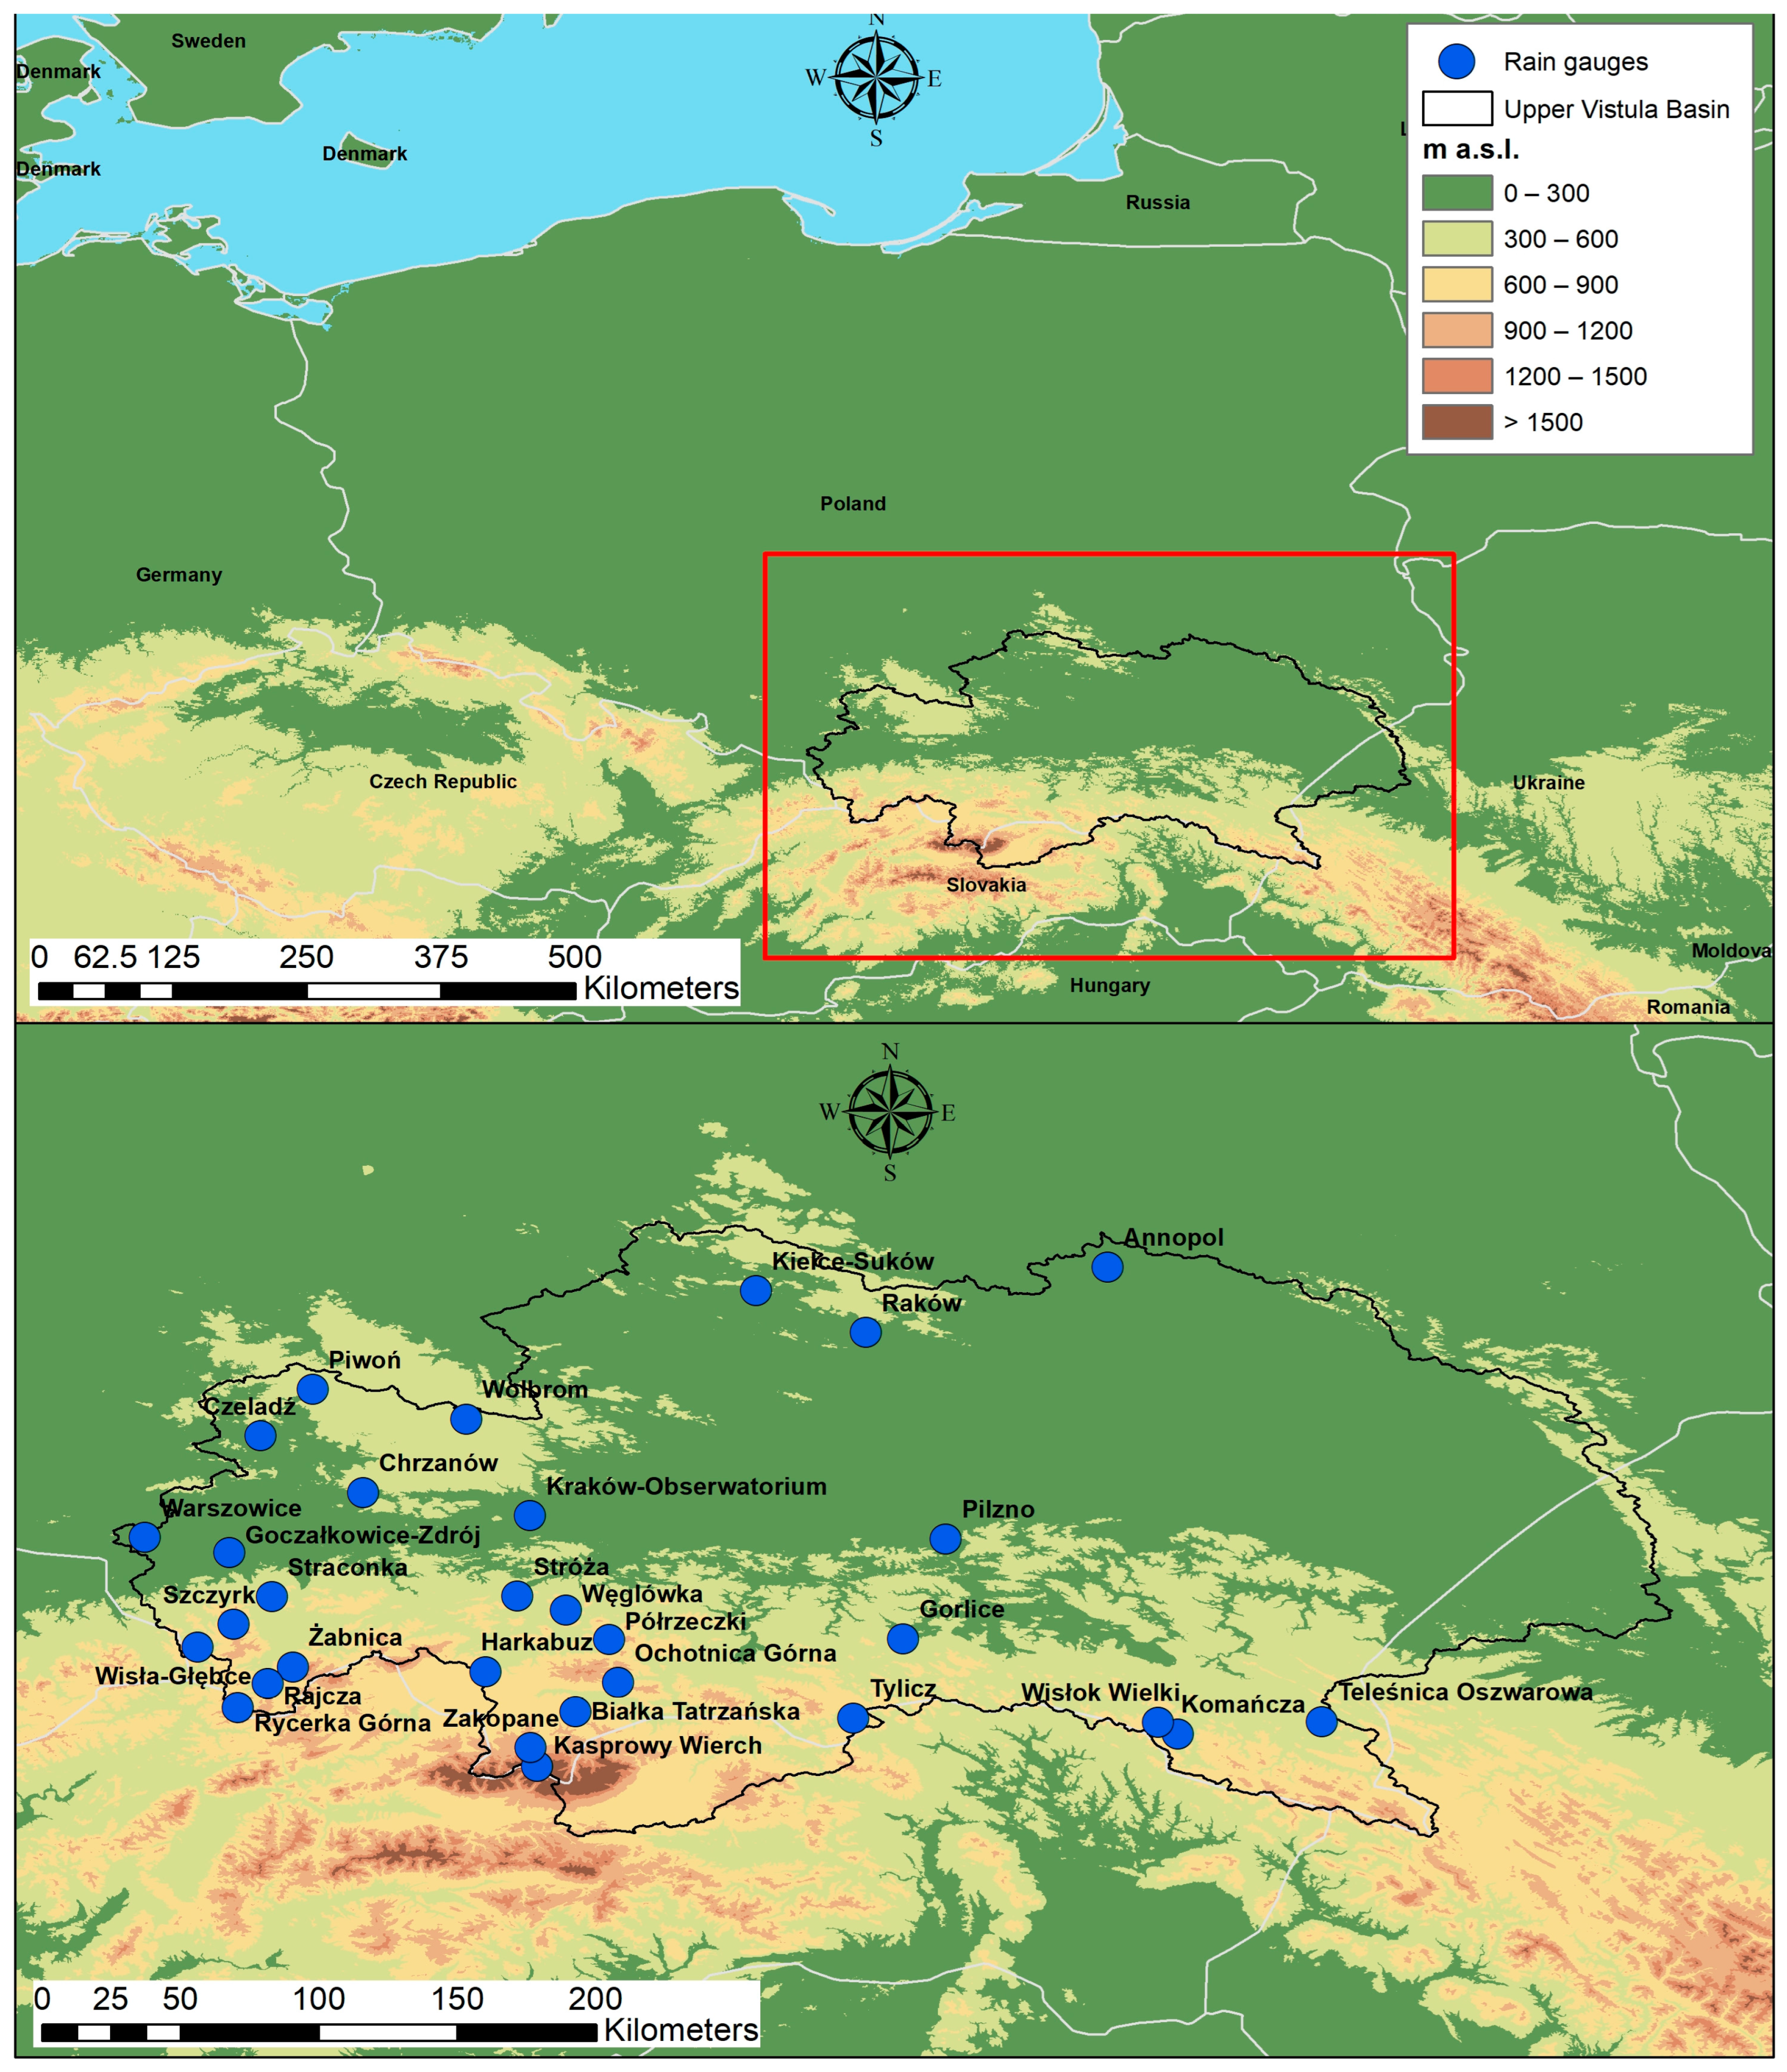
The study was conducted in the Upper Vistula basin, located in the southern and south-eastern part of Poland. The basin covers an area of approximately 51,000 km2, which represents nearly one quarter of the total Vistula River catchment area (Figure 1).
The region is characterized by pronounced physiographic heterogeneity, including the Carpathian Mountains, the Subcarpathian Basins, and the Polish Uplands. This diversity translates into strong elevation, climatic, and precipitation gradients, which play a significant role in the development and spatial variability of meteorological droughts. According to the Köppen–Geiger climate classification [24], the Upper Vistula basin is dominated by a warm temperate, fully humid climate with a warm summer.
Precipitation shows clear seasonal variability [25] as well as significant interannual fluctuations, indicating that this region is well suited for drought analyses across multiple time scales. In fact, monthly precipitation in the Upper Vistula Basin shows a clear seasonal cycle: totals are lowest in late winter and peak in early to mid-summer. In particular, mean monthly precipitation ranges from 45.33 to 68.69 mm, with a standard deviation of 15.61–36.79 mm, indicating substantial month-to-month variability. The Upper Vistula basin is characterized by complex topography, especially within the Carpathian area, which further enhances the spatial variability of precipitation sums and drought characteristics. Monthly precipitation data were obtained from 30 meteorological stations located within the Upper Vistula basin. Basic information about the stations is presented in Table 1. The data were provided by the Institute of Meteorology and Water Management—National Research Institute (IMGW-PIB) in Warsaw. Only stations with long, homogeneous, and continuous (without data gaps) measurement series for the period 1961–2022 were selected to ensure reliable drought identification and comparability of results among stations and across different time scales. The spatial distribution of stations enables the assessment of both regional drought patterns and local variability related to elevation and physiographic conditions.

2.2. Methods

To determine meteorological drought in the Upper Vistula basin, the Standardized Precipitation Index (SPI) was applied. This index is based solely on precipitation data and enables consistent drought assessment under different climatic conditions. SPI describes precipitation anomalies normalized with respect to a long-term reference period, where negative values indicate dry conditions and positive values indicate wet conditions. The SPI was calculated for accumulation periods of 3, 6, 9, 12, 24, and 48 months in order to capture drought processes occurring at different time scales and affecting various components of the hydrological system. Short accumulation periods (SPI-3 and SPI-6) primarily reflect short-term meteorological droughts associated with soil moisture deficits and agricultural impacts, whereas longer time scales (SPI-12 to SPI-48) represent prolonged precipitation shortages that are important for groundwater recharge, surface water retention, and long-term water resource availability [26,27]. The SPI values were derived by modelling precipitation data from each observation station using a gamma distribution framework [28]. In practice, this required adjusting a gamma probability density model to the empirical distribution of aggregated precipitation amounts recorded at a given station. For every station and for each analysed accumulation period (3, 6, 9, 12, 24 or 48 months), the parameters of the gamma distribution—shape (α) and scale (β)—were estimated separately. The probability density function can be written as follows [29]:
g ( x )   =   1 β α Γ α x α 1 e x β ;
where Γ(α) denotes the gamma function [-], x represents the precipitation total for the analysed period [mm], α is the shape parameter [-], and β is the scale parameter [-].
Drought severity classes based on SPI values were assigned according to the scheme summarised in Table 2, following the approach reported by [30].
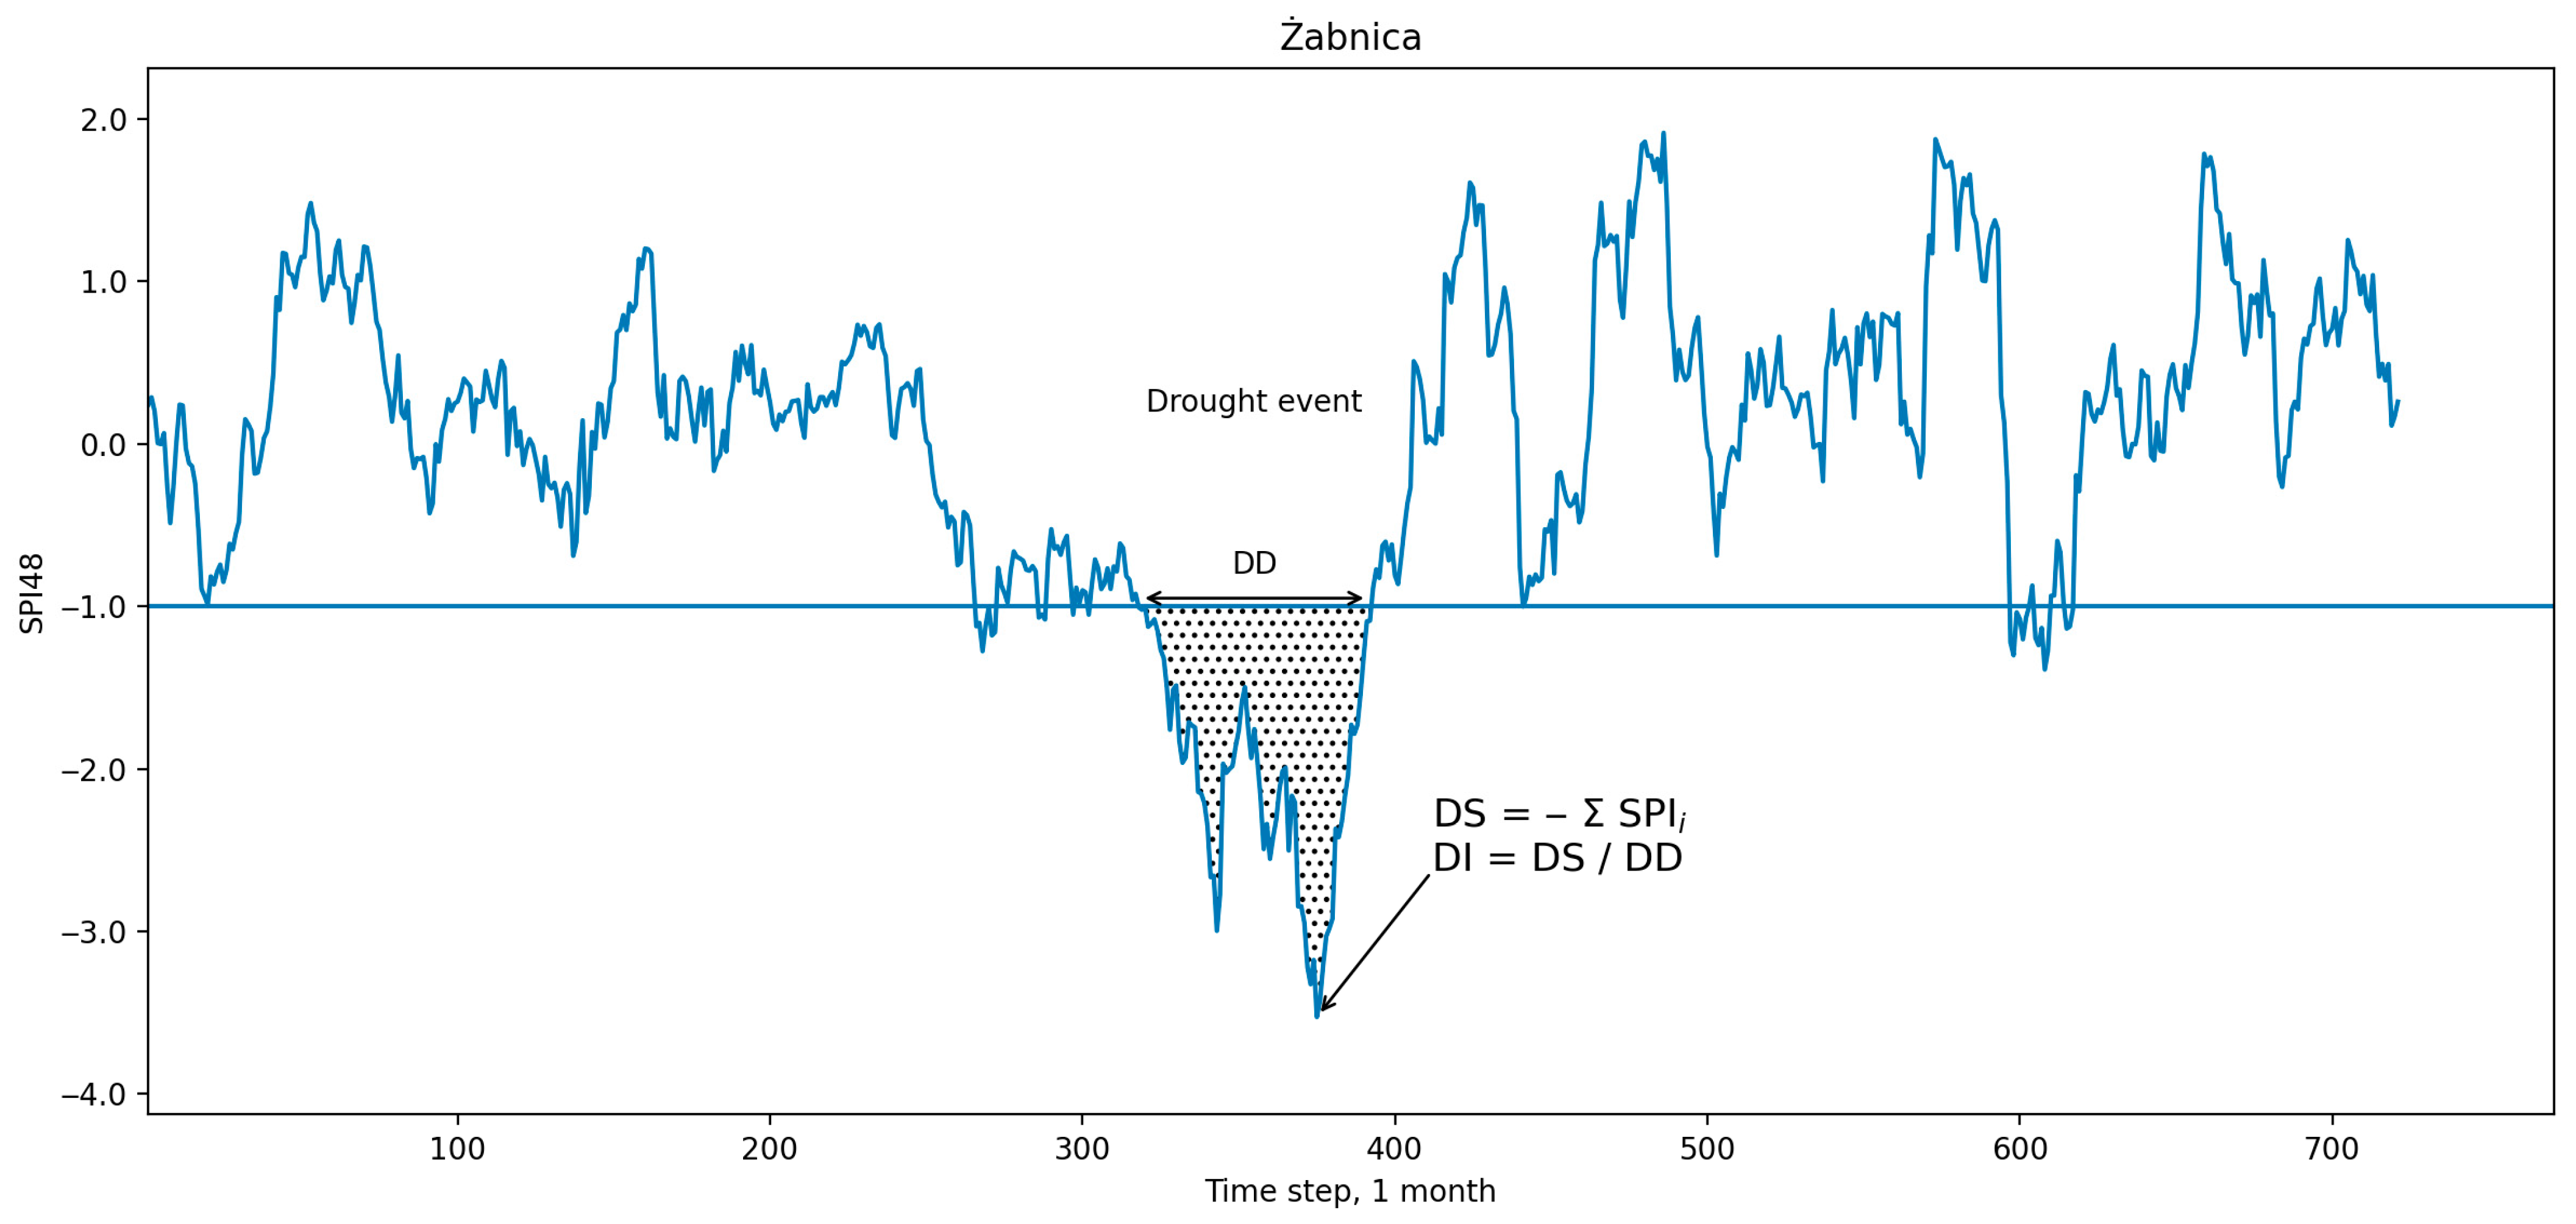
Drought events were identified using the run theory approach, originally proposed by [31]. Under this framework, a drought event is defined as a sequence of consecutive months during which SPI values (according to the classification of [32,33] remain below a specified threshold (SPI < −1). Each continuous sequence of values below this threshold constitutes a single drought event (a so-called negative run), whereas periods when SPI values exceed the threshold are treated as non-drought conditions (Figure 2). This approach enables an objective and consistent identification of drought onset, termination, and duration across different stations and SPI time scales.
All data elaborations, calculations, and analytical visualizations were performed using Microsoft Office Excel 2016.

3. Results

3.1. Number of Droughts (N)

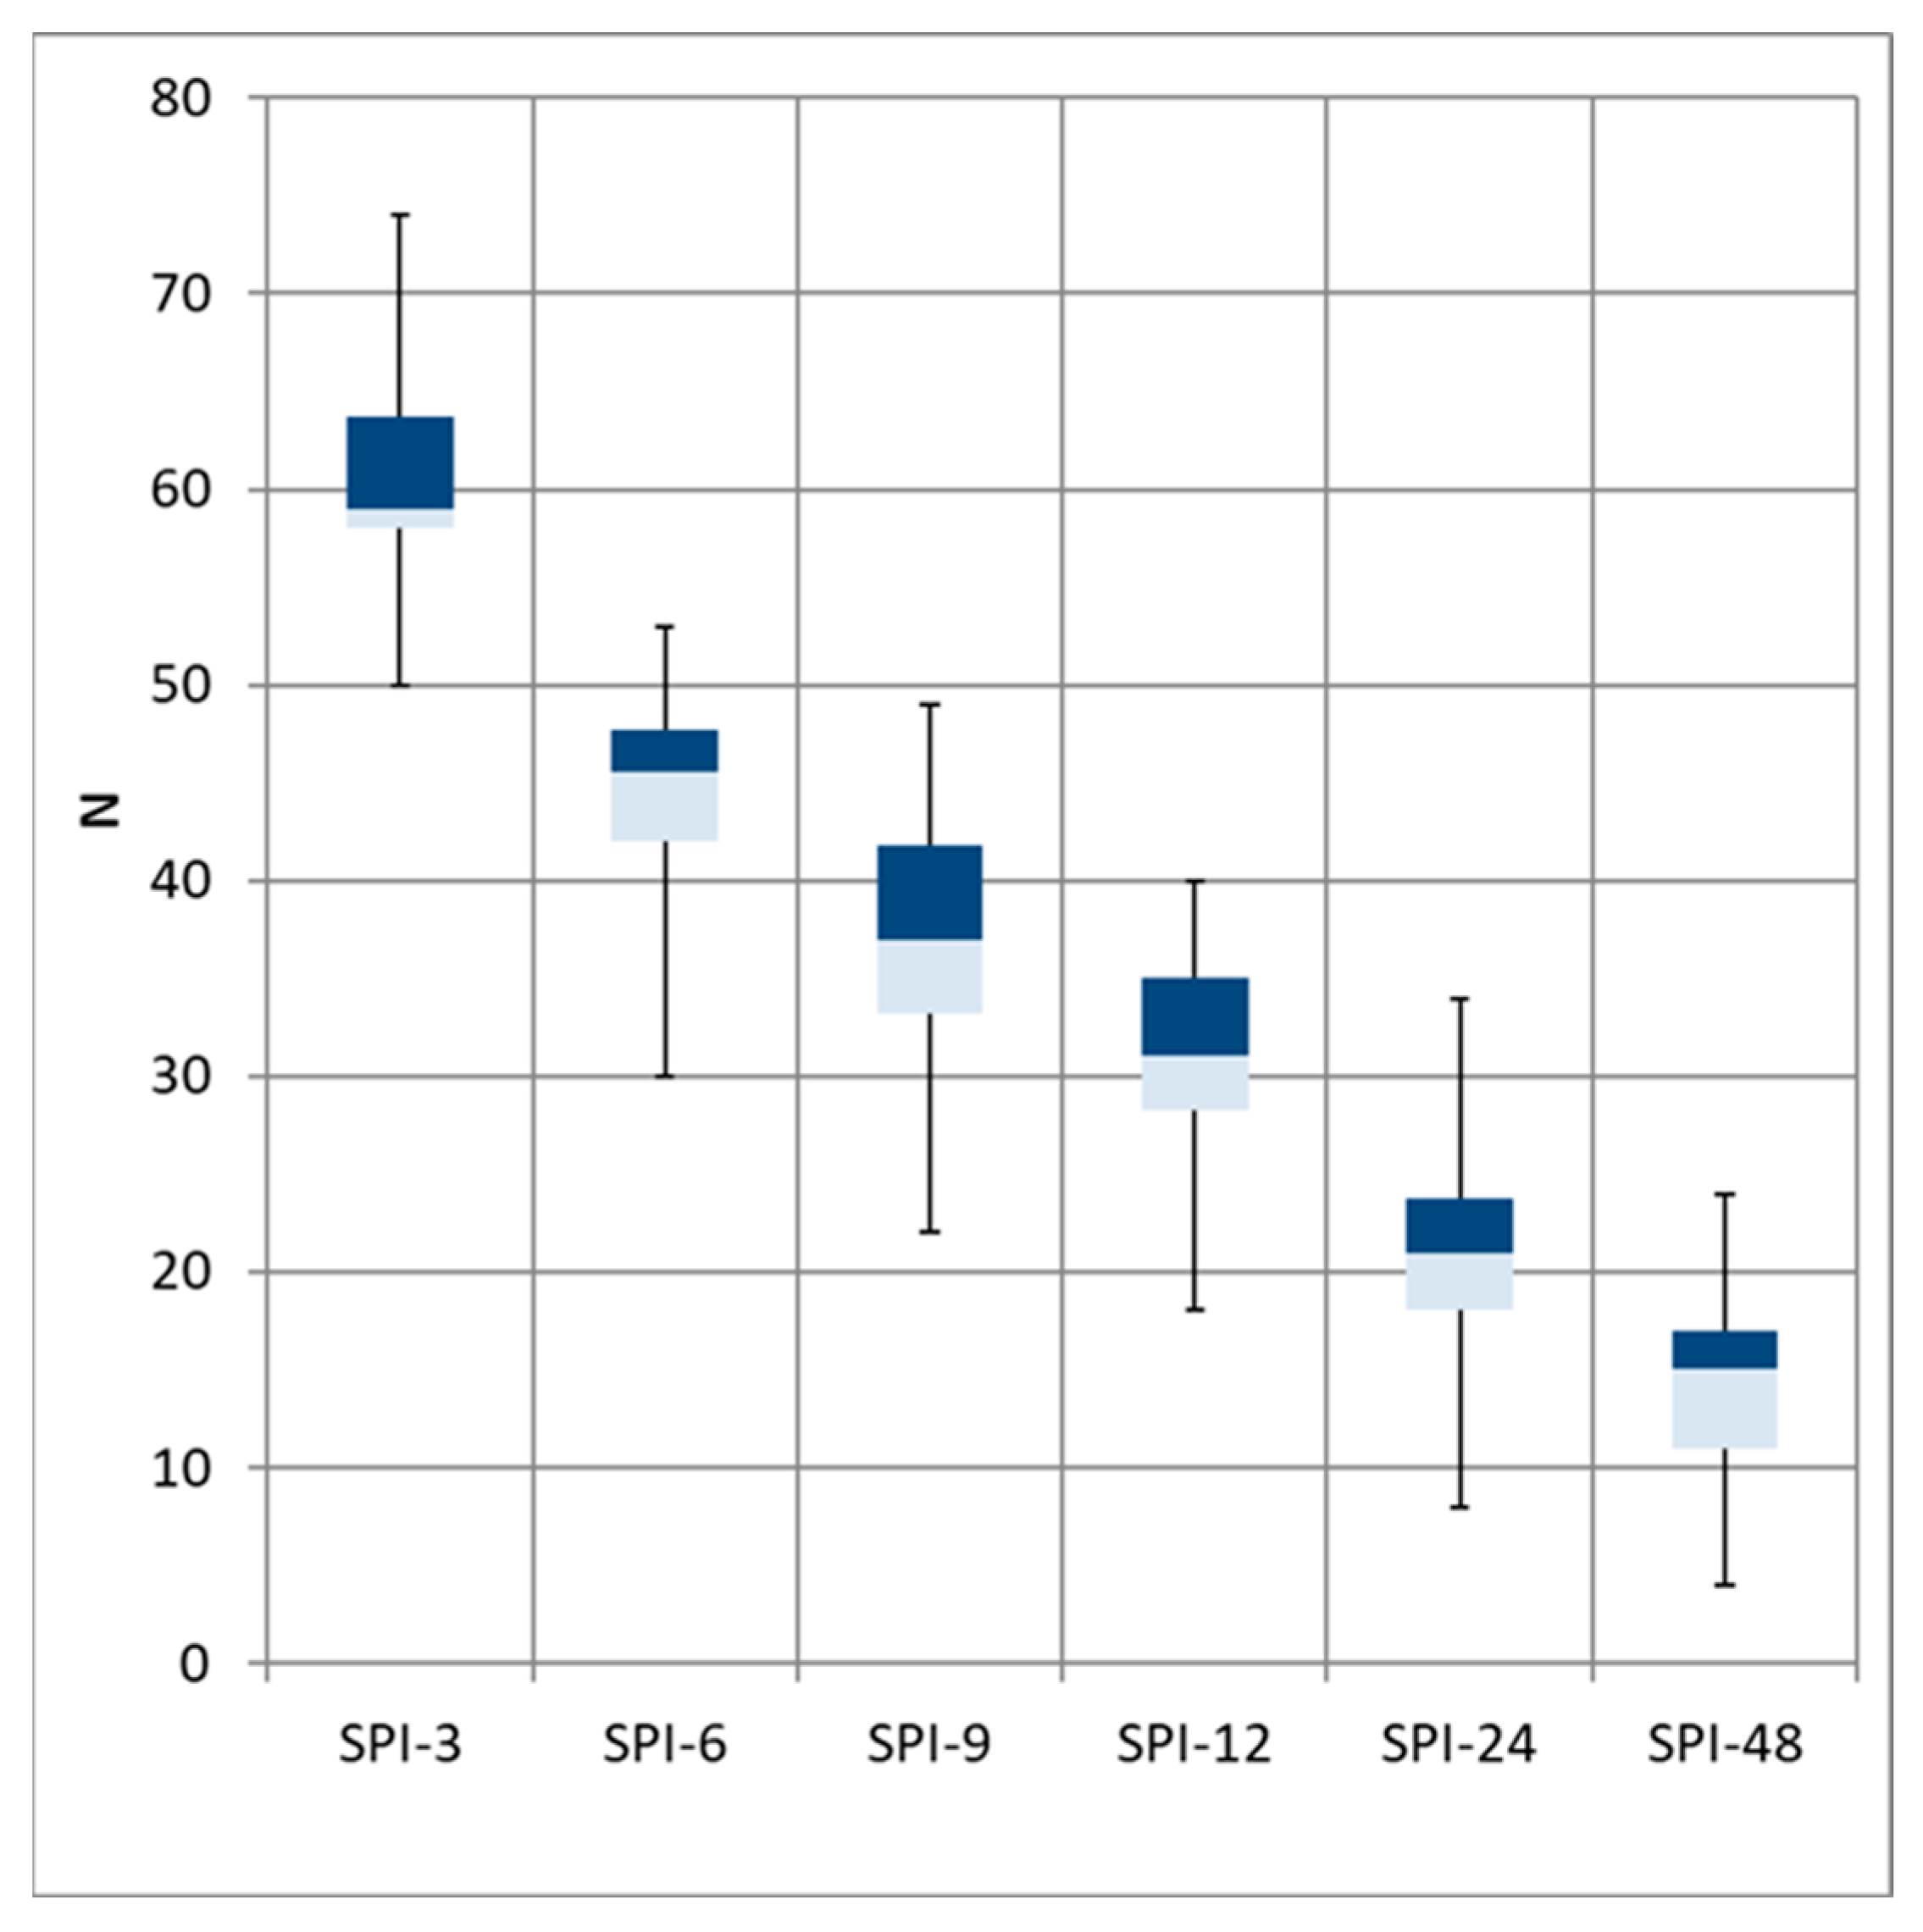
The distribution of the number of identified drought episodes (N) at meteorological stations in the Upper Vistula basin for the SPI calculated at different accumulation periods (from 3 to 48 months) is shown in Table 3 and Figure 3.
A strong dependence of drought frequency on the adopted SPI time scale is clearly visible. The highest number of drought episodes was recorded for the short-term SPI-3 index, for which the median number of events across stations exceeds 60, while the interquartile range and overall variability are relatively small. This indicates that short-term droughts are frequent and spatially relatively homogeneous across the entire Upper Vistula basin. Such droughts are directly linked to short-term precipitation deficits and are particularly important for soil moisture and agrometeorological conditions, which is especially relevant in regions with a high proportion of agricultural land use. As the SPI aggregation period increases (SPI-6 and SPI-9), a clear decrease in the number of drought episodes is observed, accompanied by growing spatial differentiation among stations. This suggests that medium-term droughts occur less frequently, but their occurrence is more strongly controlled by local physiographic and climatic conditions [34,35], such as terrain morphology, slope exposure, and regional precipitation patterns characteristic of the Carpathians and the Małopolska Uplands. The lowest numbers of drought episodes were found for the long-term indices SPI-24 and SPI-48. Here, median values drop to only several to a dozen events, while the spread between stations is the largest, confirming the rare but spatially heterogeneous character of long-lasting droughts. These droughts reflect accumulated, multi-year precipitation deficits that affect groundwater resources and reservoir storage, and their occurrence is driven by long-term climatic variability. The observed decrease in the number of drought episodes with increasing SPI aggregation period is consistent with the theoretical properties of the index and with findings reported for other regions of Central Europe [36]. At the same time, the increasing spatial variability at longer time scales highlights the heterogeneous nature of the Upper Vistula basin, which includes both mountainous and upland areas with differing climatic and hydrological conditions.
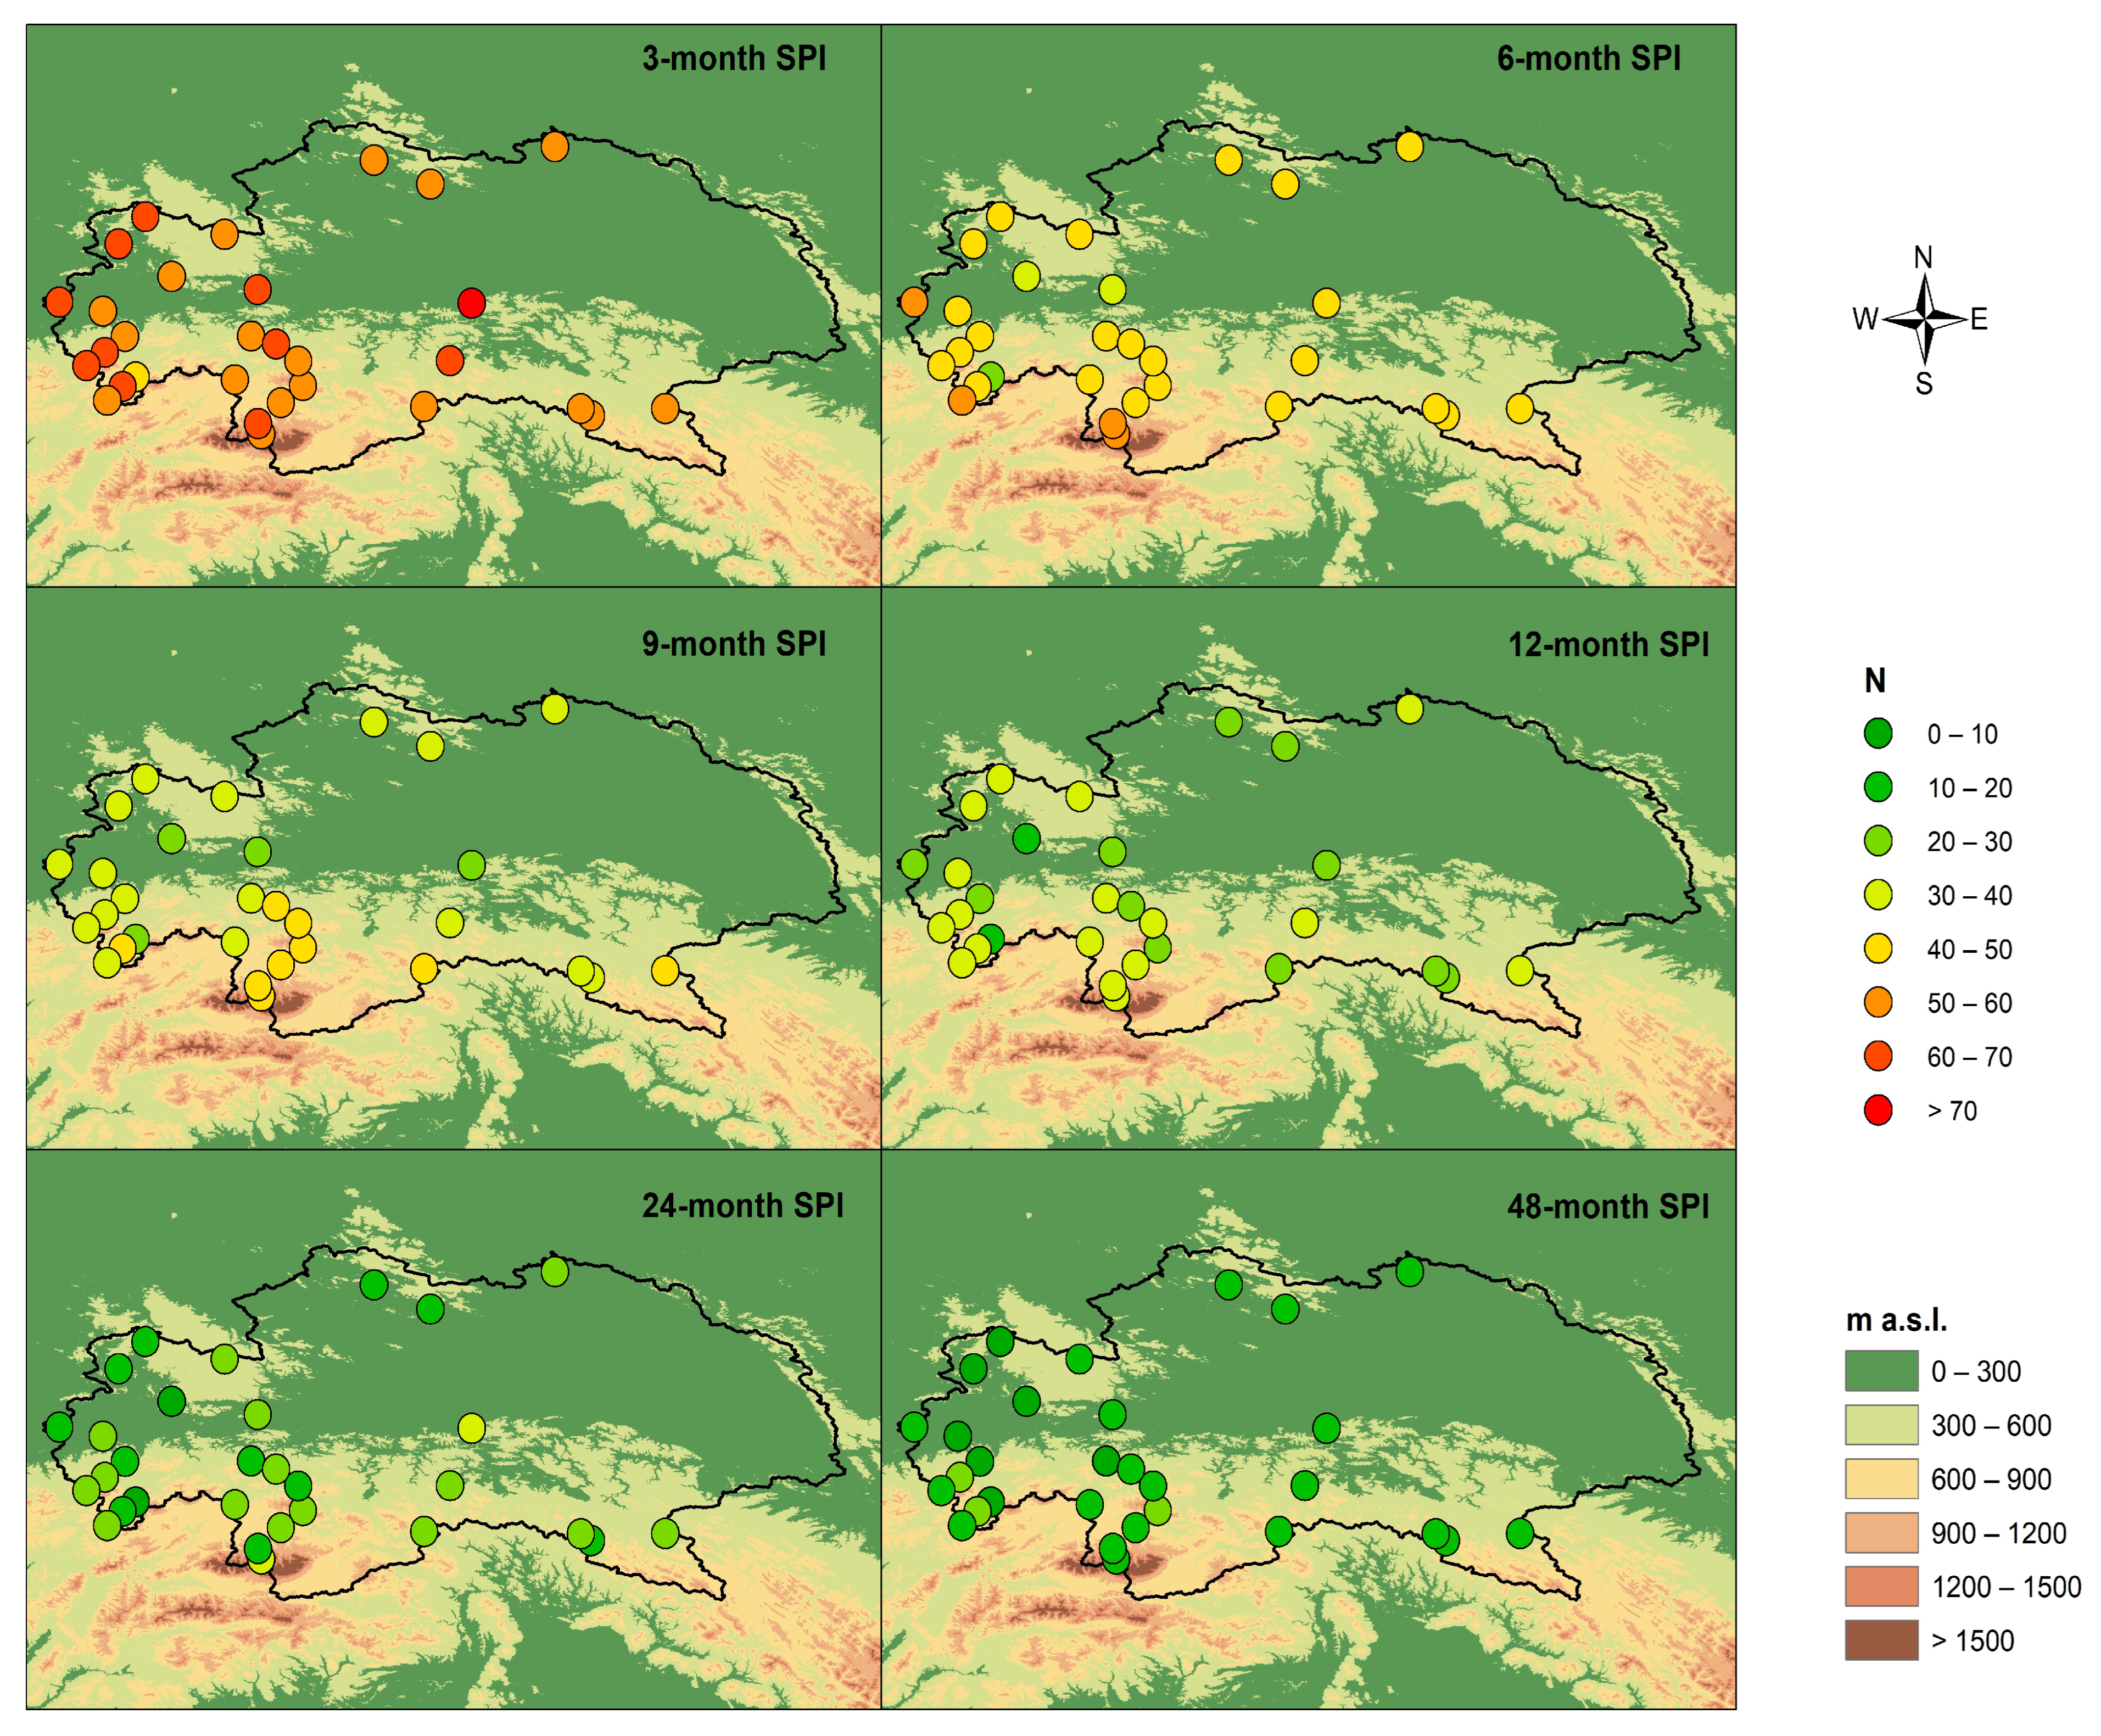
Figure 4 presents the spatial variability of the number of drought episodes (N) identified at meteorological stations in the Upper Vistula basin for SPI calculated at accumulation periods of 3, 6, 9, 12, 24, and 48 months. The analysis indicates substantial variation both in drought frequency and in its spatial patterns, which change markedly with increasing SPI time scale.
For SPI-3, the highest numbers of drought episodes are observed mainly in the western and south-western parts of the study area, particularly in the Carpathian foothill and mountain regions. At many stations, the number of episodes exceeds 50, and locally even 70 events. This indicates a high susceptibility of these areas to frequent, short-term precipitation deficits, strongly linked to seasonal and synoptic atmospheric variability. For SPI-6 and SPI-9, a clear reduction in the number of drought episodes is observed, accompanied by a more spatially uniform distribution. However, relatively higher N values are still maintained in the western part of the basin, suggesting a persistent regional pattern of drought susceptibility in this part of the Upper Vistula catchment. Stations located at higher elevations generally show fewer drought episodes, which may be related to higher precipitation sums in the Carpathian region.
For long-term time scales (SPI-12, SPI-24, and SPI-48), the number of drought episodes decreases substantially at all stations, with N values most often falling within the range of 0–20. Long-duration droughts occur less frequently but are more regional in character and result from accumulated, multi-year precipitation deficits affecting groundwater resources and catchment water retention [37]. A relationship is also evident between the number of drought episodes and elevation above sea level. Stations located at lower elevations, particularly in the northern and north-western parts of the basin, show a higher number of drought episodes for shorter SPI time scales, whereas mountainous areas exhibit relatively lower drought frequency, especially at longer time scales. This highlights the role of topographic conditions and regional precipitation mechanisms in shaping the spatial variability of meteorological drought.

3.2. Average Drought Duration ADD

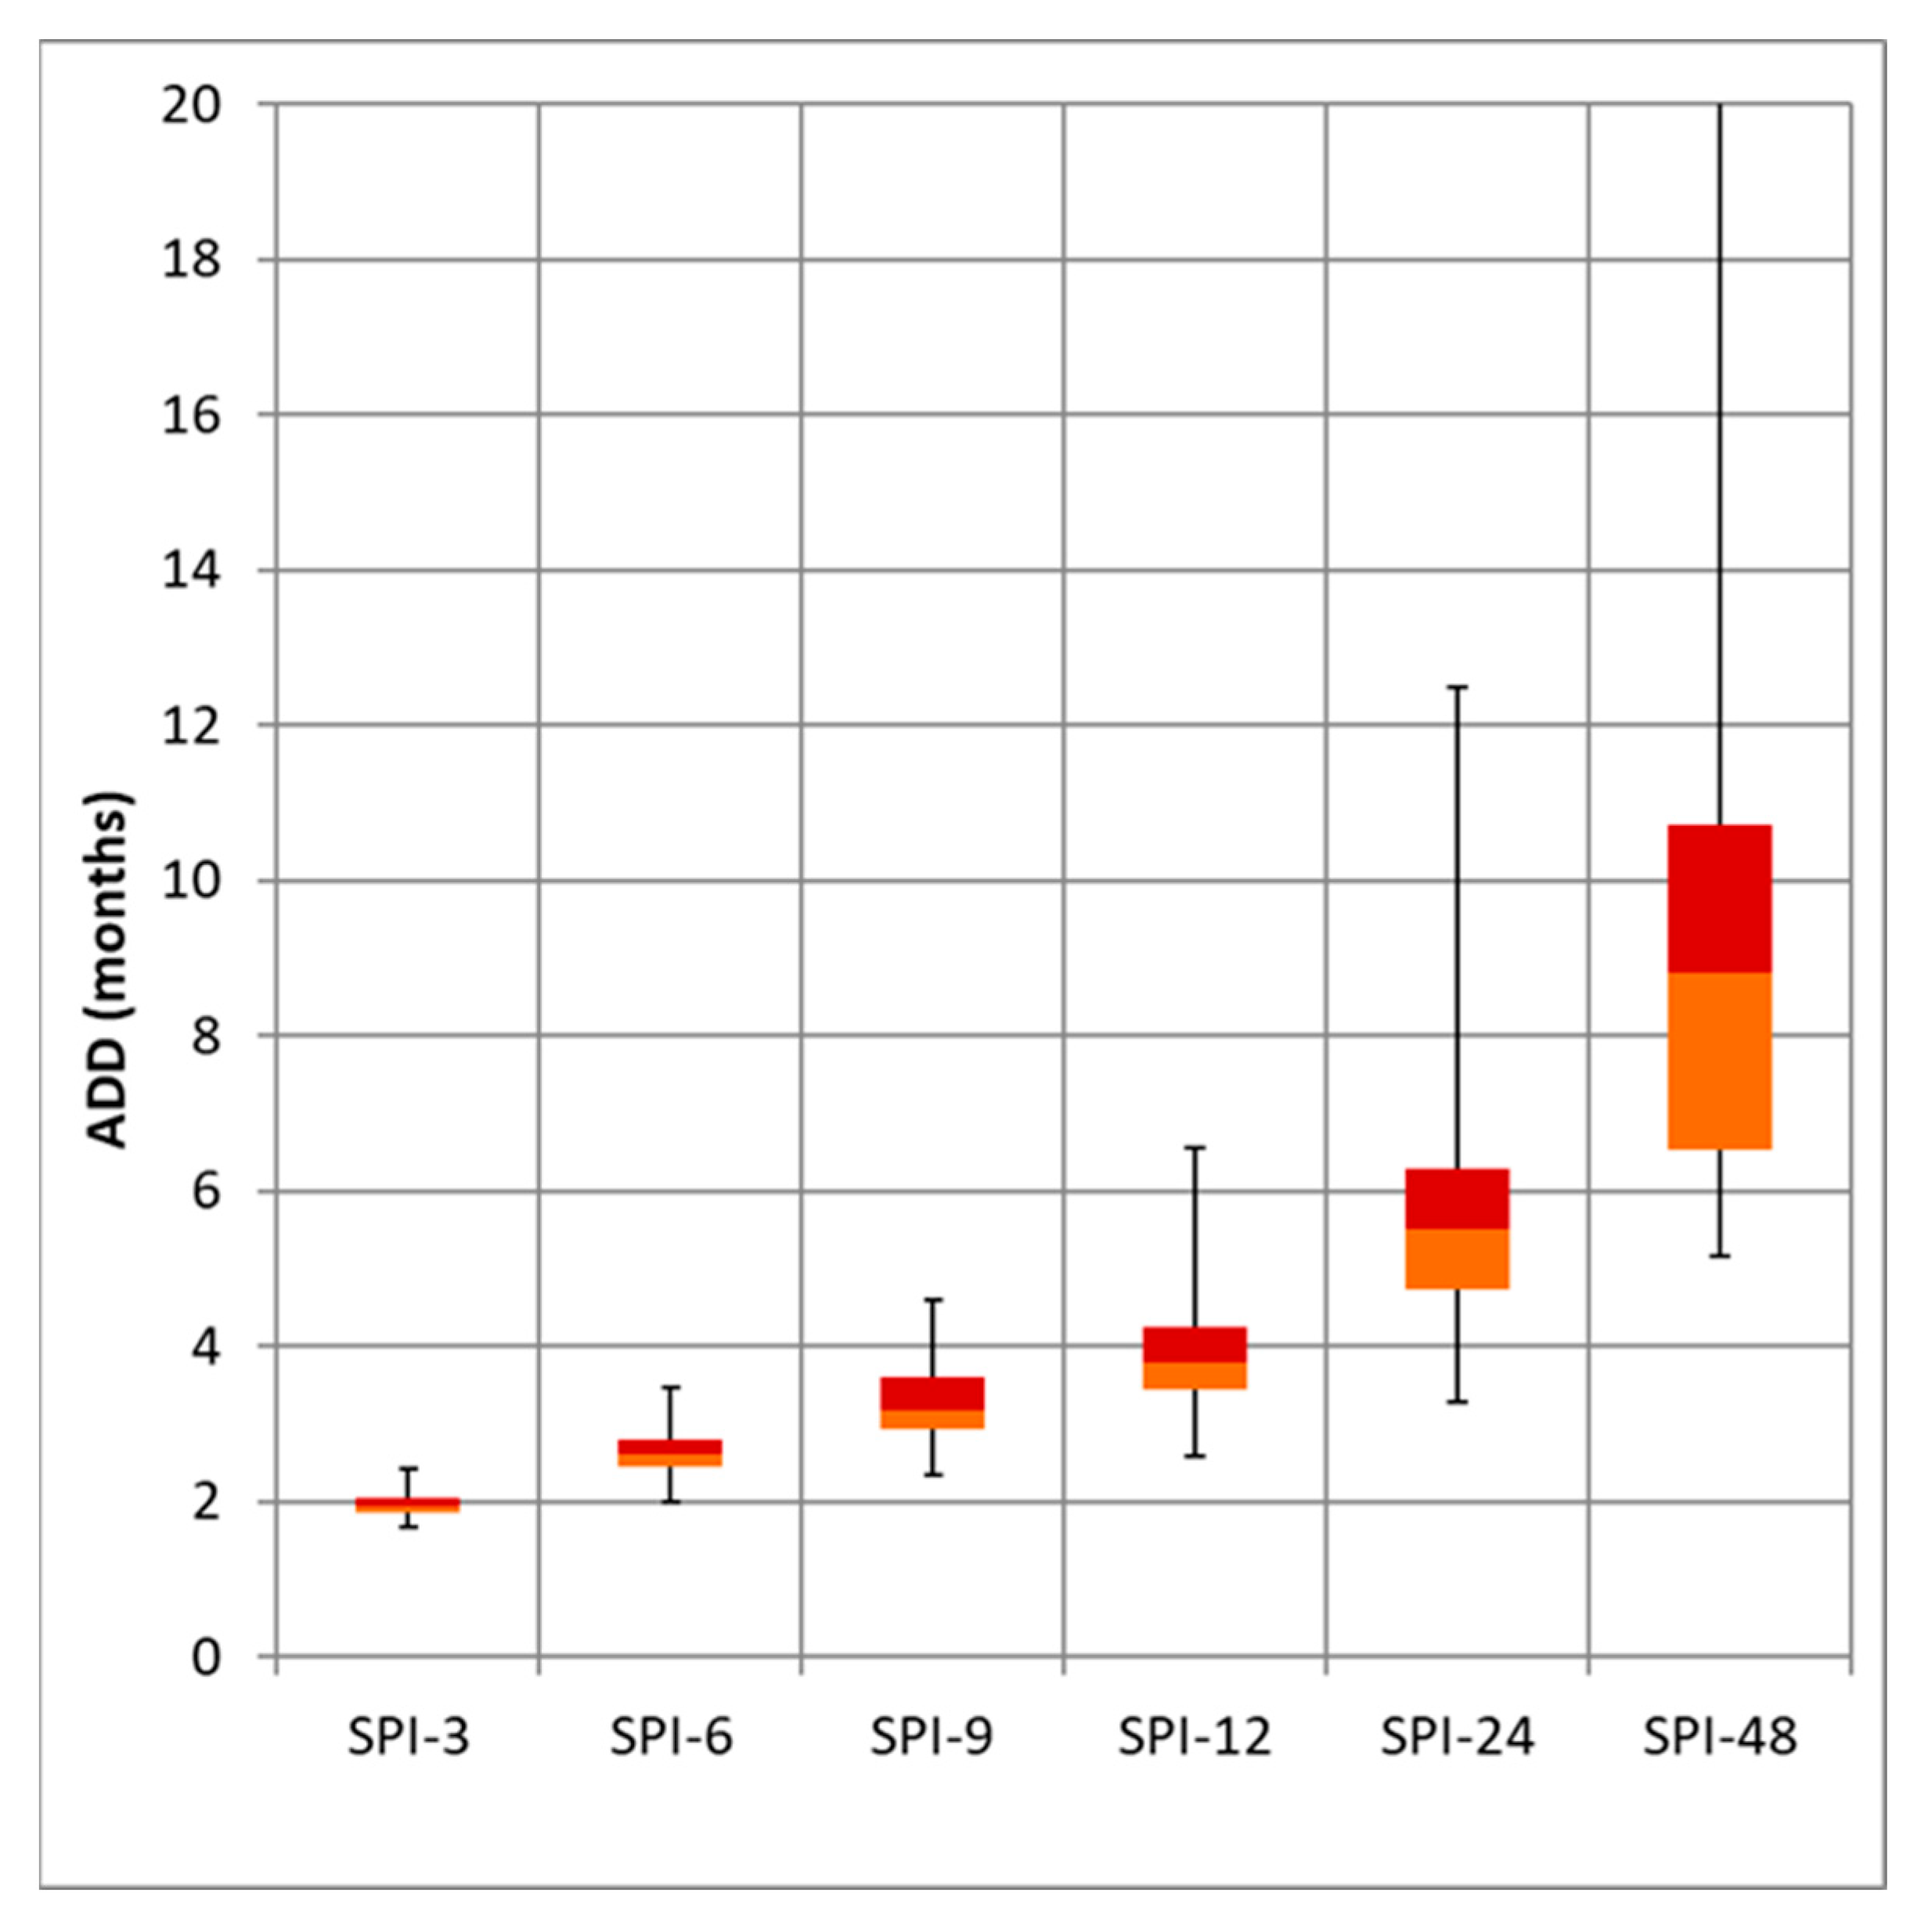
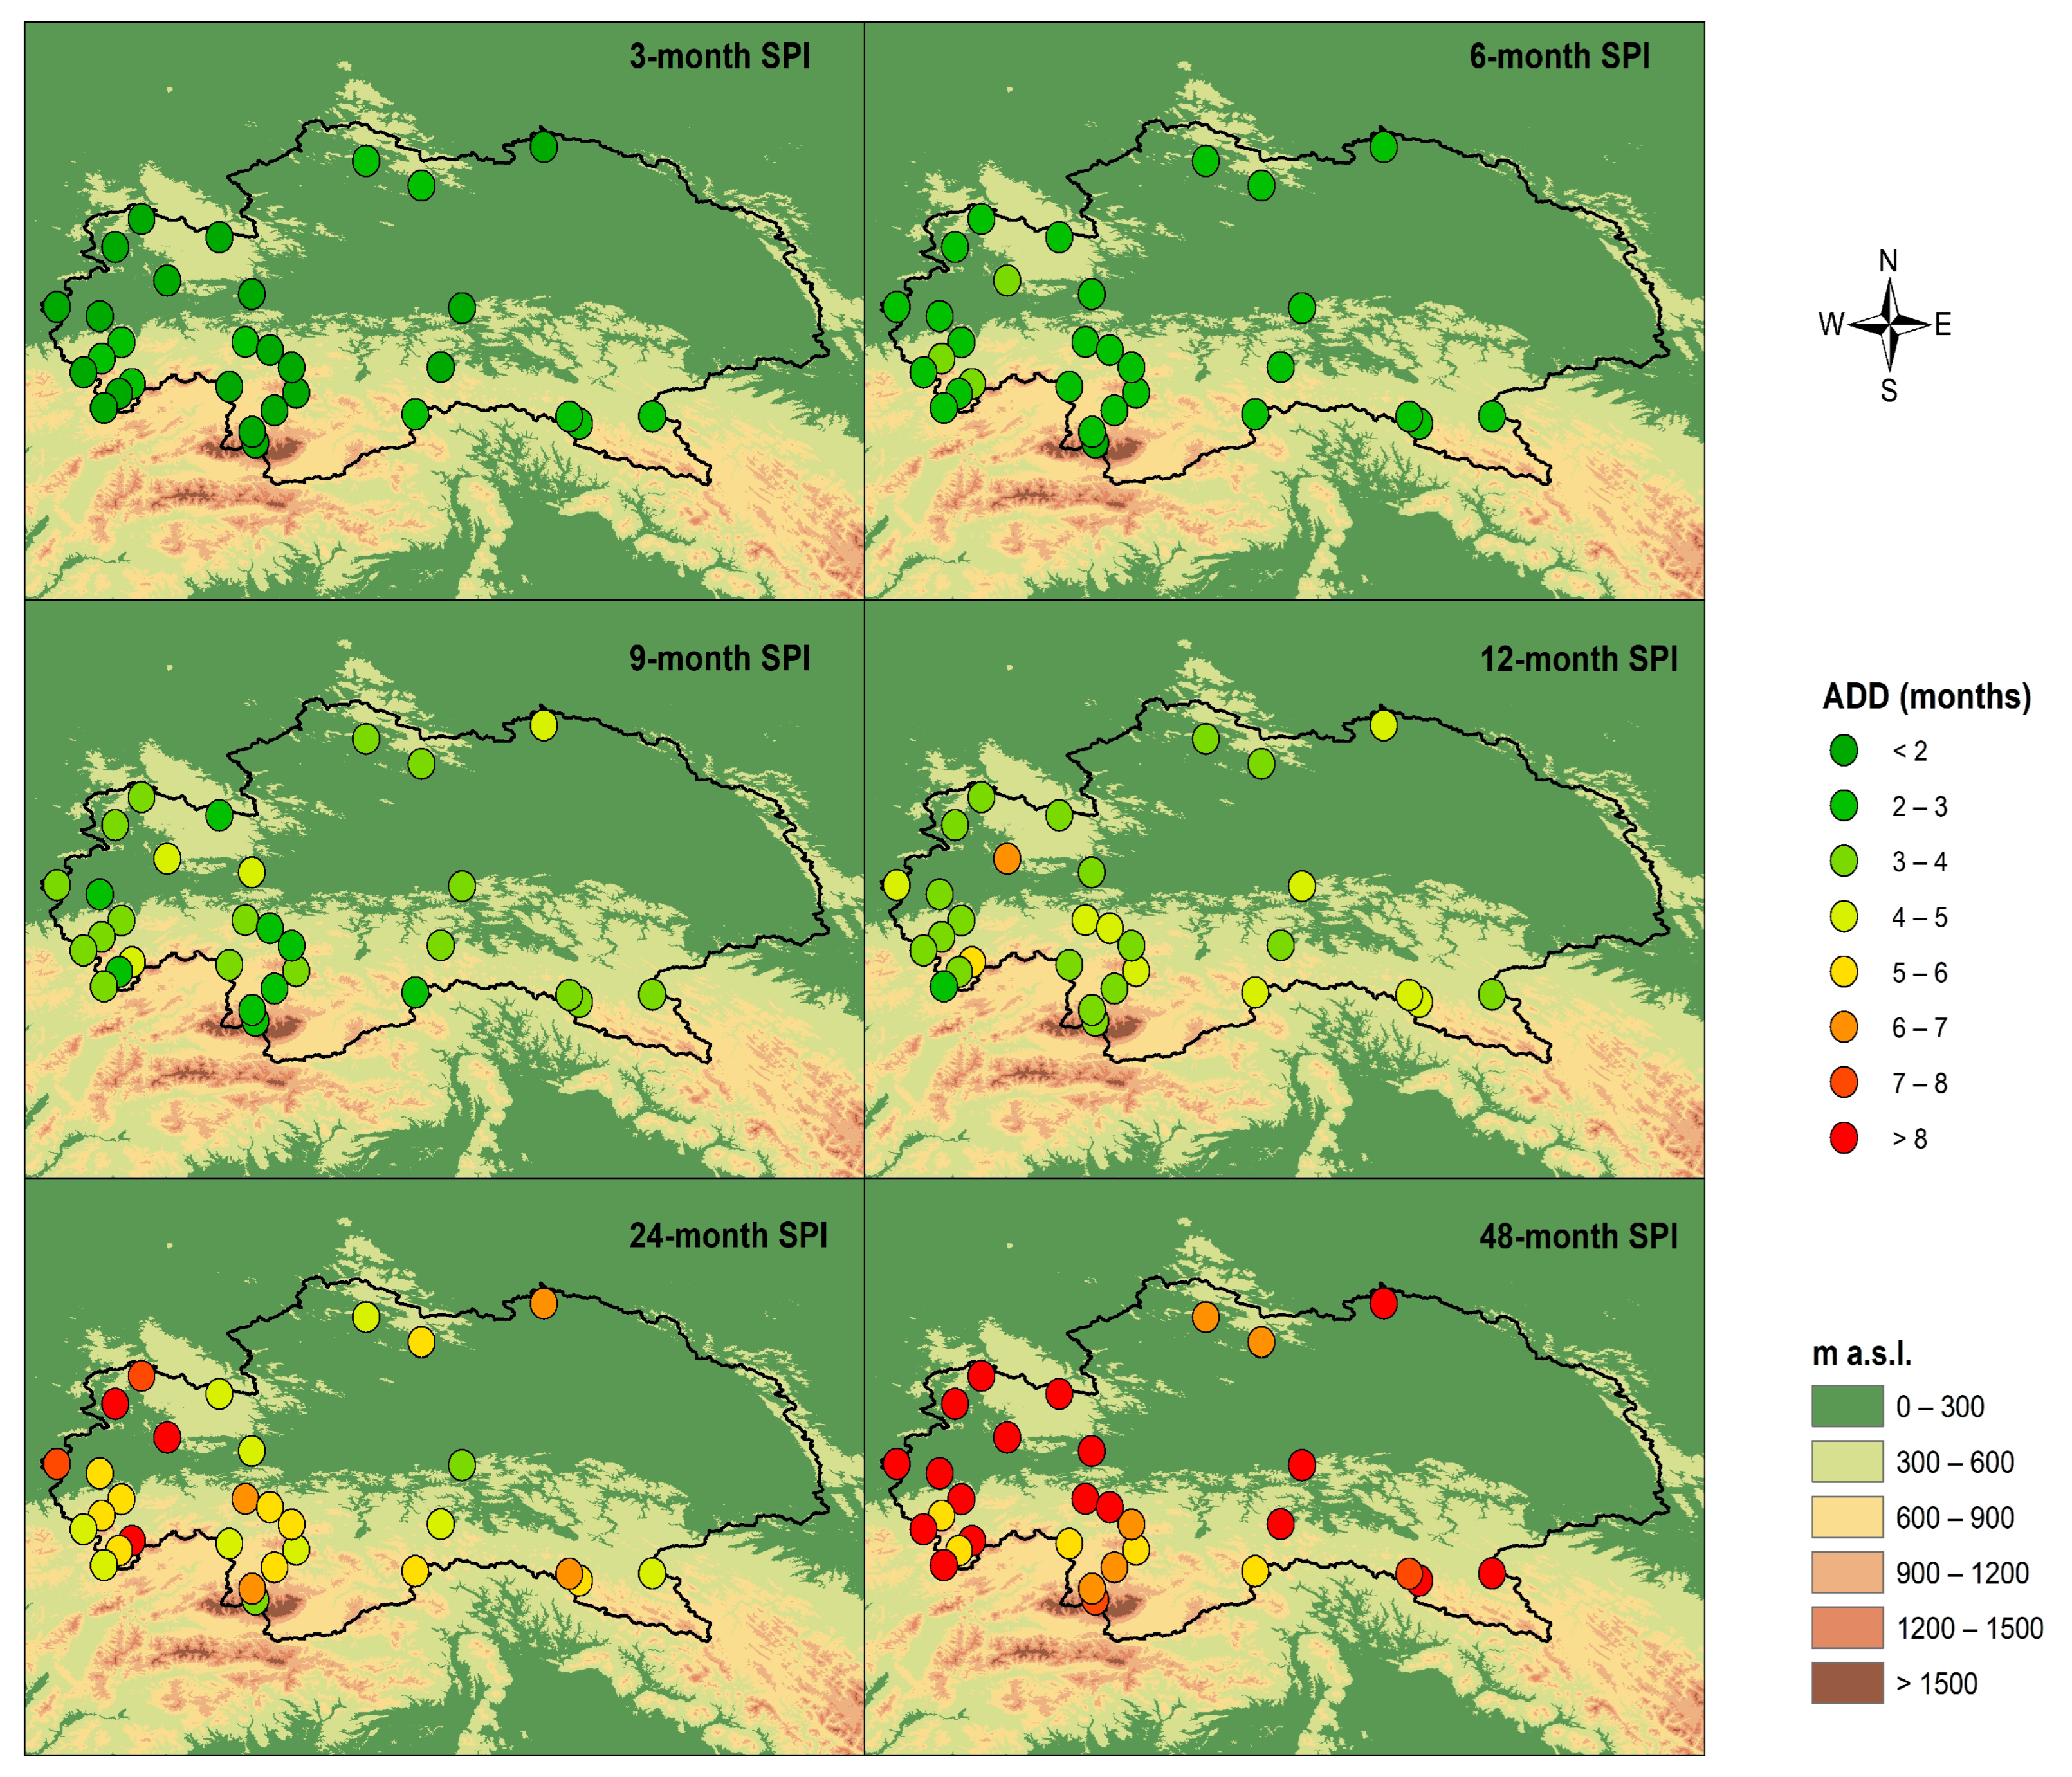
Table 3 and Figure 5 show the distribution of the average drought duration (ADD), expressed in months, at meteorological stations located in the Upper Vistula basin for the SPI calculated at different accumulation periods (from 3 to 48 months).
A systematic relationship between drought episode duration and the adopted SPI time scale is clearly visible. The shortest drought episodes are observed for SPI-3, for which median ADD values are about 2 months, and the spread of values between stations is small. This indicates that meteorological droughts identified at short time scales are brief and relatively spatially uniform, directly linked to temporary precipitation deficits and particularly important for soil moisture conditions and agrometeorological processes. As the SPI aggregation period increases (SPI-6, SPI-9, and SPI-12), a gradual increase in average drought duration is observed. Median ADD values rise to approximately 2.5–3 months for SPI-6, 3–3.5 months for SPI-9, and about 4 months for SPI-12. At the same time, a moderate increase in spatial variability among stations becomes evident, suggesting that medium-term droughts are more diverse in their course and more strongly controlled by local climatic and physiographic conditions. The longest drought episodes occur at long-term time scales (SPI-24 and SPI-48). For SPI-24, median ADD values reach about 5–6 months, with a clear increase in maximum values, locally exceeding 12 months. For SPI-48, the average drought duration exceeds 8–9 months and in extreme cases reaches up to about 20 months. Such large variability indicates the rare but potentially very persistent nature of droughts identified at longer time scales.
Figure 6 presents the spatial variability of the average drought duration (ADD), expressed in months, at meteorological stations located in the Upper Vistula basin for SPI calculated at aggregation periods of 3, 6, 9, 12, 24, and 48 months. The spatial analysis of average drought duration indicates clear spatial differentiation, whose pattern and intensity change with increasing SPI time scale. For the short-term SPI-3 index, the average drought duration is short and spatially uniform. At most stations, ADD values do not exceed 2–3 months, indicating the dominance of short-lived drought episodes resulting from temporary precipitation deficits. Such droughts are particularly important for soil moisture conditions and ongoing agrometeorological processes, but their impact on the hydrological system is usually short-term [38]. With increasing aggregation periods for SPI-6 and SPI-9, a gradual increase in average drought duration and greater spatial differentiation between stations are observed. ADD values typically fall within the range of 3–5 months, with relatively longer drought episodes occurring more frequently in the western and south-western parts of the basin. This suggests that medium-term droughts are more strongly modulated by regional climatic and physiographic controls, including terrain morphology and precipitation patterns in the Carpathian region [39]. For longer time scales (SPI-12 and SPI-24), ADD values increase markedly, and the average drought duration at many stations exceeds 5–6 months. At the same time, spatial differences become more pronounced, with a tendency toward longer drought episodes in lower-elevation areas and in the northern part of the basin. This points to the growing influence of accumulated precipitation deficits and delayed hydrological system response, including groundwater resources and catchment storage. The longest average drought durations are observed for SPI-48, where ADD values at many stations exceed 7–8 months and locally reach even higher values. Such prolonged droughts are rare but regionally extensive, and result from multi-year precipitation deficits.

3.3. Average Drought Severity (ADS)

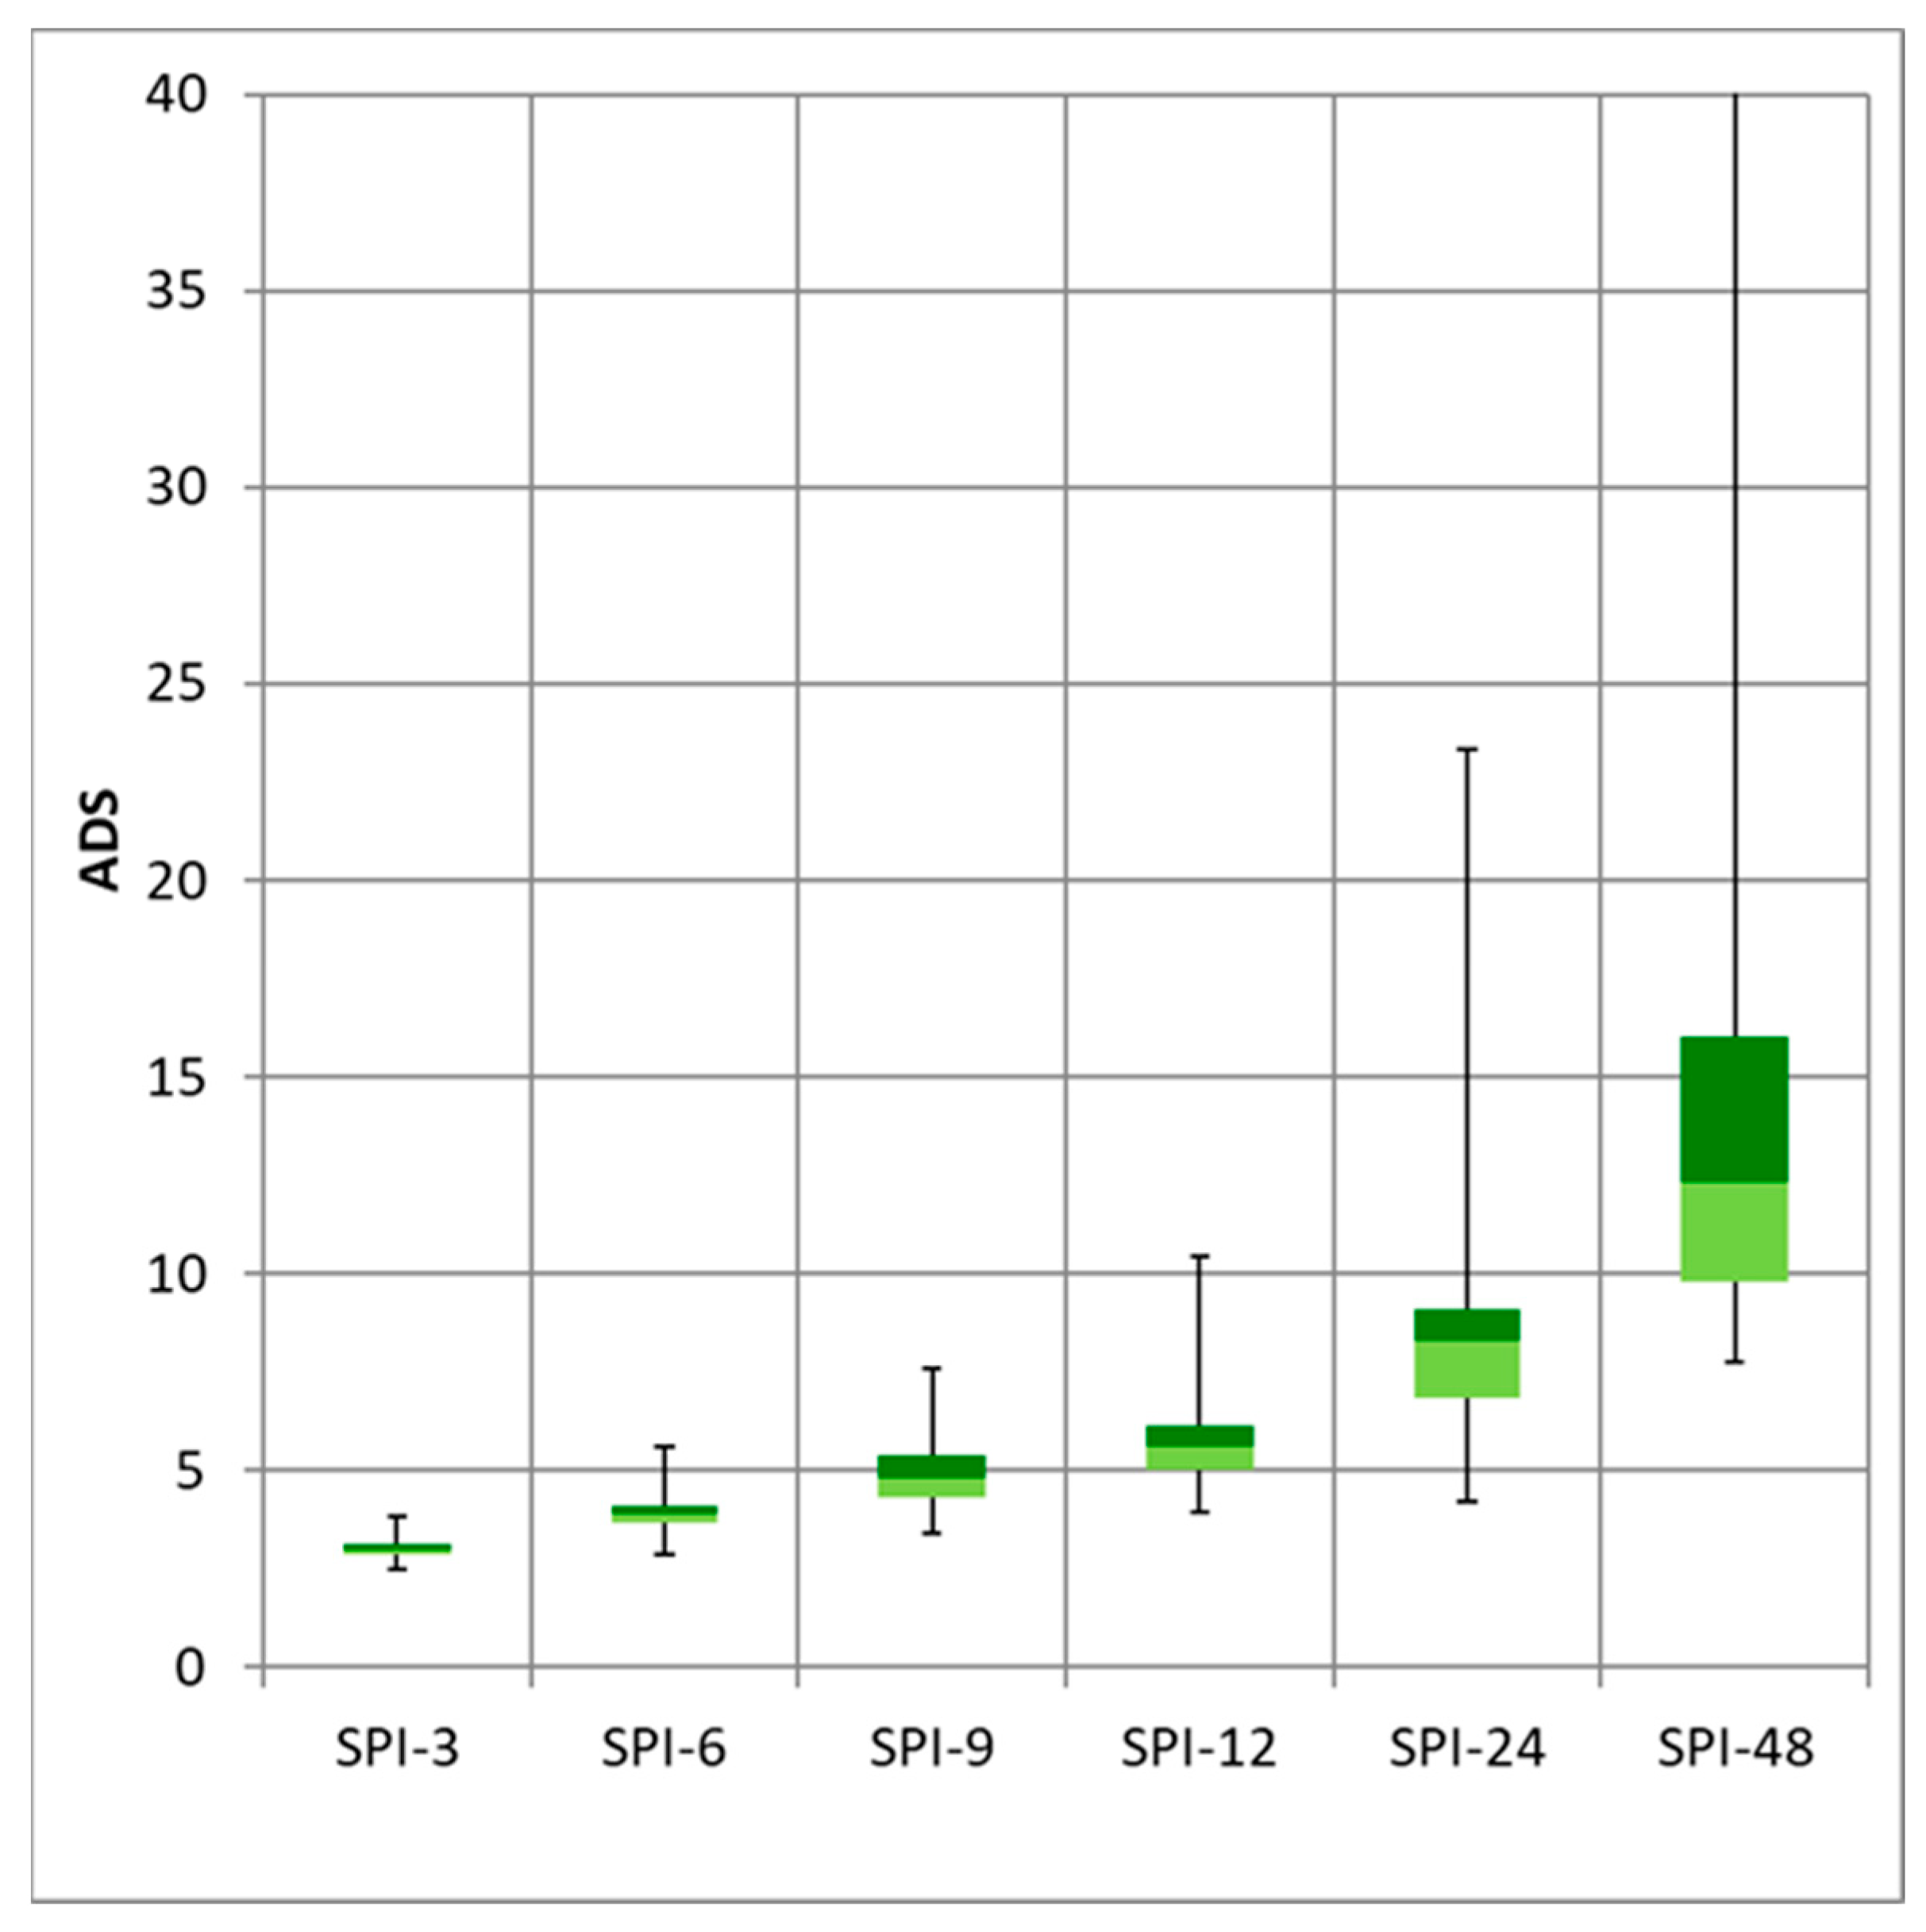
Table 3 and Figure 7 present the distribution of the average drought severity (ADS) in the analyzed area. A clear and systematic increase in ADS values can be observed with increasing SPI time scale, reflecting the cumulative nature of precipitation deficits over longer time horizons. For the short-term SPI-3 index, mean ADS values are low and show little spatial variation among stations. Median ADS values are around 3, indicating that short-term meteorological droughts are generally of limited severity, and are typically associated with temporary precipitation deficits. Such episodes usually produce mainly local and short-lived hydrometeorological impacts. With increasing aggregation periods for SPI-6 and SPI-9, a gradual rise in median ADS values to about 4–5 is observed. This indicates that medium-term droughts are more severe and display greater spatial variability, pointing to the growing influence of local climatic and physiographic controls. Substantially higher ADS values occur at longer time scales, particularly for SPI-12 and SPI-24. In these cases, median ADS values reach approximately 6 and 8–9, respectively, and the range of maximum values expands noticeably. For SPI-24 in particular, considerable variability between stations is evident, suggesting that long-duration droughts are strongly conditioned by regional climatic factors and catchment retention capacity. The highest ADS values are observed for SPI-48, where median values exceed 12 and maximum values reach up to about 40. The highest value of ADS was observed on Żabnica (42.16) and Chrzanów (56.73) station located on western part of analysed area. Such high drought severity indicates rare but exceptionally intense long-term drought episodes resulting from multi-year accumulated precipitation deficits. At this time scale, droughts have a regional character and exert a significant impact on groundwater resources and the overall catchment water balance.
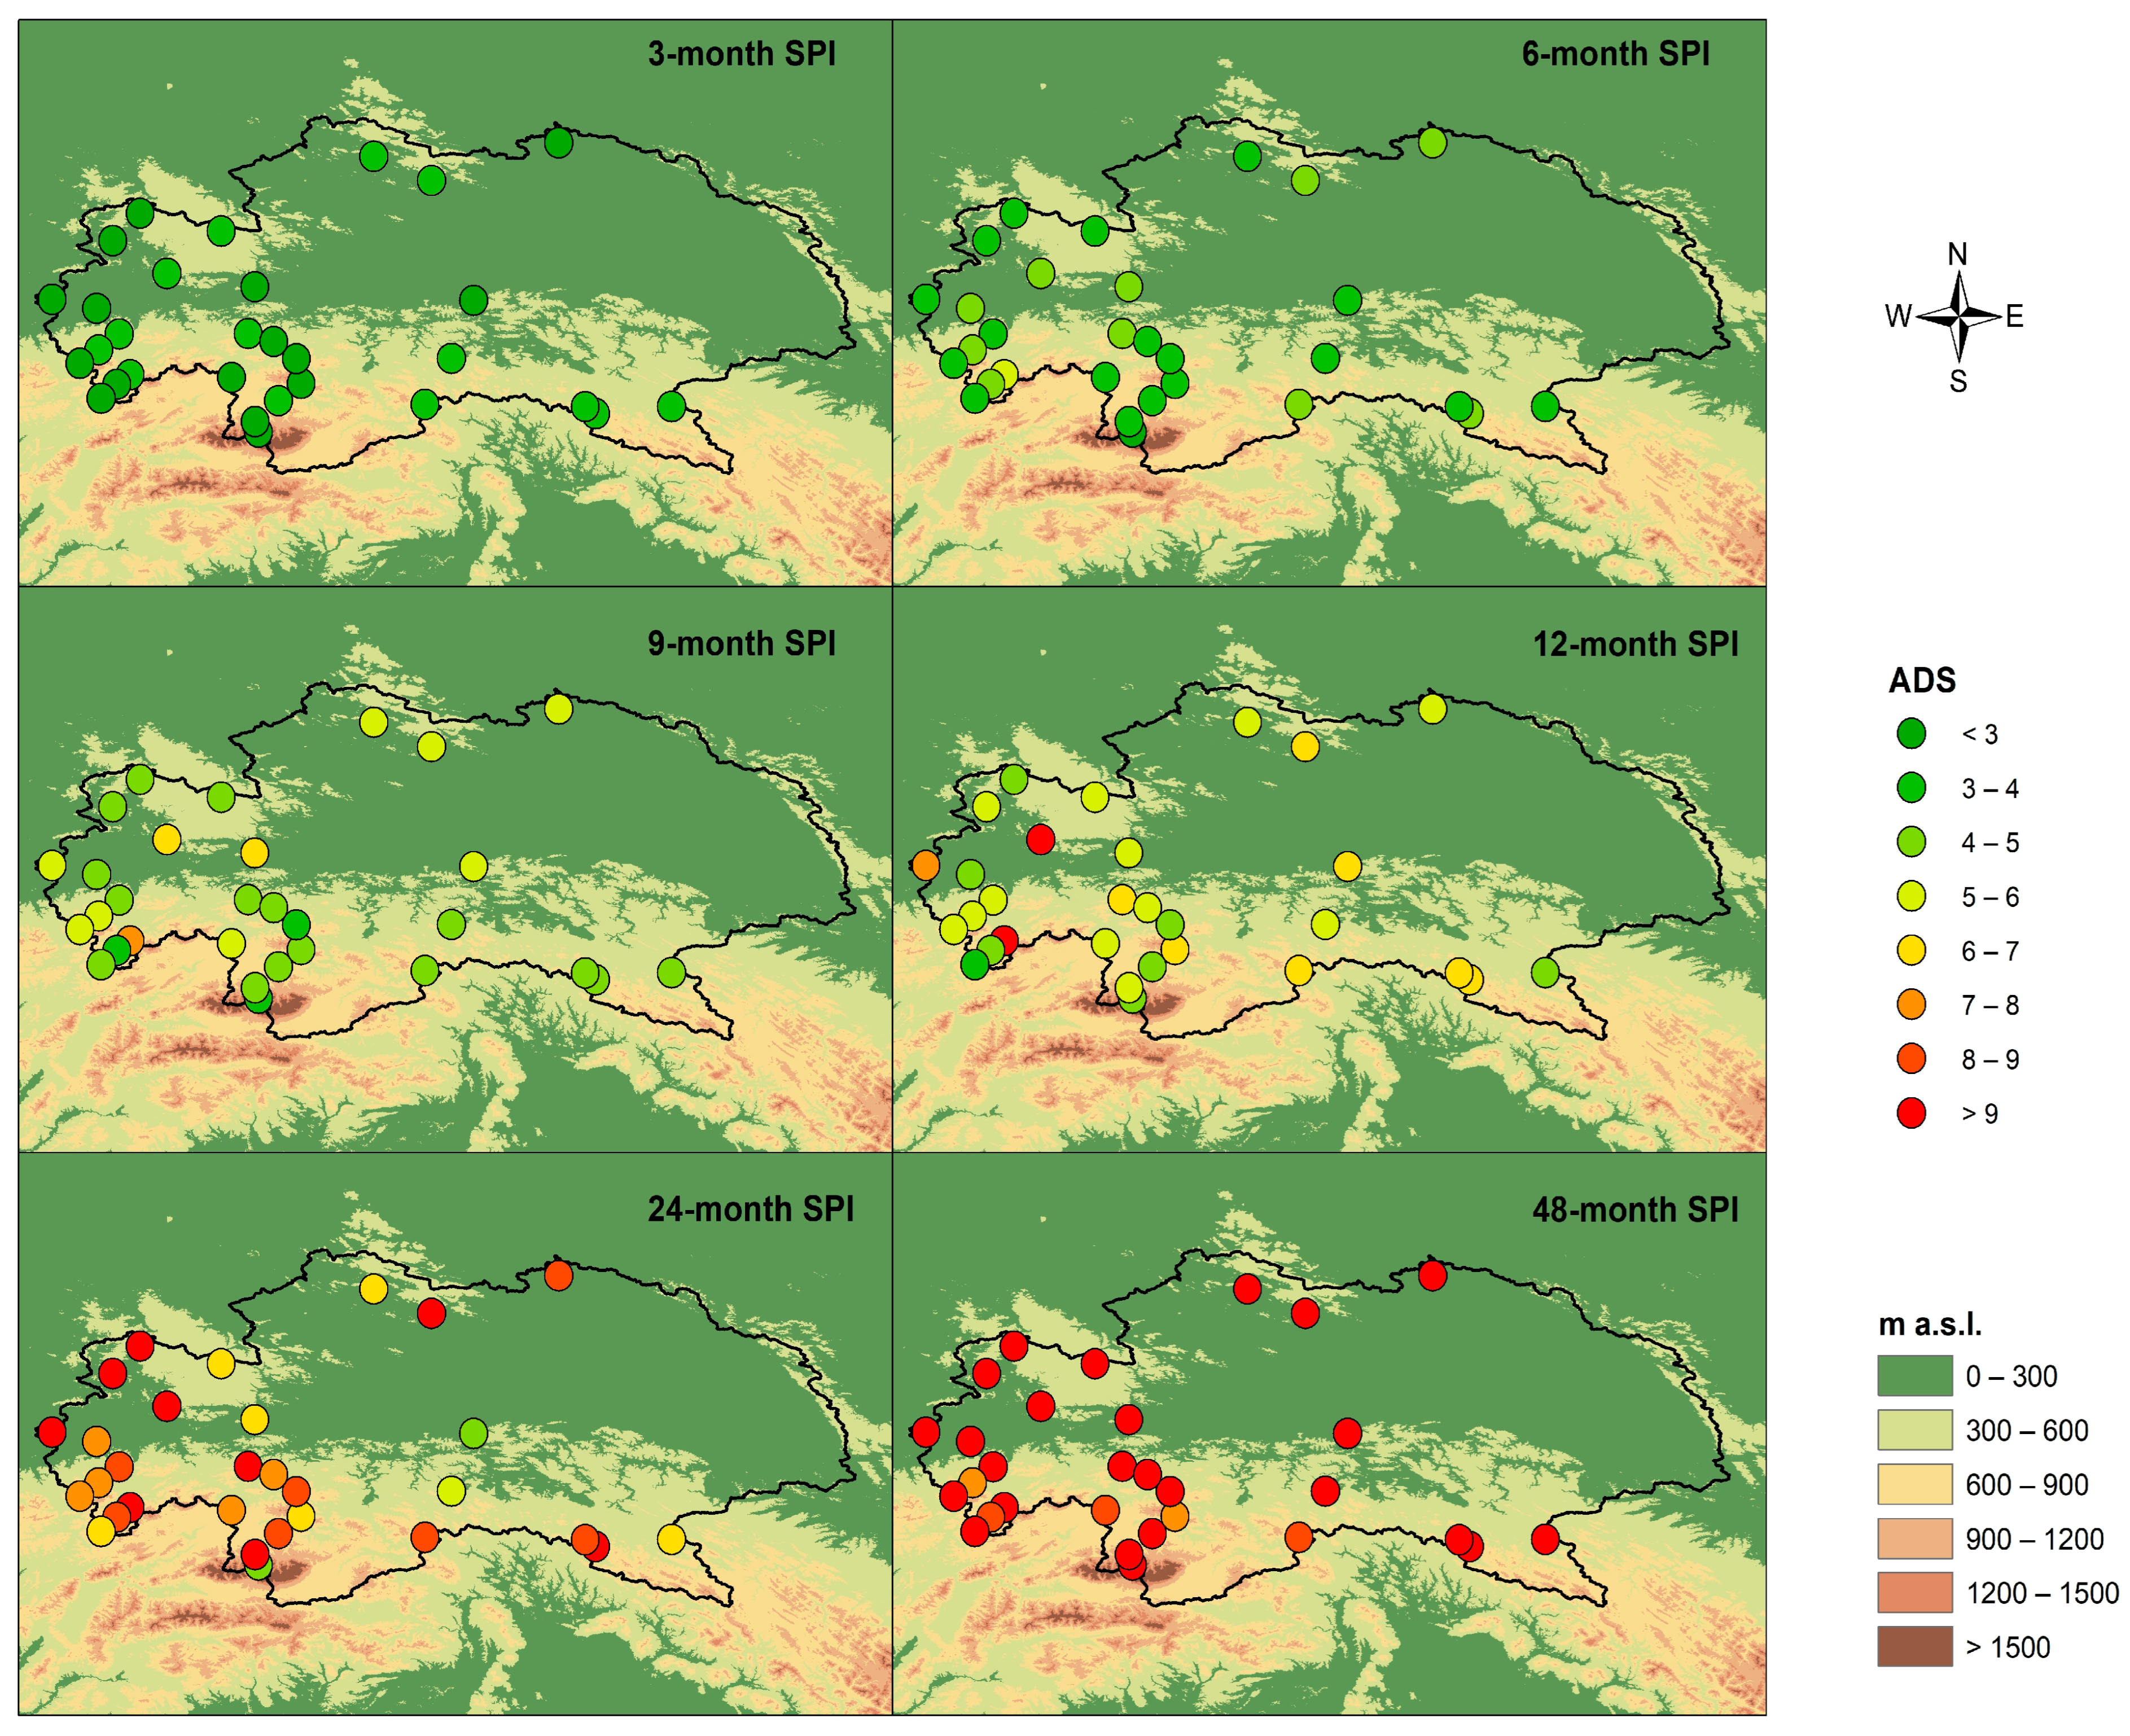
Figure 8 presents the spatial variability of the average drought severity (ADS) for the SPI. The spatial analysis indicates a clear increase in ADS values with increasing SPI aggregation period. For SPI-3, the average drought severity is low and relatively spatially uniform. At most stations, ADS values do not exceed 3–4, indicating that short-term droughts are generally moderate and result from temporary precipitation deficits. Their impacts are mainly local and short-lived, primarily affecting soil moisture conditions. With increasing aggregation periods for SPI-6 and SPI-9, a gradual rise in ADS values and increasing spatial differentiation among stations are observed. Average drought severity most often falls within the range of 4–6, with relatively higher values more frequently occurring in the western and south-western parts of the basin, including foothill and upland areas. For SPI-12, a further increase in ADS and more pronounced spatial contrasts are evident. At several stations, especially in the western part of the basin, ADS values exceed 7–8, indicating the occurrence of stronger and more persistent drought episodes. The highest average drought severity values are observed for the long-term scales SPI-24 and SPI-48. In these cases, ADS exceeds 8–9 at many stations and locally reaches values above 9, indicating exceptionally intense and persistent drought episodes. At the SPI-48 scale, droughts display a distinctly regional character, and their spatial pattern shows greater coherence, suggesting that multi-year climatic variability plays a more dominant role than local topographic controls. A relationship between drought severity and elevation above sea level is also evident: stations located at lower elevations, particularly in the northern and north-western parts of the basin, more often exhibit higher ADS values at longer time scales [40,41]. Mountain areas, despite higher precipitation sums, are not free from severe long-term droughts; however, their occurrence is less frequent and more spatially heterogeneous [42,43].

3.4. Average Drought Intensity (ADI)

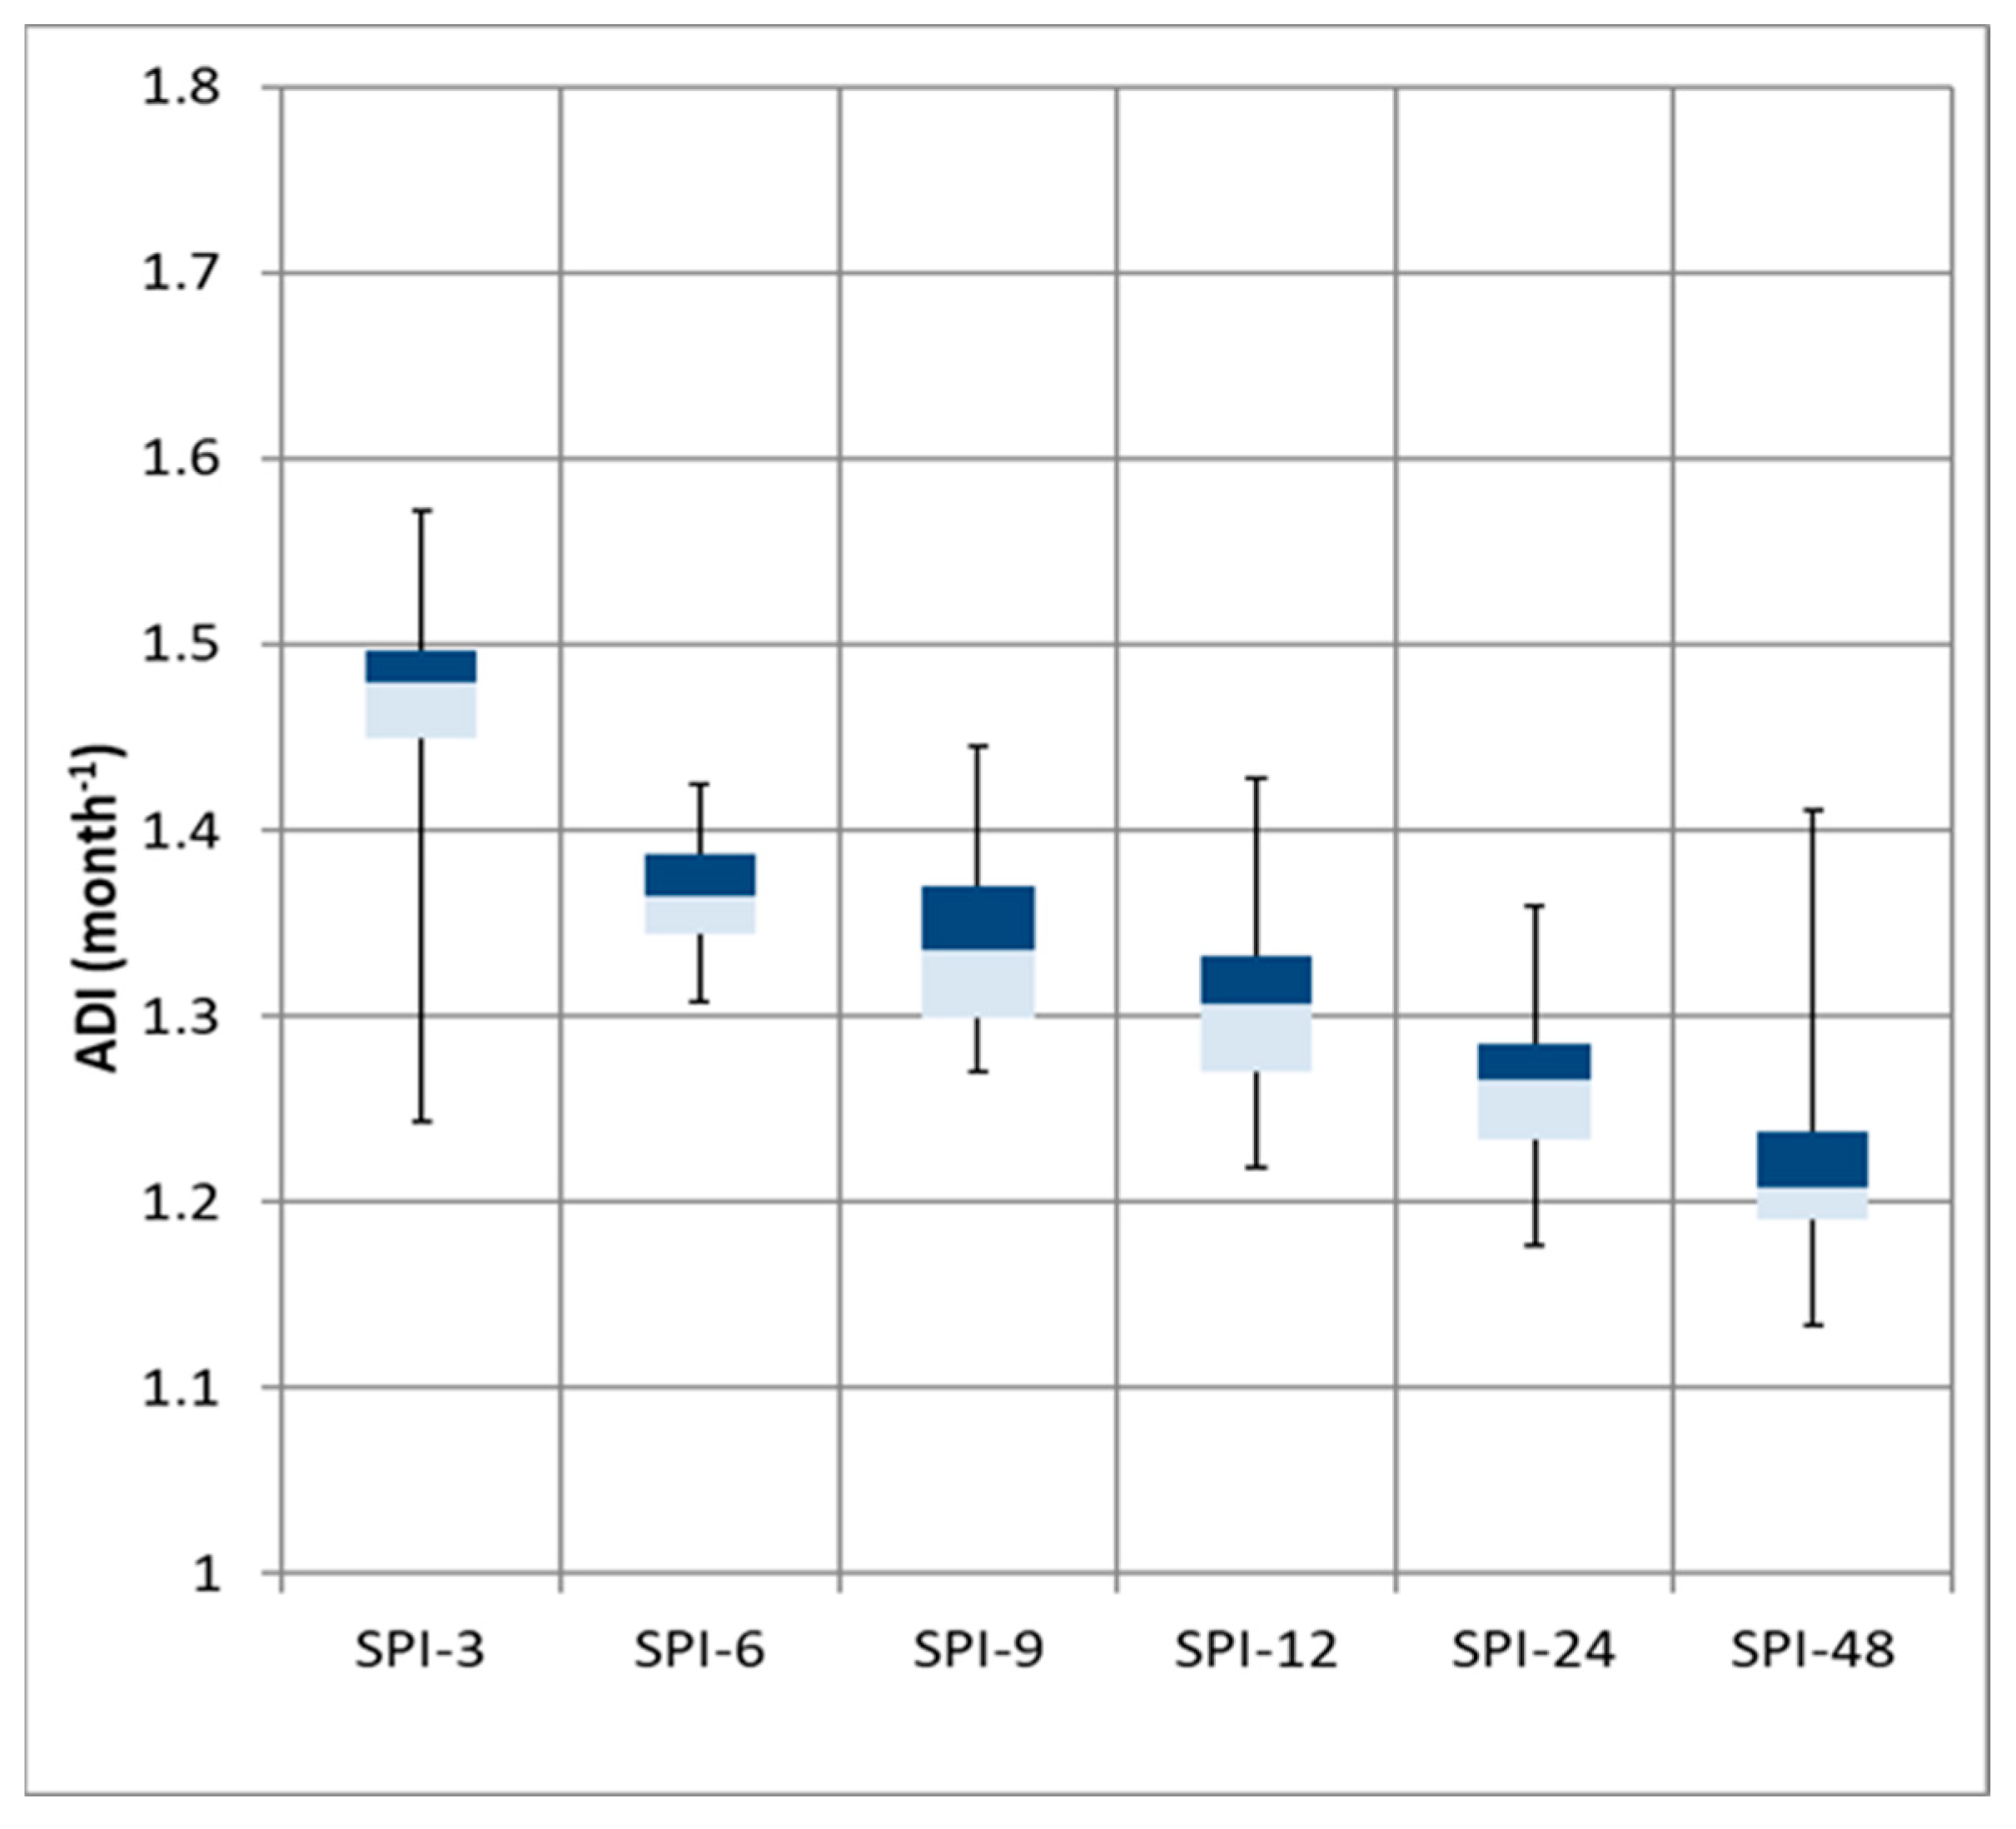
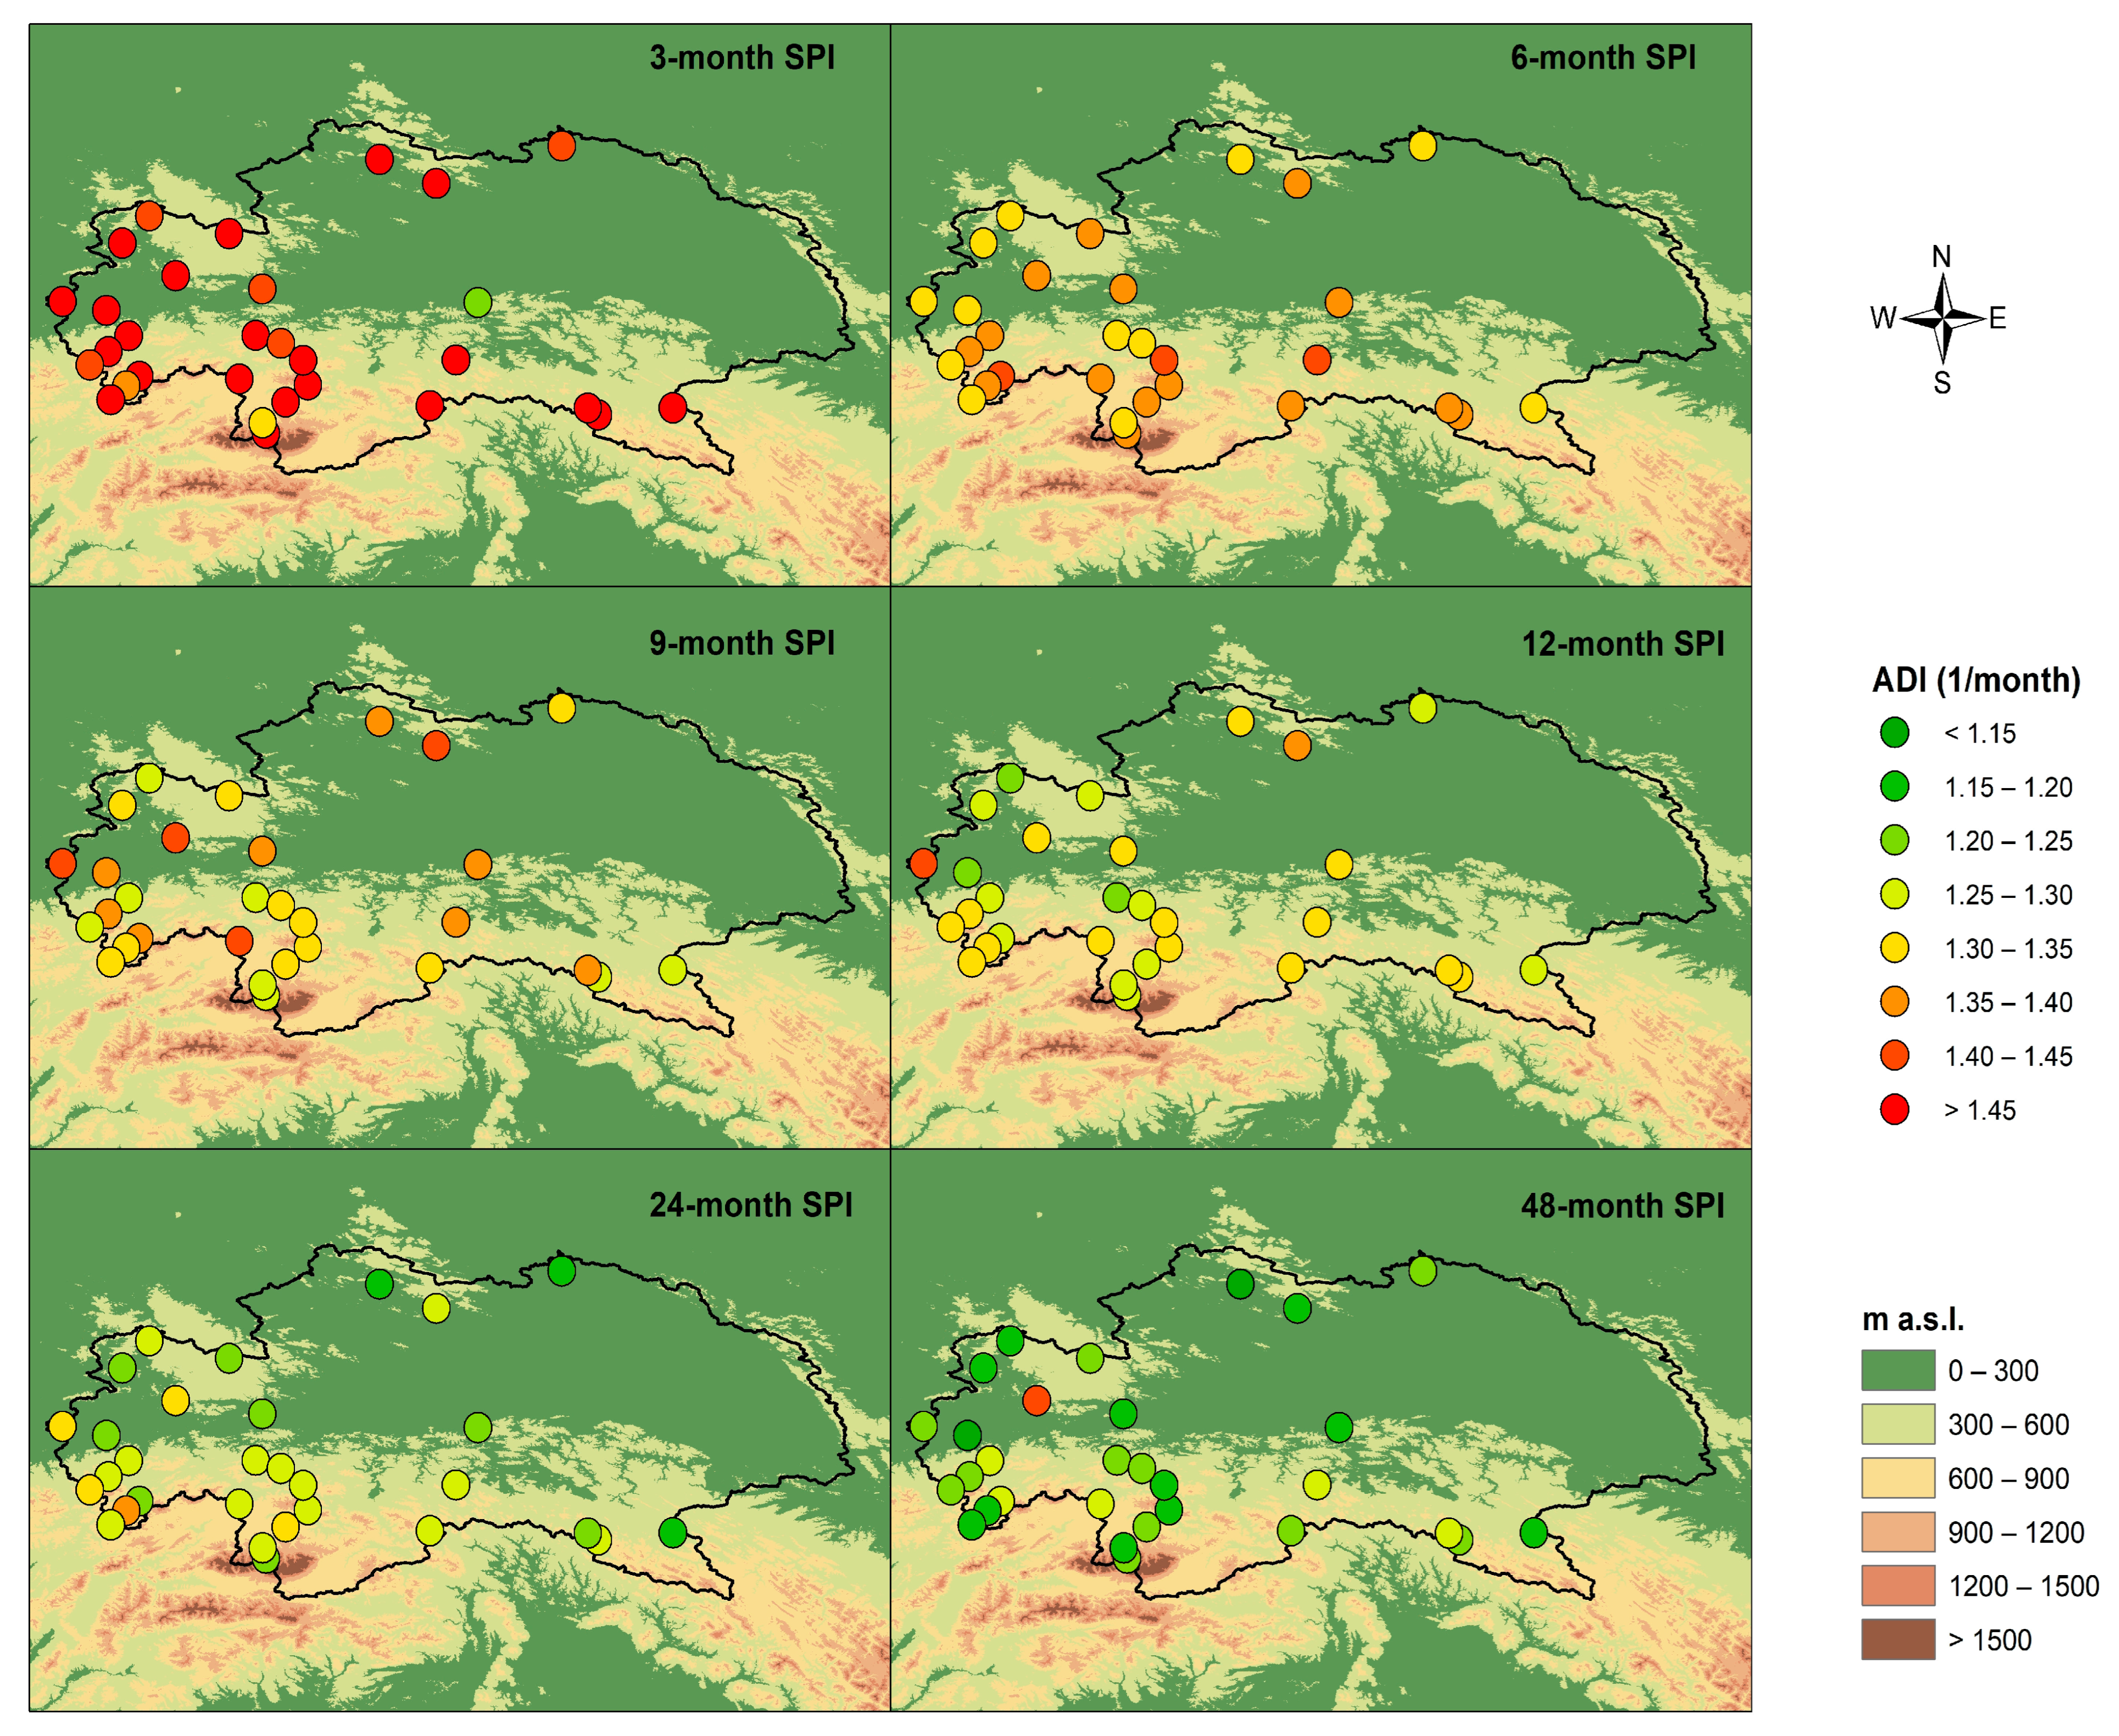
The distribution of the average drought intensity (ADI) is shown in Table 3 and Figure 9.
A clear and systematic relationship was found between drought intensity and the adopted SPI time scale. The highest ADI values are observed for SPI-3, for which median drought intensity exceeds 1.45 month−1, with relatively greater variability between stations. This indicates that short-term droughts are characterized by higher monthly intensity, resulting from the abrupt nature of precipitation deficits over short time horizons. Such episodes may lead to rapid deterioration of soil moisture conditions, particularly during agriculturally sensitive periods [44]. With increasing aggregation periods for SPI-6 and SPI-9, a gradual decrease in ADI values is observed. Median intensity declines to about 1.35–1.38 for SPI-6 and 1.32–1.35 for SPI-9, accompanied by reduced spatial variability among stations. This suggests that medium-term droughts, although more severe in cumulative terms, develop more gradually and exhibit lower monthly intensity. The lowest average drought intensity values occur at longer time scales (SPI-12, SPI-24, and SPI-48). In these cases, median ADI values gradually decrease to about 1.30 for SPI-12, 1.25 for SPI-24, and close to 1.20 for SPI-48. At the same time, the range of extreme values remains relatively limited, indicating a more stable, though prolonged, character of droughts identified at longer time scales.
The spatial variability of average drought intensity (ADI) is presented in Figure 10. Clear spatial differentiation of drought intensity is evident, and its pattern changes markedly with increasing SPI time scale. For SPI-3, the highest ADI values are observed in the western and south-western parts of the basin, where drought intensity exceeds 1.40–1.45 month−1 at many stations. This indicates the rapid and abrupt character of short-term meteorological droughts resulting from fast and pronounced precipitation deficits. At this time scale, drought intensity shows substantial spatial variability, suggesting a strong influence of local circulation conditions and Carpathian orography on the rate of precipitation deficit development [13]. For SPI-6 and SPI-9, a clear decrease in average drought intensity is visible at most stations. ADI values are predominantly within the range of 1.30–1.40 month−1, and spatial variability gradually weakens. However, drought intensity remains relatively higher in the western part of the basin, indicating a persistent regional pattern of susceptibility to rapid deficit intensification despite the longer accumulation period. For SPI-12, average drought intensity decreases further, with ADI values at most stations falling within the range of 1.25–1.35 month−1. The spatial pattern becomes more uniform, suggesting that droughts at this time scale develop more slowly and are driven more by accumulated precipitation anomalies than by short-term atmospheric impulses. The lowest ADI values are observed at longer time scales (SPI-24 and SPI-48). In these cases, values below 1.25 month−1 dominate, and locally fall below 1.20 month−1. Spatial variability is clearly reduced, indicating a more stable and regionally coherent character of long-duration droughts. At these time scales, droughts develop gradually but persist for long periods, allowing their impacts to accumulate within the hydrological system despite relatively low monthly intensities.

4. Discussion

The results describing meteorological drought characteristics in the Upper Vistula basin based on the Standardized Precipitation Index (SPI) show that the drought signal strongly depends on the aggregation time scale: short time scales highlight frequent and relatively short episodes that are particularly relevant for soil moisture and agriculture, whereas longer time scales reveal less frequent but more persistent precipitation deficits that are important for water resources and long-term regional water management [45]. Table 4 summarizes drought episode characteristics identified from the SPI series using the run method. In this analysis, only drought episodes with SPI < −1 were considered, in order to maintain consistency with the drought-event selection threshold adopted in the run method. Three SPI accumulation periods were selected, namely SPI3, SPI12, and SPI48, to illustrate drought behavior at different temporal scales.
The results indicate that 2022 was the year with the highest number of drought episodes for all three indices. The highest annual numbers of drought episodes were recorded at Kasprowy Wierch for SPI3 (26 episodes), at Piwoń for SPI12 (18 episodes), and at Harkabuz for SPI48 (7 episodes). In terms of total drought frequency, the largest numbers of episodes were observed at Pilzno (74) for SPI3, Rycerka Górna (40) for SPI12, and Rajcza (24) for SPI48. The longest drought episodes were identified at Stróża for SPI3 (12 months), at Chrzanów for SPI12 (40 months), and at Czeladź for SPI48 (104 months). These findings demonstrate that drought characteristics depend strongly on the SPI aggregation period: the number of drought episodes decreases with increasing aggregation time, whereas drought duration increases with longer aggregation periods.
Drought characteristics are also controlled by climatic and physiographic conditions, and threshold values may vary depending on regional context [22,46,47,48,49]. The distributions of the number of identified drought episodes (N) across stations show a clear decrease in N with increasing aggregation period (highest for SPI-3 and lowest for SPI-48). This pattern is consistent with both statistical and hydrometeorological reasoning: short-term precipitation deficits occur relatively often, whereas multi-year deficits require the accumulation of unfavorable conditions over several consecutive seasons, which reduces their frequency but increases the overall weight of individual events [50]. At the same time, the observed increase in average drought duration (ADD) and average drought severity (ADS) at longer SPI time scales confirms that long-term droughts are less frequent but more persistent and cumulative in nature. This pattern is consistent with European and Central European studies showing that multi-seasonal and multi-year droughts (often emphasized by SPI-12, SPI-24, SPI-48 or indices including water balance components) occur less frequently but lead to stronger system-wide impacts [2,51]. In parallel, the decrease in average drought intensity (ADI) with increasing SPI time scale suggests that short drought episodes more often reach high “sharpness” (a rapid drop of SPI below the threshold within a short period), whereas long-term droughts develop more gradually. Their strength results primarily from long duration and cumulative effects rather than from extremely low index values in individual months. The scale-dependent drought response aligns with widely reported findings that agriculture and soil moisture conditions are most sensitive to short time scales, while water resources management and stored water components are more closely linked to longer time scales [22]. Spatial patterns indicate that the highest N values for short time scales (SPI-3 and partly SPI-6) are concentrated in the western and south-western parts of the study area, especially in the Carpathian foothill and mountain zones, whereas for long time scales (SPI-24 and SPI-48) the number of drought episodes becomes low across almost the entire basin. For ADD and ADS, spatial patterns become more differentiated with increasing aggregation period. In particular, the foothill and mountainous areas of the Carpathians are characterized by more complex precipitation regimes, which are strongly affected by orographic effects. These include enhanced precipitation sums, but also higher temporal variability, which may lead to a greater frequency of short-term fluctuations in SPI values and, consequently, a higher number of drought episodes identified at shorter accumulation scales. At the same time, the reduction in the number of drought episodes for longer accumulation periods (SPI-24 and SPI-48) across the entire basin is consistent with the smoothing effect of longer aggregation windows, which dampens short-term variability and highlights more persistent, long-duration drought conditions. This distribution may reflect differences in multi-season precipitation variability, including increasingly frequent winter and spring deficits. Precipitation trends may also influence the course of atmospheric drought. As shown by exemplary studies [13] conducted in the Upper Vistula region, statistically significant trends for SPI9 and SPI12 were observed at stations located in the western part of the region. At the same time, for SPI3, the analysis results showed that trends related to interannual drought patterns were statistically insignificant. The SPI-3 results show a clear link with the dominance of anticyclonic circulation patterns, including high-pressure ridges (e.g., Ka and Wa types in the circulation calendar for southern Poland). Similar conclusions have been reported for central Poland, where dry episodes are more frequent under anticyclonic than cyclonic circulation [52]. In the Upper Vistula basin, including the Polish Carpathians, this relationship has been further confirmed through direct linkage between drought characteristics and synoptic situation calendars [13,53]. The results indicate that drought assessment in the Upper Vistula basin should adopt a multi-scale framework, particularly from a risk management perspective. These findings confirm that the choice of index and time scale should depend on the impact type and sector considered [22,23]. For the Upper Vistula basin, links between meteorological and hydrological drought as well as non-climatic drivers have also been demonstrated [18]. Some limitations must be noted. Numerous gaps in precipitation records, particularly in the eastern part of the basin, restrict the reliability of detailed spatial drought variability analysis. In addition, the lack of air temperature data prevents a comprehensive assessment using the Standardized Precipitation Evapotranspiration Index (SPEI).

5. Conclusions

The study presents a multi-scale assessment of meteorological drought characteristics in the Upper Vistula basin, based on long-term precipitation series and the Standardized Precipitation Index (SPI). The analysis conducted revealed numerous extreme drought episodes across all SPI timescales. Run theory has not been used to characterize drought in the analyzed region so far. By analyzing drought frequency, duration, severity, and intensity across six accumulation scales (3–48 months), it was demonstrated that drought behavior in the region is strongly time-scale dependent and exhibits substantial spatial heterogeneity. Short-term droughts identified using SPI-3 and SPI-6 occur frequently across the basin and are characterized by relatively high monthly intensity but short duration. As a result, they are particularly important for agricultural systems and soil moisture conditions, where even short but intense dry periods may lead to significant losses. With increasing SPI time scale, droughts occur less frequently but are characterized by longer duration and greater severity. Long-term droughts at SPI-24 and SPI-48 show much longer average duration and higher severity despite lower monthly intensity. These events reflect accumulated multi-seasonal and multi-year precipitation deficits and represent the most serious threat to regional water resources, groundwater recharge, and long-term water availability. The results show that short-term droughts are intense but persist for a short duration, whereas long-term droughts are less intense but persist much longer. Spatial analyses reveal consistent regional patterns across the examined drought characteristics. In particular, the southern and south-western part of the region, located at higher elevations, is especially prone to more frequent drought occurrence (higher N). In these areas, droughts occur more often but are generally less intense. In contrast, the northern and western parts of the region show higher drought intensity (DI), severity (DS), and duration (DD), especially at longer accumulation periods. These patterns highlight the combined influence of regional climatic gradients, atmospheric circulation variability, and physiographic heterogeneity, including elevation, on drought development. The systematic increase in drought duration and severity with increasing SPI time scale, accompanied by decreasing intensity, confirms the necessity of a multi-scale approach to drought assessment. Relying on a single SPI time scale would lead to an incomplete or biased picture of drought risk, particularly in regions with complex climatic and topographic conditions such as the Upper Vistula basin. The results emphasize that effective drought monitoring and management in Central Europe require the simultaneous consideration of both short- and long-term drought processes. Short SPI time scales are crucial for early warning systems and agricultural decision-making, whereas longer time scales are essential for strategic water resources planning and climate adaptation. The presented findings could provide a scientific basis for improving drought risk assessment and supporting integrated water management strategies in the Upper Vistula basin and other comparable regions.

Author Contributions

Conceptualization, A.W. (Andrzej Walega) and T.C.; methodology, T.C.; software, T.C.; validation, A.W. (Agnieszka Walega), A.W. (Andrzej Walega) and A.D.M.; formal analysis, A.W. (Agnieszka Walega) and T.C.; investigation, A.W. (Agnieszka Walega) and T.C.; resources, A.W. (Agnieszka Walega); data curation, A.W. (Agnieszka Walega).; writing—original draft preparation, A.W. (Agnieszka Walega), A.W. (Andrzej Walega) and T.C.; writing—review and editing, A.D.M.; visualization, T.C.; supervision, A.W. (Andrzej Walega) and T.C.; project administration, A.W. (Agnieszka Walega). All authors have read and agreed to the published version of the manuscript.

Funding

This research received no external funding.

Institutional Review Board Statement

Not applicable.

Informed Consent Statement

Not applicable.

Data Availability Statement

The data are available on https://danepubliczne.imgw.pl (accessed on 15 February 2025).

Acknowledgments

The authors thank the Editors and anonymous reviewer for their evaluation and very important comments that helped to increase the quality of this paper. During the preparation of this manuscript/study, the authors used ChatGPT5.2 to verify the English grammar. The authors have reviewed and edited the output and take full responsibility for the content of this publication.

Conflicts of Interest

The authors declare no conflicts of interest.

References

  1. IPCC. Climate Change 2021: The Physical Science Basis; Cambridge University Press: Cambridge, UK, 2021. [Google Scholar] [CrossRef]
  2. Toreti, A.; Belward, A.; Perez-Dominguez, I.; Naumann, G.; Luterbacher, J.; Cronie, O.; Seguini, L.; Manfron, G.; Lopez-Lozano, R.; Baruth, B.; et al. The exceptional 2018 European water seesaw calls for action on adaptation. Earth’s Future 2019, 7, 652–663. [Google Scholar] [CrossRef]
  3. Naumann, G.; Cammalleri, C.; Mentaschi, L.; Feyen, L. Increased economic drought impacts in Europe with anthropogenic warming. Nat. Clim. Change 2021, 11, 485–491. [Google Scholar] [CrossRef]
  4. Meza, I.; Siebert, S.; Döll, P.; Kusche, J.; Herbert, C.; Rezaei, E.E.; Nouri, H.; Gerdener, H.; Popat, E.; Frischen, J.; et al. Global-scale drought risk assessment for agricultural systems. Nat. Hazards Earth Syst. Sci. 2020, 20, 695–712. [Google Scholar] [CrossRef]
  5. Bakke, S.J.; Ionita, M.; Tallaksen, L.M. Recent European drying and its link to prevailing large-scale atmospheric patterns. Sci. Rep. 2023, 13, 21921. [Google Scholar] [CrossRef] [PubMed]
  6. Bešťáková, Z.; Kyselý, J.; Lhotka, O.; Heilig, M.; Eitzinger, J. Warm-season drying across Europe and its links to atmospheric circulation. Earth Space Sci. 2024, 11, e2023EA003434. [Google Scholar] [CrossRef]
  7. Aalbers, E.E.; Lenderink, G.; van Meijgaard, E.; van den Hurk, B. The 2018 west-central European drought projected in a pseudo global warming experiment. Nat. Hazards Earth Syst. Sci. 2023, 23, 1921–1946. [Google Scholar] [CrossRef]
  8. Barbosa, P.; Masante, D.; Arias Muñoz, C.; Cammalleri, C.; De Jager, A.; Magni, D.; Mazzeschi, M.; McCormick, N.; Naumann, G.; Spinoni, J.; et al. Droughts in Europe and Worldwide 2019–2020; EUR 30719 EN; Publications Office of the European Union: Luxembourg, 2021; (JRC125320). [Google Scholar] [CrossRef]
  9. Hari, V.; Rakovec, O.; Markonis, Y.; Hanel, M.; Kumar, R. Increased future occurrences of the exceptional 2018–2019 Central European drought under global warming. Sci. Rep. 2020, 10, 12207. [Google Scholar] [CrossRef]
  10. Ionita, M.; Nagavciuc, V.; Kumar, R.; Rakovec, O. On the curious case of the recent decade, mid-spring precipitation deficit in central Europe. npj Clim. Atmos. Sci. 2020, 3, 49. [Google Scholar] [CrossRef]
  11. Ionita, M.; Boroneanț, C.; Chelcea, S. Seasonal modes of dryness and wetness variability over Europe and their connections with large-scale atmospheric circulation and global sea surface temperature. Clim. Dyn. 2015, 45, 2803–2829. [Google Scholar] [CrossRef]
  12. Rousi, E.; Fink, A.H.; Andersen, L.S.; Becker, F.N.; Beobide-Arsuaga, G.; Breil, M.; Cozzi, G.; Heinke, J.; Jach, L.; Niermann, D.; et al. The extremely hot and dry 2018 summer in central and northern Europe from a multi-faceted weather and climate perspective. Nat. Hazards Earth Syst. Sci. 2023, 23, 1699–1718. [Google Scholar] [CrossRef]
  13. Wałęga, A.; Cebulska, M.; Ziernicka-Wojtaszek, A.; Młocek, W.; Wałęga, A.; Nieróbca, A.; Caloiero, T. Spatial and temporal variability of meteorological droughts including atmospheric circulation in Central Europe. J. Hydrol. 2024, 642, 131857. [Google Scholar] [CrossRef]
  14. Luo, S.; Tetzlaff, D.; Smith, A.; Soulsby, C. Long-term drought effects on landscape water storage and recovery under contrasting land uses. J. Hydrol. 2024, 636, 131339. [Google Scholar] [CrossRef]
  15. Łabędzki, L.; Bąk, B. Meteorological and agricultural drought indices used in drought monitoring in Poland: A review. Meteorol. Hydrol. Water Manag. 2014, 2, 3–14. [Google Scholar] [CrossRef]
  16. Sánchez, D.E.; Cantos, J.O. One country, several droughts: Characterisation, evolution, and trends in meteorological droughts in Spain within the context of climate change. Climate 2025, 13, 202. [Google Scholar] [CrossRef]
  17. Bokwa, A.; Klimek, M.; Krzaklewski, P.; Kukułka, W. Drought trends in the Polish Carpathian Mts. in the years 1991–2020. Atmosphere 2021, 12, 1259. [Google Scholar] [CrossRef]
  18. Kubiak-Wójcicka, K.; Bąk, B. Monitoring of meteorological and hydrological droughts in the Vistula basin (Poland). Environ. Monit. Assess. 2018, 190, 691. [Google Scholar] [CrossRef]
  19. Hayes, M.J.; Svoboda, M.D.; Wilhite, D.A.; Vanyarkho, O.V. Monitoring the 1996 drought using the standardized precipitation index. Bull. Am. Meteorol. Soc. 1999, 80, 429–438. [Google Scholar] [CrossRef]
  20. Łabędzki, L. Estimation of local drought frequency in central Poland using the standardized precipitation index SPI. Irrig. Drain. 2007, 56, 67–77. [Google Scholar] [CrossRef]
  21. Przybylak, R.; Oliński, P.; Koprowski, M.; Filipiak, J.; Pospieszyńska, A.; Chorążyczewski, W.; Puchałka, R.; Dąbrowski, H.P. Droughts in the area of Poland in recent centuries in the light of multi-proxy data. Clim. Past 2020, 16, 627–661. [Google Scholar] [CrossRef]
  22. Bachmair, S.; Svensson, C.; Hannaford, J.; Barker, L.J.; Stahl, K. A quantitative analysis to objectively appraise drought indicators and model drought impacts. Hydrol. Earth Syst. Sci. 2016, 20, 2589–2609. [Google Scholar] [CrossRef]
  23. Stagge, J.H.; Tallaksen, L.M.; Gudmundsson, L.; Van Loon, A.F.; Stahl, K. Candidate distributions for climatological drought indices (SPI and SPEI). Int. J. Climatol. 2015, 35, 4027–4040. [Google Scholar] [CrossRef]
  24. Kottek, M.; Grieser, J.; Beck, C.; Rudolf, B.; Rubel, F. World map of the Köppen–Geiger climate classification updated. Meteorol. Z. 2006, 15, 259–263. [Google Scholar] [CrossRef] [PubMed]
  25. Młyński, D.; Cebulska, M.; Wałęga, A. Trends, variability, and seasonality of maximum annual daily precipitation in the Upper Vistula Basin, Poland. Atmosphere 2018, 9, 313. [Google Scholar] [CrossRef]
  26. Ngwenya, M.; Gidey, E.; Simatele, M.D. Agroecological-based modeling of meteorological drought at 12-month time scale in the Western Cape Province of South Africa. Earth Sci. Inform. 2024, 17, 1851–1865. [Google Scholar] [CrossRef]
  27. Achite, M.; Simsek, O.; Sankaran, A.; Katipoğlu, O.M.; Caloiero, T. Analyzing the dynamical relationships between meteorological and hydrological drought of Wadi Mina basin, Algeria using a novel multiscale framework. Stoch. Environ. Res. Risk Assess. 2024, 38, 1935–1953. [Google Scholar] [CrossRef]
  28. Edwards, D.C.; McKee, T.B. Characteristics of 20th Century Drought in the United States at Multiple Scales; Atmospheric Science Paper 634; Colorado State University: Fort Collins, CO, USA, 1997; pp. 1–30. [Google Scholar]
  29. Salehnia, N.; Alizadeh, A.; Sanaeinejad, H.; Bannayan, M.; Zarrin, A.; Hoogenboom, G. Estimation of meteorological drought indices based on AgMERRA precipitation data and station-observed precipitation data. J. Arid Land 2017, 9, 797–809. [Google Scholar] [CrossRef]
  30. Chen, C.; Sun, J. Changes in drought characteristics over China using the standardized precipitation evapotranspiration index. J. Clim. 2015, 28, 5430–5447. [Google Scholar] [CrossRef]
  31. Yevjevich, V. Objective Approach to Definitions and Investigations of Continental Hydrologic Droughts; Hydrology Paper 23; Colorado State University: Fort Collins, CO, USA, 1967. [Google Scholar]
  32. McKee, T.B.; Doesken, N.J.; Kleist, J. The relationship of drought frequency and duration to time scales. In Proceedings of the Eighth Conference on Applied Climatology, Anaheim, CA, USA, 17–22 January 1993; American Meteorological Society: Boston, MA, USA, 1993; pp. 179–184. [Google Scholar]
  33. McKee, T.B.; Doesken, N.J.; Kleist, J. Drought monitoring with multiple time scales. In Preprints of the Ninth Conference on Applied Climatology, Dallas, TX, USA, 15–20 January 1995; American Meteorological Society: Boston, MA, USA, 1995; pp. 233–236. [Google Scholar]
  34. Masud, M.B.; Qian, B.; Faramarzi, M. Performance of multivariate and multiscalar drought indices in identifying impacts on crop production. Int. J. Climatol. 2020, 40, 292–307. [Google Scholar] [CrossRef]
  35. Sarkar, B.; Mohinuddin, S.; Islam, A.; Islam, A.R.M.T.; Saha, U.D.; Sengupta, S.; Pal, S.C.; Chu, H.-J.; Huang, J.-C. SPI-gamma random forest modelling for meteorological drought characterization and prediction in the Bengal Delta, Indo–Bangladesh region. Theor. Appl. Climatol. 2025, 156, 51. [Google Scholar] [CrossRef]
  36. Cammalleri, C.; Barbosa, P.; Vogt, J.V. Analysing the relationship between multiple-timescale SPI and GRACE terrestrial water storage in the framework of drought monitoring. Water 2019, 11, 1672. [Google Scholar] [CrossRef]
  37. Vicente-Serrano, S.M.; Domínguez-Castro, F.; Murphy, C.; Hannaford, J.; Reig, F.; Peña-Angulo, D.; Tramblay, Y.; Trigo, R.M.; Mac Donald, N.; Luna, M.Y.; et al. Long-term variability and trends in meteorological droughts in Western Europe (1851–2018). Int. J. Climatol. 2021, 41, E690–E717. [Google Scholar] [CrossRef]
  38. Erfurt, M.; Skiadaresis, G.; Tijdeman, E.; Blauhut, V.; Bauhus, J.; Glaser, R.; Schwarz, J.; Tegel, W.; Stahl, K. A multidisciplinary drought catalogue for southwestern Germany dating back to 1801. Nat. Hazards Earth Syst. Sci. 2020, 20, 2979–2995. [Google Scholar] [CrossRef]
  39. Cebulska, M.; Kholiavchuk, D. Variability of meteorological droughts in the Polish and the Ukrainian Carpathians, 1984–2015. Meteorol. Atmos. Phys. 2022, 134, 17. [Google Scholar] [CrossRef]
  40. Jiang, Y.M.; Marchand, W.; Svoboda, M.; Rydval, M.; Matula, R.; Janda, P.; Begović, K.; Thom, D.; Fruleux, A.; Buechling, A.; et al. Drought resistance of major tree species in the Czech Republic. Agric. For. Meteorol. 2024, 348, 109897. [Google Scholar] [CrossRef]
  41. Baran-Gurgul, K.; Wałęga, A. Seasonal and regional patterns of streamflow droughts in Poland: A 50-year perspective. Sustainability 2025, 17, 7531. [Google Scholar] [CrossRef]
  42. Zamora-Pereira, J.C.; Yousefpour, R.; Cailleret, M.; Bugmann, H.; Hanewinkel, M. Magnitude and timing of density reduction are key for the resilience to severe drought in conifer–broadleaf mixed forests in Central Europe. Ann. For. Sci. 2021, 78, 68. [Google Scholar] [CrossRef]
  43. Jaagus, J.; Aasa, A.; Aniskevich, S.; Boincean, B.; Bojariu, R.; Briede, A.; Danilovich, I.; Castro, F.D.; Dumitrescu, A.; Labuda, M.; et al. Long-term changes in drought indices in eastern and central Europe. Int. J. Climatol. 2022, 42, 225–249. [Google Scholar] [CrossRef]
  44. Cammalleri, C.; McCormick, N.; Spinoni, J.; Nielsen-Gammon, J.W. An analysis of the lagged relationship between anomalies of precipitation and soil moisture and its potential role in agricultural drought early warning. J. Appl. Meteorol. Climatol. 2024, 63, 339–350. [Google Scholar] [CrossRef]
  45. Mishra, A.K.; Singh, V.P.; Desai, V.R. Drought characterization: A probabilistic approach. Stoch. Environ. Res. Risk Assess. 2009, 23, 41–55. [Google Scholar] [CrossRef]
  46. Burka, A.; Biazin, B.; Bewket, W. Drought characterization using different indices, theory of run and trend analysis in Bilate River watershed, Rift Valley of Ethiopia. Front. Environ. Sci. 2023, 11, 1098113. [Google Scholar] [CrossRef]
  47. Zhang, J.; Zhang, M.; Yu, Y.; Yu, R. An innovative method integrating run theory and DBSCAN for complete three-dimensional drought structures. Sci. Total Environ. 2024, 926, 171901. [Google Scholar] [CrossRef]
  48. Achite, M.; Katipoğlu, O.M.; Jehanzaib, M.; Kartal, V.; Mansour, H. Understanding run theory for evaluating hydrologic drought in the Wadi Mina Basin (Algeria): A historical analysis. Theor. Appl. Climatol. 2024, 155, 9673–9688. [Google Scholar] [CrossRef]
  49. Espinosa, L.A.; Portela, M.M.; Filho, J.D.F.; de Carvalho Studart, T.M.; Santos, J.F.; Rodrigues, R. Jointly modeling drought characteristics with smoothed regionalized SPI series for a small island. Water 2019, 11, 2489. [Google Scholar] [CrossRef]
  50. Palagiri, H.; Pal, M. Agricultural drought risk assessment in Southern Plateau and Hills using multi-threshold run theory. Results Eng. 2024, 22, 102022. [Google Scholar] [CrossRef]
  51. Toreti, A.; Cronie, O.; Zampieri, M. Concurrent climate extremes in the key wheat producing regions of the world. Sci. Rep. 2019, 9, 5493. [Google Scholar] [CrossRef]
  52. Araźny, A.; Bartczak, A.; Maszewski, R.; Krzemiński, M. The influence of atmospheric circulation on the occurrence of dry and wet periods in Central Poland in 1954–2018. Theor. Appl. Climatol. 2021, 146, 1079–1095. [Google Scholar] [CrossRef]
  53. Cebulska, M. Atmospheric drought in the Polish Tatras and their foreland in the years 1951–2017. Acta Sci. Pol. Form. Circumiectus 2021, 20, 55–67. [Google Scholar] [CrossRef]
Figure 1. Location of the Upper Vistula Basin.
Sustainability 18 03288 g001
Figure 2. Drought characteristic identification (drought duration (DD), drought severity (DS) and drought intensity (DI)) using “run theory” (example on station Żabnica for SPI48).
Sustainability 18 03288 g002
Figure 3. Spatial distribution of number of droughts N.
Sustainability 18 03288 g003
Figure 4. Spatial variability of the number of drought episodes (N).
Sustainability 18 03288 g004
Figure 5. Spatial distribution of average drought duration ADD.
Sustainability 18 03288 g005
Figure 6. Spatial variability of the average drought duration (ADD).
Sustainability 18 03288 g006
Figure 7. Spatial distribution of average drought severity ADS.
Sustainability 18 03288 g007
Figure 8. Spatial variability of the average drought severity (ADS).
Sustainability 18 03288 g008
Figure 9. Spatial distribution of average drought intensity ADI.
Sustainability 18 03288 g009
Figure 10. Spatial variability of the average drought intensity (ADI).
Sustainability 18 03288 g010
Table 1. Coordinates and elevation of precipitation stations used in the analyses.
StationLatitude (°)Longitude (°)Elevation (m a.s.l.)
Żabnica19.187349.5619745
Annopol21.834250.8894176
Białka Tatrzańska20.105049.4128695
Chrzanów19.415450.1407215
Czeladź19.081850.3286281
Goczałkowice-Zdrój18.980449.9409248
Gorlice21.171249.6552294
Harkabuz19.814449.5457797
Kasprowy Wierch19.981849.23251959
Kielce-Suków20.692250.8105270
Komancza22.063449.3392475
Kraków-Obserwatorium19.958550.0638204
Ochotnica Górna20.244849.5102679
Pilzno21.308349.9872194
Piwoń19.251150.4832297
Półrzeczki20.215149.6524960
Rajcza19.105249.5061488
Raków21.048550.6715246
Rycerka Górna19.008449.4262481
Straconka19.119149.7948505
Stróża19.917649.7965357
Szczyrk18.994649.7030513
Telesnica22.531149.3801445
Tylicz21.008949.3923591
Warszowice18.705549.9919270
Węglówka20.074549.7502482
Wisła Głębce18.877449.6282555
WislokWielki21.999249.3787546
Wolbrom19.751250.3842369
Zakopane19.960349.2938855
Table 2. Classification of SPI values.
SPIClassification
SPI ≤ −2.0extremely dry
−2.0 < SPI ≤ −1.5severe dry
−1.5 < SPI ≤ −1.0moderate dry
−1.0 < SPI < 1.0normal
1.0 ≤ SPI < 1.5moderate wet
1.5 ≤ SPI < 2.0severe wet
SPI ≥ 2.0extremely wet
Table 3. Basic statistics of the drought characteristics.
Drought CharacteristicsStatistics *SPI-3SPI-6SPI-9SPI-12SPI-24SPI-48
Nmin50.0030.0022.0018.008.004.00
q158.0042.0033.2528.2518.0011.00
median59.0045.5037.0031.0021.0015.00
q363.7547.7541.7535.0023.7517.00
max74.0053.0049.0040.0034.0024.00
ADDmin1.681.982.352.583.265.15
q11.862.462.943.434.736.53
median1.932.613.183.805.508.81
q32.032.803.594.256.2910.73
max2.433.474.596.5612.5032.75
ADSmin2.472.893.393.924.227.73
q12.843.694.314.996.829.79
median2.993.894.785.628.2812.33
q33.144.115.416.159.1016.04
max3.835.627.6010.4223.3356.73
ADImin1.241.311.271.221.181.13
q11.451.341.301.271.231.19
median1.481.361.341.311.271.21
q31.501.391.371.331.281.24
max1.571.421.451.431.361.41
* min—minimum value, q1—first quantile, median—median value, q3—third quantile, max—maximum value.
Table 4. Summary of drought episode characteristics based on SPI indices.
IndexMax. Number of Drought EpisodesYear with Max Number of EpisodesLongest Duration
StationValueStationYearNumber of EpisodesStationStartEndDuration (Months)
SPI3Pilzno74KasprowyWierch202226Stróża1983-071984-0612
SPI12Rycerka Górna40Piwoń202218Chrzanów1988-111992-0240
SPI48Rajcza24Harkabuz20227Czeladź1985-091994-04104
Disclaimer/Publisher’s Note: The statements, opinions and data contained in all publications are solely those of the individual author(s) and contributor(s) and not of MDPI and/or the editor(s). MDPI and/or the editor(s) disclaim responsibility for any injury to people or property resulting from any ideas, methods, instructions or products referred to in the content.