1. Introduction
The energy and digital transitions are accelerating the adoption of power electronics in both distributed generation and end-use. In low-voltage networks and modern microgrids, the proliferation of distributed energy resources (DERs) connected via converters, including photovoltaics, small-scale wind power, storage devices, and chargers, coexists with a growing density of nonlinear loads (ICT, LED lighting, switched-mode power supplies, drives, and UPS).
This scenario shifts the issue of power quality (PQ) from a classic approach dominated by low-frequency harmonics to a multiscale phenomenon that includes harmonics and interharmonics, dynamic interactions between converters, and, increasingly, emissions in the 2–150 kHz range (supraharmonics) associated with switching and couplings between devices [
1,
2].
In this context, PQ ceases to be a “post–design” attribute and becomes a central operational constraint, with direct effects on losses, heating, dielectric aging, and protection behavior, as well as electromagnetic interference, which can affect sensitive equipment in university and tertiary environments [
3,
4].
A distinguishing feature of microgrids relative to conventional grids is the pronounced dependence of PQ on the operating state. Grid-connected mode, island mode, active/reactive power management and control type (grid-following versus grid-forming) modify the equivalent impedance at the coupling point and the manner in which distortion propagates or amplifies at specific nodes.
Therefore, the PQ problems in microgrids cannot be interpreted solely as “emissions” from a load but also as the result of converter–grid and converter–converter interactions, where control and impedance are coupled in the frequency domain, producing resonances or selective harmonic amplifications [
5,
6].
The recent literature on grid-forming converter control highlights precisely that these schemes, while providing voltage/frequency support and resilience, introduce new parametric sensitivities and interaction mechanisms that must be explicitly addressed to ensure robust performance, including PQ [
5,
6].
In low-voltage three-phase systems with a neutral conductor (3P4W), such as those typically found on campuses and in buildings, the problem becomes even more critical.
The high penetration of nonlinear single-phase loads favors the generation of third-order harmonics, which are zero-sequence and tend to accumulate in the neutral, raising return current and neutral-to-ground voltage, with thermal and functional impacts on conductors, busbars, differential protection and sensitive equipment [
7].
In addition, the coexistence of DER resources and storage inverters in a 3P4W grid introduces opportunities and challenges: on the one hand, it can enable control-based mitigation; on the other hand, the presence of multiple converters can alter the effective sum of harmonic components and create conditions for local amplification, especially when the neutral and grounding system have non-negligible impedances [
8,
9].
At the same time, the technical community has recognized that PQ assessment should not be limited to the traditional harmonic range. The supraharmonic range (2–150 kHz) is particularly relevant in low voltage due to the density of converters, the use of PLC and the variability of network impedances at high frequencies. However, their measurement and interpretation present methodological challenges, including comparability across instruments, grouping methods, time windows, and non-trivial summation laws when multiple sources operate simultaneously [
2,
10,
11].
These elements are especially relevant for monitoring campaigns in real networks, where the overlap of emissions depends on network topology, load simultaneity, and the switching spectrum of multiple equipment. In order to contextualize the problem and methodology,
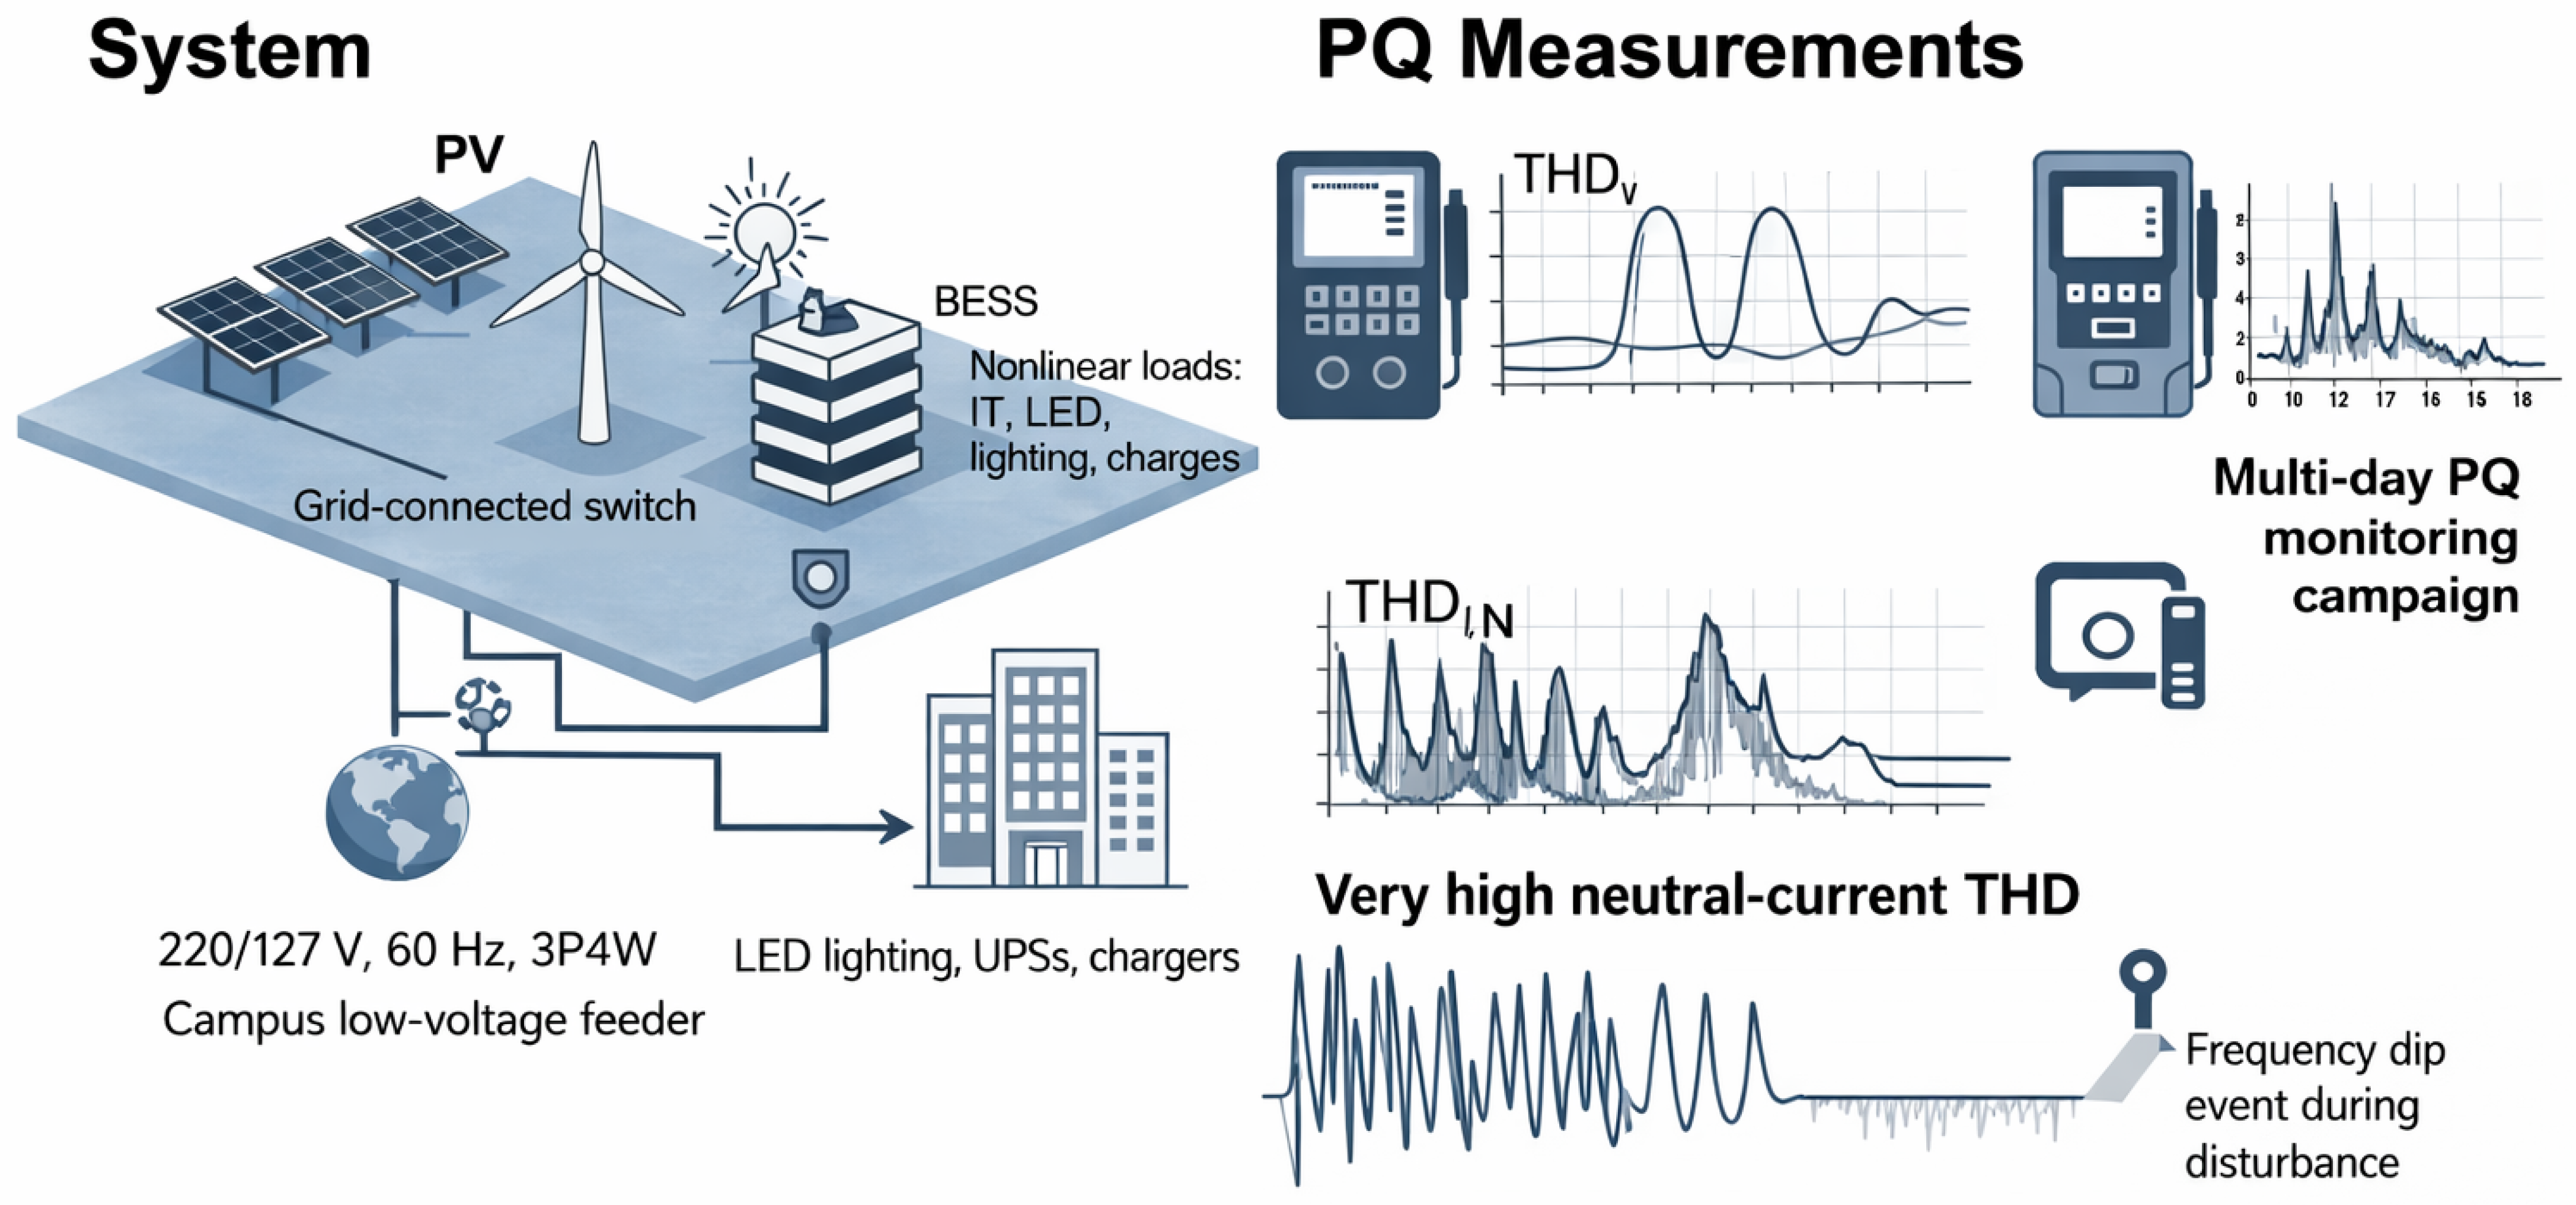
Figure 1 presents a graphical summary of the low-voltage campus microgrid (127 V, 60 Hz, 3P4W) with DER integration and high penetration of nonlinear loads, as well as the measurement strategy based on a power quality analyzer during a multi-day campaign.
Literature Review
In the literature of the last 5 years, there is a growing consensus: in systems with high power electronics penetration, the harmonic distortion observed does not depend solely on the emission spectrum of individual loads but on the coupling between (a) frequency-dependent network impedance, (b) filters and cabling, and (c) converter control loops. In microgrids, this coupling varies greatly between modes (connected/islanded) and control objectives (voltage regulation, current limitation, dynamic support), which affects the amplification/attenuation of harmonics and the occurrence of resonances at specific nodes [
5,
6].
Therefore, recent studies on harmonic mitigation in microgrids highlight that “filtering” alone is not sufficient; it is necessary to consider strategies that are stable in the face of operational variations and maintain harmonic performance under impedance and load uncertainty [
1,
9].
Active power filters (APFs) are among the most studied solutions for harmonic reduction and power factor (PF) improvement, particularly in low-voltage systems with a high density of nonlinear loads. A comprehensive review in this area classifies APF control and performance strategies for different network and load conditions, highlighting their ability to reduce current THD and compensate for imbalance, although with significant implementation costs and complexity [
12]. For retrofit environments, the literature also points to optimized designs of active shunt filters aimed at minimizing distortion with power constraints, variable locations, and load profiles; along these lines, optimal design approaches that consider harmonic performance objectives and practical limitations are reported [
13].
In 3P4W systems, neutral management is critical. Four-leg inverter architectures and phase control with harmonic compensation have been proposed to simultaneously address harmonics, imbalance, and neutral currents, which is especially relevant in networks with a large proportion of single-phase loads [
8]. These solutions are attractive because they act directly on the dominant physical mechanism (the summation of third-order harmonics in the neutral), though they require careful control and sizing to avoid overload during transient or high-distortion conditions.
In addition to dedicated hardware, a strong trend is to use the microgrid’s own converters to improve PQ through control. In isolated microgrids or those with a high converter density, distributed harmonic mitigation strategies have been proposed that combine local control and coordination mechanisms to reduce distortion without installing additional APFs. Along these lines, mitigation schemes with distributed control are reported that address harmonics through active compensation and the distribution of effort among units, while also seeking to maintain stability and overall performance [
14].
Complementarily, robust control in the face of impedance uncertainties and load variability becomes essential; the literature presents explicit strategies to maintain effective mitigation even under parametric changes and non-stationary conditions [
8,
15].
Another relevant approach is wideband mitigation control for island microgrids, where the objective is not only to reduce a small set of harmonics but also to achieve damping and reduction in wider bands without compromising stability or power dynamics. This type of controller is integrated with grid-forming schemes and aims to suppress harmonic components through internal control actions within the converter [
15].
Complementarily, harmonic quality control strategies are also proposed to improve harmonic quality even in low-switching-frequency scenarios, where the ability to act on harmonics is limited by semiconductor discretization and thermal constraints [
12].
At low voltage, the 2–150 kHz range has become highly relevant due to the density of power electronics, and the recent literature has focused on three topics: (i) understanding the impact of supraharmonics on equipment, (ii) comparable measurement methods, and (iii) summation laws when multiple sources are active. Studies in IEEE Access address the general framework of the problem, including standards, generation mechanisms, and potential mitigations and highlight that the regulatory and instrumentation ecosystem is still evolving [
1]. From a metrological perspective, a comparative analysis of methods shows that measurements in this range can vary significantly depending on windowing techniques, grouping, and instrument configuration, which affects reproducibility in field campaigns [
2].
In terms of summation, recent work has advanced in characterizing how supraharmonic currents from multiple sources are aggregated, showing that superposition does not always follow simple models due to the influence of phase, impedance, and source correlation [
10,
11]. This is relevant for microgrids/campuses, where multiple converters and loads operate simultaneously and source attribution can be non-trivial. In addition, models and characterizations of harmonic and supraharmonic sources have been proposed, providing tools for diagnosis and assignment of responsibilities in real scenarios [
4,
16]. Finally, the literature also documents the effects of supraharmonics on equipment, helping justify expanding the analysis range when the goal is to protect sensitive loads [
3].
Although simulation studies abound, prolonged measurement campaigns remain less frequent, despite their value in capturing variability and rare events. The work presented in [
17] assesses PQ in low-voltage networks with high DER penetration using statistical analysis across various operating conditions, highlighting the need to consider distributions rather than averages. This approach is especially useful for campus microgrids where the mix of profiles (labs, offices, lighting) produces marked temporal dynamics and episodes of severe distortion that may be hidden in aggregate indicators. Recent evidence from solar microgrid studies also confirms that nonlinear loads such as UPSs, VFDs, rectifiers, and converter-based devices can become dominant harmonic sources and strongly affect current and voltage distortion at the point of common coupling. In this context, mitigation strategies based on practical filtering and measurement-supported diagnosis remain highly relevant for low-voltage microgrids with concentrated nonlinear demand [
18].
In addition, methods for predicting/estimating harmonics in university microgrids using neural networks with environmental and operational variables have been proposed to anticipate critical conditions and complement on-site measurements [
19]. Such tools suggest a path toward hybrid strategies (measurement + prediction) that can be particularly useful when permanent monitoring at all nodes is not feasible.
Finally, the state of the art recognizes that PQ is closely linked to microgrid control and stability. Recent reviews on microgrid stability highlight emerging challenges as converter penetration grows and the use of advanced control strategies expands, underscoring the need to evaluate performance holistically (stability, control, resilience and PQ) [
9,
14]. In this regard, frameworks for evaluating the technical performance of microgrids have also been proposed, which open the door to incorporating PQ metrics as operating and design variables, facilitating comparisons between real microgrids and systematic evaluations under different scenarios [
20].
In addition, control proposals for compensating for imbalance without communication in grouped microgrids are relevant due to their scalability and potential applicability to campuses with multiple internal feeders [
21].
From a broader systems perspective, the recent literature also links the development of microgrids with resilience-oriented scheduling and the evolution toward smart-grid and super-smart-grid paradigms, where local energy systems are expected to contribute not only to efficiency and flexibility but also to robustness under uncertain operating conditions [
22,
23]. These studies reinforce the relevance of evaluating power quality together with resilience, controllability, and the operational behavior of converter-rich local networks.
Based on the previous state of the art, three main gaps are identified. First, prolonged measurement campaigns in real low-voltage microgrids that allow characterization of temporal variability and capture rare/severe events with sufficient granularity remain limited [
17]. Second, although the criticality of the neutral in 3P4W with nonlinear single-phase loads is recognized, there is still relatively little literature that combines phase-based harmonic analysis, neutral current analysis, and specific mitigation strategies for retrofitting in university environments [
8,
24].
Third, the growth of supraharmonics and the complexity of their measurement and summation in real networks necessitate an explicit methodological discussion to avoid inconsistent diagnoses and delimit the scope of the analysis according to the available instrumentation [
2,
10,
11]. Consequently, this work is positioned as a study based on field measurements and technical analysis focused on campus microgrids, integrating distortion characterization (including critical variables in 3P4W) with a discussion of viable mitigation strategies, aligned with recent control and design approaches for converter-dominated systems [
13,
14,
15].
With the aim of synthesizing the evidence reported in the recent literature (2020–2026) in a structured manner,
Table 1 organizes the main power quality challenges in low-voltage microgrids with a high presence of power electronics and nonlinear loads, linking each issue with the most commonly used evaluation indicators and the most representative mitigation techniques.
In particular, the table summarizes: (i) harmonic distortion associated with nonlinear loads and the need for harmonic conditioning using active/hybrid filters; (ii) resonance phenomena and converter–grid interaction in inverter-dominated systems, addressed through impedance-based and robust control approaches; (iii) harmonic distribution and harmonic voltage amplification among multiple converters, mitigated by virtual impedance and decentralized coordination; (iv) the criticality of the neutral conductor in 3P4W systems and solutions based on four-wire topologies; and (v) emerging aspects such as PQ events, supraharmonics, and operation/planning approaches with PQ constraints. This synthesis allows us to identify trends, advantages, and limitations of current strategies and, at the same time, delineates the gaps that motivate the experimental analysis and mitigation discussion proposed in this work.
This article is structured as follows:
Section 2 presents the materials and methods, including the microgrid description, the measurement setup, and the data processing workflow used for the power quality assessment.
Section 3 presents the results obtained from the multi-day monitoring campaign at the two measurement points.
Section 4 discusses these findings and their implications for distortion mechanisms, mitigation strategies, and future work directions. Finally,
Section 5 presents the conclusions.
2. Materials and Methods
2.1. Description of the Microgrid and Nodes of Interest
This study was conducted on an university microgrid capable of operating both connected to the grid and in island mode, with renewable generation and storage. The microgrid had a power output of around 15 kW, with two installed photovoltaic systems totaling 13 kW and two wind turbines of 1 kW each; in addition, island operation was enabled by a storage system.
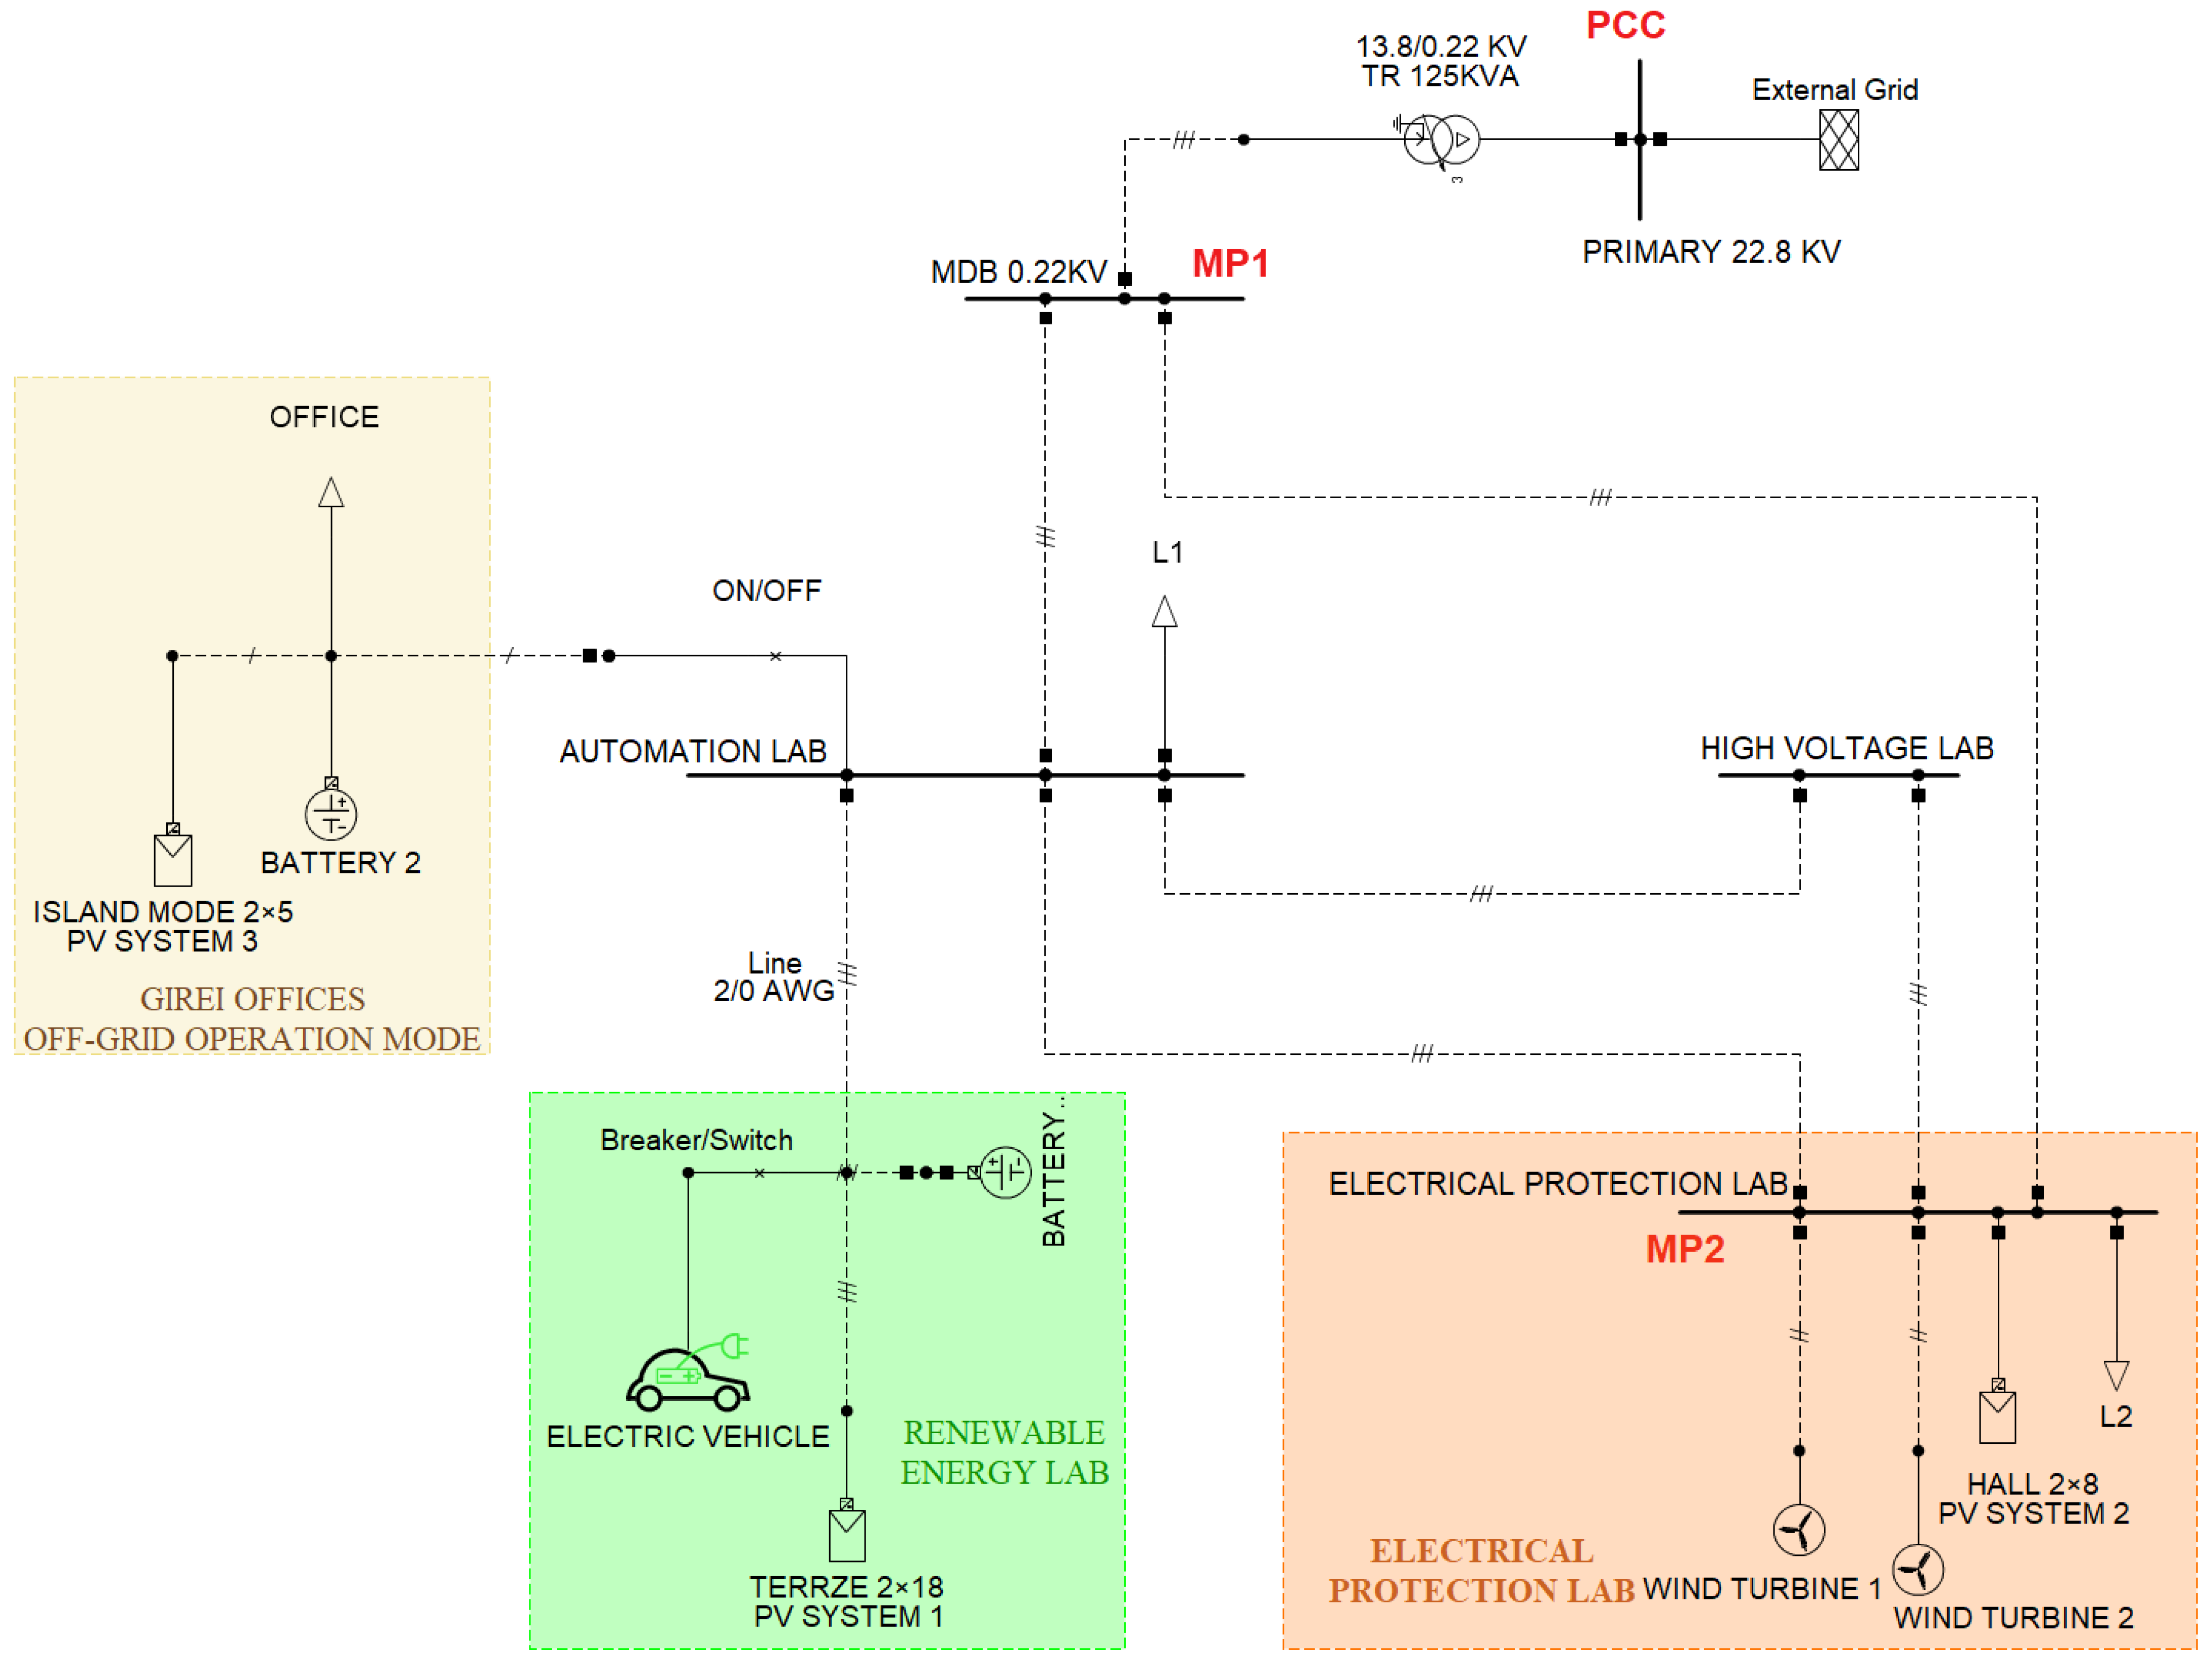
The electrical topology is shown in the single-line diagram in
Figure 2, which identifies: (i) the point of connection to the external grid via transformation to the low voltage level (PCC, external grid); (ii) the load branches associated with each area and laboratory; and (iii) the DER branches (PV, wind, and storage), as well as special loads such as electric vehicles and nonlinear loads.
Figure 2 should be interpreted as a simplified single-line representation in which the external grid is connected at the medium-voltage side, whereas MP1 and MP2 correspond to internal low-voltage buses downstream of the transformation stage. To avoid ambiguity, the labels distinguish the upstream utility connection from the internal 0.22 kV microgrid buses where the power quality measurements were carried out.
In
Figure 2, the colors identify the functional zones, the red labels mark the monitoring points, the dashed lines represent the feeder interconnections, and the symbols indicate the main equipment installed. For the experimental diagnostic, two low-voltage busbars were selected, representative of the operation and behavior of nonlinear loads: the 0.22 kV MDB busbar (hereafter Measurement Point 1—MP1) and the Electrical Protection Lab busbar (hereafter Measurement Point 2—MP2). This selection was justified because it allowed for a comparison of the severity of harmonic distortion and PQ events between two locations with different load profiles within the same microgrid.
The selection of MP1 and MP2 was intended to capture two representative operating conditions within the monitored low-voltage microgrid rather than provide a full source-by-source characterization of all feeders and end-use devices across the campus. Consequently, the measurement campaign was designed to compare the severity of neutral-current distortion at two strategically relevant buses, enabling a neutral-first diagnosis and mitigation prioritization, but not a complete electrical tracing of every harmonic emission source in the wider network.
2.2. Instrumentation, Configuration, and Measurement Campaign
Measurements were taken using a Fluke 1775 power quality analyzer with the IEEE 519 license installed (Fluke Corporation, Everett, WA, USA). The study configuration was set to 3 phases + neutral in star, with a nominal voltage of 220/127 V and a nominal frequency of 60 Hz. Flexible iFlex1500-18 (1500 A) clamps were used for current sensing in A, B, C, and N, with a 1:1 ratio; the voltage assignment was also set to 1:1. Time synchronization was performed using NTP.
The measurement setup followed the manufacturer specifications for the Fluke 1775 analyzer and the iFlex1500-18 current probes and the uncertainty of the reported quantities should therefore be interpreted within the accuracy limits of the instrument–probe combination. In this work, the analyzer was used as a field-grade power quality recorder for comparative statistical assessment between MP1 and MP2, rather than as a laboratory metrology system for traceable uncertainty propagation of every derived harmonic component. This clarification is relevant when interpreting percentile-based differences and event counts close to threshold values. The Fluke 1775 recorder was configured using subgrouped harmonic grouping. Therefore, the analysis was intentionally limited to the traditional harmonic range covered by the measurement setup and does not include the 2–150 kHz supraharmonic range. This scope limitation is consistent with the primary objective of this study, namely, the diagnosis and mitigation assessment of neutral-current distortion in a low-voltage 3P4W microgrid under field conditions. Accordingly, the discussion of compliance with IEEE 519 [
56] is used here as an interpretative reference for harmonic severity but not as a full PCC compliance assessment, since the short circuit to load current ratio
was not determined during the campaign.
At MP1, the effective recording spanned from 15 December 2025, 11:46:36, to 23 December 2025, 15:34:20, corresponding to 8 days, 3 h, 47 min, and 44 s. The analyzer was configured with 5 min intervals for trends and demand, 10 min intervals for PQ records, 10 s intervals for frequency, and event-based logging for disturbances. The same export scheme was applied at MP2, which enabled a homogeneous comparison between both locations under equivalent acquisition and post-processing criteria.
The exported files were organized into four groups: trends, demand, frequency, and events. Trends included RMS variables and PQ metrics per phase and neutral; demand provided aggregated 5 min load quantities; frequency stored 10 s average values for deviation analysis; and events contained the disturbance catalog with type, phase/channel, severity, and waveform capture windows. Although the effective campaign covered approximately eight days, this duration was considered sufficient to capture recurrent operating patterns and severe events within the monitored period, while not intended to represent seasonal or long-term variability.
PQ events were detected using the thresholds configured in the Fluke 1775 recorder: sag 90%, swell 110%, interruption 5%, RVC 5%, and waveform deviation 10%, with hysteresis handled by the instrument. Under these predefined settings, 1929 events were identified, predominantly waveform deviations, interruptions, and rapid voltage changes, which is consistent with a low-voltage environment with high penetration of power electronics-based and nonlinear loads.
The following indicators were used:
per phase (AN, BN, CN) and the contribution of dominant harmonics, where applicable.
per phase (A, B, C) and in the neutral, given that it is a critical point in 3P4W systems with nonlinear single-phase loads.
RMS currents per phase and neutral, especially to evaluate the accumulation of zero-sequence components.
Flicker (Pst/Plt) and imbalance, when available in the trend export.
10 s frequency for dynamic characterization and correlation with events.
Additionally, demand and energy variables were used to contextualize periods of higher load and their possible relationship with distortion episodes and events.
The interpretation of the results was based on two main references: IEC 61000-2-2 [
57], a low-voltage compatibility framework used by the instrument itself in the PQ evaluation report, and IEEE 519 [
56], a reference for discussing harmonic distortion severity.
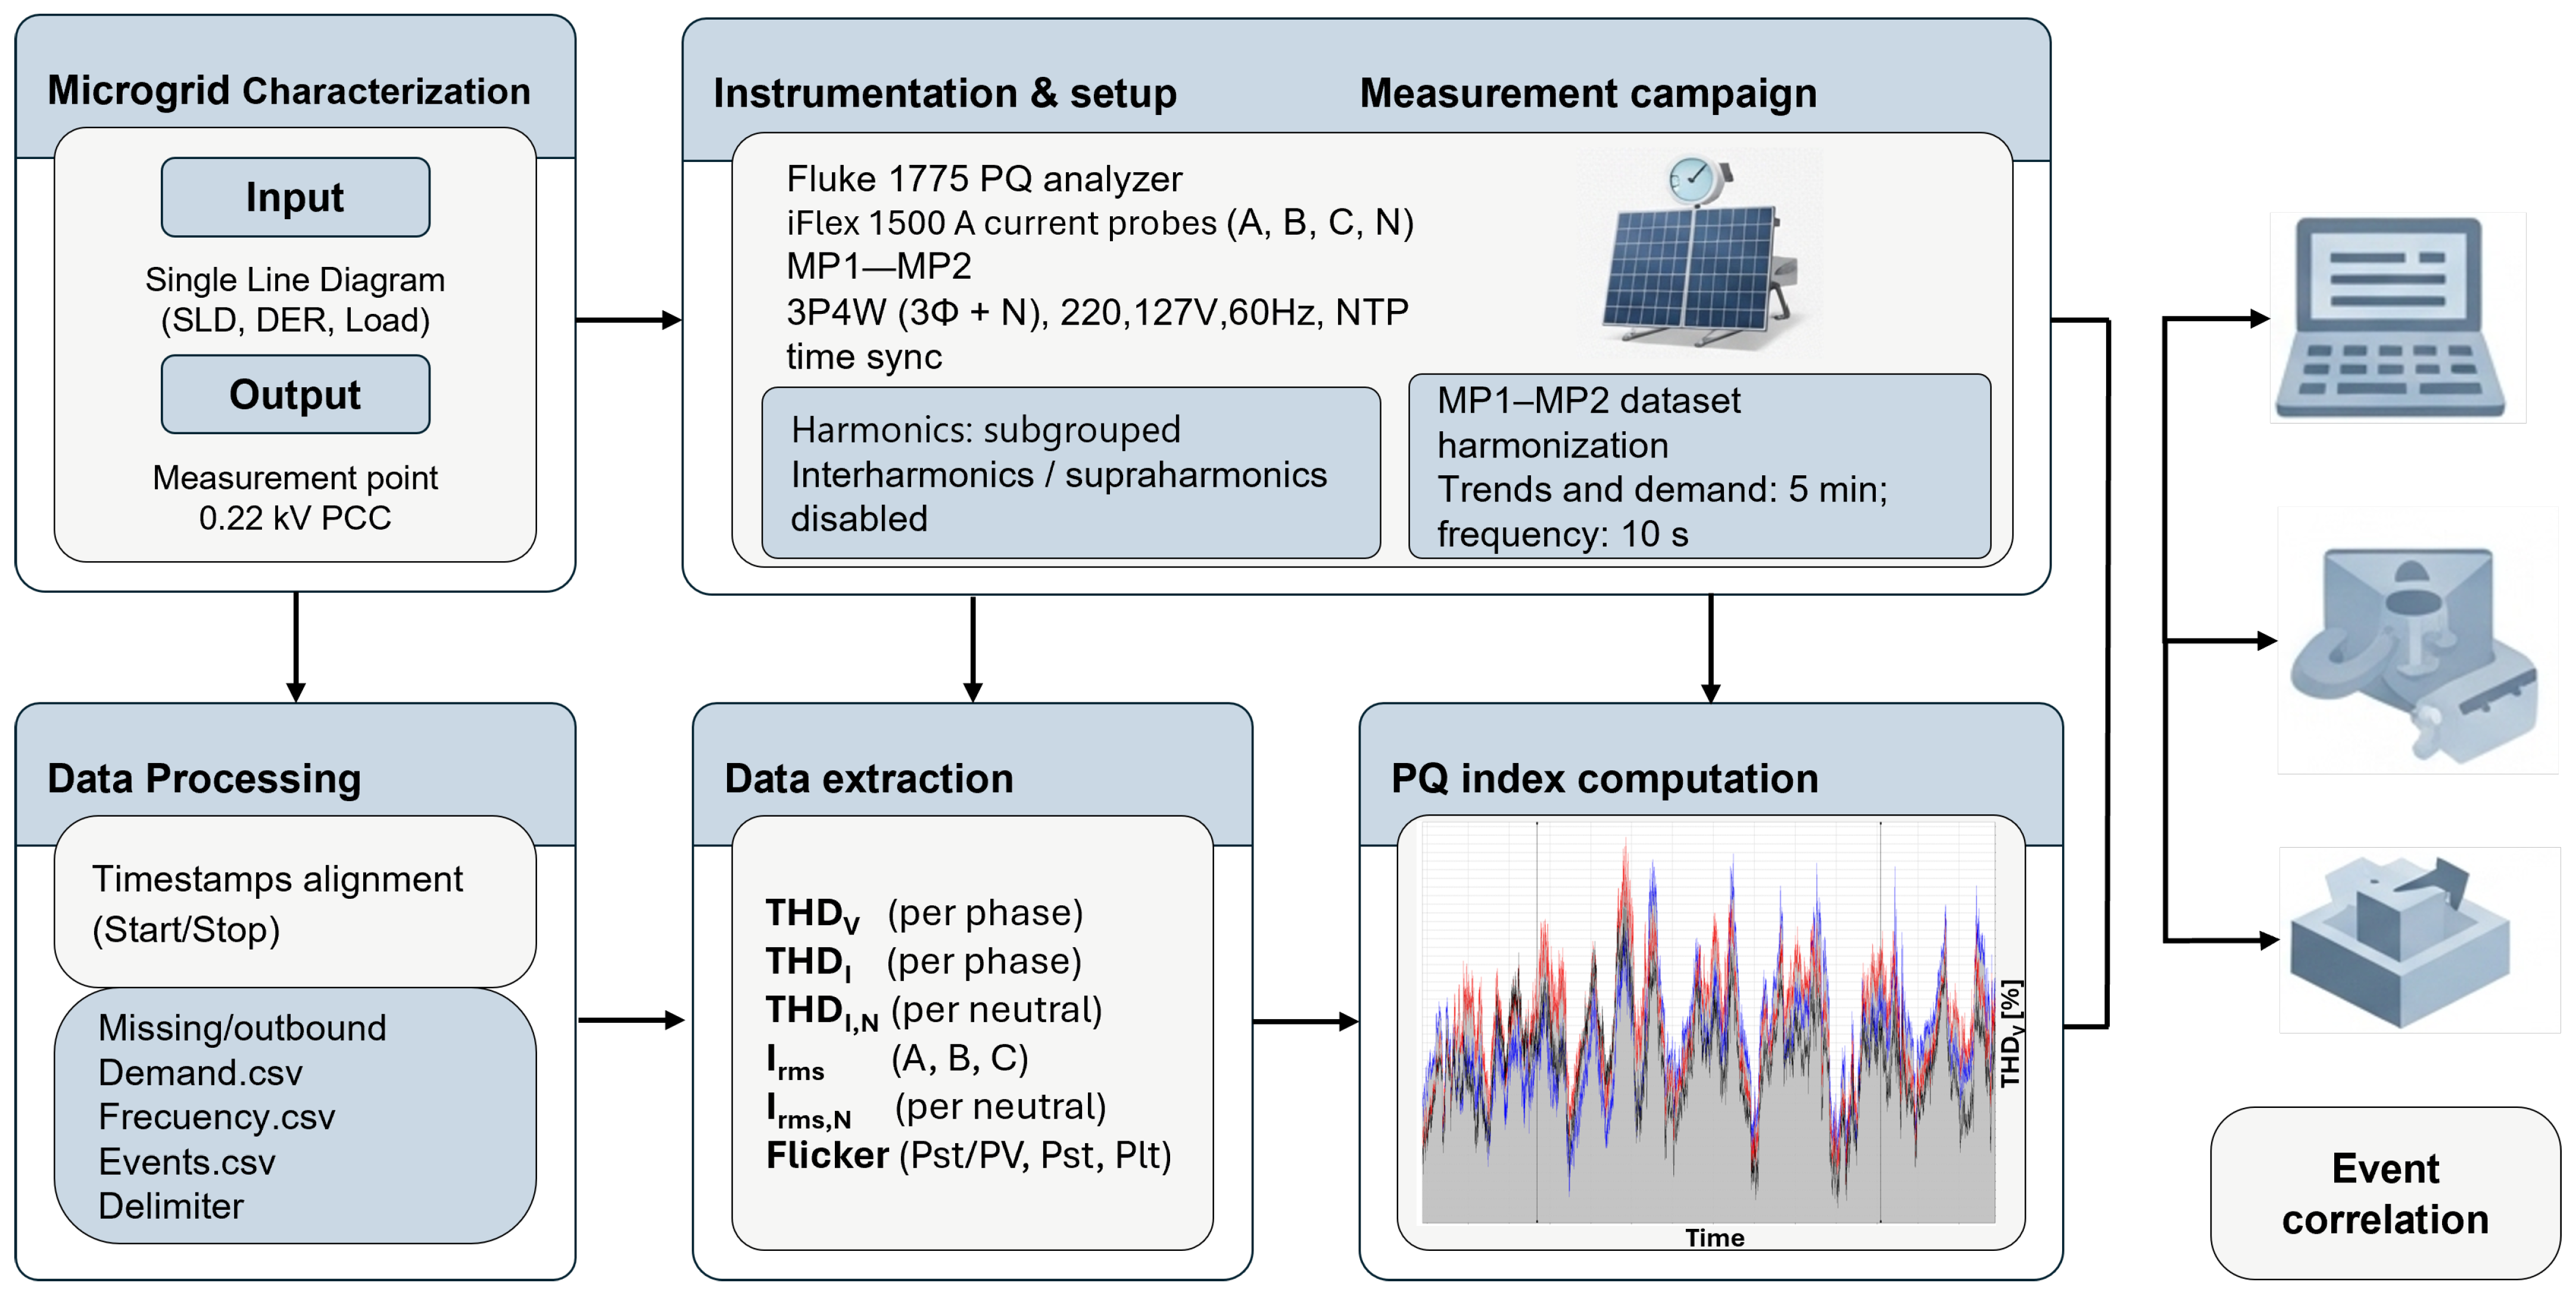
To ensure reproducibility and traceability of the analysis, the methodology was structured as a workflow that covered everything from system characterization to the interpretation of indicators and events. In particular, measurement points were defined based on the single-line diagram and asset inventory; then the power quality analyzer was configured, and a multi-day campaign was run on two busbars (MP1 and MP2). Subsequently, the exported data (trends, demand, frequency, and events) were harmonized temporally, cleaned, and used to calculate the main power quality indices (THDv/THDi, neutral current, and complementary metrics). Finally, the regime conditions and events were cross-referenced to identify critical windows.
Figure 3 summarizes this procedure and the derived products that feed into the
Section 3 and
Section 4.
2.3. Proposed Mitigation Methodology to Reduce Power Quality Issues
Based on the measurement campaign, the PQ problems identified in the
Section 3 were addressed under the verifiable assumption, supported by spectra and metrics, that the dominant phenomenon was associated with nonlinear loads and the accumulation of multiples of 3 harmonics in the neutral of a 3P4W system. Consequently, the mitigation design was primarily aimed at reducing phase-current
and, above all, neutral-current
, while preventing voltage harmonic amplification in sensitive busbars and improving robustness against PQ events. The following design criteria (
) were defined:
(neutral): minimization of and in busbars MP1 and MP2.
(voltage distortion): maintaining in internal busbars below applicable compatibility limits (IEC/IEEE criterion), avoiding resonances.
(events): reduction of the recurrence or severity of switching-related disturbances (RVC/waveshape) through harmonic damping and transient control.
(retrofit): solutions that can be installed without complete redesign (existing panels), with minimal service interruption and scalability.
Given the typical pattern of relatively acceptable voltage distortion but severely distorted current, six possible options of mitigation were proposed, applicable on an incremental basis:
Balancing of single-phase loads between phases in MP1 and MP2 to reduce imbalance and the zero-sequence component.
Neutral and N–PE connection review: verification of continuity, connection points, and tightness and elimination of unauthorized N–PE links in secondary panels as they raise the neutral-to-ground voltage and trip.
Separation of “critical harmonic” loads (UPS/LED/SMPS) into dedicated circuits where possible.
Capacitor banks and series reactors for PF correction without exciting harmonic resonances.
Passive tuned or damped filters for dominant harmonics (typically 5th or 7th, and only if the spectrum warrants it).
Active shunt filter (SAPF–3P4W) installed in shunt on the busbars where the highest is observed.
Among the candidate measures identified through criteria –, the mitigation alternatives selected for detailed assessment were those considered most representative of practical retrofit decision-making in low-voltage 3P4W microgrids with high penetration of nonlinear single-phase loads. In particular, load balancing was selected because it directly targets the unequal phase loading that contributes to the fundamental component of neutral current. Decoupled reactive compensation was included because it improves displacement power factor while reducing the risk of harmonic amplification associated with conventional capacitor-bank compensation. Passive filtering was selected as a technically relevant option when dominant low-order harmonic components were clearly identified in the measured spectrum. Finally, the shunt active power filter (SAPF) was included because it is the most comprehensive retrofit option for compensating harmonic currents, especially triplén components and neutral-current distortion in 3P4W networks.
This set of alternatives was intentionally chosen to cover different physical mitigation mechanisms, different implementation complexity levels, and different retrofit costs, ranging from operational measures such as phase balancing to more specialized power electronics-based compensation. Therefore, the comparative analysis does not only identify the technically strongest solution under the simulated conditions but also provides a decision-oriented framework for facilities where installation constraints, scalability, maintenance requirements, and budget limitations must be considered together with power quality improvement. In this sense, the proposed methodology is not limited to the monitored campus case but is also applicable to other low-voltage institutional, commercial, or campus-type microgrids characterized by concentrated nonlinear loads and overloaded neutral conductors. The location was defined by two rules of thumb: first, mitigate where the current distortion is concentrated (minimizing circulation through the network), and second, mitigate near loads.
MP1: Install the SAPF 3P4W as the main mitigator because it is the internal distribution busbar and usually the best point for reducing the overall harmonic current and the neutral current circulating through the feeders.
MP2: Install local mitigation if the analysis shows that the problem is highly localized (laboratories with power electronics/sensitive equipment). This can be: a secondary SAPF–3P4W (if MP2 has a severity comparable to MP1) or a hybrid filter (passive + small active) if MP2 has specific dominant harmonics.
2.4. Measurement-Based PQ Assessment and Mitigation Method
This section presents the measurement-to-mitigation workflow adopted in this work. First, multi-day PQ measurements at two locations (MP1 and MP2) were used to compute harmonics and neutral-related indices. Next, these indices were translated into mitigation requirements and preliminary sizing for retrofit solutions, prioritizing neutral-current reduction in a 3P4W system.
Let denote the phase index. The main measured variables were: RMS phase-to-neutral voltage , RMS phase current , RMS neutral current , and frequency f. The distortion indices were voltage THD , current THD per phase , and neutral current THD . When harmonic components are available, and denote the RMS magnitude of the h-th current harmonic in each phase and in the neutral.
To size mitigation devices, the harmonic RMS current must be derived from the measured THD and RMS quantities. Equation (
1) formalizes the relation between
, the fundamental current
, and the harmonic RMS component
(up to the maximum harmonic order
H available in the export). When the analyzer exports only
and
, Equation (
2) provides a practical estimate of
directly from those quantities. The same procedure was applied to each phase and the neutral conductor, yielding
and
time series for each measurement point.
Mitigation Selection and Sizing (Neutral-First)
The measured signatures in 3P4W networks are often characterized by moderate but severe , with particularly high distortion in the neutral conductor. Therefore, the mitigation design was driven primarily by the neutral-related quantities ( and ) and secondarily by phase currents and voltage distortion.
The first step was to define a design operating condition that is robust to variability, using campaign statistics rather than a single snapshot. Let
denote the
q-th percentile operator. In this work,
was adopted as the reference design condition in order to represent severe but recurrent operating states while avoiding oversizing due to isolated extremes. The compensation target was defined as a fraction
k of the measured harmonic RMS current at that percentile. In this study,
was adopted for active harmonic compensation, which means that the mitigation sizing aimed to compensate 80% of the harmonic RMS current associated with the selected design condition. Equation (
3) defines the target compensating current for each phase and for the neutral.
The second step was to select the nominal current rating of a 3P4W shunt active power filter (SAPF). Equation (
4) set the SAPF rating as the maximum among the required phase and neutral compensating currents, multiplied by a safety margin
(taken here as 0.20) to account for load growth, parameter uncertainty and thermal limits. In practice, this “neutral-first” sizing ensures that the SAPF is capable of significantly reducing
and
while also suppressing phase-current harmonics.
With the adopted values , , and , the sizing procedure became directly reproducible from the measured campaign statistics reported for MP1 and MP2.
The third step was placement. The primary SAPF was allocated to the measurement point exhibiting the highest neutral harmonic severity according to and . A secondary/local mitigation device at the other measurement point was considered if (i) the local remained elevated, (ii) event severity persisted (e.g., RVC/waveshape), or (iii) the harmonic spectrum was strongly localized by specific laboratory loads.
If the demand data indicated poor PF and reactive compensation was needed, a detuned capacitor bank was selected to avoid harmonic resonance. In this case, the required reactive power for PF correction was obtained using Equation (
5), where
P is the active power at the selected design operating condition,
is the initial power factor, and
is the target value. Once
is determined, the reactor percentage (detuning factor)
was selected to place the series tuning frequency below the first dominant harmonic to be avoided, as expressed by Equation (
6). This step is essential in harmonic-rich environments because it prevents capacitor banks from amplifying harmonic voltages and currents.
To ensure that mitigation targets reflected both steady-state distortion and disturbance-driven conditions, the event log was correlated with trend and PQ windows. A critical-window set W was constructed by combining the top-N windows of , the top-N windows of , and windows containing high-severity events (interruption, dip, RVC, and waveform deviation). This set was used to verify the percentile-based sizing assumptions and define before/after KPIs for later validation.
For reproducibility, the complete measurement-to-mitigation procedure is summarized in Algorithm 1. The algorithm consolidates campaign setup, data export and harmonization, PQ index computation, harmonic-RMS estimation, neutral-first ranking, and mitigation sizing into a single workflow.
Algorithm 1 also formalizes the criteria used to translate measured distortions into retrofit specifications. By using robust statistics (percentiles) and a critical window set that combines high neutral distortion and high-severity events, the procedure avoids decisions based on isolated snapshots and yields mitigation ratings that remain valid under time-varying loading and operating conditions.
| Algorithm 1 Measurement-to-mitigation workflow (grouped steps, list style). |
- Step: 1
Campaign design, setup and acquisition (MP1 & MP2) Identify PCC and define measurement points on the SLD Configure PQ analyzer: 3P4W, NTP sync, subgrouped harmonics Set logging intervals: trends/demand 5 min, PQ 10 min, frequency 10 s Enable event logging (sag/swell/interruption/RVC/waveshape thresholds) Run multi-day campaigns and export datasets - Step: 2
Data export, harmonization and cleaning Export per point: Trends.csv, Demand.csv, Frequency.csv, Events.csv Align timestamps (Start/Stop) across datasets and between MP1 and MP2 Remove invalid rows; handle missing values; unify variable names/units - Step: 3
PQ indices computation and harmonic RMS estimation Compute , , , , and Estimate harmonic RMS currents for : - Step: 4
Severity ranking and critical-window selection Compute robust statistics (e.g., percentiles ) for and Build the critical-window set: Select installation point using a deterministic neutral-first rule: . If two points exhibit comparable values, prioritize the one with the highest ; event severity is used only as a complementary tie-breaker when the two previous indicators are similar. - Step: 5
Mitigation sizing and specification Choose fixed design parameters: percentile , compensation ratio , safety margin Set compensation targets (): (Optional PF correction) If required: - Step: 6
Validation plan (Results/Discussion) Define before/after KPIs: reduction in , , event count/severity (Optional) Validate via harmonic load flow/impedance scan and a short follow up measurement
|
In addition, the installation point was selected through a deterministic neutral-first rule based primarily on
and secondarily on
, thus avoiding arbitrary weighting factors in the ranking stage. The resulting outputs (installation point, SAPF current rating, optional detuned reactive compensation, and verification indicators) were then used, as described in
Section 3 and
Section 4, to support the comparative mitigation assessment.
3. Results
This section presents the results obtained from the measurement campaign with the Fluke 1775 analyzer at the two points mentioned in the previous section.
Table 2 summarizes the volume of data per export.
3.1. Key Indicators, Severity in Neutral, and Events
Statistical percentiles (P50, P95, P99, and maximum) were calculated from valid records to avoid artifacts associated with incomplete or unreliable data periods;
Table 3 presents robust percentiles for a minimum set of representative indicators, including voltage quality (
and
), neutral severity (
and
), operating context (load and frequency), and complementary PQ metrics (Pst flicker and 50th-order components in neutral).
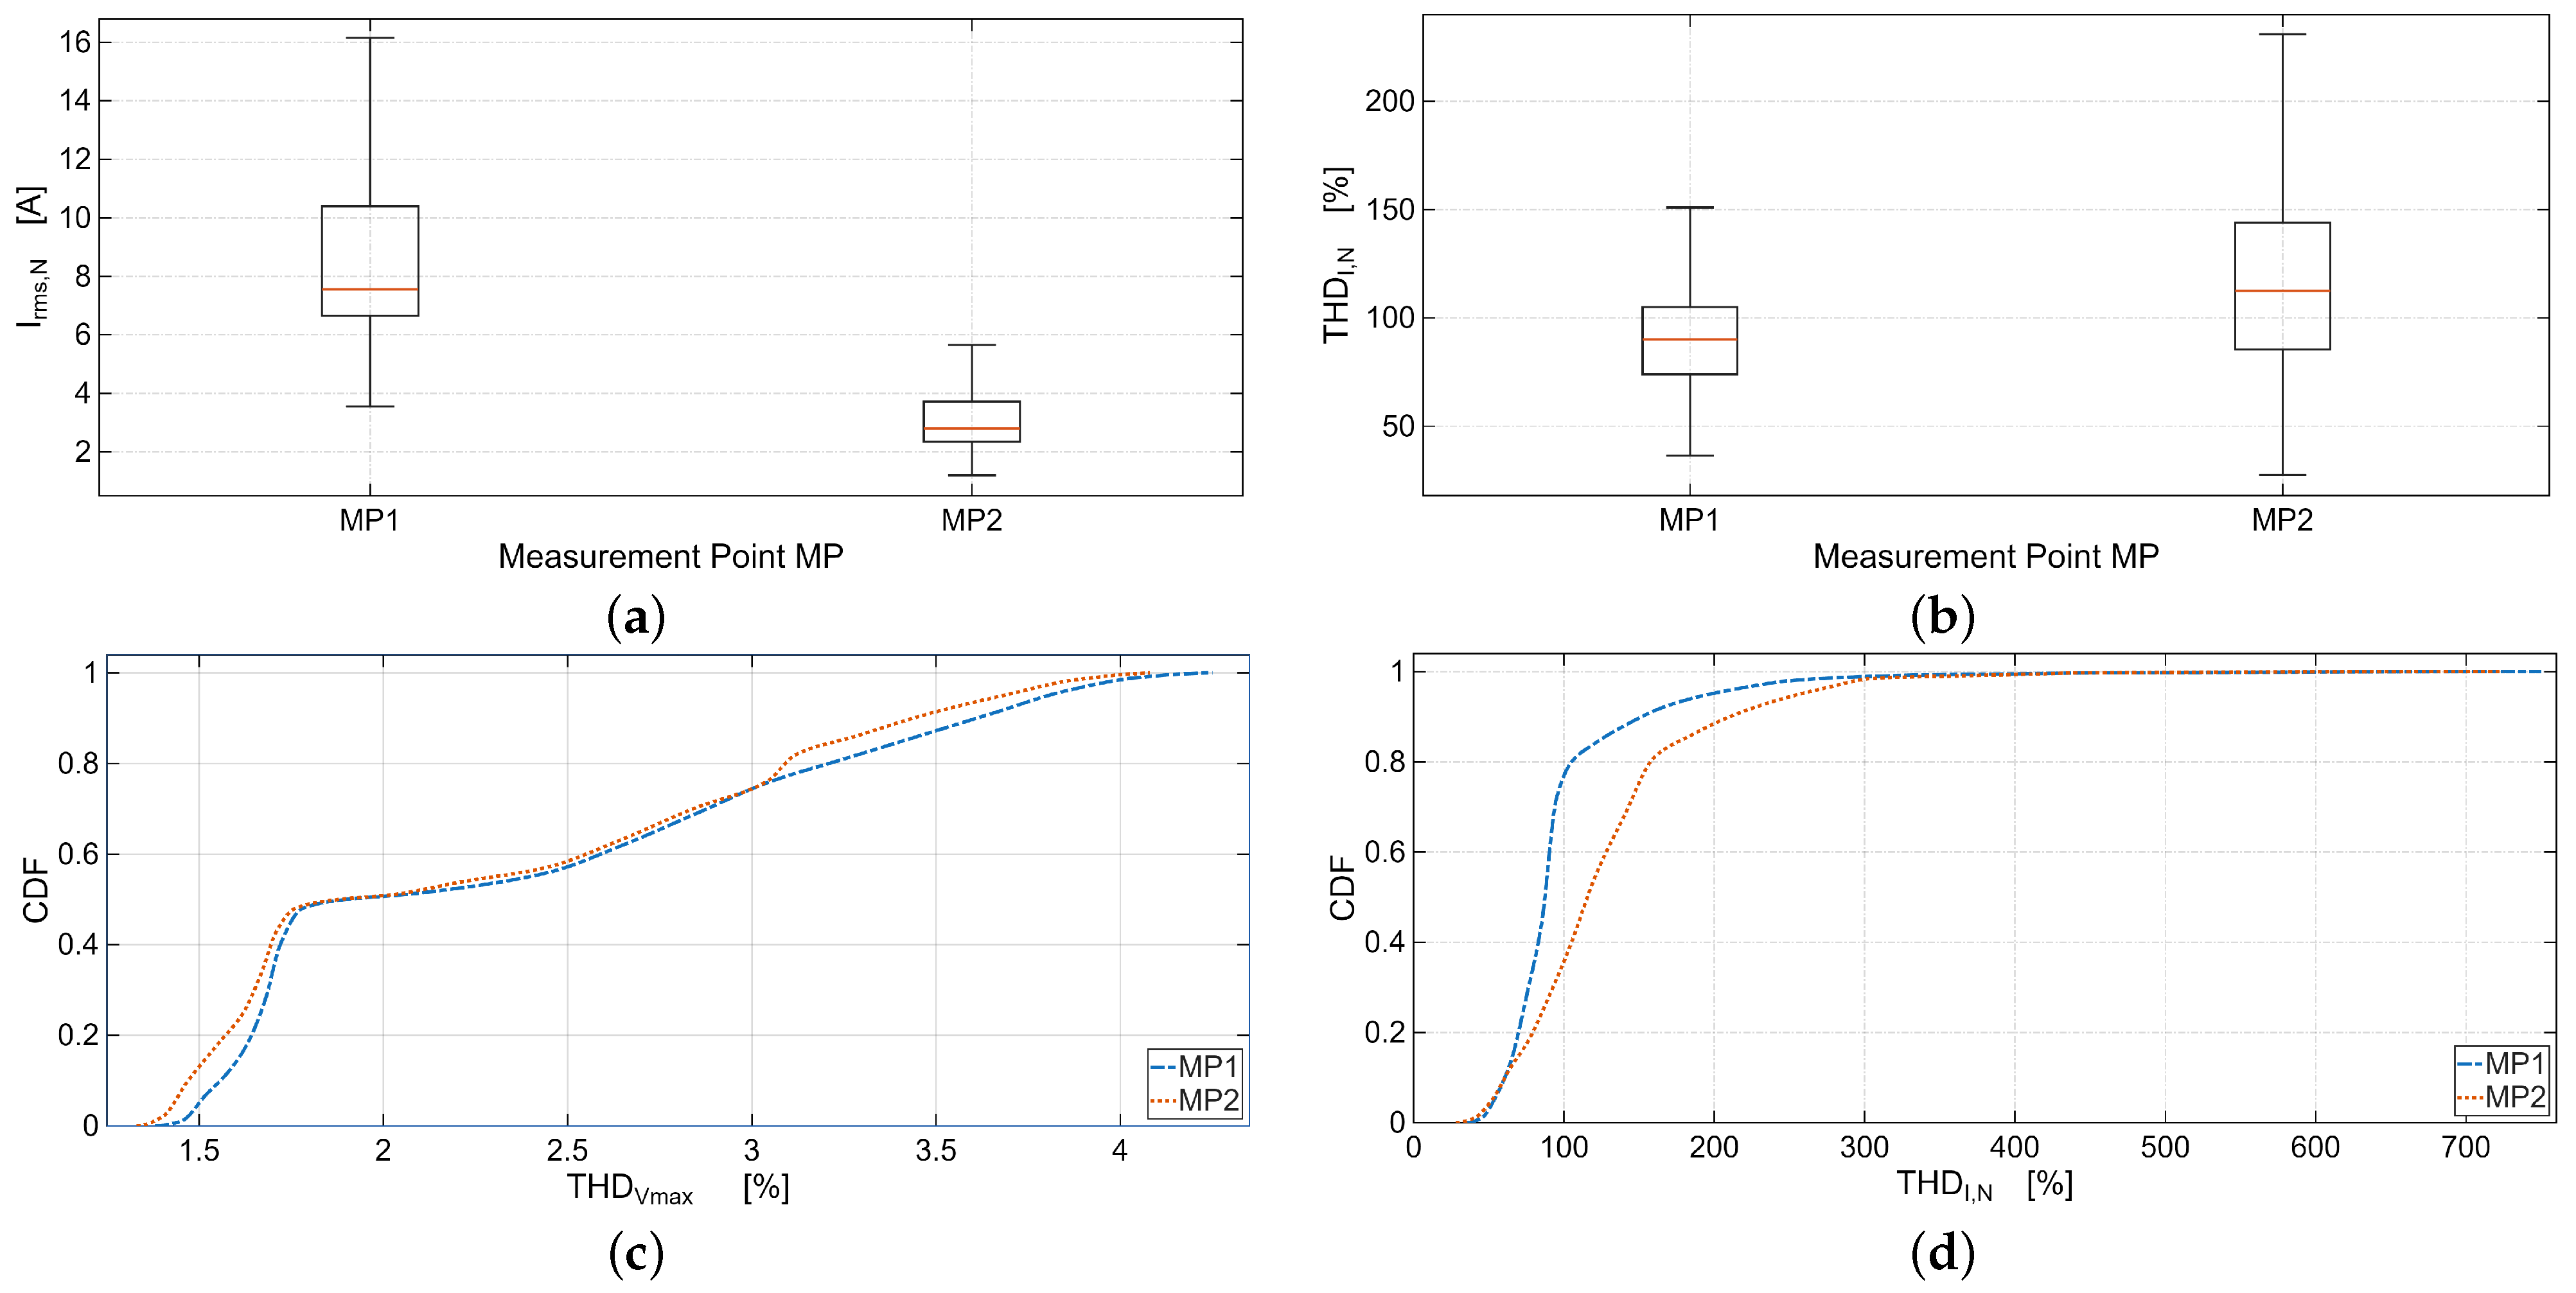
Table 3 and
Figure 4 show a consistent pattern: voltage quality remained stable, while severity was concentrated in the current, particularly in the neutral conductor. First, the
values were close to the nominal value at both points (MP1 P50 = 124.90 V; MP2 P50 = 124.88 V) and voltage distortion was moderate (
P95 ≈ 3.6–3.8% and P99 ≈ 3.9–4.1%). This is visualized in
Figure 4c, where the CDF of
shows very similar curves for MP1 and MP2, indicating comparable voltage distortion behaviors during the campaign. In contrast, the neutral indicators show the dominant phenomenon.
The boxplot of
in
Figure 4a confirms that MP1 had a significantly higher neutral current magnitude than MP2, which is consistent with
Table 3 (MP1 P95 = 16.78 A vs. MP2 P95 = 6.62 A; maximums of 21.13 A and 10.19 A, respectively). For its part, the boxplot of
in
Figure 4b and the CDF of
in
Figure 4d show that the current distortion in the neutral was extreme at both points (P95 > 220% and maximums >700%,
Table 3).
This apparent value above 100% was physically possible because current THD was defined with respect to the fundamental component, not with respect to the total RMS current. In the neutral conductor of a 3P4W system, the fundamental component may be relatively small, while the harmonic RMS component, dominated by triplén harmonics, becomes much larger. Under those conditions, the ratio can exceed 1 p.u. and therefore be reported as values above 100%.
Additionally, the comparison of distributions suggests two nuances: (i) MP2 had a higher “typical” distortion (median 112.36% vs. 89.74% in MP1,
Table 3), which shifted its distribution toward higher values in the low and middle percentiles, and (ii) MP1 had a more extreme tail (P99 = 362.47% and max = 752.35%), which showed episodes of particularly severe distortion. By integrating magnitude and distortion, a practical conclusion was reached: although MP2 had a higher typical
, the operational impact tended to be dominated by the magnitude of
; therefore, the combination of high
+ extreme
makes MP1 the most critical point for a “neutral-first” mitigation approach. This interpretation is also consistent with the load indicator, which was higher at MP1 (
Table 3) and with the neutral-based harmonic indicators
and
, which were also higher at MP1.
3.2. Operating Context and Harmonic Footprint of the Neutral
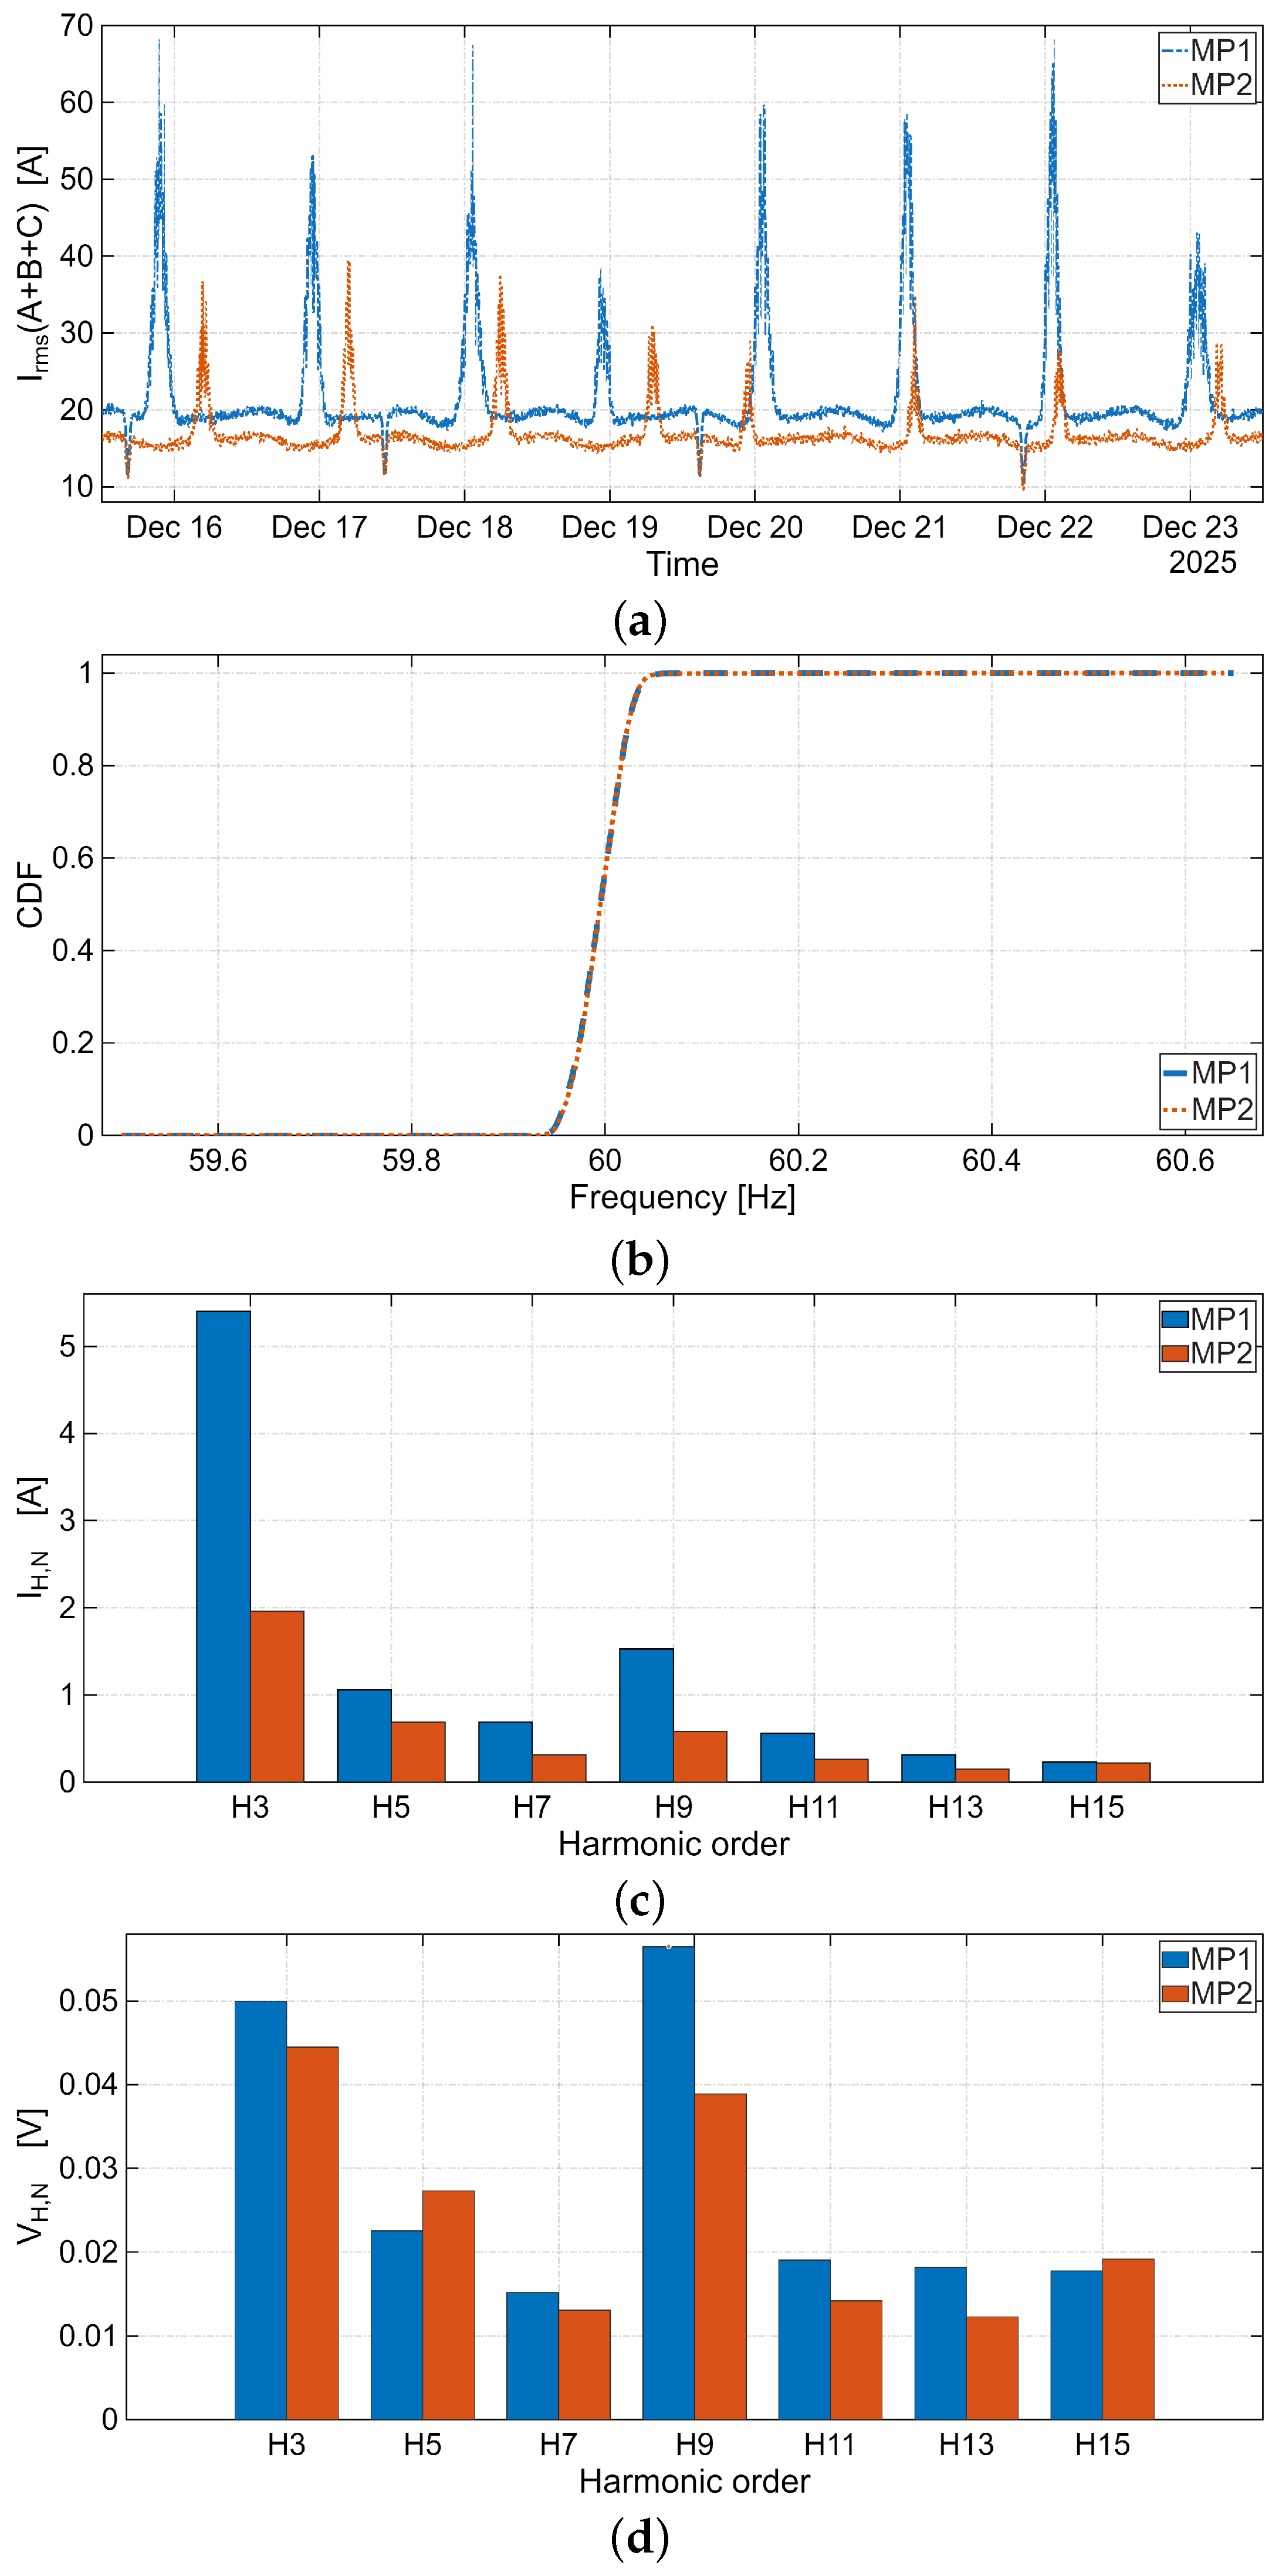
To contextualize harmonic severity based on load level, the total load current was used directly, calculated as the sum of the RMS phase currents recorded at 5 min intervals. Frequency stability was evaluated using frequency records taken every 10 s. In addition, the harmonic footprint of the neutral was obtained from power quality measurements with a 10 min resolution, using the average magnitudes of the selected harmonics (H3, H5, H7, H9, H11, H13, H15).
Figure 5 groups:
Figure 5a the total load current,
Figure 5b the frequency CDF, and
Figure 5c,d the harmonic signature of the neutral in current and voltage. There was a marked dominance of triple harmonics, especially H3, with a higher average magnitude in MP1. This behavior is consistent with the higher values of
reported in
Table 2 and with the scenario of high penetration of nonlinear single-phase loads.
The operating context confirms that although voltage quality remained within acceptable ranges, current distortion in the neutral was the dominant issue and should therefore guide mitigation priorities. In accordance with the severity indicators discussed above and the IEC-/IEEE-oriented interpretation framework adopted in this work, MP1 was prioritized because it combined the highest neutral-current magnitude with the most critical distortion tail. Based on this diagnosis, the main retrofit actions considered were: (i) balancing of single-phase loads, (ii) verification of the N–PE path and elimination of unauthorized links, (iii) segregation of heavily harmonic loads, (iv) detuned capacitor banks for PF correction, (v) passive filters for dominant harmonics when justified by the spectrum, and (vi) installation of a 3P4W SAPF at MP1 with percentile-based sizing.
This approach, in addition to being retrofittable and scalable, establishes before/after verification indicators (reduction of , , and recurrence/severity of RVC/waveform events) consistent with the criteria of the aforementioned standards and with the metrological traceability of the measurement campaign itself, paving the way for the section on standard-based solutions discussed below.
3.3. Results of Mitigation Options
This subsection reports the simulation-based mitigation assessment outcomes obtained from a calibrated microgrid model. A three-phase 3P4W (127 V, 60 Hz) model was built in DIgSILENT PowerFactory 2024 (DIgSILENT GmbH, Gomaringen, Germany), replicating the campus microgrid topology and locating the reporting points at MP1 and MP2. The baseline scenario was calibrated to represent the severity observed in the field using robust percentiles. In particular, for the neutral, the P95 values of and reported in the campaign were taken as a reference (MP1: = 16.78 A and = 223.95%; MP2: = 6.62 A and = 243.31%).
To improve traceability between field measurements and the mitigation assessment, the DIgSILENT PowerFactory model was calibrated using the monitored power quality data collected at MP1 and MP2, which were the two representative buses where the harmonic profile and neutral-current severity were characterized in detail. The baseline case was adjusted to reproduce the pre-mitigation behavior observed in the field, using as calibration targets the 95th-percentile values of neutral RMS current and neutral-current total harmonic distortion , together with the dominant harmonic footprint of the neutral conductor.
The validation was conceived as a baseline consistency check for comparative mitigation analysis rather than as a full dynamic reconstruction of all operating states during the monitored week. In addition to matching the severity indicators reported in
Table 3, the model was tuned to preserve the dominance of triplén harmonics in the neutral current spectrum, especially the third harmonic, which was the most representative component at both monitored points.
Table 4 summarizes the comparison between measured and simulated baseline values at MP1 and MP2.
For each validation indicator, the relative deviation was quantified according to Equation (
7):
The obtained deviations were kept within an acceptable engineering range for harmonic studies, which supports the use of the model as a calibrated baseline for comparing retrofit alternatives. Therefore, the post-mitigation results reported below should be interpreted as simulation-based estimates derived from a field-calibrated model, pending future experimental validation through before–after measurements.
For the harmonic analysis, the nonlinear loads were represented in DIgSILENT PowerFactory by means of an aggregated harmonic current-injection model connected to the buses associated with MP1 and MP2. This representation was calibrated to preserve the measured pre-mitigation distortion pattern observed during the monitoring campaign, using as a reference the field-recorded neutral-current severity and the dominant harmonic footprint identified at both monitoring points.
At the fundamental frequency, the network operating point was adjusted to match the representative loading condition adopted for the mitigation assessment. On that operating point, the nonlinear portion of the load was modeled as harmonic current sources whose amplitudes were scaled to reproduce the measured 95th-percentile values of and . In addition, the injected spectrum was tuned to preserve the dominance of the characteristic low-order components identified in the measurements, particularly the triplén harmonics, with special emphasis on the third harmonic due to its dominant contribution to neutral-current accumulation in the 3P4W system.
The harmonic load flow was solved up to order , including the frequency-dependent behavior of transformer and conductor impedances. In this way, the simulated response preserved both the measured severity level and the physical mechanism responsible for the neutral-current distortion, namely, the summation of zero-sequence harmonic currents from nonlinear single-phase loads. To assess the risk of resonance under reactive compensation, an impedance sweep was additionally performed over the 0–1 kHz range in order to identify impedance peaks and their proximity to dominant harmonics. Therefore, the response of the passive filtering alternative should be interpreted under the modeled equivalent-network conditions, since its effectiveness may vary if the actual system impedance changes with topology or operating state.
To compare strategies under the simulated operating conditions, the following were adopted as the main indicators: (i)
, (ii) decomposition of the neutral current into the fundamental component
and the harmonic component
, and (iii)
. Additionally, the relative reduction in
losses in the neutral, proportional to
, is reported as an estimated thermal stress indicator. The decomposition
was obtained from
and
using the relationship defined in the harmonic quantification model (Equation (
2)).
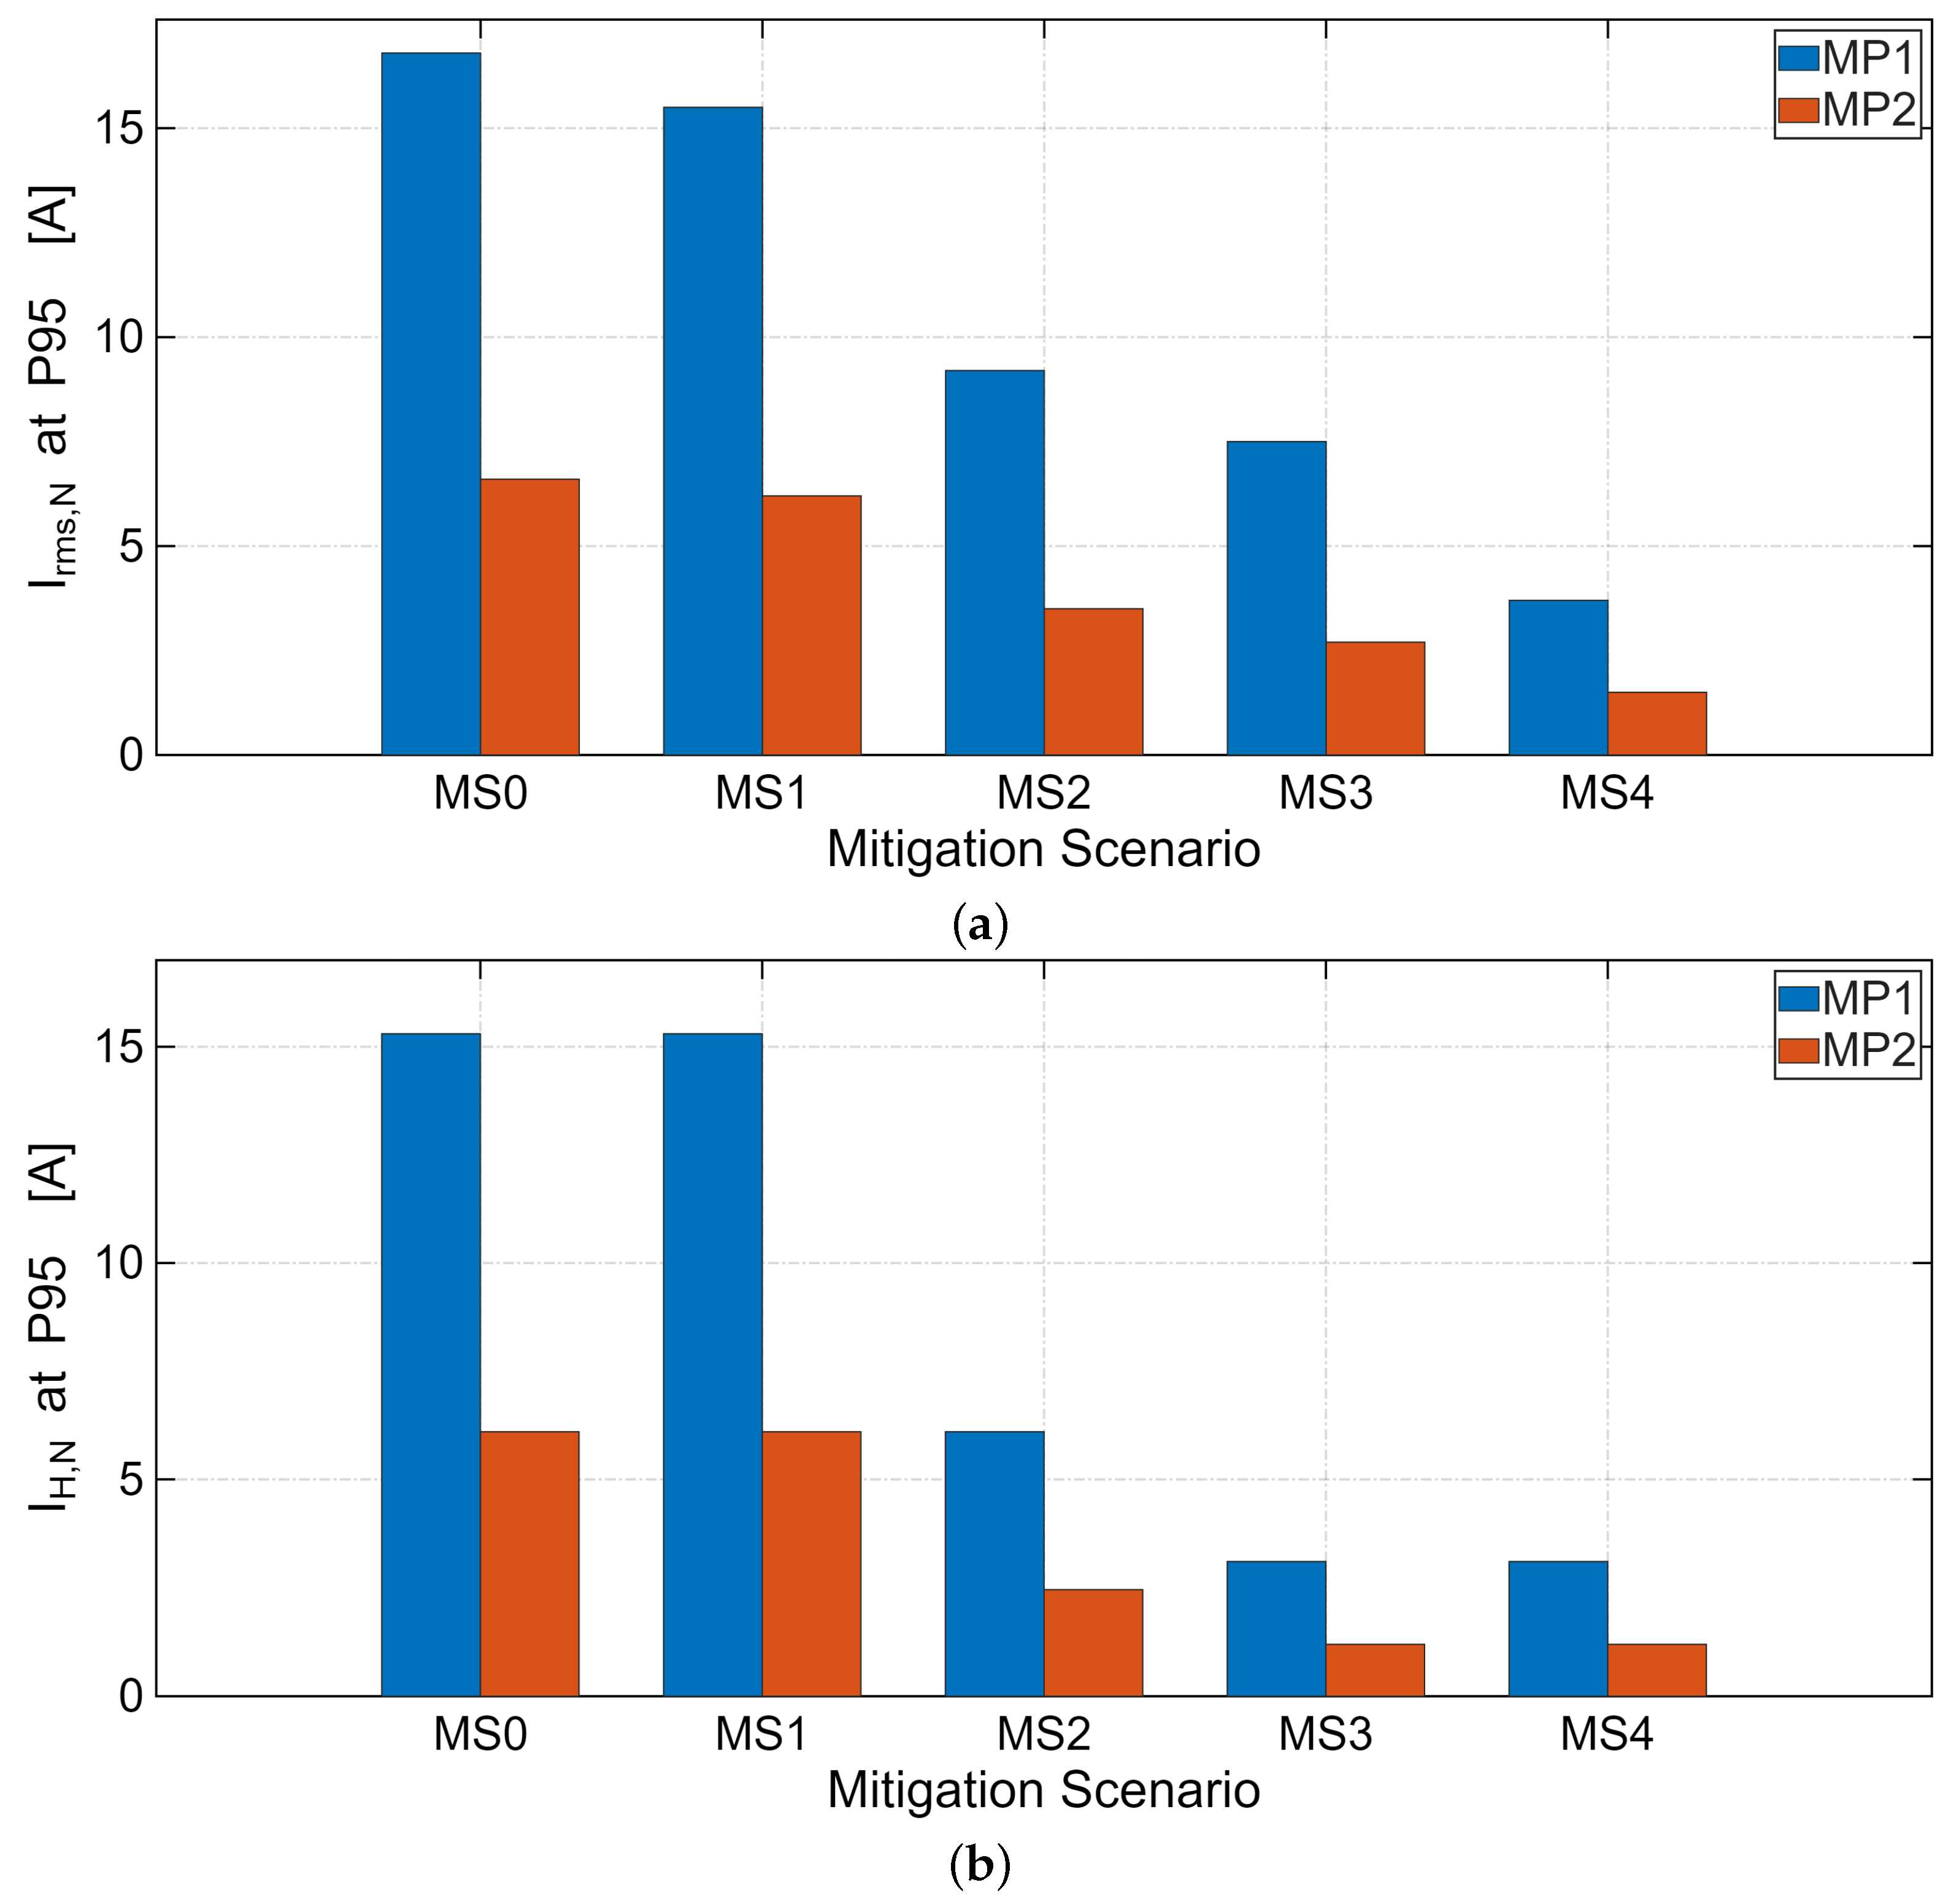
Table 5 quantifies the effect of scenarios M1, M2, M3, and M4 on the neutral indicators in MP1 and MP2, compared to the base case M0. The values reported in
Table 5 correspond to the adopted design condition (
). Accordingly, the reductions obtained for each mitigation scenario should be interpreted as simulation-based estimates derived from the calibrated baseline model. Although the baseline was anchored to field measurements at MP1 and MP2, the post-mitigation performance had not yet been verified through on-site implementation and before–after measurements.
In MS1 (load balancing), the reduction was concentrated in the fundamental component of the neutral, while the harmonic component remained practically unchanged. For this reason, although
decreased (7.9% in MP1 and 6.8% in MP2), the
index increased significantly (
Table 5), as it was defined with respect to
. This result confirms that load balancing is an effective measure for reducing imbalance and fundamental neutral current but does not mitigate the accumulation of triple harmonics. The zero-sequence passive filter (MS2) reduced
by 60% and decreased
by 45–47% at both points (
Table 5). As a result,
fell to values close to 90–97%. The SAPF 3P4W (MS3) showed the greatest reduction in
(80%), which translated into
of 7.50 A at MP1 and 2.80 A at MP2 (reductions of 55.3% and 57.7%, respectively) and
around 45–49%.
The combined scenario (MS4) delivered the lowest
by integrating the reduction in
with the SAPF attenuation of
. In MP1,
decreased from 16.78 A (MS0) to 3.69 A (MS4), and in MP2, it decreased from 6.62 A to 1.44 A, corresponding to an estimated reduction in neutral-path
losses of about 95% (
Table 5).
Figure 6a,b summarize the overall mitigation results at monitoring points MP1 and MP2, comparing the baseline condition with the proposed mitigation scenarios MS1, MS2, MS3, and MS4.
4. Discussion
The main finding is that even when voltage distortion remains at moderate levels, the neutral conductor simultaneously experiences a very high current and extremely high distortion. This combination reveals that the main risks are thermal and operational, rather than related t voltage compatibility, due to increased losses, heating of bars and connections, stress on conductors, and the possible impact on protections and sensitive loads.
The neutral spectrum confirms the physical origin: harmonics predominated, especially H3, with a higher average magnitude in MP1. In a 3P4W system, zero-sequence components tend to add up in the neutral, which explains the observed severity. Therefore, an approach to mitigating and prioritizing MP1 is justified by the combination of magnitude and distortion, as well as by the overall impact on the internal distribution board.
The simulated scenarios showed that not all measures reduced the dominant mechanism. MS1 (load balancing) slightly decreased (≈7–8%), but did not reduce ; consequently, could increase as decreased. This confirms that balancing is useful as a low-cost operational action (it reduces imbalance and fundamental current), but it does not constitute effective harmonic mitigation of the neutral when triplen harmonics dominate.
MS2 (zero-sequence passive filter) reduced by 60% and decreased by 45–47%, demonstrating its effectiveness when the design was oriented toward the dominant harmonic. However, its performance can be sensitive to equivalent impedance and topological or mode-switching changes in the microgrid; therefore, it is critical to accompany the design with impedance sweeps (0–1 kHz) to avoid resonances and amplification of .
MS3 (SAPF 3P4W) offered the most robust performance on the neutral: was reduced by 80%, fell to ≈45–49%, and decreased by ≈55–58% (MP1: 16.78 to 7.50 A; MP2: 6.62 to 2.80 A). The active solution meets the criteria of being located near the internal busbar (MP1) and of compensating for zero-sequence harmonics without relying on resonant conditions.
MS4 (combined) had the lowest (MP1: 3.69 A; MP2: 1.44 A) and the greatest reduction in the thermal indicator, proportional to the losses ( 95%). The result highlights a methodological recommendation: to evaluate performance and compliance, it is advisable to report and (in addition to ) in parallel, since may remain high when is significantly reduced.
From a practical perspective, the comparison among balancing, decoupled compensation, passive filtering, and SAPF also reflects the type of staged decision process commonly faced by facility managers and microgrid operators: first, low-cost operational corrections; second, conventional electrical compensation with resonance awareness; and, finally, dedicated harmonic mitigation when neutral-current distortion remains critical.
From a regulatory perspective, the results support two levels of verification. First, voltage compatibility in LV networks can be checked against compatibility guidelines, such as IEC 61000-2-2 [
57] and recommended measurement procedures. In this study,
remained within moderate ranges, but this does not imply the absence of risk: the neutral point concentrates the severity. Second, the performance of current emissions can be discussed in planning frameworks such as IEEE 519 [
56], which proposes current distortion limits at the PCC based on the
ratio and voltage distortion limits. Although this work did not explicitly determine
or define the external PCC, the finding of extreme
and triplen-harmonic dominance (zero-sequence) indicates that to ensure upstream compatibility and internal reliability, mitigation should prioritize the reduction of
and
in the main bus (MP1), complementing the verification of
.
The main limitations of this study should be interpreted in light of its diagnostic and retrofit-oriented scope. First, the measurement campaign was conducted at two representative buses (MP1 and MP2), which was sufficient for comparing neutral-current severity and defining a prioritized mitigation point, but not for performing a full feeder-by-feeder or device-by-device attribution of harmonic sources across the entire campus network. Therefore, the results identify dominant distortion patterns at strategically selected locations rather than a complete emission map of all connected nonlinear equipment.
Second, the effective monitoring window covered approximately eight days. This duration was appropriate for capturing recurrent operational behavior and severe events during the observed period, especially when robust indicators such as percentiles were used; however, it did not capture seasonal changes, academic cycle effects, or other long-term operating regimes that may modify the distortion profile over time.
Third, the monitored microgrid represented only a portion of a larger campus electrical system, in which the common coupling point was shared with other areas. For this reason, the conclusions should be interpreted as applicable to the studied low-voltage subsystem and, more broadly, to campus-type 3P4W microgrids with similar load composition, rather than as a complete characterization of the full campus-wide harmonic interaction.
From a metrological and normative perspective, the recorder operated with subgrouped harmonics, so this study was restricted to the traditional harmonic range and did not address supraharmonic emissions in the 2–150 kHz band. Likewise, IEEE 519 [
56] was used as a technical reference to interpret harmonic severity and guide mitigation priorities, but not as a basis for a full PCC compliance determination, since the ratio
was not available. Future work should therefore extend the analysis to the supraharmonic range, include feeder-level or device-level source identification, and incorporate a broader network characterization for more complete harmonic compliance assessment.
Future work should prioritize three extensions: (i) before/after verification under the same export scheme to validate the projected mitigation benefits in statistical terms; (ii) expanded network characterization, including supraharmonics, feeder-level source identification, and impedance sweeps under both grid-connected and islanded operation; and (iii) thermal instrumentation to directly correlate neutral-current severity with conductor and connection temperature.
5. Conclusions
The measurement campaign showed that although voltage distortion remained at moderate levels (95th percentile around 3.64–3.78%), the neutral conductor concentrated the most severe power-quality problem. Neutral-current THD reached 223.95–243.31% at the 95th percentile and maximum values above 700%, together with high neutral-current magnitudes (16.78 A at MP1 and 6.62 A at MP2). These results confirm that in this campus-type 3P4W microgrid, evaluating voltage distortion alone would underestimate the primary operational risk, namely, neutral-current accumulation and its thermal and functional consequences.
Among the evaluated mitigation alternatives, the SAPF-based solutions were the most effective. Active mitigation (MS3) reduced the harmonic neutral-current component by 80% at both monitoring points, while the combined strategy (MS4) reduced the 95th-percentile neutral RMS current from 16.78 A to 3.69 A at MP1 and from 6.62 A to 1.44 A at MP2, with an estimated reduction of approximately 95% in neutral-path losses. From a sustainability and resilience perspective, these reductions indicate lower projected thermal stress, improved operational reliability, and more efficient use of the existing electrical infrastructure under retrofit conditions.
A significant limitation of this work is that the mitigation stage was evaluated using a calibrated simulation model rather than through field implementation. Even though the baseline model was anchored to measured neutral-current severity and harmonic profile data at MP1 and MP2, the reported post-mitigation improvements remain predictive. Future work should therefore include on-site implementation and before–after measurements to experimentally verify the estimated reductions in , , and related thermal stress in the neutral conductor.
In addition, the present findings should be interpreted within the measurement scope of this study: two representative monitoring points, an approximately eight-day campaign, and harmonic assessment restricted to the traditional range covered by subgrouped measurements. Therefore, the proposed diagnosis and mitigation framework is best understood as a technically grounded approach for prioritizing retrofit actions in campus-type low-voltage 3P4W systems, rather than as a full source-resolved or campus-wide harmonic compliance evaluation.




 ,
,