Article

Sustainable Urban Renewal: Non-Linear Coupling Mechanism Between Green View Index and Thermal Comfort in High-Density Streets of Shenyang, China


1
Forestry College, Shenyang Agricultural University, Shenyang 110866, China
2
Key Laboratory of Northern Landscape Plants and Regional Landscape, Shenyang 110866, China
*
Author to whom correspondence should be addressed.
Sustainability 2026, 18(7), 3187; https://doi.org/10.3390/su18073187
Submission received: 23 February 2026 / Revised: 20 March 2026 / Accepted: 21 March 2026 / Published: 24 March 2026

Abstract

As urbanization intensifies, improving street thermal comfort has become a critical issue in urban renewal. While existing studies generally assume that increasing the Green View Index (GVI) linearly improves pedestrian thermal comfort, this study identifies a significant “Decoupling Effect” in high-density commercial areas through field measurements and numerical simulations of three typical street types (commercial–service, ecological–recreational, and historical–cultural) in Shenyang. Integrating DeepLab V3 semantic segmentation with ENVI-met version 5.1.1 microclimate simulation, the results demonstrate a robust monotonic negative correlation between GVI and Physiological Equivalent Temperature (PET) in ecological streets (Spearman’s ρ = −0.692, p < 0.001), confirming the consistent cooling benefit of greenery in nature-dominated environments. However, a distinct “Threshold Effect” was identified in commercial streets using Piecewise Linear Regression (PLR). A critical breakpoint was detected at GVI = 22.08%. Below this threshold, visual greenery effectively contributes to cooling (slope = −0.454); yet, once GVI exceeds 22.08%, the cooling efficacy diminishes significantly (slope = −0.109), marking the onset of a “decoupling” phase. Specifically, despite Wenhua Road achieving a GVI of ~24.5% with a complex “three-board, four-belt” structure, its PET peak reaches 46.15 °C, approximately 5.5 °C higher than ecological streets. Mechanism analysis reveals that under peak thermal stress (Traffic Heat ≈ 75 W/m2), the high-intensity anthropogenic heat and hardscape radiation exceed the evaporative cooling threshold of vegetation. This study reveals the non-linear relationship between visual greenery and the physical thermal environment, suggesting that simply pursuing visual green quantity is ineffective in commercial canyon renewal; instead, a threshold-based synergistic optimization of canopy shading and pavement thermal performance is required. These findings provide a quantitative basis for sustainable street landscape planning and urban climate adaptation strategies in high-density cities.

1. Introduction

With the acceleration of global urbanization, the Urban Heat Island (UHI) effect, first recorded by Howard [1] and defined by Manley [2], has become a critical issue constraining the quality of human settlements in high-density urban areas [3], compelling planners to seek effective passive cooling strategies [4]. Among these strategies, urban greening is widely recognized for its dual benefits of microclimate regulation and esthetic enhancement. Traditionally, researchers and planners have relied on macro-scale indicators, such as green coverage rate or canopy cover, to evaluate the cooling potential of urban vegetation. However, these two-dimensional metrics primarily reflect the vertical distribution of greenery and often fail to capture the true spatial perception or the specific thermal experience of pedestrians at the eye level. To bridge this gap between physical greening and human perception, the concept of the “Green View Index” (GVI) has been introduced and widely applied because it can quantify the proportion of green plants within the pedestrian’s field of view [5,6]. Subsequently, Mihara et al. [7] research further established a positive correlation between GVI and psychological comfort, pointing out that visual experience is optimal when GVI exceeds 25%. In recent years, the development of computer vision technology has greatly promoted the quantitative research of this indicator. Based on the studies mentioned above, a widespread linear hypothesis has formed within the academic community: increasing GVI can not only improve the visual landscape but also synchronously enhance pedestrian thermal comfort. While this study focuses on Shenyang, the identified “Decoupling Effect” provides a transferable framework for optimizing pedestrian thermal environments in other high-latitude, high-density cities globally.
In recent years, the academic community has begun to deeply explore the refined coupling relationship between visual greenery and the physical thermal environment. Existing research indicates that green spaces with high GVI effectively lower ambient temperatures primarily through shading and evapotranspiration, thereby improving outdoor thermal comfort [8]. For example, research in the tropical city of San Luis emphasized the critical role of this mechanism in creating livable environments [9]. Empirical studies have found that in various urban functional zones such as parks and open spaces, an increase in GVI can significantly reduce Physiological Equivalent Temperature (PET), effectively alleviating pedestrian thermal stress [10,11]. Furthermore, Meng et al. [12] pointed out that in residential street environments, visual greenery has a significant positive regulatory effect on psychological thermal comfort. By assessing the relationship between urban green space and human perception, these studies confirmed a significant association between visual comfort and landscape indicators (such as GVI), as well as a clear psychological compensation effect. Such findings have reinforced the traditional understanding that “a high Green View Index implies high comfort.”
Compared to these previous studies in relatively open spaces, the cooling efficacy of GVI in high-density, complex street canyons remains to be further explored. In high-density urban areas, street canyon microclimates are influenced by a complex interplay of factors, including building geometry, street Aspect Ratio (AR), and Anthropogenic Heat (AH) emissions [13,14]. Ali-Toudert & Mayer [15] pointed out through numerical simulation that the impact of street canyon geometry on outdoor thermal comfort often exceeds that of mere green coverage. More importantly, the latest research has begun to focus on “threshold effects” in extreme built environments. For instance, extreme heat events and rapid urbanization make anthropogenic heat from air conditioning operation a significant heat source [16]; particularly in high-density areas (high H/W ratio), heat may be more difficult to dissipate, and the cooling effect of vegetation may not be as significant as in open spaces [17]. Simultaneously, empirical studies by Cohen et al. [18] and Perini & Magliocco [19] also found that in high-density built-up areas, relying solely on the cooling effect of vegetation is often limited and difficult to offset the negative impacts brought by building radiation and anthropogenic heat sources. Past empirical experience suggests that in certain commercial streets, even if a high GVI is achieved, pedestrians seem to still face severe thermal stress in summer. Recent debates highlight that while GVI effectively captures the horizontal visual greenery, it often fails to account for the three-dimensional biomass and shading efficiency crucial for thermal regulation. This study positions itself within this debate by exploring the “decoupling effect”—where high visual greenery does not necessarily translate to thermal relief—thereby challenging the oversimplified assumption of a linear GVI–PET relationship [20]. This triggers a scientific hypothesis: In high-intensity commercial street canyons, are “visual greening” and “physical cooling” not always synergistic, but instead potentially subject to some “mismatch” or “decoupling effect” [14,16,21]? Where does the microclimate threshold behind this lie? This is the key question this study attempts to answer.
Therefore, this study aims to integrate street view semantic segmentation technology with ENVI-met version 5.1.1 microclimate simulation [22,23,24,25], utilizing the potential of street view images to quantify thermal environment morphological parameters at high spatial resolution [26]. By comparing commercial service, historical–cultural, and ecological recreational streets [27], this study deeply explores the underlying mechanisms by which high GVI fails to effectively improve thermal comfort (PET) in commercial street canyons [20]. As a city in a severe cold region, Shenyang faces increasingly prominent thermal comfort issues during transitional seasons and summer [21,28,29]; investigating the non-linear characteristics and non-synergistic mechanisms of the relationship between GVI and PET in its high-density commercial street canyons holds significant practical significance. This study attempts to answer: In high-density commercial street canyons, does the commonly perceived law of “high GVI improves thermal comfort” still hold true? If it fails, what are the microclimate mechanisms behind it (such as anthropogenic heat emissions and radiation trapping effects)? The results of this study will provide a scientific basis for the refined renewal and thermal environmental resilience enhancement of high-density urban commercial districts.

2. Materials and Methods

2.1. Study Area Characteristics and Simulation Setup

This study focuses on the central urban area of Shenyang (41°48′ N, 123°25′ E), a typical city in China’s severe cold region. Although the region is characterized by long, cold winters, its summers exhibit significant high-temperature and high-humidity features (with a July average temperature of 24.6 °C and extreme highs reaching 38.3 °C). Moreover, the area is severely impacted by the Urban Heat Island effect, rendering street thermal environment issues increasingly prominent. To investigate the coupling mechanism between visual greenery and thermal comfort within different urban functional zones, this study employs a “controlled experiment” design. Six representative street segments were selected based on their street functional attributes and greening forms (Table 1).
To quantify greenery perception from a pedestrian perspective, this study constructed a deep learning-based street view semantic segmentation workflow. For data acquisition, the Baidu Map Open Platform API V2.0 was utilized to establish observation points along the centerlines of the target streets at 50 m intervals [30]. At each point, Street View Images (SVI) were collected simulating a pedestrian eye level of 1.5 m across four directions (0°, 90°, 180°, and 270°). All images were standardized to a resolution of 1000 × 750 pixels, yielding a total dataset of 336 valid samples.
Semantic segmentation was executed using the DeepLab V3 deep convolutional neural network model pre-trained on the Cityscapes dataset [30,31,32]. This model demonstrates the capability to precisely identify and extract the “Vegetation” pixel class, effectively distinguishing natural greenery from artificial green facilities. Based on the segmentation results, the Green View Index (GVI) was calculated via the pixel ratio method, with the final indicator for each observation point derived from the average of the four directional views. The calculation formula is defined as follows:
G V I = 1 4 i = 1 4 P v e g i P t o t a l i × 100 %
where Pveg represents the number of vegetation pixels and Ptotal denotes the total number of valid pixels in the image.

2.2. Microclimate Monitoring and ENVI-Met Simulation

To ensure the representative nature of the spatial data, a 50 m sampling interval was selected to balance spatial granularity with computational efficiency. This distance aligns with the average building frontage in high-density districts of Shenyang and ensures that captured street view images maintain sufficient overlap to represent continuous pedestrian visual experiences without redundant data processing [33,34]. To acquire high spatiotemporal resolution thermal environment data, this study adopted a methodology combining field measurement verification with numerical simulation inversion. Field measurements were conducted on typical summer meteorological days (31 July and 2–3 August 2024) characterized by clear, cloudless skies. Kestrel 4500 pocket weather trackers (Nielsen-Kellerman Company, Boothwyn, PA, USA) and TES 1333R solar power meters (TES Electrical Electronic Corp., Taipei, China) were deployed to continuously monitor air temperature (Ta), relative humidity (RH), wind speed (Va), and solar radiation at a height of 1.5 m above ground level, with data recorded at 1 h intervals (09:00–18:00). Subsequently, the collected empirical data were utilized to validate the ENVI-met model. The results demonstrated that the Root Mean Square Error (RMSE) for air temperature ranged from 0.27 °C to 0.68 °C, while the Mean Absolute Percentage Error (MAPE) remained below 2.02%, indicating high predictive reliability that satisfies the precision requirements for microclimate research [29].
Three-dimensional microclimate models for each street were constructed using ENVI-met version 5.1.1. The horizontal and vertical grid resolutions were uniformly set to 2 m × 2 m × 2 m to precisely capture the subtle heat exchange processes within tree canopies and building facades. Parameter settings are shown in Table 2. The simulation duration was established at 13 h (07:00–20:00), with the first 2 h designated as the model spin-up period to eliminate initial condition errors, focusing the analysis on the 09:00–18:00 timeframe. Specifically for the commercial–service street (Wenhua Rd), an additional anthropogenic heat parameter (Traffic Heat Emission) was incorporated to account for its characteristics as a major urban artery with high traffic volume. To strictly quantify the anthropogenic heat intensity, the traffic heat emission (Qv) for the commercial–service street (Wenhua Rd) was calculated based on the inventory approach proposed by [35,36]:
Q v = ( N · L · E f ) / A
where N represents the traffic volume, measured at approximately 2800 vehicles/hour during the afternoon peak (14:00–15:00) through field counting; L refers to road length, which is the distance traveled by vehicles within the calculation area; Ef denotes the average total heat emission per vehicle (including combustion and mechanical friction), set at 320 J/m for mixed traffic in stop-and-go conditions; and A is the street canyon area. The calculated peak heat flux is approximately 74.6 W/m2. Therefore, to simulate the maximum thermal stress scenario, the anthropogenic heat parameter in ENVI-met was set to 75 W/m2.

2.3. Thermal Comfort Assessment and Data Coupling

Physiological Equivalent Temperature (PET) was selected as the core index for thermal comfort evaluation in this study. By comprehensively integrating meteorological parameters (Ta, RH, Va, Tmrt) with human thermoregulatory mechanisms (metabolic rate and clothing insulation), PET accurately reflects thermal stress levels in complex outdoor environments. PET values for each observation point were calculated using the Bio-met module within ENVI-met, based on standard “summer male” parameters (height: 1.75 m, weight: 75 kg, metabolic rate: 80 W, clothing insulation: 0.5 clo).
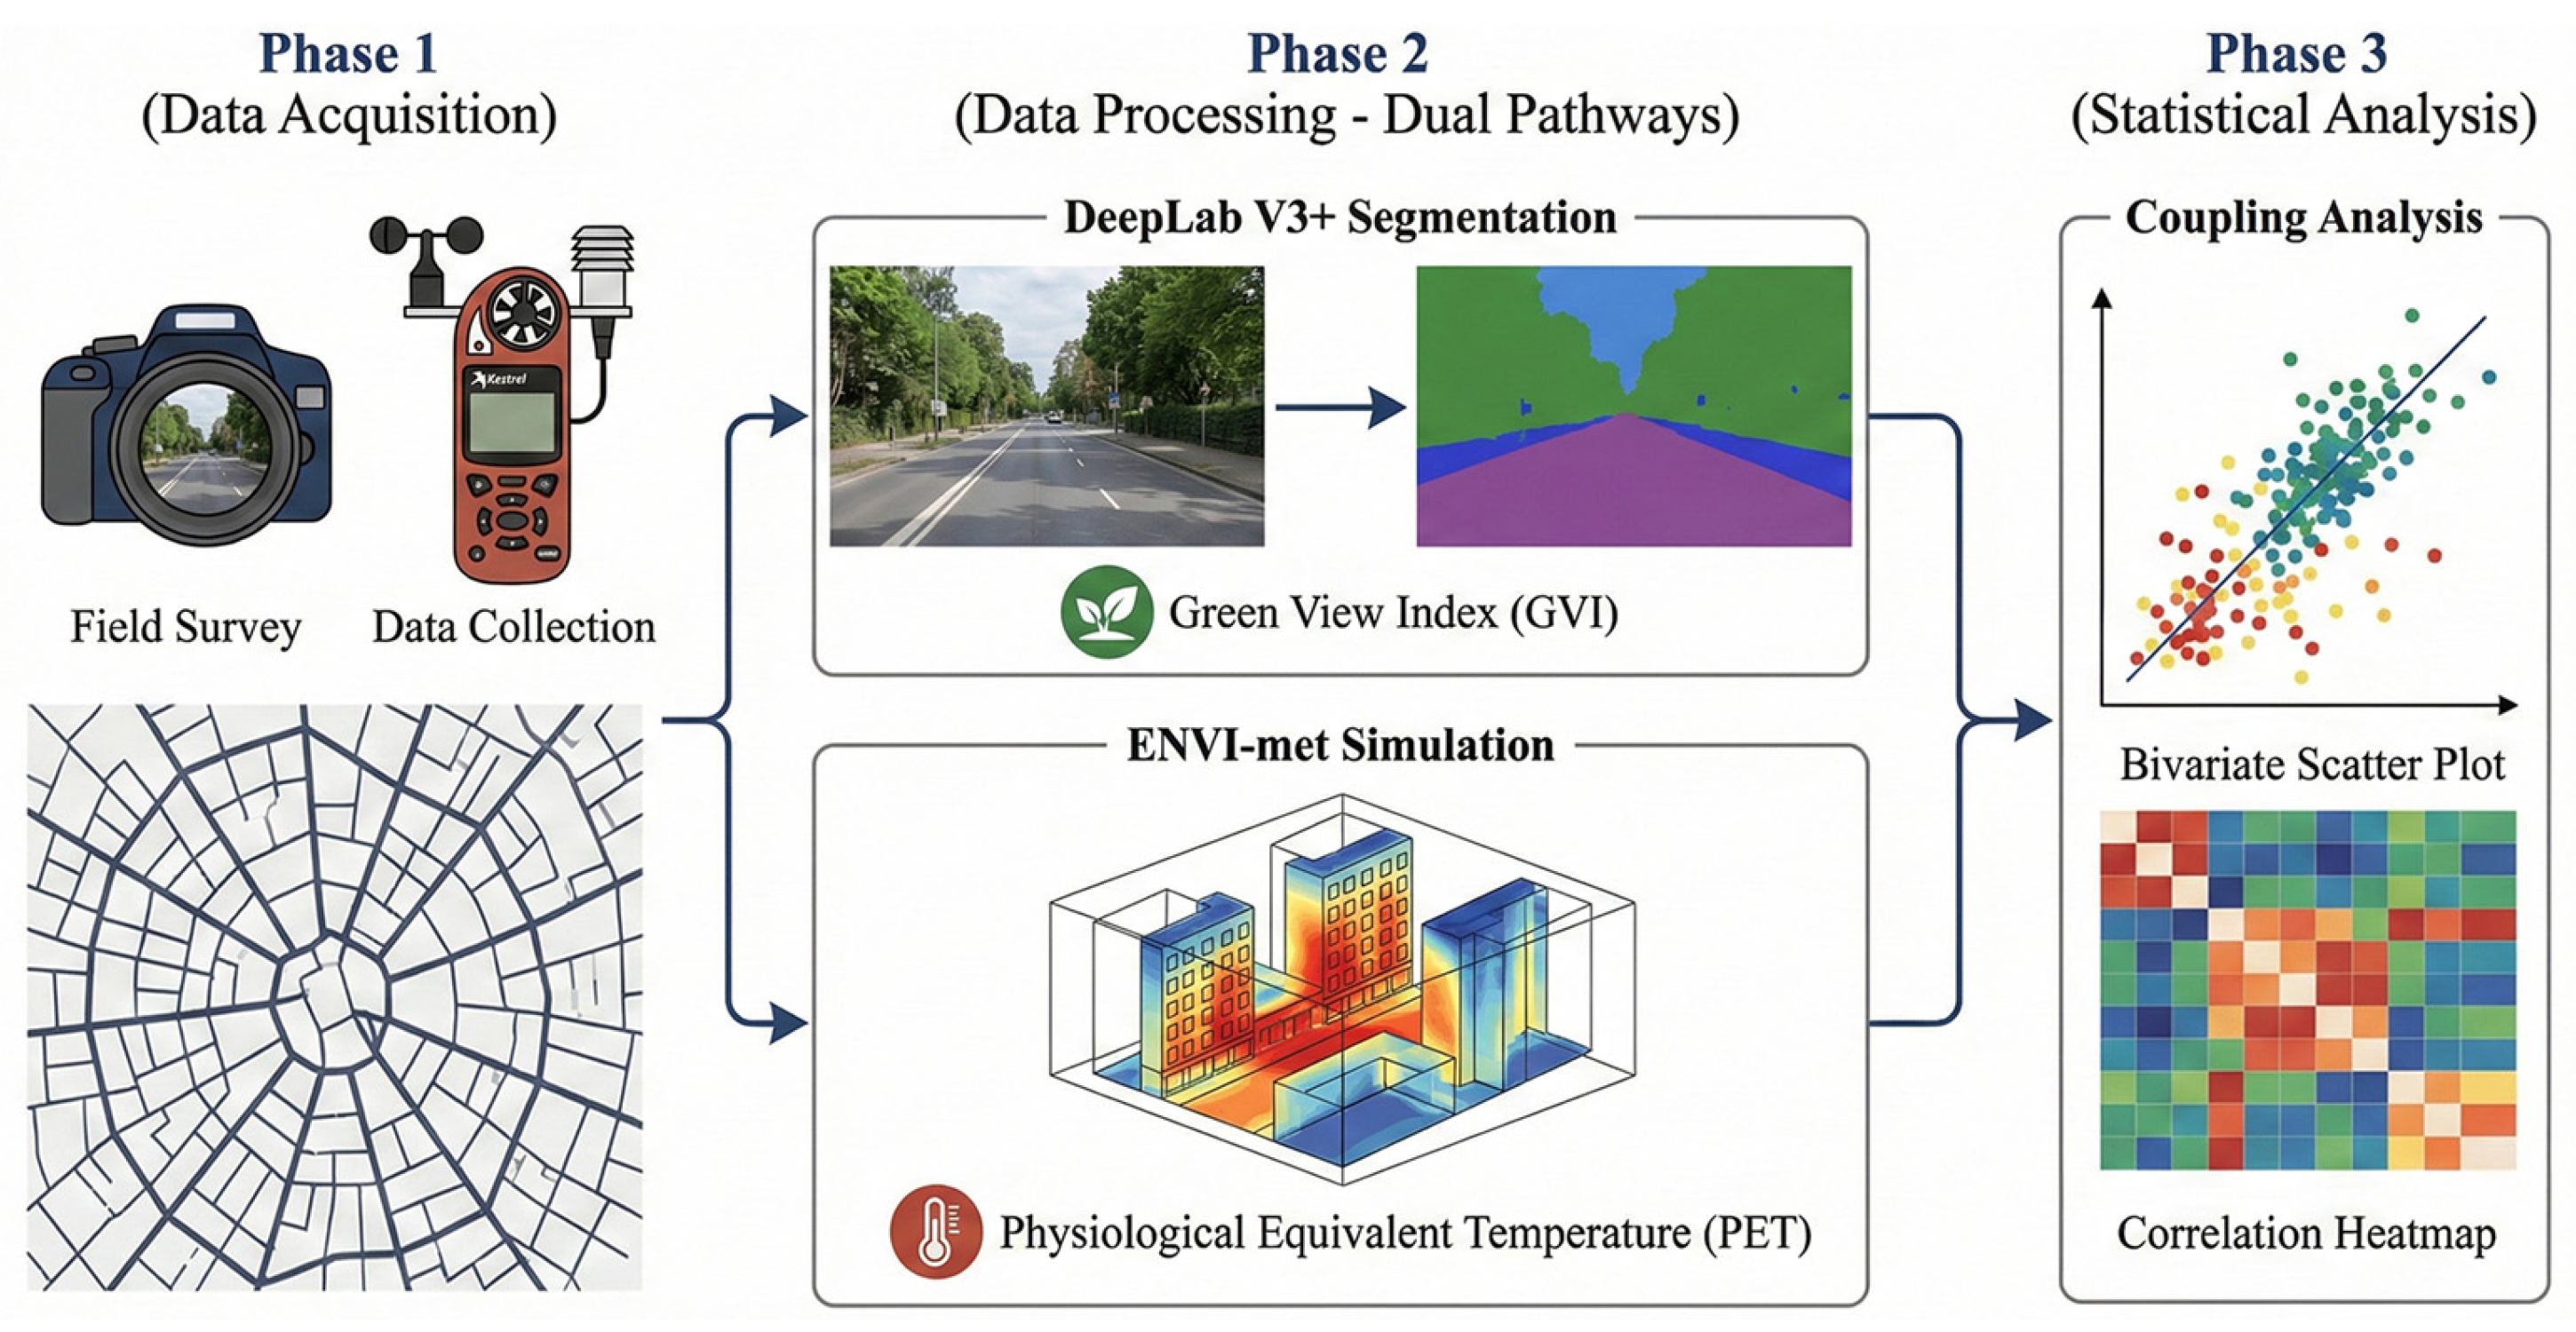
To verify the “visual–thermal mismatch” hypothesis, a rigorous spatial matching mechanism was established. Street view image acquisition points (the source of GVI data) were spatially aligned with ENVI-met simulation output grids (the source of PET data) within a GIS platform to ensure coordinate precision. Subsequently, statistical analyses were performed to quantify the variations in the regulatory efficacy of visual greenery. To verify the non-linear coupling relationship and identify potential threshold effects, this study employed Curve Estimation and Piecewise Regression models in addition to traditional correlation analysis. First, Spearman’s rank correlation coefficient was calculated to assess the monotonic relationship between GVI and PET, as it is more sensitive to non-linear dependencies than Pearson’s coefficient. Second, to quantify the ‘Decoupling Effect’ in commercial canyons, we performed Piecewise Linear Regression (PLR). This method allows for the identification of a specific breakpoint (threshold) in the GVI–PET relationship. The model identifies the critical GVI value where the cooling efficacy (slope) significantly changes, statistically verifying the saturation or failure of green cooling benefits under high thermal loads. The experimental process is shown in Figure 1.

2.4. Microclimate Model Validation

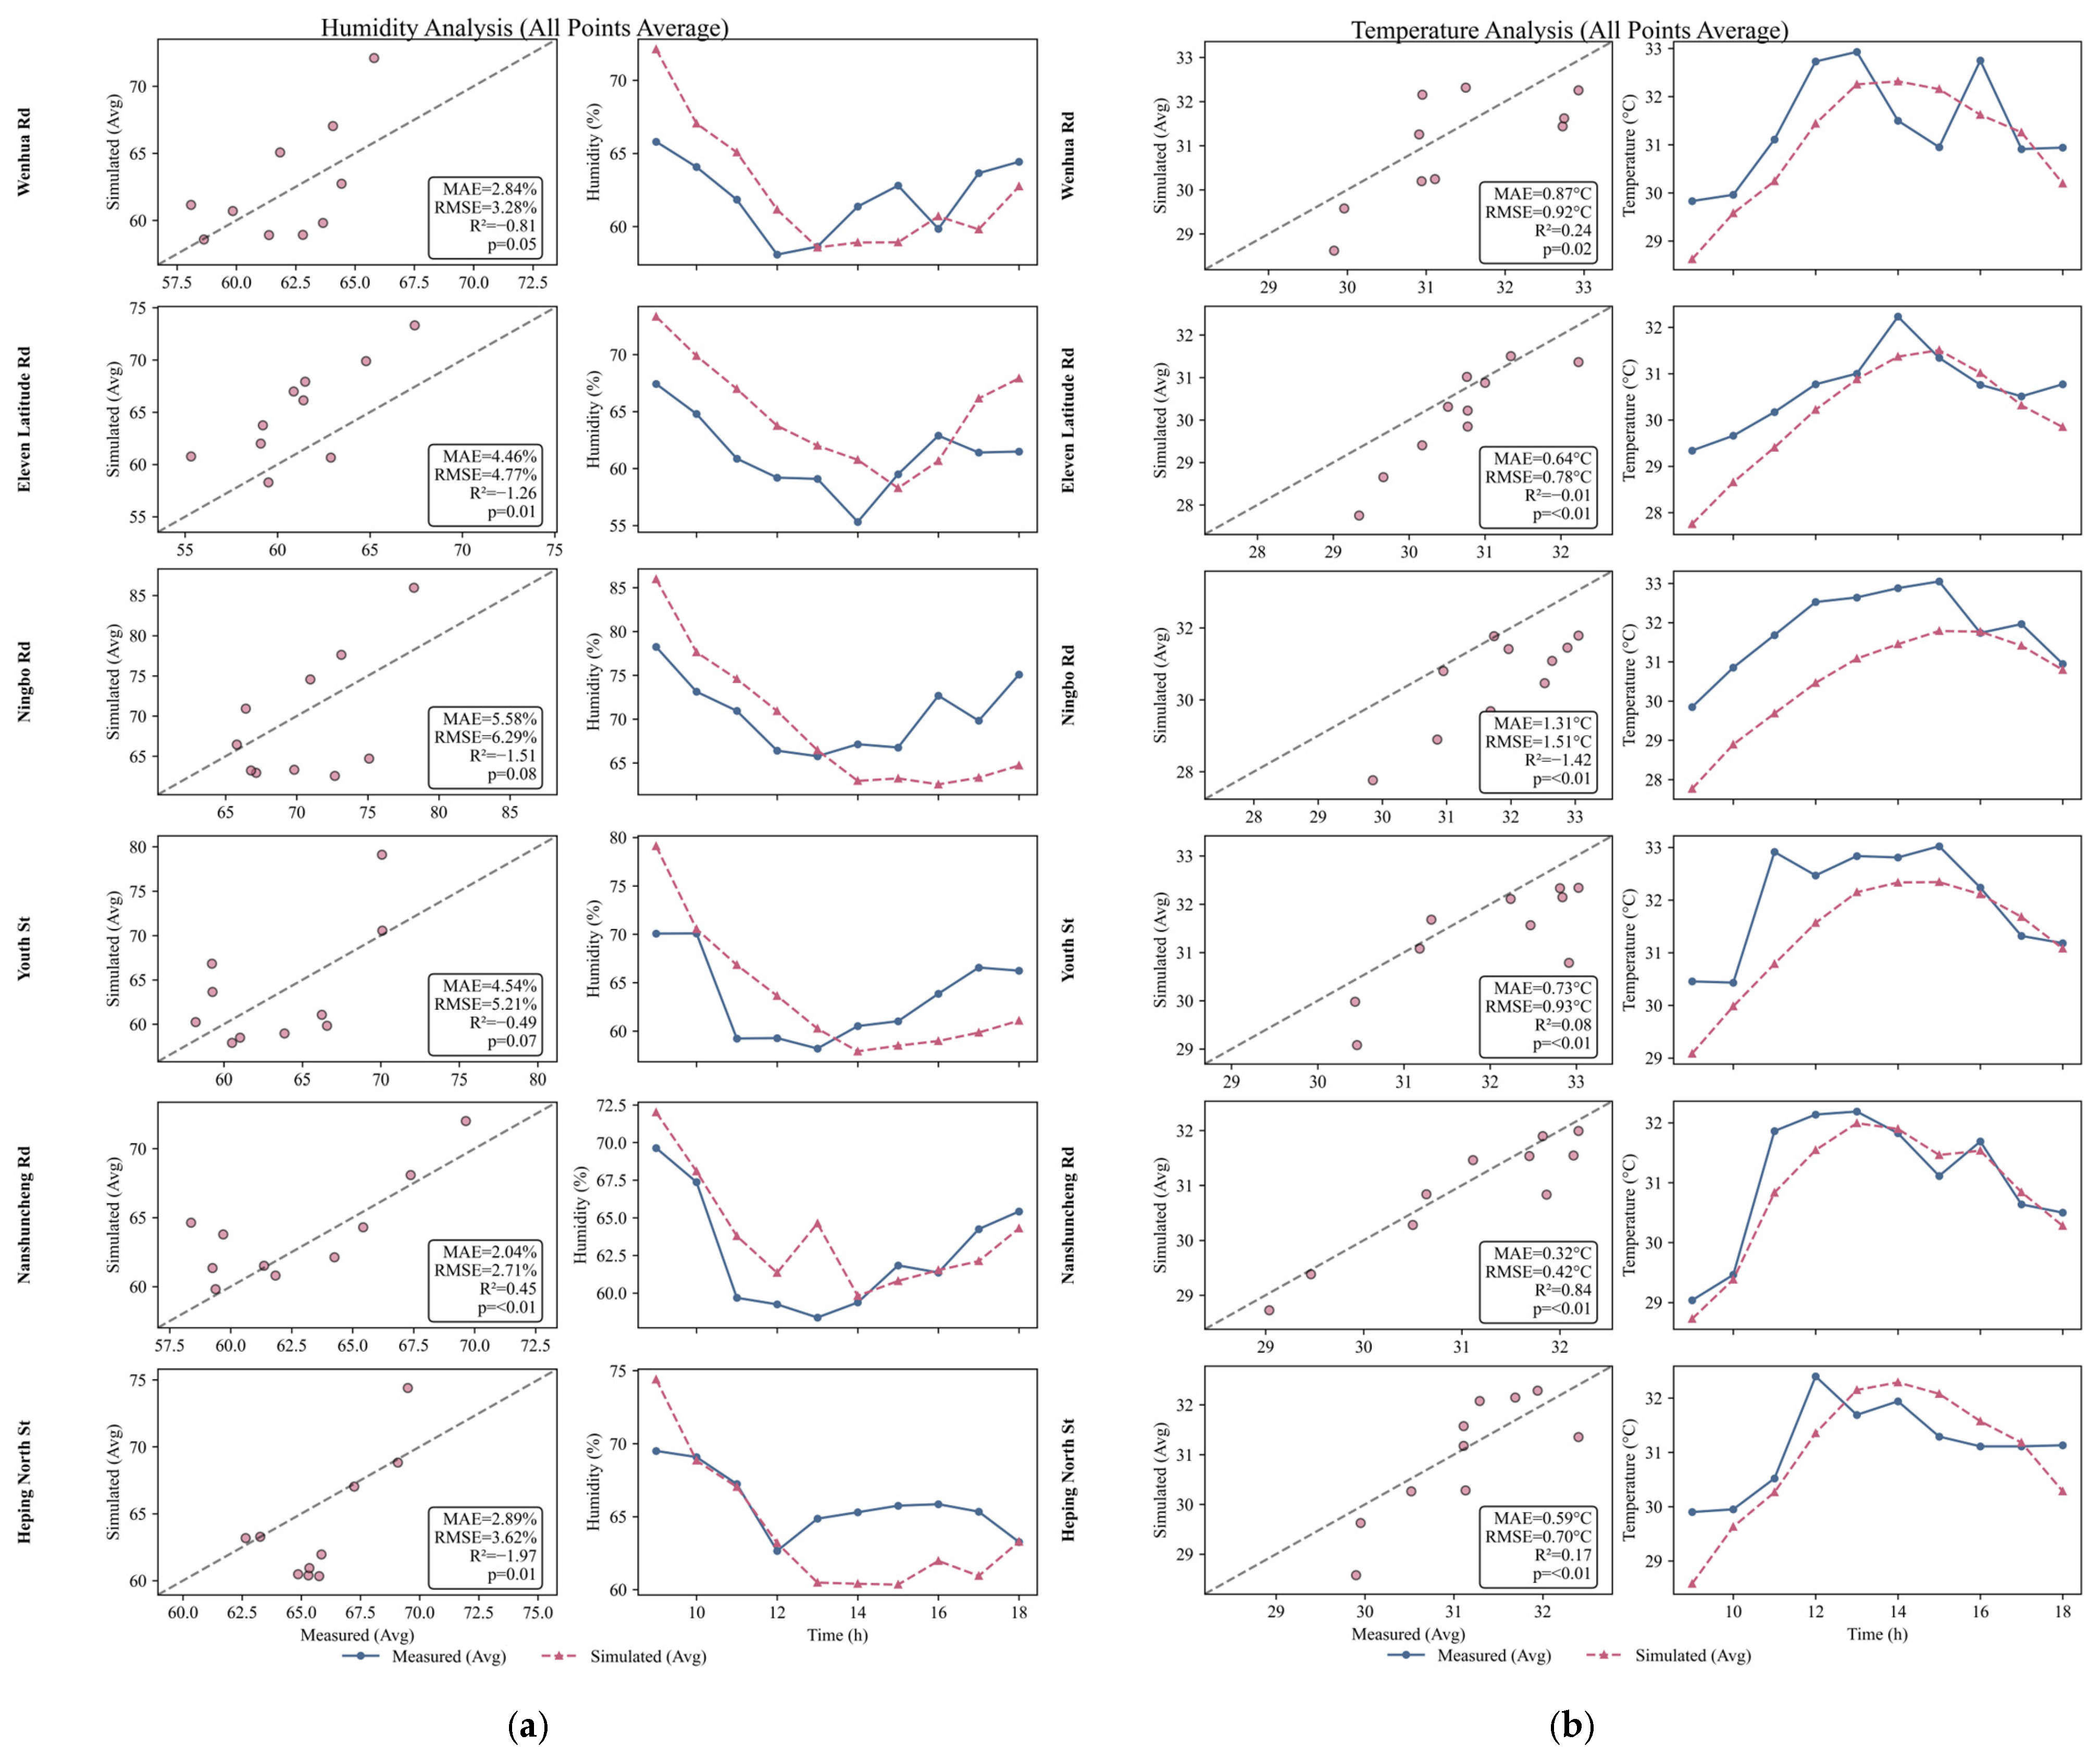
To ensure the reliability of the ENVI-met model settings, a rigorous validation was conducted by comparing the simulated meteorological data with synchronous field measurements from the six typical streets. The validation covered four key parameters: air temperature (Ta), relative humidity (RH), wind velocity (V), and solar radiation (G). The fit between simulated (Ysim) and measured (Xmeas) values was evaluated using the Coefficient of Determination (R2) and Root Mean Square Error (RMSE).
As shown in Figure 2, the simulation results for thermodynamic parameters demonstrated satisfactory accuracy. The simulated Ta and RH curves closely matched the diurnal variation trends of the field data across the measurement points. Specifically, the overall RMSE for air temperature was controlled within the range of 0.42 °C to 1.51 °C. Similarly, relative humidity showed a consistent trend with RMSE values ranging from 2.71% to 6.29%, indicating that the model effectively captures the moisture dynamics of the urban canyon.
While the simulation of dynamic aerodynamic parameters presented slight deviations due to the complexity of instantaneous turbulence in high-density canyons, the deviations were within acceptable limits. The RMSE for wind velocity was maintained between 0.12 m/s and 0.39 m/s, confirming that the model can reasonably reproduce the ventilation patterns. The general trends for solar radiation also remained consistent with the measured data, despite minor discrepancies attributed to the simplified cloud cover assumptions in the static input file compared to the variable sky conditions during the measurement day. Overall, the quantitative validation metrics confirm that the ENVI-met 5.1.1 model successfully captures the microclimatic characteristics of the study area and is sufficiently reliable for the subsequent scenario simulations (Table 3).

2.5. Statistical Analysis

All statistical analyses and data visualizations were performed using Python (version 3.9) with the SciPy, Statsmodels, and Scikit-learn libraries. The statistical significance level was set at p < 0.05 (two-tailed).

2.5.1. Model Validation

To assess the accuracy of the ENVI-met microclimate simulations, simulated meteorological parameters (air temperature and relative humidity) were compared with field measurement data. The evaluation metrics included the Root Mean Square Error (RMSE), Mean Absolute Error (MAE), and Pearson’s correlation coefficient (r). A high r value combined with low RMSE and MAE indicates a robust agreement between the simulation model and the physical environment.

2.5.2. Comparative Analysis of Thermal Comfort

To quantify the differences in thermal performance across street types, Independent Samples T-tests were employed to compare the hourly PET variations between ecological/historical streets and commercial streets. Data were presented as mean ± standard deviation (SD). Furthermore, One-way Analysis of Variance (ANOVA) followed by Tukey’s Honest Significant Difference (HSD) post hoc test was utilized to determine statistically significant differences in Mean Radiant Temperature (Tmrt) and surface temperature among the six specific street scenarios.

2.5.3. Correlation and Threshold Identification

Given the non-normal distribution and potential non-linear relationships in the dataset, Spearman’s rank correlation coefficient (ρ) was calculated to evaluate the monotonic relationship between GVI and PET.
To specifically test the “decoupling” hypothesis in commercial canyons, this study applied Piecewise Linear Regression (PLR) to identify the critical structural break (threshold) in the GVI–PET relationship. The PLR model was compared against Quadratic Polynomial Fitting and standard linear regression using the Coefficient of Determination ((R2) and Akaike Information Criterion (AIC) to select the optimal explanatory model.

2.5.4. Factor Importance Analysis

To disentangle the complex interactions of urban morphology (H/W, SVF), greenery (GVI), and anthropogenic heat (Traffic Heat) on thermal stress (Tmrt), Generalized Linear Models (GLM) were constructed. Standardized regression coefficients were calculated to rank the relative importance of each predictor variable, eliminating the interference of dimensional units.

3. Results

3.1. Spatiotemporal Distribution Characteristics of Typical Street Microclimate and Thermal Comfort

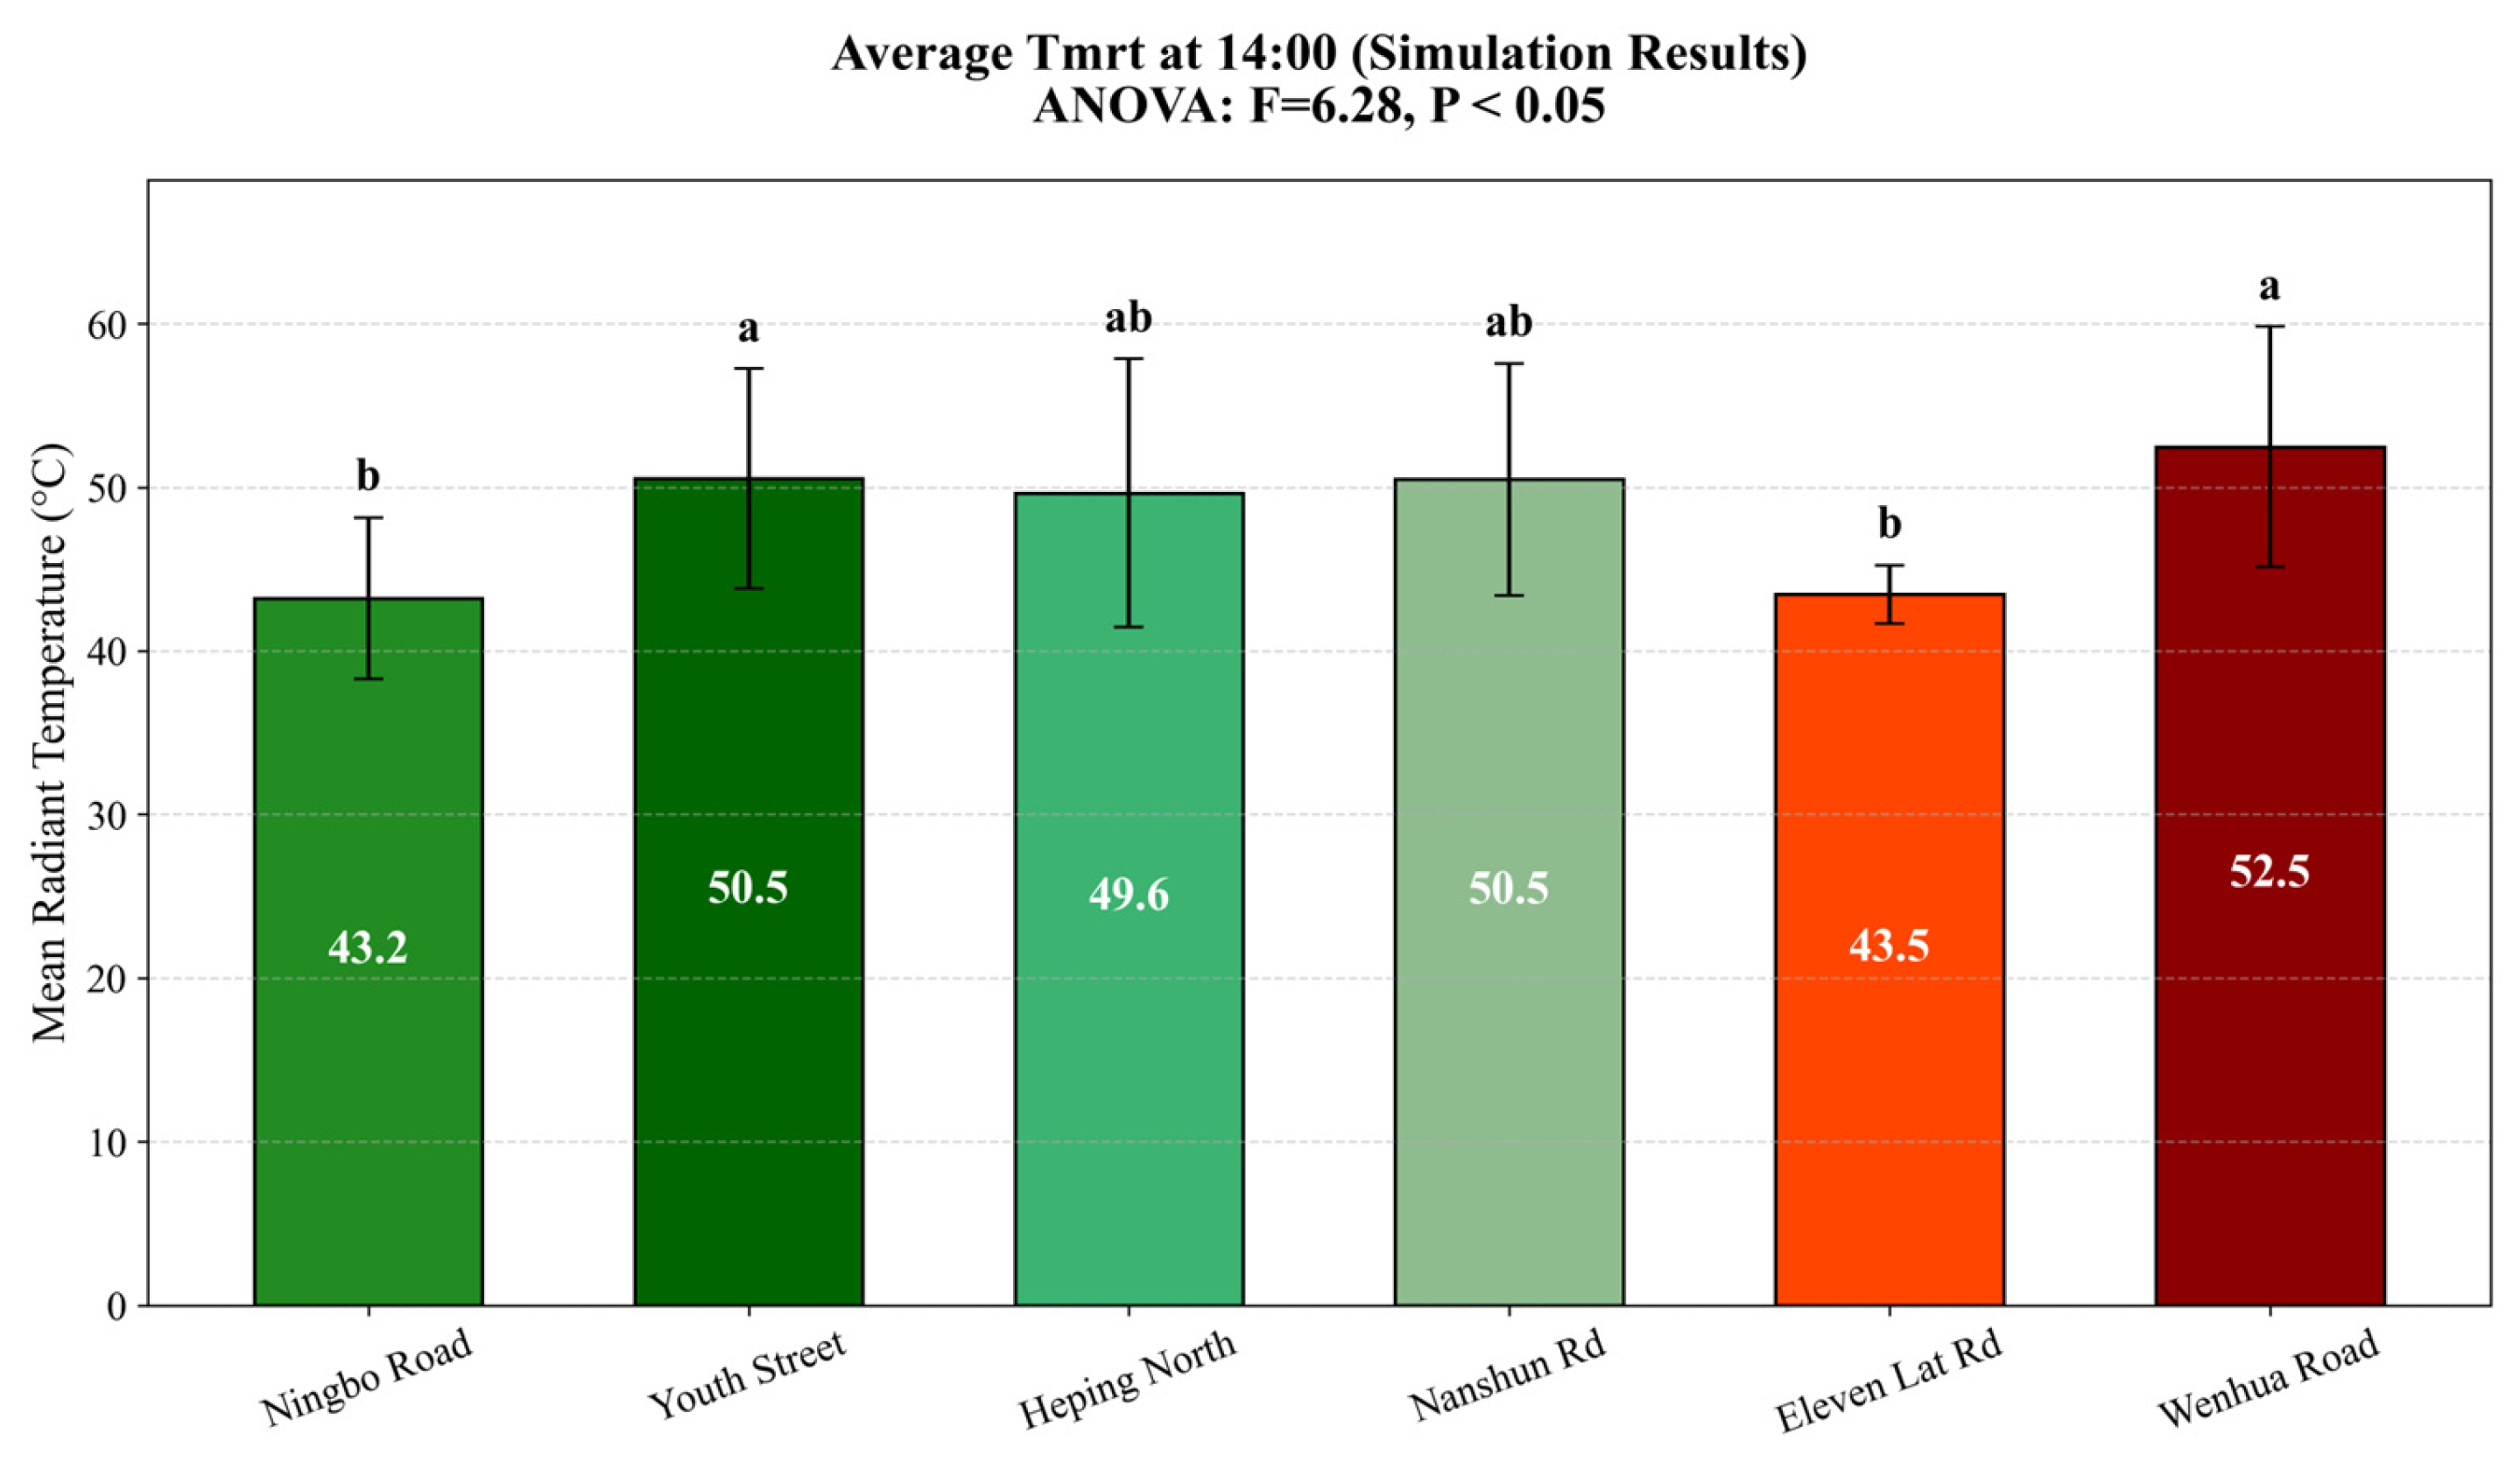
As shown in Figure 3, Simulation results indicated disparities in the radiant thermal environments across different streets. Specifically, in commercial–service streets (Wenhua Rd and Eleven Latitude Rd), the low Sky View Factor (SVF = 0.35), resulting from high aspect ratios (H/W > 1.2), caused the Mean Radiant Temperature (Tmrt) to peak at 48 °C at 14:00. This value was higher than the average Tmrt of 46.85 °C observed in ecological–recreational streets such as Ningbo Rd and Youth St. This intense radiant load was identified as the dominant factor driving the elevation of PET levels.
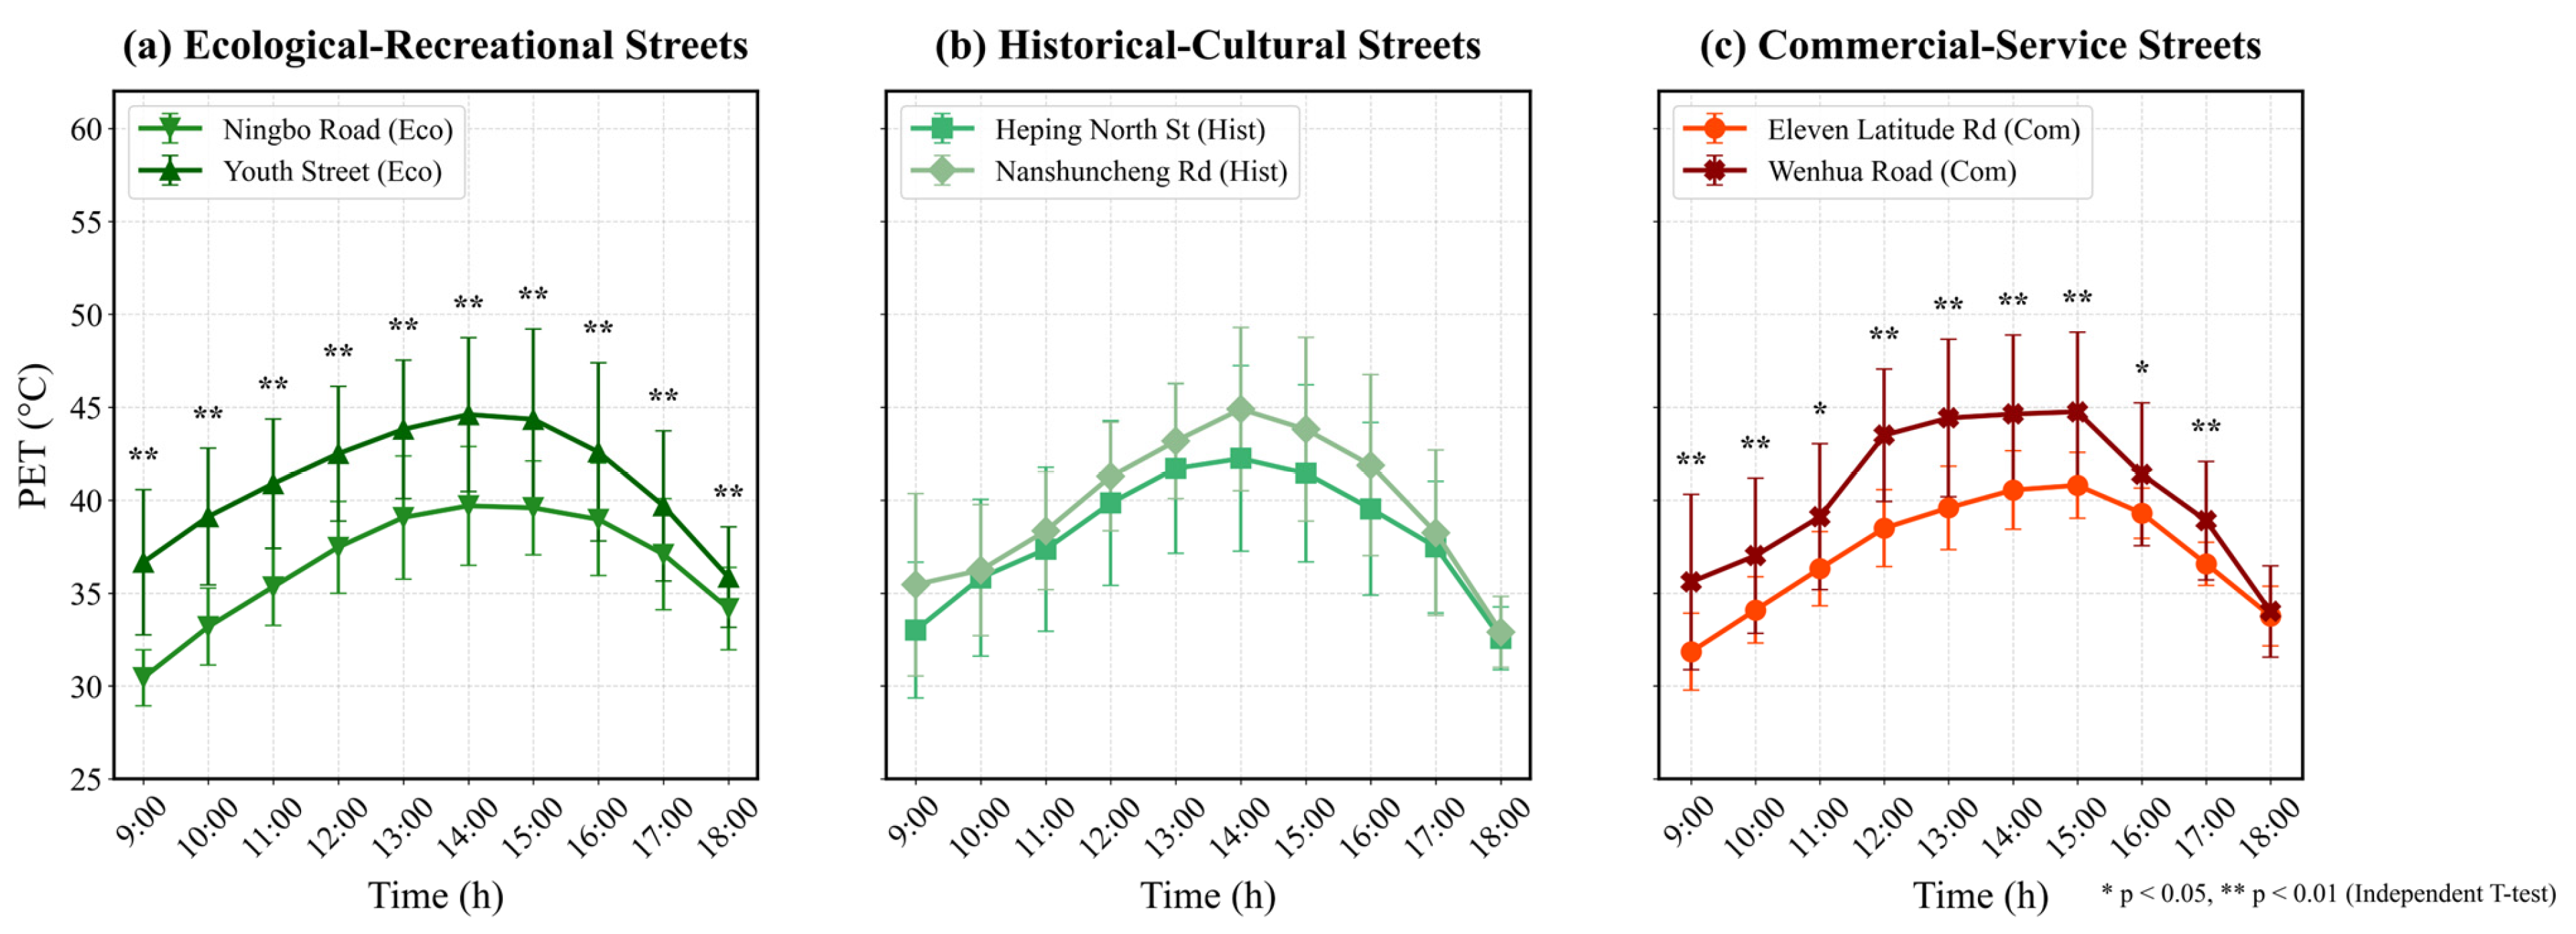
As shown in Figure 4, ENVI-met simulations and empirical data reveal distinct hierarchical disparities in thermal performance across streets of different functional types. commercial–service streets exhibited the most severe thermal stress. Taking Wenhua Rd as a prime example, under the combined influence of high-density architecture and hard underlying surfaces, the peak Physiological Equivalent Temperature (PET) reached 46.15 °C on a typical summer afternoon (14:00), with a diurnal fluctuation amplitude of 13.68 °C. This extreme thermal disparity is fundamentally driven by differences in anthropogenic heat intensity; specifically, the Traffic Heat load in commercial canyons (simulated at 75 W/m2) creates a localized heat accumulation effect that significantly elevates the thermal baseline compared to other functional zones. This was higher than that of the control groups, indicating that commercial street canyons are subject to extreme thermal stress during peak heat periods. In contrast, ecological–recreational streets demonstrated superior thermal buffering capacity; Ningbo Rd, featuring a complete multi-layered planting structure and minimal anthropogenic heat interference, recorded a daily peak PET of merely 40.60 °C, ranking as the most thermally comfortable among all samples. Historical–cultural streets (e.g., Nanshuncheng Rd) displayed intermediate performance, with peak PET values around 44.90 °C and notable thermal stability during morning and evening hours. Furthermore, ENVI-met simulation results indicated that surface temperatures in commercial streets (Wenhua Rd) remained above 40 °C throughout the day, significantly exceeding the 28 °C observed in ecological streets. The long-wave radiation generated by these high-temperature impervious surfaces (with Tmrt peaks exceeding 60 °C), superimposed with the high traffic heat, constituted the primary source of thermal stress.

3.2. Structural Differences and Spatial Differentiation of Street Green View Rate

Street view semantic segmentation results indicate that the superposition effect of planting configuration and street function dominates the spatial distribution of the Green View Index (GVI). Ningbo Rd, an ecological–recreational street adopting the “three-section, four-belt” planting configuration, achieved the highest average GVI of 50.85% by leveraging its ample greening space and multi-level planting structure; notably, the GVI in core landscape segments generally exceeded 55%, forming a high-quality continuous visual green corridor. Conversely, Wenhua Rd, a commercial–service street utilizing the same “three-section, four-belt” layout, recorded an average GVI of only 24.50%—even lower than certain streets employing the simpler “single-section, two-belt” form. This deficit is attributed to the long-term encroachment of commercial activities on ground space and the restricted development of street tree canopies (averaging less than 3 m). Empirical measurements reveal that despite sharing the identical “three-section, four-belt” layout, the ecological street allocates over 70% of its space to greenery, whereas the commercial street compresses this allocation to under 30%, resulting in an extreme GVI disparity of 26.35%. This result quantitatively confirms that in high-density commercial districts, relying solely on cross-sectional planting Form is insufficient to guarantee actual visual greenery Performance (Table 4).
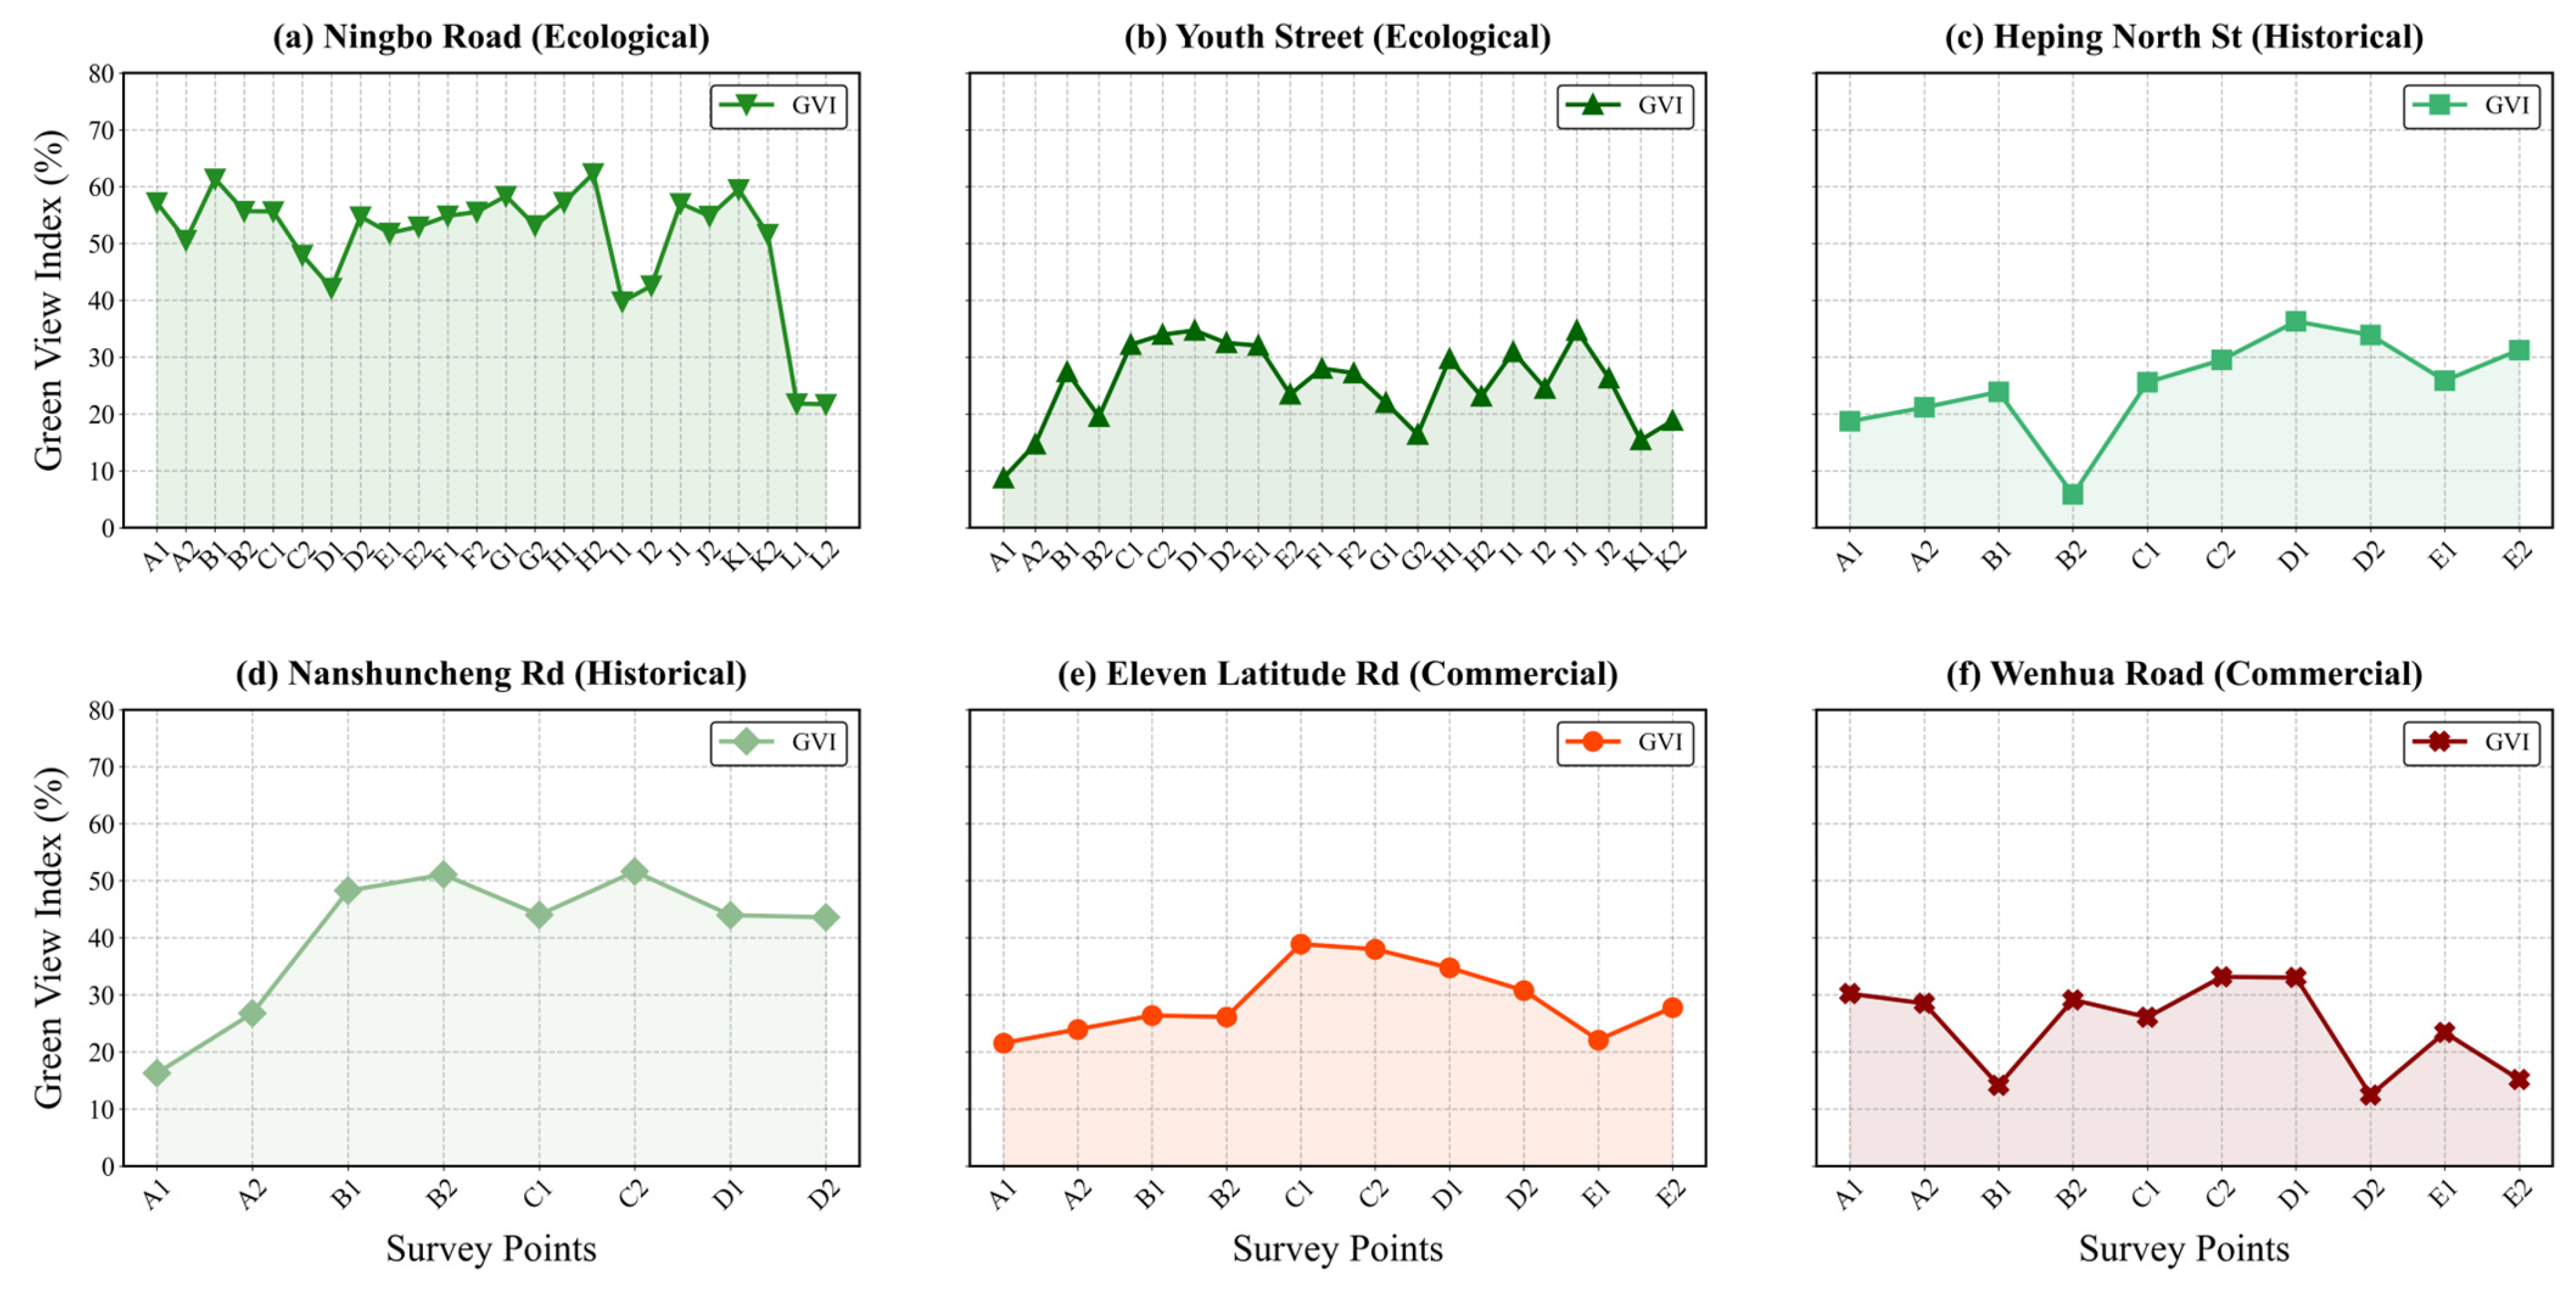
As illustrated in Figure 5a,b, the Green View Index (GVI) curve for ecological–recreational streets (e.g., Ningbo Rd) maintains relatively stable oscillations at high levels (50–60%). This indicates that its “tree-shrub-grass” multi-layer structure possesses strong spatial continuity with minimal interruptions. The higher GVI variation observed in Ningbo Rd is attributed to its heterogeneous spatial morphology, where modern commercial plazas with sparse ornamental greenery alternate with older residential pockets featuring mature spontaneous vegetation. This “fragmentation” results in sharp fluctuations between high-GVI visual nodes and low-GVI functional zones. In sharp contrast, commercial–service streets (e.g., Figure 5f, Wenhua Rd) exhibit intense sawtooth-like fluctuations. At specific observation points (such as B2 and D2), the GVI suffers precipitous drops to below 15%. This visually reflects the “erosion effect” exerted on green spaces by commercial activities such as shop entrances, temporary parking, and billboard obstructions, resulting in significant fragmentation of the green landscape (Table 4).

3.3. Non-Linear Decoupling Between Visual Perception and Thermal Environment Improvement

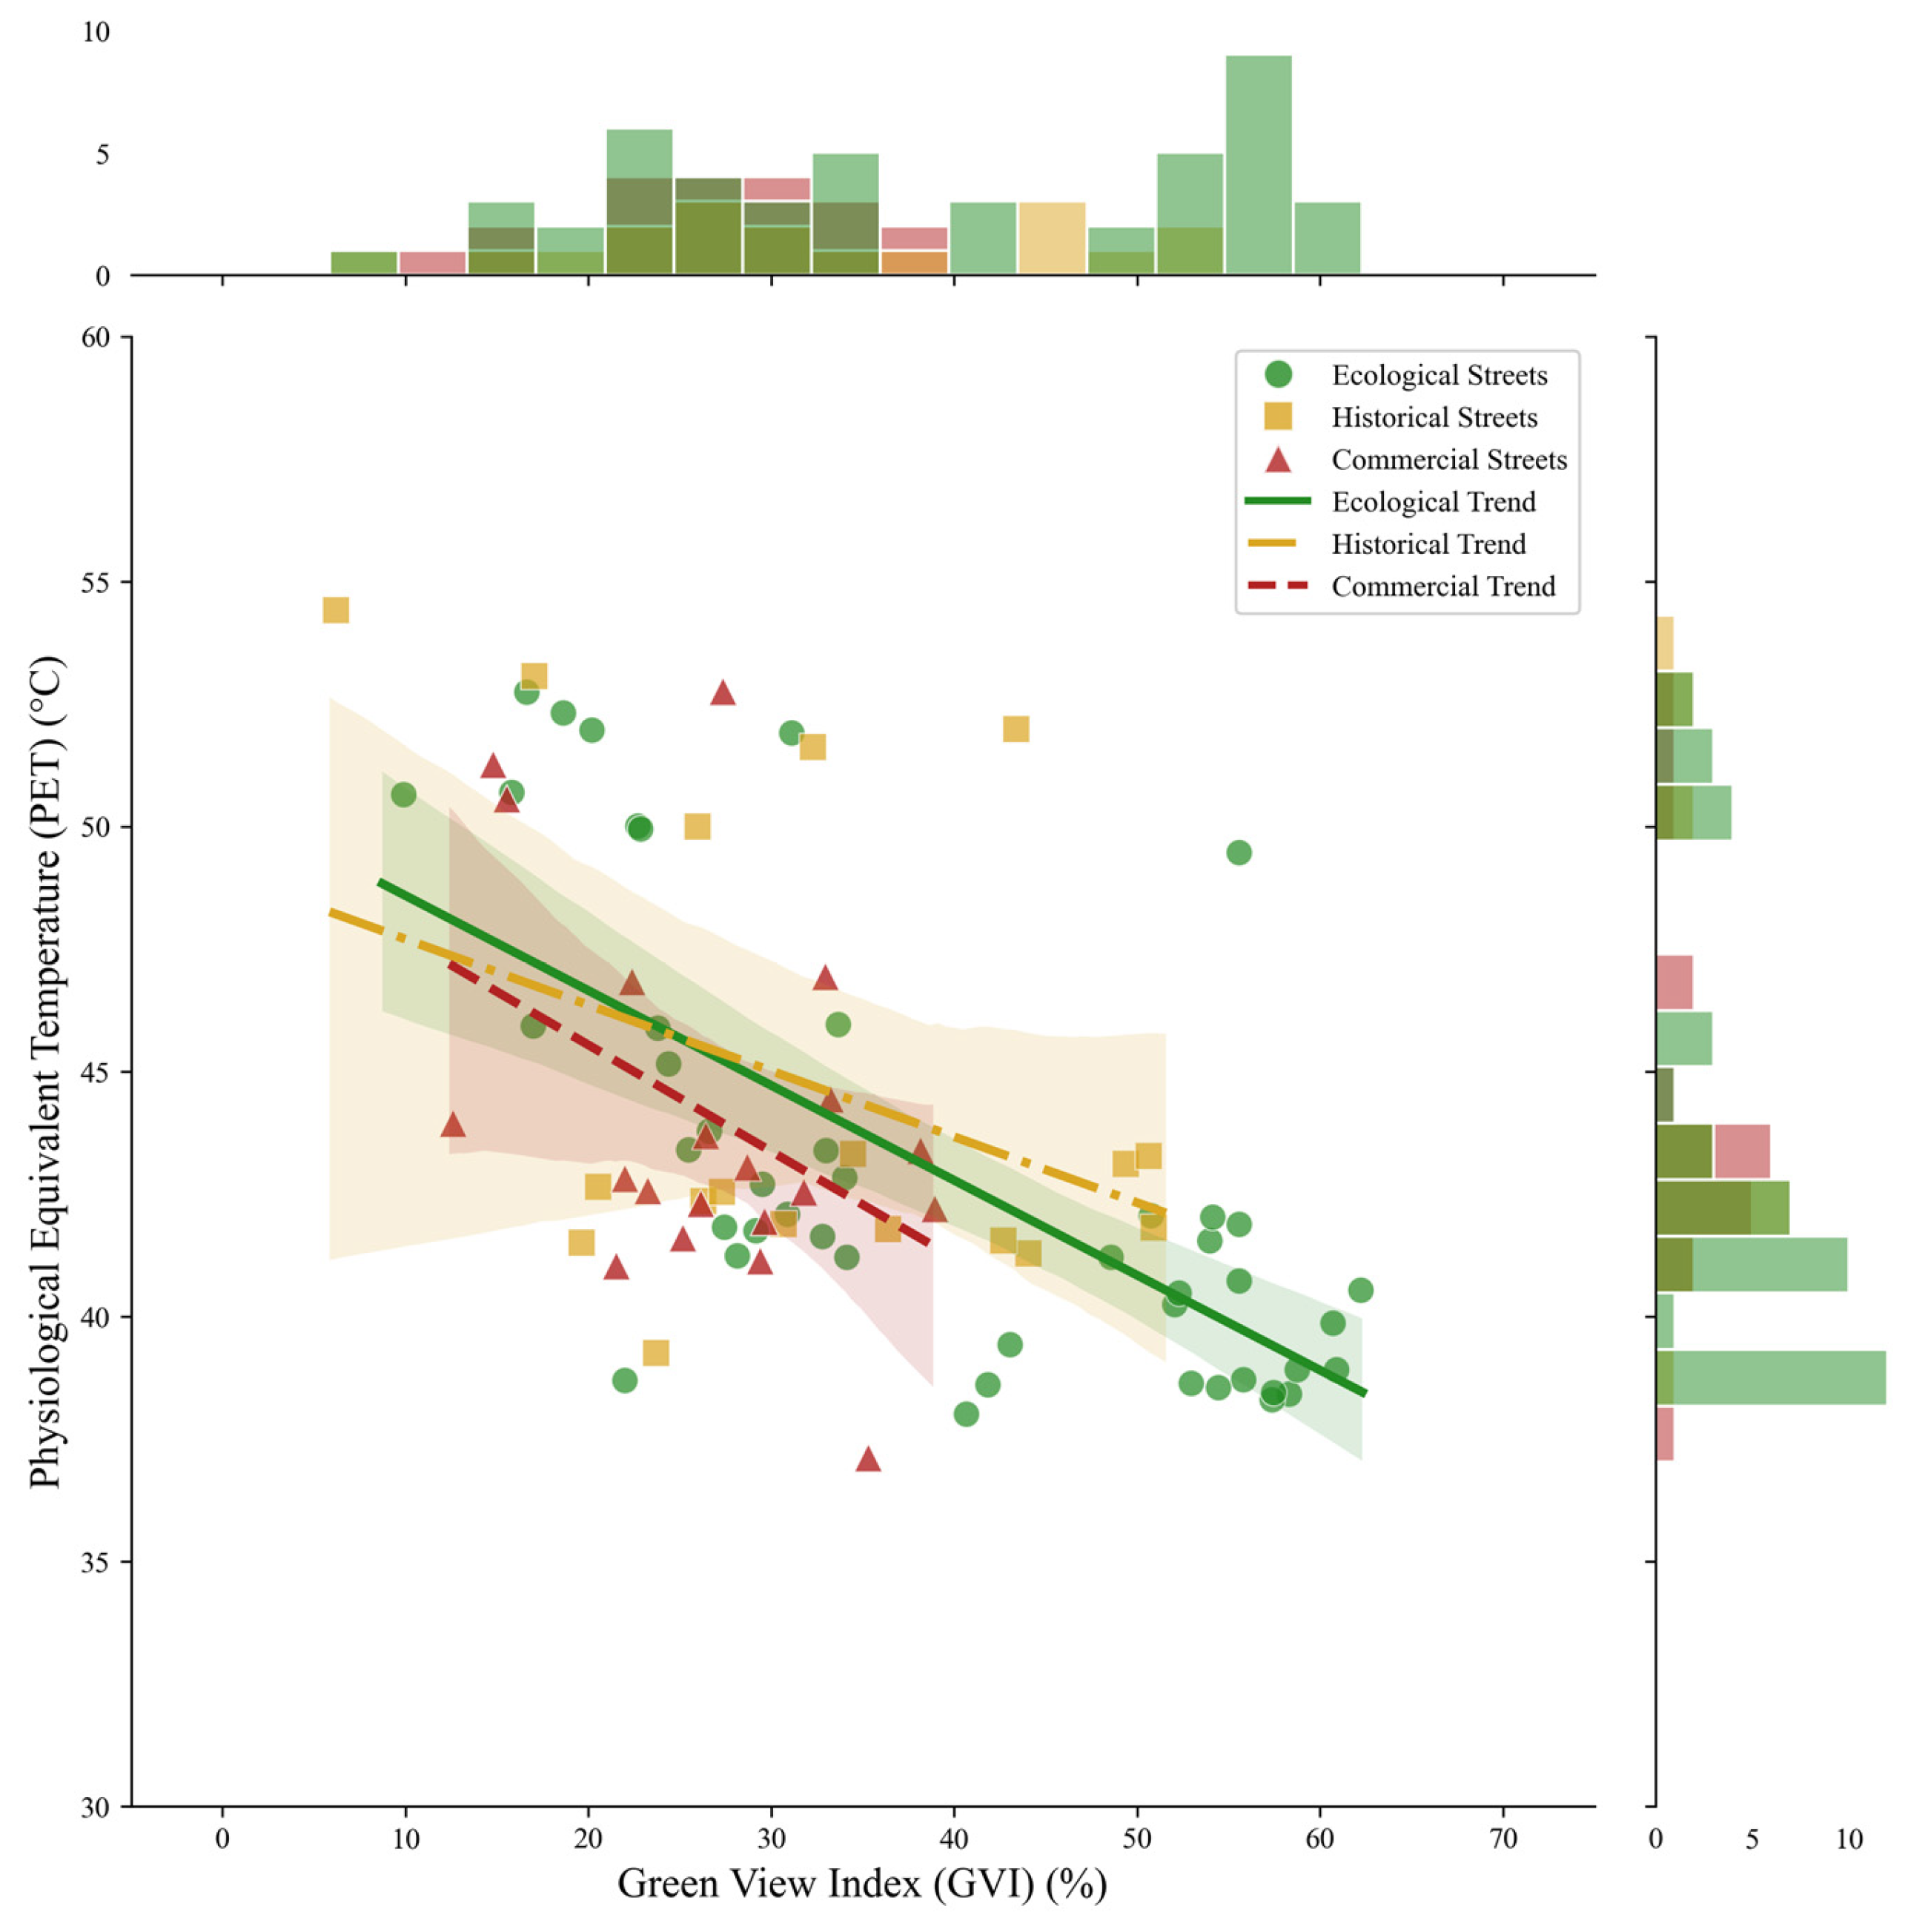
Through non-linear regression and correlation analysis, this study identified a significant “visual–thermal decoupling” phenomenon in commercial street canyons. In ecological–recreational streets, GVI and PET exhibited a highly significant negative correlation (Youth St: r = −0.763, p < 0.001; Ningbo Rd: r = −0.545, p = 0.005), confirming that in ecology-dominated environments, increasing visual green volume can be effectively translated into physical cooling benefits. However, in commercial–service streets, this coupling relationship breaks down: the correlations between GVI and PET for both Eleven Latitude Rd (p = 0.325) and Wenhua Rd (p = 0.351) failed to reach statistical significance, indicating that fluctuations in GVI did not induce significant changes in thermal comfort. Similarly, despite Nanshuncheng Rd (historical–cultural) possessing a relatively high mean GVI (40.66%), the ameliorating effect of its GVI on PET remained statistically insignificant (p = 0.181). These statistical findings demonstrate that in complex urban environments, the regulatory capacity of visual greenery on the thermal environment is subject to distinct “threshold effects” and environmental dependency (Figure 6 and Figure 7).
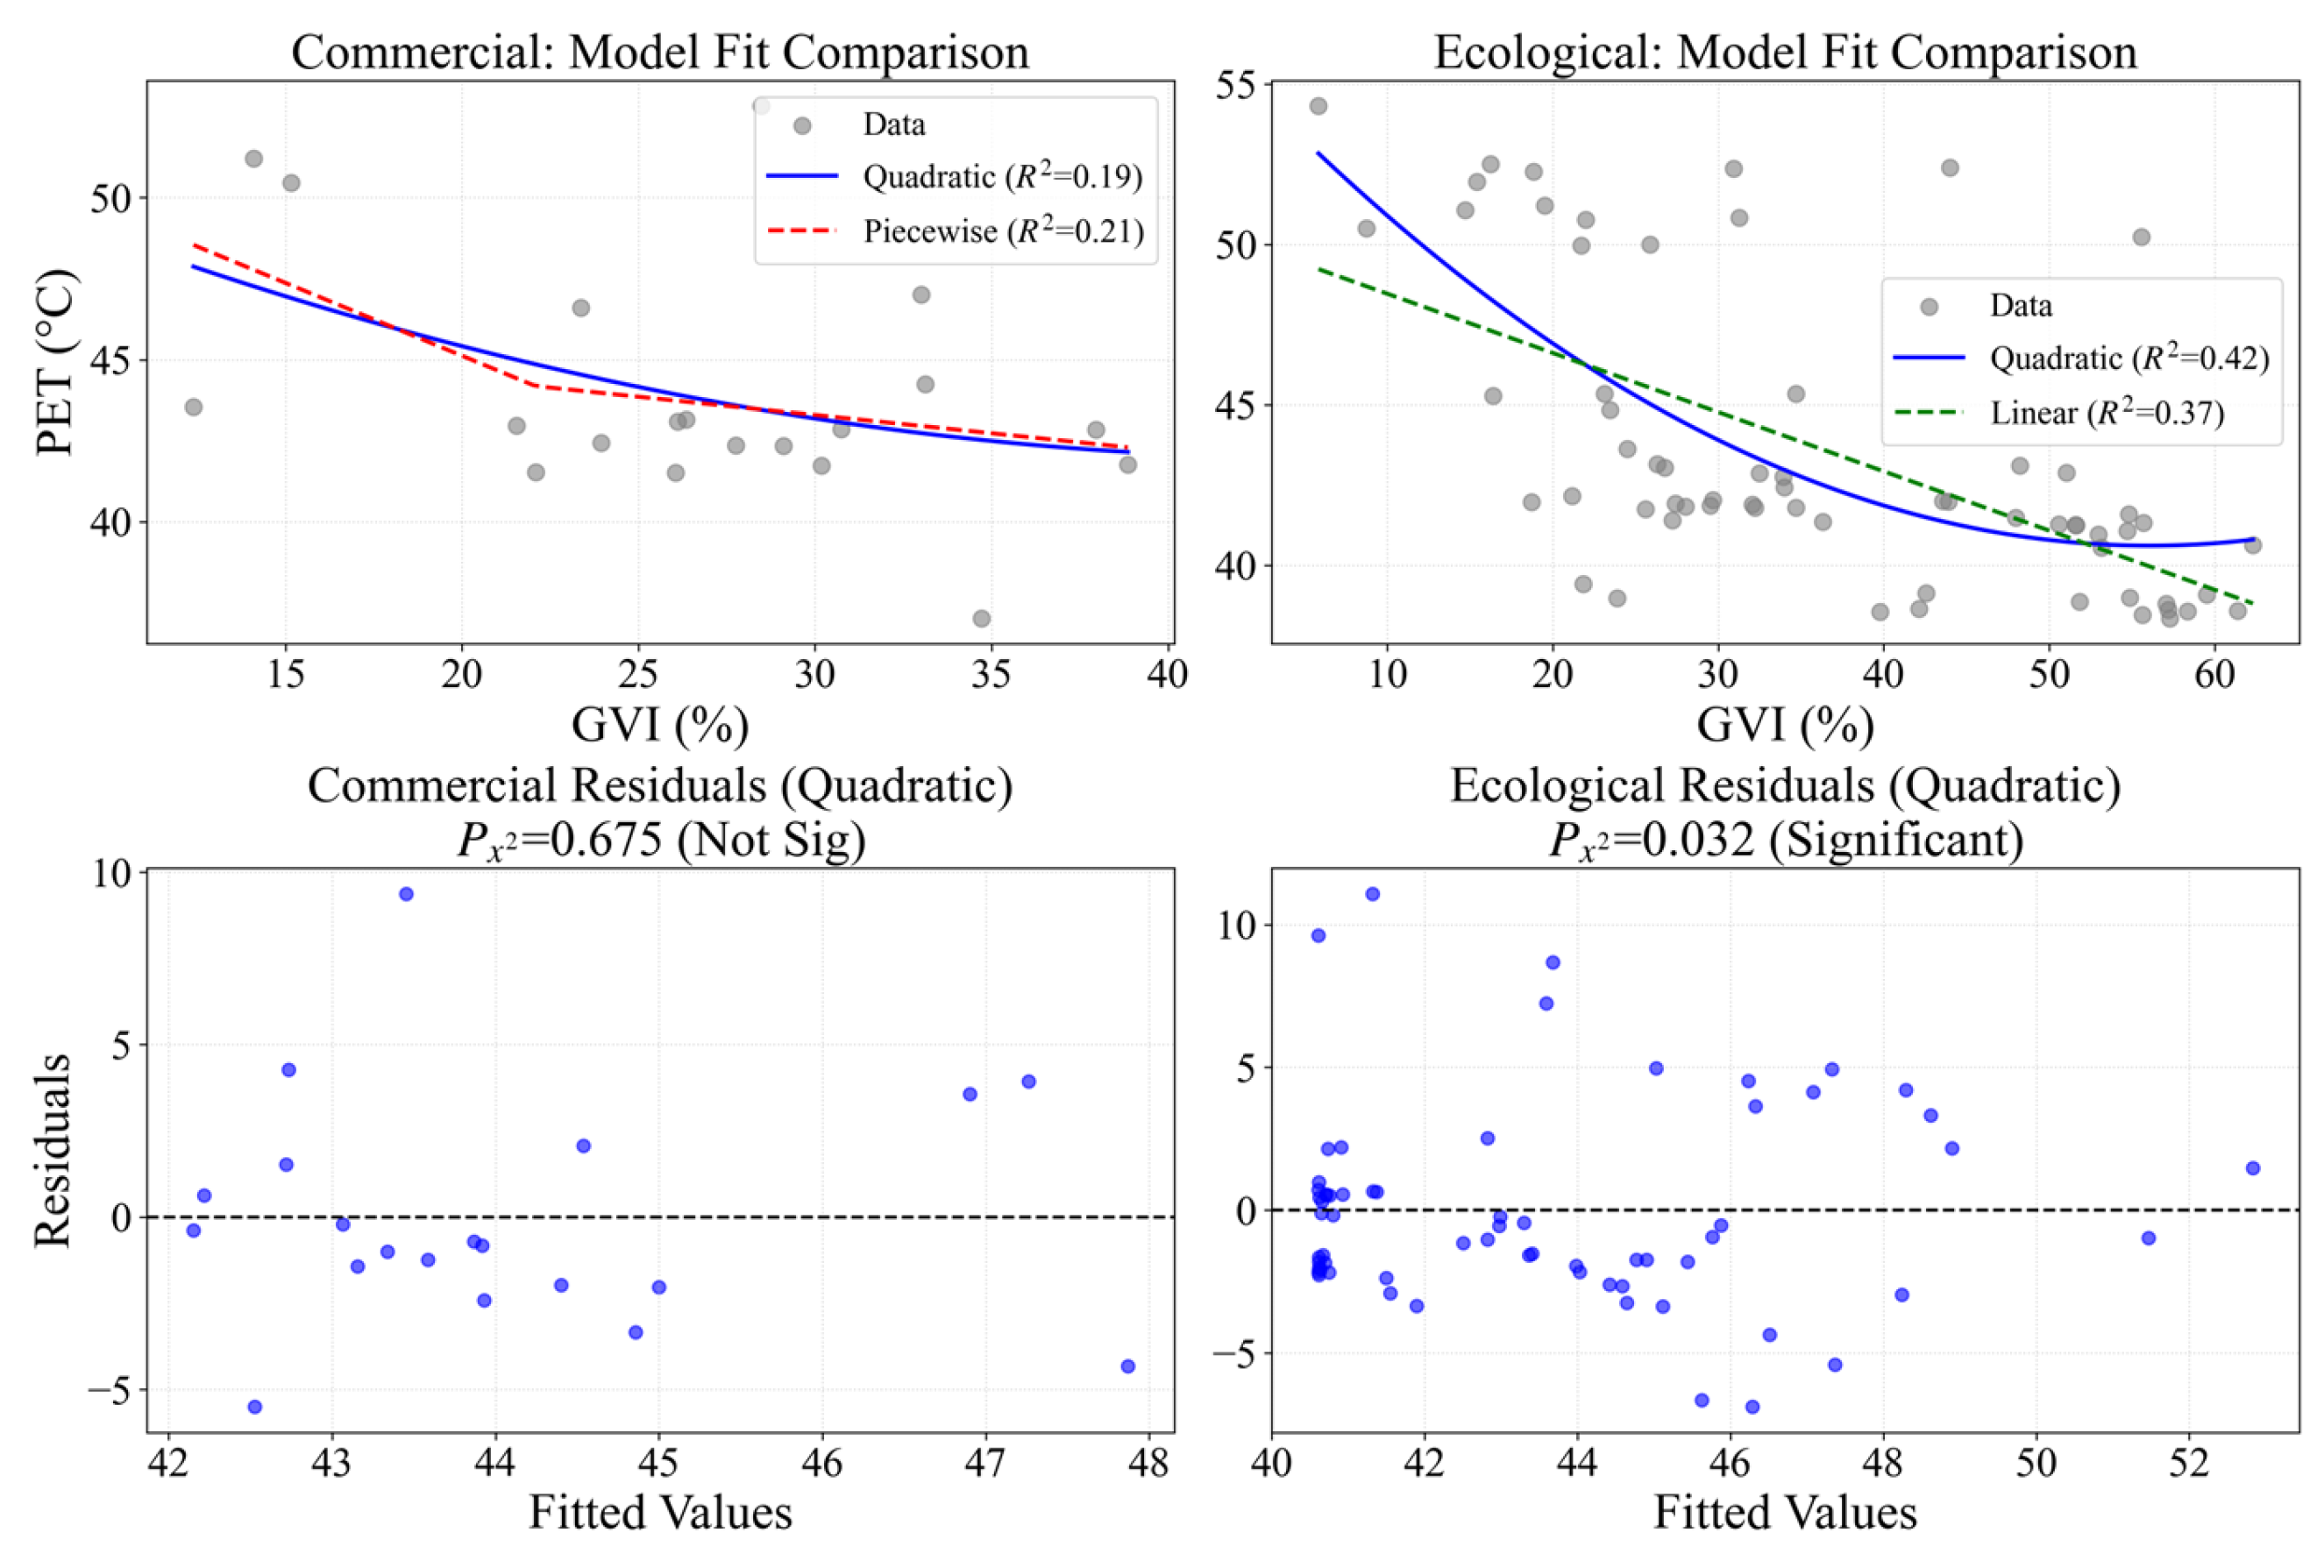
Utilizing Piecewise Linear Regression (PLR) on the commercial street dataset, we quantitatively identified a critical cooling threshold at GVI = 22.08%. Below this threshold, visual greenery exhibited a substantial cooling potential, with a regression slope of −0.454. However, a distinct ‘decoupling’ phenomenon was observed beyond this point: as GVI exceeded 22.08%, the cooling efficacy diminished significantly (slope = −0.109). Comparative diagnostics confirmed the validity of this threshold model: the PLR achieved a goodness-of-fit (R2) of 0.210, outperforming the quadratic polynomial fit (R2 = 0.186), where the non-linear curvature term proved statistically insignificant (p > 0.05). This indicates that the thermal response is governed by a distinct ‘breaking point’ rather than a smooth curvilinear gradient.
In contrast, ecological streets maintained a consistent and strong negative correlation across the entire GVI spectrum. While the quadratic fit (R2 = 0.421) slightly improved explanatory power over the linear model (R2 = 0.375), indicating a potential acceleration in cooling benefits, the relationship remained statistically significant and monotonic (Spearman’s ρ = −0.692, p < 0.001). This stark contrast demonstrates that the ‘visual–thermal mismatch’ is a unique characteristic of high-intensity commercial canyons governed by anthropogenic heat dominance (Figure 8). These statistical findings demonstrate that in complex urban environments, the regulatory capacity of visual greenery on the thermal environment is subject to distinct ‘threshold effects’ and environmental dependency.

4. Discussion

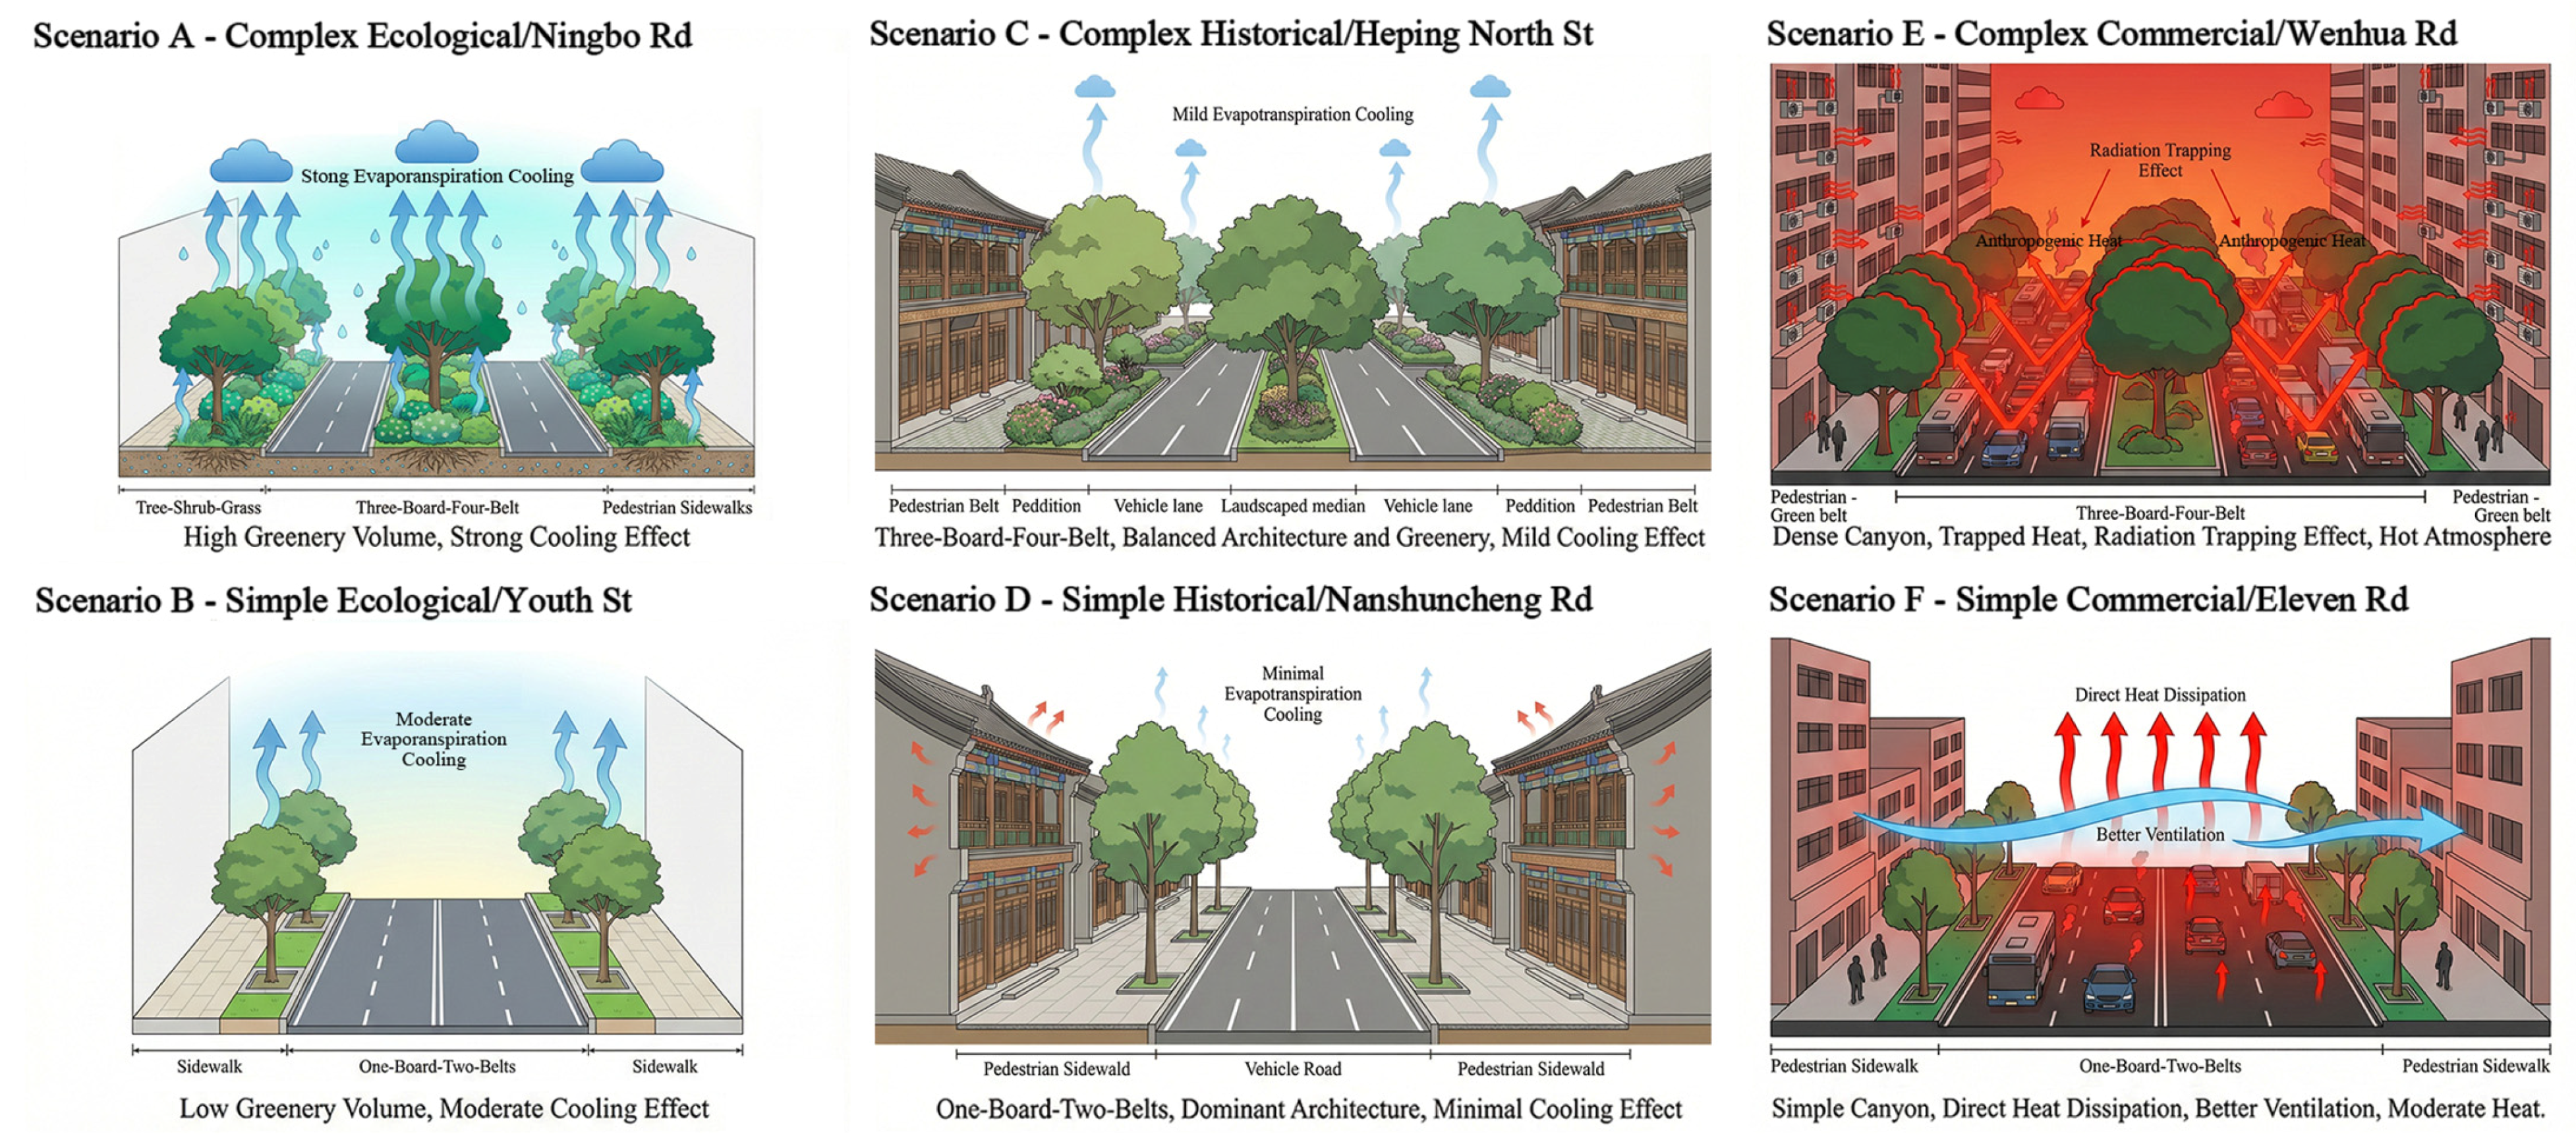
The inefficacy of the cooling effect of greenery in commercial districts unveils the complexity inherent in urban microclimate regulation mechanisms. This does not imply a total loss of physical cooling capacity by vegetation; rather, in specific high-intensity built environments, its ecological benefits are obscured or overwhelmed by multiple dominant factors. Previous studies have widely posited that increasing the Green View Index (GVI) effectively enhances outdoor thermal comfort [6,37,38]. Furthermore, GVI derived from street view imagery has been extensively utilized to evaluate urban greening and its impact on resident well-being (Huang et al., 2025; Zhu et al., 2025) [39,40]. However, empirical investigations conducted in high-density commercial districts such as Wenhua Rd revealed that this established regularity fails under specific high-thermal-load conditions, manifesting as a significant “decoupling effect.” This phenomenon is not attributable to a single factor but is the cumulative result of high-intensity anthropogenic heat emissions, the dominance of impervious hardscapes, the “bonsai-like” characteristic of vegetation structures, and street canyon geometry. Under the combined constraints of these factors, the ameliorative effects of visual greenery are significantly offset, leading to a phenomenon of “same form, different effect” [41,42,43]. This suggests that when street functional attributes reach a certain critical threshold, their impact on the microclimate may override the potential benefits offered by landscape morphology. To systematically contextualize this decoupling effect and guide the subsequent mechanistic decomposition, we present the conceptual diagram of the street heat balance mechanism (Figure 9), which illustrates the differences in heat exchange processes and vegetation cooling efficiency across our six typical street scenarios and establishes a visual framework for the analysis below. From the perspective of energy balance, the following sections delve into the three key mechanisms driving this phenomenon:

4.1. Threshold Effect of Anthropogenic Heat and Hardscape Offset

The primary driver behind the inefficacy of greening in commercial districts lies in the “offsetting effect” exerted by high-intensity anthropogenic heat emissions and the radiative properties of underlying surfaces against the vegetation cooling island effect. Field survey data reveals that in commercial–service streets (e.g., Wenhua Rd), building density along the street reaches as high as 75%. Furthermore, to accommodate transient traffic flow and commercial outdoor displays, substantial potential greening space has been encroached upon by impervious hardscapes such as asphalt and concrete. Under conditions of high summer solar radiation, these hard interfaces, characterized by low albedo and high heat capacity, significantly elevate the Tmrt [44,45,46]. Tmrt serves as a critical metric for evaluating human thermal exposure, quantifying the primary source of spatial variability in pedestrian perceived thermal stress and comfort within complex urban environments [47,48]. Research indicates that urban geometry exerts a significant influence on daytime thermal stress; particularly under clear-sky and high-temperature conditions, high radiant heat loads lead to a marked increase in Tmrt [46]. Concurrently, the metabolic heat from dense pedestrian crowds, vehicle exhaust emissions, and waste heat rejected by building air conditioning systems collectively construct an extremely high-intensity “Anthropogenic Heat Dome” within commercial districts.
This study proposes the “Thermal Threshold” hypothesis: when the external thermal load exceeds a specific critical point, the latent heat flux generated by vegetation through transpiration becomes significantly lower than the environmental sensible heat flux. As evidenced by the empirical data, the afternoon peak PET on Wenhua Rd reached 46.15 °C. This extreme thermal environment indicates that, in the absence of source heat control, purely cosmetic visual greenery is insufficient to reverse the thermodynamic balance dominated by impervious underlying surfaces and anthropogenic heat sources. It is important to note that this study specifically focuses on the ‘Peak Thermal Stress’ scenario (Traffic Heat ≈ 75 W/m2) to identify the critical failure boundary of green cooling. While a sensitivity analysis across varying traffic loads (e.g., 25 W/m2 or 125 W/m2) could delineate the gradual progression of thermal coupling, our field measurements and simulation results at 75 W/m2 have already successfully captured the distinct ‘Decoupling’ phenomenon. Since the primary objective is to reveal the mechanism of ‘Greenery Failure’ under extreme urban conditions rather than quantifying cooling rates under mild conditions, the peak load scenario serves as the decisive threshold indicator.
It is of particular note that Wenhua Rd (commercial) and Ningbo Rd (ecological) both employ the identical “three-section, four-belt” multi-layered planting structure and achieve relatively high Green View Indices; yet, their thermal environmental performances diverge significantly. This phenomenon of “Same Form, Different Performance” strongly substantiates that in high-density commercial districts, high-intensity external thermal loads have exceeded the physical threshold of vegetative transpiration cooling. Consequently, mere reliance on the morphological accumulation of greenery is insufficient to reverse the thermal environmental deficit.

4.2. Structural Mismatch Between Visual Greenery and Ecological Performance

The structural disparity between “Visual Greenery” (GVI) and “Ecological Greenery” constitutes another critical internal factor driving the observed mismatch phenomenon. The ecological–recreational street Ningbo Rd not only exhibited high GVI values but, more crucially, featured a complete “tree-shrub-grass” multi-layered community structure. With green belts reaching 2 m in width and ample growth space, street trees developed full, robust canopies. This structure not only intercepts solar radiation through multi-layered foliage but also maintains soil moisture via ground cover vegetation, thereby forming a stable cool air pool in the near-surface layer [49]. This aligns with the findings of Fan et al. [28] on Youth St in Shenyang, which emphasized that optimizing vegetation layout (e.g., increasing understory shrub coverage) is a key strategy for enhancing street thermal comfort, whereas solitary tree planting offers limited benefits in the absence of vertical structural support.
Conversely, in commercial–service streets, although dense street tree planting yields considerable GVI values in two-dimensional imagery, the greenery exhibits distinct “bonsai-like” characteristics due to the compression of underground utility networks and surface space. This “bonsai effect” stems from the rigid functional demands of commercial streets: to accommodate commercial pedestrian flows and traffic, the “elastic space” for greening is severely squeezed. Furthermore, the prioritization of commercial operations over vegetation maintenance results in greenery characterized by “high fragmentation and low canopy closure.” Field observations confirmed that in sections of Wenhua Rd, the average crown width of street trees was less than 3 m, with understory shrubs being severely lacking or exhibiting patchiness. This fragmented green structure leads to the paradoxical situation of “greenery without shade”: pedestrians perceive greenery visually (high GVI) yet remain physically exposed to direct sunlight and surface reflected radiation. Consequently, GVI, as a two-dimensional metric based on visual projection, possesses inherent defects in characterizing the three-dimensional ecological volume and shading quality of vegetation [37,50]. This explains why high GVI fails to translate into low PET in commercial districts lacking substantive canopy shading. Our findings align with previous studies [51,52], suggesting that horizontal GVI must be complemented by three-dimensional metrics like Leaf Area Index (LAI) or Canopy Volume to accurately predict cooling potential.

4.3. Urban Canyon Geometry and Radiative Trapping Effect

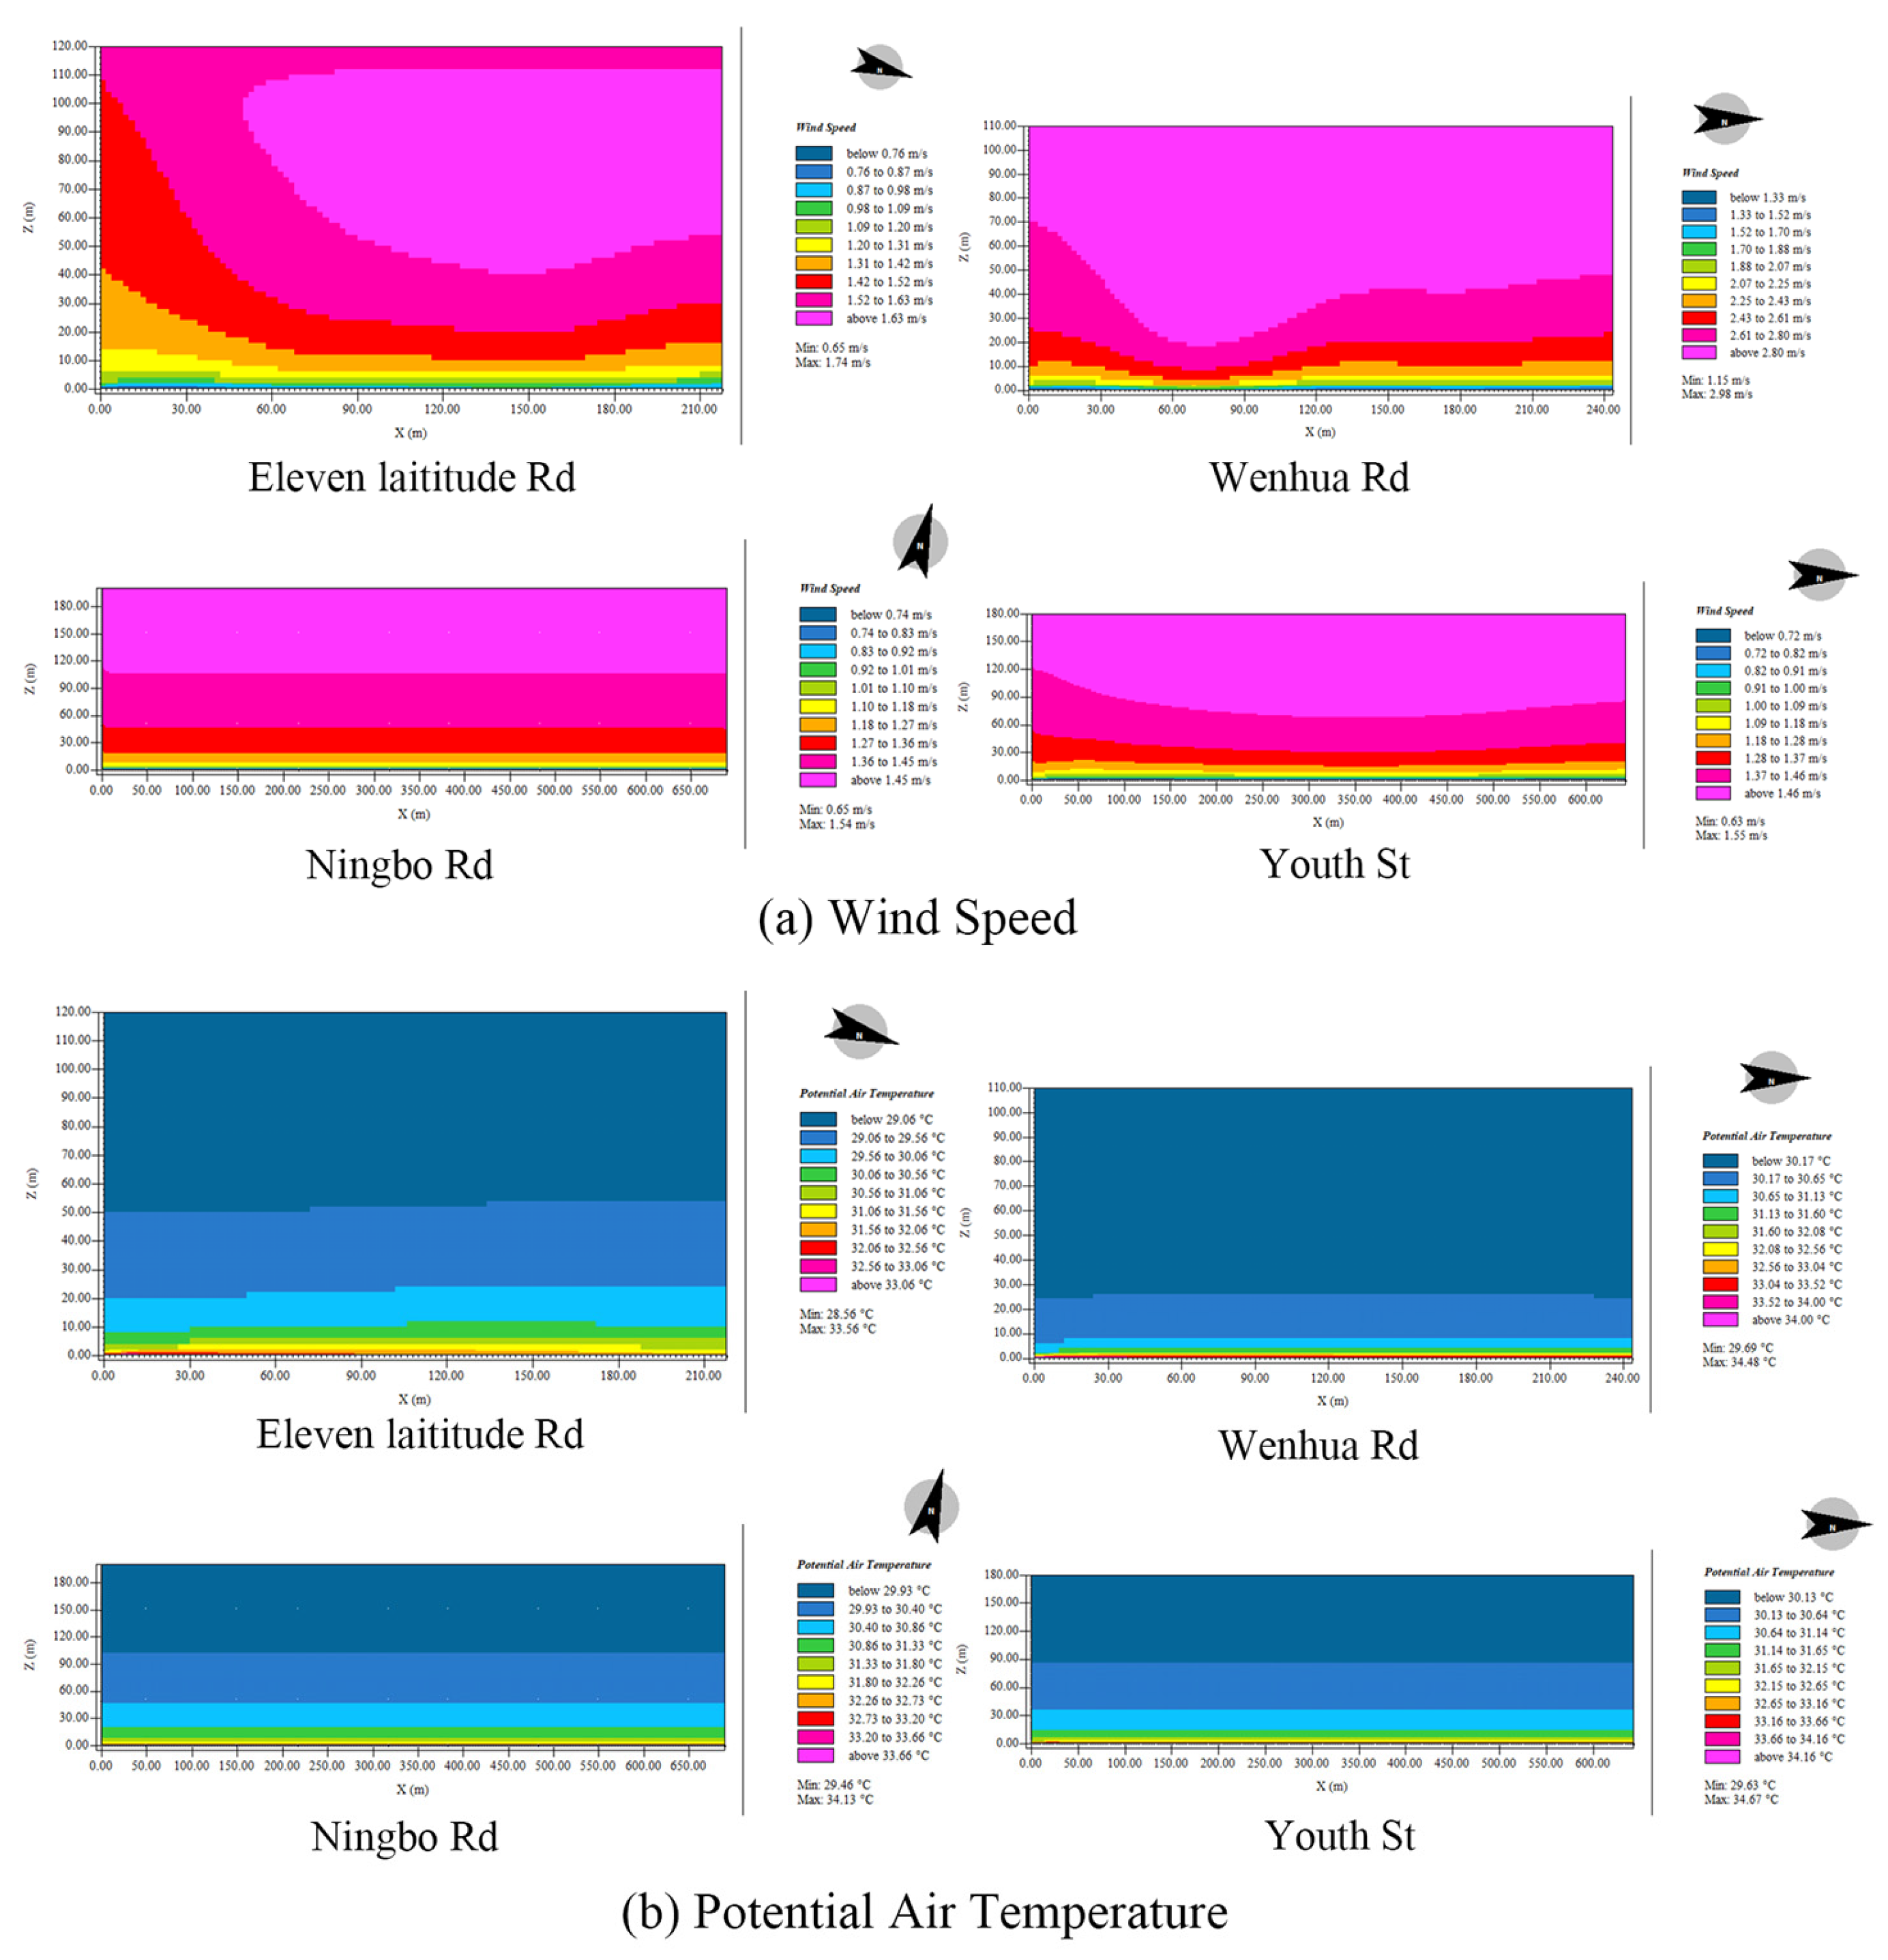
Beyond underlying surfaces and greening structures, Urban Canyon Geometry further modulates the cooling potential of greenery by influencing the Sky View Factor (SVF) and ventilation efficiency [53,54]. Commercial–service streets, typically characterized by higher Aspect Ratios (H/W Ratio) and greater interface continuity [55,56,57], exhibit distinct aerodynamic behaviors. Wind speed fields simulated by ENVI-met reveal that dense, high-rise commercial buildings significantly increase surface roughness, creating wind shadow zones or vortex airflows within the street that hinder the convective dissipation of accumulated heat [54,58]. The observed heat accumulation could be partially attributed to restricted ventilation in deep canyons, a phenomenon widely reported in similar high-density contexts [59]. Although wind speed was not the primary focus of this measurement, the ENVI-met profiles suggest that the high aspect ratio induces a distinct “skimming flow” regime [60].
To elucidate the physical mechanism behind this, we analyzed the vertical cross-sections of the wind and thermal environments (Figure 10). From an aerodynamic perspective, the high aspect ratio of the commercial–service street induces a distinct “skimming flow” regime. As illustrated by the wind vectors (Figure 10a), the free-stream airflow glides over the roof level, failing to penetrate into the canyon. This creates a stable vortex circulation and a wind stagnation zone (v < 0.5 m/s) at the pedestrian level, significantly inhibiting convective heat transfer. Thermodynamically, this ventilation blockage leads to severe thermal stratification (Figure 10b). The potential temperature profile reveals a high-intensity “heat dome” accumulating at the bottom of the commercial canyon, causing the near-surface temperature to exceed 35 °C.
Deep street canyon morphology also results in a reduced SVF, limiting the dissipation of surface long-wave radiation into the sky and creating a radiative “Trapping Effect” [61]. Both empirical and simulated data confirm the mechanics of this phenomenon. As shown in Table 1, the SVF of Wenhua Rd is only 0.35, a narrow aperture that impedes the release of terrestrial long-wave radiation. Despite a relatively high Green View Index, the peak Mean Radiant Temperature still reached 52.5 °C, suggesting that while tree canopies block incoming short-wave radiation, they combine with towering building facades to form a closed “thermal cavity.” This mechanism of “heat gain without dissipation” directly undermines the cooling potential of street trees. In poorly ventilated deep canyons, merely increasing roadside trees may even yield counterproductive effects; while canopies intercept solar radiation, they simultaneously obstruct the scattering of upward long-wave radiation from the street bottom and reduce near-surface wind speeds [28,62,63].
Ecological–recreational streets, conversely, typically feature larger building setbacks and higher spatial openness, facilitating the introduction of natural wind to carry away the moist, cool air generated by vegetation transpiration. This distinction indicates that in the renewal of commercial districts, improvements in GVI must be synergistically considered alongside the construction of ventilation corridors. Such an approach avoids high-density planting exacerbating “canyon occlusion,” thereby achieving the dual optimization of visual landscapes and physical environments. This aligns with research on urban forestry and greening management emphasizing the importance of characterizing individual tree dimensions, growth conditions, and spatial distribution [64].
The key to the inefficacy of greening cooling effects in commercial districts lies in the physical limitations revealed by the “Thermal Threshold” hypothesis. In environments dominated by high-intensity anthropogenic heat emissions and impervious paving, even a high GVI is insufficient if unaccompanied by a complete three-dimensional greening structure, adequate canopy coverage, and favorable ventilation conditions. Under such circumstances, the latent heat flux generated by greenery is far insufficient to offset the sensible heat flux in the environment, failing to effectively improve outdoor thermal comfort. Urban renewal strategies, therefore, must not blindly pursue the accumulation of green volume but should prioritize controlling heat sources and resolving ventilation issues, followed by the optimization of greening structures to enhance their ecological function.

4.4. Quantitative Implications for Design Strategy

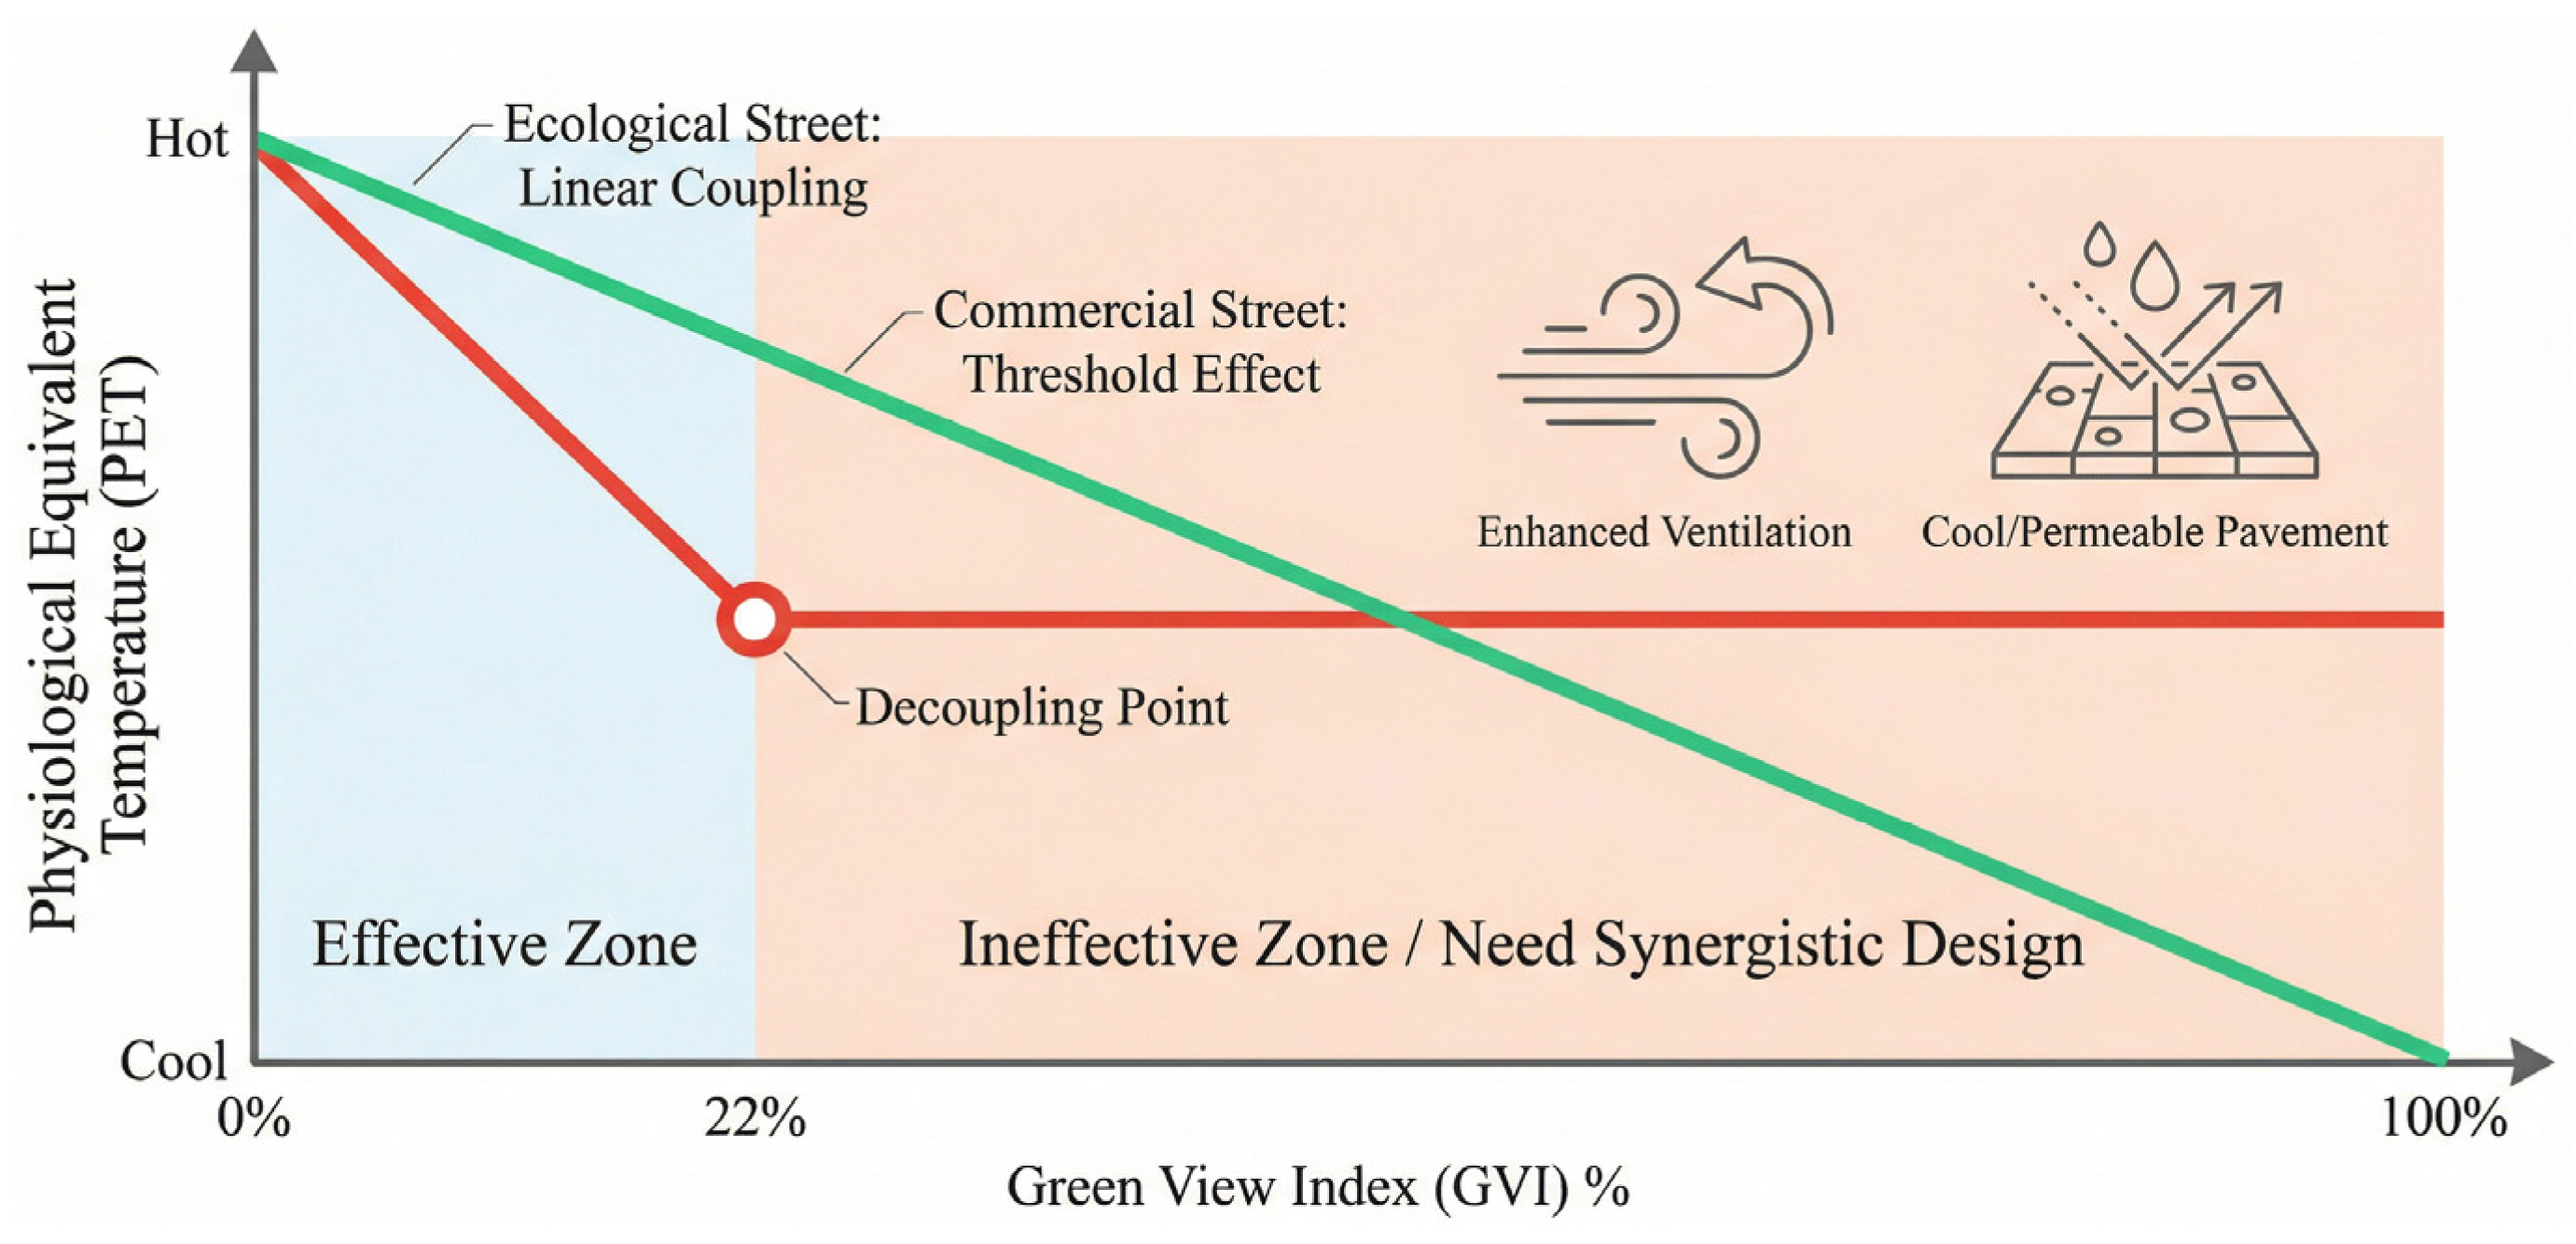
Instead of a one-size-fits-all approach, this study proposes a “Threshold-Based Design Strategy” derived from the Piecewise Linear Regression model (Figure 11):
Zone A (Efficiency Zone, GVI < 22%): For streets with low green volume, increasing GVI is the priority. Our model predicts that every 10% increase in GVI yields a ~4.54 °C reduction in PET (based on slope −0.454).
Zone B (Inefficiency Zone, GVI > 22%): Once GVI exceeds the 22.08% threshold in commercial canyons, the “Decoupling Effect” dominates. The strategy must shift from “Quantitative Accumulation” (planting more trees) to “Qualitative Optimization” (e.g., improving ventilation, using cool pavements), as the marginal benefit of added greenery is negligible (slope −0.109).
This quantitative threshold provides a specific checkpoint for urban renewal in severe cold regions, preventing resource wastage on ineffective greening strategies. To operationalize the Load-Responsive strategy, Zone A (high thermal load) should prioritize cool pavement materials and ventilation corridors to offset anthropogenic heat, while Zone B should focus on increasing canopy density rather than just visual green coverage.
The identified 22.08% GVI threshold in Shenyang aligns with observations in other severe cold regions. For instance, studies in Harbin [65] similarly identified that in extremely dense commercial corridors, the marginal cooling benefit of vegetation significantly diminishes once a certain visual density is reached, often due to the overriding influence of anthropogenic heat and building trapping effects. Compared to tropical cities like Singapore, where greenery maintains a more linear cooling efficiency due to intense evapotranspiration [66], our findings emphasize that in high-latitude, severe cold regions, the ‘Decoupling Effect’ is more pronounced, necessitating a shift from quantity-based to performance-based greening strategies [67].

4.5. Limitations and Future Perspectives

While this study offers valuable insights into the correlation between the Green View Index (GVI) and thermal comfort in urban streetscapes, it also identifies limitations that suggest specific pathways for future methodological refinement. One primary constraint lies in the nature of data acquisition: street view images reflect only the static conditions at the specific moment of capture, whereas actual street environments exhibit significant dynamic characteristics. Transient elements such as moving vehicles, pedestrian density, and changes to temporary physical facilities are subject to fluctuations caused by capture time, specific events, weather conditions, and seasonal variations. The inevitable temporal discrepancy between the acquisition of historical street view data and the specific time nodes used for thermal comfort simulations may introduce potential deviations in measurement. To mitigate this, future inquiries could utilize street view imagery that is temporally synchronized with thermal simulation periods, thereby enhancing spatiotemporal consistency and ensuring a more accurate analysis of the GVI–thermal comfort relationship.
The scope of sample selection represents another area for optimization, as the finite number of study sites in this research may constrain the statistical power of the correlation analysis. Expanding the sample scale would serve to strengthen data representativeness and statistical validity, ultimately bolstering the reliability of the conclusions. Subsequent studies could further refine the research design by increasing the number of study sites and observation points, extending observation cycles, or integrating multi-temporal data acquisition. By prioritizing the enhancement of temporal synchronization between visual data and thermal simulations to reduce interference from dynamic factors, and simultaneously expanding the sample size to improve stability and precision, future research can establish a more scientifically robust and comprehensive evaluation system. Such advancements will provide a more reliable empirical basis for the optimization of urban street landscapes.
Furthermore, this study focuses on typical summer sunny days in a severe cold region to isolate the maximum thermal stress conditions. While this provides a critical baseline, the current statistical model does not yet account for all weather variations (e.g., overcast days, varying wind speeds). Future research will build upon the threshold identified here to develop a multi-parametric generative model applicable to broader climatic scenarios.

5. Conclusions

By integrating deep learning with ENVI-met simulations, this study establishes a generalized “Heat-Load Dependent Regulation Model” to elucidate the non-linear cooling efficacy of visual greenery. Key conclusions include:
  • Identification of Traffic-Heat-Dependent Thresholds: The cooling capacity of GVI is critically governed by anthropogenic heat intensity. Under Low-to-Moderate Heat Loads (<50 W/m2), greenery maintains a robust, linear cooling efficacy (R2 = 0.421). Conversely, High Heat Loads (≈75 W/m2) trigger a “Phase Transition,” exhibiting a critical “Threshold Effect” at GVI = 22.08%. Beyond this point, a “decoupling phase” emerges where cooling benefits stagnate (R2 = 0.210), confirming that high anthropogenic heat saturates the thermodynamic benefits of vegetation.
  • Mechanism of Thermodynamic Saturation: This decoupling stems from a thermodynamic imbalance where high-intensity anthropogenic heat domes and long-wave radiation exceed the evaporative cooling threshold of vegetation. In commercial canyons, restricted canopy structures fail to neutralize the basal heat load, resulting in extreme thermal stress despite visual greening.
  • Load-Responsive Synergistic Strategy: Urban renewal must shift from “quantity accumulation” to “Load-Responsive Design.” For High-Heat Districts exceeding the 22% threshold, priority must be given to “Source Control” (e.g., cool pavements, ventilation) to lower the thermal baseline and reactivate green infrastructure efficiency. For Low-Heat Districts, increasing canopy density remains a valid strategy for linear comfort improvement. For urban policy, these results advocate for a shift from conventional “percentage-based” greening targets to “performance-based” thresholds in severe cold regions. Planning guidelines should incorporate minimum shading requirements in commercial–service streets to overcome the visual–thermal decoupling and enhance climate resilience in high-density urban cores.
  • Limitations and Outlook: Current findings are limited by static imagery and clear-day scenarios. Future research will incorporate dynamic traffic effects and diverse weather conditions to develop multi-parametric generative models for climate-resilient design.

Author Contributions

Conceptualization, L.F. and Y.Z.; methodology, L.F. and Y.S.; software, Y.S. and Z.L.; validation, L.F., Y.S. and Y.Z.; formal analysis, L.F., Y.S. and Y.Z.; investigation, L.F. and Y.S.; resources, L.F. and Y.Z.; data curation, L.F., Y.S. and Z.L.; writing—original draft preparation, L.F. and Y.S. and Y.Z.; writing—review and editing, L.F. and Y.Z.; visualization, Y.S. and Z.L.; supervision, Y.Z.; project administration, Y.Z.; funding acquisition, L.F. and Y.Z. All authors have read and agreed to the published version of the manuscript.

Funding

This work was supported by Research Fund project of Liaoning Provincial Department of Education (LJ112510157019), Social Science Research Fund project of Liaoning Province (L23BDJ002), and University level Research Fund project of Shenyang Agricultural University (X2022005).

Institutional Review Board Statement

Not applicable.

Informed Consent Statement

Not applicable.

Data Availability Statement

The data that support the findings of this study are available from the corresponding author upon reasonable request.

Acknowledgments

During the preparation of this study, the authors used Deepseek-V3.2 for the purposes of grammar, spelling, punctuation, and formatting. The authors have reviewed and edited the output and take full responsibility for the content of this publication.

Conflicts of Interest

The authors declare no conflicts of interest.

Abbreviations

The following abbreviations are used in this manuscript:
TaAir temperature (°C)
RHRelative Humidity (%)
Va, VWind speed/Wind velocity (m/s)
GSolar radiation (W/m2)
TmrtMean Radiant Temperature (°C)
GVIGreen View Index (%)
PETPhysiological Equivalent Temperature (°C)
SVFSky View Factor (dimensionless/0–1)
SVIStreet View Images
UHIUrban Heat Island
H/W, ARAspect Ratio (dimensionless)
AHAnthropogenic Heat
PvegNumber of vegetation pixels in the image (pixels)
PtotalTotal number of valid pixels in the image (pixels)
dx, dy, dzGrid resolution dimensions (m)
RMSERoot Mean Square Error (variable dependent)
MAPEMean Absolute Percentage Error (%)
MAEMean Absolute Error (variable dependent)
pp-value/Statistical significance level (dimensionless)
rPearson correlation coefficient (dimensionless)
XmeasMeasured values (variable dependent)
YsimSimulated values (variable dependent)

References

  1. Howard, L. The Climate of London: Deduced from Meteorological Observations, Made at Different Places in the Neighbourhood of the Metropolis; W. Phillips: London, UK, 1818; Volume 1. [Google Scholar]
  2. Manley, G. On the Frequency of Snowfall in Metropolitan England. Q. J. R. Meteorol. Soc. 1958, 84, 70–72. [Google Scholar] [CrossRef] [Scilit]
  3. Deilami, K.; Kamruzzaman, M.; Liu, Y. Urban Heat Island Effect: A Systematic Review of Spatio-Temporal Factors, Data, Methods, and Mitigation Measures. Int. J. Appl. Earth Obs. Geoinf. 2018, 67, 30–42. [Google Scholar] [CrossRef] [Scilit]
  4. Mohite, S.; Surawar, M. Impact of Urban Street Geometry on Outdoor Pedestrian Thermal Comfort during Heatwave in Nagpur City. Sustain. Cities Soc. 2024, 108, 105450. [Google Scholar] [CrossRef] [Scilit]
  5. Chiang, Y.-C.; Liu, H.-H.; Li, D.; Ho, L.-C. Quantification through Deep Learning of Sky View Factor and Greenery on Urban Streets during Hot and Cool Seasons. Landsc. Urban Plann. 2023, 232, 104679. [Google Scholar] [CrossRef] [Scilit]
  6. Wang, H.; Che, X.; Yang, X. Investigating Green View Perception in Non-Street Areas by Combining Baidu Street View and Sentinel-2 Images. Sustainability 2025, 17, 7485. [Google Scholar] [CrossRef] [Scilit]
  7. Mihara, K.; Hii, D.J.C.; Takasuna, H.; Sakata, K. How Does Green Coverage Ratio and Spaciousness Affect Self-Reported Performance and Mood? Build. Environ. 2023, 245, 110939. [Google Scholar] [CrossRef] [Scilit]
  8. Jang, S.; Bae, J.; Kim, Y. Street-Level Urban Heat Island Mitigation: Assessing the Cooling Effect of Green Infrastructure Using Urban IoT Sensor Big Data. Sustain. Cities Soc. 2024, 100, 105007. [Google Scholar] [CrossRef] [Scilit]
  9. Araujo, M.K.D.C.D.; Bastos, K.D.O.; Antunes, A.M. Influence of Urban Greenery on Thermal Comfort: A Case Study in a Tropical City. Rev. Nac. Gerenciamento Cid. 2023, 11, 230–240. [Google Scholar] [CrossRef] [Scilit]
  10. Li, Z.; Zhou, L.; Hong, X.; Qiu, S. Outdoor Thermal Comfort and Activities in Urban Parks: An Experiment Study in Humid Subtropical Climates. Build. Environ. 2024, 253, 111361. [Google Scholar] [CrossRef] [Scilit]
  11. Xin, B.; Zhu, C.; Geng, J.; Liu, Y. Emotional Perceptions of Thermal Comfort for People Exposed to Green Spaces Characterized Using Streetscapes in Urban Parks. Land 2024, 13, 1515. [Google Scholar] [CrossRef] [Scilit]
  12. Meng, Y.; Shi, J.; Lyu, M.; Sun, D.; Fukuda, H. Research into the Influence Mechanisms of Visual-Comfort and Landscape Indicators of Urban Green Spaces. Land 2024, 13, 1688. [Google Scholar] [CrossRef] [Scilit]
  13. Khalvandi, R.; Karimimoshaver, M. Urban Street Canyons and Heat Islands: A Systematic Review on Morphological Solutions. Results Eng. 2025, 27, 106542. [Google Scholar] [CrossRef] [Scilit]
  14. Schaefer, M.; Ebrahimi Salari, H.; Köckler, H.; Thinh, N.X. Assessing Local Heat Stress and Air Quality with the Use of Remote Sensing and Pedestrian Perception in Urban Microclimate Simulations. Sci. Total Environ. 2021, 794, 148709. [Google Scholar] [CrossRef] [Scilit] [PubMed]
  15. Ali-Toudert, F.; Mayer, H. Numerical Study on the Effects of Aspect Ratio and Orientation of an Urban Street Canyon on Outdoor Thermal Comfort in Hot and Dry Climate. Build. Environ. 2006, 41, 94–108. [Google Scholar] [CrossRef] [Scilit]
  16. Ren, C.; Zhou, X.; Wang, J.; Chen, G.; Cao, S.-J. Investigation of Air-Conditioning Anthropogenic Heat Dissipation and Thermal Discomfort in Street Canyons toward Sustainable Urban Cooling. Urban Clim. 2025, 64, 102721. [Google Scholar] [CrossRef] [Scilit]
  17. Su, Y.-M.; Antoni, J. Outdoor Thermal Comfort Study on Urban Areas with Various Densities in Taipei. In Proceedings of the IEEE ICEIB 2023, Taichung, Taiwan, 14-16 April 2023; MDPI: Basel, Switzerland, 2023; p. 77. [Google Scholar]
  18. Cohen, P.; Potchter, O.; Matzarakis, A. Daily and Seasonal Climatic Conditions of Green Urban Open Spaces in the Mediterranean Climate and Their Impact on Human Comfort. Build. Environ. 2012, 51, 285–295. [Google Scholar] [CrossRef] [Scilit]
  19. Perini, K.; Magliocco, A. Effects of Vegetation, Urban Density, Building Height, and Atmospheric Conditions on Local Temperatures and Thermal Comfort. Urban For. Urban Green. 2014, 13, 495–506. [Google Scholar] [CrossRef] [Scilit]
  20. Wang, Q.; Hu, Y.; Yan, H. Research on the Mechanism of the Impact of Green View Index of Urban Streets on Thermal Environment: A Machine Learning-Driven Empirical Study in Hangzhou, China. Atmosphere 2025, 16, 617. [Google Scholar] [CrossRef] [Scilit]
  21. Wang, Q.; Sun, W.; Tang, S.; Zhou, X. SVI-GVI Integration for Thermal Comfort in Urban Parks: A Case Study of Changchun in Cold Regions. Theor. Appl. Climatol. 2025, 156, 318. [Google Scholar] [CrossRef] [Scilit]
  22. Donthu, E.V.S.K.K.; Kyriakodis, G.-E.; Zhang, X.; Long, Y.P.; Wan, M.P.; Bozonnet, E. Simulation Advances with EnviBatE- a Case Study on Urban Heat Island Mitigation in Singapore. Build. Environ. 2024, 258, 111580. [Google Scholar] [CrossRef] [Scilit]
  23. Kim, S.W.; Brown, R.D. Development of a Micro-Scale Heat Island (MHI) Model to Assess the Thermal Environment in Urban Street Canyons. Renew. Sustain. Energy Rev. 2023, 184, 113598. [Google Scholar] [CrossRef] [Scilit]
  24. Mohammad, P.; Aghlmand, S.; Fadaei, A.; Gachkar, S.; Gachkar, D.; Karimi, A. Evaluating the Role of the Albedo of Material and Vegetation Scenarios along the Urban Street Canyon for Improving Pedestrian Thermal Comfort Outdoors. Urban Clim. 2021, 40, 100993. [Google Scholar] [CrossRef] [Scilit]
  25. Zuckerman, N.; Shiloah, N.; Lensky, I.M. Quantifying the Impact of Vertical Greenery Systems (VGS) on Mediterranean Urban Microclimate during Heat Wave Events. Build. Environ. 2025, 267, 112151. [Google Scholar] [CrossRef] [Scilit]
  26. Hu, Y.; Qian, F.; Yan, H.; Middel, A.; Wu, R.; Zhu, M.; Han, Q.; Zhao, K.; Wang, H.; Shao, F.; et al. Which Street Is Hotter? Street Morphology May Hold Clues -Thermal Environment Mapping Based on Street View Imagery. Build. Environ. 2024, 262, 111838. [Google Scholar] [CrossRef] [Scilit]
  27. Liu, J.; Zheng, B.; Yang, F. A Simulation Study of the Impact of Urban Street Greening on the Thermal Comfort in Street Canyons on Hot and Cold Days. Forests 2023, 14, 2256. [Google Scholar] [CrossRef] [Scilit]
  28. Fan, L.; Zhao, M.; Huo, J.; Sha, Y.; Zhou, Y. The Impact of Vegetation Layouts on Thermal Comfort in Urban Main Streets: A Case Study of Youth Street in Shenyang. Sustainability 2025, 17, 1755. [Google Scholar] [CrossRef] [Scilit]
  29. Sui, Q.; Jia, H.; Zhao, M.; Zhou, Y.; Fan, L. Quantitative Evaluation of Ecosystem Services of Urban Street Trees: A Case Study of Shengjing Historical and Cultural Block in Shenyang, China. Sustainability 2023, 15, 2532. [Google Scholar] [CrossRef] [Scilit]
  30. Su, L.; Chen, W.; Li, J.; Zhou, Y.; Fan, L. Analysis and Optimization of Urban Street Landscape Based on GVI and NDVI. J. Northwest For. Univ. 2024, 39, 256–264. [Google Scholar]
  31. Xu, X.; Niu, L. Analysis of Influencing Factors of Green View Index Based on Street View Segmentation. Int. Arch. Photogramm. Remote Sens. Spat. Inf. Sci. 2024, XLVIII-4-2024, 517–524. [Google Scholar] [CrossRef] [Scilit]
  32. Zhang, J.; Hu, A. Analyzing Green View Index and Green View Index Best Path Using Google Street View and Deep Learning. J. Comput. Des. Eng. 2022, 9, 2010–2023. [Google Scholar] [CrossRef] [Scilit]
  33. Liu, S.; Zhao, J.; Chen, Y.; Zhang, S. Urban Morphology Classification and Organizational Patterns: A Multidimensional Numerical Analysis of Heping District, Shenyang City. Buildings 2024, 14, 3157. [Google Scholar] [CrossRef] [Scilit]
  34. Zhang, G.; Yi, J.; Yuan, J.; Li, Y.; Jin, D. DAS: Efficient Street View Image Sampling for Urban Prediction. ACM Trans. Intell. Syst. Technol. 2023, 14, 1–20. [Google Scholar] [CrossRef] [Scilit]
  35. Roth, M.; Chow, W.T.L. A Historical Review and Assessment of Urban Heat Island Research in Singapore. Singapore J. Trop. Geogr. 2012, 33, 381–397. [Google Scholar] [CrossRef] [Scilit]
  36. Sailor, D.J. A Review of Methods for Estimating Anthropogenic Heat and Moisture Emissions in the Urban Environment. Int. J. Climatol. 2011, 31, 189–199. [Google Scholar] [CrossRef] [Scilit]
  37. Hu, J.; Du, Y.; Ma, Y.; Liu, D.; Chen, L. Investigating Spatial Variation Characteristics and Influencing Factors of Urban Green View Index Based on Street View Imagery—A Case Study of Luoyang, China. Sustainability 2025, 17, 10208. [Google Scholar] [CrossRef] [Scilit]
  38. Ji, Q.; Zhou, S.; Zhang, L.; Yuan, Y.; Wu, L.; Tang, F.; Wu, J.; Meng, Y.; Zhang, Y. Urban Greening Strategies and Ecosystem Services: The Differential Impact of Street-Level Greening Structures on Housing Prices. Forests 2025, 16, 1713. [Google Scholar] [CrossRef] [Scilit]
  39. Huang, Z.; Duan, L.; Xu, Y.; Yang, S.; Lin, Z.; Yue, H.; Yang, J. Exploring the Influence of Urban Green Space and Ur-ban Morphology on Urban Heat Islands Using Street View and Satellite Imagery. Sci. Rep. 2025, 15, 23759. [Google Scholar] [CrossRef] [Scilit]
  40. Zhu, J.; Huang, Y.; Cao, Z.; Zhang, Y.; Ding, Y.; Du, J. Evaluating Urban Greenery through the Front-Facing Street View Imagery: Insights from a Nanjing Case Study. ISPRS Int. J. Geo-Inf. 2025, 14, 287. [Google Scholar] [CrossRef] [Scilit]
  41. Cao, Y.; Fang, C.; Li, G.; Feng, Y.; Li, L.; Sun, J. Asymmetric Thermal Effects of Urban Vegetation Greening and Browning. Land Use Policy 2026, 160, 107833. [Google Scholar] [CrossRef] [Scilit]
  42. Gou, A.; Wang, X.; Wang, J.; Wang, C.; Tan, G. Spatial Pattern and Heterogeneity of Green View Index in Mountainous Cities: A Case Study of Yuzhong District, Chongqing, China. Sci. Rep. 2025, 15, 12576. [Google Scholar] [CrossRef] [Scilit]
  43. Wai, K.-M. Is Integrating Tree-Planting Strategies with Building Array Sufficient to Mitigate Heat Risks in a Sub-Tropical Future City? Buildings 2025, 15, 1913. [Google Scholar] [CrossRef] [Scilit]
  44. Aminipouri, M.; Knudby, A.J.; Krayenhoff, E.S.; Zickfeld, K.; Middel, A. Modelling the Impact of Increased Street Tree Cover on Mean Radiant Temperature across Vancouver’s Local Climate Zones. Urban For. Urban Green. 2019, 39, 9–17. [Google Scholar] [CrossRef] [Scilit]
  45. Chen, L.; Yu, B.; Yang, F.; Mayer, H. Intra-Urban Differences of Mean Radiant Temperature in Different Urban Settings in Shanghai and Implications for Heat Stress under Heat Waves: A GIS-Based Approach. Energy Build. 2016, 130, 829–842. [Google Scholar] [CrossRef] [Scilit]
  46. Lau, K.K.-L.; Lindberg, F.; Rayner, D.; Thorsson, S. The Effect of Urban Geometry on Mean Radiant Temperature under Future Climate Change: A Study of Three European Cities. Int. J. Biometeorol. 2015, 59, 799–814. [Google Scholar] [CrossRef] [Scilit]
  47. Dissegna, M.A.; Yin, T.; Wu, H.; Lauret, N.; Wei, S.; Gastellu-Etchegorry, J.-P.; Grêt-Regamey, A. Modeling Mean Radiant Temperature Distribution in Urban Landscapes Using DART. Remote Sens. 2021, 13, 1443. [Google Scholar] [CrossRef] [Scilit]
  48. Zhong, X.; Voogt, J.; Bailey, B.; Zhang, X.; Krayenhoff, E.S. Evaluating High-Resolution Mean Radiant Temperature within an Urban Street Canopy: Resolving Spatiotemporal Variations with LiDAR/Thermal Infrared Scanning and Data-Driven Simulation. Build. Environ. 2026, 287, 113819. [Google Scholar] [CrossRef] [Scilit]
  49. Priya, U.K.; Senthil, R. Enhancing Sustainable Urban Planning to Mitigate Urban Heat Island Effects through Residential Greening. Sustain. Cities Soc. 2025, 129, 106512. [Google Scholar] [CrossRef] [Scilit]
  50. Guo, D.; Chen, S.S. Spatial Mismatching of Residents’ Visible Greening with Green Coverage under the Influence of Urban Morphology. Ecosyst. Health Sustain. 2025, 11, 0359. [Google Scholar] [CrossRef] [Scilit]
  51. Zhou, L.; Li, X.; Huang, Z.; Tan, C.; Huang, H.; Du, H. Enhanced Interpretation of Green Space Surface for Land Surface Temperature through a Novel Voxel-Based Landscape Index from UAV LiDAR. Urban For. Urban Green. 2025, 104, 128623. [Google Scholar] [CrossRef] [Scilit]
  52. Zhou, T.; Jia, W.; Yan, L.; Hong, B.; Wang, K. Urban Park’s Vertical Canopy Structure and Its Varied Cooling Effect under Continuous Warming Climate. Urban Clim. 2024, 53, 101819. [Google Scholar] [CrossRef] [Scilit]
  53. Fischereit, J. The Simple Urban Radiation Model for Estimating Mean Radiant Temperature in Idealised Street Canyons. Urban Clim. 2021, 35, 100694. [Google Scholar] [CrossRef] [Scilit]
  54. Su, Y.; Wang, X.; Xuan, L.; Wu, T.; Ge, X.; Wang, Z.; Duan, J.; Yang, M. Analysis of the Correlation Mechanism between Geometric Parameters and the Thermal Environment of Xi’an’s Summer Outdoor Commercial Pedestrian Streets. Int. J. Biometeorol. 2024, 68, 909–925. [Google Scholar] [CrossRef] [Scilit] [PubMed]
  55. Chen, X.; Han, M.; He, J.; Ma, H.; Han, M.; Liu, Y.; Wu, X. Integrated Effect of Aspect Ratio and Tree Spacing on Pedestrian Thermal Comfort of Street Canyon. Int. J. Biometeorol. 2024, 68, 2115–2131. [Google Scholar] [CrossRef] [Scilit] [PubMed]
  56. Haeri, T.; Hassan, N.; Ghaffarianhoseini, A. Evaluation of Microclimate Mitigation Strategies in a Heterogenous Street Canyon in Kuala Lumpur from Outdoor Thermal Comfort Perspective Using Envi-Met. Urban Clim. 2023, 52, 101719. [Google Scholar] [CrossRef] [Scilit]
  57. Lee, H.; Mayer, H.; Kuttler, W. To What Extent Does the Air Flow Initialisation of the ENVI-Met Model Affect Human Heat Stress Simulated in a Common Street Canyon? Int. J. Biometeorol. 2019, 63, 73–81. [Google Scholar] [CrossRef] [Scilit]
  58. Abaas, Z.R. Impact of Development on Baghdad’s Urban Microclimate and Human Thermal Comfort. Alex. Eng. J. 2020, 59, 275–290. [Google Scholar] [CrossRef] [Scilit]
  59. Li, J.; You, W.; Peng, Y.; Ding, W. Exploring the Potential of the Aspect Ratio to Predict Flow Patterns in Actual Urban Spaces for Ventilation Design by Comparing the Idealized and Actual Canyons. Sustain. Cities Soc. 2024, 102, 105214. [Google Scholar] [CrossRef] [Scilit]
  60. Badas, M.G.; Ferrari, S.; Garau, M.; Seoni, A.; Querzoli, G. On the Flow Past an Array of Two-Dimensional Street Canyons between Slender Buildings. Bound.-Layer Meteorol 2020, 174, 251–273. [Google Scholar] [CrossRef] [Scilit]
  61. Shata, R.O.; Mahmoud, A.H.; Fahmy, M. Correlating the Sky View Factor with the Pedestrian Thermal Environment in a Hot Arid University Campus Plaza. Sustainability 2021, 13, 468. [Google Scholar] [CrossRef] [Scilit]
  62. Lee, H.; Mayer, H. Maximum Extent of Human Heat Stress Reduction on Building Areas Due to Urban Greening. Urban For. Urban Green. 2018, 32, 154–167. [Google Scholar] [CrossRef] [Scilit]
  63. Lindberg, F.; Wallenberg, N.; Thorsson, S.; Haeger-Eugensson, M.; Lönn, J.; Holmberg, B.; Frid, M.; Fahlström, J. Micro-Scale, City-Wide Analysis of Outdoor Thermal Comfort during Heatwaves in High Latitude Cities: Influence of Building Geometry and Vegetation. Int. J. Biometeorol. 2025, 69, 3421–3434. [Google Scholar] [CrossRef] [Scilit]
  64. Liang, C.; Jiang, H.; Yang, S.; Tian, P.; Ma, X.; Tang, Z.; Wang, H.; Wang, W. Characterizing Street Trees in Three Metropolises of Central China by Using Street View Data: From Individual Trees to Landscape Mapping. Ecol. Inform. 2024, 80, 102480. [Google Scholar] [CrossRef] [Scilit]
  65. Liu, Q.; Dong, Q.; Zhang, L.; Sun, C. Summer Cooling Island Effects of Blue-Green Spaces in Severe Cold Regions: A Case Study of Harbin, China. Build. Environ. 2024, 257, 111539. [Google Scholar] [CrossRef] [Scilit]
  66. Li, X.-X.; Liu, X. Effect of Tree Evapotranspiration and Hydrological Processes on Urban Microclimate in a Tropical City: A WRF/SLUCM Study. Urban Clim. 2021, 40, 101009. [Google Scholar] [CrossRef] [Scilit]
  67. Almalla, R.; Marino, M.D. Green Infrastructure’s Potential Effects on Climate Change Adaptation in Cold-Climate Countries: A Critical Literature Review. Sustain. Dev. 2025, 33, 8110–8131. [Google Scholar] [CrossRef] [Scilit]
Figure 1. Experimental flowchart.
Sustainability 18 03187 g001
Figure 2. Comparison between simulated and measured meteorological parameters across six street canyons: (a) Ta; (b) RH. Note: The black dashed line is the 1:1 reference line, indicating perfect agreement between measured and simulated values.
Sustainability 18 03187 g002
Figure 3. Comparison of simulated Mean Radiant Temperature (Tmrt) among six sample streets during the peak heat stress time (14:00). Note: ANOVA was performed (F = 6.28, p < 0.05). Lowercase letters (a, b, ab) above the bars indicate results of post-hoc multiple comparison analysis. Different letters indicate significant differences in Tmrt between street sites, while the same letter indicates no significant difference (p < 0.05).
Sustainability 18 03187 g003
Figure 4. The daily temperature variations at various measurement points in different street spaces.
Sustainability 18 03187 g004
Figure 5. Spatial distribution characteristics of Green View Index (GVI) along survey points for six sample streets. Note: (a,b) are ecological and recreational types, showing a high and stable trend; (c,d) are historical and cultural types; (e,f) are commercial and service types, characterized by intense fluctuations.
Sustainability 18 03187 g005
Figure 6. Bivariate scatter plot of GVI vs. PET. Colors denote three street categories: green for Ecological Streets, orange for Historical Streets, and red for Commercial Streets. The solid/dashed lines represent the linear regression trends for each category, and the shaded areas indicate the 95% confidence intervals around the trends.
Sustainability 18 03187 g006
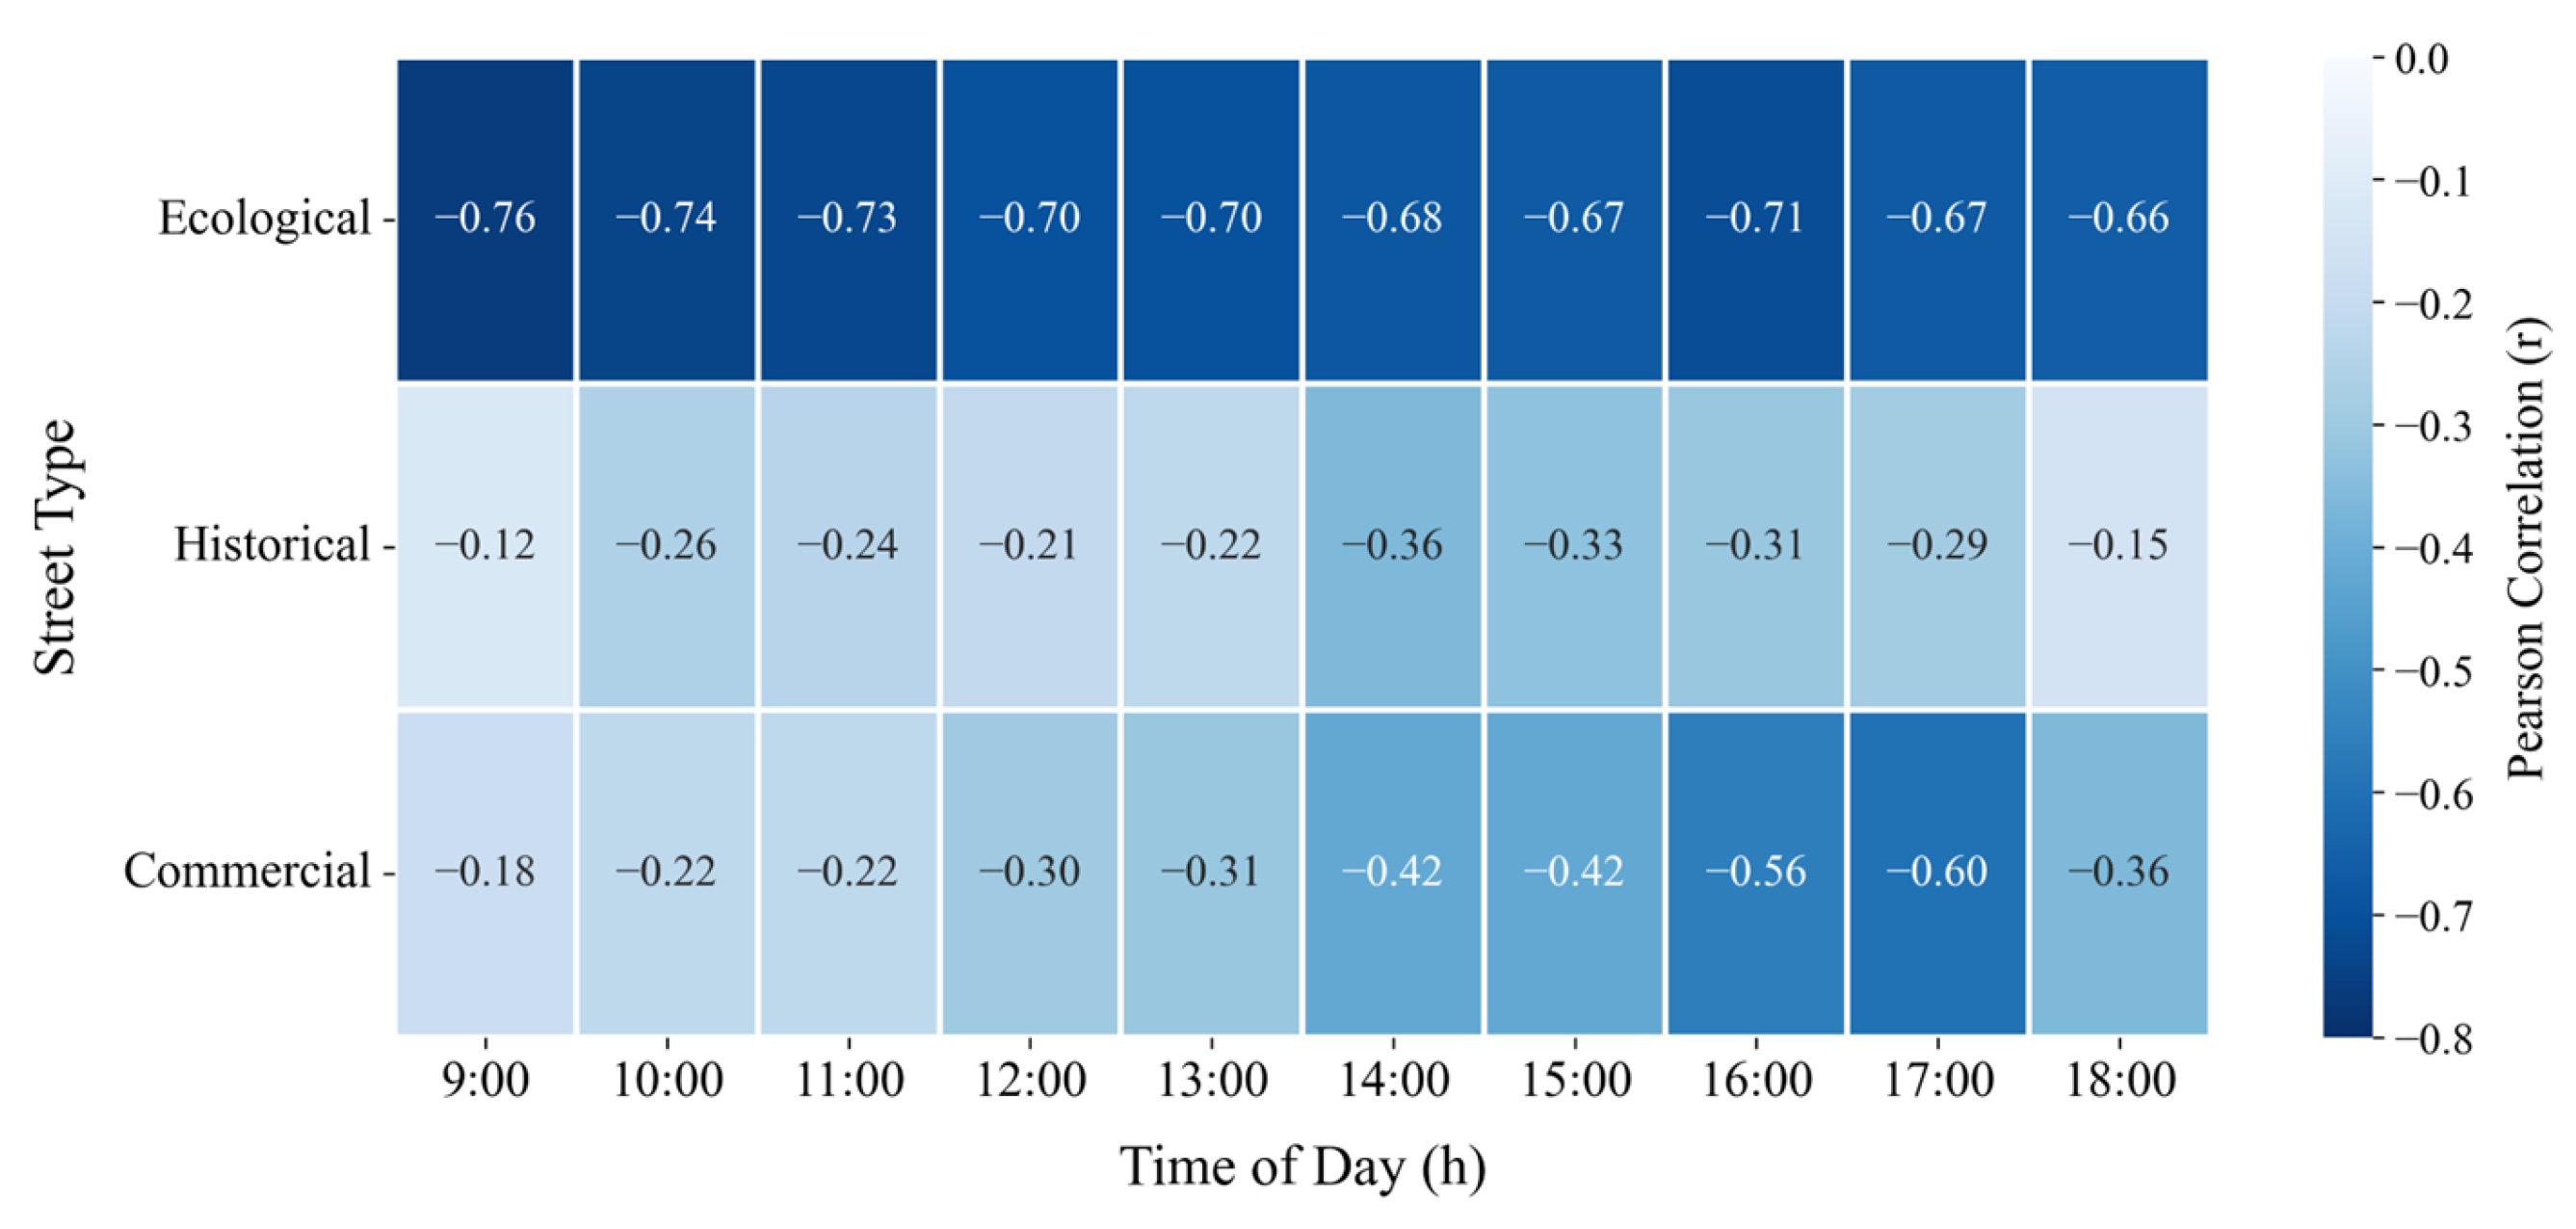
Figure 7. Temporal evolution of the Pearson correlation coefficient between GVI and PET across different street functional types.
Sustainability 18 03187 g007
Figure 8. Non-linear threshold identification of green cooling benefits in commercial canyons compared to the linear response in ecological environments. Note: Top panels illustrate the model fit comparison for commercial (left) and ecological (right) street types. For commercial streets, the piecewise model (red dashed line, R2 = 0.21) identifies a threshold effect: the cooling benefit of greenery significantly diminishes (slope changes from −0.454 to −0.109) when GVI exceeds 22.1%, while the quadratic model (blue solid line, R2 = 0.19) shows a weaker non-linear trend. For ecological streets, the linear model (green dashed line, R2 = 0.37) and quadratic model (blue solid line, R2 = 0.42) both indicate a consistent negative linear relationship between GVI and PET. Bottom panels present the residual analysis of the quadratic model: blue dots represent residuals (differences between observed and fitted PET values), and the black dashed line is the y = 0 reference line to evaluate residual randomness. Commercial model residuals are not significant (pχ2 = 0.675), while ecological model residuals are significant (pχ2 = 0.032), supporting the appropriateness of the quadratic model for ecological streets.
Sustainability 18 03187 g008
Figure 9. Conceptual diagram of street heat balance mechanism. Note: Blue and light blue arrows indicate evapotranspiration cooling (heat loss through vegetation transpiration), while red arrows represent anthropogenic heat release, radiation trapping, or direct heat dissipation. Scenarios are color-coded to reflect thermal intensity: cool blue tones for ecological streets (strong/moderate cooling), neutral tones for historical streets (mild/minimal cooling), and warm red tones for commercial streets (trapped heat/moderate heat). Each panel is labeled with its street configuration and corresponding cooling/heating effect.
Sustainability 18 03187 g009
Figure 10. Comparison of vertical microclimatic profiles between the commercial–service street and the ecological–recreational street at 14:00: (a) vertical wind velocity vectors; (b) potential temperature distribution.
Sustainability 18 03187 g010
Figure 11. Conceptual framework: decoupling mechanism and design strategy thresholds in commercial street canyons.
Sustainability 18 03187 g011
Table 1. Sample Catalog of Street Green Spaces.
Street NameFunctional
Type
Planting
Configuration
Aspect Ratio
(H/W)
Pavement
Material
(Hardscape %)
Traffic
Heat
(W/m2)
Vegetation
Structure
SVFTmrt
(°C)
Wenhua
Rd
CommercialThree-section, four-belt1.2
(Deep Canyon)
> 85%
(Asphalt/Concrete)
High
(~75)
Restricted Canopy (Bonsai-like; Trees only, no understory)0.35
\(Low)
52.5
Eleven latitude
Rd
CommercialSingle-section, two-belt1.4
(Deep Canyon)
>90%
(Fully Impervious)
High
(~75)
Sparse Single-layer (Small canopy street trees)0.30
(Very Low)
43.5
Ningbo
Rd
EcologicalThree-section, four-belt0.5
(Open)
<50% (Permeable/High Vegetation)Low
(~15)
Complete Multi-layer (Tree-Shrub-Grass integration)0.68
(High)
43.2
Youth
St
EcologicalSingle-section, two-belt0.6 (Semi-open)60–70% (Partially Impervious)Medium
(~30)
Dense Single-layer (Large tree canopy)0.60 (Relatively High)50.5
Nanshuncheng
Rd
HistoricalThree-section, four-belt0.7
(Medium)
60%
(Mixed Paving)
Medium
(~40)
Semi-multi-layer (With shrubs, neatly trimmed)0.55
(Medium)
50.5
Heping North
St
HistoricalSingle-section, two-belt0.9
(Medium Canyon)
75% (Predominantly Impervious)Medium
(~40)
Mature Single-layer (Ancient trees, high trunk)0.45 (Medium–Low)49.6
Note: Deep Canyon: Refers to a street segment with a high aspect ratio (H/W > 1.2), where the relatively narrow street width and tall building heights significantly restrict sky visibility and solar access. Medium/Open Canyon: Refers to street geometries with aspect ratios (H/W) between 0.5 and 1.0, characterized by better ventilation potential and increased exposure to direct solar radiation. Bonsai-like: A qualitative descriptor for street greenery characterized by high visual coverage (GVI) but low ecological volume; typically consists of ornamental, small-canopy trees or potted plants that offer minimal shading or evapotranspiration benefits. Multi-layer/Single-layer: ‘Multi-layer’ denotes a complex vegetation structure integrating trees, shrubs, and grass, providing maximum cooling via shading and transpiration; ‘Single-layer’ refers to simpler configurations, often only street trees with impervious understory. Hardscape %: The proportion of impervious surfaces (e.g., asphalt, concrete) within the street canyon, which contributes to increased sensible heat flux and elevated PET levels. Traffic Heat (W/m2): Represents the estimated peak anthropogenic heat flux derived from vehicle volume and emission factors, specifically incorporated to account for thermal stress in high-intensity commercial corridors.
Table 2. Modeling Parameter Settings for Each Subdistrict.
Study Site Grid Resolution (m)Grid Dimensions (x, y, z)Model Diagram
Eleven latitude Rddx = 2, dy = 2, dz = 2109 × 170 × 60Sustainability 18 03187 i001
Wenhua Rddx = 2, dy = 2, dz = 2122 × 170 × 55Sustainability 18 03187 i002
Youth Stdx = 2, dy = 2, dz = 2322 × 123 × 90Sustainability 18 03187 i003
Ningbo Rddx = 2, dy = 2, dz = 2345 × 116 × 100Sustainability 18 03187 i004
Heping North Stdx = 2, dy = 2, dz = 2109 × 169 × 20Sustainability 18 03187 i005
Nanshuncheng Rddx = 2, dy = 2, dz = 2116 × 146 × 27Sustainability 18 03187 i006
Note: Gray blocks represent urban buildings; light green areas denote urban green spaces (e.g., lawns, planted beds); dotted green patterns indicate tree/vegetation distribution; the dotted background represents paved roads or open urban spaces.
Table 3. Quantitative validation metrics for meteorological variables across selected streets.
VariableStreetMAERMSEPearson_rp-Value
TemperatureWenhua Rd0.870.920.7290.02
TemperatureEleven Latitude Rd0.640.780.907<0.01
TemperatureNingbo Rd1.311.510.799<0.01
TemperatureYouth St0.730.930.782<0.01
TemperatureNanshuncheng Rd0.320.420.936<0.01
TemperatureHeping North St0.590.700.826<0.01
HumidityWenhua Rd2.843.280.6240.05
HumidityEleven Latitude Rd4.464.770.7600.01
HumidityNingbo Rd5.586.290.5780.08
HumidityYouth St4.545.210.5880.07
HumidityNanshuncheng Rd2.042.710.770<0.01
HumidityHeping North St2.893.620.7520.01
Table 4. Statistics on the green vision rate of samples from each street.
Street NamePlanting ConfigurationMean GVI (%)GVI Variation (%)
Eleven latitude RdSingle-section, two-belt29.0017.32
Wenhua RdThree-section, four-belt24.5020.72
Youth StSingle-section, two-belt25.2925.96
Ningbo RdThree-section, four-belt50.8540.57
Heping North StSingle-section, two-belt25.2130.44
Nanshuncheng RdThree-section, four-belt40.6635.32
Disclaimer/Publisher’s Note: The statements, opinions and data contained in all publications are solely those of the individual author(s) and contributor(s) and not of MDPI and/or the editor(s). MDPI and/or the editor(s) disclaim responsibility for any injury to people or property resulting from any ideas, methods, instructions or products referred to in the content.