Article

Assessing Circular Economy and Sustainability Business Strategies in Fast Fashion: A Fuzzy Cognitive Maps Approach


1
Department of Economic Science, University of Salento, 73100 Lecce, Italy
2
Department of Engineering for Innovation, University of Salento, 73100 Lecce, Italy
*
Author to whom correspondence should be addressed.
Sustainability 2026, 18(6), 3141; https://doi.org/10.3390/su18063141
Submission received: 15 February 2026 / Revised: 17 March 2026 / Accepted: 20 March 2026 / Published: 23 March 2026

Abstract

The fashion industry is one of the most resource-intensive sectors, generating major environmental impacts such as greenhouse gas emissions, excessive water and land use, and pollution from waste and microplastics. Fast fashion intensifies these issues through overproduction and overconsumption. However, growing consumer awareness and regulatory pressure are pushing brands to adopt Circular Economy (CE) and sustainability strategies, including resale platforms, recycling programs, and sustainability frameworks. Despite these efforts, their real effectiveness remains uncertain. This study investigates which CE and sustainability strategies are most common among fast fashion companies and how they can mitigate key environmental impacts. Using a Fuzzy Cognitive Maps (FCM) model, the research quantitatively evaluates the effects of various circular and sustainable strategies across the supply chain. Ten key strategies were identified, revealing that isolated actions are often ineffective. Instead, an integrated, systemic approach combining multiple initiatives is essential to achieve meaningful sustainability improvements.

1. Introduction

In recent years, attention towards the sustainability aspects of the fashion industry has been growing, due to its significant environmental impacts [1]. The textile and fashion sector is estimated to be among the five most impacting worldwide in terms of resource consumption, greenhouse gases (GHG) emissions, water and land use [2], due to both the production and consumption phases. On the producers’ side, the production of fibers (natural or synthetic) requires land and water use and implies a massive use of hazardous chemicals, so as garments manufacturing, which often presents also significant social impacts [3,4]. On the consumers’ side, one critical problem is due to the release of microplastics in the ocean through the washing process [5]. At the same time, it has been estimated that more than 70% of clothing globally ends up in landfill or incinerated, with an enormous waste of resources [6]. The sector is globally characterized by overproduction and overconsumption, as the volume of garments produced and sold has been increasing drastically in recent decades, and the trend is not expected to change soon [7,8].
Considering the social dimension, the textile and fashion industry is often criticized for exploitative working conditions, as companies often produce their garments in low- and middle-income countries, where labor is cheaper and labor regulations are less rigorous than western countries [9,10]. The lack of adequate social, environmental and safety standards in these countries generates unacceptable social impacts, such as labor exploitation, including child labor, low wages, and unhealthy work environments [11].
Furthermore, the spread of fast fashion models is contributing to increase environmental impacts of the sector. Fast fashion has been defined as “a business model based on offering consumers frequent novelty in the form of low-priced, trend-led products” [4]. This business model is essentially based on overproduction and overconsumption, pushing customers to buy frequently and more than what’s necessary in order to keep up with fashion trends, offering low-quality and short-lasting products [4,10,12]. This type of business model is inherently challenging for sustainability, entailing several environmental as well as social burdens [9,13].
As consumer and societal awareness of the environmental impacts of fast fashion grows, both political and market pressures are driving change within fashion supply chains and, consequently, within the fast fashion sector. One example is the initiative recently carried out by the European Commission defined as “Strategy for Sustainable and Circular Textiles” [14,15], aiming at creating a greener and more resilient fashion industry through the implementation of circular strategies, such as garments life extension, repair and recycling, use of recycled materials, and enhancing transparency along the supply chain through the digital product passport. Another notable example is the so-defined “anti-fast fashion bill” approved by the French Senate in June 2025, proposing a set of measures aiming at discouraging aggressive overproduction strategies, like eco-taxes and advertising bans [16]. Alongside institutional initiatives, consumers have started to request greener products, thereby influencing the way fashion companies engage with sustainability challenges [17,18]. Thus, in recent years numerous fast fashion companies have undertaken efforts to address these concerns, formulating and implementing strategies aimed at first at enhancing their sustainability performance and, more recently, at advancing circularity [19]. Specifically, by “sustainability strategies” we refer to all actions aimed at addressing challenges related to the development of more sustainable production and consumption models, in line with the Sustainable Development Goals (Goal 12—Ensure sustainable consumption and production patterns) [20]. These include, for example, the efficient use of natural resources, the use of renewable energy sources, the adoption of less polluting materials and processes. By “CE strategies” we refer to actions that aim to improve sustainability by increasing the circularity of the system considered. These include actions designed to close material loops, reduce material consumption, extend product lifetimes, and other measures included in the so-called “10R framework” [21]. While the discussion on the three dimensions of sustainability is not new to the fast fashion sector [22], only recently have fast fashion companies begun to implement circular actions to achieve environmental sustainability [19], as a strategic response to heightened consumer awareness and growing regulatory pressures [10,13,23]. This trend is also confirmed by recent strategies adopted by some companies: H&M enables resell on physical and online stores [24]; ASOS developed a Circularity Framework, to support the company’s transition towards a CE [25]; Mango installed “recycling boxes” in all of its stores to allow the collection of used garments, which are then destined to reuse, recycling or energy recovery [26].
From a literature perspective, few recent studies focused on analyzing the sustainability efforts of fast fashion companies [3,10,22] and their impacts on consumer behaviors [12,27]. Scholars argue that this change could occur if both consumers’ requests and companies’ offers align towards a more sustainable production and consumption model [11].
However, while the environmental hotspots of the fast fashion sector are well-known [4], the effectiveness of CE and sustainability strategies of fast fashion brands in reducing their environmental impact is still unclear. Researchers have predominantly focused on identifying the efforts of such brands to increase sustainability, while their actual impacts on the environment have not been investigated yet. Recent research highlights the lack of transparency in sustainability reporting regarding the environmental impacts of fast fashion supply chains [10]. Moreover, academics have been discussing the risk of greenwashing in the fashion sector [28,29,30], and the recent literature suggests the necessity to investigate the rebound effects related to circular and sustainable practices in this industry [31].
This study aims to investigate this issue, focusing on the potential influence that the main CE and sustainability strategies in the fast fashion supply chain could have on the environmental performance of the sector. While acknowledging the multidimensional nature of sustainability, encompassing also social aspects, the environmental and social dimensions often require distinct analytical frameworks and methodological approaches. Given the scope of this research, concentrating on the environmental dimension allows for a more consistent and in-depth analysis of fast fashion CE and sustainability strategies, while confirming that social sustainability remains a critical and complementary area for future investigation. Therefore, the following research questions are addressed in this study:
  • RQ1: what are the main CE and sustainability strategies currently adopted by fast fashion companies?
  • RQ2: which of these strategies can be most effective in reducing the main environmental impacts identified in this sector?
Starting from the identification of the most adopted CE and sustainability strategies in the fast fashion sector, this work proposes a tool based on Fuzzy Cognitive Maps (FCM) approach to evaluate the environmental impact of such strategies. The contribution of this work is multi-fold, including theoretical, methodological, and practical aspects: it contributes to the literature on CE in the fast fashion industry by representing CE and sustainability strategies with a systems-thinking perspective, showing the applicability of the FCM approach to analyze and prioritize such strategies in according to their potential environmental benefits. Ultimately, this study aims at providing indications for practitioners and policy makers useful to prioritize CE and sustainability interventions in fast fashion, supporting decision-making.
The paper is organized as follows: the state of the art about the main environmental impacts of fast fashion, together with the most widespread CE and sustainability strategies currently adopted in this sector, are presented in Section 2. The methodology adopted for assessing their effectiveness is detailed in Section 3, while results are presented in Section 4. Finally, Section 5 and Section 6 provide a discussion of the results and summarize conclusions, respectively.

2. State of the Art

2.1. The Fast Fashion Model and Its Main Environmental Impacts: A Quick Review

The fast fashion model is based on the production of large quantities of clothing, responding to the latest fashion trends, providing garments at affordable prices and on very fast production cycles [4,32]. Specifically, the main characteristics of this model can be summarized as follows:
  • Trend imitation: Fast fashion relies on the ability to quickly imitate luxury brands’ fashion trends and create cheaper copies that are only available for a short period of time [27].
  • Rapid production: Clothing items are designed and produced in very short times, often a few weeks, in order to respond quickly to the latest emerging trends [33,34].
  • Reduced costs: Due to the speed of production, fast fashion companies try to keep production costs as low as possible. This characteristic involves the use of low-cost labor in countries of the Global South, as well as the use of cheap materials [34].
  • Low-priced and low-quality products: Fast fashion products are therefore affordable for a vast pool of customers, but the quality of garments is usually low, which often discourages reuse and repair [35].
As a consequence, the impact of this business model on sustainability performance is two-fold: on one side, it is contributing to the global increase in clothing production, which has almost doubled from 2000 to 2015; on the other side, the average utilization of clothing is decreasing, as customers are buying more garments and wearing them less [4,6,13,36,37]. By enhancing the access to low-cost garments, the fast fashion business model is fostering apparel overconsumption, contributing to increase the massive environmental impacts related to the fashion industry [34]. This is also confirmed by a recent publication by the European Commission, where textiles and clothing consumption has been evaluated as the fourth main contributor to climate change, after the food, housing and mobility sectors [15].
Another issue to consider is related to water consumption and pollution as relevant impacts. Water use is extensive for both natural and plastic fibers production, as well as in the manufacturing processes and during the customer use phase [3,11,35,38,39]. Water pollution is mainly due to the dyeing and finishing processes: it is estimated that textile production, a step of the fashion supply chain, is responsible for around 20% of global drinking water pollution, while the washing of synthetic garments releases 0.5 million tons of microplastics into the seas every year [3,11,13]. The use of hazardous chemicals is also a critical point in most processes in the supply chain: the agricultural phase entails massive use of chemicals such as pesticides, herbicides and insecticides, which can affect both human health and soil biodiversity; the textile finishing processes also contribute, using different sorts of chemicals to obtain some fabrics’ desired characteristics, representing a threat for the health of both workers and consumers [4,40]. Energy consumption is relevant all along the supply chain, from fiber production to consumer use, and it is associated with resource depletion and CO2eq emissions [3,35,38]. Finally, waste generation is one of the most debated and critical impacts, originating from both pre- and post-consumer phases. The Ellen MacArthur Foundation estimated that globally more than 70% of material flows in the clothing industry ends up being landfilled of incinerated, with enormous waste of resources, and another 12% of the material losses happen during the production stage, while only 12% of the materials are recycled for lower-value applications, and less than 1% for the clothing industry [6].
Another typical problem of the fast fashion supply chain is the shortened lifetime of garments. Combined with increasing consumption trends, this has led to a global rise in textile waste. Not only do used garments enter the waste stream, as in traditional fashion supply chains, but unsold or returned clothes from the fast fashion industry are also frequently discarded, despite never having been sold, often due to overproduction [10]. Furthermore, used clothing from industrialized countries is often sold in second-hand markets in countries of the Global South, where unsold items eventually become textile waste, further straining local waste management systems [4,9,41].
In brief, all activities related to the fashion supply chain generate a wide range of environmental impacts, including greenhouse gas (GHG) emissions, climate change, fossil energy use, land use, acidification, eutrophication, water consumption, as well as human and ecological at local, regional and global scales [42]. Within the fast fashion model, these impacts are further amplified by overproduction and overconsumption, which drive more intensive resource use and greater waste generation. Moreover, some researchers underline a lack of transparency in fast fashion supply chains, which makes it more difficult to assess the environmental impacts of products and processes [36].
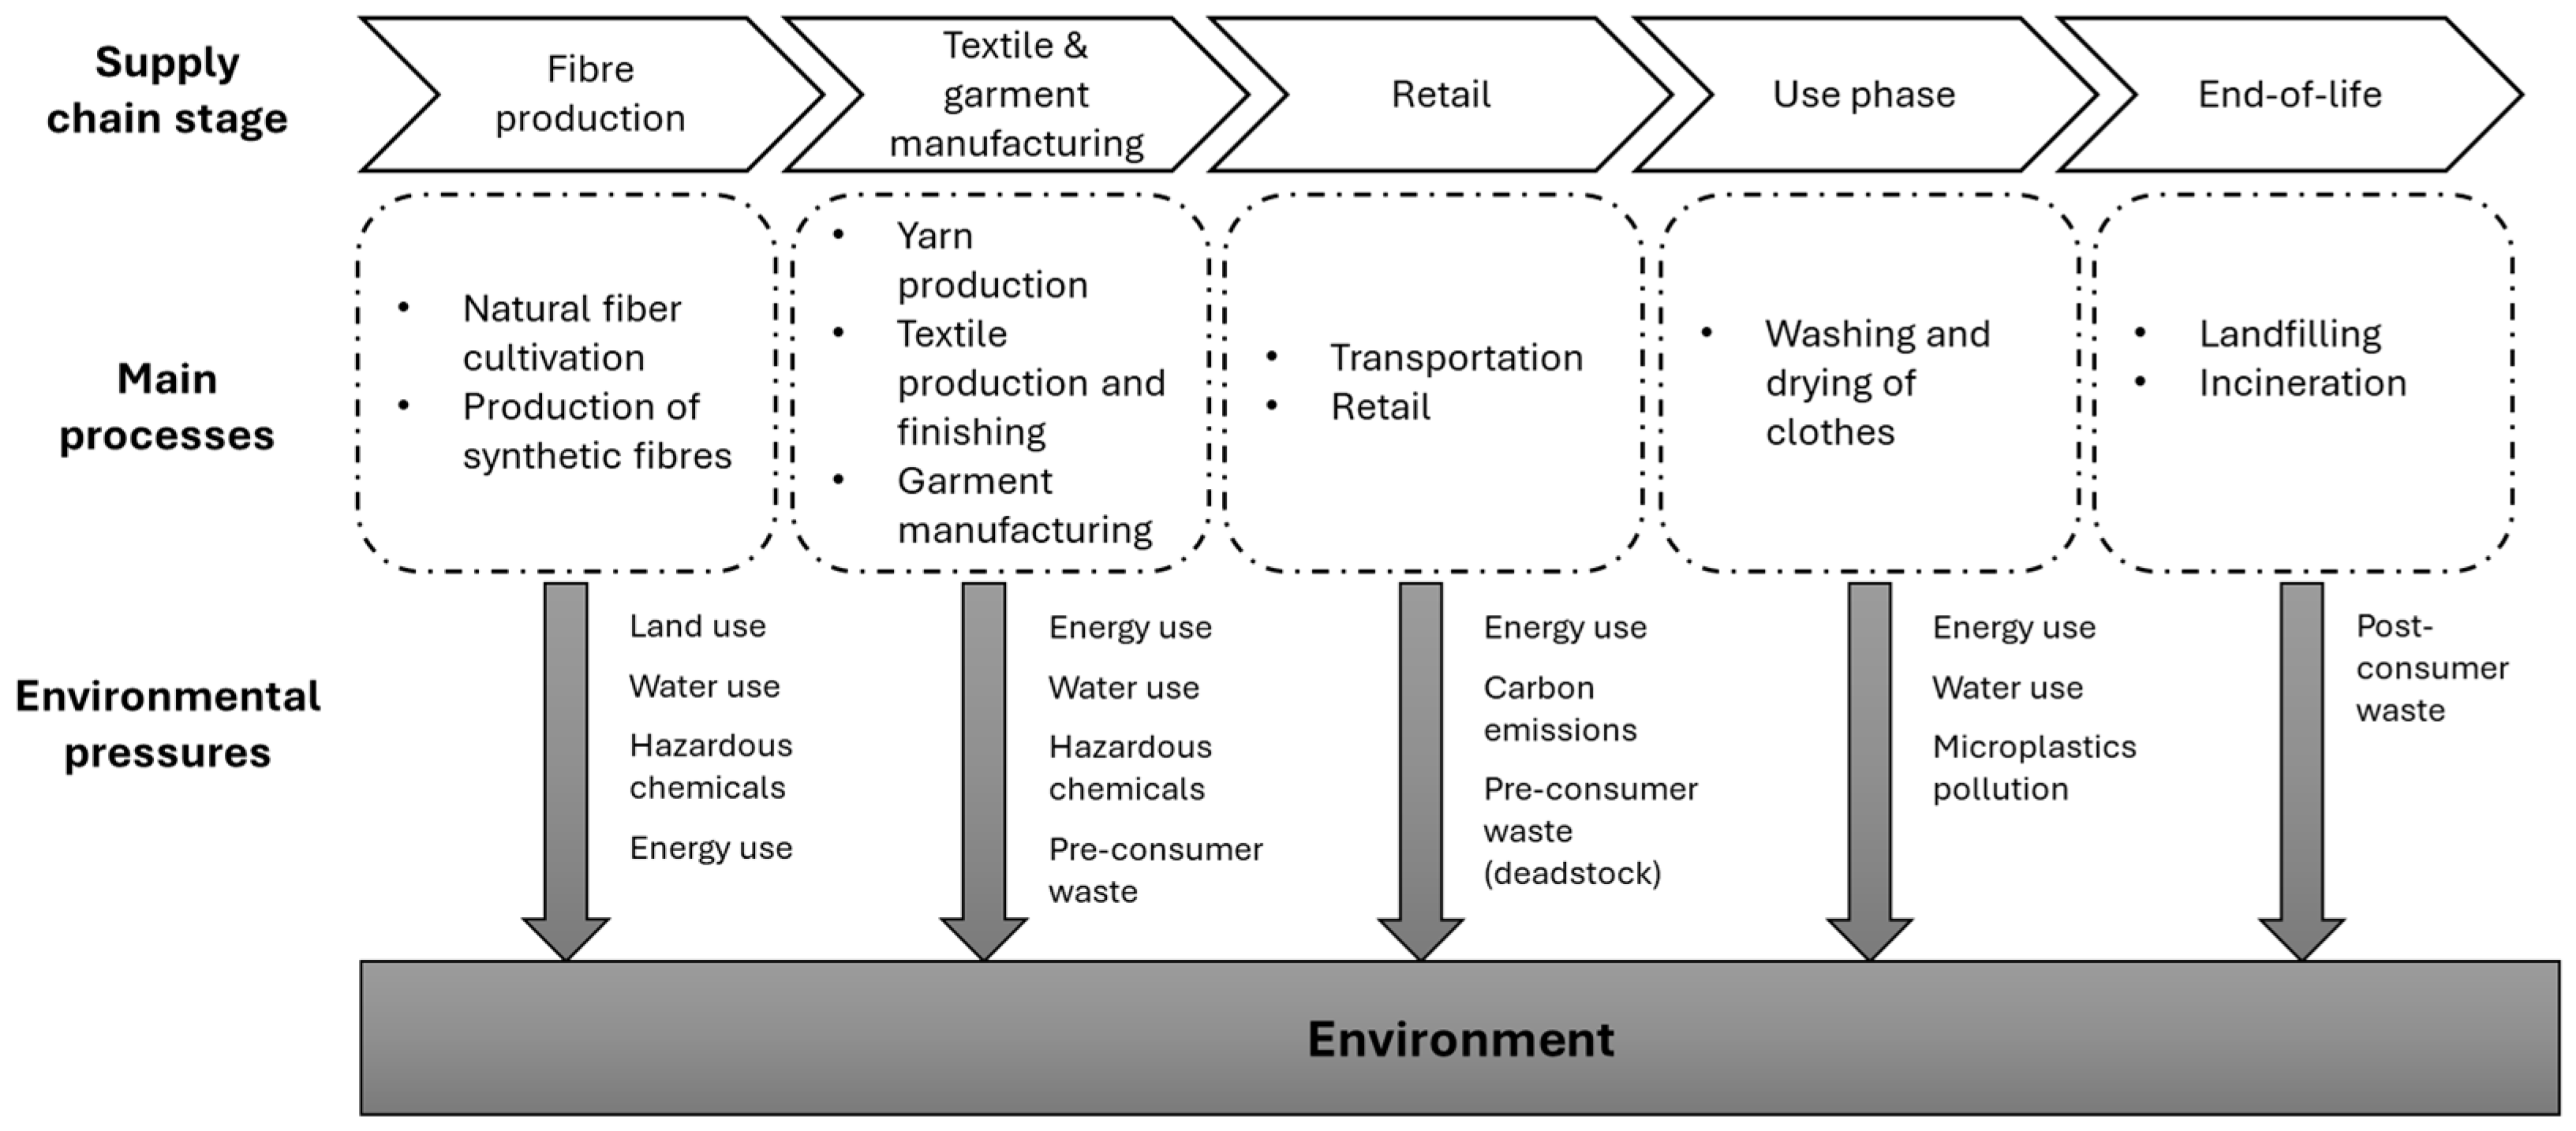
Based on these results, Figure 1 summarizes the linear fast fashion supply chain—i.e., the one not based on CE strategies—its main processes and related environmental impacts. While most processes and environmental issues are also present in traditional fashion supply chains, the specific characteristics of the fast fashion model significantly amplify their impacts, exacerbating its criticalities.

2.2. Current Circular Economy and Sustainability Strategies Applied by Fast Fashion Companies

Due to the significant environmental impacts of these supply chains, and in response to growing policy and market pressures to transition towards more sustainable production models, fast fashion companies worldwide have started adopting sustainability-oriented initiatives (hereafter referred to as “sustainability strategies”). These include actions aimed at improving their environmental performance, such as reducing the use of hazardous materials in their production processes and sourcing materials more responsibly. More recently, companies have also started implementing measures designed to enhance circularity and close material loops (hereafter referred to as “circularity strategies”), like supporting the collection of used garments for reuse or recycling or extending the product lifespan [24,25,26,43]. Several studies in the literature propose classifications of such strategies. One of the most comprehensive is the 10R framework, which summarizes the main circularity strategies in 10 categories [21,44].
Some studies have investigated the adoption of CE and sustainability strategies by fast fashion companies, discussing opportunities and challenges. A pioneer study from Turker and Altuntas [22] provided a first state of the art of sustainable supply chain management (SSCM) practices in the fast fashion sector, through a multiple case study analysis. Starting with the analysis of corporate reports from nine companies of the sector, the authors pointed out that the most relevant efforts were focused in promoting suppliers’ compliance with the company’s sustainability approach; a lack of more effective improvements is also highlighted. A similar approach was adopted by Wren [10], who analyzed SSCM practices adopted by two fast fashion companies, H&M and Everlane. Results showed that, despite the efforts focused on some key issues (such as direct emissions reduction or initiatives to improve the suppliers’ performance), several weaknesses affect the overall efficiency of these actions. The author identified some improvement areas that should be addressed to effectively enhance sustainability in fast fashion companies, such as the decarbonization of raw materials and the adoption of sustainable and recyclable ones, the use of renewable energies along the whole supply chain, the implementation and support of CE strategies downstream (i.e., recycle, rental, repair and resale). Another improvement point could be to engage all actors, including suppliers and customers, in more meaningful actions through the whole supply chain. In a recent study, Arimany Serrat et al. [45] analyze how sustainability initiatives in fast fashion brands align with the European Sustainability Reporting Standards (ESRS), considering four case studies (H&M, Zara, Mango and Shein). The authors show the different approaches of the brands to sustainability issues, revealing an existing gap between companies’ strategies and the ESRS performance objectives.
A different point of view was adopted by Garcia-Ortega et al. [3]: in this case, the starting point was the concept of “sufficient consumption” previously introduced in the literature by other studies. This paradigm indicates a new way of responding to customers’ requests, addressing their needs rather than promoting continuous consumption, thus reducing resource use as well as environmental impacts. In line with this paradigm, the authors proposed a framework to support fast fashion companies in its adoption, validated through a multiple case study. In detail, the strategies of ten fast fashion companies were analyzed to assess their level according to three pillars of the sufficient consumption paradigm (design for durability, alternative product/service systems, and fair promotion and information). Results showed that, despite their latest efforts towards sustainability, fast fashion companies are more used to apply strategies characterized by low impacts on their business model. Dragomir and Dumitru [19] discussed an attempt to provide a complete picture of the most applied circularity approaches adopted in the fast fashion sector, by analyzing corporate reports of six companies: the results outlined the lack of a common standard model for applying CE in the fashion industry.
From a more operational point of view, Gheorghe and Matefi [46] analyzed the sustainability level of one specific Zara collection, defined by the company as in line with sustainable strategies. The authors outlined that, on one side, some issues are well identified and managed (i.e., full information were available on the type of materials used for production); on the other side, less efforts were applied on sharing data about different environmental impacts of production processes (such as water use or air pollution) and for improving the sustainability of raw materials production.
A few recent studies focused on the benefits of implementing sustainable actions in terms of customers’ behavior. Baena [27] analyzed the correlation between Zara’s corporate social responsibility (CSR) practices and sustainable initiatives with the customers’ purchase intention, showing that customers were positively influenced by the declared social and environmental commitment of the brand. Two other recent studies [12,47] confirmed that sustainability-oriented actions can enhance the customers’ perception of a company, although this correlation may also be influenced by demographic factors [12]. Recently, Mathew and Spinelli conducted a literature review on how sustainability initiatives influence consumers’ behavior in the fast fashion sector [18], emphasizing the persistence of the so-called attitude–behavior gap: despite the growing importance of sustainability issues for consumers, their actual purchase behavior is often influenced by other factors, such as cost and convenience. However, the authors underline the increasing relevance of sustainability-oriented choices in fast fashion business strategies.
On the other hand, recent studies show that greenwashing is unfortunately widespread in the fashion industry, including fast fashion, raising the risk that claims of circularity and sustainability do not always reflect genuine corporate commitment [28,29,30,48]. Research highlights the necessity of combating greenwashing through diverse strategies, such as eco-labeling practices, and outlines the need to assess the effective environmental impact of sustainability strategies through consolidated methodologies [49]. In this context, the potential role of CE strategies in effectively improving the environmental sustainability of the sector is underlined [48,49,50].
This quick review has outlined the lights and shadows of the current adoption of CE and sustainability strategies in fast fashion, revealing a lack of structured analysis about their overall impact on the fast fashion supply chain. Indeed, previous studies on CE and sustainability initiatives of fast fashion brands do not address the effectiveness of such actions in addressing the environmental challenges characterizing the supply chain, but are mainly focused on defining trends and opportunities characterizing the sector. Moreover, most of these studies focus on sustainability strategies, while only one study so far discussed qualitatively the potential impact of adopting CE strategies and business models to improve the sustainability of the whole supply chain, through an empirical analysis [19].
This study aims at filling this gap, exploring the effectiveness of both circularity and sustainability strategies adopted by fast fashion companies, as described in the next section. The focus is not on the exact quantification of the environmental impacts of a specific measure, for which methods such as Life Cycle Assessment (LCA) and Life Cycle Costing (LCC) can be adopted [49], rather on the estimation of the potential influence that existing business strategies can have on the environmental hotspots of the sector. Therefore, the analysis is based on the FCM methodology, which allows modeling systems characterized by interdependencies among multiple factors, without the need for large or highly detailed datasets. As such, this methodology is particularly well-suited for theory development and validation [51].

3. Materials and Methods

This work proposes a tool based on FCM to assess quantitatively the impacts of different CE and sustainability strategies that could be adopted in the fast fashion supply chain. FCMs are often used to model systems entailing complex relationships among several factors, allowing for qualitative analysis that does not require an extensive and detailed amount of data: they are an effective tool for theory formation and verification, especially in domains characterized by lack of data and uncertainty [52,53]. FCM are particularly fit for scenario analysis and decision support [54,55] and can help filling the gap between qualitative and quantitative analysis [56]. Unlike traditional multi-criteria decision making (MCDM) methods, FCM can model causal relationships and feedback, capturing complex systems’ behavior rather than considering single variables and factors independently. Moreover, while other qualitative methodologies, such as Delphi or case studies, enable static analyses, FCM allows to simulate and capture dynamics that other methods fail to represent [56]. For this reason, FCMs have been previously applied in the context of sustainability transition, showing their effectiveness in this domain [51]. While previous applications of FCM in the fashion sector exist in the literature, these contributions do not focus on environmental sustainability assessment [57,58]. The present study is the first attempt to apply the FCM method to the fashion sector with the aim of exploring sustainability challenges.
First, a brief description of FCM method is proposed in the next two sections, followed by the FCM construction and the case study analysis.

3.1. Fuzzy Cognitive Maps: The Theoretical Model

The FCMs methodology was initially introduced by Kosko [59] as an evolution of a method proposed by Axelrod 10 years earlier [60], and it is based on the elaboration of directional diagrams that capture causal relationships between the concepts identified.
Three main elements compose the FCM:
  • the concepts (Ci), represented by the nodes of the diagram and indicating variables that are characteristics of the system analyzed; each concept takes a fuzzy value Ai;
  • the arcs, which connect the concepts identified and indicate their causal relationship;
  • the relative weights (wij), representing the relative influence of concept Ci on concept Cj. Relative weights vary in the range [−1;+1] and denotes the type of causality connecting the two concepts [61]: a negative weight wij indicates that the value of Cj decreases with the increase in Ci; a positive weight wij indicates that the value of Cj increases with the increase in Ci; in both cases, the higher the absolute value of wij, the stronger is the relationship. Wij = 0 means that no causal relationship exists between the two concepts.
Once the model is built, the values of the concepts can be calculated iteratively through Equation (1):
A i k + 1 = f ( A i k + j = 1 N A j k w i j )
where Aik represents the value of Ai in the k-th iteration, while f is a threshold function, which can vary depending on the method used to describe the concepts, as detailed in [61]. In this study, the hyperbolic tangent function has been used, binding the node values in the range [−1;+1], as described in [61].
Concepts are also characterized by three more parameters: out-degree, in-degree and centrality. The out-degree and in-degree are calculated as the sum (in absolute value) of the total relative weights exiting and entering the node, respectively. The centrality is the sum of in-degree and out-degree of the node, giving an indication of how much that concept is interrelated with the others, therefore of its relative importance in the map. Consequently, the concepts of a FCM can be classified in three categories: transmitters or drivers, receivers and ordinary concepts. The drivers have positive out-degree and 0 in-degree, meaning that they can affect other concepts but not be affected by them. On the other hand, receivers have positive in-degree and 0 out-degree, as they are influenced by other concepts of the map but do not influence other variables. Finally, concepts that have both positive in-degree and out-degree are classified as ordinary.

3.2. The Proposed FCM Process Development

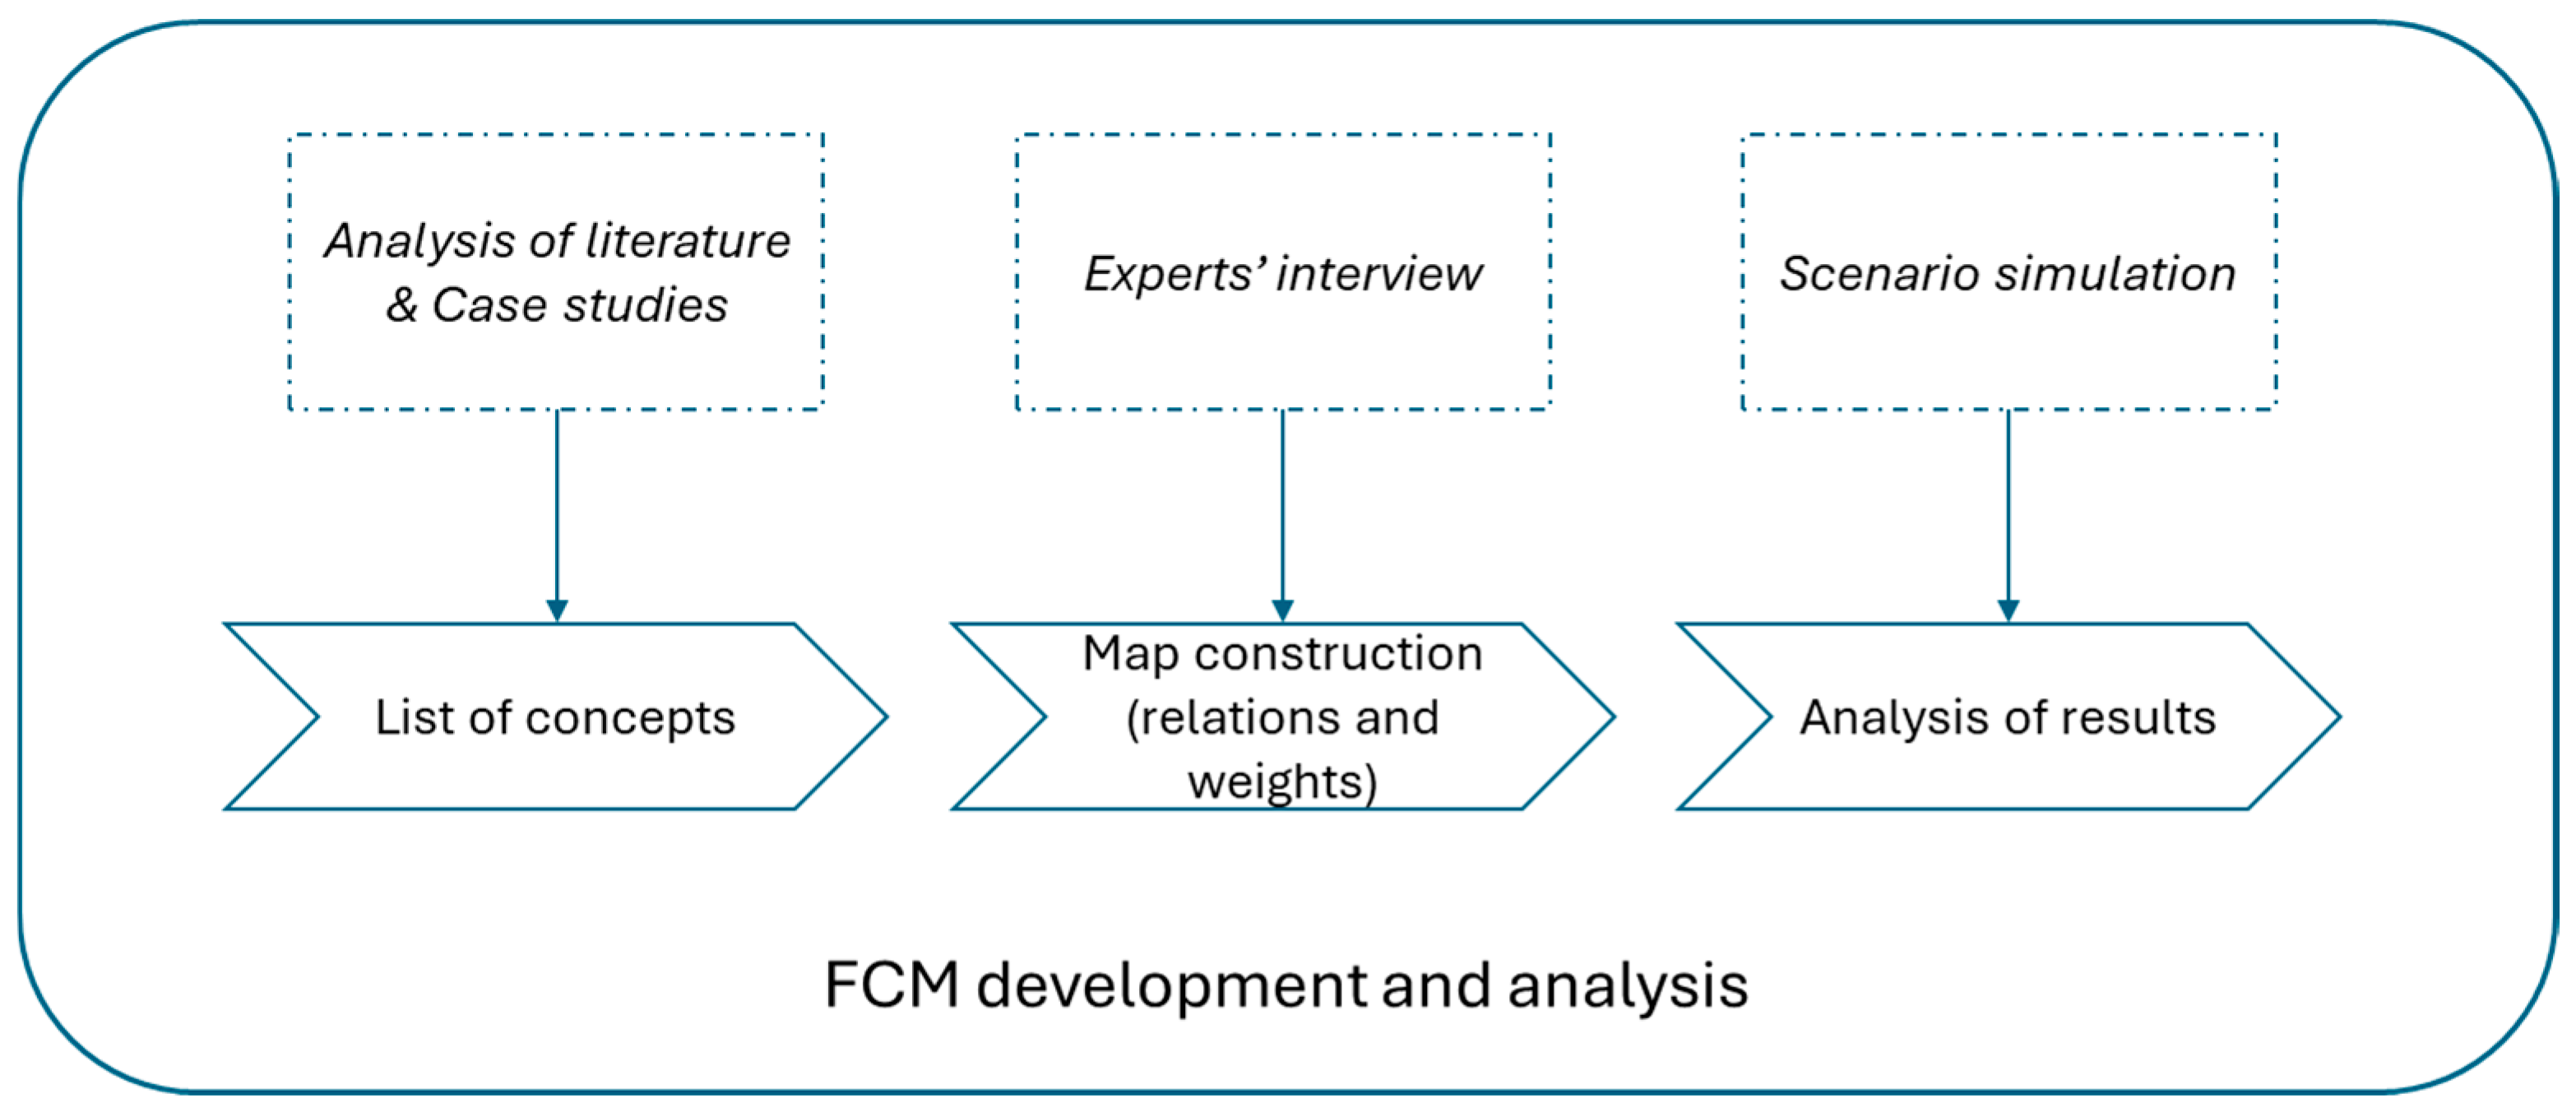
The FMC methodology has been applied through the following three main steps, as described in [62] and detailed in Figure 2:
  • Develop a list of concepts included in the map. The concepts constituting the map can be defined through different methods, such as interviews, data analysis, questionnaires or text analysis [53]. In this study, the concepts were selected through text analysis, considering two main sources. Starting from the analysis of the literature on the environmental impact of fast fashion, presented in Section 2.1, a first set of concepts related to the main impacts on the environment was defined. Next to this, two case studies of globally recognized fast fashion leaders were selected, and their corporate reports were analyzed to identify the main CE and sustainability strategies adopted to improve their environmental performance. More details are reported in Section 3.3.
  • Map construction. In the second step, relationships between concepts and their relative weights have been defined, starting from experts’ interviews. The experts involved are all researchers that have a deep knowledge of the fashion sector and its dynamics, or experience with environmental sustainability impact assessment. This step is detailed in Section 3.4.
  • Analysis of results. In the last step, a few scenarios have been simulated through the FCM, with the aim of estimating the impact on environmental sustainability of the CE strategies identified, as detailed in Section 4.

3.3. Development of the List of Concepts

As reported in Figure 2, the first step to carry out is developing a list of concepts. Two sets of concepts have been developed to define the map. As defined in Section 3.2, the selection has been made based on text analysis. Qualitative data have been coded through an inductive (or bottom-up) approach in two rounds, starting from the information collected and deriving codes directly from the data (first round), and then refining and consolidating the concepts to grant coherence (second round). This approach ensures higher adherence to the reality, avoiding bias related to the pre-existing knowledge and experience of the researchers [63]. Two main informative sources have been used for this step. The first cluster of concepts includes the strategies adopted in the sector to improve the sustainability of fast fashion (defined as cluster A). The second one collects the main environmental impacts generated by the fast fashion supply chain, based on the literature analysis described in Section 2.1 (defined as cluster B).
Cluster A has been defined based on case studies. The first screening involved the corporate reports of fast fashion brands that disclose sustainability information in their corporate documents. It must be noted that, for the purpose of this study, brands representative of the ultra-fast fashion sector, such as Shein and Temu, were not included due to the significant differences between the two segments. In particular, they operate almost exclusively online through large-scale e-commerce and digital marketing, relying heavily on social media platforms and influencers for promotion, whereas fast fashion brands typically combine online channels with extensive brick-and-mortar retail networks. This allows ultra-fast fashion firms to eliminate or significantly reduce several operational activities, such as physical store management and associated inventory processes. Moreover, ultra-fast fashion companies typically rely on smaller production batches and significantly shorter lead times, restocking only those items that show strong consumer demand [64,65]. Considering these substantial structural differences, this study focuses exclusively on traditional fast fashion companies in order to ensure greater coherence and accuracy in the development of the Fuzzy Cognitive Map model. Future research could extend the analysis by developing a dedicated scenario specifically addressing ultra-fast fashion business models.
Additionally, fast fashion brands that do not engage in sustainability reporting were not included in the first stage, due to a lack of information (such as Forever21 and Fashion Nova, based in the USA). Therefore, the research led to the inclusion of eight fast fashion companies (i.e., Asos, Bestseller, C&A, H&M, Inditex, Mango, Primark, Uniqlo). This sample includes corporates operating on the global market and of different relative sizes. Building on this information, a second screening resulted in the selection of the two companies with the widest and most comprehensive set of strategies, considered illustrative of the circularity and sustainability efforts in the fast fashion sector: H&M and Inditex. These two brands are recognized as major global players in fast fashion, both in terms of revenue and market share, and are widely regarded as leaders in the sector [65,66]. At the same time, both companies have launched several initiatives aimed at promoting sustainability and circularity over the years [10,46]. It should be noted that the strategies declared by these two brands, which are detailed in the following paragraphs, are representative of all the strategies identified during the first screening of eight companies. Relevant data have been retrieved analyzing their corporate reports.
Inditex, a Spanish corporate founded in 1985, today is one of the world’s largest fashion groups, owning several famous brands such as Zara, Zara Home, Massimo Dutti, Pull & Bear, Bershka, Stradivarius, Oysho and Uterqüe. Over the years, the Inditex group engaged in several measures to improve its corporate sustainability: initiatives such as reducing water use in production, adopting more sustainable materials and recycling programs for used clothing have been adopted. One example is the Zara Join Life collection, launched in 2015, which included Zara products realized following some sustainability criteria, such as the use of recycled fibers [46]. The company declares to set “ambitious targets for driving an increasingly sustainable and more circular value chain”, such as the net zero emission target set for 2040, or the 100% use of lower impacts materials for their products by 2030, including new generation fibers, recycled or organic farmed materials [43]. The Zara brand also provides the Zara pre-owned program, allowing resell of used clothes, as well as repair of damaged items.
H&M, founded in 1947, is a Swedish fast fashion corporation with more than 4300 stores in the world [67]. Its sustainability disclosure document summarizes the company’s main objectives and strategies to achieve sustainability, which also involve resource use and circularity initiatives, such as the increase in recycled and sustainably sourced materials, the programs for customers supporting repair and reuse, or the collection of used garments. The report highlights that the company has already reduced the scope three greenhouse gas emissions by 22% compared to 2019, and that currently 85% of the materials used in production are recycled or sustainably sourced. Some of their declared targets include reaching net zero emission by 2040, sourcing 100% of electricity for operations from renewable sources, using 100% of recycled or sustainable sourced materials by 2030. Concerning life extension and material recovery strategies, H&M implements the Take Care program, offering repair and reuse advice to customers, and provides repair services in seven stores in Europe. Resell of used garments is also allowed, both in selected H&M physical stores (and online) and through third platforms, such as Sellpy [24].
A more detailed summary of circularity objectives and strategies declared by Inditex and H&M in their latest sustainability reports [24,43] is provided in Table 1.
Starting from the analysis of the two cases studies summarized in Table 1, a list of strategies has been extracted and included in cluster A. Specifically, only strategies emerging from the case studies (i.e., currently adopted by one of the two brands) have been included. Therefore, the model does not include other possible strategies that could be implemented in the future (such as on-demand production, rental models, etc.).
Next, for completing the list of concepts, the most relevant environmental impacts generated along the whole supply chain, emerged from the analysis reported in Section 2.1, have been considered; the analysis was based on a total of 11 sources, of which 10 scientific peer-reviewed articles from international journals, and one public report of the Ellen MacArthur Foundation. The full list of concepts developed for the FCM and of the relative sources is detailed in Table 2.
It must be noted that the “Life extension” strategy has been detailed in two concepts (“repair”—S5 and “reuse & resell”—S6) to capture the different impacts they entail. Similarly, actions related to the choice of the input materials have been modeled considering two types of strategies (the use of materials obtained through more sustainable processes—S1, and the use of recycled materials—S2), as they might have different influences on the selected impacts. Following the same principle, actions oriented to improve energy efficiency (S8) and the use of renewable energies (S9) have been modeled separately. Finally, the strategy oriented towards improving the sustainability of transportation has not been included in the map, since for both case studies the specific objectives of this strategy and the supporting data were not sufficiently detailed.

3.4. Map Construction

As specified in Section 3.2, the following step was the map construction based on experts’ opinions. Previous studies underline that FCM development requires equitable participant selection, ensuring that selected experts possess sufficient knowledge and experience of the phenomenon under investigation [68]. An initial group of 25 candidates was contacted, all academics with a solid background on fashion supply chain and environmental sustainability, to ensure familiarity with the topics and competences related to the sector analyzed. The experts were reached via email and, after a detailed explanation of the research conducted and the objective of the study, the methodology used has been illustrated and they have been asked to validate the relationships between the concepts included in the map, and subsequently fill out the matrix with their evaluation of relative weights wij ∈ [−1; +1], using positive values for concepts that are positively correlated, negative values for concepts that are negatively correlated, and zero for concepts with no correlation. As a guideline, three classes of absolute values to express the causal relations between two concepts were provided, following an approach commonly used in FCM studies to collect weights from experts [68,69,70,71]. It should be noted that the scales used to convert qualitative judgments into quantitative weights may vary across different studies, as there is no universally standardized threshold. In this study, the following scale has been proposed:
  • A low value for concepts weakly correlated: 0 < |wij| ≤ 0.3
  • A medium value for concepts with a moderate correlation: 0.4 < |wij| ≤ 0.6
  • A high value for concepts with a strong correlation: 0.7 < |wij| ≤ 1
In the end, seven complete answers were collected and analyzed to define the final matrix of weights, shown in Table 3. This was calculated by averaging the weights proposed by the experts for each identified connection, thereby assigning equal importance to each contribution. A simple arithmetic mean was applied to establish the value of each weight, formally:
w i j = 1 K k = 1 K w i j ( k )
where K denotes the number of experts and wij(k) represents the causal weight assigned by expert k [72]. To measure consensus among the experts and assess the reliability of the FCM, the total coefficient of variation (CV) of the map has been computed, considering that lower CV values indicate higher consensus among experts in the FCM weight assignments. The following equations have been applied:
σ i j = 1 K k = 1 K w i j k w i j 2
C V i , j = σ i j w i j
C V t o t = 1 N ( i , j ) C V i , j
where σij denotes the standard deviation of the calculated weight wij and CVi,j is the corresponding coefficient of variation. The map developed has a CVtot of 0.23, which denotes a strong agreement among the experts [73].
It has to be noted that this methodology does not prescribe a minimum number of experts to be involved in the map construction phase [74,75]. However, while the number of experts to include can be debatable, the size of the panel is consistent with established practices in previous studies employing FCM [71,76,77,78,79]. Moreover, recent studies in the literature underline that the experience and competence of the experts selected is more relevant than sample size for effective FCM construction [80]. FCM studies can involve a limited number of experts because the method requires participants with substantial domain expertise and the ability to articulate causal relationships among complex system variables. In fact, the FCM methodology emphasizes depth of knowledge rather than statistical representativeness, as the objective is to capture informed causal perceptions of the system. Previous research has shown that panels with less than 10 experts are frequently used in participatory FCM applications and are considered sufficient to capture relevant knowledge structures, particularly when participants possess specialized expertise [71,76,77,78,79]. To mitigate potential selection bias, the study focused on recruiting individuals with demonstrated expertise in the relevant research domains: all the candidates involved present deep knowledge of the CE context and solid experience in the fashion sector, based on previous on-field collaborations with companies. The presence of researchers with experience in the industrial sector was considered appropriate to ensure the reliability of the panel, guaranteeing that the elicited cognitive maps reflect informed and grounded perspectives.
Finally, to assess the robustness of the results, a sensitivity analysis was also conducted on the matrix of weights of the FCM. Random perturbations were introduced to the causal weights within a ±10% interval, and the resulting rankings of strategies were reassessed to evaluate the stability of the model outputs.
It should be noted that, although the FCM has been developed specifically for the fast fashion sector, both the strategies and the environmental impacts included in the map may also be applicable to the fashion sector more broadly. However, as discussed in Section 2, the magnitude of environmental criticalities in fast fashion supply chains is distinctive and strongly influenced by the characteristics of this business model. Consequently, the relationships and weights defined in the FCM should be considered specific to the fast fashion context.

4. Results

This section presents the analysis of the results obtained applying the proposed FCM model, which is the third step of the methodology depicted in Figure 2.

4.1. Descriptive Analysis

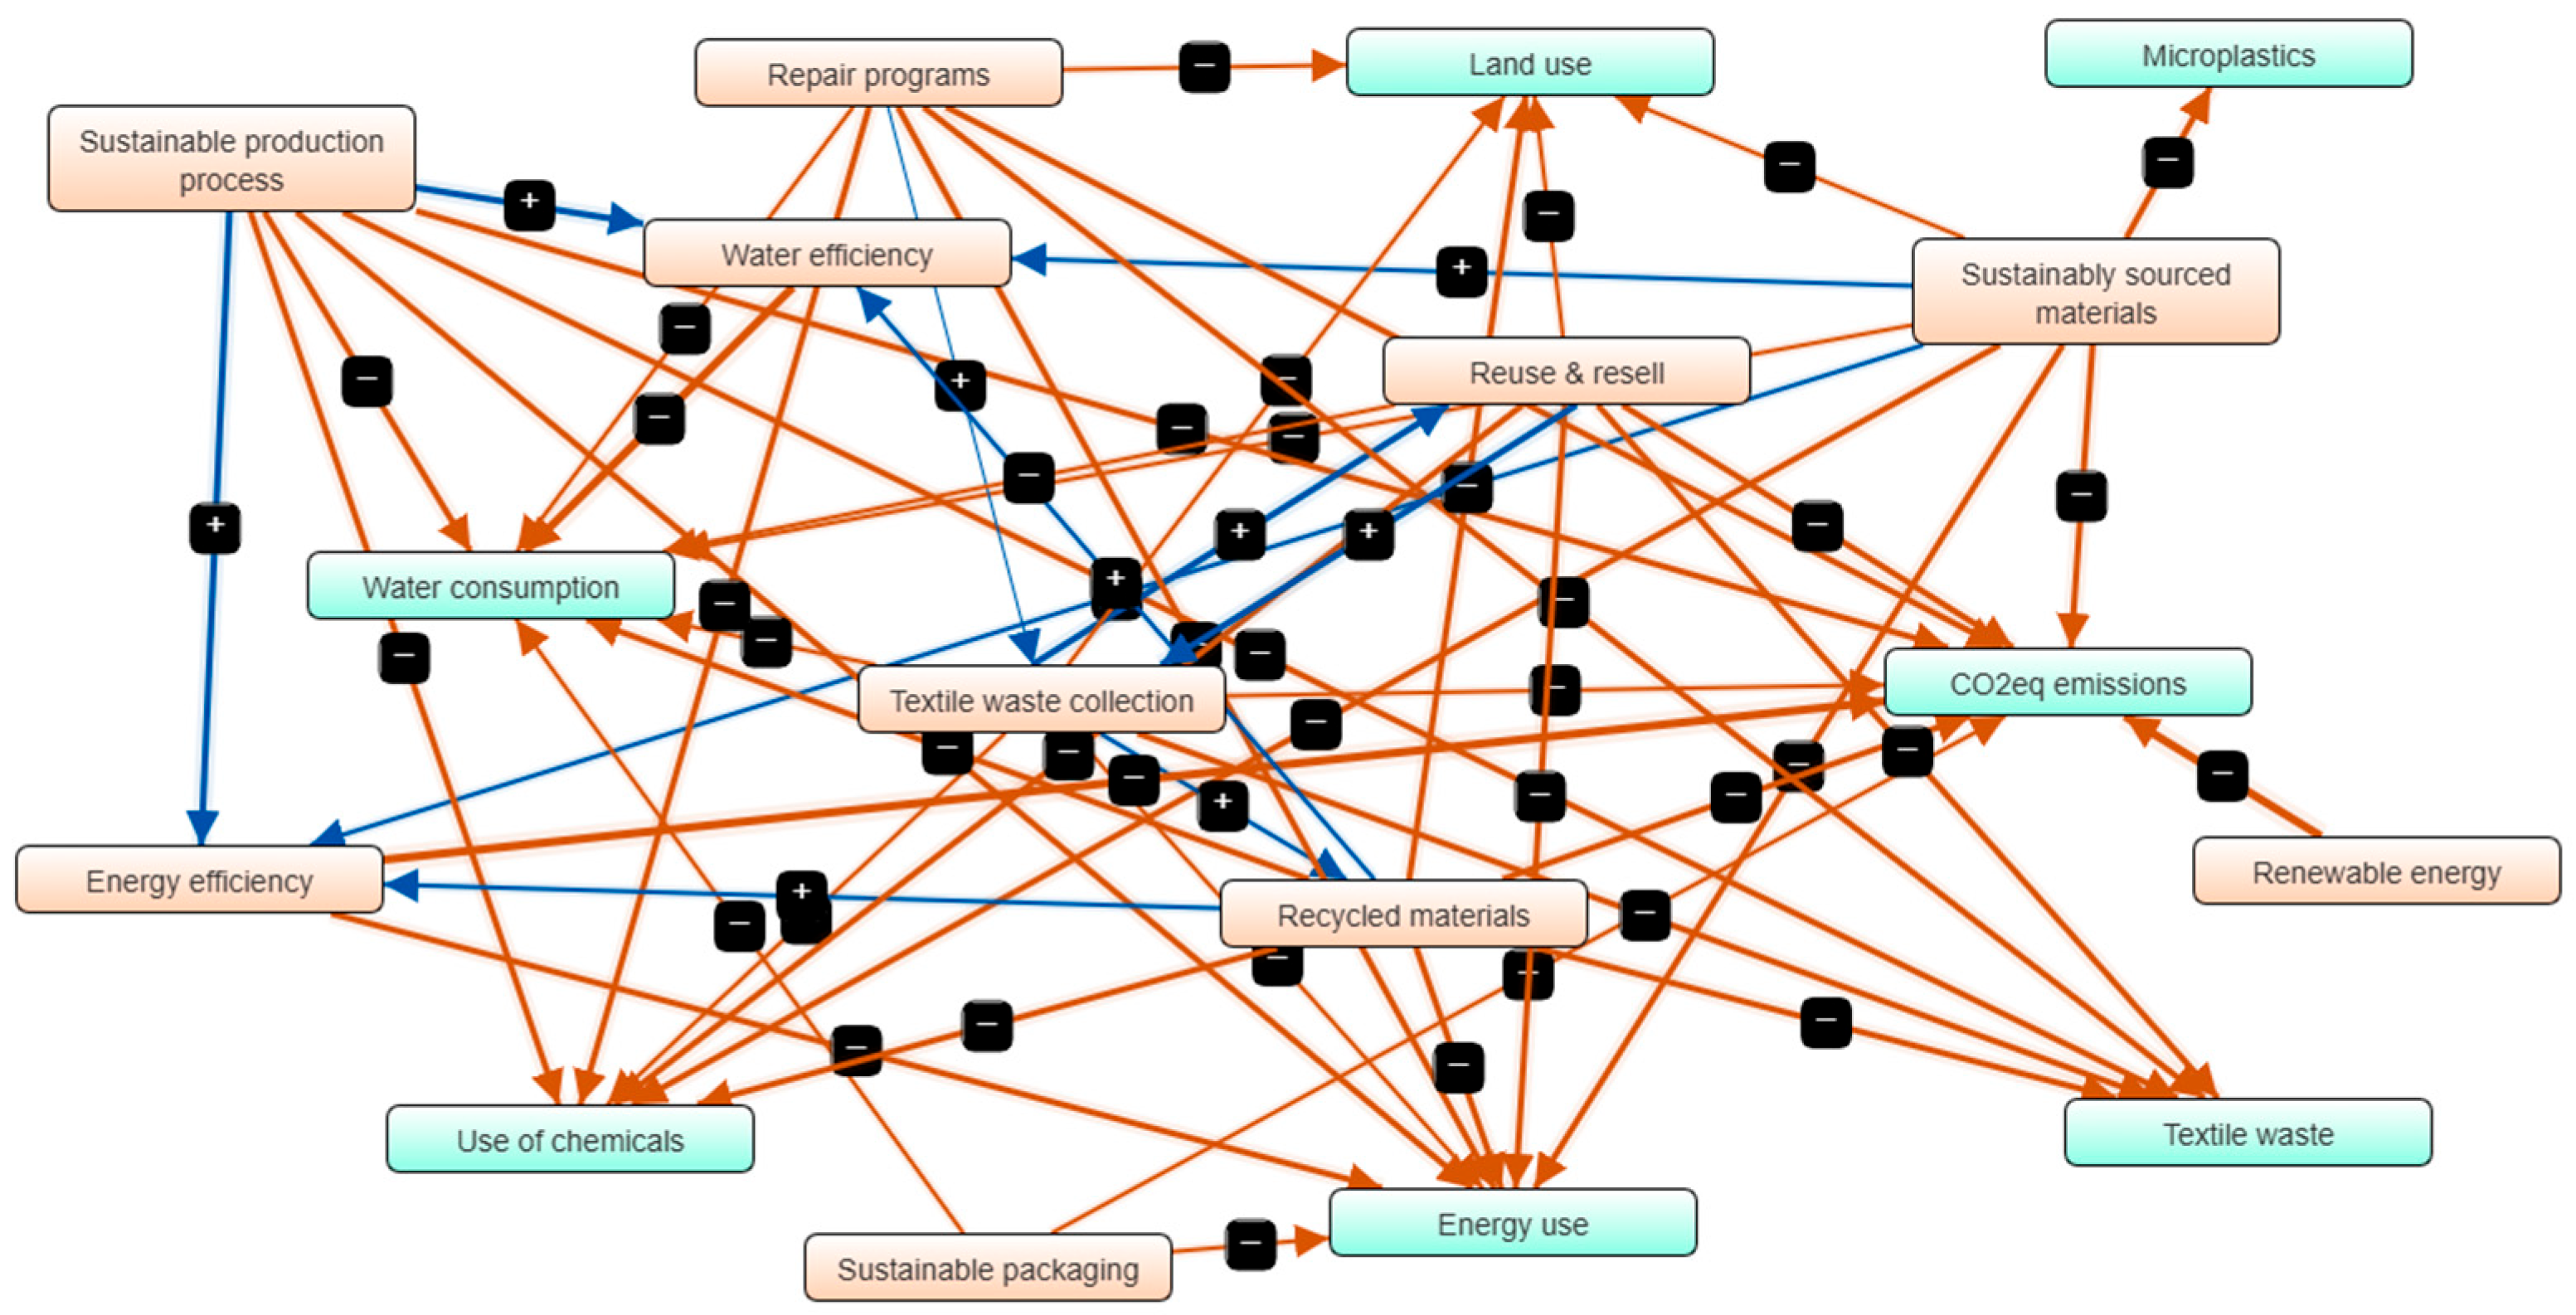
The resulting FCM is shown in Figure 3. It consists of a network of 17 concepts with a total of 52 connections identified (as detailed in Table 4). The total density of the map (D) is calculated through Equation (6):
D = C N N 1
where C is the number of connections of the map and N is the number of components. Therefore, the density represents the ratio between the number of connections identified and the total number of connections possible between the existing components [53]. In this case, it is equal to 0.19, indicating that the number of connections identified among the components is not extremely high. This is also confirmed by the average number of connections per component, which is about three.
Considering the classification of the components, the set of strategies includes both drivers and ordinary components: in detail, half of the strategies identified (S1, S3, S4, S5 and S9) have some degree of influence on other concepts, but are not influenced by them; the remaining ones (S2, S6, S7, S8 and S10) have both ingoing and outgoing connections. The set of environmental impacts identified is entirely constituted by receiver concepts, as evident from Table 5: these represent the response variables to monitor for assessing the system response to the adoption of different strategies. Finally, the complexity score is calculated as the ratio between number of receivers and number of drivers (R/D): in this way, the complexity is higher for models with many receiver components that can be impacted by few drivers. In this case, it is equal to 1.4, denoting an average complexity of the map.
Table 5 also shows the in-degree, out-degree and centrality levels of the concepts. As previously explained, the centrality value can give an indication about the relative importance of the concept in the map. In this case, considering the category of strategies, the actions with higher centrality scores are the implementation of sustainable production processes (S3), reuse and resell programs (S6), the collection of textile waste (S7) and the use of recycled materials for garment production (S2), which are therefore likely to have a greater influence on the environmental impacts compared to those with lower scores. Strategies like the adoption of sustainable packaging (S4) and the use of renewable energies (S9) appear to be more marginal in relation to the impacts considered. Looking at the environmental impacts, the ones more influenced by the strategies selected are CO2eq emissions (I2), energy use (I5) and water consumption (I1), while land use (I6) and microplastics (I7) are less connected.
A first observation based on these results is that, on the one hand, the identified strategies are strongly connected to some impacts (I2, I5 and I1), suggesting that they could potentially influence them. On the other hand, they appear to be only weakly connected to other impacts of the fast fashion supply chain (I6 and I7), indicating that they are unlikely to be effective in addressing those critical aspects of the fast fashion model.

4.2. Scenario Analysis

The resulting map has been implemented in the software Mental Modeler to evaluate the effectiveness of the strategies [81]. In a first step, the strategies have been evaluated individually through 10 single-strategy scenarios, with the objective of isolating the effects of each one of them on the environmental impacts selected and compare their effectiveness. Then, three multi-strategy scenarios have been simulated, as detailed in the next sections.

4.2.1. Single-Strategy Scenarios

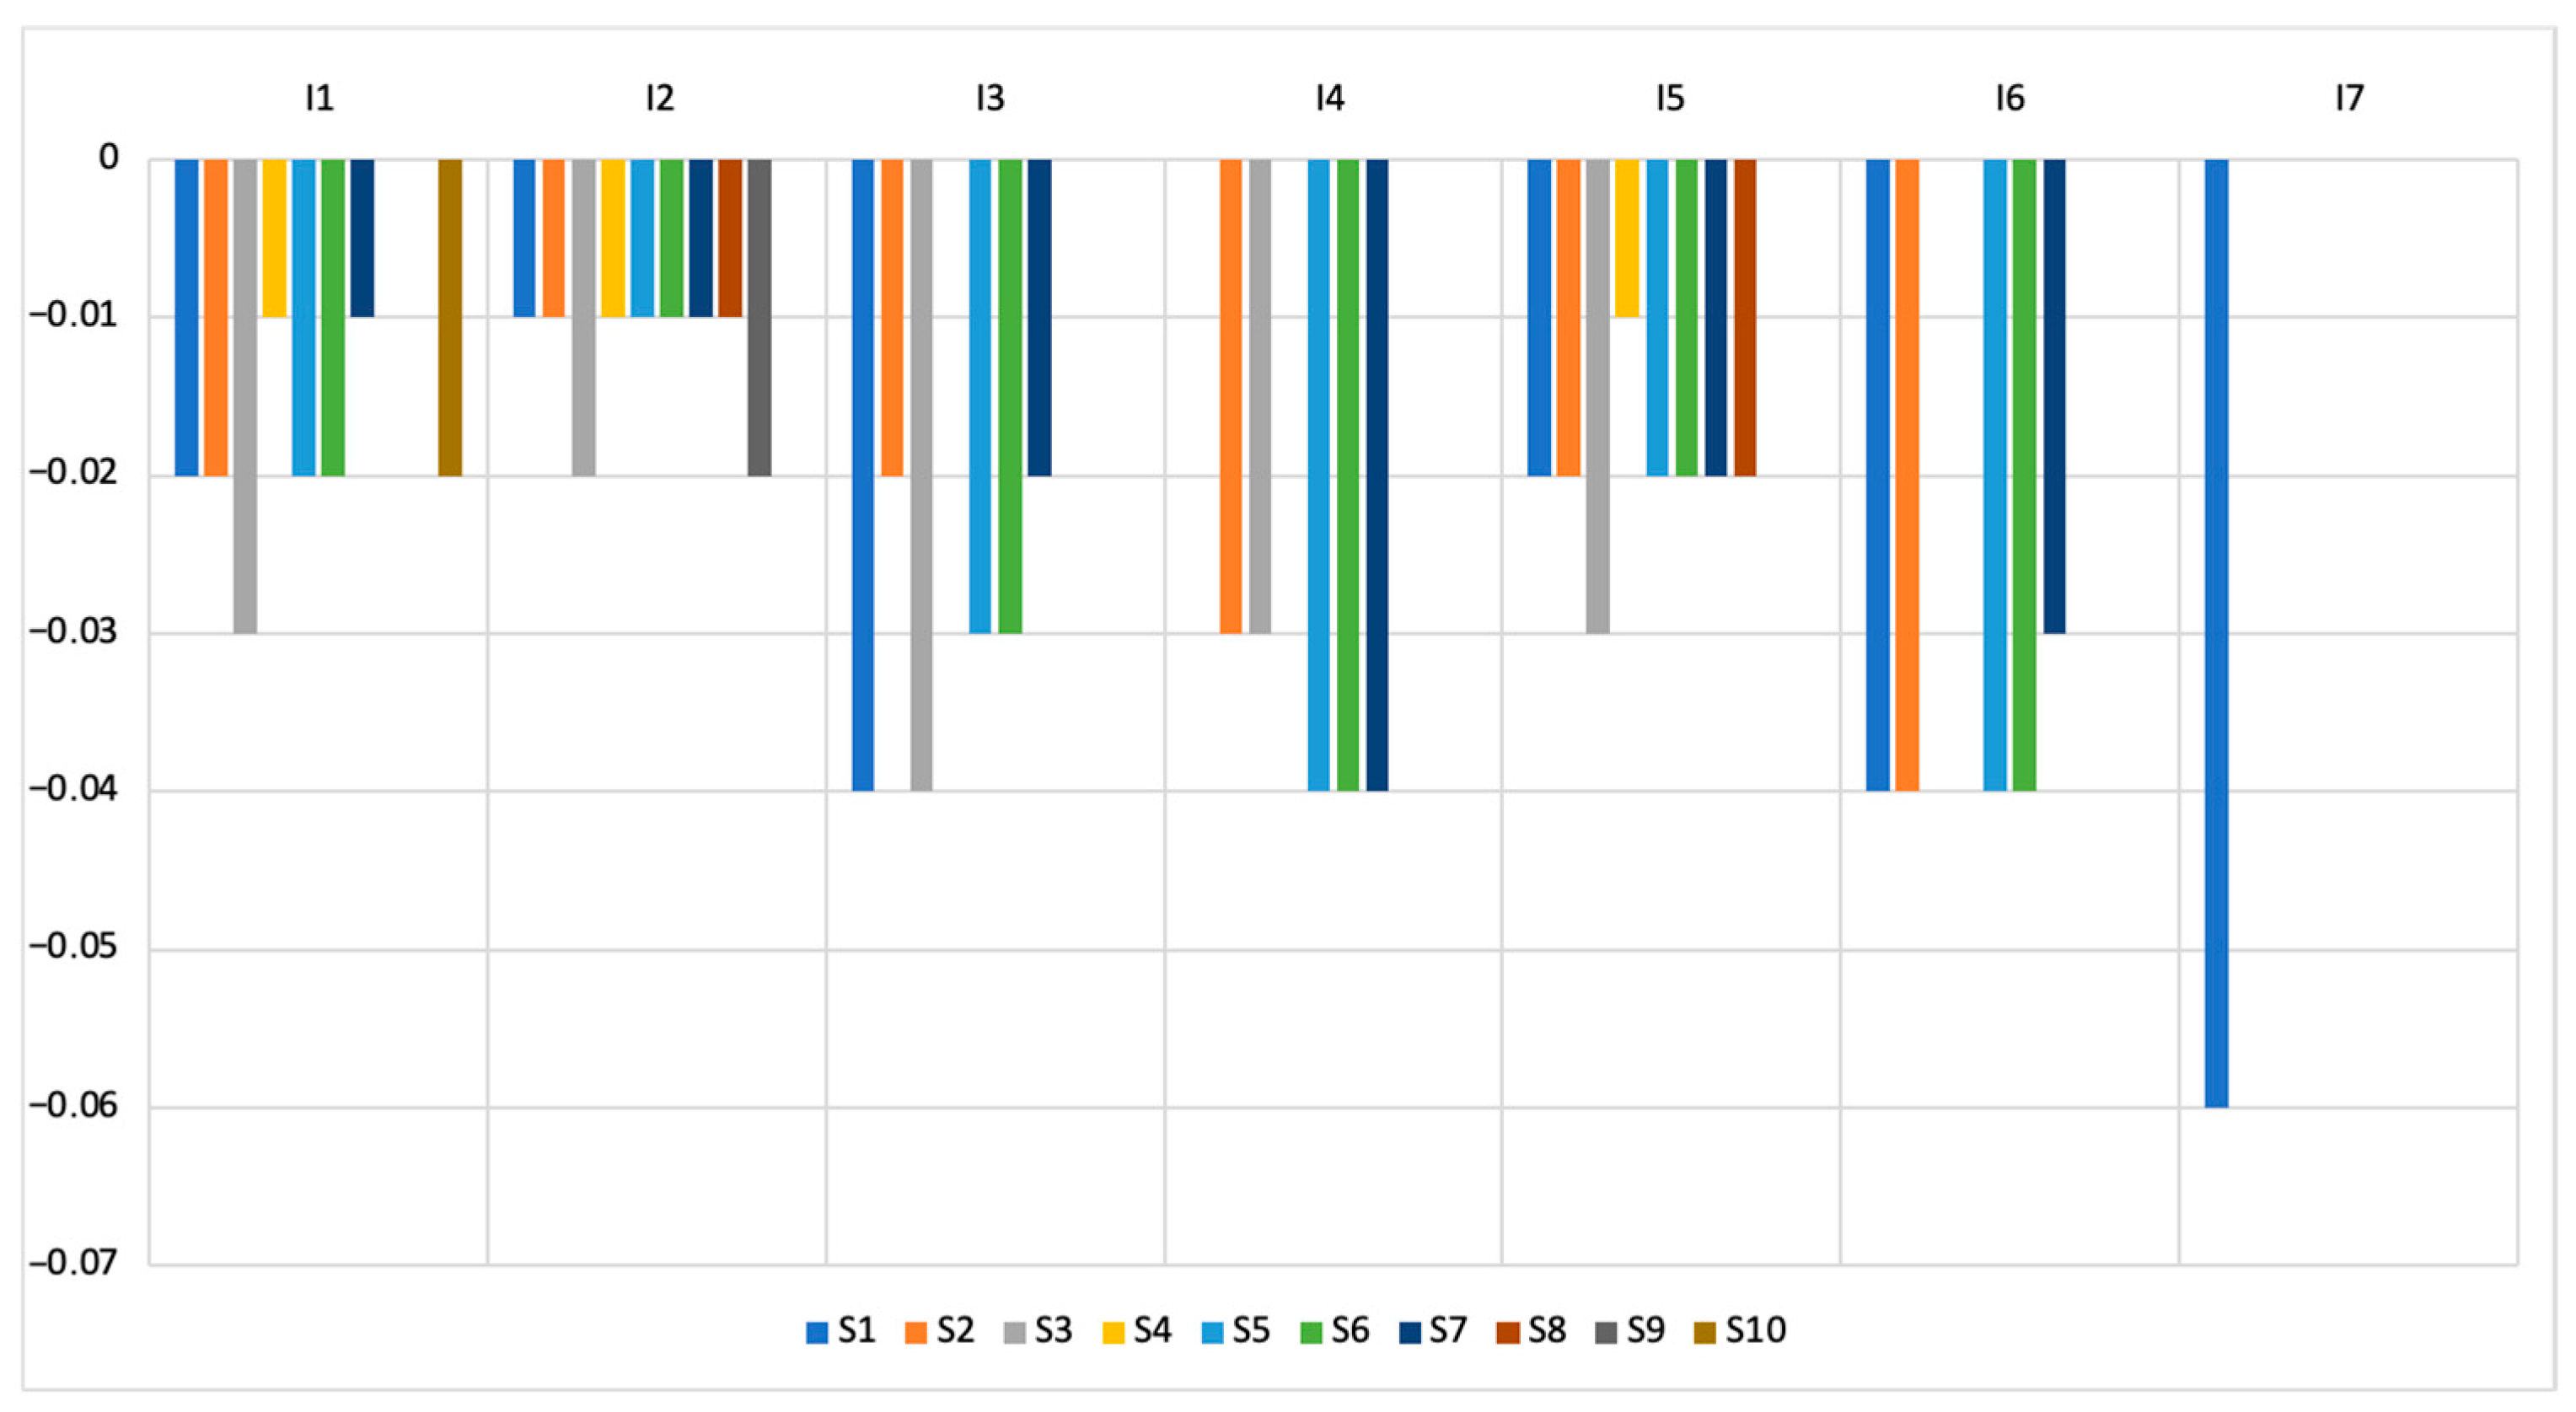
A total of 10 single-strategy scenarios have been considered, each one simulating the full adoption of one strategy by setting its value to one, while the others were kept to zero, obtaining the results summarized in Figure 4 and Table 6, where the largest influence reached for each impact is indicated in green.
Comparing the effects of the single strategies on the impacts considered, it emerges that S1 (Sustainably sourced materials) and S3 (Sustainable production process) have the most significant effects on the set of impacts. In particular, S3 has the highest effect on I1 (Water consumption), I2 (CO2eq emissions), I3 (Use of chemicals) and I5 (Energy use), while S1 is the most significant strategy for I3, I6 (Land use) and I7 (Microplastics). This result is not unexpected, as S1 and S3 potentially address some key issues of the fast fashion supply chain, such as the low quality of materials used and the high-polluting transformation processes [34,40], as coherently reflected by the connections in the map. Secondarily, S5 (Repair) and S6 (Reuse and resell) are also relevant, being the strategies with the highest impacts on I4 (Textile waste) and I6 (Land use). These strategies address the challenge posed by the short lifetime of fast fashion garments, aiming at extending their use and keeping valuable products within the cycle. Finally, strategies S2 (Recycled materials) and S7 (Textile waste collection) are the most impactful in only one category (I6 and I4 respectively); however, they can be considered relevant as they have a medium influence on 6 of the 7 environmental impacts identified, meaning that they have the potential to improve different aspects of the overall environmental performance of the system. On the contrary, these first results show that there is a subset of strategies that presents little or no influence on most environmental aspects considered, specifically: Sustainable packaging (S4), Energy efficiency (S8), Renewable energy (S9) and Water efficiency (S10). According to the analysis performed, these strategies are likely to affect only one or two of the impacts identified, and in a negligible way. This evidence may be attributed to the narrow focus of these strategies, each targeting specific aspects of the production and distribution system. While these actions can contribute to reducing some environmental impacts, their influence on the overall environmental sustainability performance of the fast fashion system is comparatively limited, because they do not directly address the most critical impacts of the fashion value chain (such as intensive resource use or textile waste generation) [4].

4.2.2. Multi-Strategy Scenarios

In a second step, three additional scenarios resulting from the simultaneous adoption of a mix of strategies have been considered, simulating the choice of a company to concentrate its effort towards three different policies, in particular:
  • Scenario P1 involves the adoption of strategies focused on improving the sustainability of material inputs. In this scenario, strategies S1 and S2 were set to 1.
  • Scenario P2 includes all the strategies oriented to improve the sustainability and the efficiency of the production process; therefore, strategies S3, S4, S8, S9 and S10 were set to 1.
  • Finally, scenario P3 involves the strategies oriented to close the loop of materials in the fast fashion supply chain: S5, S6 and S7.
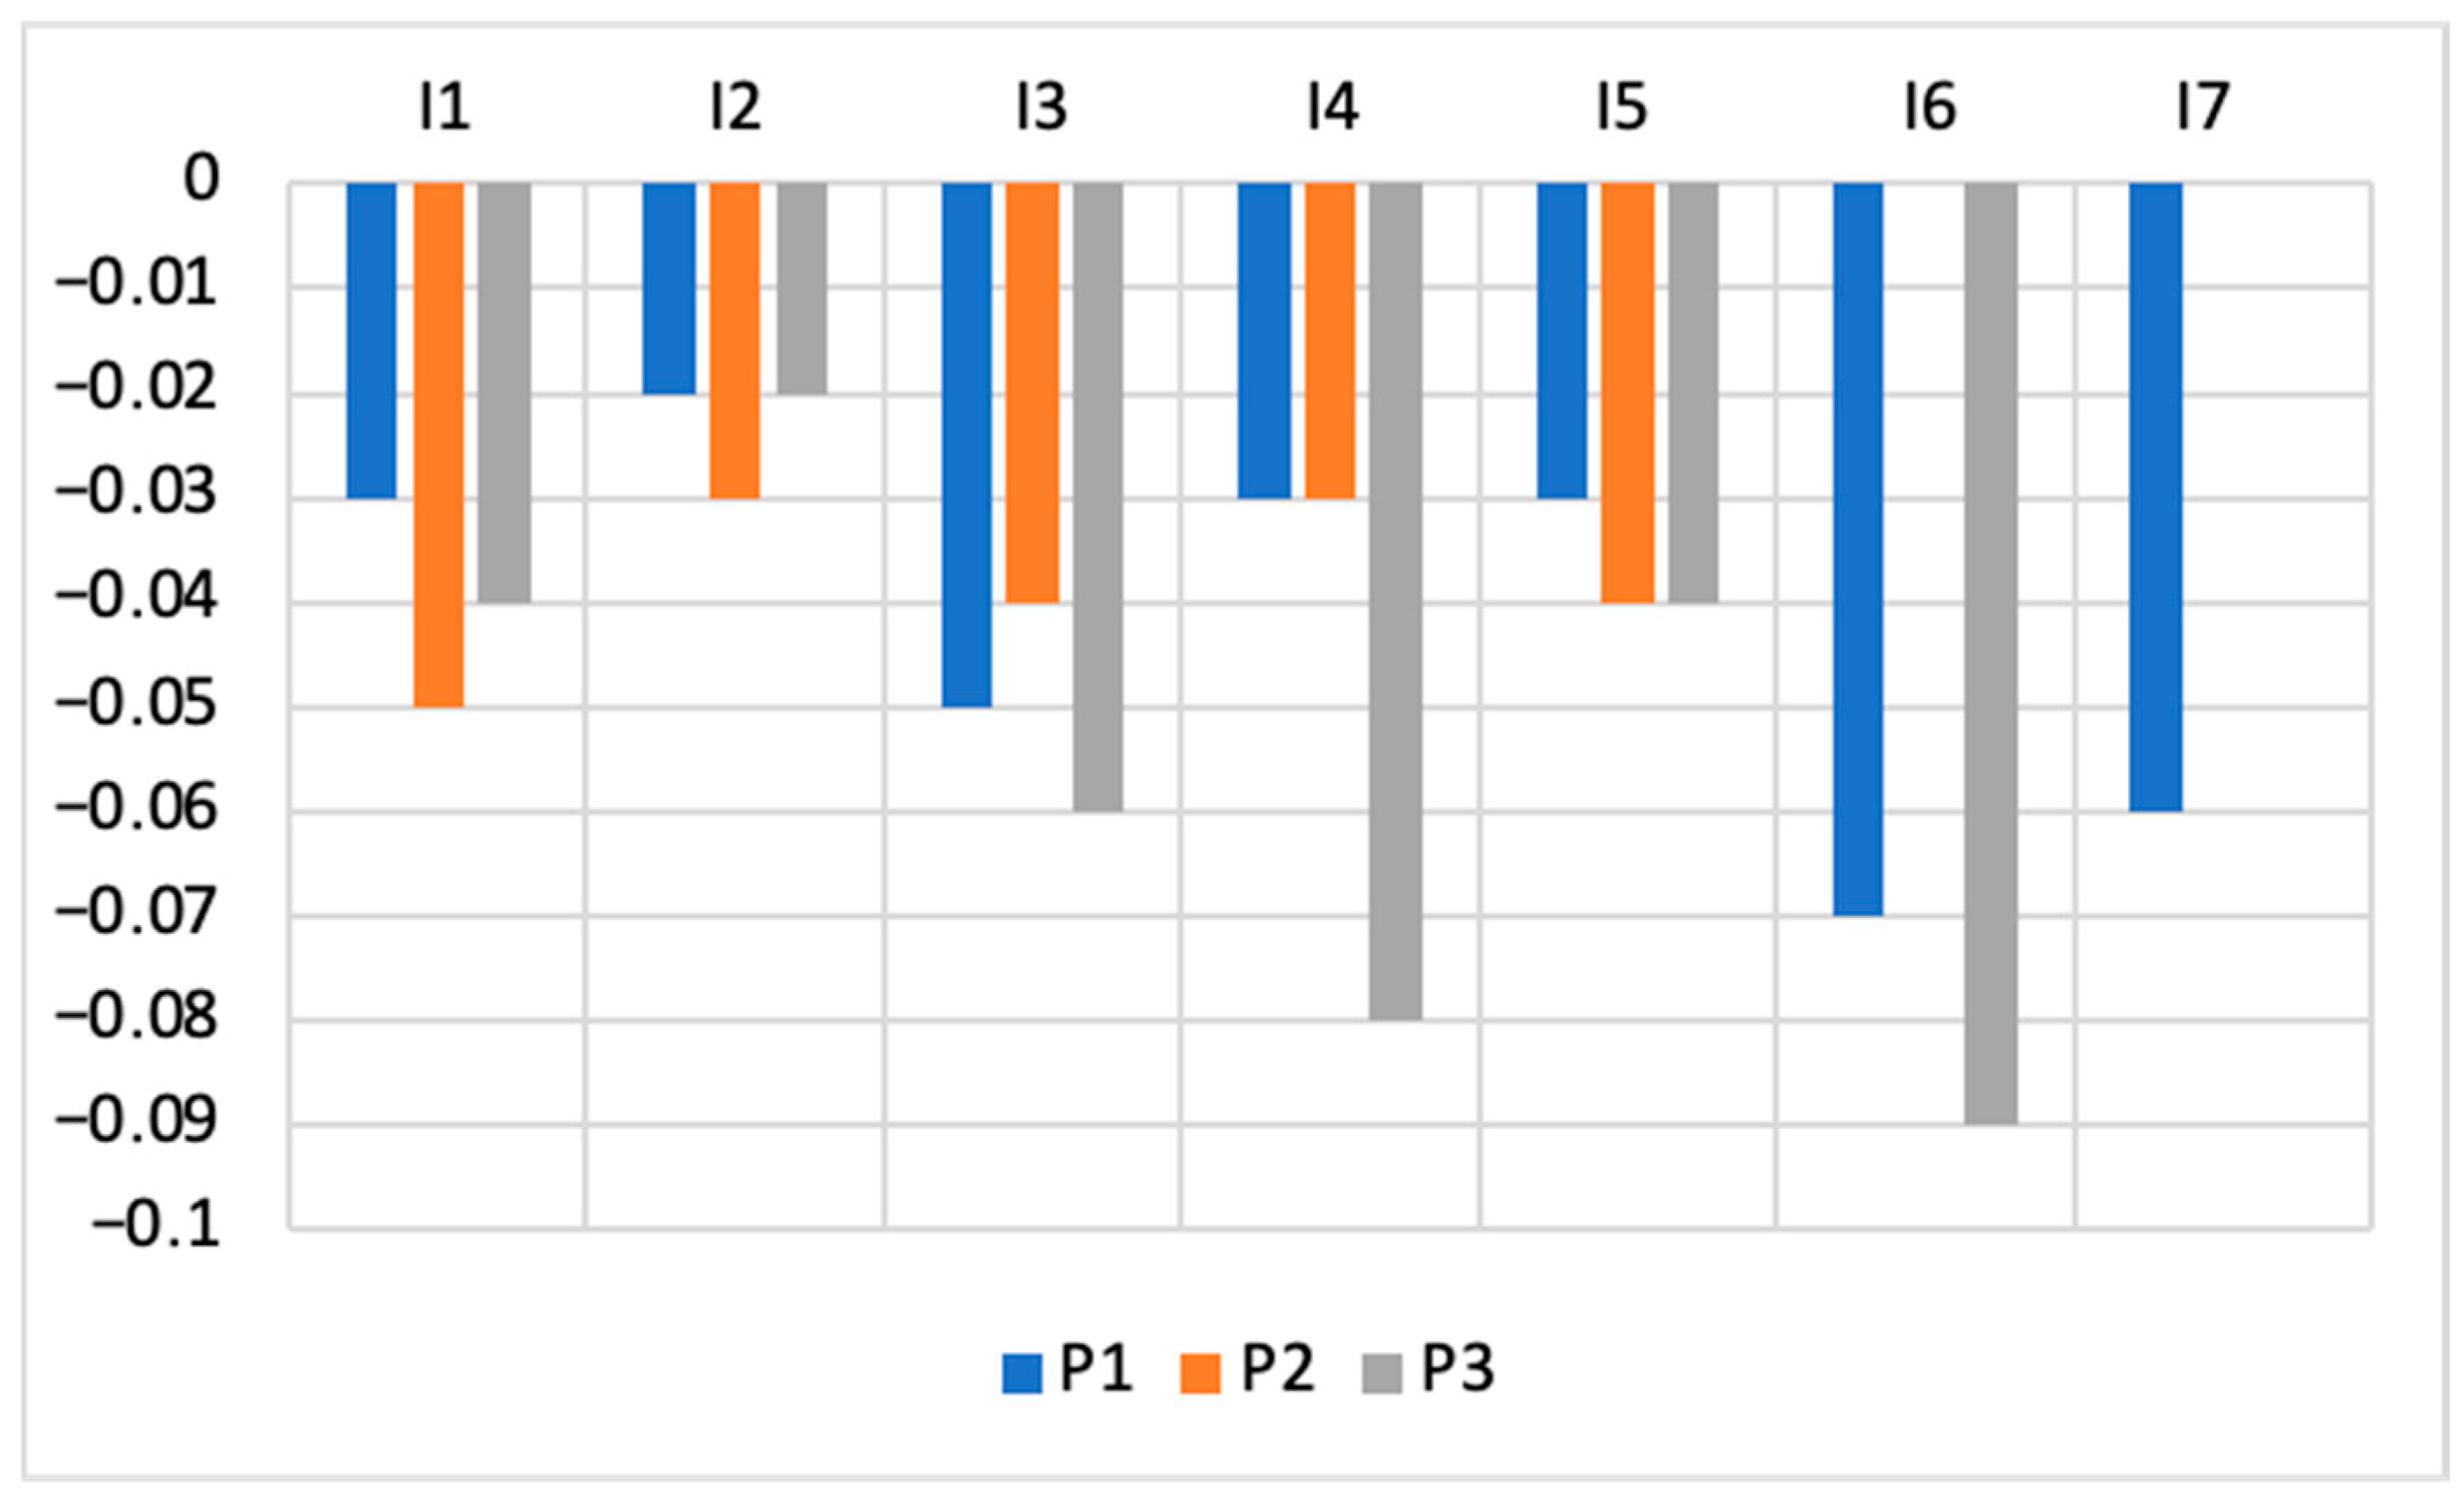
The results of the three policies are illustrated in Figure 5 and detailed in Table 6.
Comparing the three policies, the results outline that the best option for most impacts is closing the loop of materials through life extension strategies (Repair, Reuse and resell) and Textile waste collection (P3). These strategies combined can influence six of the seven impacts identified (leaving only I7 out) and have the highest influence among the three scenarios on the impacts Use of chemicals, Textile waste, Energy use and Land use (I3, I4, I5, I6). Conversely, focusing on the sustainability and efficiency of the production process (scenario P2) can lead to decrease the level of five of the impacts considered, representing the best options for improving Water consumption, CO2eq emissions and Energy use (I1, I2 and I5). Finally, scenario P1 emerges as the preferable option only when considering the impact on Microplastics (I7), but it has the merit of having some level of influence on all impacts considered in the analysis.
Shifting the perspective from strategies to environmental impacts allows for additional observations. Table 7 shows, for each of the seven impacts, the ranking of strategies from the most to the least influential, considering both single- and multi-strategy scenarios. Notably, some impacts appear to be mitigated by nearly every strategy: CO2eq emissions (I2), energy use (I5) and water consumption (I1) are affected in 11 or 12 of the scenarios examined. This finding is consistent with the centrality score, which identified these impacts as the most interconnected. However, the magnitude of the influence of the strategies on CO2eq emissions (I2) is relatively limited, with most strategies showing a minimum value (−0.01). Conversely, other impacts appear less influenced by the actions analyzed. The dispersion of microplastics (I7) is addressed only in one single-strategy and one multi-strategy scenario, both focused on enhancing the sustainability of materials used (S1 and P1), while it remains unaffected in most strategies. Textile waste (I4) and land use (I6) are influenced by roughly half of the strategies, but with greater magnitude compared to other impacts. Notably, the strategy mix aimed at closing material loops (P3) proves to be the most effective in reducing both these impacts, as well as I3 (use of chemicals).
Looking at the results of the FCM, the interpretation may not be straightforward if all impact categories are considered equally important, and prioritization of the strategies can be challenging. To enhance results interpretation, we propose an approach considering two dimensions: the first is related to how many environmental aspects a strategy can address, which can be indicated as their transversality. The second is related to the relative entity of this influence on each impact, which can be indicated considering the number of impact categories for which that strategy is considered the best option (here defined as preferability). The values of these two parameters are summarized in Table 8 for each of the strategies and policies analyzed.
A first result outlined is that in the set of analyzed strategies, only six out of ten score positively for transversality, influencing five or six on the impact categories selected, while the remaining four (Sustainable packaging, Energy efficiency, Renewable energy, and Water efficiency) can only improve from one to three of the impacts considered, and with negligible effects, confirming the results observed in Section 4.1. Looking at the preferability parameter, two strategies (S1 and S3) present a high value (3 or 4), and two others (S5 and S6) present a medium value. The remaining six strategies have a low score, being the best alternative for one impact (S2, S7 and S9) or none (S4, S8, S10).
By crossing the results of transversality and preferability scores, it is possible to underline which of the strategies present at the same time a good level for both parameters. Each strategy and policy have been therefore classified according to their transversality and preferability level, which can vary on a scale from 0 to 7. Three levels have been defined for both parameters, specifically: scores from 0 to 2 correspond to a “low” level, from 3 to 4 to “medium”, from 5 to 7 to “high”. Table 9 shows the results of this classification. The green cells of the matrix include the strategies that should be preferred, presenting medium–high scores on both parameters; the yellow area includes the “second-best” choices, while the red area collects the strategies that have low significance. In this case, Sustainable sourced materials (S1) and Sustainable production process (S3) should be preferred as single strategies to implement, while among the multi-strategies policies, focusing on the whole production process sustainability (P2) or on closing the materials loop (P3) can presumably allow better environmental performances. Unfortunately, most of the single strategies analyzed fall in the yellow or red area, showing a low potential for effective environmental improvement. Similarly, among the policies P1 presents a low preferability, though scoring the maximum value for transversality. This means that focusing on the sustainability of materials can influence all the impacts considered, but the entity of this influence is often lower compared to the other two policies.
As defined in Section 3.4, a sensitivity analysis was also performed on the weights defined to assess the robustness of results. Results indicate that the ranking of the highest-priority strategies remains largely stable across perturbation scenarios. Although minor variations in activation values were observed, the strategies identified as most influential consistently remained among the top-ranked actions. This suggests that the model results are robust to moderate variations in expert-elicited weights.

5. Discussion

The analysis presented allows to address the two research questions defined in Section 1.
Considering RQ1, the development of the list of concepts has supported the identification of CE and sustainability strategies already adopted in fast fashion supply chains. It should be noted that the analysis focused on only two companies, both widely recognized as leaders in the fast fashion sector and actively engaged in sustainability initiatives. These companies were selected from a sample of nine brands, as their engagement encompasses a broad spectrum of CE and sustainability actions. Different clusters of strategies have been identified: the list includes actions aimed at improving the sustainability of material sourcing (S1 and S2) or of the production and packaging processes (S3 and S4), actions related to water and energy management (S8, S9 and S10), as well as actions primarily oriented toward closing material and production loops and extending the product lifetime, in line with a circularity approach (S5, S6 and S7). This confirms that companies in the fast fashion sector view the CE paradigm as a means of enhancing their sustainability profile [19]. On the contrary, the analysis revealed that other strategies that are emerging in the wider fashion sector to address environmental challenges, such as on-demand production models [82], garment rental models [83,84], or design for durability strategies [3,85], are not currently adopted by fast fashion brands. However, this finding is not surprising: while such strategies could have the potential to address some of the biggest criticalities of the fast fashion model (i.e., short garments’ lifespan, overproduction, waste generation), they are in clear conflict with its core characteristics, requiring structural changes that would threaten cost leadership, speed, and volume-driven growth. Therefore, the analysis confirms that fast fashion brands tend to favor incremental CE and sustainability strategies that can be easily integrated in their current business, without undermining their competitive advantage.
Considering RQ2, the analysis performed through the FCM has allowed to estimate qualitatively the influence that different CE and sustainability strategies in fast fashion are likely to have on the most relevant environmental impacts identified for this sector. The results indicate that, with respect to the main impacts generated by the fast fashion sector, some of the strategies currently adopted by companies are unlikely to be effective. For instance, actions aiming at improving the sustainability of packaging (S4) are becoming increasingly popular in the sector [86], yet they appear to fall short in addressing the most critical environmental pressures generated by this industry. Similarly, strategies focused on sustainable energy (S8 and S9) and water management (S10) seem to hold relevance only for CO2eq emissions and water efficiency, respectively, while neglecting other crucial environmental hotspots. Nevertheless, these actions are often presented by brands as crucial to the sustainability of their supply chains [10,86]. Further investigation into the actual environmental benefits of such measures could shed light on this issue, on one hand supporting academics and practitioners in assessing their real potential, on the other hand enabling consumers to develop a clearer perception of these brands’ sustainability.
Notably, the case studies show that fast fashion companies’ efforts to improve energy and water efficiency are currently focused mainly on supply chain operations (particularly at production sites and stores), while actions aiming at decarbonizing transportation along the supply chain remain limited [43,67]. In addition, while transportation-related emissions in fast fashion can be considerable, due to the global nature of supply chains and the increasing reliance on air cargos driven by e-commerce, the shipping of raw materials and finished products is not the only relevant process. At the end of their life cycle, garments are often shipped to countries in the Global South, a process that companies tend to overlook while focusing on their logistics [4].
Conversely, actions centered on sustainably sourced materials (S1), sustainable production processes (S3) and, to a lesser extent, recycled materials (S2), emerged as the most promising standalone strategies, exerting a stronger influence on several impacts compared to the others. This is not unexpected, as material sourcing and textile processing are reported to be among the most impactful stages of the fast fashion supply chain [4]. Consequently, actions aiming at improving their sustainability are increasingly spreading within the sector [10,86]. Considering the case studies, several actions are being planned for improving the sustainability of material sourcing and processing, such as the design of innovative materials, organic farming, certified materials, etc. However, the literature suggests that the environmental benefits of such initiatives should be quantified through specific methodologies [10].
Considering the multi-strategy scenarios, the preference for P2 is coherent with these observations, as it involves a combination of strategies aiming at enhancing the sustainability of the production process. In addition, results indicate that a policy based on a combination of circularity strategies, oriented toward closing material loops (P3), could effectively address the most relevant environmental impacts of fast fashion, whereas the single strategies alone (S5, S6 and S7) may not be sufficient to achieve this objective. In fact, repair, reuse, resell and waste collection initiatives appear to affect most of the impacts considered, but to a lesser extent compared to other strategies. This confirms that a circularity approach should be systemic and rely on the synergy of different actions [44]. Therefore, implementing CE actions in a complementary manner could represent a viable pathway toward enhanced sustainability for fast fashion companies [19], given that many of the environmental pressures associated with this model are related to the excessive resource consumption and waste generation caused by overconsumption. In particular, the strong performance of the P2 and P3 scenarios reflects the structural characteristics of the fast fashion industry. A large share of the sector’s environmental impacts originates from upstream activities, including fiber production, textile processing, and garment manufacturing [4]. Strategies targeting material circularity—such as recycling and reuse/resell programs —can have the potential to significantly reduce resource extraction and waste generation. Similarly, improvements in production processes may affect multiple environmental dimensions, including energy use, water consumption, and chemical pollution, generating broader system-level effects. However, the methodology adopted can only provide qualitative insights into the effects of CE and sustainability strategies on the impacts considered. To quantify the actual environmental benefits of each scenario, the analysis should be extended by integrating specific assessment methodologies (e.g., life cycle assessment—LCA).
It should be noted that the analysis and discussion of the effectiveness of the strategies identified is only based on the environmental sustainability dimension. No evaluation of the social and economic impacts of such strategies has been performed in this study, nor their impact on other relevant aspects for the companies, such as customer perception, brand value, regulatory compliance, etc. Therefore, these results should be intended as descriptive of the only environmental performance of fast fashion companies.

6. Conclusions

The massive diffusion of the fast fashion model in recent decades has contributed to the increase in the environmental impact of the fashion sector, exacerbating effects like water consumption, CO2eq emissions, waste production, use of hazardous chemicals, etc. However, several fast fashion firms are increasing their efforts towards environmental sustainability, influenced by evolving regulatory frameworks and governance mechanisms aimed at improving transparency and accountability in corporate sustainability practices. In recent years, policymakers have encouraged companies to disclose information about the environmental and social impacts of their operations. Such regulatory initiatives can play an important role in accelerating the adoption of more sustainable practices within the fashion industry. Next to regulatory pressures, consumer awareness mechanisms are becoming increasingly relevant. Tools such as sustainability labels, product traceability systems, and environmental information disclosure can influence consumer purchasing decisions and encourage companies to adopt more sustainable production and sourcing practices. However, the growing emphasis on sustainability communication also raises concerns regarding the risk of greenwashing, as companies may overstate the environmental benefits of their initiatives without achieving substantial improvements in environmental performance. While more companies in the sector are striving to implement and communicate CE and sustainability strategies, the effective impact of these decisions on their environmental performance is still not clear.
This study presents a FCM approach based on empirical and theoretical evidence, shedding light on which CE and sustainability strategies are currently adopted in fast fashion, and what kind of influence they are expected to have on the critical environmental impacts of the sector. Ten main CE and sustainability strategies have been identified through a case study analysis, and their influence on seven environmental hotspots of the fast fashion supply chain has been evaluated through the FCM methodology. Results show that only a subset of the identified strategies has an influence on the most critical environmental impacts of fast fashion, either as standalone strategies or in combination with others, highlighting that some of the actions undertaken by companies in the sector fail in addressing the main sustainability challenges identified. Moreover, the scenario analysis of three different policies (including multiple strategies) suggests that a higher impact can be reached focusing on enhancing the sustainability of production process, or closing the loop of materials in the supply chain, adopting a systemic approach to implement circularity and address sustainability issues. These findings suggest that CE and sustainability initiatives in fast fashion may be most effective when they target the core material and production dynamics of the industry.
This study has several implications. From a conceptual perspective, it explores the topic of CE in the fast fashion sector with a system-thinking approach, highlighting how different strategies can interact and jointly influence environmental outcomes. This perspective advances existing research that typically evaluates CE initiatives in isolation, providing a more holistic understanding of sustainability transitions in the sector. From a methodological standpoint, the study demonstrates the applicability of the FCM approach to analyze and prioritize CE and sustainability strategies in the fast fashion context, introducing a dynamic and system-based prioritization framework that captures interdependencies among strategies. Finally, it entails a practical contribution for managers aiming at improving the sustainability of fast fashion companies, as it provides a tool for comparing the most effective strategies adopted and/or to be adopted in the sector. The proposed FCM-based approach could be adapted to specific case studies and used by companies as a decision support tool to assess the environmental effectiveness of their strategies and prioritize sustainability-oriented actions.

6.1. Limitations of the Study

This study presents some limitations. First, the case study analysis includes two fast fashion companies, recognized leaders in this sector and whose efforts to address sustainability issues in their supply chain are widely acknowledged. The two companies have been selected after a first screening of the sustainability reports of nine fast fashion brands, having the broader set of CE and sustainability strategies. Nonetheless, the fast fashion industry is characterized by significant heterogeneity among firms, in terms of supply chain configurations, production models, and level of vertical integration. These differences may influence the adoption and effectiveness of CE and sustainability strategies. Similarly, smaller companies or regionally focused brands may face different operational constraints, resource availability, and strategic priorities that affect their sustainability practices. As an example, large multinational brands with global supply chains may be better positioned to implement systemic strategies, such as investments in closed-loop material systems or large-scale improvements in production processes, while smaller or regionally focused companies may face greater resource constraints and therefore prioritize more targeted initiatives, such as improving supply chain transparency or adopting sustainable sourcing practices. Similarly, the exclusion of ultra-fast fashion companies, which have different structure and dynamics, may be considered a limit to address in future research. Therefore, extending the analysis to a more inclusive sample of companies could contribute to the definition of a larger framework.
Moreover, the FCM methodology itself can present some criticalities, such as the subjectivity of experts’ judgment on the concepts identified and their relationships, as well as the qualitative nature of the results provided, that can only suggest which are the dynamics of a system under given assumptions [53]. However, FCM can be particularly useful to perform scenario analysis, therefore supporting decision making, especially in the context of data scarcity and uncertainty [54,56]. Furthermore, the objective of this study is not to perform an environmental assessment of the strategies selected, but rather to provide a picture of their expected effectiveness and help practitioners in the choice of the most promising ones. Moreover, this study does not include a direct empirical validation of the model outputs. FCM is primarily intended to explore causal relationships and identify potential leverage points within complex systems. Therefore, the results should be interpreted as indicative rather than predictive.
Additionally, the FCM proposed only includes CE and sustainability strategies that are currently adopted by fast fashion brands. Strategies like on-demand production, design for circularity, design for durability, which are already implemented by traditional fashion brands but not in fast fashion, could be included in an extension of this work to understand their potential benefits in the fast fashion sector.
Another limitation is that the developed FCM model does not account for possible rebound effects or conflicts between strategies, which may arise in real word outcomes, nor for the impact of diverse consumers’ behaviors. While the literature suggests that these aspects should be investigated, their complex dynamics require further dedicated research [47,87]. Finally, as described in the introduction, the social dimension of sustainability was not incorporated in the study, despite its significant relevance to the fast fashion sector. This issue still represents a gap in the current literature and should be addressed accordingly.

6.2. Further Research Directions

Further research should be therefore focused on tackling such limitations: the panel of experts could be enlarged to include diverse stakeholders and ensure a larger representativeness of the sample. The case study analysis could be expanded considering differences among different brands and regions, or extending the analysis to assess the strategies of ultra-fast fashion brands; the FCM model could be integrated considering the effects generated by the adoption of CE and sustainability strategies, such as rebound effects, and the dynamic dimension considering time-dependent variables. A specific in-depth analysis of the social sustainability impacts of such strategies could also be performed. Further efforts could be oriented to validating the findings by comparing the prioritization of strategies with external empirical evidence, such as corporate sustainability reports, life-cycle assessment results, or environmental performance indicators reported by fast fashion brands. Furthermore, an extension of the framework including potential CE and sustainability strategies not yet adopted by fast fashion firms could give broader insights and provide suggestions for decision makers. Consumers’ behavioral responses to the implemented strategies should be investigated through dedicated qualitative analyses in order to elucidate how business strategies influence customer perceptions and the resulting consequences. Finally, the environmental performance of the preferred strategies could be analyzed in depth through environmental assessment methodologies (such as LCA) to quantify the impact on specific categories.

Author Contributions

Conceptualization, F.D.L., V.E., M.G.G. and F.T.; methodology, V.E., M.G.G. and F.T.; validation, M.G.G. and F.T.; formal analysis, M.G.G. and F.T.; data curation, M.G.G. and F.T.; writing—original draft preparation, F.D.L., V.E., M.G.G. and F.T.; writing—review and editing, F.D.L., V.E., M.G.G. and F.T. All authors have read and agreed to the published version of the manuscript.

Funding

This research received no external funding.

Institutional Review Board Statement

Not applicable.

Data Availability Statement

Further raw data supporting the conclusions of this article will be made available by the authors on request.

Conflicts of Interest

The authors declare no conflicts of interest.

Abbreviations

The following abbreviations are used in this manuscript:
CECircular Economy
CSRCorporate Social Responsibility
FCMFuzzy Cognitive Maps
FFFast Fashion
GHGGreenhouse Gas
LCALife Cycle Assessment
SSCMSustainable supply chain management

References

  1. Abdelmeguid, A.; Afy-Shararah, M.; Salonitis, K. Towards circular fashion: Management strategies promoting circular behaviour along the value chain. Sustain. Prod. Consum. 2024, 48, 143–156. [Google Scholar] [CrossRef]
  2. European Environment Agency. Textiles and the Environment: The Role of Design in Europe’s Circular Economy; Publications Office: Luxembourg, 2022. Available online: https://data.europa.eu/doi/10.2800/578806 (accessed on 21 January 2025).
  3. Garcia-Ortega, B.; Galan-Cubillo, J.; Llorens-Montes, F.J.; de-Miguel-Molina, B. Sufficient consumption as a missing link toward sustainability: The case of fast fashion. J. Clean. Prod. 2023, 399, 136678. [Google Scholar] [CrossRef]
  4. Niinimäki, K.; Peters, G.; Dahlbo, H.; Perry, P.; Rissanen, T.; Gwilt, A. The environmental price of fast fashion. Nat. Rev. Earth Environ. 2020, 1, 189–200. [Google Scholar] [CrossRef]
  5. De Falco, F.; Di Pace, E.; Cocca, M.; Avella, M. The contribution of washing processes of synthetic clothes to microplastic pollution. Sci. Rep. 2019, 9, 6633. [Google Scholar] [CrossRef]
  6. Ellen MacArthur Foundation. A New Textiles Economy: Redesigning Fashion’s Future; Ellen MacArthur Foundation: Isle of Wight, UK, 2017. [Google Scholar]
  7. Maldini, I.; Grimstad Klepp, I. The EU Textile Strategy: How to Avoid Overproduction and Overconsumption Measures in Environmental Policy. J. Sustain. Mark. 2025, 6, 56–72. [Google Scholar] [CrossRef]
  8. Castagna, A.C.; Duarte, M.; Pinto, D.C. Slow fashion or self-signaling? Sustainability in the fashion industry. Sustain. Prod. Consum. 2022, 31, 582–590. [Google Scholar] [CrossRef]
  9. Bick, R.; Halsey, E.; Ekenga, C.C. The global environmental injustice of fast fashion. Environ. Health 2018, 17, 92. [Google Scholar] [CrossRef]
  10. Wren, B. Sustainable supply chain management in the fast fashion Industry: A comparative study of current efforts and best practices to address the climate crisis. Clean. Logist. Supply Chain 2022, 4, 100032. [Google Scholar] [CrossRef]
  11. Dzhengiz, T.; Haukkala, T.; Sahimaa, O. (Un)Sustainable transitions towards fast and ultra-fast fashion. Fash. Text. 2023, 10, 19. [Google Scholar] [CrossRef]
  12. Zhang, B.; Zhang, Y.; Zhou, P. Consumer Attitude towards Sustainability of Fast Fashion Products in the UK. Sustainability 2021, 13, 1646. [Google Scholar] [CrossRef]
  13. Bartkutė, R.; Streimikiene, D.; Kačerauskas, T. Between Fast and Sustainable Fashion: The Attitude of Young Lithuanian Designers to the Circular Economy. Sustainability 2023, 15, 9986. [Google Scholar] [CrossRef]
  14. European Commission. Communication from the Commission to the European Parliament, the Council, the European Economic and Social Committee and the Committee of the Regions-EU Strategy for Sustainable and Circular Textiles. 2022. Available online: https://environment.ec.europa.eu/publications/textiles-strategy_en (accessed on 10 April 2024).
  15. European Commission. Directorate General for Environment. Sustainable and Circular Textiles by 2030; Publications Office: Luxembourg, 2023; Available online: https://data.europa.eu/doi/10.2779/96659 (accessed on 31 January 2025).
  16. Khatsenkova, S. French Senate Backs Law to Regulate Ultra Fast Fashion Giants Shein and Temu. Euronews. Available online: https://www.euronews.com/my-europe/2025/06/11/french-senate-backs-law-to-regulate-ultra-fast-fashion-giants-shein-and-temu (accessed on 17 September 2025).
  17. Tran, K.V.; Uehara, T. The influence of key opinion leaders on consumers’ purchasing intention regarding green fashion products. Front. Commun. 2023, 8, 1296174. [Google Scholar] [CrossRef]
  18. Mathew, M.; Spinelli, R. Decoding sustainable drivers: A systematic literature review on sustainability-induced consumer behaviour in the fast fashion industry. Sustain. Prod. Consum. 2025, 55, 132–145. [Google Scholar] [CrossRef]
  19. Dragomir, V.D.; Dumitru, M. Practical solutions for circular business models in the fashion industry. Clean. Logist. Supply Chain 2022, 4, 100040. [Google Scholar] [CrossRef]
  20. Bizikova, L.; Pinter, L.; Huppe, G.; Schandl, H. Sustainable Consumption and Production Indicators for the Future SDGs; UNEP: Nairobi, Kenya, 2015; Available online: https://sdgs.un.org/sites/default/files/publications/2301SCP%20indicators.pdf (accessed on 11 November 2024).
  21. Potting, J.; Hekkert, M.; Worrel, E.; Hanemaaijer, A. Circular Economy: Measuring Innovation in the Product Chain; PBL Publishers: The Hague, The Netherlands, 2017; Available online: https://research-portal.uu.nl/en/publications/circular-economy-measuring-innovation-in-the-product-chain (accessed on 10 November 2024).
  22. Turker, D.; Altuntas, C. Sustainable supply chain management in the fast fashion industry: An analysis of corporate reports. Eur. Manag. J. 2014, 32, 837–849. [Google Scholar] [CrossRef]
  23. Musova, Z.; Musa, H.; Drugdova, J.; Lazaroiu, G.; Alayasa, J. Consumer Attitudes Towards New Circular Models in the Fashion Industry. J. Compet. 2021, 13, 111–128. [Google Scholar] [CrossRef]
  24. H&M Group. H&M Group-Sustainability Disclosure 2023. 2024. Available online: https://hmgroup.com/wp-content/uploads/2024/03/HM-Group-Sustainability-Disclosure-2023.pdf (accessed on 10 September 2024).
  25. ASOS. Fashion with Integrity: Strategy Update. 2024. Available online: https://www.asosplc.com/media/prwpal1k/fashion_with_integrity_strategy_update.pdf (accessed on 10 April 2025).
  26. Mango. Mango-Sustainability Report 2023. 2023. Available online: https://media.mango.com/is/content/punto/mfg-Mango_Memoria-sostenibilidad-2023_EN (accessed on 10 April 2025).
  27. Baena, V. The shift from fast fashion to socially and sustainable fast fashion: The pivotal role of ethical consideration of consumer intentions to purchase Zara. Corp. Soc. Responsib. Environ. Manag. 2024, 31, 4315–4328. [Google Scholar] [CrossRef]
  28. Adamkiewicz, J.; Kochańska, E.; Adamkiewicz, I.; Łukasik, R.M. Greenwashing and sustainable fashion industry. Curr. Opin. Green Sustain. Chem. 2022, 38, 100710. [Google Scholar] [CrossRef]
  29. Badhwar, A.; Islam, S.; Tan, C.S.L.; Panwar, T.; Wigley, S.; Nayak, R. Unraveling Green Marketing and Greenwashing: A Systematic Review in the Context of the Fashion and Textiles Industry. Sustainability 2024, 16, 2738. [Google Scholar] [CrossRef]
  30. Diaz-Bustamante-Ventisca, M.; Carcelén-García, S.; Díaz-Soloaga, P.; Kolotouchkina, O. Greenwashing perception in Spanish fast-fashion brands’ communication: Modelling sustainable behaviours and attitudes. Int. J. Fash. Des. Technol. Educ. 2025, 18, 179–189. [Google Scholar] [CrossRef]
  31. Saha, K.; Dey, P.K.; Kumar, V. A comprehensive review of circular economy research in the textile and clothing industry. J. Clean. Prod. 2024, 444, 141252. [Google Scholar] [CrossRef]
  32. Zamani, B.; Sandin, G.; Peters, G.M. Life cycle assessment of clothing libraries: Can collaborative consumption reduce the environmental impact of fast fashion? J. Clean. Prod. 2017, 162, 1368–1375. [Google Scholar] [CrossRef]
  33. Bartl, A.; Ipsmiller, W. Fast fashion and the Circular Economy: Symbiosis or antibiosis? Waste Manag. Res. 2023, 41, 497–498. [Google Scholar] [CrossRef] [PubMed]
  34. De Koning, J.; Lavanga, M.; Spekkink, W. Exploring the clothing overconsumption of young adults: An experimental study with communication interventions. J. Clean. Prod. 2024, 467, 142970. [Google Scholar] [CrossRef]
  35. Peters, G.; Li, M.; Lenzen, M. The need to decelerate fast fashion in a hot climate—A global sustainability perspective on the garment industry. J. Clean. Prod. 2021, 295, 126390. [Google Scholar] [CrossRef]
  36. Olivar Aponte, N.; Hernández Gómez, J.; Torres Argüelles, V.; Smith, E.D. Fast fashion consumption and its environmental impact: A literature review. Sustain. Sci. Pract. Policy 2024, 20, 2381871. [Google Scholar] [CrossRef]
  37. Wiśniewski, A. Fast fashion business model: A review of innovation potential and environmental risks. Econ. Environ. 2025, 93, 944. [Google Scholar] [CrossRef]
  38. Centobelli, P.; Abbate, S.; Nadeem, S.P.; Garza-Reyes, J.A. Slowing the fast fashion industry: An all-round perspective. Curr. Opin. Green Sustain. Chem. 2022, 38, 100684. [Google Scholar] [CrossRef]
  39. Bailey, K.; Basu, A.; Sharma, S. The Environmental Impacts of Fast Fashion on Water Quality: A Systematic Review. Water 2022, 14, 1073. [Google Scholar] [CrossRef]
  40. Pinto, V.C.D.; Peleg Mizrachi, M. The Health Impact of Fast Fashion: Exploring Toxic Chemicals in Clothing and Textiles. Encyclopedia 2025, 5, 84. [Google Scholar] [CrossRef]
  41. Mensah, J. The Global South as a Wasteland for Global North’s Fast Fashion: Ghana in Focus. Am. J. Biol. Environ. Stat. 2023, 9, 33–40. [Google Scholar] [CrossRef]
  42. Moazzem, S.; Crossin, E.; Daver, F.; Wang, L. Environmental impact of apparel supply chain and textile products. Environ. Dev. Sustain. 2022, 24, 9757–9775. [Google Scholar] [CrossRef]
  43. Inditex. Statement of Non Financial Information. 2023. Available online: https://www.inditex.com/itxcomweb/api/media/cc6b203a-de08-4ff9-8989-e0ca52e03472/Statement_of_Non_Financial_Information_2023.pdf?t=1710759711321 (accessed on 11 November 2024).
  44. Kirchherr, J.; Reike, D.; Hekkert, M. Conceptualizing the circular economy: An analysis of 114 definitions. Resour. Conserv. Recycl. 2017, 127, 221–232. [Google Scholar] [CrossRef]
  45. Arimany Serrat, N.; Arribas-Ibar, M.; Erdoğan, G. Fast Fashion Sector: Business Models, Supply Chains, and European Sustainability Standards. Systems 2025, 13, 405. [Google Scholar] [CrossRef]
  46. Gheorghe, C.A.; Matefi, R. Sustainability and Transparency—Necessary Conditions for the Transition from Fast to Slow Fashion: Zara Join Life Collection’s Analysis. Sustainability 2021, 13, 11013. [Google Scholar] [CrossRef]
  47. Neumann, H.L.; Martinez, L.M.; Martinez, L.F. Sustainability efforts in the fast fashion industry: Consumer perception, trust and purchase intention. Sustain. Account. Manag. Policy J. 2021, 12, 571–590. [Google Scholar] [CrossRef]
  48. Rani, J.; Guru, R.; Santhanam, S.; Molla, W.T.; Wadmare, S.V. Rethinking Fashion: The Environmental Impact and the Shift Towards Sustainability. In Global Impacts and Sustainable Practices in Fast Fashion; Olubiyi, T.O., Behera, S.K., Tran, T.A., Eds.; IGI Global: Hershey, PA, USA, 2025; pp. 21–48. [Google Scholar] [CrossRef]
  49. Mousavi, K.; Kowsari, E.; Ramakrishna, S.; Chinnappan, A.; Gheibi, M. A comprehensive review of greenwashing in the textile industry (life cycle assessment, life cycle cost, and eco-labeling). Environ. Dev. Sustain. 2024, 27, 21737–21777. [Google Scholar] [CrossRef]
  50. Jain, P.; Chaudhary, N.; Thakur, P. Sustainable Shifts: Addressing Challenges and Exploring Opportunities in Fast Fashion Through Circular Practices. In Convergence of AI, Education, and Business for Sustainability; Tariq, M.U., Sergio, R.P., Eds.; IGI Global: Hershey, PA, USA, 2025; pp. 357–378. [Google Scholar] [CrossRef]
  51. Morone, P.; Yilan, G.; Imbert, E. Using fuzzy cognitive maps to identify better policy strategies to valorize organic waste flows: An Italian case study. J. Clean. Prod. 2021, 319, 128722. [Google Scholar] [CrossRef]
  52. Emir, O.; Ekici, Ş.Ö. An integrated assessment of food waste model through intuitionistic fuzzy cognitive maps. J. Clean. Prod. 2023, 418, 138061. [Google Scholar] [CrossRef]
  53. Özesmi, U.; Özesmi, S.L. Ecological models based on people’s knowledge: A multi-step fuzzy cognitive mapping approach. Ecol. Model. 2004, 176, 43–64. [Google Scholar] [CrossRef]
  54. Carvalho, J.P. On the semantics and the use of fuzzy cognitive maps and dynamic cognitive maps in social sciences. Fuzzy Sets Syst. 2013, 214, 6–19. [Google Scholar] [CrossRef]
  55. Papageorgiou, E.; Kontogianni, A. Using Fuzzy Cognitive Mapping in Environmental Decision Making and Management: A Methodological Primer and an Application. In International Perspectives on Global Environmental Change; Young, S., Silvern, S., Eds.; InTech: London, UK, 2012. [Google Scholar]
  56. Jetter, A.J.; Kok, K. Fuzzy Cognitive Maps for futures studies—A methodological assessment of concepts and methods. Futures 2014, 61, 45–57. [Google Scholar] [CrossRef]
  57. Bevilacqua, M.; Ciarapica, F.E.; Marcucci, G.; Mazzuto, G. Fuzzy cognitive maps approach for analysing the domino effect of factors affecting supply chain resilience: A fashion industry case study. Int. J. Prod. Res. 2019, 58, 6370–6398. [Google Scholar] [CrossRef]
  58. Wang, L.; Zeng, X.; Koehl, L.; Chen, Y. A Human Perception-Based Fashion Design Support System for Mass Customization. In Knowledge Engineering and Management. Advances in Intelligent Systems and Computing; Sun, F., Li, T., Li, H., Eds.; Springer: Berlin/Heidelberg, Germany, 2014; Volume 214. [Google Scholar] [CrossRef]
  59. Kosko, B. Fuzzy cognitive maps. Int. J. Man-Mach. Stud. 1986, 24, 65–75. [Google Scholar] [CrossRef]
  60. Axelrod, R.M. Structure of Decision: The Cognitive Maps of Political Elite; Princeton University Press: Princeton, NJ, USA, 1976. [Google Scholar]
  61. Stylios, C.D.; Groumpos, P.P. Modeling Complex Systems Using Fuzzy Cognitive Maps. IEEE Trans. Syst. Man Cybern. A Syst. Hum. 2004, 34, 155–162. [Google Scholar] [CrossRef]
  62. Barbrook-Johnson, P.; Penn, A.S. Fuzzy Cognitive Mapping. In Systems Mapping; Springer International Publishing: Cham, Switzerland, 2022; pp. 79–95. [Google Scholar] [CrossRef]
  63. Skjott Linneberg, M.; Korsgaard, S. Coding qualitative data: A synthesis guiding the novice. Qual. Res. J. 2019, 19, 259–270. [Google Scholar] [CrossRef]
  64. Uchańska-Bieniusiewicz, A.; Obłój, K. Disrupting fast fashion: A case study of Shein’s innovative business model. Int. Entrep. Rev. 2023, 9, 47–59. [Google Scholar] [CrossRef]
  65. Caro, F.; Martínez-de-Albéniz, V. Fast Fashion: Business Model Overview and Research Opportunities. In Retail Supply Chain Management; Agrawal, N., Smith, S., Eds.; International Series in Operations Research & Management Science; Springer: Boston, MA, USA, 2015; Volume 223. [Google Scholar] [CrossRef]
  66. Borkar, R. Fast Fashion Market Growth Trends, Top Companies, Global Insights and Adoption. Analysis Sphere. Available online: https://analysissphere.com/fast-fashion-market/ (accessed on 15 December 2025).
  67. H&M Group. H&M Group-Annual and Sustainability Report 2023. 2024. Available online: https://hmgroup.com/wp-content/uploads/2024/03/HM-Group-Annual-and-Sustainability-Report-2023.pdf (accessed on 25 February 2025).
  68. Sapaloglu, I.; Ajas, İ.İ.; Yıldırım, N. A Strategic Roadmap to Circularization of the Turkish Textile and Ready-To-Wear Industry Within the Context of the European Green Deal. Bus. Strategy Dev. 2025, 3, e70153. [Google Scholar] [CrossRef]
  69. Papageorgiou, E.I.; De Roo, J.; Huszka, C.; Colaert, D. Formalization of treatment guidelines using Fuzzy Cognitive Maps and semantic web tools. J. Biomed. Inform. 2012, 45, 45–60. [Google Scholar] [CrossRef]
  70. Mehryar, S.; Sliuzas, R.; Sharifi, A.; Reckien, D.; van Maarseveen, M. A structured participatory method to support policy option analysis in a social-ecological system. J. Environ. Manag. 2017, 197, 360–372. [Google Scholar] [CrossRef]
  71. Morone, P.; Falcone, P.M.; Lopolito, A. How to promote a new and sustainable food consumption model: A fuzzy cognitive map study. J. Clean. Prod. 2019, 208, 563–574. [Google Scholar] [CrossRef]
  72. Papageorgiou, K.; Singh, P.K.; Papageorgiou, E.; Chudasama, H.; Bochtis, D.; Stamoulis, G. Fuzzy Cognitive Map-Based Sustainable Socio-Economic Development Planning for Rural Communities. Sustainability 2020, 12, 305. [Google Scholar] [CrossRef]
  73. Snedecor, G.W.; Cochran, W.G. Statistical Methods, 8th ed.; Iowa State University Press: Ames, IA, USA, 1989. [Google Scholar]
  74. Sarmiento, I.; Cockcroft, A.; Dion, A.; Belaid, L.; Silver, H.; Pizarro, K.; Pimentel, J.; Tratt, E.; Skerritt, L.; Ghadirian, M.Z.; et al. Fuzzy cognitive mapping in participatory research and decision making: A practice review. Arch. Public Health 2024, 82, 76. [Google Scholar] [CrossRef]
  75. Aguilar, J. A survey about Fuzzy Cognitive maps papers. Int. J. Comput. Cogn. 2005, 3, 27–33. [Google Scholar]
  76. Chen, C.-T.; Chiu, Y.-T. A study of dynamic fuzzy cognitive map model with group consensus based on linguistic variables. Technol. Forecast. Soc. Change 2021, 171, 120948. [Google Scholar] [CrossRef]
  77. Dion, A.; Nakajima, A.; McGee, A.; Andersson, N. How Adolescent Mothers Interpret and Prioritize Evidence About Perinatal Child Protection Involvement: Participatory Contextualization of Published Evidence. Child Adolesc. Soc. Work J. 2022, 39, 785–803. [Google Scholar] [CrossRef]
  78. Farahani, H. Fuzzy Cognitive Maps for Impact Assessment in Psychological Research: Case Study of Psychological Well-being. In Proceedings of the 3rd International Conference on Modern Approach in Humanities and Social Sciences, Acavent, Amsterdam, The Netherlands, 26–28 February 2021. [Google Scholar] [CrossRef]
  79. Soler, L.S.; Kok, K.; Camara, G.; Veldkamp, A. Using fuzzy cognitive maps to describe current system dynamics and develop land cover scenarios: A case study in the Brazilian Amazon. J. Land Use Sci. 2012, 7, 149–175. [Google Scholar] [CrossRef]
  80. Brandl, L.; Van Velsen, L.; Brodbeck, J.; Jacinto, S.; Hofs, D.; Heylen, D. Developing an eMental health monitoring module for older mourners using fuzzy cognitive maps. Digital Health 2023, 9, 20552076231183549. [Google Scholar] [CrossRef] [PubMed]
  81. Gray, S.A.; Gray, S.; Cox, L.J.; Henly-Shepard, S. Mental Modeler: A Fuzzy-Logic Cognitive Mapping Modeling Tool for Adaptive Environmental Management. In Proceedings of the 46th Hawaii International Conference on System Sciences, Wailea, HI, USA, 7–10 January 2013; pp. 965–973. [Google Scholar] [CrossRef]
  82. Casciani, D.; Bertolini, M. Towards a sustainable on-demand fashion industry: The impact of digital body measurement technologies. Discov. Sustain. 2025, 6, 478. [Google Scholar] [CrossRef]
  83. Arrigo, E. Digital platforms in fashion rental: A business model analysis. J. Fashion Mark. Manag. 2022, 26, 1–20. [Google Scholar] [CrossRef]
  84. Clube, R.K.M.; Tennant, M. Exploring garment rental as a sustainable business model in the fashion industry: Does contamination impact the consumption experience? J. Consum. Behav. 2020, 19, 359–370. [Google Scholar] [CrossRef]
  85. Niinimäki, K. Designing for (Extended) Product and Material Lifetimes. In Recycling and Lifetime Management in the Textile and Fashion Sector, 1st ed.; CRC Press: Boca Raton, FL, USA, 2024; p. 13. [Google Scholar]
  86. Liu, N.; Xie, F. Sustainable Practices in Fast Fashion. In Operations Management in the Era of Fast Fashion; Chan, H.-L., Ren, S., Liu, E.N., Eds.; Springer Series in Fashion Business; Springer Nature: Singapore, 2022; pp. 29–45. [Google Scholar] [CrossRef]
  87. Yerushalmi, E.; Saha, K. How Circular Economy Innovation Can Backfire on the Environment: Quantifying the Rebound Effect of the Textiles and Clothing Sector. Bus. Strategy Environ. 2025, 34, 10495–10512. [Google Scholar] [CrossRef]
Figure 1. The fast fashion supply chain and its main impacts on the environment.
Sustainability 18 03141 g001
Figure 2. Steps of the methodology adopted.
Sustainability 18 03141 g002
Figure 3. FCM of CE and sustainability strategies in fast fashion and their environmental impacts.
Sustainability 18 03141 g003
Figure 4. Effects of the single strategies on the environmental impacts considered (FCM simulation).
Sustainability 18 03141 g004
Figure 5. Effects of the three policies defined on the environmental impacts considered (FCM simulation).
Sustainability 18 03141 g005
Table 1. Main CE and sustainability strategies identified in the two case studies.
StrategyInditexH&M
ObjectiveCurrent ValueObjectiveCurrent Value
Sustainable
materials
By 2030, 100% of textile products will only use
lower-impact materials (25% fibers from new generation materials; 40% from recycling; 25% from organic farming; 10% other)
18% recycled materials in 2023; from 52% to 96% lower-impact materials, depending on material type100% of materials sustainably sourced by 203085%
30% recycled materials by 2025, 50% by 203025%
Life extensionIncrease number n of markets providing Zara pre-owned program (repair, reuse and resell)16Increase number of markets providing H&M Take care & repair program60 (100%)
Increase number of markets (including stores
and online) with resell
11
Waste reductionClothing Collection Program20,259 t collected (67% reused or resold, 33% recycled or disposed)Garment collection16,800 t clothes collected (68% reused, 24% recycled, 8% disposed)
Sustainable
production process
Improving sustainability of production processes such as washing, pretreatment, coloration (dyeing and printing) and finishingN/A *Improving sustainability of production processes such as washing, pretreatment, coloration (dyeing and printing) and finishingN/A *
Sustainable
packaging
100% of packaging materials reused or recycled by 2023100%Absolute reduction in plastic packaging of 25% by 2025 (2018 baseline)−55%
50% reduction in plastic footprint by
2025 (2019 baseline)
N/A *Design 100% of packaging to be recyclable, and where relevant reusable, by 2025N/A *
Make 100% of packaging from recycled or sustainably sourced materials by 203079%
Reuse or recycle 100% of packaging from own sites by 2025N/A *
Energy efficiencyReduction in relative energy consumption per square meter (2018 baseline)−19%25% reduction in electricity
intensity in stores by 2030 (2016 baseline)
−29%
Renewable energyShare of electricity produced from renewable energy100%Sourcing of 100% renewable electricity in
the supply chain by 2030
N/A *
Sourcing of 100% renewable electricity in operations by 203094%
Water efficiencyRelative water consumption reduction (2020 baseline)−20%% absolute reduction in freshwater extraction and consumption (2022 baseline)−14%
Sustainable
transportation
Use alternative fuels for at least 90% of maritime shipping by 2025N/A *support transport decarbonization (transport optimization, alternative fuels, preference for low-carbon transport options)−8% ktons CO2eq compared to 2022
* Not applicable.
Table 2. List of concepts included in the FCM.
CategoryConceptLegendDescriptionSources
StrategiesSustainably sourced
materials
S1Use of fibers from lower impact processes (ex. Organic farming, new generation synthetic materials)Cluster A [24,43]
Recycled materialsS2Use of recycled fibers
Sustainable production process S3Enhancing sustainability of textiles production processes such as washing, pretreatment, coloration (dyeing and printing) and finishing
Sustainable packagingS4Reduction in plastic packaging, use of recycled materials, reuse or recycle of packaging.
RepairS5Providing support services for repairing used garments instore
Reuse &
resell
S6Programs for second-hand garments sale (online or in store)
Textile waste
collection
S7Instore used garment collection for reuse (about 68%) or recycling
Energy
efficiency
S8Reduction in relative energy consumption in stores
Renewable energyS9Use of renewable energies for electricity consumed
Water
efficiency
S10Reduction in relative water consumption
Environmental impactsWater consumptionI1Total water consumptionCluster B [3,4,6,9,10,11,13,35,38,41,42]
CO2eq emissionsI2Total CO2eq emissions generated
Use of chemicalsI3Use of hazardous chemicals along the supply chain (especially for fibers production and textile transformation)
Textile waste I4Generation of pre-consumer (ex. Production waste, deadstock and returns) and post-consumer waste
Energy useI5Total consumption of energy
Land useI6Consumption of land for producing natural fibers
MicroplasticsI7Dispersion of microplastics in the environment (ex. From washing process of synthetic fibers)
Table 3. Matrix of weights of the constructed FCM.
S1S2S3S4S5S6S7S8S9S10I1I2I3I4I5I6I7
S1—Sustainably sourced materials-- 0.28 0.36−0.43−0.51−0.68 −0.5−0.47−0.5
S2—Recycled materials -- 0.19 0.29−0.56−0.57−0.53−0.62−0.5−0.52
S3—Sustainable production process -- 0.58 0.58−0.76−0.78−0.79−0.53−0.75
S4—Sustainable packaging -- −0.21−0.35 −0.19
S5—Repair programs -- 0.06 −0.47−0.52−0.52−0.78−0.52−0.47
S6—Reuse and resell --0.54 −0.48−0.57−0.53−0.73−0.55−0.47
S7—Textile waste collection 0.45 0.60-- −0.34−0.46−0.42−0.64−0.42−0.32
S8—Energy efficiency -- −0.88 −0.83
S9—Renewable energy -- −0.85
S10—Water efficiency --−0.97
I1—Water consumption --
I2—CO2eq emissions --
I3—Use of chemicals --
I4—Textile waste --
I5—Energy use --
I6—Land use --
I7—Microplastics --
Table 4. Characteristics of the FCM proposed.
FeatureValue
Total components [N]17
Total connections [C]52
Density [C/(N × (N − 1))]0.19
Connections per component [C/N]3.06
Number of driver components [D]5
Number of receiver components [R]7
Number of ordinary components [O]5
Complexity score 1.4
Table 5. Network analysis of the FCM.
CategoryConceptIn-DegreeOut-DegreeCentrality
CE and sustainability strategiesS1—Sustainably sourced materials03.733.73
S2—Recycled materials0.453.784.23
S3—Sustainable production process 04.774.77
S4—Sustainable packaging00.740.74
S5—Repair03.343.34
S6—Reuse and resell0.63.874.47
S7—Textile waste collection0.63.654.25
S8—Energy efficiency1.051.712.76
S9—Renewable energy00.850.85
S10—Water efficiency1.230.972.2
Environmental impactsI1—Water consumption4.2104.21
I2—CO2eq emissions5.4905.49
I3—Use of chemicals3.4703.47
I4—Textile waste 3.303.3
I5—Energy use4.2604.26
I6—Land use2.2502.25
I7—Microplastics0.500.5
Table 6. Summary of the impacts of the different strategies (S1 to S10) or strategy mix (P1 to P3) on the environmental impacts considered (for each impact, the highest effect is highlighted in green for the single strategies and in blue for the strategy mix).
Active Strategies/
Policies
I1I2I3I4I5I6I7
S1−0.02−0.01−0.04 −0.02−0.04−0.06
S2−0.02−0.01−0.02−0.03−0.02−0.04
S3−0.03−0.02−0.04−0.03−0.03
S4−0.01−0.01 −0.01
S5−0.02−0.01−0.03−0.04−0.02−0.04
S6−0.02−0.01−0.03−0.04−0.02−0.04
S7−0.01−0.01−0.02−0.04−0.02−0.03
S8 −0.01 −0.02
S9 −0.02
S10−0.02
P1−0.03−0.02−0.05−0.03−0.03−0.07−0.06
P2−0.05−0.03−0.04−0.03−0.04
P3−0.04−0.02−0.06−0.08−0.04−0.09
Table 7. Effect of the different strategies and mix on the environmental impacts, ranked from highest (indicated in darker green) to lowest influence (in lighter shades of green).
PositionI1I2I3I4I5I6I7
1P2−0.05P2−0.03P3−0.06P3−0.08P2−0.04P3−0.09P1−0.06
2P3−0.04P1−0.02P1−0.05S5−0.04P3−0.04P1−0.07S1−0.06
3P1−0.03P3−0.02P2−0.04S6−0.04P1−0.03S1−0.04P20
4S3−0.03S3−0.02S1−0.04S7−0.04S3−0.03S2−0.04P30
5S1−0.02S9−0.02S3−0.04P1−0.03S1−0.02S5−0.04S20
6S2−0.02S1−0.01S5−0.03P2−0.03S2−0.02S6−0.04S30
7S5−0.02S2−0.01S6−0.03S2−0.03S5−0.02S7−0.03S40
8S6−0.02S4−0.01S2−0.02S3−0.03S6−0.02P20S50
9S10−0.02S5−0.01S7−0.02S10S7−0.02S30S60
10S4−0.01S6−0.01S40S40S8−0.02S40S70
11S7−0.01S7−0.01S80S80S4−0.01S80S80
12S80S8−0.01S90S90S90S90S90
13S90S100S100S100S100S100S100
Table 8. Values of transversality and preferability of the strategies and policies analyzed.
Active Strategy/PolicyTransversality (N° of Impacts Involved)Preferability (Best Strategy for N Impacts)
S1—Sustainably sourced materials63
S2—Recycled materials61
S3—Sustainable production process 54
S4—Sustainable packaging30
S5—Repair62
S6—Reuse and resell62
S7—Textile waste collection61
S8—Energy efficiency20
S9—Renewable energy11
S10—Water efficiency10
P1—Sustainability of materials71
P2—Sustainability of the production process53
P3—Closing the loop64
Table 9. Cross analysis on transversality and preferability of the strategies and policies analyzed.
Transversality Level
LowMediumHigh
Preferability levelHigh S3
Medium S1, P2, P3
LowS8, S9, S10S4S2, S5, S6, S7, P1
Disclaimer/Publisher’s Note: The statements, opinions and data contained in all publications are solely those of the individual author(s) and contributor(s) and not of MDPI and/or the editor(s). MDPI and/or the editor(s) disclaim responsibility for any injury to people or property resulting from any ideas, methods, instructions or products referred to in the content.