Article

Simulation of Soil Erosion on the Yunnan–Guizhou Plateau Under Future Climate Scenarios Based on the SSPs-RUSLE Coupled Model

1
School of Electronic, Electrical and Systems Engineering, University of Birmingham, Edgbaston, Birmingham B15 2TT, UK
2
School of Infrastructure Engineering, Nanchang University, Nanchang 330031, China
*
Author to whom correspondence should be addressed.
Sustainability 2026, 18(6), 2928; https://doi.org/10.3390/su18062928
Submission received: 29 December 2025 / Revised: 19 February 2026 / Accepted: 2 March 2026 / Published: 17 March 2026
(This article belongs to the Special Issue Sediment Movement, Sustainable Water Conservancy and Water Transport)

Abstract

Soil erosion on the Yunnan–Guizhou Plateau (YGP) has a significant impact on the water sources and ecological safety of Southeast Asia and South China. With the influence of climate change, this erosion has been altered, which will create uncertainty regarding soil erosion management and social development in China and Southeast Asia. However, existing research still lacks simulations of soil erosion in large-scale regions, as well as a systematic understanding of the spatiotemporal characteristics of future soil erosion under climate change. Therefore, a coupled model of the Shared Socioeconomic Pathways (SSPs) and the Revised Universal Soil Loss Equation (RUSLE) at the regional scale of the YGP is proposed in this study. By analyzing the erosion patterns in the YGP, this research determines the optimal future scenario and corresponding mitigation strategies, thereby offering a localized practical reference for soil erosion control in the YGP and its alignment with the UN SDGs. The results show the following: (i) Temporally, soil erosion on the YGP will improve in the future. The overall soil erosion moduli of the YGP decrease by 196.86, 367.03, and 391.72 t/(km2·a) under the scenarios of SSPs1-1.9, SSPs2-4.5, and SPPs5-8.5, respectively. (ii) Spatially, soil erosion in the southwestern and central-northern parts of the YGP will be significantly improved in the future. The soil erosion moduli of the karstic and non-karstic areas gradually become close to each other, with the difference in soil erosion moduli between them in SSPs1-1.9, SSPs2-4.5, and SSPs5-8.5 being reduced from 671.65 t/(km2·a) to 623.79, 592.21, and 611.92 t/(km2·a), respectively. (iii) Among the different SSP scenarios, the SSPs2-4.5 scenario aligns most closely with the principles of sustainable development, making it the most desirable pathway. To ensure the long-term effectiveness of soil erosion control under changing climate and socioeconomic conditions, future strategies should take the SSPs2-4.5 scenario as a core reference and implement resilient portfolios of mitigation measures.

1. Introduction

The Yunnan–Guizhou Plateau (YGP) is the headwaters and upper reaches of the Yangtze, Pearl, and Lancang rivers, and so on in Asia [1]. Its soil erosion seriously affects the water/sand balance and ecological safety of these rivers [2]. In turn, it has a serious impact on soil erosion control and agricultural production and economic development in China and downstream Southeast Asian countries [3].
Recently, climate change has led to a trend of decreasing total rainfall yet increasing extreme weather events in the YGP [4]. This phenomenon not only exacerbates soil erosion but also significantly enhances the consistency of its physical properties and spatial structure due to the high sensitivity of the regional underlying surface to dry/wet changes [5,6]. Consequently, erosion drivers become increasingly complex, making it more challenging to accurately predict the spatiotemporal dynamics and future trends of soil erosion in the YGP [7]. It creates many uncertainties regarding soil erosion conservation and social development in China and Southeast Asian countries [3]. However, existing research primarily focuses on modeling the spatiotemporal patterns of soil erosion during the historical period at a small regional scale within the YGP [8,9,10]. This highlights a research gap concerning basin-wide soil erosion patterns and future projections for the YGP.
The Revised Universal Soil Loss Equation (RUSLE) potentially allows researchers to model soil erosion on the scale of the whole YGP [8]. Notably, Aslam et al. integrated the RUSLE model with Markov chain modeling to project soil erosion magnitudes under multiple scenarios in Chitral for 2030 and 2040 [11]. Liu et al. developed a soil erosion simulation (SES) framework incorporating the RUSLE to predict erosion dynamics in Northeast China [12]. Rendana et al. employed the RUSLE to predict soil erosion in the Langat River Basin [13]. Combined with existing research findings, the RUSLE framework has achieved widespread adoption in erosion prediction studies due to its operational simplicity, broad applicability, and reduced data dependency [14].
The Shared Socioeconomic Pathways (SSPs) can be used to predict soil erosion. They were proposed by the Intergovernmental Panel on Climate Change (IPCC) in 2010 [15]. Each scenario integrates socioeconomic development, climate policies, and emission reduction targets, reflecting different assumptions about population trends, economic growth, technological progress, and environmental governance [16]. Therefore, SSPs have been extensively employed in various fields. Lü et al. utilized an ensemble of five global climate models to evaluate future climate conditions under seven different scenarios in the Belt and Road region [17]. Wen et al. projected the spatiotemporal evolution of temperature and precipitation across the Yangtze River Basin over various future periods under multiple SSPs [18]. Based on existing research findings, the SSP framework not only serves as a source for climate projections but also provides a structured narrative for exploring diverse socioeconomic futures and their implications for sustainable policies [15]. SSPs have become the cornerstone for conducting climate change impact assessments.
However, existing research has rarely focused on predicting future soil erosion in large-scale regions using either the RUSLE model or SSPs, and studies coupling the two for future forecasting and assessment are even more scarce. This limitation hinders the development of long-term sustainable development plans that account for uncertainty: it prevents a comprehensive understanding of soil erosion at the YGP scale. Moreover, soil and water conservation strategies cannot be adjusted in advance to adapt to future changes.
Therefore, this study focuses on the spatiotemporal variation characteristics of soil erosion in the YGP during the historical period (2000–2022) and the future period (2030–2060). By structurally integrating climate scenarios with erosion process models, an SSPs-RUSLE coupled model is established to simulate soil erosion in the YGP under future climate scenarios. Then, based on the simulation results, the spatiotemporal characteristics of soil erosion across different subregions within the YGP are evaluated. Targeted measures and solutions are proposed to provide a reference basis for local soil erosion management and strategic planning for ecological and economic development in downstream Southeast Asian countries.
The coupling logic is as follows: (i) Downscale and bias-correct future meteorological data at the YGP scale under different shared socioeconomic pathways using the Delta method, ensuring temporal and spatial consistency with current data. (ii) Integrate the preprocessed data to calculate the required parameter factors for the RUSLE model, thereby accurately simulating and predicting soil erosion conditions under various scenarios across different periods in the YGP.

2. Methods and Materials

2.1. Study Area and Data Sources

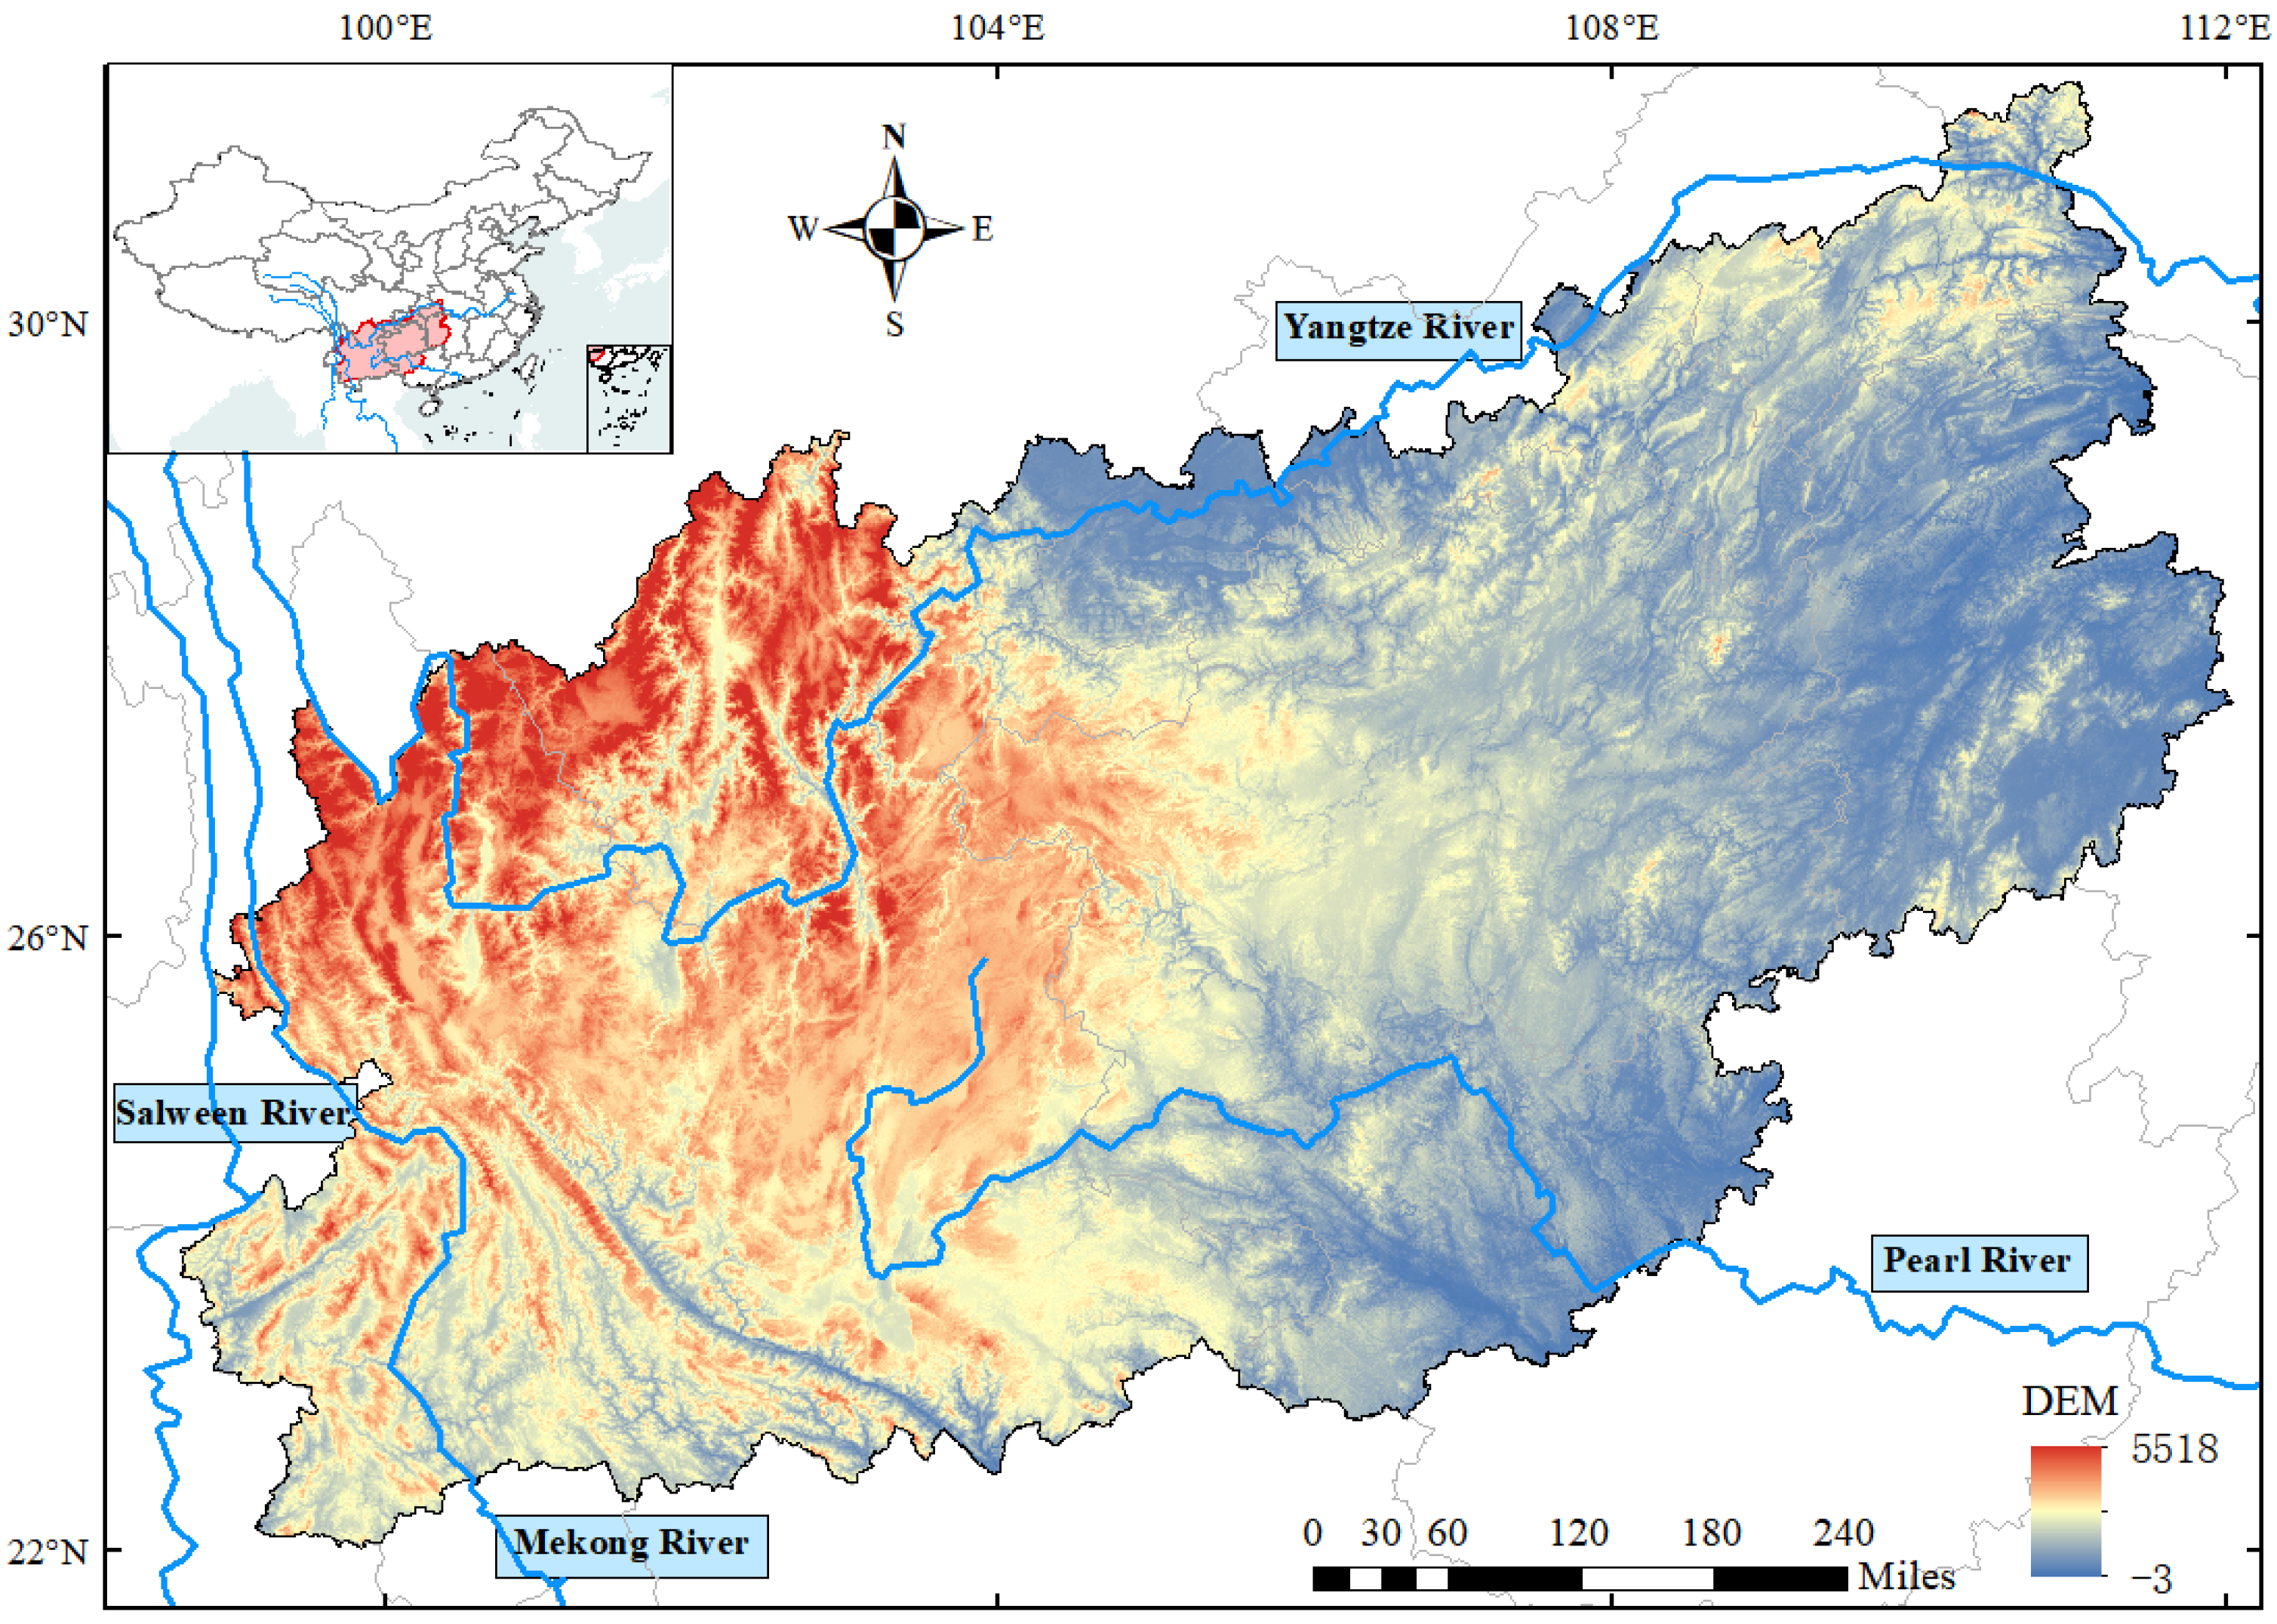
The study area is shown in Figure 1.
The Yunnan–Guizhou Plateau (YGP) is located between 100°~111°E and 22°~30°N. Its altitude ranges from 400 to 3500 m, and the terrain gradually declines from northwest to southeast. As shown in Figure 1, the YGP serves as the headwater and upper reaches of several major river systems, including the Jinsha River (Yangtze), the South and North Panjiang (Pearl River), the Lancang River (Mekong) and the Nujiang (Salween) [1]. Notably, the Lancang and Nujiang Rivers are international watercourses flowing through multiple Southeast Asian nations downstream. This unique geographical location renders soil erosion in the YGP critically influential to the sediment/water balance of these rivers, which will in turn impact the socioeconomic development of China and downstream countries in Southeast Asia [3].
According to detailed land use data analysis, the YGP is predominantly characterized by paddy soils, red soils, and yellow soils [19]. The region exhibits extensive limestone distribution and fragmented topography, representing one of the world’s most developed karst landscapes [4]. Furthermore, steep terrain, high elevation, and frequent torrential rainfall render the thin-layer skeletal soils and clastic weathering materials in this area highly susceptible to erosion [20].
Each data source is shown in Table 1.
Notably, simulating future soil erosion requires the integration of multi-source, multi-resolution spatial data with future climate scenario data—a process that introduces unavoidable uncertainty. On the one hand, the native spatial resolution of simulated future climate data differs significantly from that of the geospatial data used in the YGP [21]. This implies that raw climate data outputs cannot capture the local precipitation variations driven by the complex topography of the YGP. On the other hand, future climate projections inherently carry a degree of uncertainty, primarily manifested as differences in the physical responses of various climate models to changes in greenhouse gas concentrations [22]. Blindly combining multiple climate model ensembles may exacerbate this uncertainty. Therefore, it is necessary to reduce and quantify the uncertainty introduced during data processing by selecting representative climate models through intercomparison, applying appropriate downscaling methods, and incorporating relative error and relative expanded uncertainty [23,24].

2.2. Rainfall Data for Shared Socioeconomic Pathways (SSPs)

The SSPs were developed by the Intergovernmental Panel on Climate Change (IPCC) as an extension of the Representative Concentration Pathways (RCPs) [15]. This integrated approach represents the target of achieving the corresponding radiative forcing by implementing certain climate mitigation and policies under a certain socioeconomic development pathway [16]. In particular, while multi-model ensemble averaging can reduce the uncertainty inherent in individual models, it may smooth out critical regional or extreme climate signals, thereby diminishing the differences between scenarios [25].
Therefore, this study selected SSPs data from the EC-Earth3 model of CMIP6 as the input for future rainfall projections [26]. This model can maintain consistency in scenario comparisons while more clearly revealing the potential impacts under different SSPs [26]. EC-Earth3 is a representative high-performance Earth system model within CMIP6, featuring well-developed physical processes and stable simulation performance. It has been extensively validated and applied in global and regional climate change research, providing reliable data support for rainfall changes over the YGP under different SSPs [26].
Building upon this foundation and integrating current research findings, the three SSP scenarios SSPs1-1.9, SSPs2-4.5, and SSPs5-8.5 were selected. They not only represent three typical development pathways—sustainable development, intermediate development, and high resource consumption, effectively covering the full spectrum from active mitigation to high emissions—but have also been widely adopted as a core framework in studies of future precipitation changes [27,28].
The details of the three future scenarios are shown in Table 2.
As shown in Table 2, the three scenarios exhibit distinct socioeconomic trajectories [29]. Among them, the SSPs1-1.9 scenario represents a sustainable development pathway. It is the most desirable low-carbon social scenario under future climate change. The SSPs2-4.5 scenario represents a medium development pathway. The current policies and technologies continue to be used and are optimized in this scenario to a degree. The SSPs5-8.5 scenario represents a high resource consumption pathway. The large-scale resource depletion contributes to more severe environmental damage in the future.
Additionally, to address the differences in resolution among data from various sources, downscaling and bias correction must be applied to the climate data in the aforementioned scenarios [23,24]. Specifically, the Delta downscaling method can effectively preserve the relative change signals of the original data while performing downscaling. Meanwhile, the quantile mapping method not only corrects mean values but also adjusts the overall probability distribution of the variables. The application of these two methods can effectively improve the simulation of precipitation frequency and intensity.
The baseline period was set from 1980 to 2014, and the validation period was set from 2015 to 2022. On a monthly basis, spatial downscaling is performed with the Delta change factor method, combined with quantile mapping for systematic bias correction.
The Delta downscaling method is as follows [23]:
P f = P o × P G f P G o
where P G f is the precipitation series in the EC-Earth3 model, P G o is the multi-year mean precipitation simulated by the climate model during the reference period, and P o is the multi-year mean precipitation at meteorological stations during the reference period.
The quantile mapping method for bias correction is as follows [24]:
x ^ m , p t = x ^ o : m , h : p t + Δ m t
x ^ o : m , h : p t = F o , h 1 τ m , p t
Δ m t = x m , p t F m , h 1 τ m , p t
where x ^ m , p t is the bias correction for future predicted data, x ^ o : m , h : p t is the bias correction for actual base observations, Δ m t is the relative change of the model data between the actual and future predicted data, τ m , p t is the percentile of the x ^ m , p t in the empirical cumulative density F for the time near t, F o , h 1 is the inverse of the empirical cumulative density function of the actual observed data, and F m , h 1 is the inverse of the empirical cumulative density function of the future predicted data.
A comparison of the differences between simulated and observed monthly precipitation for the historical period before and after calibration of the EC-Earth3 model is presented in Table 3.
Table 3 shows that both the MB and RMSE of the calibrated model data decreased significantly, indicating that the deviation correction method effectively enhances the climate representativeness of the model outputs in the study area. The calibrated data can be applied to future soil erosion simulation calculations.
Furthermore, based on independent validation during 2015–2022, the mean relative errors (MREs) of monthly precipitation from the bias-corrected EC-Earth3 model under the SSPs1-1.9, SSPs2-4.5, and SSPs5-8.5 scenarios were +1.2%, −0.3%, and +1.7%, respectively. All MRE values passed the t-test at the 5% significance level, indicating that the systematic bias is negligible. The standard deviations of relative error (SD_RE) for the three scenarios were 4.7%, 3.9%, and 5.4%, respectively. The slightly higher SD_RE under SSPs5-8.5 may be related to the amplified simulation bias in extreme precipitation events. Assuming that the error characteristics remain unchanged in the future, the uncertainty ranges of monthly precipitation data under the three scenarios for 2030–2060 were ±9.4%, ±7.8%, and ±10.8%, respectively, at the 95% confidence level. None of these ranges exceeded the overlap range of uncertainty, suggesting that the differential impacts of emission pathways on regional precipitation are statistically robust.

2.3. Methodology for Revised Universal Soil Loss Equation (RUSLE)

The RUSLE is an improvement on the Universal Soil Loss Equation (USLE) [30]. It is calculated as follows:
A = R × K × L S × C × P
where A is the soil erosion modulus (t/(km2·a)), R is the rainfall erosivity factor ((MJ·mm)/(hm2·h·a)), K is the soil erodibility factor ((t·hm2·h)/(hm2·MJ·mm)), LS is the slope length and steepness factor (dimensionless), C is the cover management factor (dimensionless), and P is the conservation practice factor (dimensionless) (t/(km2·a)).
Meanwhile, the factors in the model of this study are calculated as follows:
(i)
Factor R
The factor R is calculated as follows [31]:
R = α 2 F β 2
F = i = 1 12 P i 2 × P 1
where R represents the rainfall erosivity factor ((MJ·mm)/(hm2·h·a)); P represents the annual average rainfall (mm); P i represents the average rainfall for the i-th month (mm); α 2 and β 2 are model parameters, which in this study are set to 0.3589 and 1.9462, respectively, based on the literature; and F represents index correlates with the seasonal distribution of annual average rainfall P .
(ii)
Factor K
The factor K is calculated as follows [32]:
K = 0.2 + 0.3 exp 0.0256 S 1 F 100 × F N F 0.3 × 1 0.25 T T + exp 3 . 75 2 . 95 T × 1 0.7 S n 1 S n 1 + exp 5.51 + 22.9 S n 1
where K represents the soil erodibility factor ((t·acre·h)/(100·acre·ft·tanf·in)). The results of these calculations need to be multiplied by a conversion coefficient of 0.1317 to obtain the International System of Units equivalent (t·hm2·h)/(hm2·MJ·mm). S , F , N , and T represent the percentage contents of sand, silt, clay, and organic carbon in the soil (%), respectively. Among them,
S n 1 = 1 S / 100
(iii)
Factor LS
The slope length factor L is calculated as follows [33]:
L = λ 22.13 m
λ = l × cos α
where L represents the slope length factor (dimensionless), λ represents the horizontal projected slope length (m), l represents the overland flow length along the direction (m), α represents the slope of water flow areas (°), and m represents the variable slope exponent determined as follows:
m = 0.2 θ < 0.57 ° 0.3 0.57 ° θ < 1.72 ° 0.4 1.72 ° θ < 2.56 ° 0.5 2.56 ° θ
where θ represents the variable slope (°).
The slope steepness factor S is calculated using a graded approach: the methodology developed by Liu et al. is applied when the slope exceeds 10° [34], whereas the formulation of McCool et al. is adopted conversely [35].
S = 10.80 × sin θ + 0.03 θ < 5 ° 16.80 × sin θ 0.50 5 ° θ 10 ° 21.91 × sin θ 0.96 θ > 10 °
where S represents the slope steepness factor (dimensionless).
(iv)
Factor P
This study determines factor P by referencing previous research on related regions and considering land use patterns within the study area [36,37,38], as detailed in Table 4. Notably, for a given land use, a higher effectiveness of soil conservation measures corresponds to a lower P -value. Conversely, poor or degraded land cover increases erosion risk, resulting in a higher P -value.
(v)
Factor C
The conventional method of calculating factor C is not applicable to areas where karst is widely distributed [8]. Therefore, this study determines factor C by referencing prior research on related study regions and considering land use patterns within the study area, as detailed in Table 4 [37,38,39]. Notably, higher vegetation cover strengthens the suppression of soil erosion, resulting in a lower C -value, and vice versa.

2.4. Methodology for the SSPs-RUSLE Coupled Model

The SSPs-RUSLE coupled model primarily integrates climate-driven data from SSPs with the erosion mechanisms of the RUSLE model to systematically simulate the spatiotemporal dynamics of soil erosion during both historical and future periods in the YGP.
The process of the SSPs-RUSLE coupled model is as follows: (i) Use the Delta downscaling method and the quantile mapping method to process the future data. (ii) Couple the processed future data with the RUSLE, and simulate mean annual soil erosion under the historical period (2000–2022) and three scenarios (SSPs1-1.9, SSPs2-4.5, and SSPs5-8.5) for the future period (2030–2050). (iii) Assess the spatiotemporal variations in soil erosion across different regions of the YGP based on the simulation results.
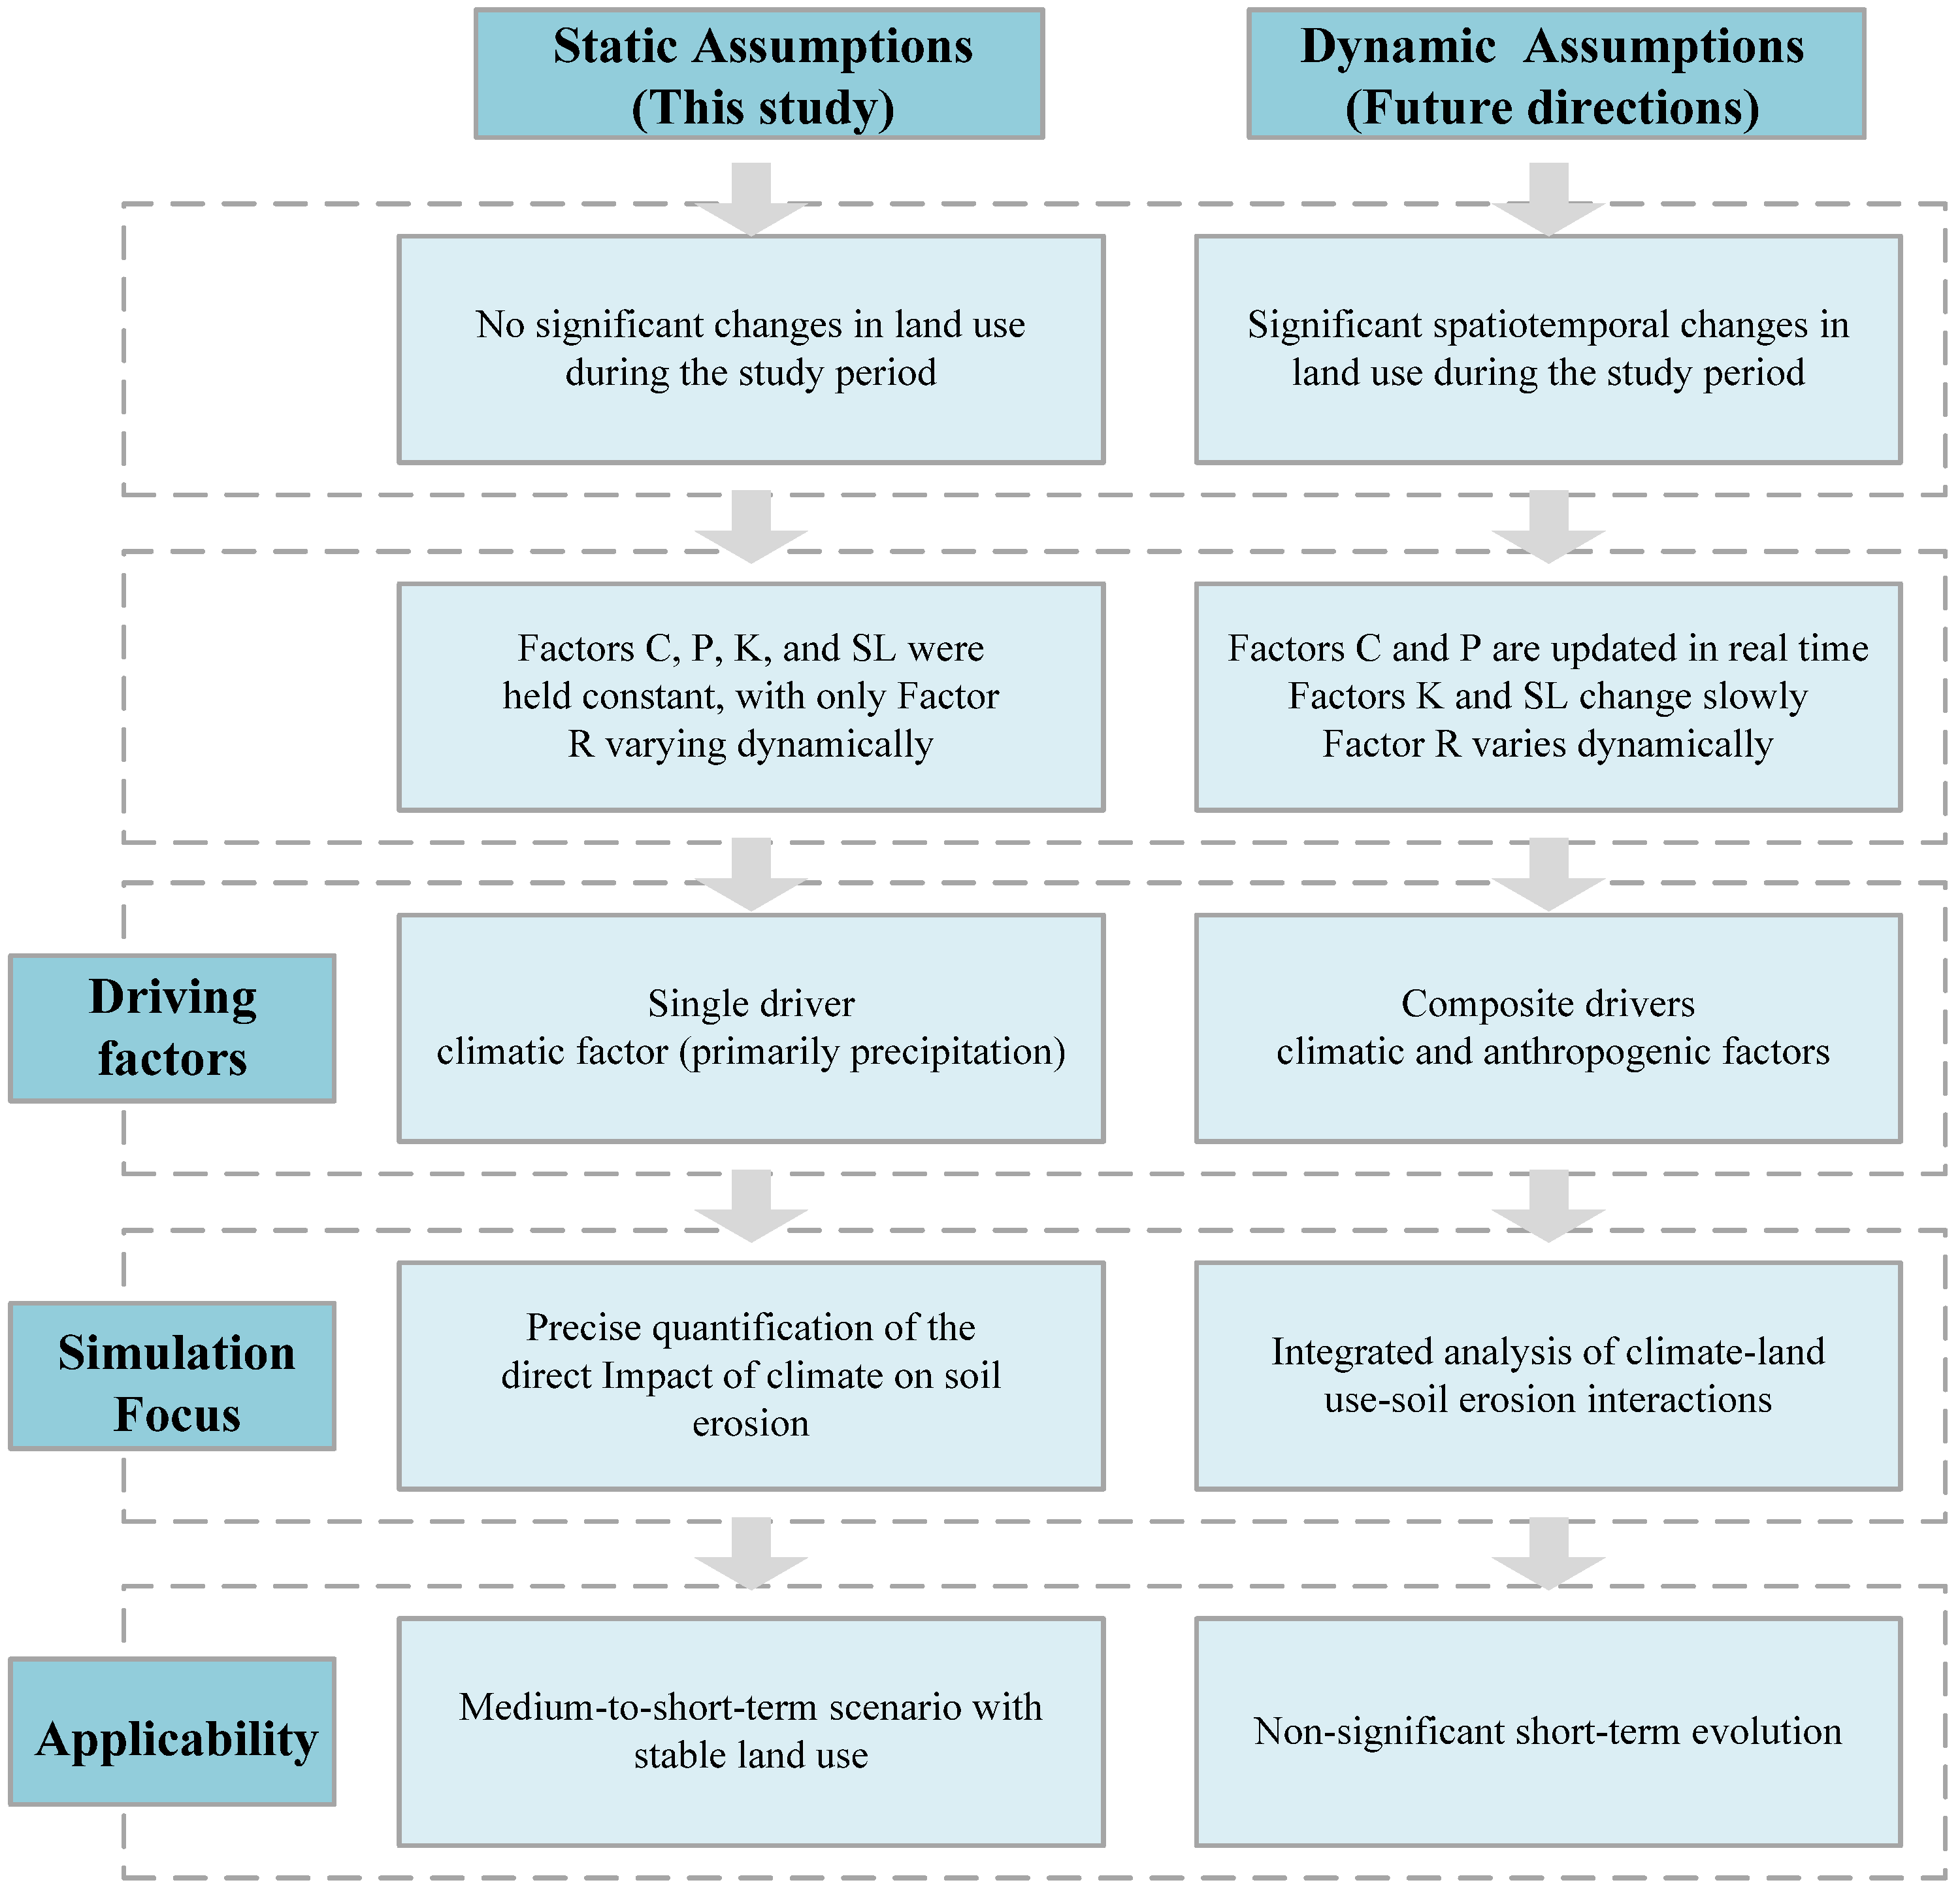
Specifically, the future period simulated in this study (2030–2060) is relatively short-term. Based on this, changes in topographic features depend on long-term processes such as tectonic movements and large-scale landform modification projects, and their magnitude of change is negligible in the short- to medium-term future [40]. Similarly, Li et al. indicate that the land use pattern in the YGP stabilized between 2000 and 2022 [41]. Concurrently, the YGP has established a relatively comprehensive soil and water conservation system, with low conversion rates among primary land use types such as cropland, forest, and shrubland, maintaining overall pattern stability [19]. Therefore, this study assumes that the distribution of C, K, P, and LS factors remains unchanged in future simulations, focusing primarily on the direct impact of precipitation variability on soil erosion.
To justify the static land use assumption in this study, the core features of static versus dynamic land use scenarios are compared and illustrated in Figure 2.
As shown in the figure, the dynamic land use scenario more comprehensively reflects the actual evolutionary characteristics of future soil erosion. However, given the medium-to-short-term timescale of this study and the regional characteristics of the YGP, the static scenario is more effective in isolating the direct driving effect of precipitation changes on soil erosion.

3. Results

3.1. Soil Erosion on YGP

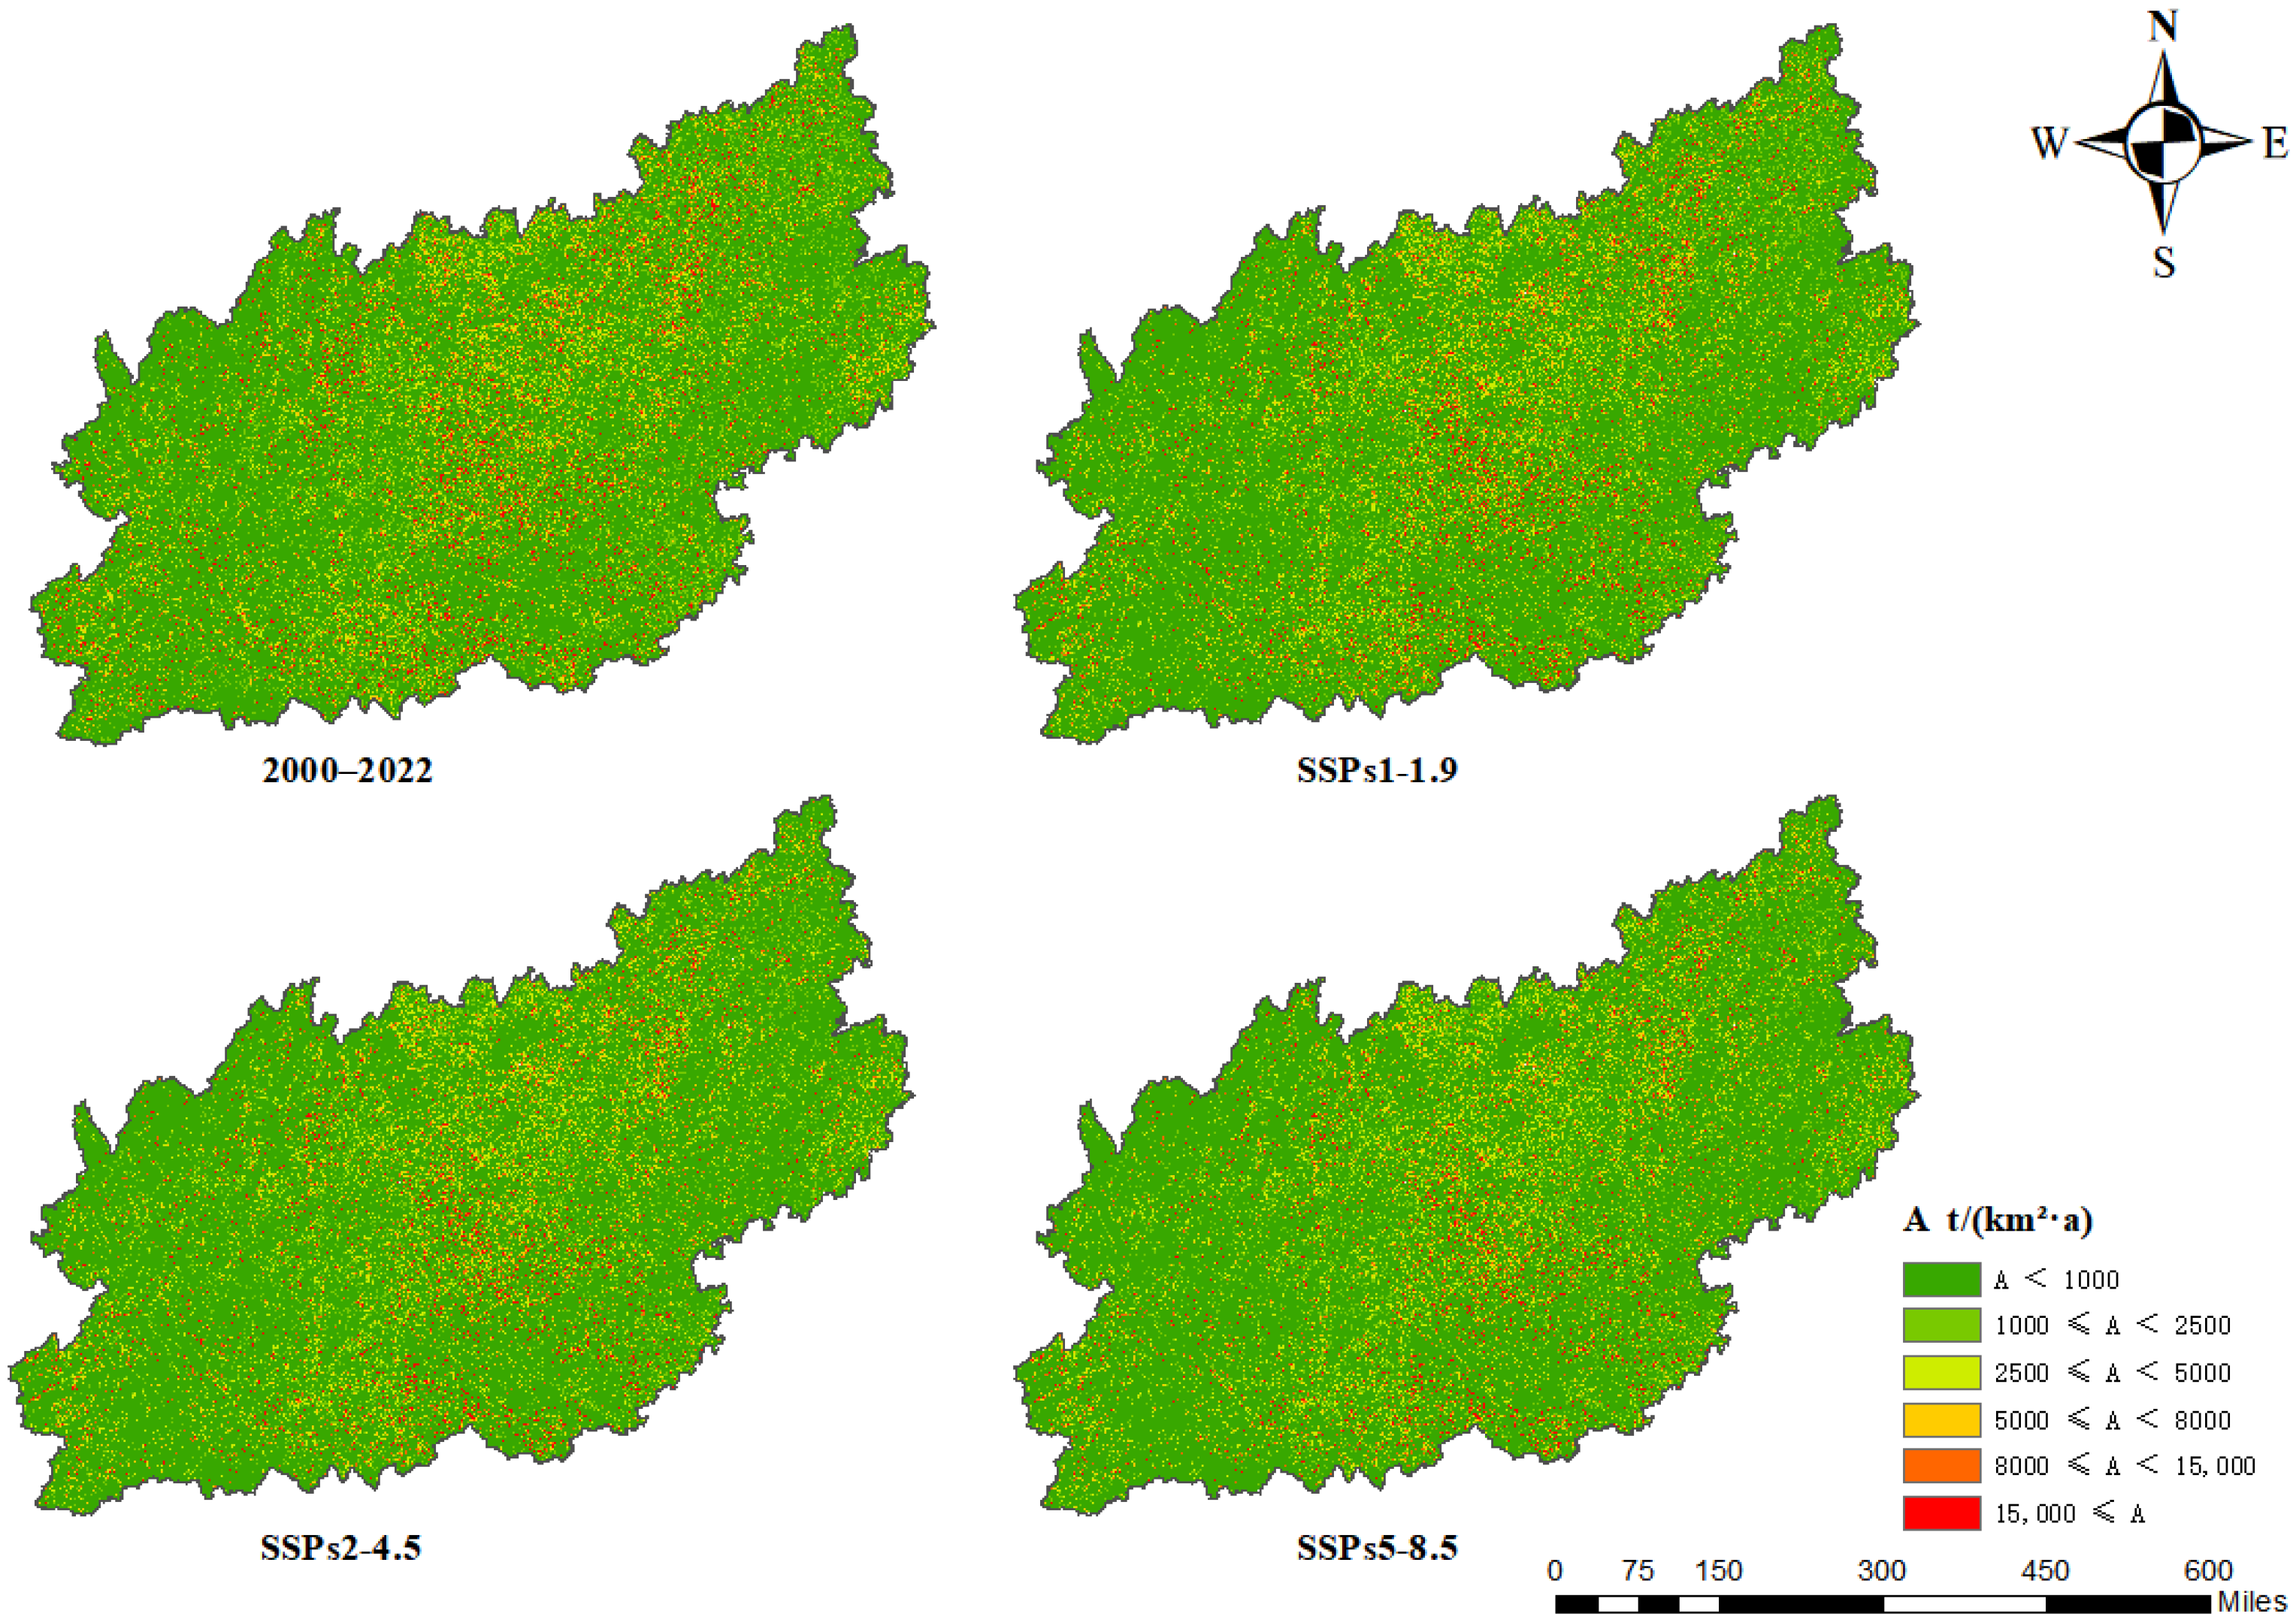
The soil erosion modulus of the YGP is classified using six grades based on the Classification and Grading Standards of Soil Erosion [42]. The classification criteria are provided in Table 5 and the results are presented in Figure 3.
As shown in Figure 3, the modulus of the YGP during the historical period is 2175.59 t/(km2·a), with an annual total soil erosion amount of 16.80 × 10⁸ t/a. Furthermore, the modulus of the YGP during SSPs1-1.9, SSPs2-4.5, and SSPs5-8.5 in the future period is 1978.73, 1808.56, and 1783.87 t/(km2·a), respectively, with estimated total erosion amounts of 15.24 × 10⁸, 13.93 × 10⁸, and 13.74 × 10⁸ t/a.
Temporally, the soil erosion condition on the YGP will be improved in the future. Comparing historical soil erosion, the modulus A under SSPs1-1.9, SSPs2-4.5, and SSPs5-8.5 will decrease by 196.86, 367.03, and 391.72 t/(km2·a), respectively. The amount of soil erosion generated will decrease by 1.56 × 10⁸, 2.87 × 10⁸, and 3.06 × 10⁸ t/a, respectively. As radiative forcing gradually increases from SSPs1-1.9 to SSPs5-8.5, drought conditions in the YGP region intensify under global warming, reducing the opportunities for soil erosion by rainfall. Consequently, both the soil erosion modulus and total erosion decrease [17].
Spatially, all of the simulation results under all scenarios show the worst soil erosion condition in the central, southern, and northeastern regions and the best soil erosion condition in the western and eastern regions of the YGP. Based on terrain analysis, areas with severe erosion primarily include the Wumeng Mountains and the hills of northern Guangxi. These regions generally feature steep slopes, widespread karst topography, and concentrated rainfall, leading to significant soil erosion through rainwater runoff. In contrast, ideal areas exhibit relatively gentle terrain and higher vegetation coverage, resulting in low soil erosion rates. However, the soil erosion in the southwestern and central-northern parts of the YGP will be significantly improved in the future, while the soil erosion regions of grade E will be significantly reduced. This may be due to the implementation of ecological engineering.
Comparing different scenarios in the future, the SSPs1-1.9 scenario yields the highest soil erosion modulus in the YGP, while the SSPs5-8.5 scenario results in the lowest. Notably, although the SSPs5-8.5 scenario exhibits the strongest radiative forcing, it shows the greatest reduction in soil erosion modulus. This phenomenon can be attributed to the policy assumptions embedded in this pathway. As a high consumption and emission scenario, the SSPs5-8.5 scenario assumes that technological advancements are concentrated on energy extraction rather than emission reduction, leading to a sharp short-term increase in greenhouse gas concentrations and significant global warming. Under this scenario, future precipitation in the YGP is projected to decrease substantially, exacerbating drought conditions [29]. Consequently, the opportunity for rainfall-induced soil loss is reduced, thereby decreasing the soil erosion modulus.
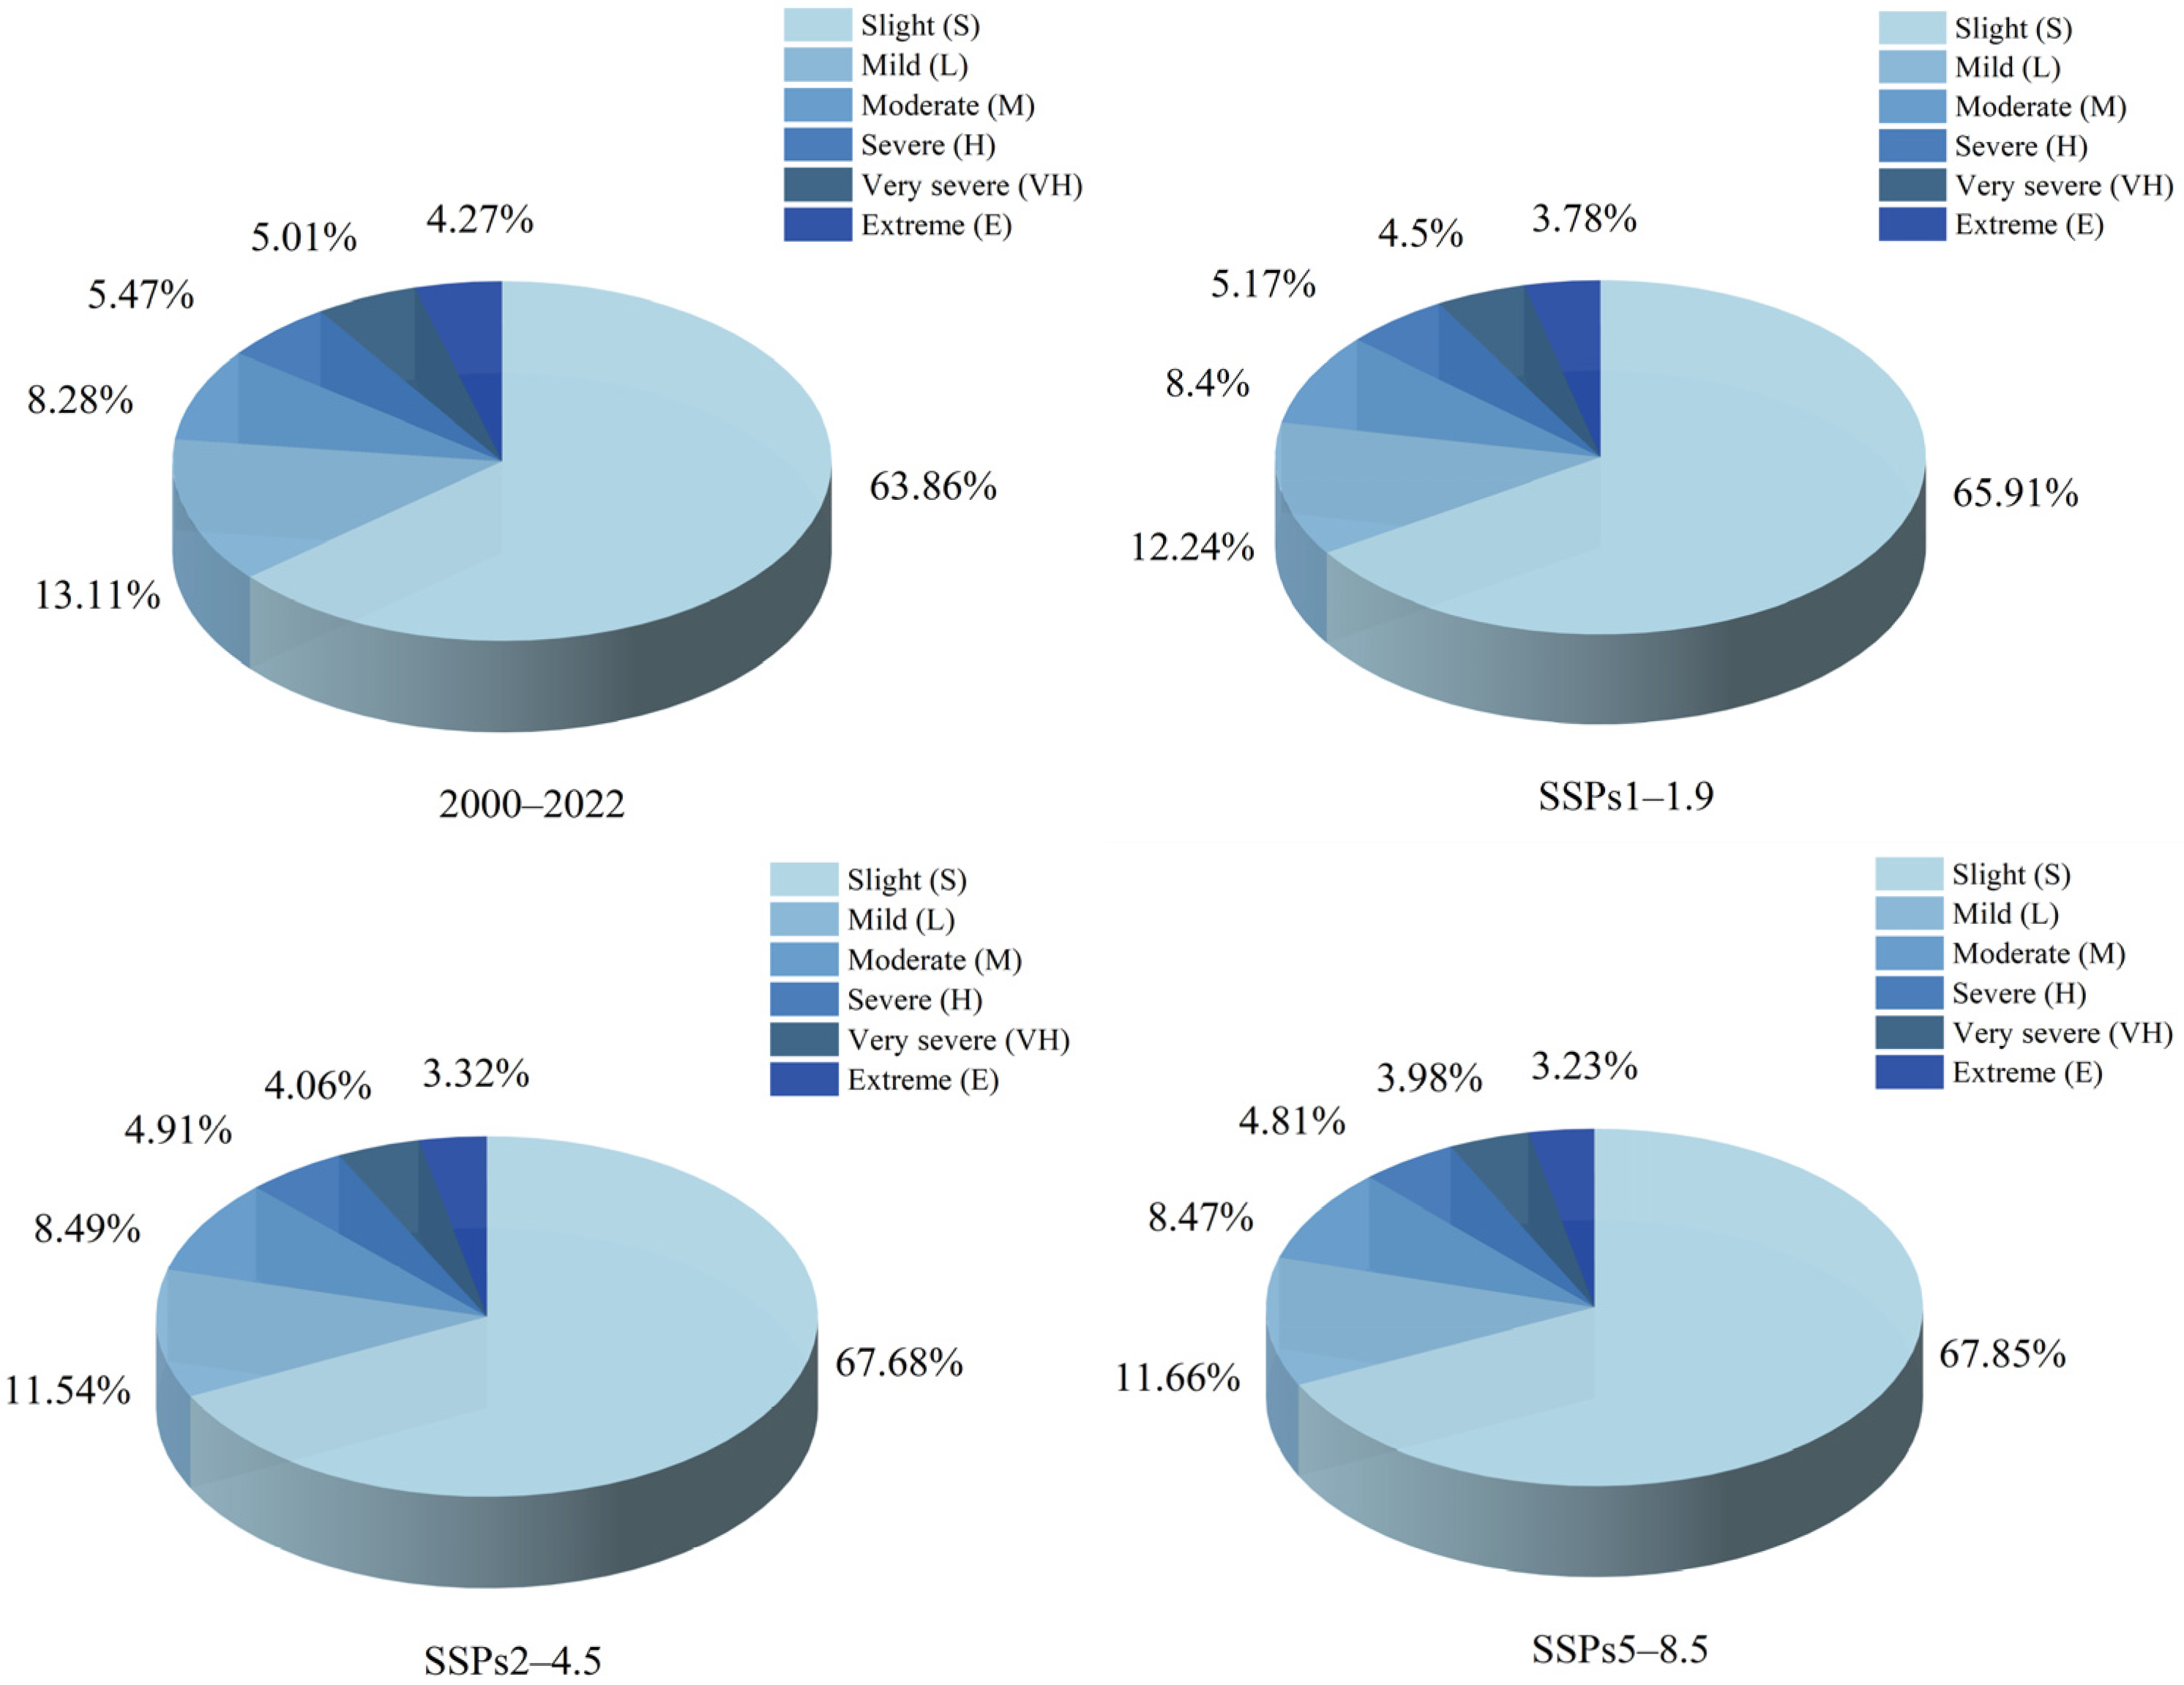
We conducted statistical analysis of the areas for each erosion grade across the historical and future periods, and the results are presented in Figure 4.
As shown in Figure 4, the areal extent of soil erosion across the YGP follows a consistent descending order across all periods: Slight > Mild > Moderate > Strong > Very Strong > Intense. Among these erosion severity classes, grade M exhibits the largest spatial extent, comprising over 60% of the total erosion area. In contrast, grade E represents the smallest proportion, accounting for 4.27%, 3.78%, 3.32%, and 3.23% of the total erosion area across the respective time periods.
Temporally, the total soil erosion area on the YGP is projected to decrease in the future due to climate change. The reductions are particularly noticeable under the SSPs2-4.5 and SSPs5-8.5 scenarios. Under both scenarios, the proportion of areas with grade M and below increased from 85.26% to 87.71% and 87.98%, respectively, while the areas with grade H and above decreased from 14.74% to 12.29% and 12.02%.
Comparing different future scenarios, the proportion of erosion areas at grade H and above follows the order SSPs1-1.9 > SSPs2-4.5 > SSPs5-8.5, with proportions of 13.45%, 12.29%, and 12.02%, respectively. The proportion of erosion areas at grade M and below follows the order SSPs5-8.5 > SSPs2-4.5 > SSPs1-1.9, with respective proportions of 86.55%, 87.71%, and 87.98%.
We conducted statistical analysis of the modulus A for each erosion grade across the historical and future periods, and the results are presented in Table 6.
As shown in Table 6, the soil erosion modulus of all grades except grade L erosion will decrease in the YGP in the future. Notably, the modulus in grade E erosion decreases the most, by 336.65, 589.41, and 138.73 t/(km2·a) under the SSPs1-1.9, SSPs2-4.5, and SSPs5-8.5 scenarios, respectively. Grade M erosion follows, with modulus reductions of 107.92, 54.72, and 38.70 t/(km2·a), respectively. In contrast, the modulus in grade L erosion increases by 26.68, 48.81, and 47.44 t/(km2·a), respectively.
Among the three future scenarios, the mean moduli in grade M and below erosion under the SSPS1-1.9, SSPS2-4.5, and SSPS5-8.5 scenarios are quantified as 870.04, 846.69, and 841.02 t/(km2·a), respectively, while those in grade H and above erosion are 16,738.57, 16,306.10, and 16,392.28 t/(km2·a).
Considering Figure 3 and Table 5, the SSPs2-4.5 scenario is the most desirable for future soil erosion changes on the YGP. The area with grade H and above in SSPs2-4.5 is slightly larger than that in SSPs5-8.5. However, the modulus in grade H and above in SSPs2-4.5 is significantly lower than that in SSPs5-8.5. All of these show that soil erosion areas of grade H and above exhibit a “limited but severe” erosion pattern in SSPs5-8.5, presenting significant management challenges and potential for future deterioration, accompanied by more complex and irreversible transitions between erosion grades. Compared to SSPs5-8.5, soil erosion areas of grade H and above under SSPs2-4.5 are less severe in the YGP. This implies that the difficulty and pressure associated with human-induced interventions for remediation are reduced.

3.2. Soil Erosion in the Karst Region of YGP

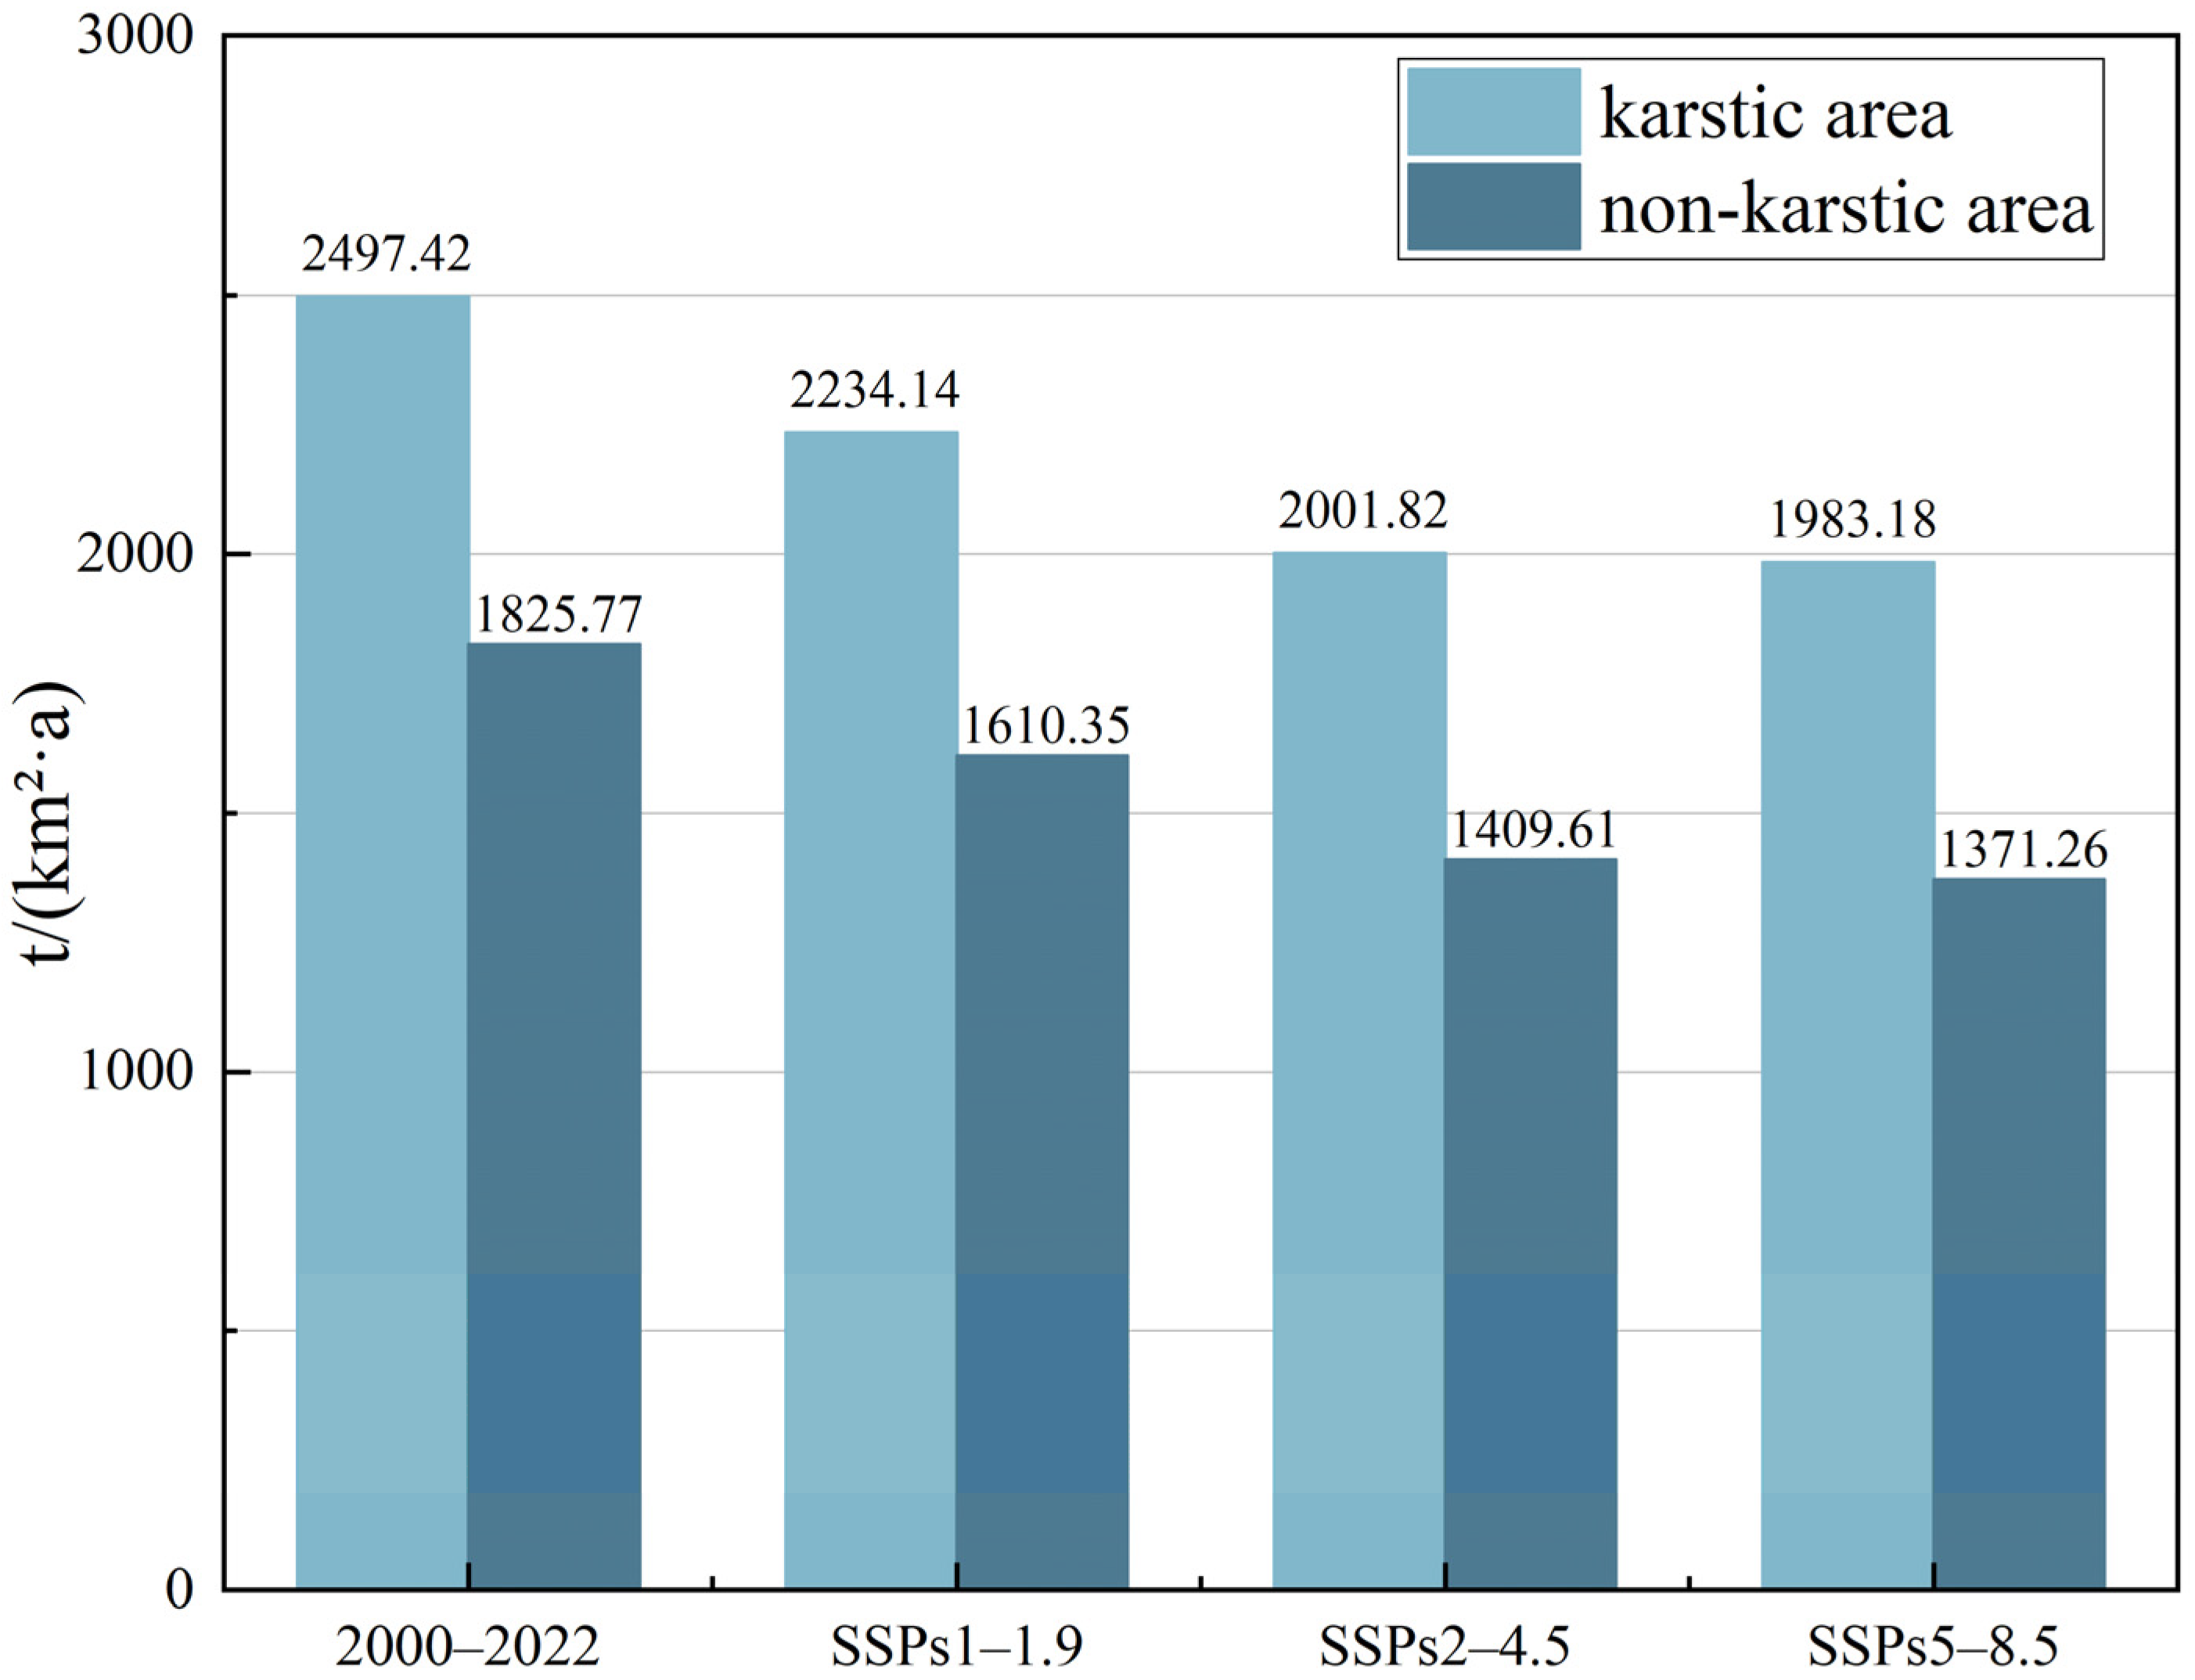
We analyzed the statistics on soil erosion in the karstic and non-karstic areas of the YGP in different periods, and the results are presented in Figure 5.
As shown in Figure 5, the karst region constitutes the primary area of soil erosion on the YGP, with corresponding erosion moduli of 2497.42, 2232.14, 2001.82, and 1983.18 t/(km2·a) for the historical period and future SSPs1-1.9, SSPs2-4.5, and SSPs5-8.5 scenarios, respectively. All of them are significantly higher than the overall soil erosion moduli. By contrast, the soil erosion moduli in the non-karstic areas are 1825.77, 1610.35, 1409.61, and 1371.26 t/(km2·a), respectively, which are lower than the overall soil erosion moduli.
Spatially, soil erosion in the karst areas is projected to improve in the future, with the soil erosion modulus gradually approaching that of non-karst areas. Notably, the differences in soil erosion moduli between the two terrain types are 671.65, 623.79, 592.21, and 611.92 t/(km2·a) for the historical period and the future SSPs1-1.9, SSPs2-4.5, and SSPs5-8.5, respectively, suggesting a general declining trend over time. Among them, the degree of improvement of soil erosion is SSPs2-4.5 > SSPs5-8.5 > SSPs1-1.9.
We analyzed the statistics on soil erosion modulus under different grades in the karstic areas, and the results are presented in Table 7.
As shown in Table 7, an alignment is observed between erosion trends in karst areas and the broader regional pattern, indicating a projected decrease in modulus values for all severity classes excluding grade L. Among these grades, the modulus in grade E erosion shows the highest reduction, with decreases of 495.42, 776.53, and 344.78 t/(km2·a) for the SSPs1-1.9, SSPs2-4.5, and SSPs5-8.5 scenarios, respectively. In contrast, the modulus in grade L erosion increases by 25.39, 47.86, and 44.90 t/(km2·a), respectively. Based on this, it is evident that soil erosion classified as grade E in karst regions is expected to improve in the future due to a transition to grade L or other lower erosion classes, particularly under the SSPs2-4.5 scenario.
Among the three future scenarios, the mean moduli in grade M and below erosion under the SSPs1-1.9, SSPs2-4.5, and SSPs5-8.5 scenarios are quantified as 932.95, 911.77, and 909.39 t/(km2·a), respectively, while those in grade H and above erosion are 17,476.86, 17,061.79, and 17,289.75 t/(km2·a).
Notably, it can be found that all three future scenarios exhibit overall soil erosion characteristics consistent with the general pattern. The SSPs1-1.9 scenario presents the most severe soil erosion conditions. Under SSPs5-8.5, although the overall erosion modulus is the smallest, the erosion modulus in areas classified as grade H and above is significantly larger than that under SSPs2-4.5. This indicates greater difficulty in soil erosion control under SSPs5-8.5, with a high risk of further deterioration. In contrast, SSPs2-4.5 shows an overall erosion modulus similar to that of SSPs5-8.5, but the erosion modulus in grade H and above areas is the smallest among all scenarios. This suggests lower future mitigation difficulty and a high likelihood of transitioning toward improved conditions, making SSPs2-4.5 the most desirable scenario.

4. Discussion

4.1. Discussion of the Validity of the SSPs-RUSLE Coupled Model

As the YGP encompasses multiple international rivers, systematically obtaining measured sediment data from transboundary hydrological stations is challenging. There is no publicly accessible, comprehensive, and standardized regional soil erosion monitoring network database. Therefore, this study selected three representative hydrological stations within China—Wulong Station on the Wujiang River, Wuzhou Station on the Xijiang River, and Xunjiang River’s Dahuangkou Station. Annual sediment transport data from 2000 to 2022 were collected using the Pearl River Sediment Bulletin and Yangtze Sediment Bulletin. Subsequently, model-simulated total soil erosion within each hydrological station’s catchment area was compared with measured sediment transport on an annual sequence basis.
The statistical results indicate that among the Wulong, Wuzhou, and Dahuangkou hydrological stations, the simulated and observed sequence R2 values are 0.78, 0.81, and 0.80, respectively, and the NSE values are 0.71, 0.75, and 0.73. Both NSE and R2 values are satisfactory, indicating that the simulation results from the SSPs-RUSLE coupled model showed reasonable consistency with the measured data.
Furthermore, to validate the model’s effectiveness, this study systematically collected published research findings on soil erosion from representative areas within the YGP and conducted comparative analyses in terms of magnitude, spatial relative patterns, and temporal trends, as shown in Table 8.
As shown in Table 8, the simulated soil erosion modulus of the YGP from 2000 to 2022 reached 2175.59 t/(km2·a), which is comparable to the estimates reported by Tang Jianqiu [9] and Wang et al. [43]. Meanwhile, a comparative analysis with the studies of Tang Jianqiu [9], Wang et al. [43], and Li et al. [8] reveals that, in previous historical simulations, the study area within the YGP exhibited a decreasing trend in soil erosion over time. This aligns with the projected improvement in future soil erosion moduli obtained in this study. Furthermore, the distribution of severely eroded soil areas aligns with the findings of Li et al. [10]. All comparisons indicate that the SSPs-RUSLE coupled model developed in this study effectively simulates soil erosion conditions in the YGP region. The results demonstrate reasonable credibility and provide a valuable reference for related research.
Unlike the above studies, the present study has the following strengths: (i) It designs a soil erosion model at the scale of the YGP. By introducing the RUSLE model, the overall soil erosion situation on the YGP can be simulated and evaluated, further complementing the soil erosion research in the YGP. (ii) It discusses the future trend of soil erosion changes on the YGP under climate change. By integrating the SSPs-RUSLE coupled model, the spatiotemporal dynamics of future soil erosion across the YGP are simulated and predicted. The results contribute to filling the research gap in the prediction of future soil erosion in this region.
Notably, due to inherent uncertainties in the precipitation input data used for future simulations, both the factor R and the soil erosion modulus A derived therefrom are subject to certain errors. Assuming that the error characteristics remain unchanged in the future and applying the same methodology, the uncertainty ranges of the factor R under the SSPs1-1.9, SSPs2-4.5, and SSPs5-8.5 for 2030–2060 are ±18.59%, ±16.23%, and ±21.41%, respectively, at the 95% confidence level. Correspondingly, the uncertainty ranges of the erosion modulus A are ±18.63%, ±16.72%, and ±21.91%, respectively.
Furthermore, the RUSLE model employed in this study was originally designed to estimate sheet erosion and rill erosion caused by rainfall splash and slope runoff [30]. Its outputs represent the potential erosion rate of slope soils and do not directly simulate gully erosion, channel erosion, or any form of sedimentation processes. Therefore, distinct from sediment deposition hazard maps, the erosion hotspots identified through this model simulation can be regarded as “potential high-risk zones prone to stripping”. They primarily serve to guide local governments in planning soil and water conservation measures and other soil erosion control methods.

4.2. Discussion of Factors Affecting Soil Erosion of YGP

In this section, we discuss the main influencing factors for the findings of this study. The main details are shown in Table 9.
As shown in Table 9, temporally, the soil erosion on the YGP will be improved in the future, with a decreasing trend of soil erosion modulus and areas. Notably, grade H and above soil erosion will shift to grade L or another lower erosion.
However, the main causes of this phenomenon are a reduction in rainfall [7] and an influence on measures taken by local governments [45]. On the one hand, reduced rainfall causes a lower factor R. This indicates that the probability of local soils being transported by rainfall in the future is significantly lower. On the other hand, local government departments have actively regulated a series of soil erosion control policies [45], including rocky desertification control and natural forest protection. All of these can achieve good results and contribute to the future reduction in soil erosion modulus and erosion volume on the YGP.
As shown in Table 9, spatially, the karst landscape is the main area where soil erosion occurs on the YGP. In addition, the soil erosion modulus in the southwestern and central-northern parts of the YGP will be improved in the future, with a significant reduction in grade E erosion in the regions.
However, the main causes of this phenomenon arise mainly from the characteristics of karst areas and local soil erosion changes. Karst areas are characterized by shallow soil layers and serious desertification problems [4]. Under the influence of rainfall and human activities, the soil in such areas is easily stripped and transported [46], which has a significant impact on soil erosion on the YGP.
Furthermore, the modulus of the karst areas in the southwestern and central-northern parts of the YGP will be significantly improved. This is primarily the result of the combined effects of region-specific natural conditions and ecological engineering [46,47]. The southwestern region of the YGP has relatively high annual average temperatures and precipitation. While this led to more severe soil erosion during historical periods, it also provided better water and heat conditions for vegetation restoration [45]. Accordingly, the central-northern regions of the YGP exhibit steeper slopes and thinner soil layers, making them more sensitive to human disturbance, which implies that once conservation measures are implemented, soil loss in these areas will be significantly reduced. Under these geological conditions, the implementation of major ecological projects such as the “Grain-for-Green Program” and “Comprehensive Management of Karst Desertification” along with the application of technical models suited to karst habitats, including mixed cropping and specialty economic forest planting, will lower the erosion modulus in these regions [45]. Many regions with grade H and above erosion have shifted to grade L and below.
As shown in Table 9, the SSPs2-4.5 scenario is the most desirable and more in line with the requirements of sustainable development.
However, the main reason for this is that the SSPs2-4.5 scenario proposes a moderate sustainable development trajectory [48]. Compared to SSPs1-1.9, the SSPs2-4.5 scenario exhibits stronger radiative forcing. Under this scenario, the YGP experiences slightly drier conditions due to climate change. Consequently, opportunities for soil erosion through rainfall runoff decrease, resulting in a lower overall soil erosion modulus. Compared to SSPs5-8.5, the SSPs2-4.5 scenario features further refined energy-saving and emission-reducing technologies and policies, resulting in a more stable ecological environment [48].
Furthermore, although the overall soil erosion modulus of the YGP is slightly lower under SSPs5-8.5, the stronger radiative forcing in this scenario leads to more severe droughts, which will disrupt the soil structure in the study area. In soil erosion areas of grade H and above, soil erosion will intensify further. If these regions fail to receive timely and effective remediation, the consequences will be severe. Conversely, under SSPs2-4.5, the YGP experiences relatively minor impacts from climate change, maintaining a relatively stable soil structure. Based on this, soil erosion moduli in these areas are comparatively lower, suggesting future soil conservation efforts will face fewer challenges and pressures.

4.3. Sustainable Trade-Offs for Future Soil Erosion Under YGP and Soil Erosion Mitigation Approaches

As discussed above, karst regions are key areas for soil erosion in the YGP. Moreover, with social development and the implementation of ecological projects, many eroded areas of the YGP have shown an overall positive trend in soil erosion. However, grade L soil erosion areas typically feature relatively gentle topography. This implies that if erosion is not promptly controlled, the cumulative effects of soil loss over successive years will lead to increased sediment deposition in these areas. Consequently, the frequency of flooding and waterlogging incidents will rise, ultimately exacerbating soil erosion rather than mitigating it.
Furthermore, the literature indicates that ecological projects such as the “Grain-for-Green Program” are key human-driven factors in improving soil erosion both currently and in the future [45]. However, in karst water-scarce regions such as the YGP, large-scale afforestation or restoration with water-intensive vegetation may exacerbate regional or seasonal water stress, creating new conflicts between soil conservation and water retention. Therefore, as remediation efforts intensify, it is essential to enhance assessments of local water resource carrying capacity and optimize vegetation selection based on these evaluations.
In SSPs2-4.5 for the future, interregional inequalities gradually improve and the energy structure progressively shifts toward low-carbon transformation. Against this backdrop, a balance is achieved between mitigating climate change and sustaining socioeconomic development, enabling soil erosion mitigation to be built upon a relatively stable climate and societal foundation [15,18]. Notably, moderate-intensity emission reduction policies may not fully avert medium-to-long-term climate risks, necessitating sustained societal investment to adapt to potential changes.
Therefore, this study proposes the following recommendations:
(i)
Increase the attention and treatment of areas with grade L erosion on the YGP. On the one hand, improve the monitoring system of soil erosion in the YGP by combining advanced modern science and technology—digital remote sensing, Internet of Things, and so on. On the other hand, design new and more targeted technologies to address the characteristics of grade L soil erosion. This could lead to a downward trend in soil erosion at all grades in the future.
(ii)
Promote water-saving, high-efficiency vegetation models for soil and water conservation. Strengthen assessments of water resources and prioritize ecological benefits to develop regional ecological restoration, including rational planning of mining activities, the adoption of composite planting, and dendrobium planting to improve greening effects.
(iii)
Taking SSPs2-4.5 as the core reference scenario while accounting for the likelihood of extreme climate events occurring, design a resilient portfolio of governance measures. For instance, establish a “climate-ecology-livelihood” adaptation linkage mechanism, deeply integrating soil conservation into regional climate adaptation strategies and rural revitalization initiatives to ensure governance outcomes remain robust and sustainable under changing climatic and socioeconomic conditions.

4.4. Limitations and Future Plans

This study employs a coupled SSPs-RUSLE model to incorporate factors such as climate change policies, population, technological progress, and precipitation into future impact projections, demonstrating scientific rigor and objectivity. However, certain limitations remain. On the one hand, this study adopts a static land use assumption and considers only the direct impact of precipitation changes on soil erosion under climate change. However, other factors will also undergo minor changes in the future, and this oversight will inevitably affect the accuracy of the simulation. On the other hand, due to technical limitations, the RUSLE model is primarily suited for assessing slope erosion. It inadequately characterizes erosion processes such as gully erosion, channel processes, and karst-specific phenomena including rapid infiltration and subsurface flow, thereby limiting its explanatory power at the watershed scale and in special topographic regions.
To address the aforementioned issues, future research will build upon this foundation by utilizing higher-resolution remote sensing data and field monitoring data to enhance the estimation accuracy of key factors. Additionally, more complex multivariate coupling models will be introduced to compensate for the limitations of empirical models in process characterization, thereby improving the precision of soil erosion prediction in the Yangtze River Basin.

5. Conclusions

In this study, a coupled SSPs-RUSLE model is constructed to investigate the spatiotemporal evolution patterns of future soil erosion in the YGP under climate change scenarios. The results show the following:
Temporally, the total soil erosion on the YGP will be reduced in the future. Notably, the total modulus of the YGP under the SSPs1-1.9, SSPs2-4.5, and SSPs5-8.5 scenarios will decrease by 196.86, 367.03, and 391.72 t/(km2·a), respectively, with the overall soil erosion reduced by 1.56 × 10⁸, 2.87 × 10⁸, and 3.06 × 10⁸ t/a. Furthermore, the proportion of areas with grade M and below will increase from 85.26% to 86.55%, 87.71%, and 87.98%, while that of areas with grade H and above will decline from 14.74% to 13.45%, 12.29%, and 12.02% across corresponding scenarios.
Spatially, soil erosion in the southwestern and central-northern parts of the YGP will be significantly improved in the future. The areas with a modulus of up to 15,000 t/(km2·a) will be significantly reduced, particularly in karst terrain where erosion levels progressively converge with non-karst zones. The modulus A differential between karst and non-karst areas narrows from 671.65 t/(km2·a) to 623.79, 592.21, and 611.92 t/(km2·a) under the SSPs1-1.9, SSPs2-4.5, and SSPs5-8.5 scenarios, respectively.
Under different future scenarios, SSPs2-4.5 is more in line with sustainable development requirements. To ensure the long-term sustainable development of the YGP, resilient governance measures should be designed with SSPs2-4.5 as the core reference scenario. This approach will safeguard the achievements in soil erosion control, ensuring their enduring stability under changing climatic and socioeconomic conditions.
Overall, this study’s elucidation of soil erosion dynamics and the optimal scenario in the YGP offers scientific support for refining conservation policies in karst regions, including the Grain-for-Green Program and rocky desertification control. Furthermore, the findings serve as a localized practical pathway for aligning regional efforts with the United Nations Sustainable Development Goals (SDGs), particularly Climate Action (SDG 13), Life on Land (SDG 15), and Clean Water and Sanitation (SDG 6). They also offer valuable insights for the collaborative governance of transboundary ecosystems in the Lancang–Mekong River Basin, contributing to the synergistic advancement of ecological security and sustainable development across borders.

Author Contributions

J.L., writing—original draft preparation; H.W., writing—reviewing and editing; J.W., data curation and investigation; and F.Y., conceptualization and methodology. All authors have read and agreed to the published version of the manuscript.

Funding

This research was supported by the National Natural Science Foundation of China (grant number: 52069012).

Institutional Review Board Statement

Not applicable.

Data Availability Statement

All data regarding the results of this research are available upon request from the authors.

Conflicts of Interest

The authors declare that they have no conflicts of interest.

References

  1. Li, J.; Yu, R. Characteristics of cold season rainfall over the Yungui Plateau. J. Appl. Meteorol. Climatol. 2014, 53, 1750–1759. [Google Scholar] [CrossRef]
  2. Niu, L.; Shao, Q. Soil Conservation Service Spatiotemporal Variability and Its Driving Mechanism on the Guizhou Plateau, China. Remote Sens. 2020, 12, 2187. [Google Scholar] [CrossRef]
  3. Zhang, J.; Deng, W. Multiscale spatio-temporal dynamics of economic development in an interprovincial boundary Region: Junction area of Tibetan plateau, Hengduan mountain, Yungui plateau and Sichuan basin, southwestern China case. Sustainability 2016, 8, 215. [Google Scholar] [CrossRef]
  4. Ge, W.; Han, J.; Zhang, D.; Wang, F. Divergent impacts of droughts on vegetation phenology and productivity in the Yungui Plateau, southwest China. Ecol. Indic. 2021, 127, 107743. [Google Scholar] [CrossRef]
  5. Lin, H.X.; Zhang, W.Y.; Guo, S.F.; Zhang, X.S.; Wang, L.; Zhang, J.Y. Study on the Energy Evolution Mechanism and Fractal Characteristics of Coal Failure under Dynamic Loading. ACS Omega 2025, 10, 54710–54719. [Google Scholar] [CrossRef]
  6. Zhu, D.S.; Griffiths, D.N.; Fenton, A.G.; Huang, J.S. Probabilistic stability analyses of two-layer undrained slopes. Comput. Geotech. 2025, 182, 107178. [Google Scholar] [CrossRef]
  7. Wang, S.; Bao, X.H.; Rong, Y.; Tian, Y.Q.; Fu, Z.Y.; Chen, H.S. Study on soil moisture varation and runoff characteristics on typical karst slope under different rainfall intensities. Res. Aricult. Mod. 2020, 41, 889–898. [Google Scholar]
  8. Li, M.Y.; Li, Q.; Zhang, Q. Spatial-temporal characteristics analysis of soil erosion in karst watershed based on GIS technology and RUSLE model—A case study of Wujiang River Basin in Guizhou Province. Hydropower Pumped Storage 2023, 9, 70–74+69. [Google Scholar]
  9. Tang, J.Q. Analysis on Temporal and Spatial Changes and Driving Forces of Soil Erosion in Guizhou Province form 2000 to 2018. Master’s Thesis, Chang’an University, Xi’an, China, 2022. [Google Scholar]
  10. Li, J.L.; Sun, R.H.; Xiong, M.Q.; Yang, G.C. Estimation of soil erosion based on the RUSLE model in China. Acta Ecol. Sin. 2020, 40, 3473–3485. [Google Scholar] [CrossRef]
  11. Aslam, B.; Khalil, U.; Saleem, M.; Maqsoom, A.; Khan, E. Effect of multiple climate change scenarios and predicted land cover on soil erosion: A way forward for the better land management. Environ. Monit. Assess. 2021, 193, 754. [Google Scholar] [CrossRef]
  12. Liu, Z.W.; Wang, M.C.; Liu, X.N.; Yu, X.Y.; Wang, M.S.; Wang, F.Y.; Ji, X.; Li, X.Y. Spatiotemporal simulation and projection of soil erosion as affected by climate change in Northeast China. Int. J. Appl. Earth Obs. Geoinf. 2024, 135, 104305. [Google Scholar] [CrossRef]
  13. Rendana, M.; Idris, R.M.W.; Alia, F.; Rahim, S.E.; Yamin, M.; Izzudin, M. Relationship between drought and soil erosion based on the normalized differential water index(NDWI) and revised universal soil loss equation(RUSLE) model. Reg. Sustain. 2024, 5, 135–146. [Google Scholar] [CrossRef]
  14. Qin, W.; Guo, Q.K.; Cao, W.H.; Yin, Z.; Yan, Q.H.; Shan, Z.J.; Zheng, F.L. A new RUSLE slope length factor and its application to soil erosion assessment in a Loess Plateau watershed. Soil Tillage Res. 2018, 182, 10–24. [Google Scholar] [CrossRef]
  15. O’Neill, B.C.; Kriegler, E.; Riahi, K.; Ebi, K.; Hallegatte, S.; Carter, T.R.; Mathur, R.; van Vuuren, D.P. A new scenario framework for climate change research: The concept of shared socioeconomic pathways. Clim. Change 2014, 122, 387–400. [Google Scholar] [CrossRef]
  16. Marangoni, G.; Tavoni, M.; Bosetti, V.; Borgonovo, E.; Capros, P.; Fricko, O.; Gernaat, D.E.H.J.; Guivarch, C.; Havlik, P.; Huppmann, D.; et al. Sensitivity of projected long-term CO2 emissions across the Shared Socioeconomic Pathways. Nat. Clim. Change 2017, 7, 113–117. [Google Scholar] [CrossRef]
  17. Lü, Y.; Jiang, T.; Wang, Y.J.; Su, B.D.; Huang, J.L.; Tao, H. Simulation and projection of climate change using CMIP6 Muti-models in the Belt and Road Region. Sci. Cold Arid Reg. 2020, 12, 389–403. [Google Scholar]
  18. Wen, S.S.; Wang, Z.C.; Yao, J.Q.; Jiang, F.S.; Zhou, B. Future projection on temperature and precipitation in Yangtze river basin based on N-CMIP6. Yangtze River 2024, 55, 69–78. [Google Scholar]
  19. Wang, Z.J.; Liu, S.J.; Li, J.H.; Pan, C.; Wu, J.L.; Ran, J.; Su, Y. Remarkable improvement of ecosystem service values promoted by land use/land cover changes on the Yungui Plateau of China during 2001–2020. Ecol. Indic. 2022, 142, 109303. [Google Scholar] [CrossRef]
  20. Zhao, L.N.; Li, R.; Yuan, J.; Jin, J. Spatial-temporal variation of runoff erosivity in Karst Basin and its response to Karst characteristic factors. J. Soil Water Conserv. 2024, 38, 60–69+78. [Google Scholar]
  21. Fullhart, A.T.; Ponce-Campos, G.E.; Meles, M.B.; McGehee, R.P.; Wei, H.Y.; Armendariz, G.; Burns, S.; Goodrich, D.C. Towards global coverage of gridded parameterization for CLImate GENerator (CLIGEN). Big Earth Data 2024, 8, 142–165. [Google Scholar] [CrossRef]
  22. Booth, B.B.B.; Bernie, D.; McNeall, D.; Hawkins, E.; Caesar, J.; Boulton, C.; Friedlingstein, P.; Sexton, D.M.H. Scenario and modelling uncertainty in global mean temperature change derived from emission-driven global climate models. Earth Syst. Dyn. 2013, 4, 95–108. [Google Scholar] [CrossRef]
  23. Ma, B.; Zeng, W.H.; Hu, G.Z.; Cao, R.X.; Cui, D.; Zhang, T.Z. Normalized difference vegetation index prediction based on the delta downscaling method and back-propagation artificial neural network under climate change in the Sanjiangyuan region, China. Ecol. Inform. 2022, 72, 101883. [Google Scholar] [CrossRef]
  24. Wang, F.; Tian, D. On deep learning-based bias correction and downscaling of multiple climate models simulations. Clim. Dyn. 2022, 59, 3451–3468. [Google Scholar] [CrossRef]
  25. Harris, T.; Li, B.; Sriver, R. Multimodel ensemble analysis with neural network Gaussian processes. Ann. Appl. Stat. 2023, 17, 3403–3425. [Google Scholar] [CrossRef]
  26. Döscher, R.; Acosta, M.; Alessandri, A.; Anthoni, P.; Arsouze, T.; Bergman, T.; Bernardello, R.; Boussetta, S.; Caron, L.P.; Carver, G.; et al. The EC-Earth3 Earth system model for the Coupled Model Intercomparison Project 6. Geosci. Model Dev. 2022, 15, 2973–3020. [Google Scholar] [CrossRef]
  27. Basse, J.; Diba, I.; Deme, A.; Temudo, M.P.; Carvalho, S. Future changes in precipitation over Guinea-Bissau under the Shared Socioeconomic Pathways (SSPs). J. Water Clim. Change 2025, 16, 3197–3211. [Google Scholar] [CrossRef]
  28. Kabo-Bah, A.T.; Siabi, A.E.; Siabi, E.K.; Ahiada, W.B.; Cobbina, N.A. Simulating future climate changes under the shared socioeconomic pathway scenarios: A case of the black volta basin of Ghana. Front. Environ. Sci. 2025, 13, 1643465. [Google Scholar] [CrossRef]
  29. Xu, R.H.; Shi, P.J.; Gao, M.N.; Wang, Y.J.; Wang, G.J.; Su, B.D.; Huang, J.L.; Lin, Q.G.; Jiang, T. Projected land use changes in the Qinghai-Tibet Plateau at the carbon peak and carbon neutrality targets. Sci. China Earth Sci. 2023, 53, 1392–1407. [Google Scholar] [CrossRef]
  30. Williams, J.R.; Renard, K.G.; Dyke, P.T. EPIC: A new method for assessing erosion’s effect on soil productivity. J. Soil Water Conserv. 1983, 38, 381–383. [Google Scholar] [CrossRef]
  31. Zhang, W.B.; Fu, J.S. Rainfall erosivity estimation under different rainfall amount. Resour. Sci. 2003, 25, 35–41. [Google Scholar]
  32. Sharpley, A.N.; Williams, J.R. EPIC-Erosion/Productivity Impact Calculator: 1. Model Determination; US Department of Agriculture: Washington, DC, USA, 1990.
  33. Wei, J.M.; Li, C.B.; Wu, L.; Xie, X.H.; Lu, J.N. Study on soil erosion in northwestern Sichuan and southern Cansu (NSSG) based on USLE. J. Soil Water Conserv. 2021, 35, 31–37+46. [Google Scholar]
  34. Liu, B.Y.; Nearing, M.A.; Rise, L.M. Slop gradient effects on soil loss for steep slopes. Trans. ASAE 1994, 37, 1835–1840. [Google Scholar] [CrossRef]
  35. McCool, D.K.; Brown, L.C.; Foster, G.R.; Mutchler, C.K.; Meyer, L.D. Revised slope steepness factor for the universal soil loss equation. Trans. ASAE 1987, 30, 1387–1396. [Google Scholar] [CrossRef]
  36. Peng, J.; Li, D.D.; Zhang, Y.Q. Analysis of spatial characteristics of soil erosion in mountain areas of northwestern Yunnan based on GIS and RUSLE. J. Mt. Sci. 2007, 25, 548–556. [Google Scholar]
  37. Chen, Z.F.; Li, J.; Duan, Q.S.; Wang, Y.; Xiang, B.; Ning, D.W. Evaluation of soil erosion and nutrient loss of slope farmland in Yunnan Province using USLE model. Trans. Chin. Soc. Agric. Eng. 2022, 38, 124–134. [Google Scholar]
  38. Hu, X.P.; Guo, C.C.; Li, B.X.; Yang, Y. Evaluation of soil conservation in Guizhou Province from 1993 to 2020 based on GIS and RUSLE models. Rural Sci. Technol. 2024, 15, 130–134. [Google Scholar]
  39. Yang, Q. Soil erosion and factors of different soil and water conservation measures on slopes in karst areas. Agric. Technol. 2022, 42, 66–71. [Google Scholar]
  40. Gelwick, K.D.; Willett, S.D.; Yang, R. Geomorphic indicators of continental-scale landscape transience in the Hengduan Mountains, SE Tibet, China. Earth Surf. Dyn. 2024, 12, 783–800. [Google Scholar] [CrossRef]
  41. Li, J.H.; Liu, S.J.; Wang, Z.J. Multi-scenario Simulation of Spatiotemporal Changes of Land Use Pattern and Ecosystem Services in Yunnan-Guizhou Plateau Based on FLUS and InVEST Models. Res. Soil Water Conserv. 2024, 31, 87–298. [Google Scholar]
  42. SL 190-2007; Classification and Grading Standards of Soil Erosion. Ministry of Water Resources of the People’s Republic of China: Beijing, China, 2008.
  43. Wang, Y.; Cai, Y.L.; Pan, M. Soil erosion simulation of the Wujiang River Basin in Guizhou Province Based on GIS, RUSLE and ANN. Geol. China 2014, 41, 1735–1747. [Google Scholar]
  44. Lou, Y.; Wang, H.; Meersmans, J.; Green, S.M.; Quine, T.A.; Feng, S. Modeling soil erosion between 1985 and 2014 in three watersheds on the carbonate-rock dominated Guizhou Plateau, SW China, using WaTEM/SEDEM. Sage 2000, 45, 1. [Google Scholar]
  45. Tong, X.W.; Brandt, M.S.; Yue, Y.; Stéphanie, H.; Wang, K.; Wanda, D.K.; Tian, F.; Schurgers, G.; Xiao, X.; Luo, Y.; et al. Increased vegetation growth and carbon stock in China karst via ecological engineering. Nat. Sustain. 2018, 1, 44–50. [Google Scholar] [CrossRef]
  46. Ma, G.J.; Yang, Q.W. On historical causes and counter measures of stony desertification of the Yunnan-Guizhou Plateau: On the relationship of economic development and ecological adaptation. J. Orig. Ecol. Natl. Cult. 2011, 3, 9–15. [Google Scholar]
  47. Wang, X.F.; Zhang, X.R.; Feng, X.M.; Liu, S.R.; Yin, L.C.; Chen, Y.Z. Trade-offs and synergies of ecosystem services in karst area of China driven by grain-for-green Program. Chin. Geogr. Sci. 2020, 30, 101–114. [Google Scholar] [CrossRef]
  48. O’Neill, B.C.; Tebaldi, C.; Van Vuuren, D.P.; Eyring, V.; Friedlingstein, P.; Hurtt, G.; Knutti, R.; Kriegler, E.; Lamarque, J.F.; Lowe, J.; et al. The Scenario Model Intercomparison Project (ScenarioMIP) for CMIP6. Geosci. Model Dev. 2016, 9, 3461–3482. [Google Scholar] [CrossRef]
Figure 1. Study area.
Sustainability 18 02928 g001
Figure 2. Comparative illustration of static and dynamic land use patterns in modeling soil erosion across YGP.
Sustainability 18 02928 g002
Figure 3. Distribution of soil erosion modulus in different periods.
Sustainability 18 02928 g003
Figure 4. Statistical results of soil erosion areas of different erosion classes.
Sustainability 18 02928 g004
Figure 5. Soil erosion modulus of karstic and non-karstic landscapes in different periods.
Sustainability 18 02928 g005
Table 1. Basic data sources.
Basic DataSources
Digital Elevation Model Data (30 m)Geospatial Data Cloud
(http://www.gscloud.cn, accessed on 15 November 2023)
Historical Period Rainfall DataChina Meteorological Administration Official Website (https://data.cma.cn/, accessed on 11 November 2023)
Future Forecast Rainfall DataEarth System Grid Federation
(https://esgf-node.llnl.gov/, accessed on 12 November 2023)
Land Use Data (30 m)China Land Cover Dataset
(https://developers.google.cn/, accessed on 15 November 2023)
Soil DataHarmonized World Soil Database
(http://data.tpdc.ac.cn, accessed on 16 November 2023)
Table 2. Explanation of future scenario types.
ScenarioClassExplanation
SSPs1-1.9Sustainable Development Pathway(i) Emphasizing low-carbon technology deployment and green economic transition. (ii) Maintaining radiative forcing at 1.9 W/m2 by 2100.
SSPs2-4.5Medium Development Pathway(i) Balancing economic growth with some climate action, with modest technology development and mitigation measures. (ii) Maintaining radiative forcing at 4.5 W/m2 by 2100.
SSPs5-8.5High Resource Consumption Pathway(i) Using fossil fuels to drive economic growth. Technological innovation focuses on energy extraction rather than emission reduction with greater social inequality. (ii) Maintaining radiative forcing at 8.5 W/m2 by 2100.
Table 3. Statistical deviation of monthly precipitation in the historical period of the EC-Earth3 model before and after calibration compared with observed values.
IndicatorMBRMSE
Before CalibrationAfter CalibrationBefore CalibrationAfter Calibration
Annual average (mm)125.45.2148.642.7
Rainy season (May–Oct.)195.88.7223.158.3
Dry season (Nov.–Apr. in the following year)55.01.758.922.4
Table 4. Value of the P factor and C factor on the YGP.
Lang UseWetlandsForestShrubGrasslandWater
P -value0.810.210
C -value10.00310.0051
Lang UseSnow/IceCroplandBarrenImpervious
P -value00.610
C -value10.08811
Table 5. Soil erosion severity classification [t/(km2·a)].
GradeAbbreviationSoil Erosion Modulus A
Slight erosionS<1000
Mild erosionL1000–2500
Moderate erosionM2500–5000
Severe erosionH5000–8000
Very severe erosionVH8000–15,000
Extreme erosionE≥15,000
Table 6. Statistical results of soil erosion modulus for different erosion classes [t/(km2·a)].
GradeHistorical PeriodFuture Period
SSPs1-1.9SSPs2-4.5SSPs5-8.5
Slight erosion420.86399.12392.17385.8
Mild erosion1543.951570.631592.761591.39
Moderate erosion3630.163522.243575.443591.46
Severe erosion6339.666319.296300.956305.73
Very severe erosion10,781.1110,768.3610,743.6910,751.92
Extreme erosion38,475.0738,138.4237,885.6638,336.34
Table 7. Statistical results of soil erosion modulus of different grades in the karst landscape [t/(km2·a)].
GradesHistorical PeriodFuture Period
SSPs1-1.9SSPs2-4.5SSPs5-8.5
Slight erosion424.14395.75378.48374.14
Mild erosion1552.331577.721600.191597.23
Moderate erosion3633.663630.683624.243619.94
Severe erosion6349.376322.536288.266299.44
Very severe erosion10,796.2310,766.1810,694.7810,753.37
Extreme erosion39,936.6239,441.2039,160.0939,591.84
Table 8. References on the impact of climate change soil erosion.
SourcesConclusions
This study(i) From 2000 to 2022, the mean soil erosion modulus across the YGP stood at 2175.59 t/(km2·a). (ii) Under the YGP future SSPs1-1.9, SSPs2-4.5, and SSPs5-8.5 scenarios, the soil erosion moduli are 1978.73, 1808.56, and 1783.87 t/(km2·a), respectively. Due to climate change impacts, future soil erosion conditions are projected to improve. (iii) The southeastern and central-northern regions of the YGP experience severe soil erosion.
Tang Jianqiu [9]The soil erosion moduli in 2000, 2010, and 2018 in Guizhou Province are calculated as 29.58, 21.36, and 15.25 t/(hm2·a), with a total average of 22.06 t/(hm2·a). It shows a decreasing trend over time.
Wang et al. [43]The annual soil erosion moduli of the Wujiang watershed in the 1980s and 1990s are 26.78 and 23.12 t/(hm2·a), respectively, which is more consistent with the Guizhou Bulletin of Soil Erosion and Water Loss [44].
Li et al. [8]The erosion grade from 2000 to 2015 of the Wujiang watershed is dominated by grade S and M. Moreover, all the grades show a gradual decreasing trend.
Li et al. [10]The transitional zone between the Yunnan–Guizhou Plateau and the Sichuan Basin exhibits severe water erosion, with particularly pronounced impacts observed in Guizhou Province.
Table 9. Findings and factors based on SSPs-RUSLE coupled model.
FindingsFactors
The soil erosion will be improved in the future, with reductions in overall soil erosion areas and modulus.(i) The reduction in future rainfall contributes to a reduction in the probability of local soils being transported by rainwater runoff. (ii) Local government departments have introduced a series of soil erosion control policies, which have achieved positive results.
Karst landscape forms the primary sites for soil erosion in the YGP. The soil erosion modulus in the southwestern and central-northern parts of the YGP will be improved in the future.(i) Karst regions are characterized by shallow soil layers and rocky desertification. The soils in such areas are easily stripped and transported under the impact of rainfall and human activities. (ii) The southwestern and central-northern regions in the YGP have achieved significant reductions in soil erosion modulus due to the synergistic effects of region-specific natural conditions and ecological engineering.
In the three future scenarios, the SSPs2-4.5 scenario is the most desirable and more in line with the requirements of sustainable development.The SSPs2-4.5 scenario is a medium sustainable development pathway. As a result of the mitigation measures taken, grade H and above soil erosion under this scenario is significantly improved, with the lowest modulus in the three future scenarios. The ecology of the YGP in SSPs2-4.5 is also more stable and overall more in line with the requirements of sustainable development.
Disclaimer/Publisher’s Note: The statements, opinions and data contained in all publications are solely those of the individual author(s) and contributor(s) and not of MDPI and/or the editor(s). MDPI and/or the editor(s) disclaim responsibility for any injury to people or property resulting from any ideas, methods, instructions or products referred to in the content.