Article

The Influence of Near-Surface Ground Features on Near-Surface Airflow

1
Key Laboratory of Desert and Desertification, Northwest Institute of Eco-Environment and Resources, Chinese Academy of Sciences, Lanzhou 730000, China
2
University of Chinese Academy of Sciences, Beijing 100000, China
3
Key Laboratory of Qian Xuesen Deserticulture of Shaanxi Higher Education Institute, Yulin Observation and Research Station for Ecology and Environment of Desert-Loess Zone, School of Geography and Tourism, Shaanxi Normal University, Xi’an 710119, China
4
Institute of Atmospheric Physics, Chinese Academy of Sciences, Beijing 100000, China
*
Author to whom correspondence should be addressed.
Deceased author.
Sustainability 2026, 18(6), 2910; https://doi.org/10.3390/su18062910
Submission received: 19 January 2026 / Revised: 3 March 2026 / Accepted: 12 March 2026 / Published: 16 March 2026

Abstract

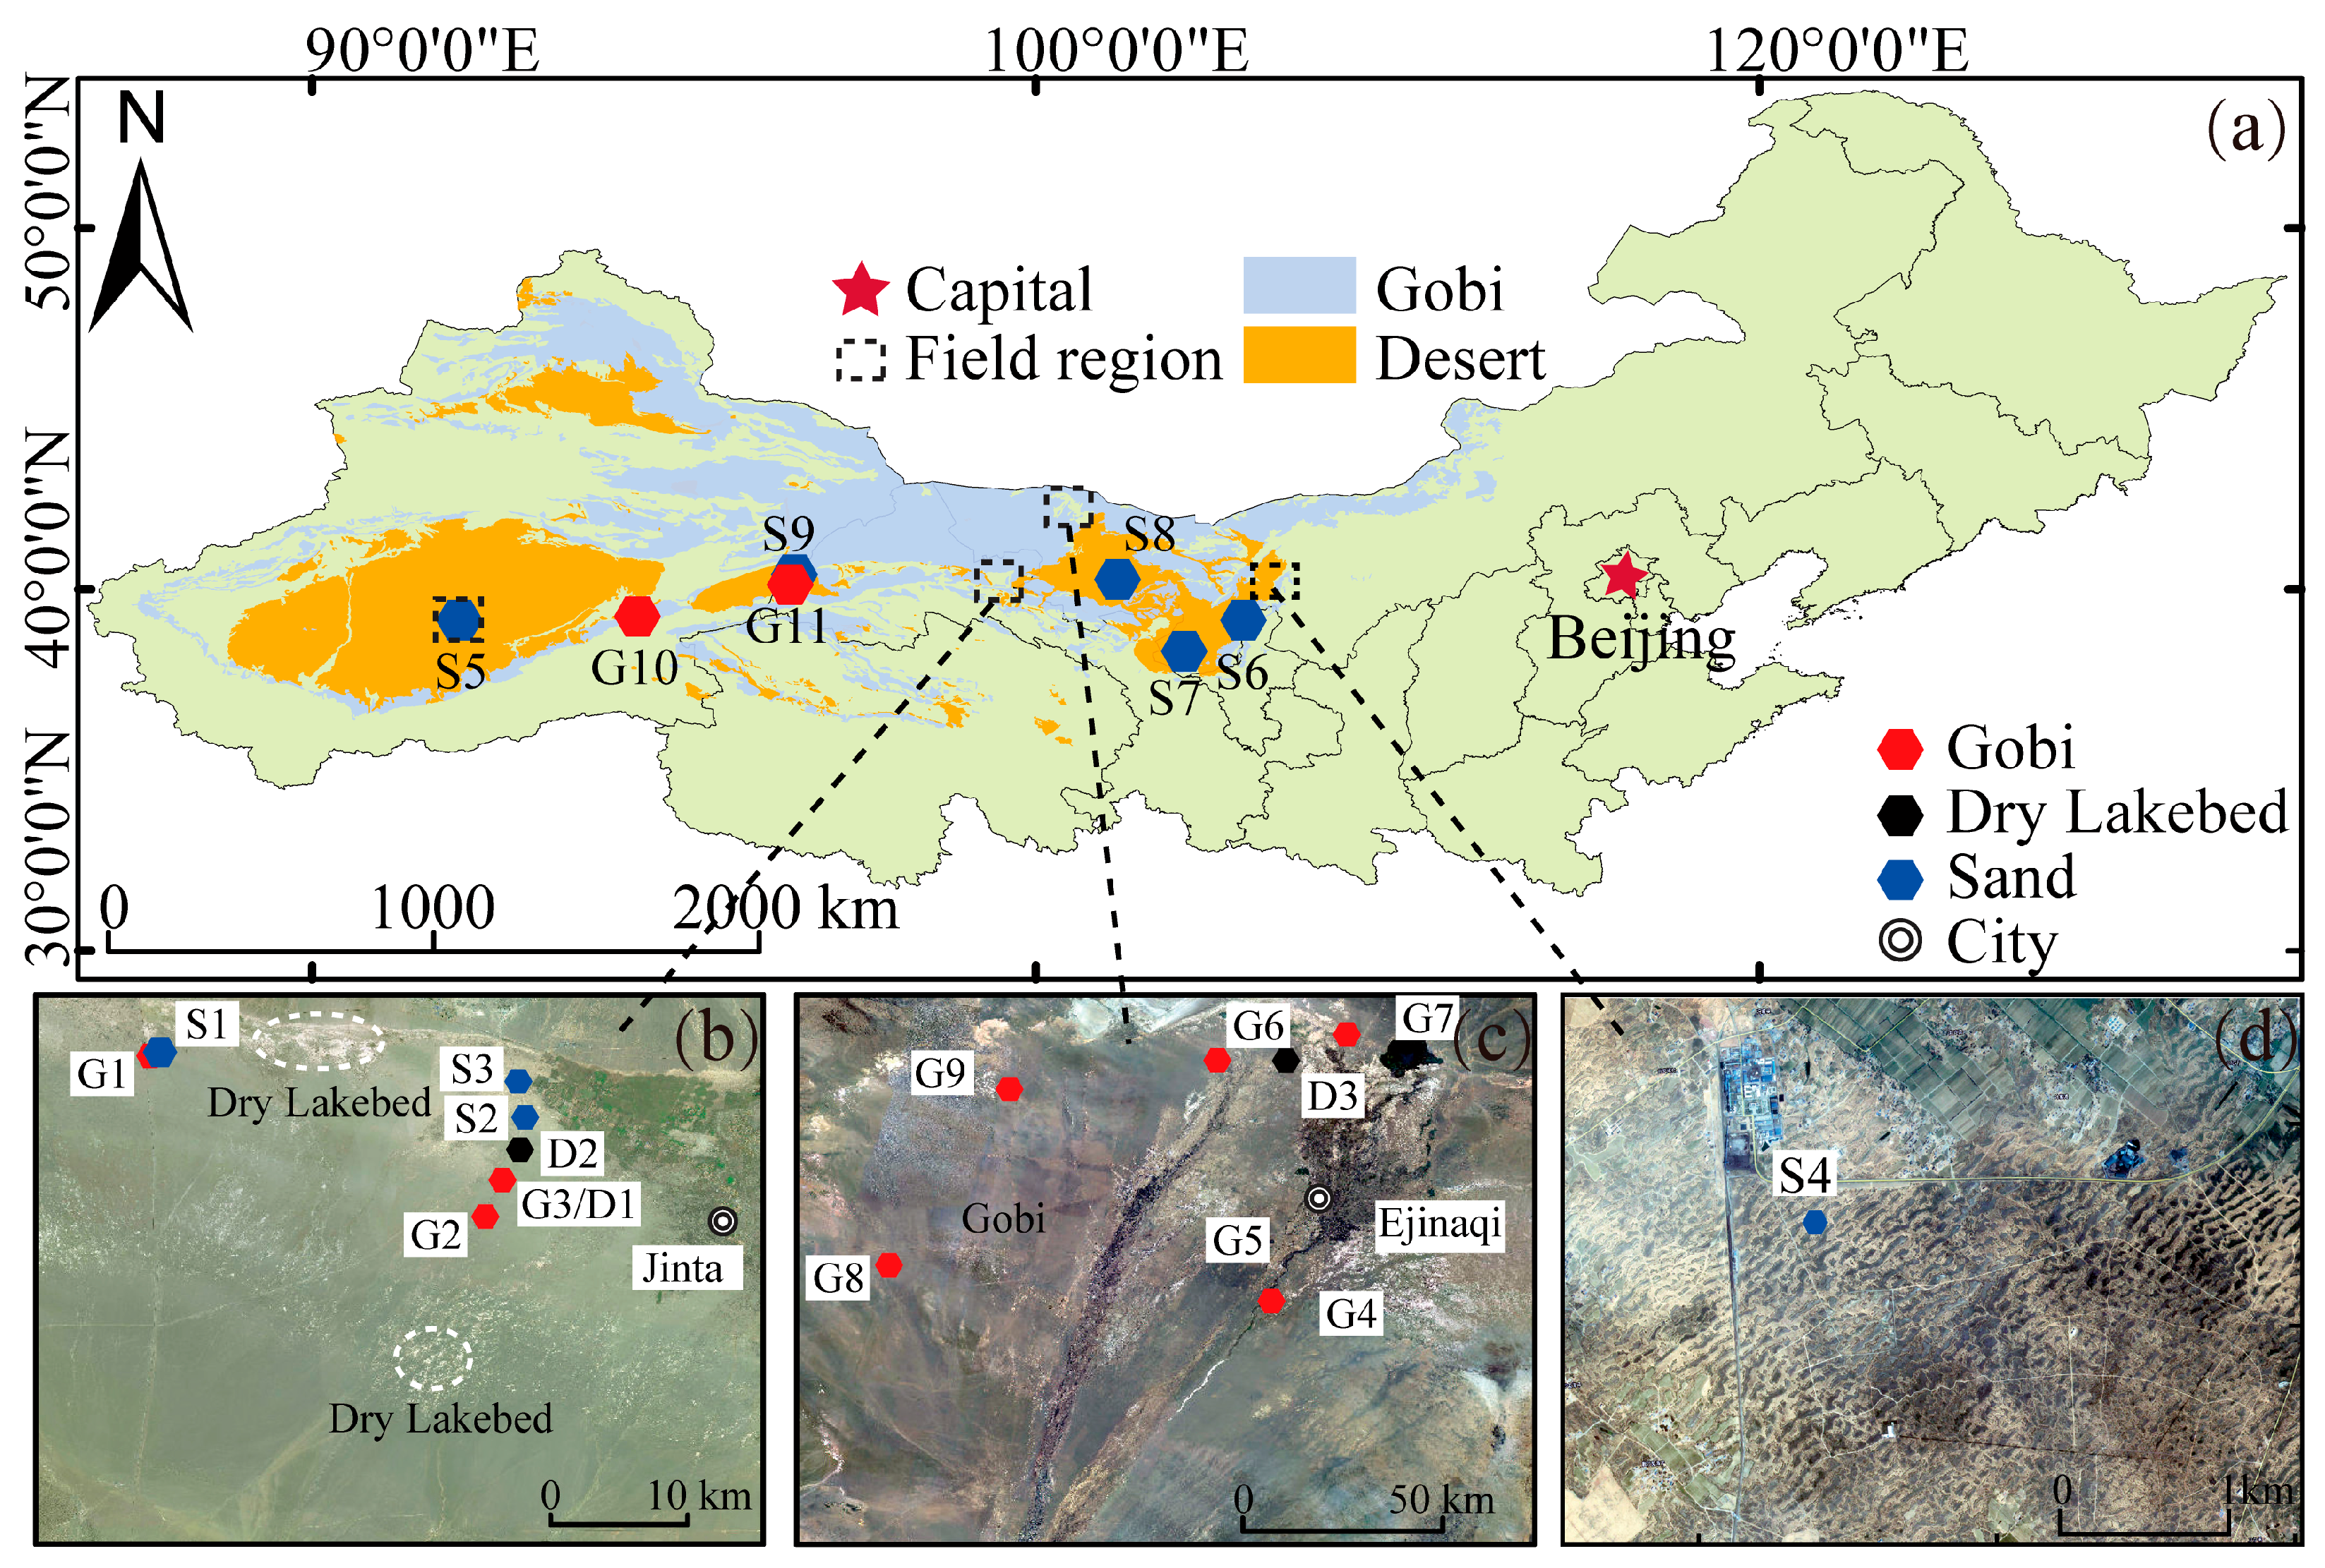
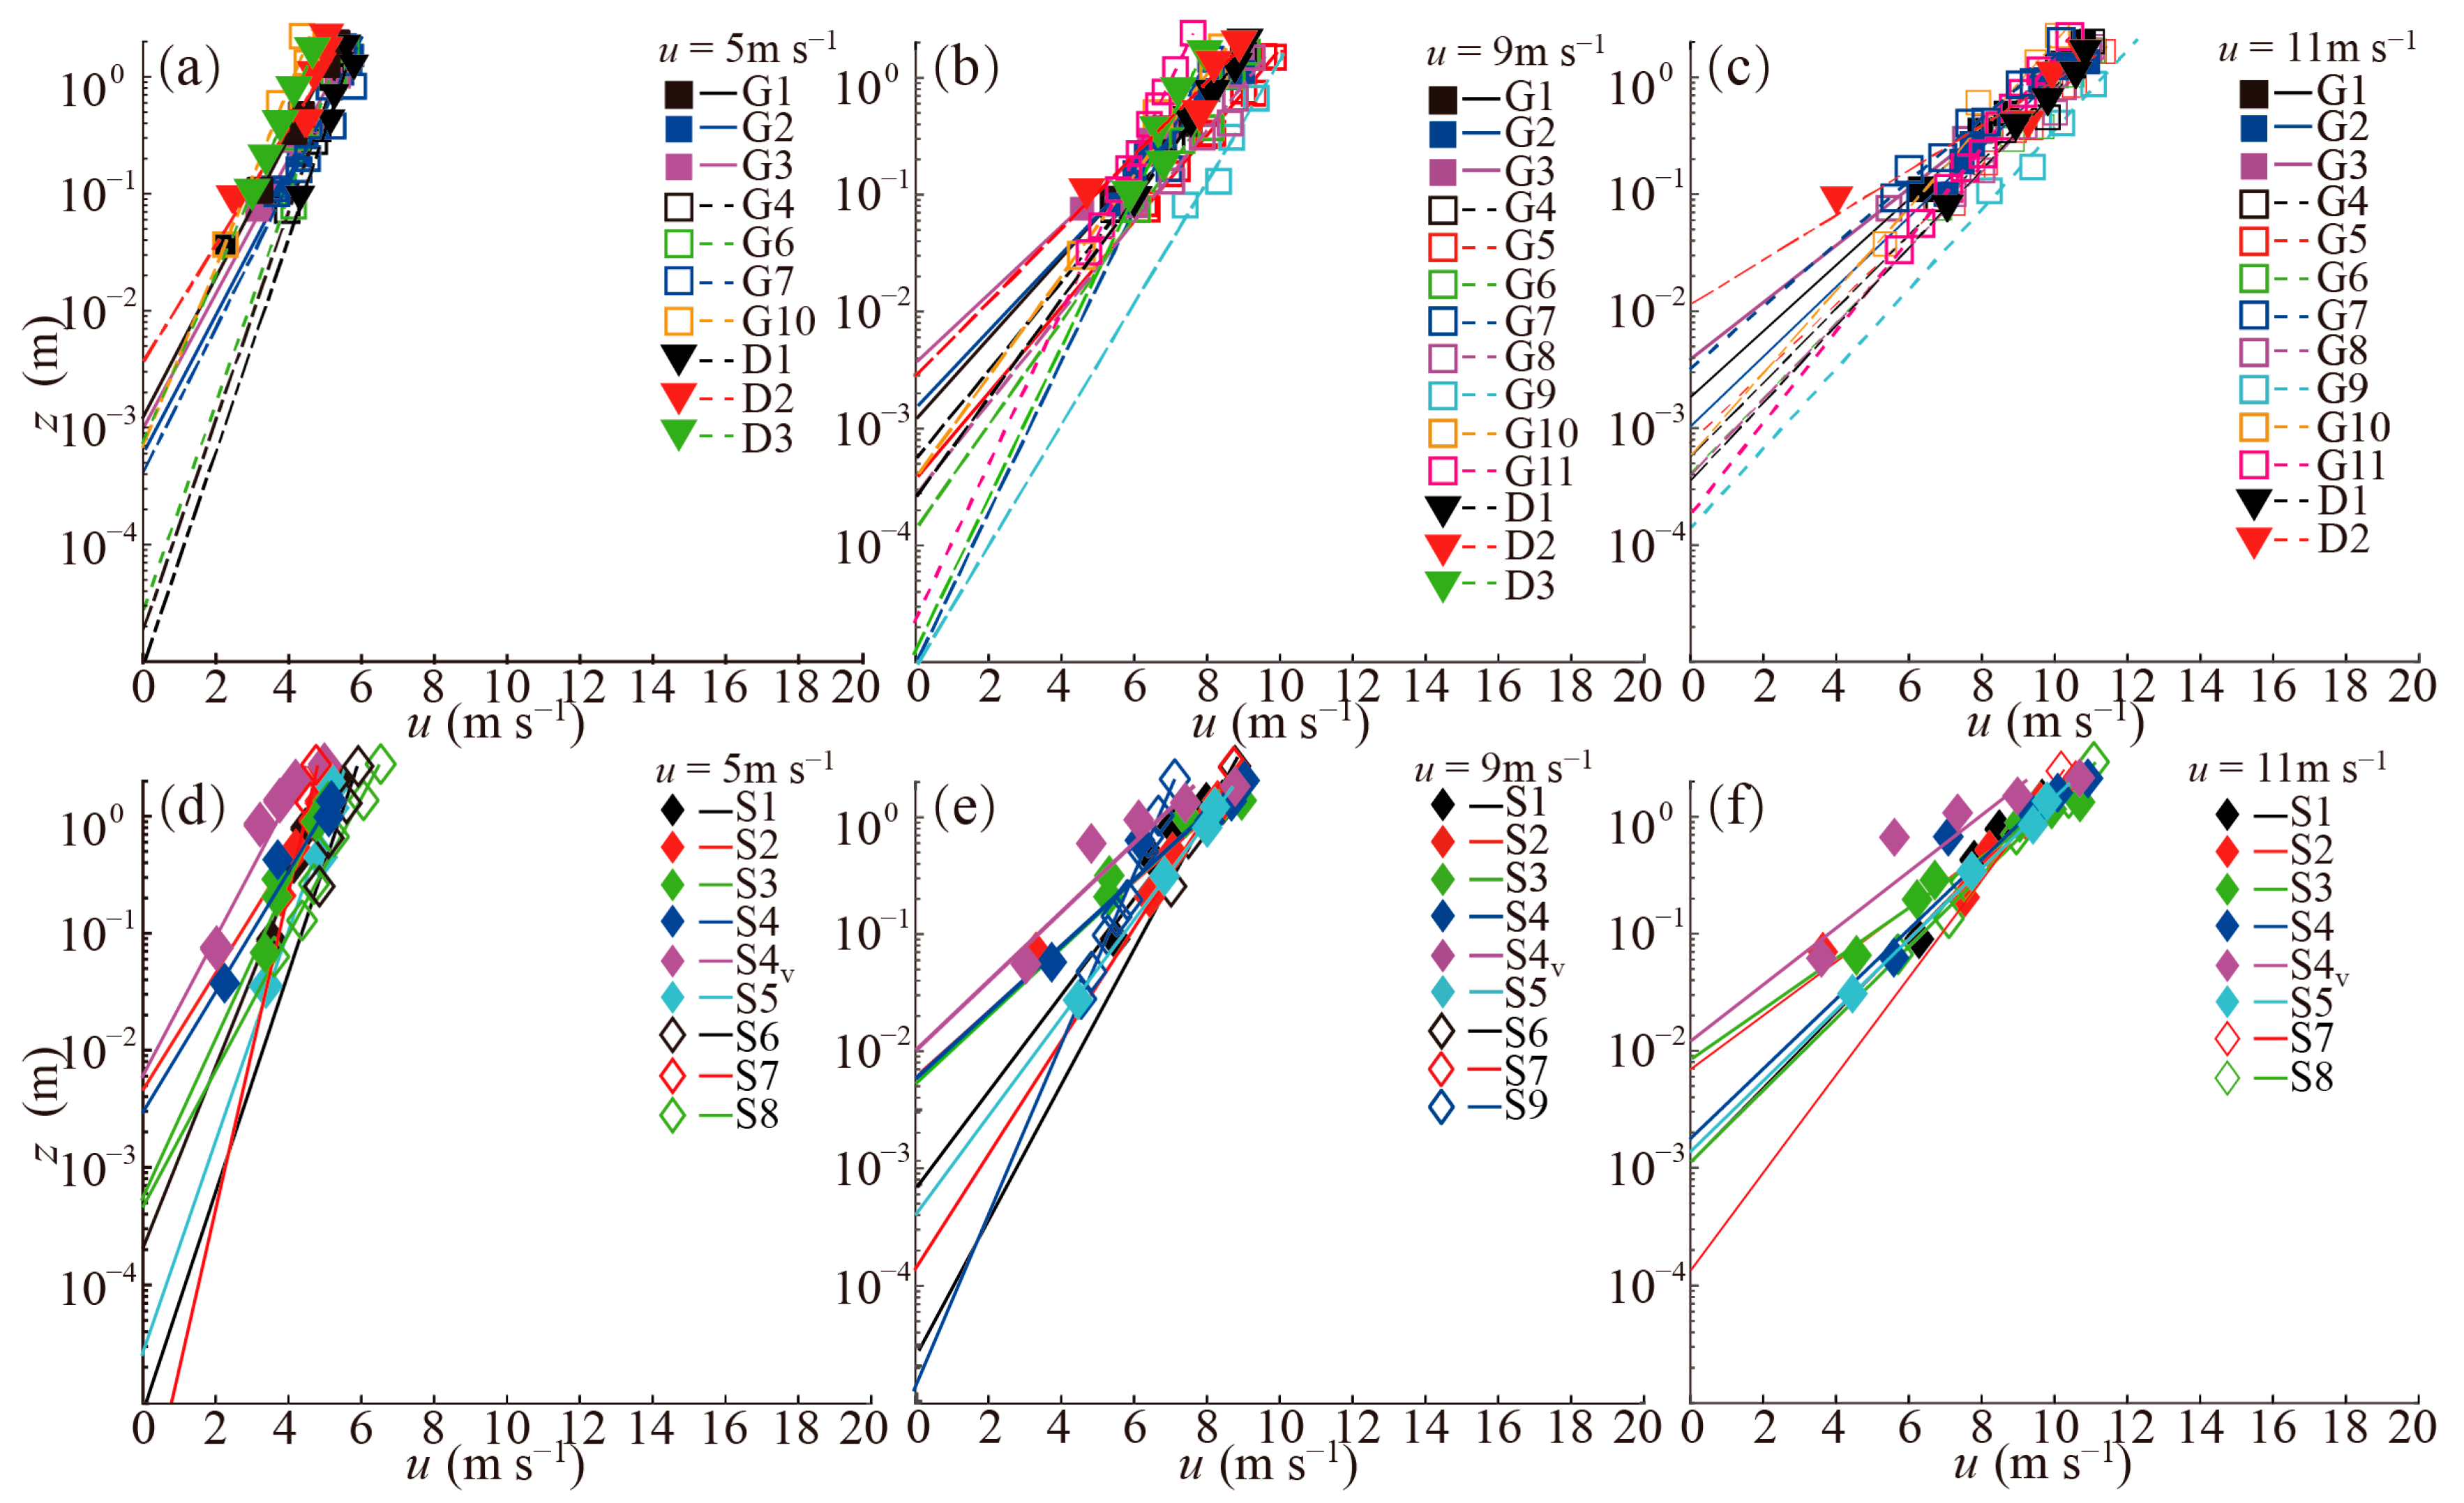
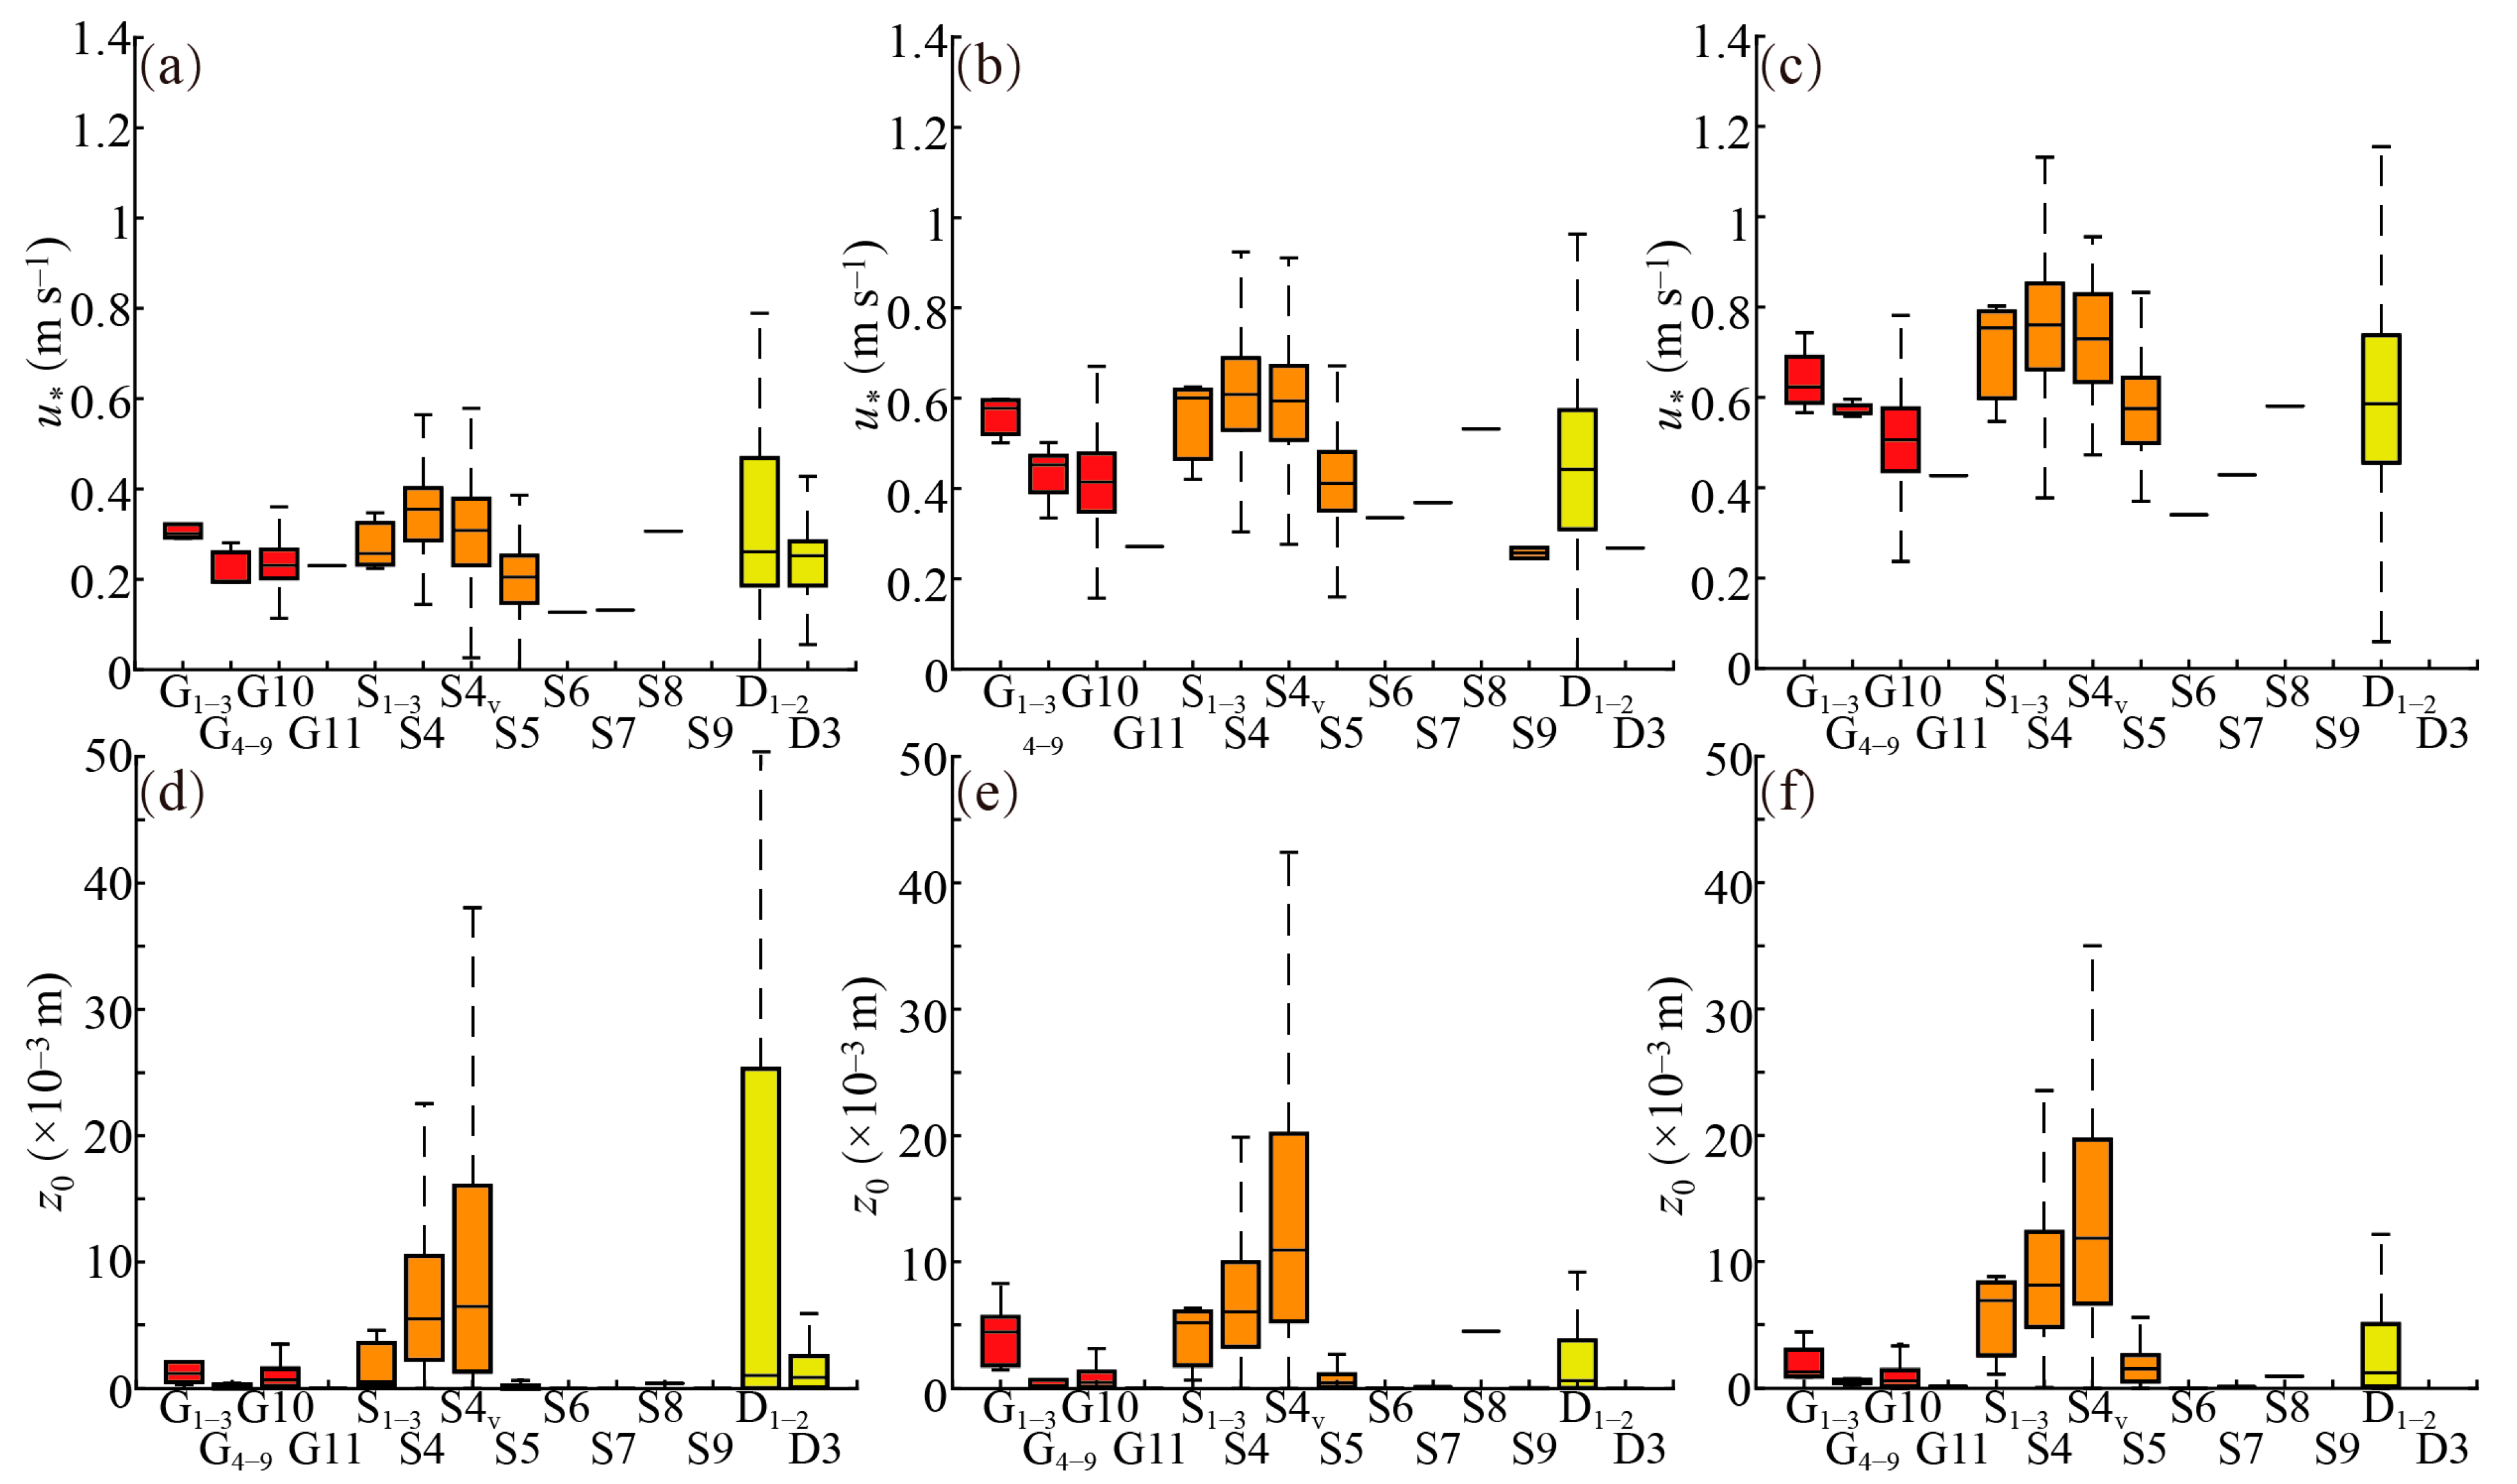
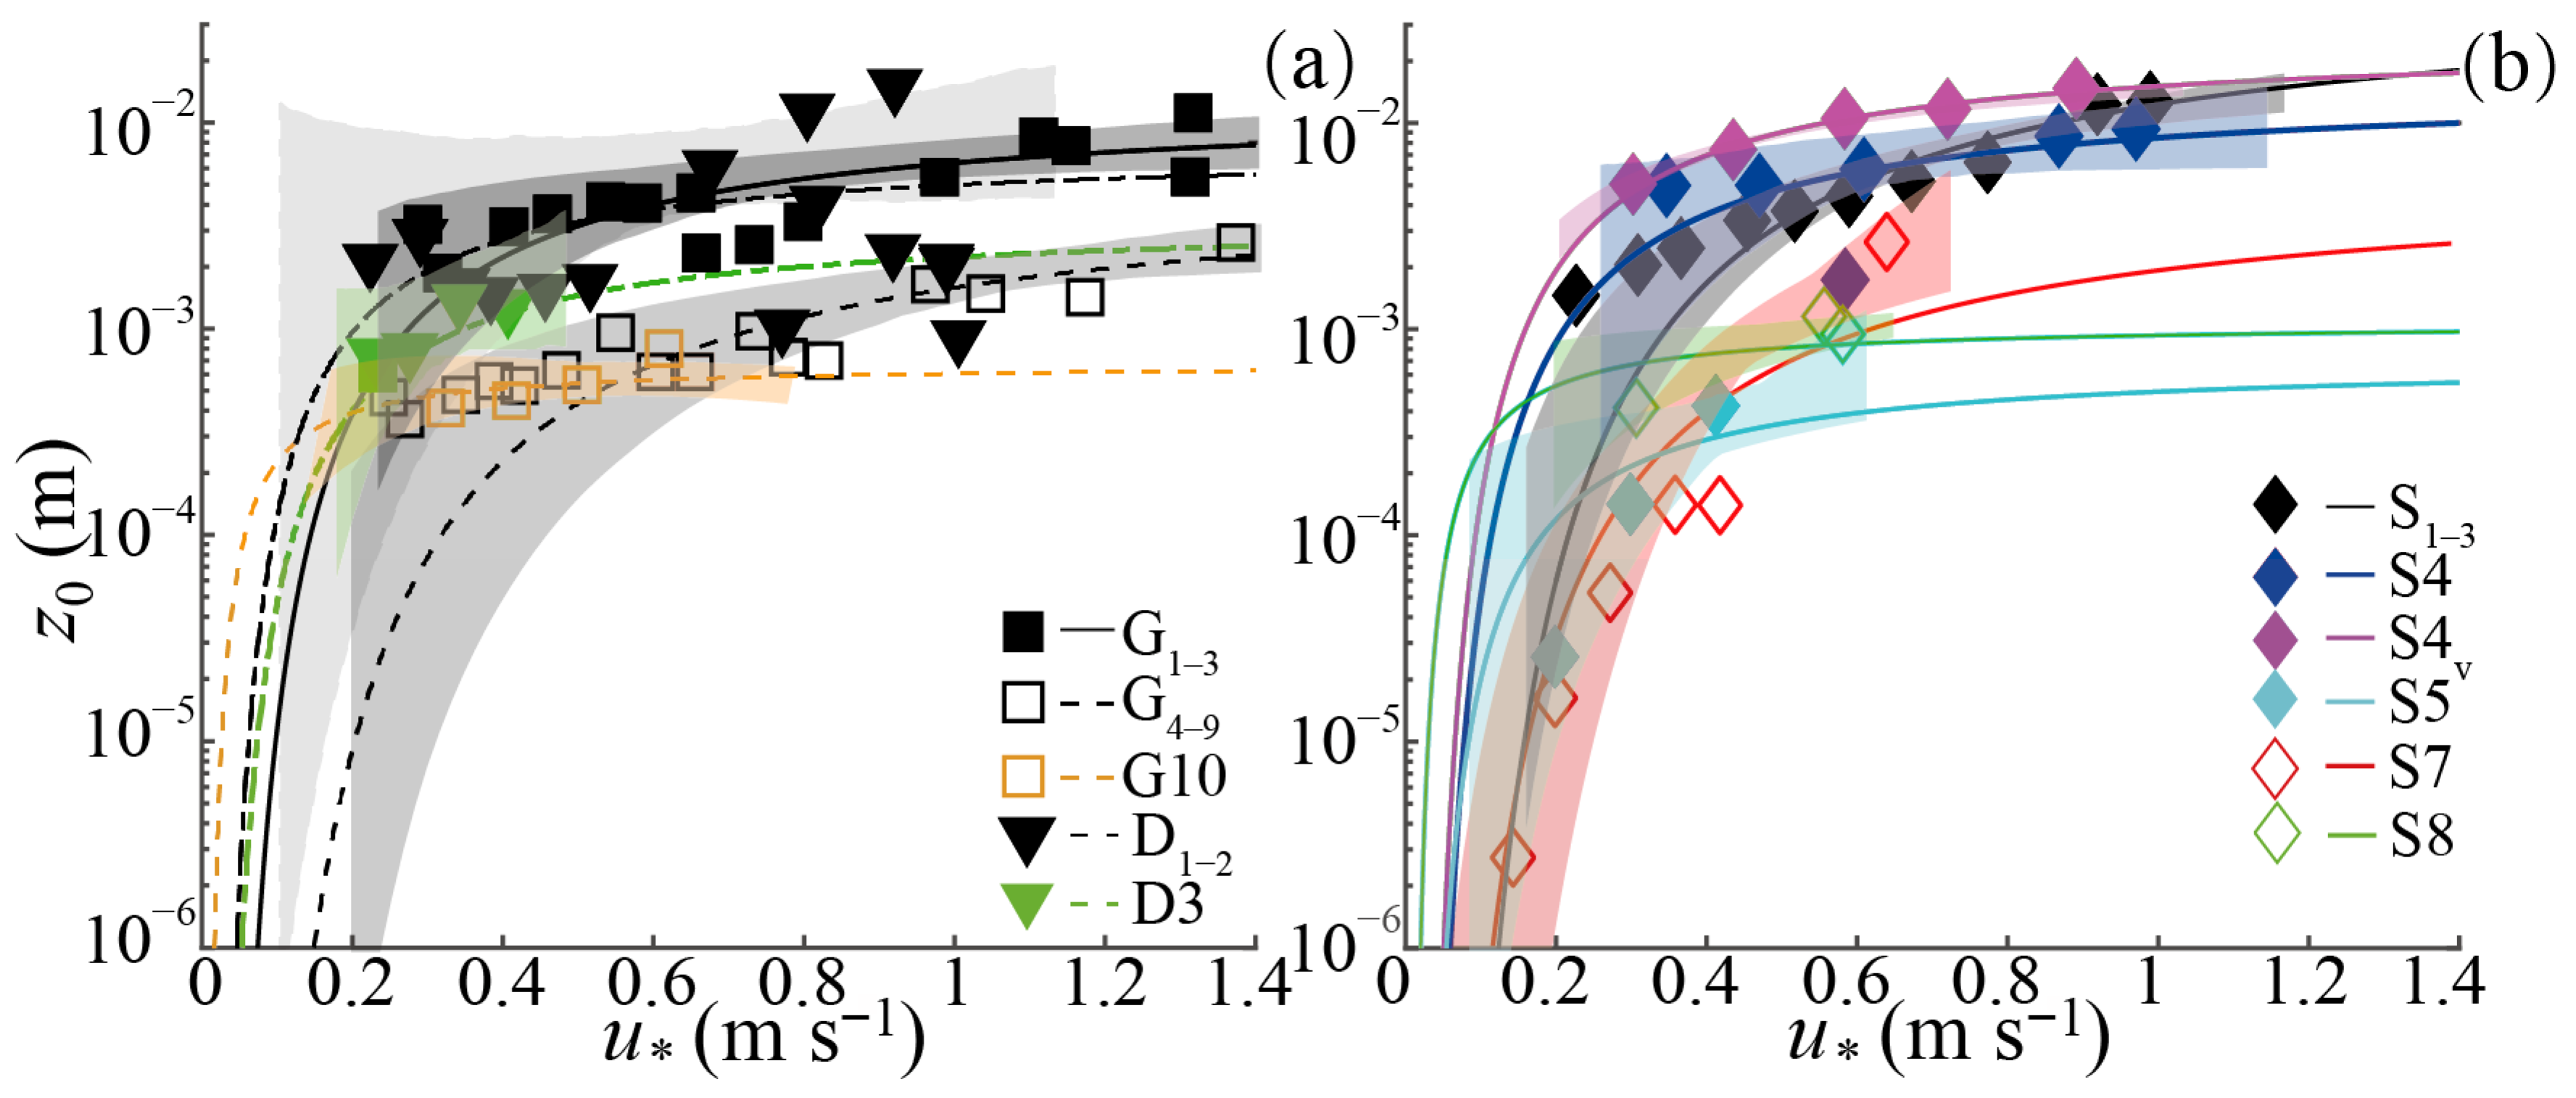
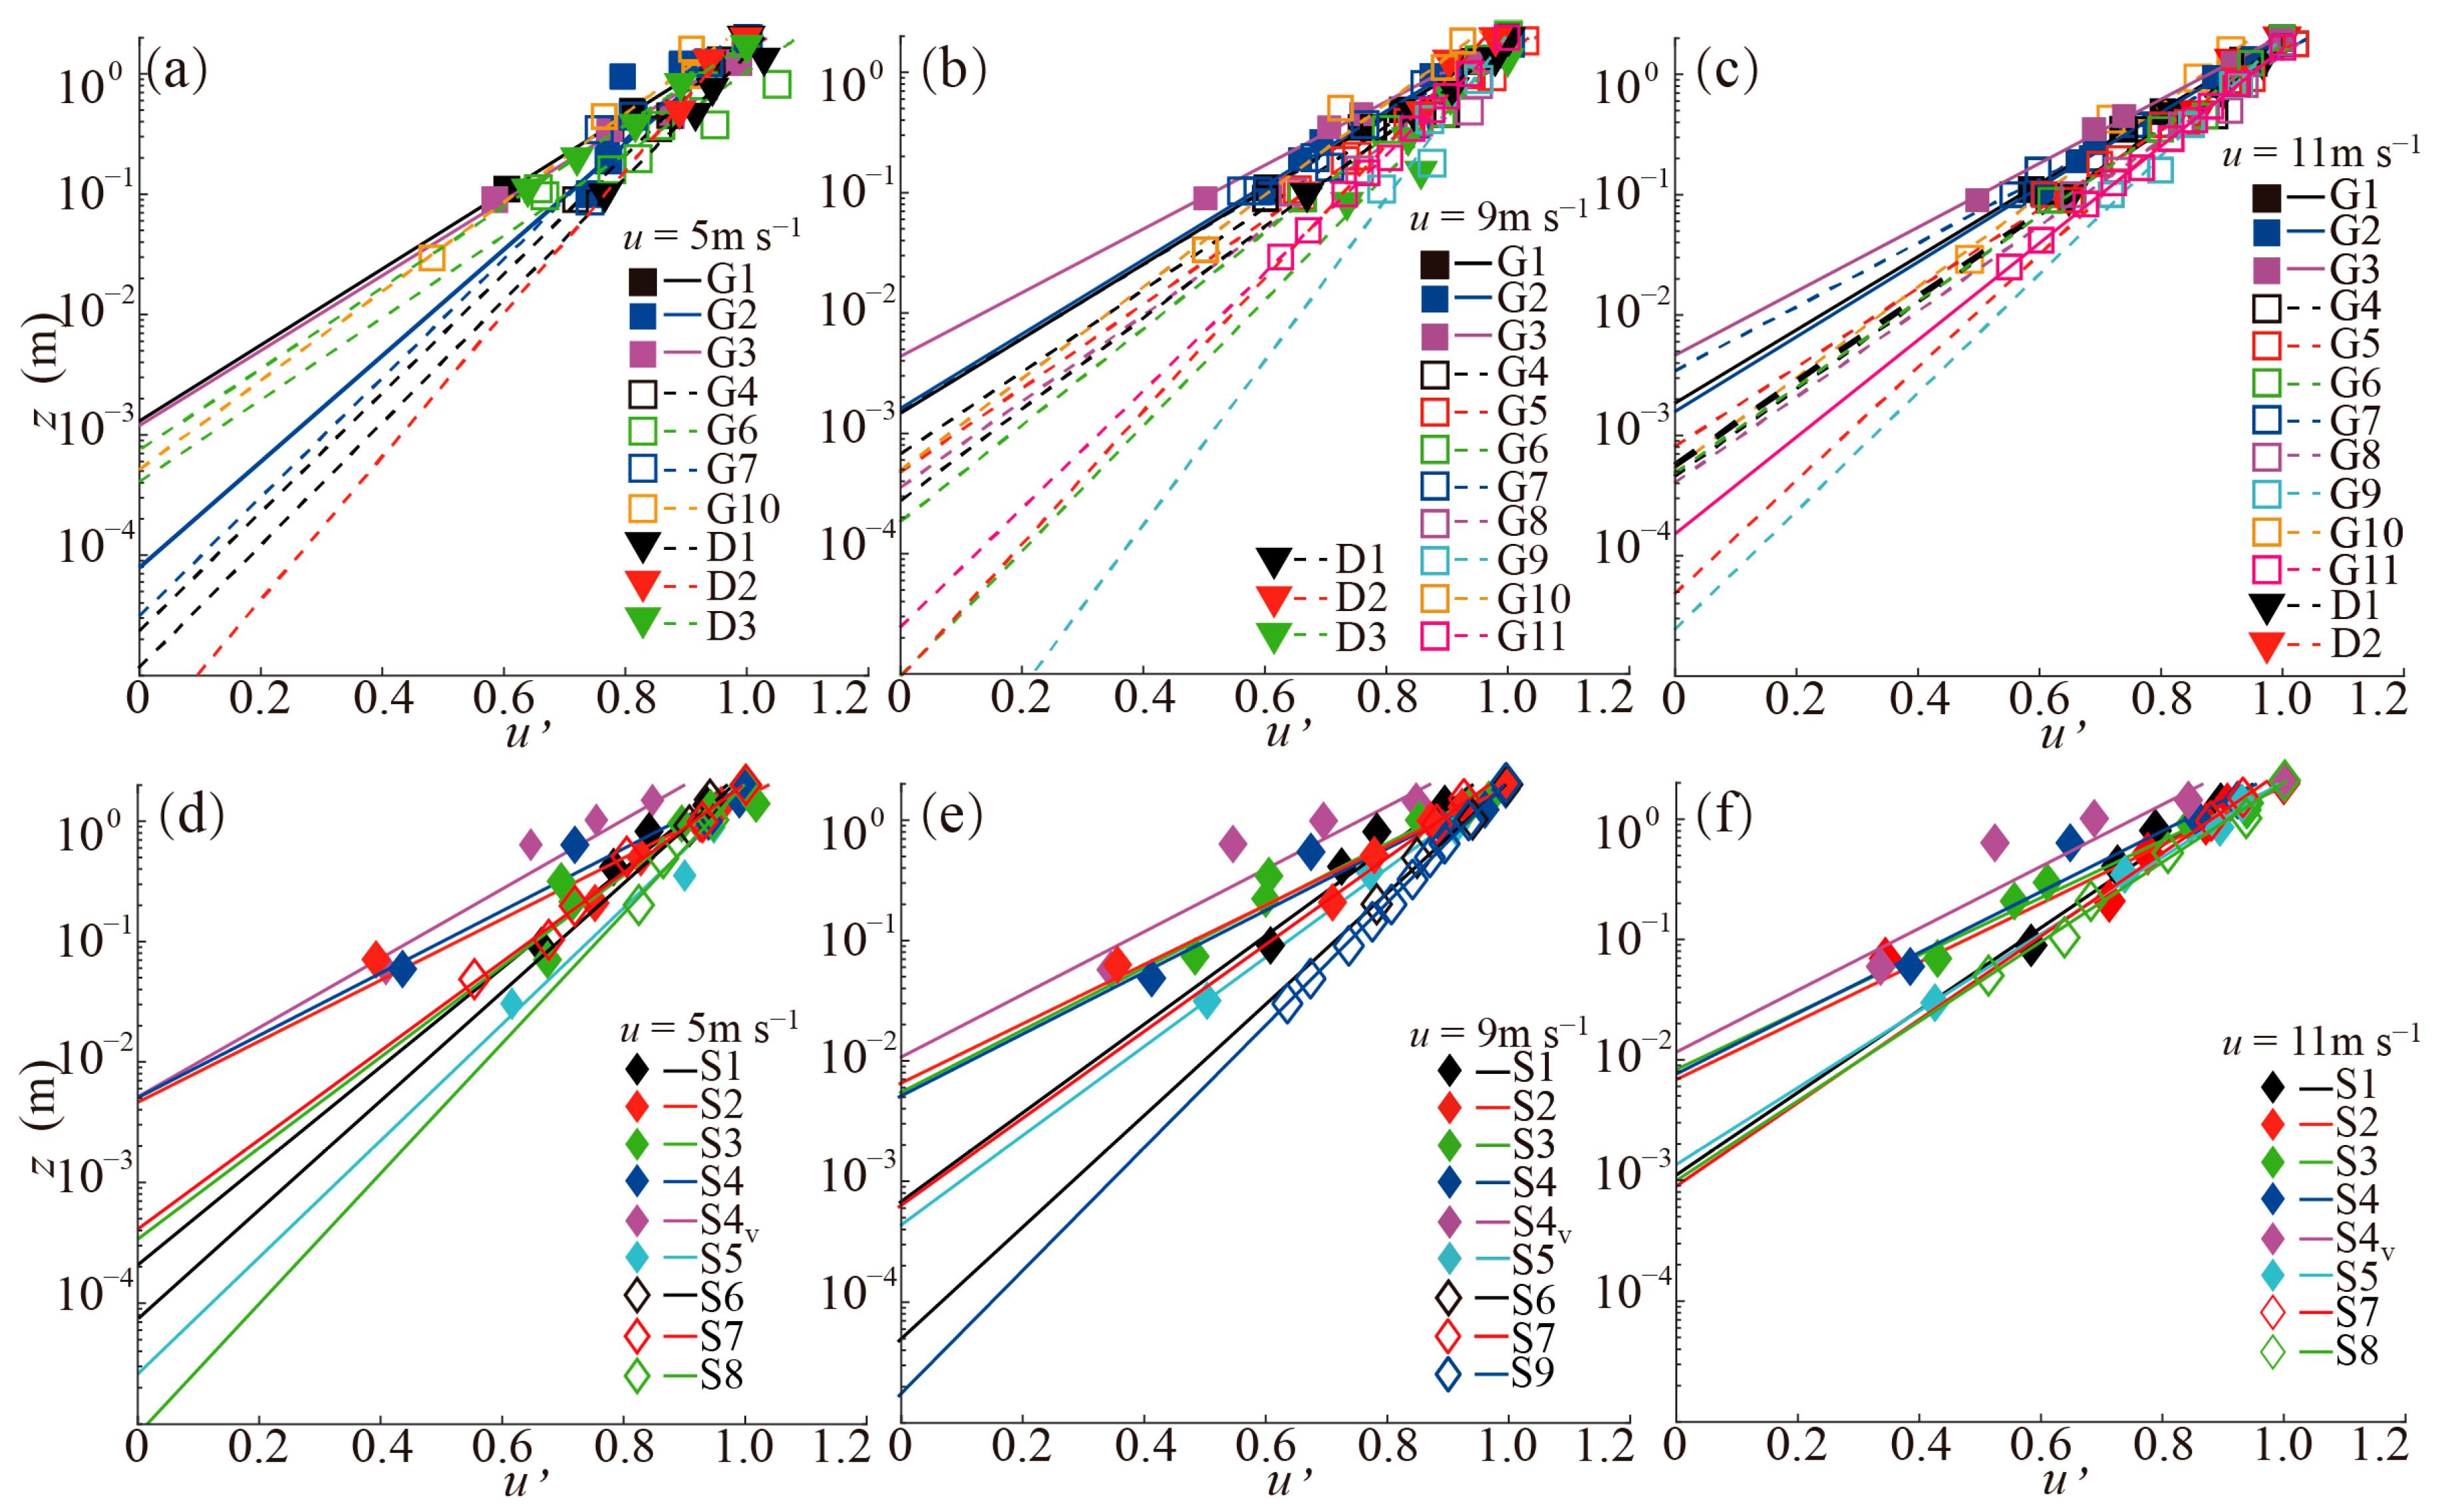
Dust and sand storms occurring in northern China are strongly controlled by near-surface aerodynamics, yet the spatial heterogeneity of these processes remains poorly understood. We obtained field measurements of the wind above gobis, sandy surfaces, and dry lakebeds in the Hexi Corridor Desert and Heihe River Basin, and sandy surfaces in northern China. First, the slope of wind profile (a1) reveals distinct drag reversal with increasing wind speed: under low winds, a1 increases from sandy to dry lakebed to gobi surfaces, whereas under high winds, actively saltating sandy surfaces exhibit the highest a1, surpassing gobi and dry lakebed. Second, the dynamic feedback between sediment transport and aerodynamics is clear: at below-threshold winds, friction velocity (u*) and aerodynamic roughness length (z0) are lowest for sand; however, as wind speed increases to initiate significant saltation, the sandy surface develops the highest u* and z0, highlighting the dominant role of grain-borne roughness. Third, the focal height (zf) shows regional disparity, varying by up to two orders of magnitude for both sandy and gobi surfaces, with a strong correlation to local gravel coverage. This work provides spatially explicit parameterizations of surface type, offering a physical basis for modeling dust emission and transport in northern China and similar arid regions globally. Such parameterizations are essential for developing reliable early warning systems and evidence-based land management strategies. These advances contribute directly to ecosystem sustainability and community resilience in vulnerable arid and semi-arid regions under climate change.
Keywords: wind profiles; the friction velocity; the aerodynamic roughness length; surface types wind profiles; the friction velocity; the aerodynamic roughness length; surface types