Article

The Influence of Near-Surface Ground Features on Near-Surface Airflow

1
Key Laboratory of Desert and Desertification, Northwest Institute of Eco-Environment and Resources, Chinese Academy of Sciences, Lanzhou 730000, China
2
University of Chinese Academy of Sciences, Beijing 100000, China
3
Key Laboratory of Qian Xuesen Deserticulture of Shaanxi Higher Education Institute, Yulin Observation and Research Station for Ecology and Environment of Desert-Loess Zone, School of Geography and Tourism, Shaanxi Normal University, Xi’an 710119, China
4
Institute of Atmospheric Physics, Chinese Academy of Sciences, Beijing 100000, China
*
Author to whom correspondence should be addressed.
Deceased author.
Sustainability 2026, 18(6), 2910; https://doi.org/10.3390/su18062910
Submission received: 19 January 2026 / Revised: 3 March 2026 / Accepted: 12 March 2026 / Published: 16 March 2026

Abstract

Dust and sand storms occurring in northern China are strongly controlled by near-surface aerodynamics, yet the spatial heterogeneity of these processes remains poorly understood. We obtained field measurements of the wind above gobis, sandy surfaces, and dry lakebeds in the Hexi Corridor Desert and Heihe River Basin, and sandy surfaces in northern China. First, the slope of wind profile (a1) reveals distinct drag reversal with increasing wind speed: under low winds, a1 increases from sandy to dry lakebed to gobi surfaces, whereas under high winds, actively saltating sandy surfaces exhibit the highest a1, surpassing gobi and dry lakebed. Second, the dynamic feedback between sediment transport and aerodynamics is clear: at below-threshold winds, friction velocity ( u * ) and aerodynamic roughness length (z0) are lowest for sand; however, as wind speed increases to initiate significant saltation, the sandy surface develops the highest u * and z0, highlighting the dominant role of grain-borne roughness. Third, the focal height (zf) shows regional disparity, varying by up to two orders of magnitude for both sandy and gobi surfaces, with a strong correlation to local gravel coverage. This work provides spatially explicit parameterizations of surface type, offering a physical basis for modeling dust emission and transport in northern China and similar arid regions globally. Such parameterizations are essential for developing reliable early warning systems and evidence-based land management strategies. These advances contribute directly to ecosystem sustainability and community resilience in vulnerable arid and semi-arid regions under climate change.

1. Introduction

Wind erosion results from the entrainment and transport of sediment particles, resulting in the formation and evolution of the world’s sand seas and the long-range transport of sediments from continents to oceans [1]. This transport has gradually become a key environmental issue around the world [2,3,4]. Both wind properties and surface properties affect wind erosion. For instance, wind velocity, turbulence, air density, and viscosity differed above different land surfaces, leading to spatial variation in sand transport [5]. The characteristics of the near-surface stratum, including soil moisture, vegetation, average particle size, and topography [6], also affect wind erosion of soil [7]. However, the transported sand also changes the wind field by absorbing some of the wind’s energy and increasing the surface roughness length [8,9,10]. Therefore, differences in the wind velocity above different surfaces and during different sand transport processes are a key issue in aeolian research.
Wind is the most important external dynamic factor during wind erosion, and it provides power for the emission and transport of aeolian sand. Wind velocity changes with height near the surface, and these changes are expressed as a wind profile, which reflects the changes in the vertical momentum flux and the magnitude of the shear stress with increasing height [1,11]. The spatial variation in wind profiles is affected by the existence of roughness elements (e.g., vegetation, gravel), and the length of the uniform surface over which the wind is blowing (i.e., the fetch), leading to wind velocity profiles with different shapes [12]. A number of equation forms have been used to describe the equilibrium wind velocity profile, such as power and logarithmic equations [13,14]. However, most of the research results were obtained in a wind tunnel [15], with relatively scarce field measurements [16].
The wind’s friction (shear) velocity ( u * ) and aerodynamic roughness length (z0) are two main parameters in aeolian research, and can usually be calculated from the wind velocity profiles using a logarithmic equation [17]. u * and z0 are used to describe the effect of near-surface aerodynamic roughness on the wind. u * reflects the air’s power to entrain particles and can be used to represent the distribution of this power above different surfaces as well as the variation in the momentum flux at the surface [1]. Under the influence of different underlying surfaces, the wind’s friction velocity changes.
The aerodynamic parameters of wind above a surface reflect the surface properties, since a larger surface roughness generally creates a larger z0. z0 is an important parameter of the boundary layer because it represents the height where the wind velocity in the near-surface layer equals zero [18]. It is therefore a physical quantity that reflects the interaction between the underlying surface and the airflow [19]. Aerodynamic roughness has been used to assess the aerodynamic properties of sandy, vegetated, and snow-covered surfaces [20,21,22] and to determine how sand transport is affected by variations in surface roughness [18,23,24].
The u * and z0 parameters obtained from wind profiles can be used to calculate the sediment transport rate (q) and the resulting total quantity of transported sediment [21]. Different types of surfaces affect the airflow and turbulence near the surface. Gobis (gravel deserts), dry lakebed surfaces, sandy surfaces, and other surface types are widely distributed in northern China [16]. Gobi and dry lakebed surfaces are often considered to be non-erodible surfaces, whereas sandy surfaces are clearly erodible. These different surface types can affect the near-surface wind velocity in different ways and, thus, affect the emission of dust. Our previous field study indicated that sand transport differed above gobis, sands, and dry lakebed surfaces [25], but it was unclear how the mechanisms differed among these three land surfaces. Unlike previous research that predominantly focused on sandy surfaces or wind tunnel simulations, this study provides systematic field measurements specifically targeting the aerodynamic characteristics of gobi and dry lakebed surfaces, which have been significantly understudied. Therefore, we designed the present study to analyze spatial variations in wind conditions above these surfaces and the effects on sand and dust emission and transport. Although we collected the wind data used in the present study during that previous research, the wind data in the present study does not overlap with the data in that previous manuscript.
Currently, a lack of data on both wind velocities in the field and surface roughness has limited our ability to validate models of sand emission and transport above gobis and dry lakebed surfaces. In the present field study, we used Windsonic sensors to measure the wind velocity profile above sand surfaces, dry lakebed surfaces, and gobis in the Hexi Corridor Desert of northern China and other deserts in northern China. Our main purpose was to quantify the spatial differences in wind velocity and provide field data to parameterize models of atmospheric conditions above these surfaces. Our results provide insights into the characteristics of the aerodynamic processes above different surfaces in northern China, and will have implications for similar surfaces around the world. Understanding the mechanisms that control the initiation of sand transport will provide important support for parameterizing wind-erosion models and will offer guidance for the prevention of wind erosion in these areas. Furthermore, the mechanistic insights of aeolian processes across diverse surface types and field-based parameterizations presented in this work provide essential scientific support for evidence-based decision-making. They enhance the predictive accuracy of dust emission and transport models, which is critical for developing early-warning systems and sustainable land management strategies to mitigate sand and dust storm impacts. Consequently, this work aids in reducing disaster risks, enhancing the resilience of ecosystems and supporting sustainable development in vulnerable drylands facing climate change.

2. Materials and Methods

2.1. Study Regions

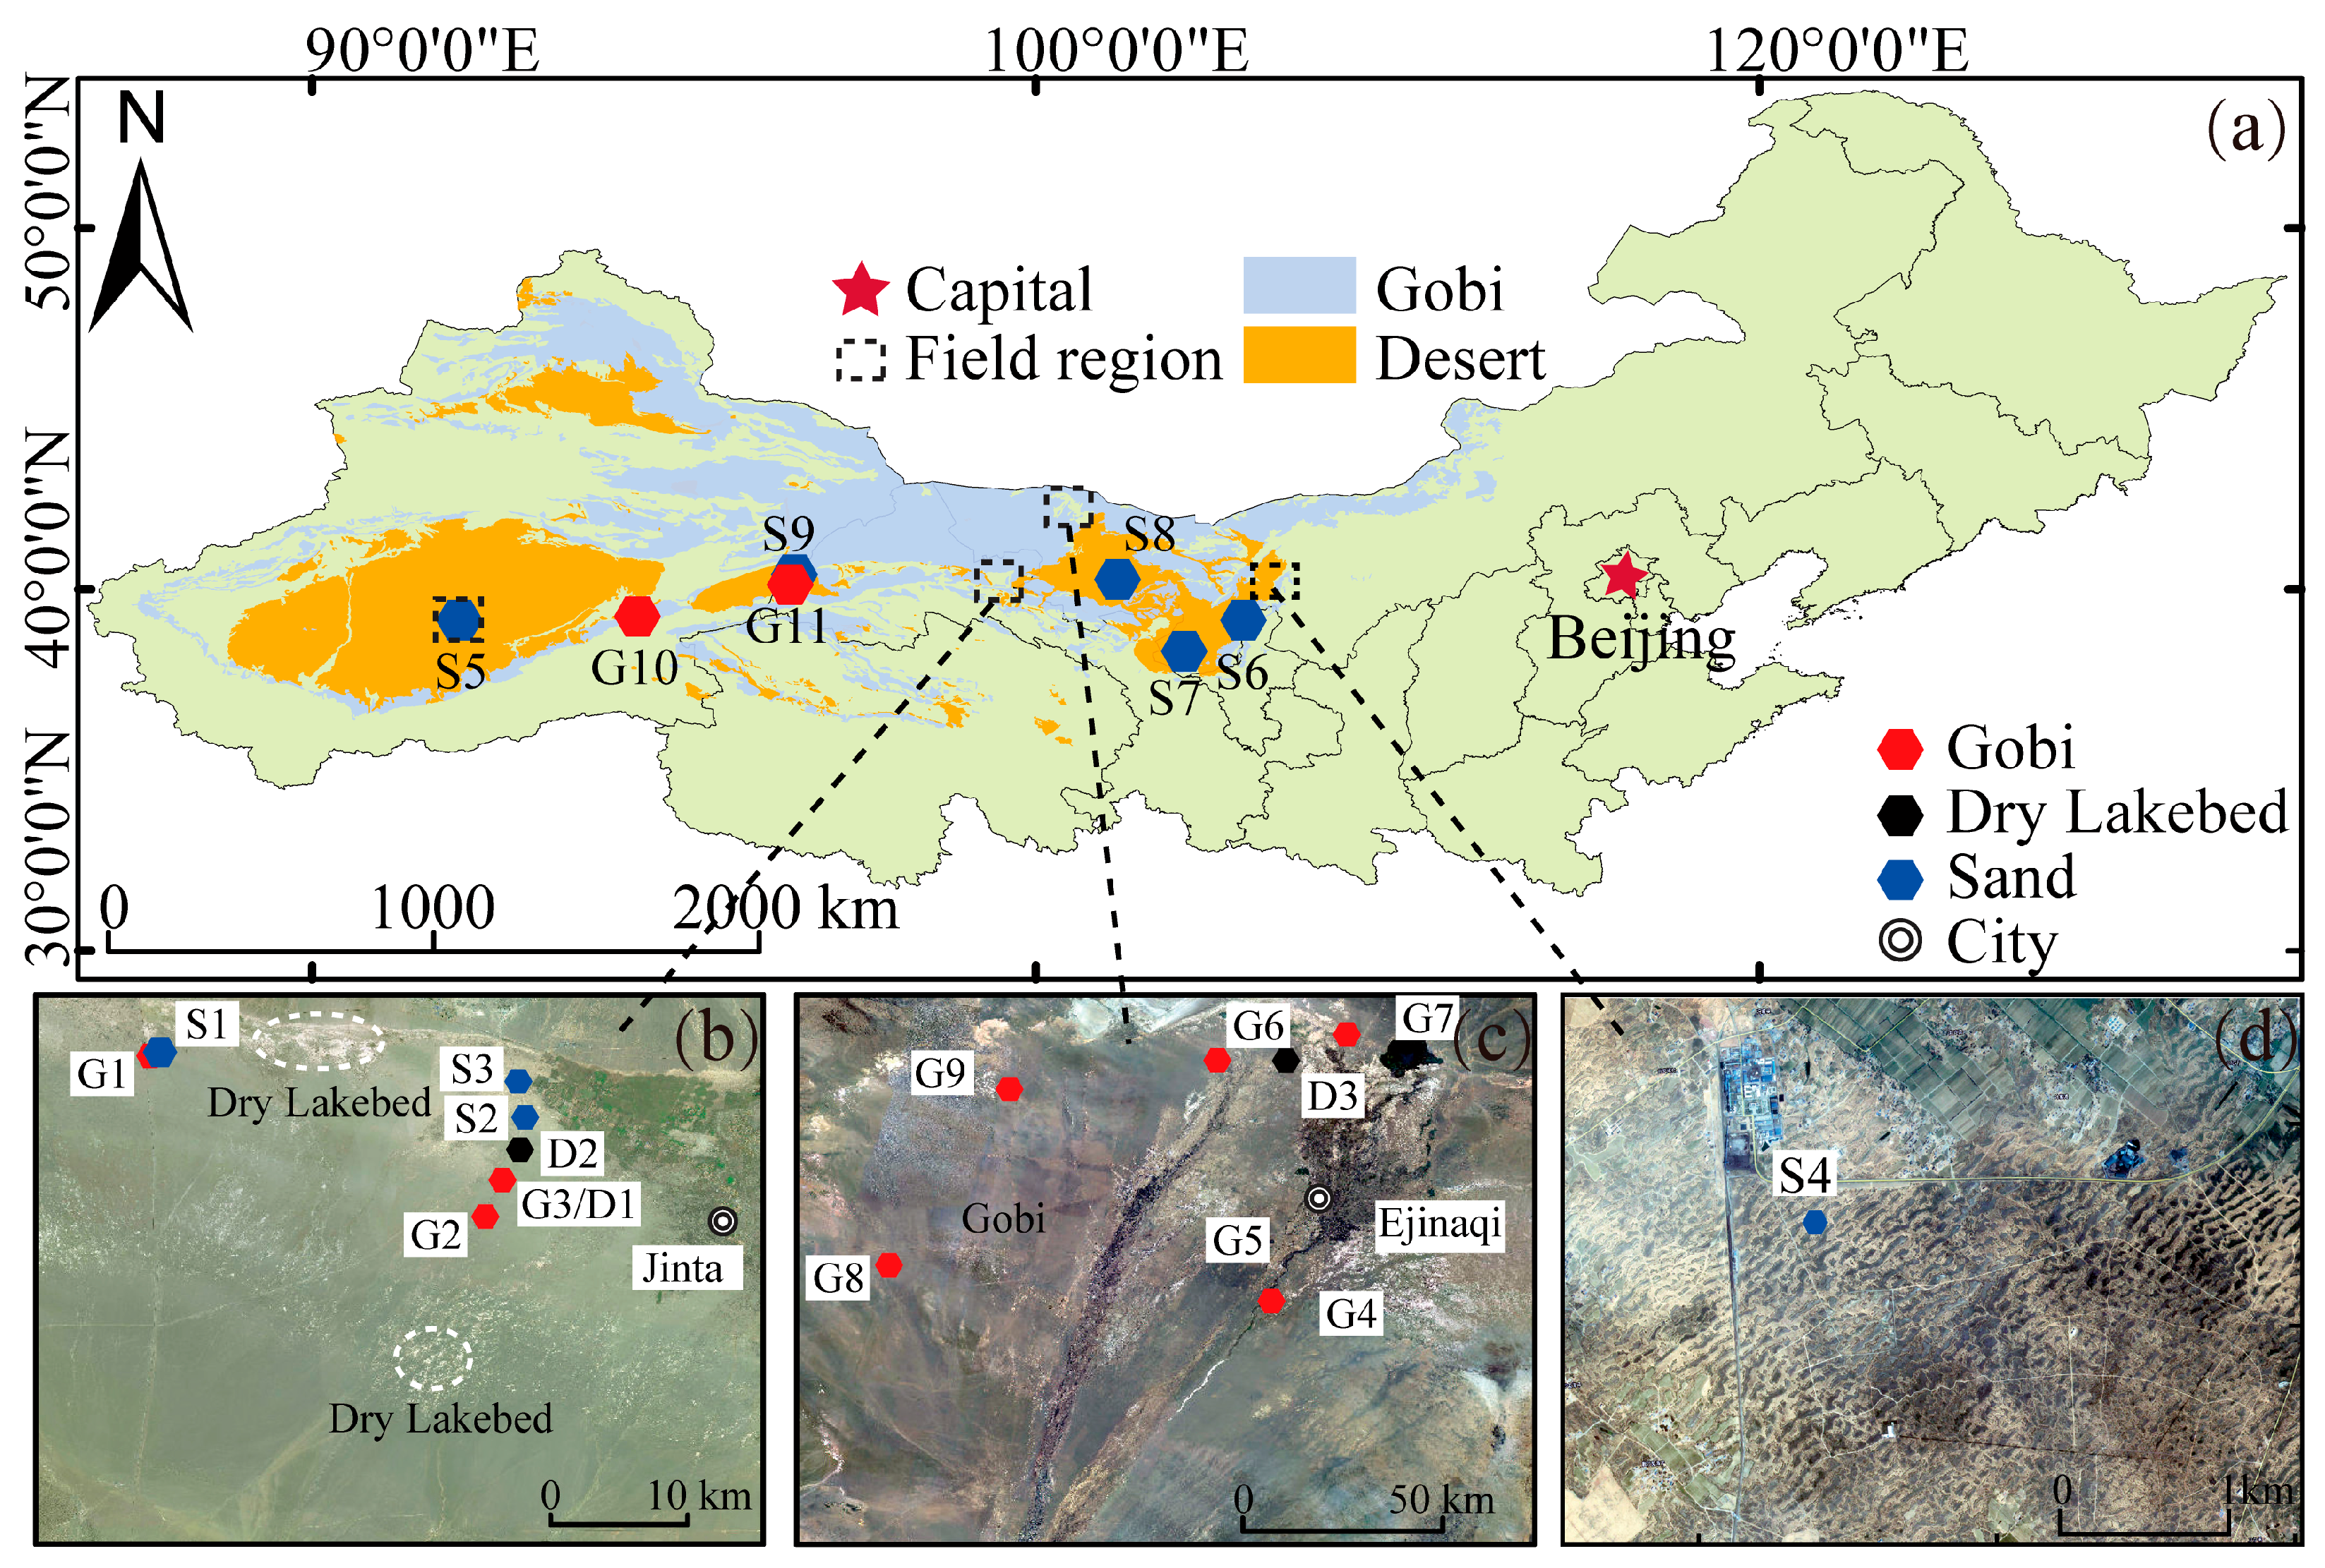
Our study was conducted across six typical arid and semi-arid regions in northern China, including the central Hexi Corridor Desert (northwest of Jinta County, Gansu Province), the Heihe River Basin (near Ejina Banner), the central and southeastern Taklimakan Desert, and the Mu Us Sandy Land (Figure 1). Additionally, wind profile data from the Tengger Desert, Badain Jaran Desert and Ulan Buh Desert were incorporated from previously published literature to expand the regional coverage. Detailed characteristics of each study area are described below.

2.1.1. Hexi Corridor Desert

Located in the central Hexi Corridor (40°00′–40°17′ N, 98°14′–98°34′ E), this region has a temperate continental arid climate. The annual mean temperature is approximately 6.2 °C, and the annual mean precipitation is 50–150 mm, of which 90% of precipitation falls between June and August. The annual potential evaporation ranges from 1500 to 2500 mm, indicating extreme aridity [26]. Wind conditions are characterized by an annual mean wind speed of 2.8–4.6 m s−1, with the strongest winds occurring in April and May, coinciding with the peak sandstorm season [27,28].
The dominant surface types include gobi, sandy, and dry lakebed (Figure 1b). Gobi areas are primarily distributed on alluvial fans of the Qilian Mountains and Beishan Mountains, covered with well-sorted gravel and sparse vegetation. Sandy surfaces consist of mobile dunes interspersed with scattered small shrubs, while dry lakebeds form hard crusts (physical and biological) via the evaporation of stagnant water, with sparse vegetation in low-lying areas and loose sediments from human activities (e.g., road construction) [28]. All observation sites were established on flat, level ground to avoid topographic interference with wind measurements.

2.1.2. Heihe River Basin

The study area in the Heihe River Basin is situated near Ejina Banner (41°40′–42°17′ N, 100°05′–101°01′ E, Figure 1c), sharing a temperate continental arid climate with the Hexi Corridor Desert but differing in key climatic parameters. The annual mean temperature is approximately 9.1 °C (higher than the Hexi Corridor Desert), the annual mean precipitation is only 37 mm (90% concentrated in June–August), and the annual potential evaporation averages 3841.51 mm—resulting in a drought index (potential evaporation/precipitation) exceeding 100 [29]. The annual mean wind speed is 4.4 m s−1, with frequent sandstorms in winter and spring [30,31].
The dominant surface type in this region is gobi, with scattered dry lakebeds. Within the gobi areas, gravel particles are coarser and surface moisture is slightly higher; influenced by the terminal hydrological processes of the Heihe River, dry lakebeds exhibit more developed crusts [29]. Observation sites were established in open, flat areas to exclude non-representative surfaces such as oases and water bodies.

2.1.3. Taklimakan Desert

Two sub-regions were studied in the Taklimakan Desert—the largest shifting sand desert in China: the central desert (38°45′–38°46′ N, 83°55′–83°56′ E) and the southeastern desert (39°03′–39°16′ N, 88°51′–89°16′ E) (Figure 1a). The climate is temperate continental, extremely arid, with an annual mean temperature of 9.9–12.6 °C, an annual mean precipitation of 17.4–66.3 mm, and potential evaporation exceeding 3000 mm [32]. Despite lower overall wind speeds than the Hexi Corridor Desert and Heihe River Basin, the desert has high dune mobility (over 90% sandy surfaces) and frequent sand-related hazards.
Sandy surfaces (predominantly fine to medium sand) are mainly distributed in the desert hinterland, where complex longitudinal ridges—with secondary simple dunes superimposed on them—are the dominant dune types (vegetation coverage < 1%). In contrast, Gobi surfaces are limited to Piedmont zones along the desert margin, covered with 40–60% gravel (mostly weathered crusts from mountain erosion) [32]. Observation sites were placed in inter-dune depressions or open gobi areas to avoid wind disturbance from dune crests or slopes.

2.1.4. Mu Us Sandy Land

Located in the northwestern Ordos Basin (38°23′–38°28′ N, 109°27′–109°30′ E)—a transition zone between the Ordos Plateau and the Loess Plateau—this region has a temperate semi-arid continental climate, influenced by the East Asian monsoon. The annual mean temperature is 6–9 °C, the annual mean precipitation is 200–450 mm (concentrated in July–August), and the annual potential evaporation is 1800–2200 mm [33,34].
Sandy surfaces are the primary land cover, with dune types including mobile, semi-fixed, and fixed dunes (Figure 1d). Semi-fixed dunes account for 51.81% of the total dune area, covered with vegetation (e.g., Artemisia ordosica, Leymus chinensis) at 30–50% coverage [35]. Sandstorm intensity is lower than in deserts due to higher vegetation coverage, though dust events still occur in winter and spring. Observation sites were established in flat inter-dune areas to minimize interference from dense vegetation.

2.1.5. Literature Data Regions (Tengger Desert, Badain Jaran Desert, Ulan Buh Desert)

Wind profile data from the Tengger Desert, Badain Jaran Desert and Ulan Buh Desert were extracted from peer-reviewed literature to supplement field observations [36,37,38]. The Tengger Desert (37°33′–37°35′ N, 105°01′–105°03′ E) features a temperate continental arid climate, with an annual mean precipitation of less than 250 mm (concentrated in July–August) and an annual potential evaporation larger than 2500 mm [39]. The annual mean wind speed is 2–3 m s−1, and is relatively higher from April to June and lower from September to February of the following year, with northwesterly winds dominating the region [40]. Its landscape is characterized by mobile and semi-fixed dunes interspersed with lake basins. The Badain Jaran Desert (41°19′–41°22′ N, 102°21′–102°27′ E) is characterized by a temperate continental, extremely arid climate. Its mean annual precipitation shows a distinct southeast-to-northwest gradient, decreasing from 120 mm in the southeast to 40 mm in the northwest, while mean annual evaporation varies, ranging from 100 mm on lake surfaces to 1000 mm on sand surfaces [41]. The desert is dominated by large sand mountains and inter-dune lakes: individual sand dunes reach heights of 200–400 m and lengths of 3–5 km, with lakes commonly distributed in the depressions between these dunes. In terms of wind regimes, the desert has a mean annual wind speed of 2.8–4.6 m s−1 (with a south-to-north increasing trend), and the strongest wind events occur in April and May [42]. The Ulan Buh Desert (39°35′–39°40′ N, 106°17′–106°29′ E) has an annual precipitation of 100–150 mm, potential evaporation of 2200–2600 mm and a mean annual wind speed of 3.7 m s−1, with aeolian activities as its primary natural hazard [43]; and its landscape consists of shifting, semi-fixed and fixed sand dunes accounting for 36.9%, 33.3% and 29.8%, respectively [32].
Basic wind and sediment characteristics of all study sites (field observations and literature data) are summarized in Table 1.

2.2. Wind Velocity Measurements

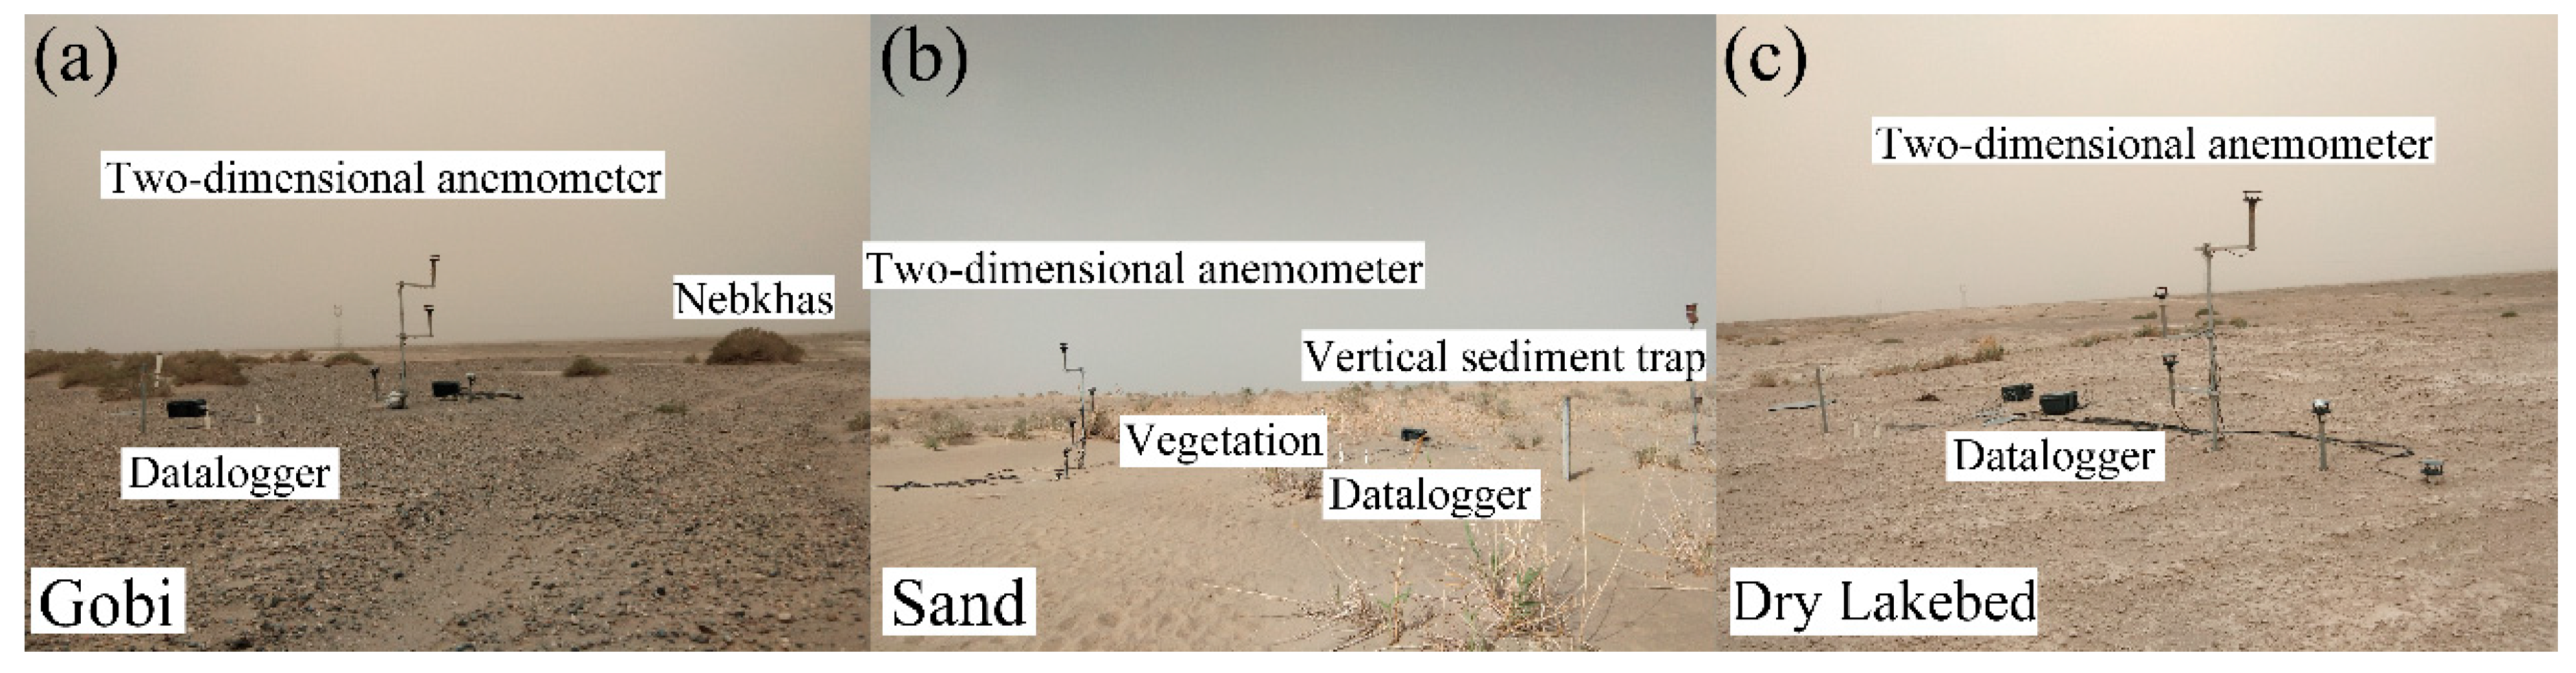
Wind velocity and direction were measured using Windsonic sensors (Figure 2; Gill Instruments Limited, Lymington, UK), and data were stored in CR6 dataloggers (Campbell Scientific Inc., Logan, UT, USA). Data were recorded at 1 s intervals and stored as 1 min averages. As detailed in Table 2, these measurements were conducted across multiple arid and semi-arid regions (Hexi Corridor Desert, Heihe River Basin, Mu Us Desert, and Taklimakan Desert) with standardized instrument accuracy (±2% for wind speed, ±3% for wind direction) and sampling protocols, while data from literature-based regions (Ulan Buhe Desert, Tengger desert, and Badain Jaran Desert,) exhibited inconsistent instrumentation parameters. For analysis, all records with diagnostic flags indicating sensor malfunction, icing, or other instrument errors were removed. To focus exclusively on dust-generating conditions, data were restricted to periods identified as dust-influenced weather. The only data corresponding to high free-stream wind velocity (u > 4 m s−1) were retained [45].

2.3. Data Analysis

The relationship between wind velocity and height can be expressed as a log-linear function under conditions of neutral atmospheric stability [46,47,48]:
u = a 1 l n ( z ) + a 2
where u represents the wind velocity at height z (2 m in the present study) and a1 and a2 are regression coefficients.
u * and z0 can be calculated by the gradient method or the wind profile method, which produce similar results [25]. We chose the wind profile method:
z 0 = e x p [ a 2 / a 1 ]
u * = k a 1
where k is Von Karman’s constant (0.4).
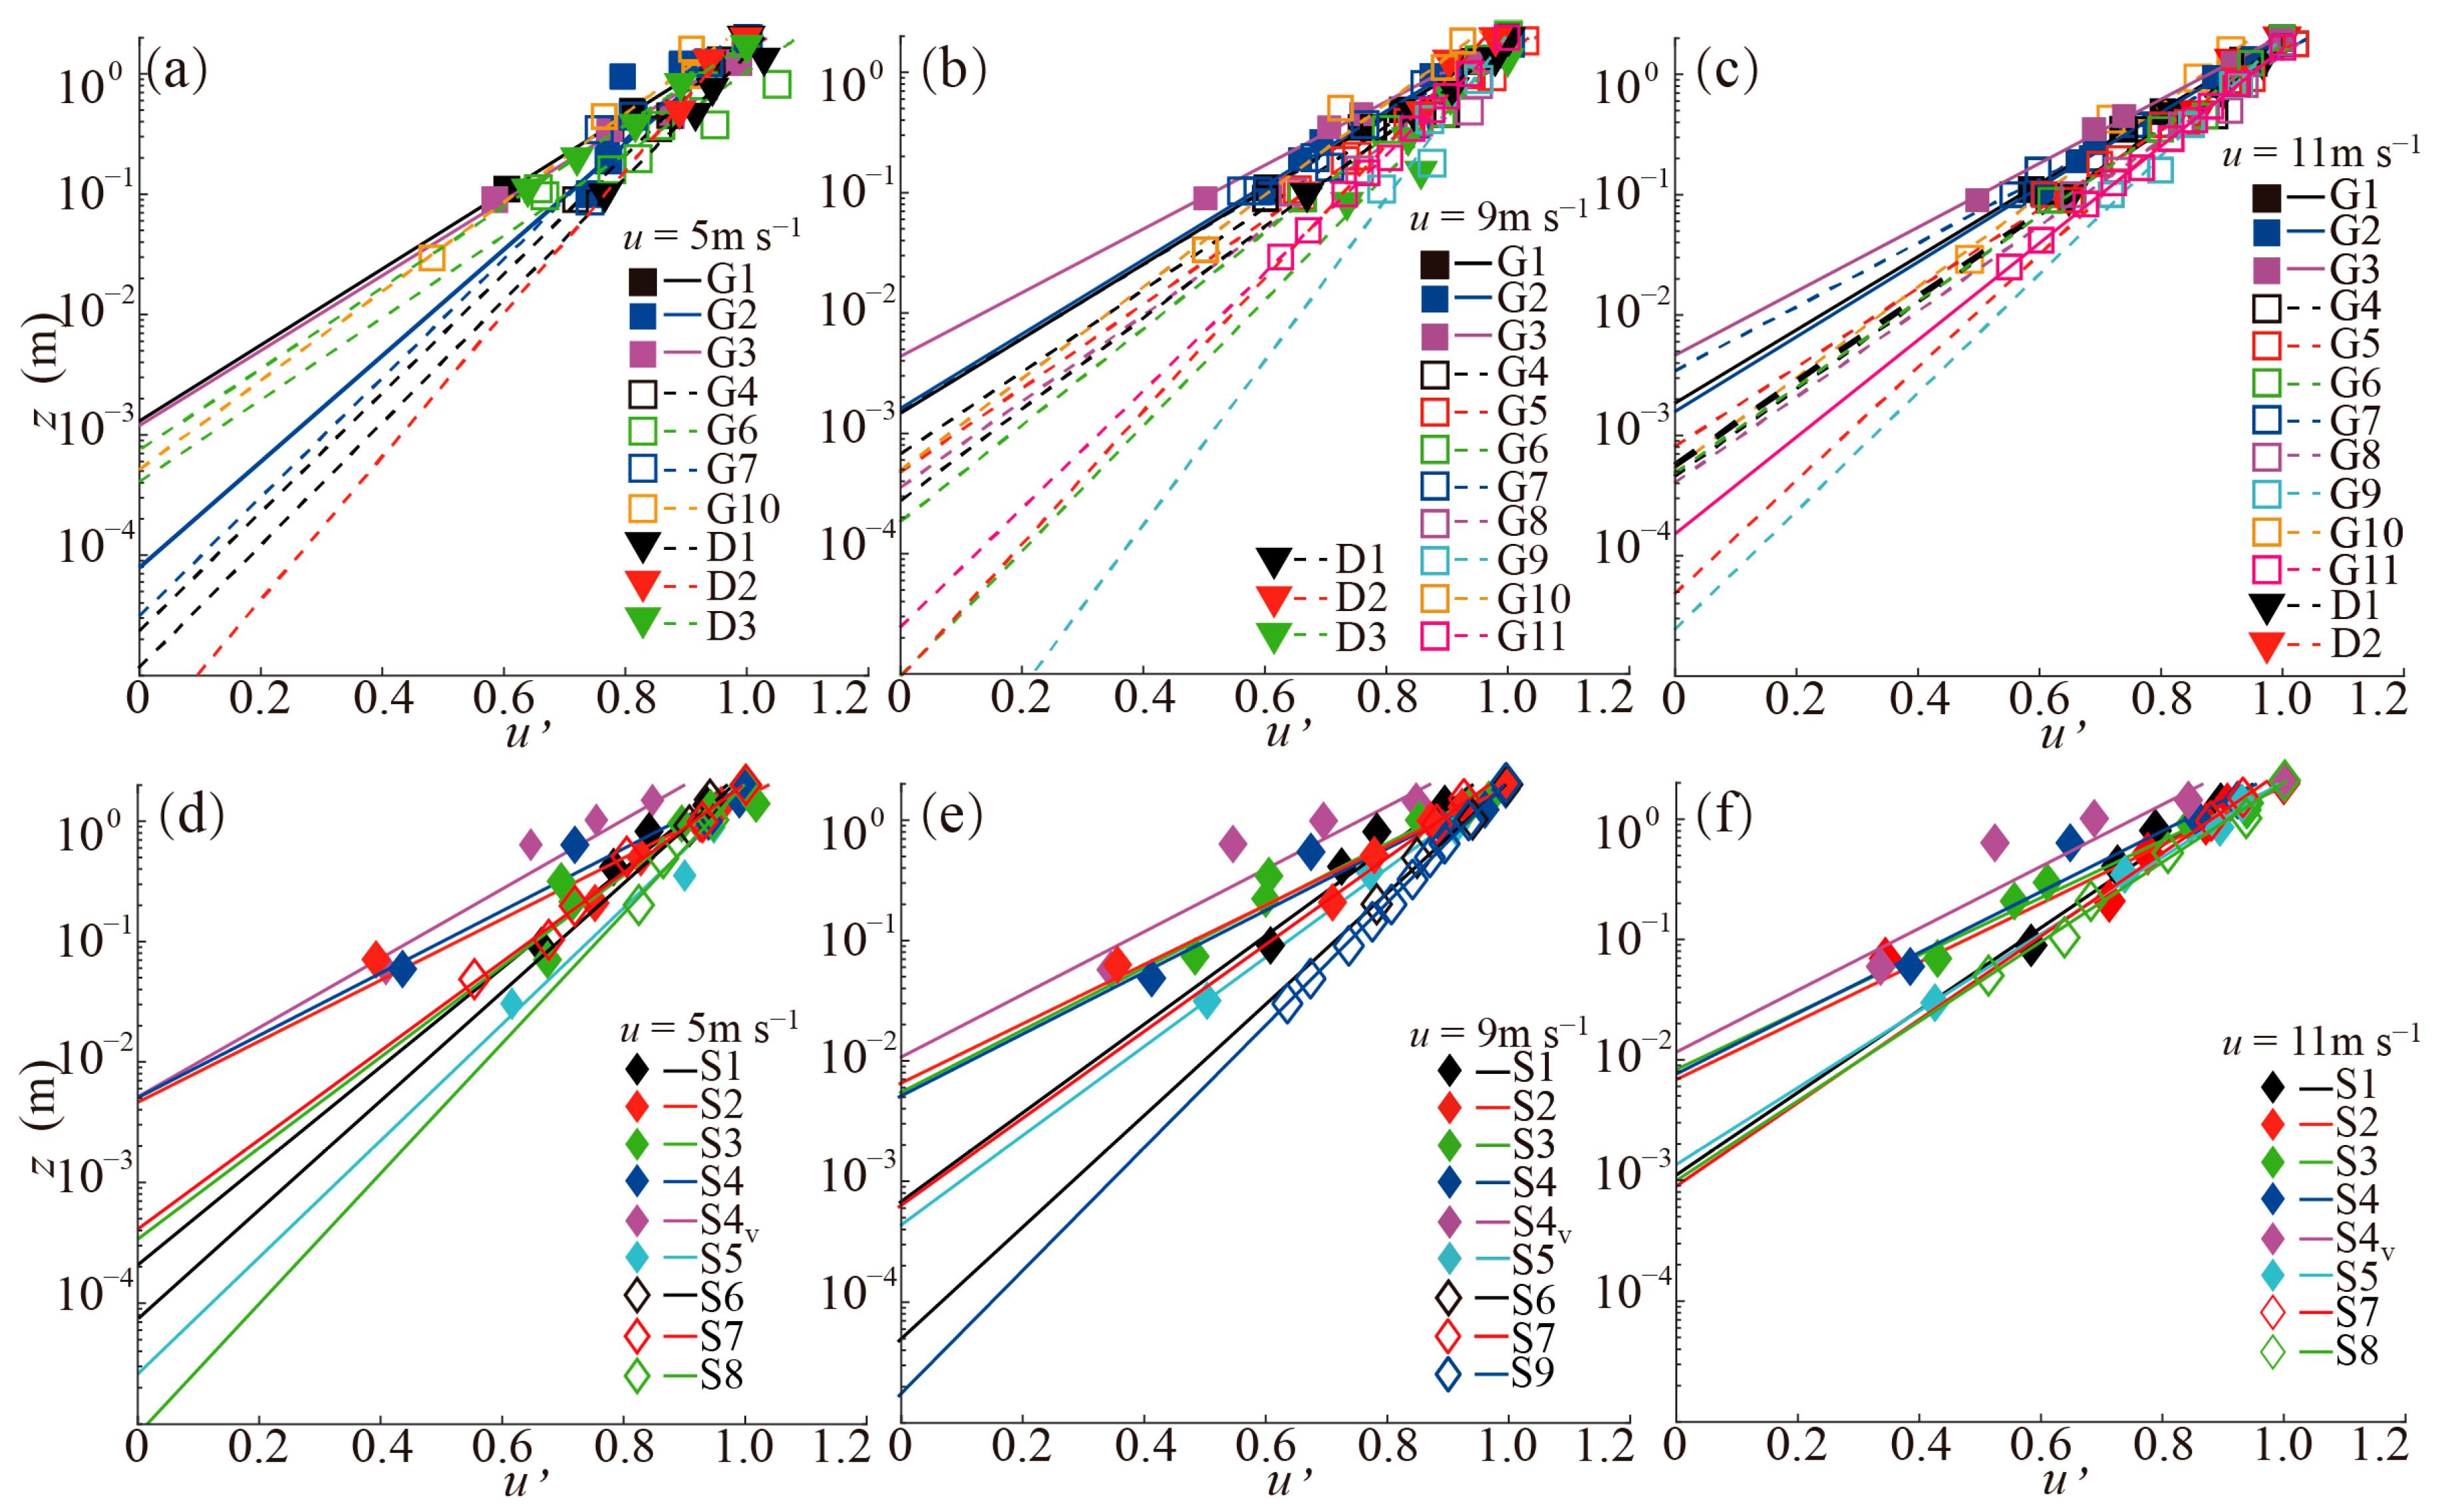
To compare the wind speed profiles over different underlying surfaces, the wind speeds at different heights and the wind speed at the highest layer are normalized according to the following equation:
u i = u i / u 2 m
where i denotes the i-th layer from bottom to top (I = 1, 2, 3, 4, 5), ui is the wind speed at the i-th layer (m s−1), u represents the wind velocity at height z (2 m), and ui′ is the dimensionless wind speed at the i-th layer after normalization.
The relationships between u and u * and between z0 and u * were fitted according to the method of Ho et al. [48]:
z 0 = z f   e x p [ u f   k / u * ]
where b1, b2, c1 and c2 are regression coefficients and uf and zf are the height and velocity (respectively) at a “focus” point defined as the position where the wind velocity is independent of the friction velocity.
Shao et al. [49] formulated the fluid threshold friction velocity ( u * t ) as:
u * t = d 1 ( σ p g d + d 2 ρ d )
where d is the mean diameter of the erodible grains (mm), g is the acceleration due to gravity (=9.8 m s−2), ρ is the air density (=1.29 kg m−3), and σp is the particle-to-air density ratio (=2208.3). The coefficients d1 = 1.23 × 10⁻² and d2 = 3 × 10⁻⁴ kg s−2 were estimated by fitting to the wind-tunnel data of Shao and Lu [50].
Bagnold [17] formulated the fluid threshold friction velocity for particle entrainment as:
u * t = A ( σ p 1 ) g d
where A is an empirical constant taken as 0.11 based on the more recent data of Shao et al. [50] and Han et al. [48], σp is the particle-to-air density ratio, d is the mean diameter of the erodible grains, and g is the acceleration due to gravity. Data were analyzed by origin 9.0 and matlab 2016a.
To evaluate the goodness of fit of these equations with the empirical data, we used the root-mean-square error (RMSE).

3. Results

3.1. Wind Profiles

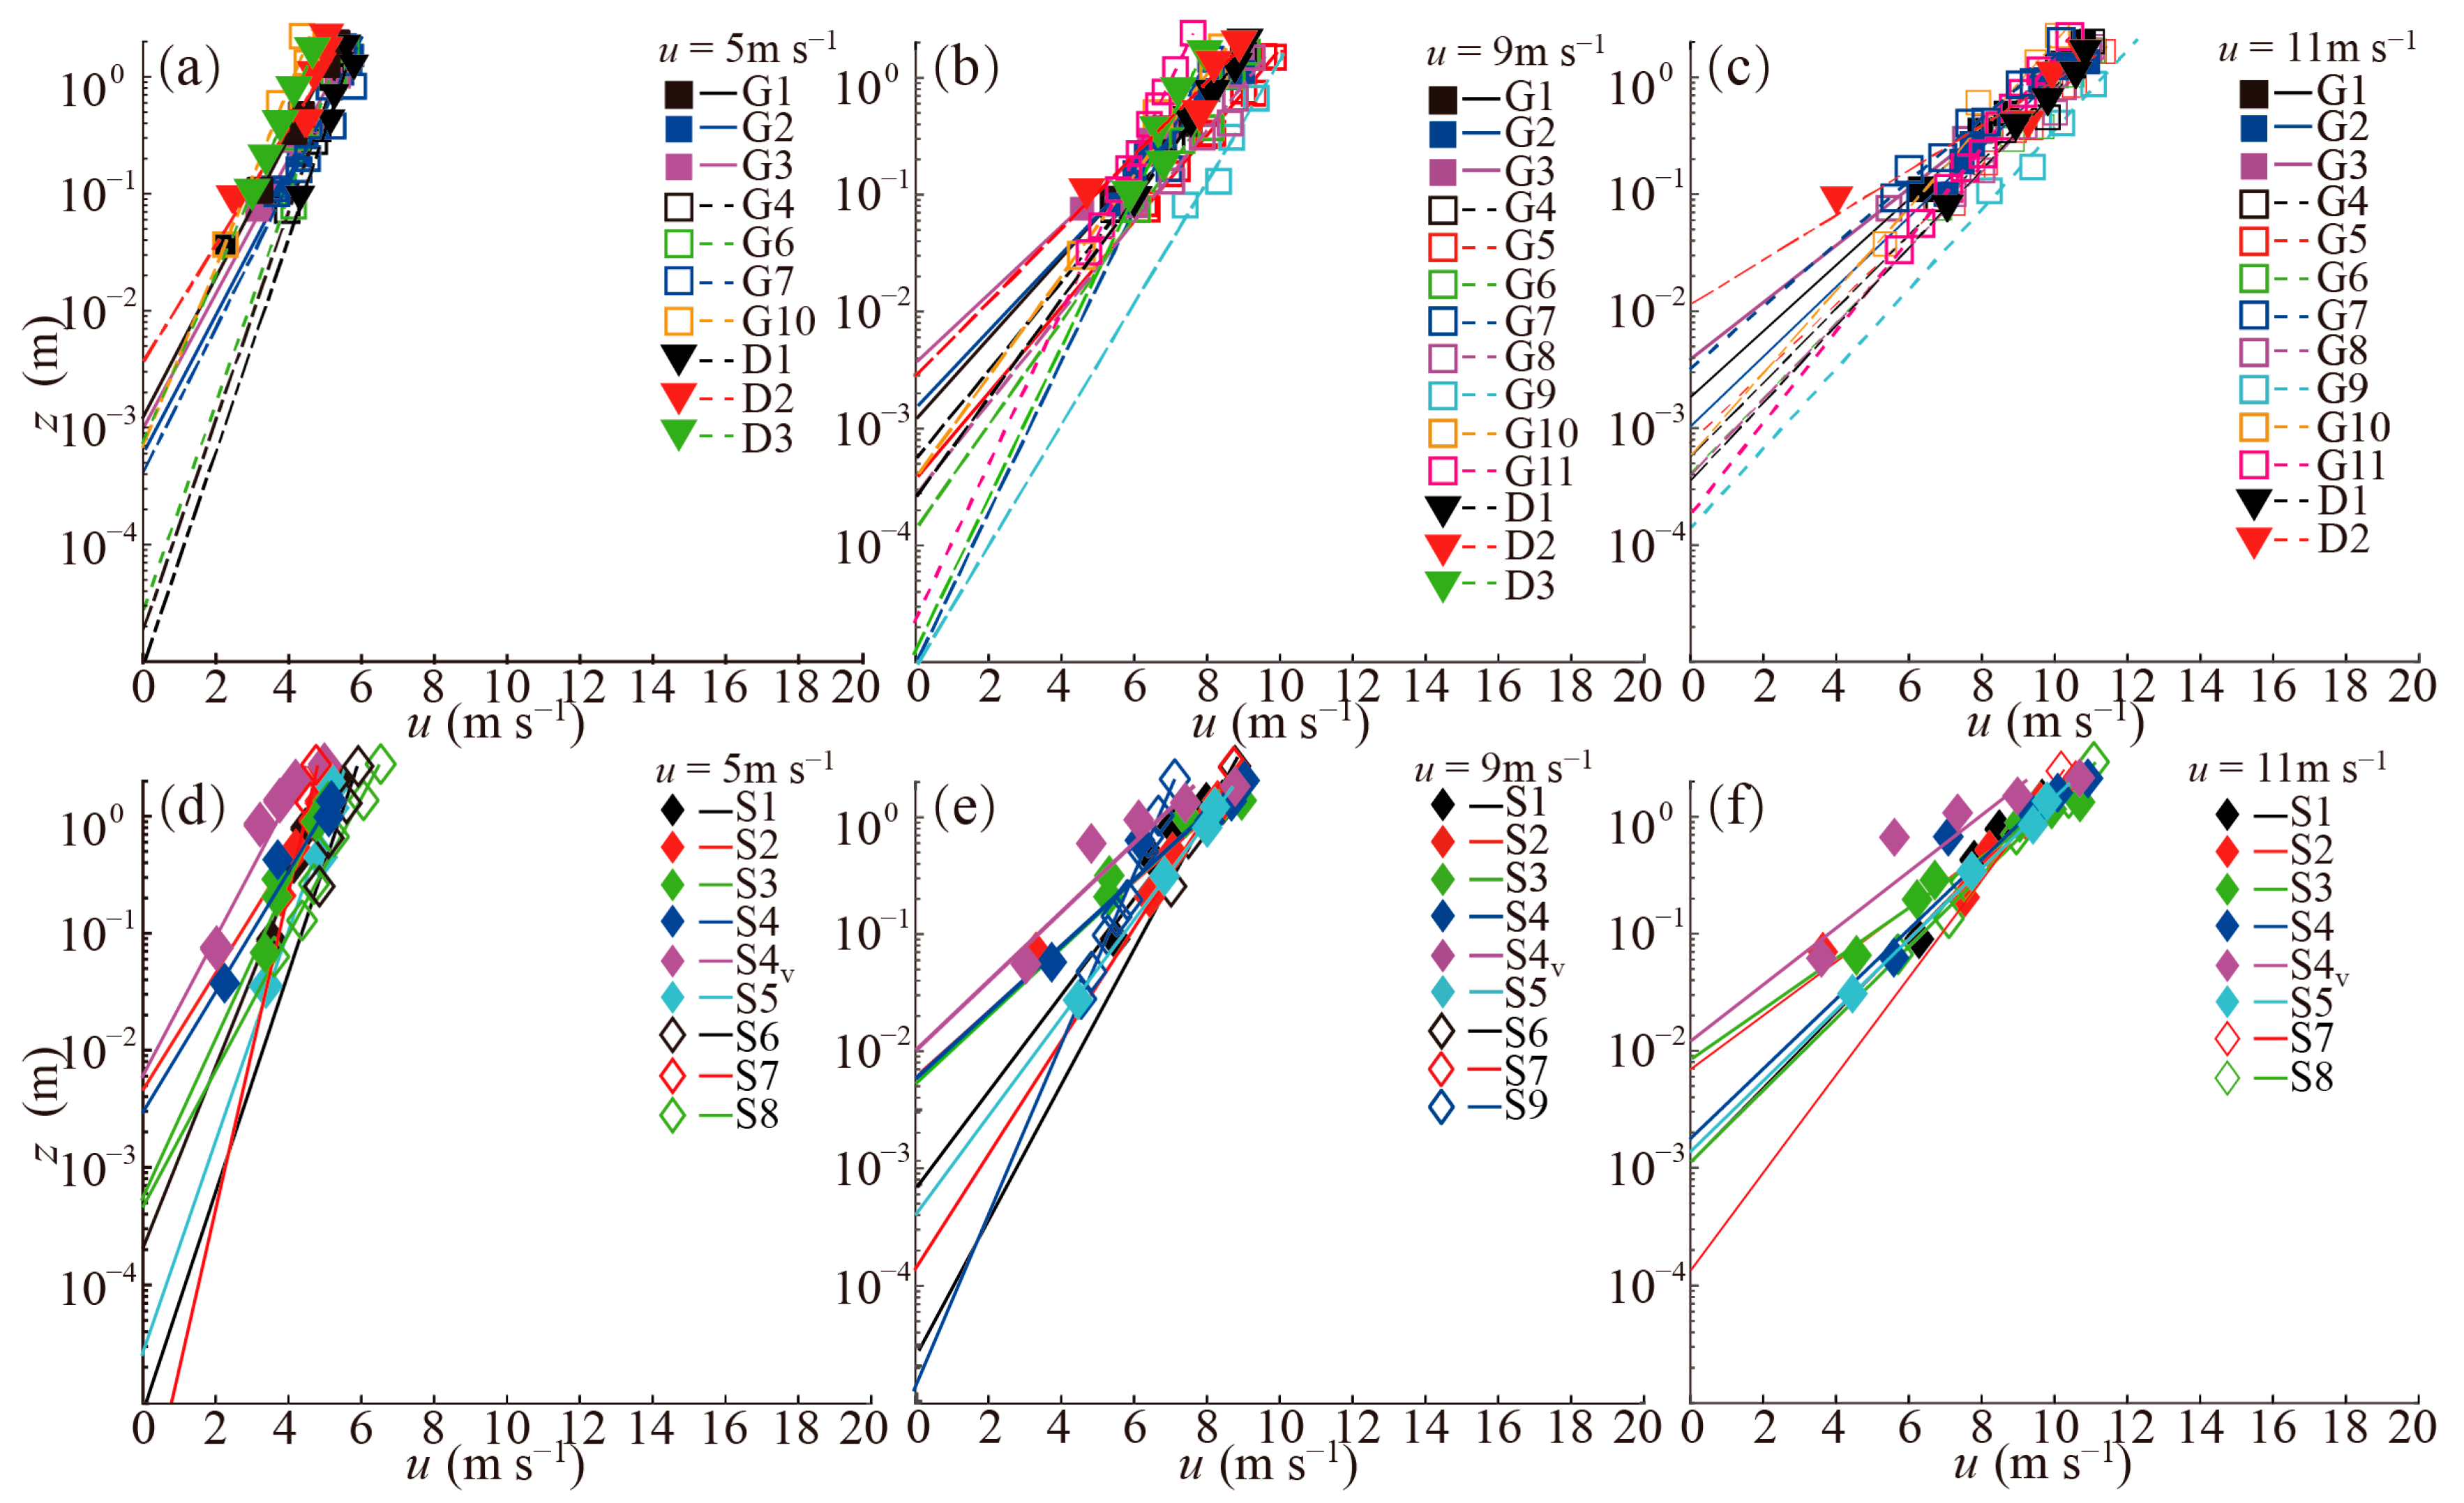
To further explain the effect of the land surface on the wind profiles, we compared representative wind profiles for free-stream wind velocities of 5, 9, 11 m s−1 under the prevailing wind direction (Figure 3 and Figure 4; Table 3). The results in Figure 3a–e illustrated that the vertical wind profiles (relating height z to free-stream velocity u) exhibited distinct surface-type dependence and wind-speed sensitivity across gobi (a,b), sandy (c), and dry lakebed (d) surfaces in Chinese arid regions. At u = 5 m s−1 (no sand transport), gobi surfaces (a) showed the steepest profile slopes (a1 = 0.58 to 0.75), followed by dry lakebed (a1 = 0.63 to 0.65, in the Hexi Corridor Desert and Heihe River Basin) and sandy surfaces (a1 = 0.32 to 0.88), indicating stronger aerodynamic resistance for gobi and dry lakebed surfaces. At u = 9 m s−1 (significant sand transport), sandy surfaces showed notable profile flattening with a1 ranging 0.64 to 1.52 due to saltation-induced turbulence, while gobi profiles remained relatively stable (0.68 to 1.35), and dry lakebed surfaces in the Hexi Corridor Desert and Heihe River Basin had intermediate a1 (0.67 to 1.1). At u = 11 m s−1 (intense sand transport), sandy surfaces (a1 = 0.85 to 1.90) exhibited notable profile flattening due to saltation-induced turbulence, while gobi profiles (a1 = 1.06 to 1.59) remained relatively stable, and dry lakebed surfaces in the Hexi Corridor Desert and Heihe River Basin showed a high a1 (1.46). Within the same region, gobi surfaces exhibited the largest wind profile slope (a1 = 0.75), with sandy and dry lakebed surfaces in the Hexi Corridor Desert and Heihe River Basin showing smaller slopes (a1 = 0.64, and 0.65) at low wind speeds (u = 5 m s−1). Conversely, sandy surfaces had the largest slope (a1 = 1.73), whereas gobi and dry lakebed surfaces in the Hexi Corridor Desert and Heihe River Basin displayed smaller slopes (a1 = 1.59, 1.46).
These findings indicated that at low wind speeds, wind profile coefficients were dominated by the surface roughness elements of gobi and dry lakebed surfaces in the Hexi Corridor Desert and Heihe River Basin, while at high wind speeds, sandy surface properties exerted a more prominent influence on these coefficients. Collectively, these results highlight that wind profile characteristics are co-governed by surface roughness and aeolian transport intensity, providing critical insights for parameterizing atmospheric boundary layers and sand transport models in arid regions.

3.2. Variation in Aerodynamic Roughness Length (z0) with Friction Velocity ( u * )

z0 and u * were obtained from the wind velocity profiles (Equations (2) and (3), Figure 4), and z0 and u * exhibited distinct variations across surface types (gobi, sand, dry lakebed) and free-stream wind speeds (5, 9, 11 m s−1). With increasing wind speed, u * consistently escalates. Similarly, z0 over sandy and gobi surfaces augments with increasing free-stream wind speed.
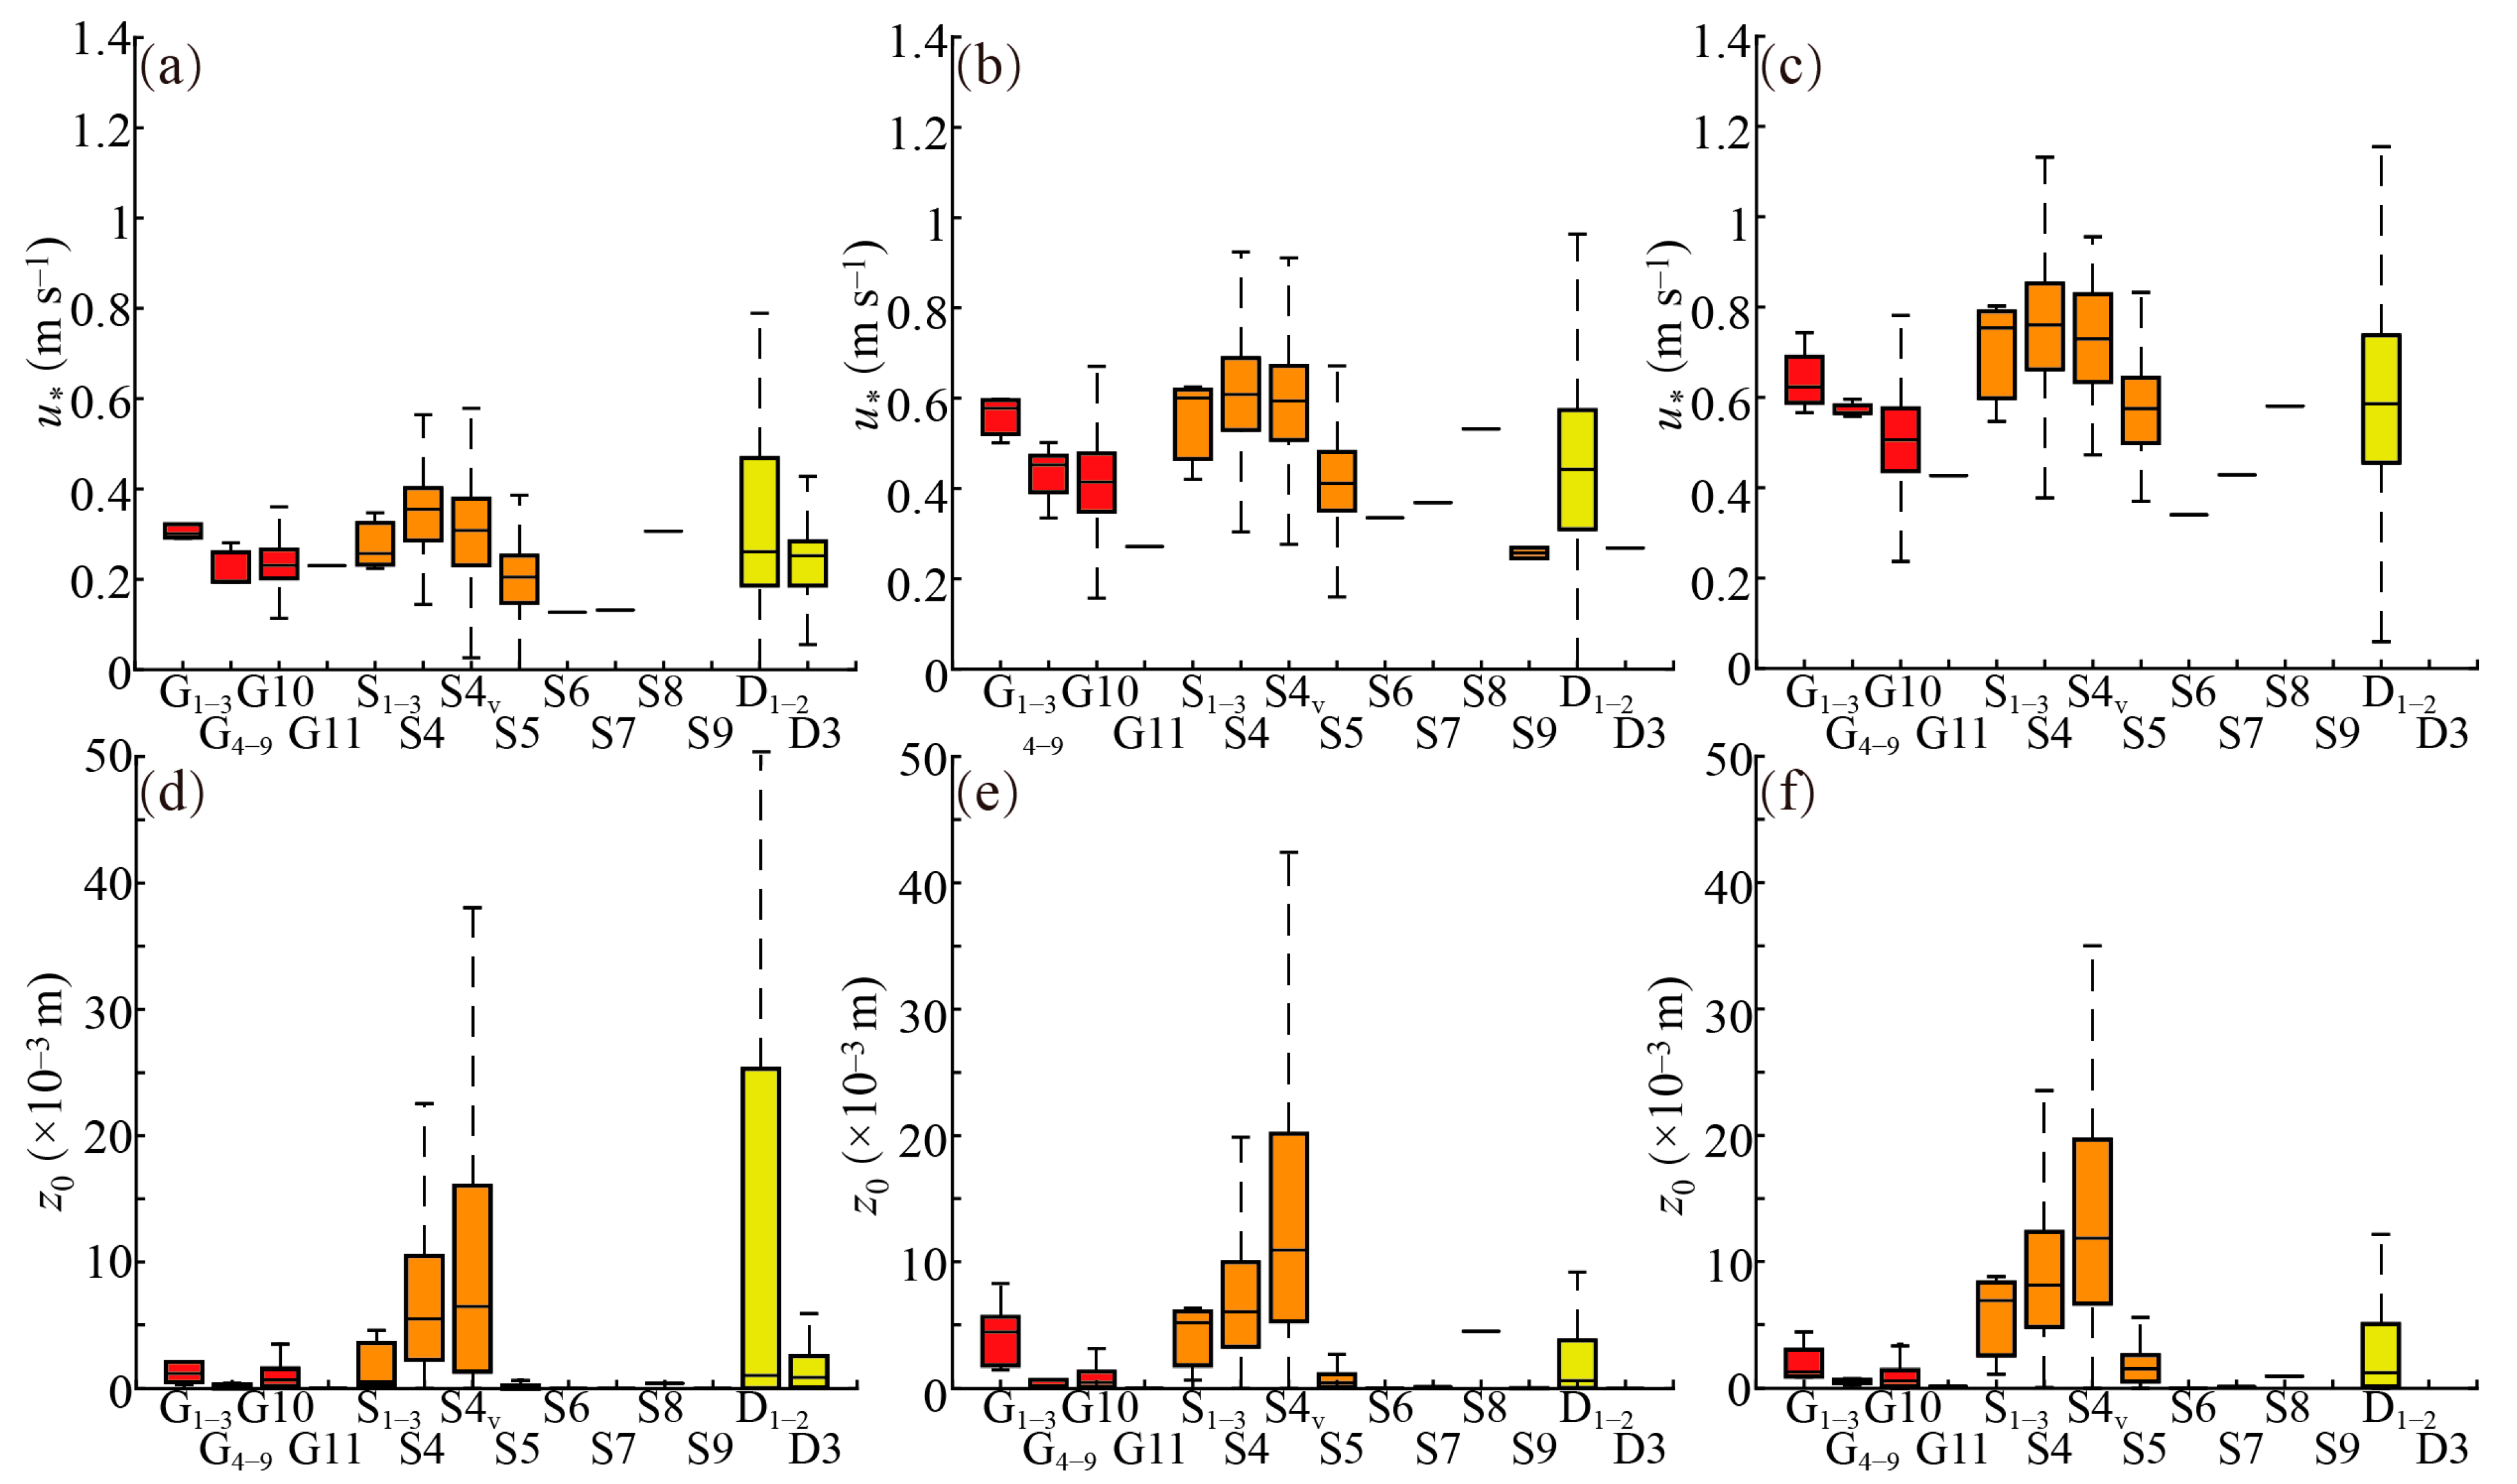
For u * , at low wind speed (5 m s−1), dry lakebed surface in the Hexi Corridor Desert and Heihe River Basin showed the smallest (0.19 ± 0.01 m s−1 [mean ± SD]), while gobi and sand surface had comparable values (0.23 ± 0.003 and 0.24 ± 0.07 m s−1, respectively) (Figure 5a). At 9 m s−1, u * was smallest for the dry lakebed surfaces in the Hexi Corridor Desert and Heihe River Basin (0.32 ± 0.06 m s−1), followed by gobi surfaces (0.41 ± 0.07 m s−1), and sandy surfaces (0.46 ± 0.12 m s−1) (Figure 5b). At high wind speed (11 m s−1), sandy surfaces and gobi surfaces showed comparable (0.58 ± 0.14 and 0.53 ± 0.08 m s−1), slightly higher than dry lakebed surfaces in the Hexi Corridor Desert and Heihe River Basin (0.46 ± 0.06 m s−1) (Figure 5c). For z0, sandy surfaces consistently had the largest z0 across all wind speeds, with values increasing from 1.52 ± 2.09 × 10⁻³ m (5 m s−1) to 4.55 ± 4.34 × 10⁻³ m (11 m s−1) (Figure 5d–f). Gobi showed moderate, gradually increasing with 0.72 ± 0.56 × 10⁻³ m (5 m s−1) to 1.33 ± 1.39 × 10⁻³ m (11 m s−1) (Figure 5d–f). Dry lakebed exhibited the lowest at 9 m s−1 (z0 = 0.10 ± 0.35 × 10⁻³ m) in the Hexi Corridor Desert and Heihe River Basin but increased to 0.25 ± 0.20 × 10⁻³ m at 11 m s−1 (Figure 5e,f).
Within the same region, u * exhibited a wind speed-dependent hierarchical pattern, driven by differential surface erodibility. As wind speeds increased to 5 to 9 m s−1, the gobi surfaces displayed the highest u * , while the sandy and dry lakebed surfaces showed comparable but lower u * . When wind speed increased to 11 m s−1, this pattern shifted that u * over sandy and gobi surfaces became higher than over the dry lakebed surfaces, with a frequent order of gobi surfaces > sandy surfaces > dry lakebed surfaces. Notably, this wind speed-dependent hierarchy of u * was also observed in other regions, such as the Taklamakan and Dunhuang deserts. For z0, it likewise showed surface-specific dependence on wind speed, in a manner similar to that observed for friction velocity. At wind speeds of 5 to 9 m s−1, z0 decreased in the order gobi surfaces > sandy surfaces > dry lakebed surfaces. At 11 m s−1, this order reversed, with the sandy surface exhibiting the highest z0, followed by the gobi, while the dry lakebed remained the lowest z0. A similar wind-speed dependency of z0 was identified in the Taklamakan and Dunhuang deserts, where gobi surfaces showed higher z0 than sandy surfaces at 5 to 9 m s−1, but sandy surfaces exceeded gobi at 11 m s−1.
For shifting sandy surfaces across distinct deserts, the mean u * relative to the Hexi Corridor Desert exhibited significant inter-desert differences and wind speed dependence. At 5 m s−1, the Mu Us (1.21) and Badain Jaran (1.14) deserts had the highest ratios (>1.0), while the Ulan Buhe (0.47) and Tengger (0.49) deserts showed the lowest (<0.6); intermediate values were observed for Dunhuang (0.74) and Taklimakan (0.74) (Figure 5a). At 9 m s−1, the ratios ranged from 0.47 (Dunhuang, lowest) to 1.09 (Mu Us, highest), with Ulan Buhe (0.61), Tengger (0.67), Taklimakan (0.75), and Badain Jaran (0.97) intermediate (Figure 5b). At 11 m s−1, the Mu Us Desert remained the highest (1.06), while the Ulan Buhe Desert maintained the lowest ratio (0.49), with other deserts (Tengger, 0.61; Badain Jaran, 0.84; Taklimakan, 0.83) showing moderate values (Figure 5c).

3.3. Relationships Between Aerodynamic Roughness Length (z0) and Friction Velocity ( u * )

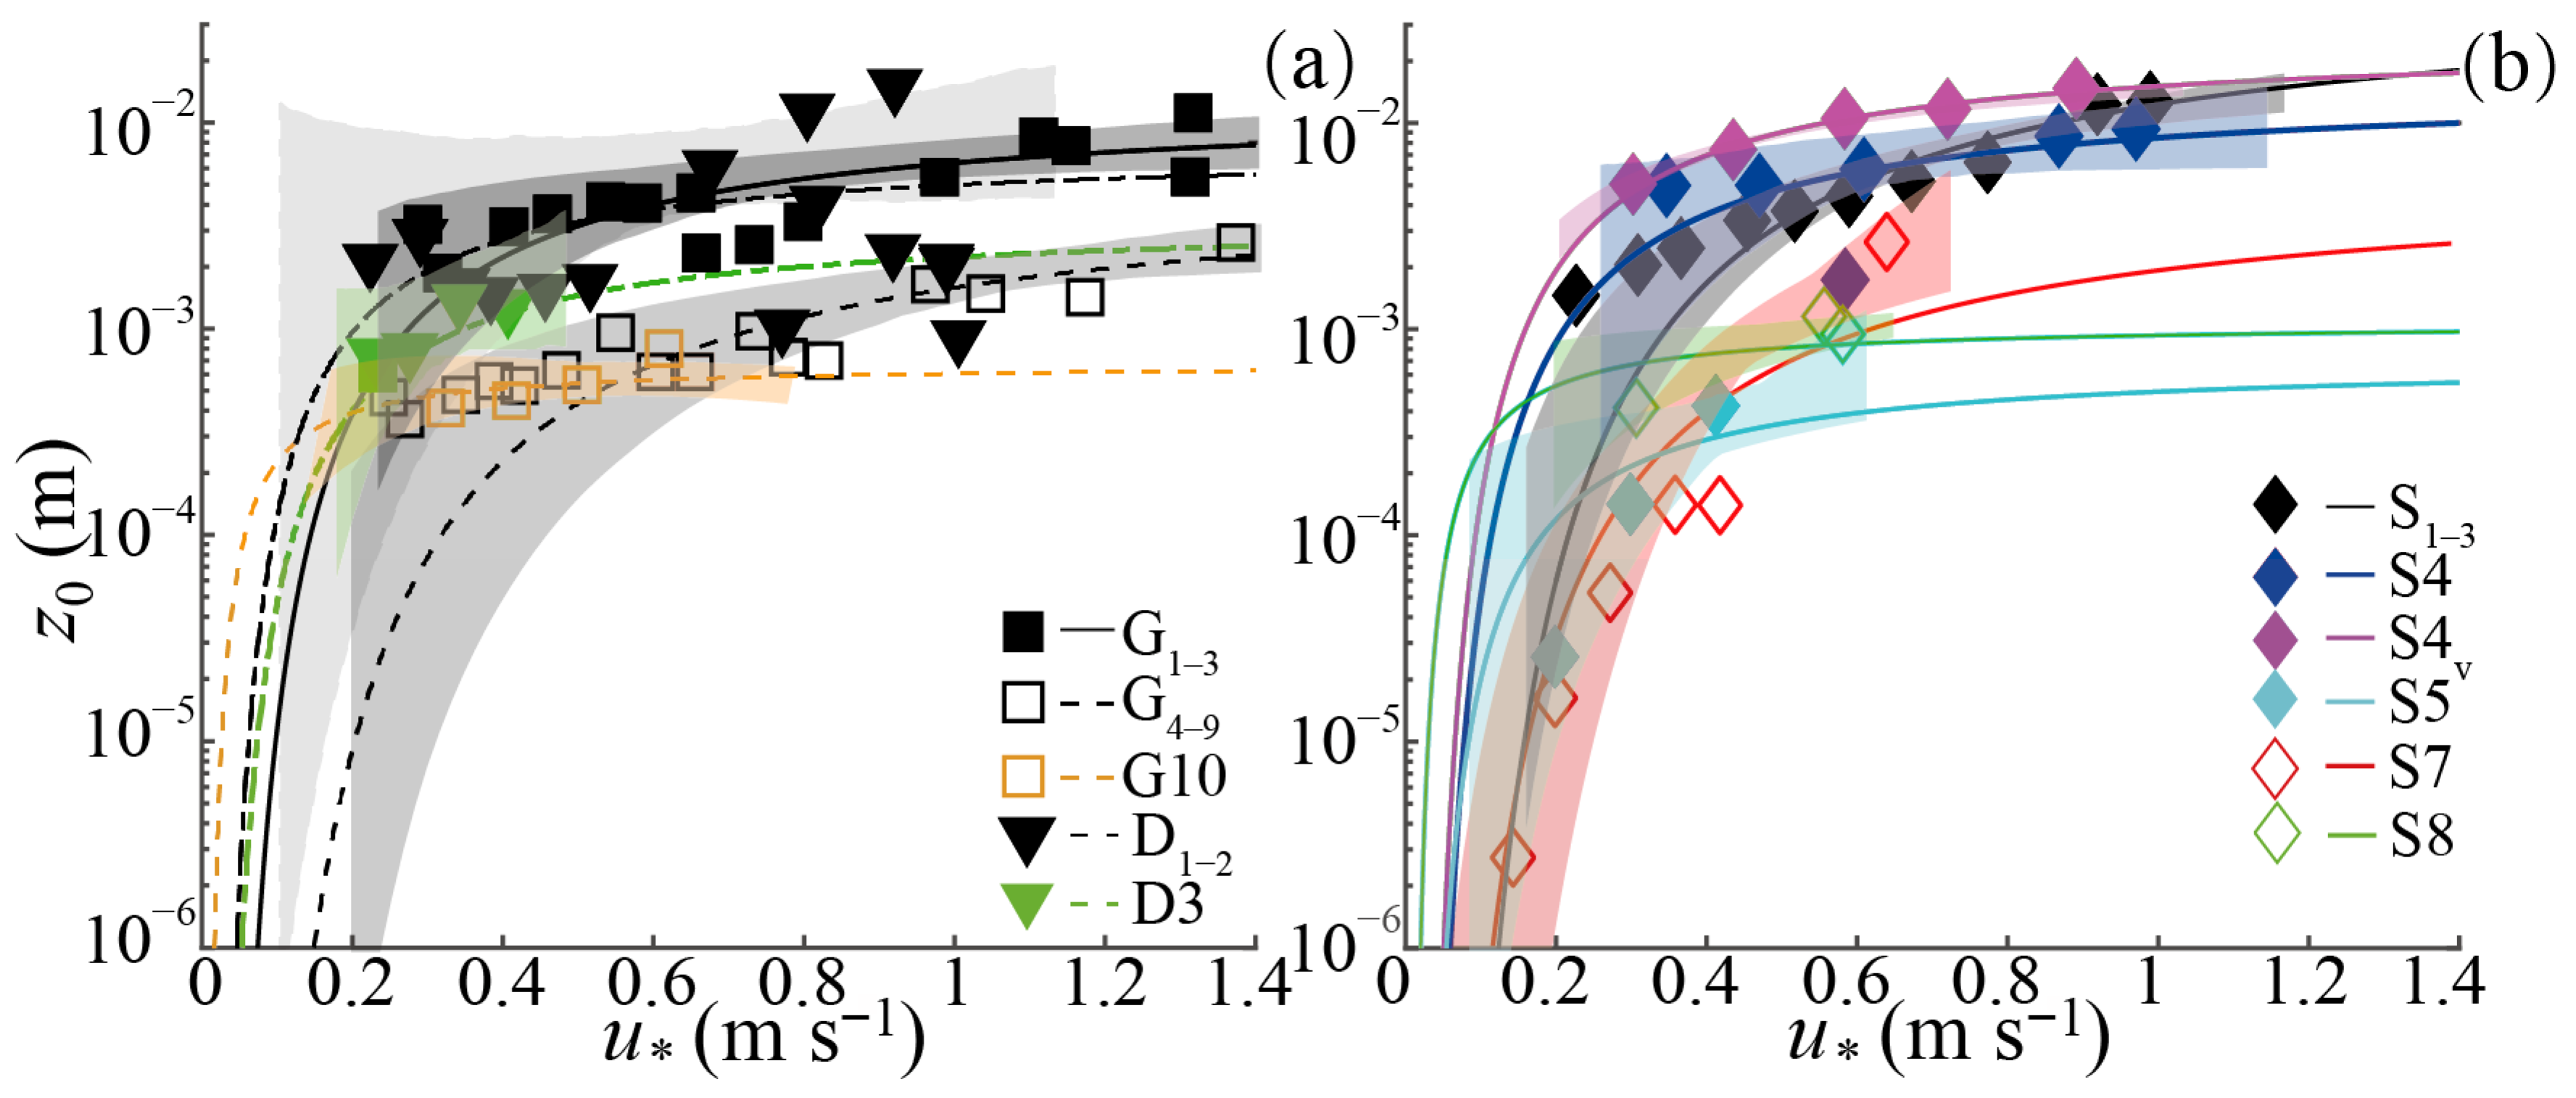
The z0 values varied across three surface types (gobi, sandy, dry lakebed) and different northern Chinese deserts, yet universally exhibited an exponential relationship with u * at all sites (Equation (5), Figure 6, Table 4) with different coefficients. z0 increased with u * and that reached an asymptote range from 10−4 to 10−2 m among the gobi, dry lakebed in the Hexi Corridor Desert, Heihe River Basin and sandy surfaces (Figure 6), indicating surface-specific sediment transport dynamics.
Spatially, zf values (Figure 6a, Table 4) varied as follows: gobi surfaces showed 1.3 × 10⁻² m (Hexi Corridor), 6 × 10⁻³ m (Heihe River Basin), and 1 × 10⁻³ m (Taklimakan); dry lakebeds registered 8 × 10⁻³ m (Hexi Corridor Desert) and 3 × 10⁻³ (Heihe River Basin); while sandy surfaces in the Mu Us and Hexi Deserts ((1.5 to 4.7) × 10−2 m) exceeded those in the Tengger, Badain Jaran, and Taklimakan Deserts ((1 to 6) × 10−3 m) (Figure 6b, Table 4). The uf values also exhibited distinct regional and surface-type dependencies (Figure 6, Table 4). Within the Hexi Corridor, sandy surfaces (3.33 m s−1) and dry lakebeds (3.02 m s−1) had higher uf than gobi surfaces (1.76 m s−1). However, in the Taklimakan Desert, sandy surfaces (0.89 m s−1) showed lower uf than their gobi counterparts (1.33 m s−1). In contrast, dry lakebeds in the Heihe River Basin (1.07 m s−1) had lower uf than local gobi surfaces (3.23 m s−1), though Heihe gobi exceeded some sandy and dry lakebed sites. Notably, mean uf over shifting sands in other northern Chinese deserts (0.35 to 2.73 m s−1) was lower than that in Hexi Corridor sandy surfaces (3.33 m s−1), collectively highlighting surface-type and regional controls on near-surface turbulent dynamics.
Mechanistically, z0 increased with u * and stabilized at higher u * for gobi and dry lakebed surfaces (Figure 6a), driven by enhanced momentum exchange from gravel and crust. Sandy surfaces (Figure 6b) showed analogous z0 u * growth but at lower magnitudes, attributed to mobile fine sand grains and the erosibility of the surface type.

4. Discussion

Saltation above sandy surfaces is the most important form of aeolian transport [17]. Both the aerodynamic roughness length and the wind’s friction velocity are affected by the characteristics of the sandy surface, including the average particle size and the grain-size distribution, as well as by characteristics of the wind regime, including the free-stream wind velocity and turbulence. For non-sandy sites, surface properties such as the vegetation and gravel cover and the presence or absence of soil crusts are important. The combinations of these surface and wind factors ultimately control sediment transport.

4.1. The Effect of Surface Properties on Wind Profiles

The morphological differences in wind profiles are inherently governed by the combined effects of surface roughness properties and sediment supply potential [17,51]. Thus, surface attributes and wind speed synergistically modulate the variations in wind profile coefficients [21].
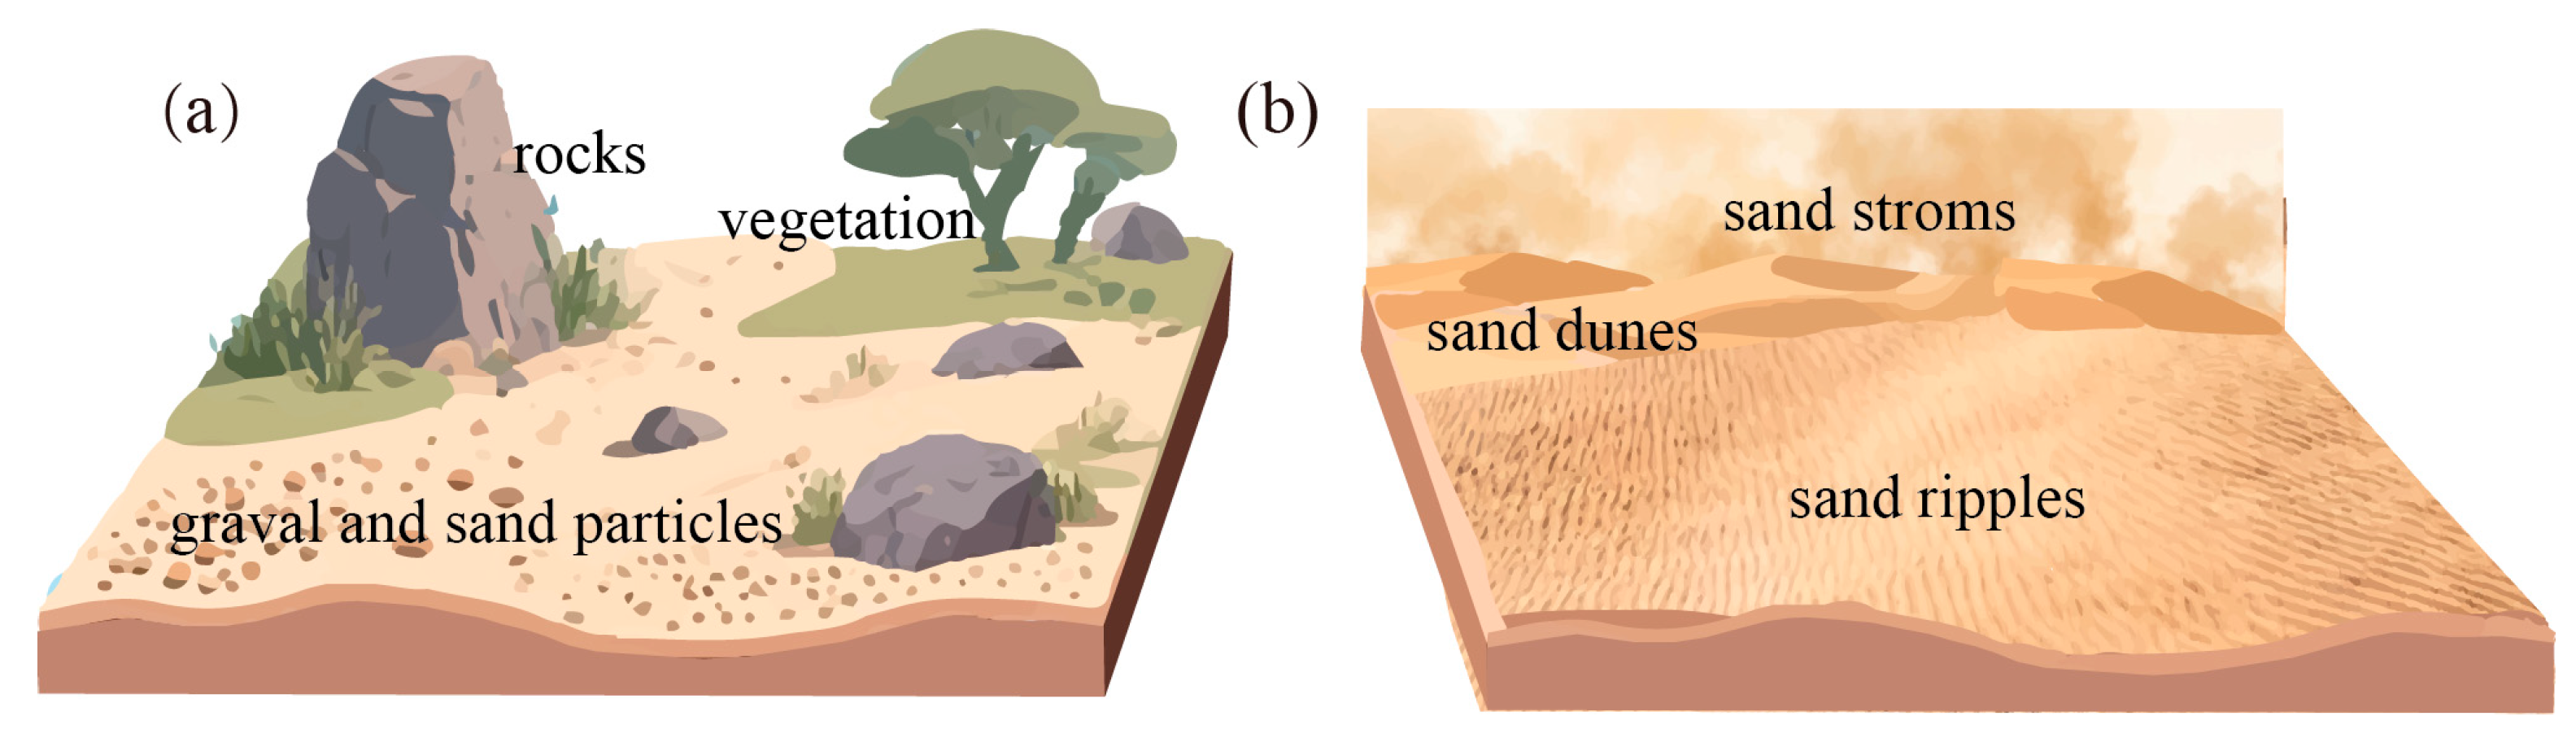
In this study, Normalized wind profiles (u/u2m) revealed distinct morphological patterns among surface types (Figure 4), and the mean wind profile coefficient a1 and Constant term a2 exhibited marked disparities among gobi, dry lakebed in the Hexi Corridor Desert and Heihe River Basin, and sandy surfaces (Figure 3). Within the same region, the mean wind profile coefficient a1 on sandy surfaces (a1 = 0.64) was significantly smaller than that on dry lakebed (a1 = 0.65) and gobi surfaces (a1 = 0.75) at low wind speeds, whereas this pattern was completely reversed at high wind speeds, with sandy surfaces displaying the largest slopes (a1 = 1.73) and gobi, dry lakebed surfaces showing smaller slopes (a1 = 1.59, and 1.46, respectively). This characteristic aligns closely with surface properties: sandy surfaces feature small roughness elements and abundant sediment supply (Figure 7), whereas gobi and dry lakebed surfaces are dominated by gravel and physical crusts, respectively, thus constraining sediment availability [52]. These observed behaviors of wind profiles can be further elucidated from the perspective of the threshold friction velocity governing the transition between “static roughness–dominated” and “dynamic roughness-dominated” regimes. The shift from static dominance—where surface roughness elements such as rocks, vegetation, and crusts dominate momentum dissipation—to dynamic dominance—driven by sand grains and the bedforms such as ripples—depends on whether wind speed exceeds a threshold (Figure 7). For surfaces like gobi and dry lakebeds, which have a larger static roughness length (z0) and limited sediment availability, the threshold friction velocity required to initiate sand movement is relatively high. This means that wind energy must first overcome the substantial drag imposed by static roughness elements before sediment transport can be initiated. Consequently, over a wide range of wind speeds, the morphology of their wind profiles (i.e., the coefficient a1) changes relatively gradually, as reflected in the modest increase in a1 from low to high wind speeds (e.g., for gobi surfaces, a1 rises from 0.75 to 1.59). In contrast, homogeneous sandy surfaces exhibit low static roughness and abundant sediment supply, and once wind speed surpasses this lower threshold, sand grains are rapidly mobilized, forming ripples and significantly altering the effective surface roughness, thereby transitioning the surface into a dynamic roughness-dominated regime. This explains the sharp increase in a1 observed on sandy surfaces at high wind speeds (e.g., from 0.64 to 1.73).
At the regional scale, the wind profile slopes of sandy surfaces exhibited distinct patterns with wind speed. The slopes decreased from west to east: relatively large in the Mu Us Sandy Land (0.85 at 5 m s−1 and 1.85 at 11 m s−1), smaller in the Ulan Buh and Tengger Deserts (0.32, 0.33 at 5 m s−1 and 0.85, 1.07 at 11 m s−1), larger again in the Badain Jaran Desert and Hexi Corridor (0.77, 0.64 at 5 m s−1 and 1.45, 1.73 at 11 m s−1), and smallest in the Taklamakan Desert (0.51 at 5 m s−1 and 1.44 at 11 m s−1) with no and intense sand transport. This spatial variability is closely linked to adjustments in surface roughness induced by higher vegetation coverage in the eastern regions [53].
This finding aligns with Bagnold’s [17] classic saltation theory and modern aeolian dynamics research, which emphasize that surface properties (roughness, sediment supply) regulate the vertical structure of aeolian processes, thereby shaping wind profile morphology [6]. In turn, wind profile changes feed back on aeolian transport intensity and patterns, collectively forming a coupled surface–airflow–sediment system in arid regions. Such insights are critical for improving parameterizations of atmospheric boundary layers and sand transport models in arid and semi-arid zones.

4.2. The Relationships Between u * and z0

Field measurements of the friction velocity ( u * ) and aerodynamic roughness length (z0) over three typical surfaces in northern China, including sand, gobi (gravel desert), and dry lakebed, revealed distinct and non-linear responses under varying wind regimes. The overall trend shows that both u * and z0 increase with wind speed (Figure 6), with z0 on the order of magnitude ranging from 10−2 to 10−3 m. More importantly, the relative magnitudes of these parameters between surfaces shift significantly as a function of sediment transport intensity, indicating a transition from static to dynamic roughness control.
At low wind speeds (5 to 9 m s−1), the difference in u * and z0 was determined by the inherent physical structure of the surface. The physical hard surface crust of the dry lakebed inhibits particle entrainment [54,55] and results in the lowest u * and z0. The loose sand grains and small sand ripples of shifting sand surfaces form a medium u * and z0, while the immobile gravel of the gobi surfaces constituted a high inherent u * and z0 [56,57]. When the wind speed exceeds 9 m s−1, the aerodynamic behavior of surfaces is primarily governed by sediment transport dynamics [58]. Sand surfaces undergo full sand lifting at high wind speeds, with the accumulation of saltating sand grains forming dynamic sand ripples, and the interaction between the aeolian flow and the airflow intensifies turbulent disturbances, leading to an explosive increase in effective u * and z0. In contrast, the gravel of the gobi is stable and cannot form continuous dynamic roughness elements, resulting in limited growth in effective roughness. The dry lakebed surfaces remains the smoothest due to the dominant suspension of fine particles after sand lifting, maintaining the lowest u * and z0.
We obtained zf (Bagnold’s “focus point”) by analyzing the wind profiles above the three land types and different deserts, which means that the heights where the point was no longer affected by the free-stream velocity [17]. Essentially, zf quantitatively characterizes the experimental relationship between u * and z0 under aeolian transport conditions. It can be understood as a “reference height” separating the saltation layer from the overlying airflow, directly reflecting the thickness of the sand-transport layer.
Spatially, zf over shifting sand surfaces showed distinct patterns, which zf was significantly higher in the Mu Us and Hexi Corridors deserts ((1.5–4.7) × 10−2 m) compared to the Tengger, Badain Jaran, and Taklamakan deserts ((1–6) × 10−3 m). These values are consistent with zf = (9 ± 8) × 10−3 m measured by Ho et al. [48] on eroding beds and zf = 8 × 10⁻³ m (d = 190 μm) by Ralaiarisoa et al. [59]. For gobi surfaces, zf exhibited significant regional variations, which 1 × 10⁻³ m (Taklamakan), 1.3 × 10⁻² m (Hexi Corridor, gravel coverage of 56–60%) and 6 × 10⁻³ m (Heihe River Basin, gravel coverage of 40–60%), reflecting the regulatory effect of gravel coverage on saltation layer height. Over dry lakebed surfaces, zf was 8 × 10⁻³ m (Hexi Corridor) and 3 × 10⁻³ m (Heihe River Basin). Although influenced by surface crusts, these values were still higher than zf ≈ 7.77 × 10⁻⁶ m measured by Ho et al. [48] on rigid wind tunnel beds, consistent with the absence of perfectly rigid surfaces in natural field conditions. The friction velocity uf at the focus height was closely coupled with height zf. Lower uf values were observed over gobi surfaces (Hexi Corridor and Taklamakan, 1.76 m s−1 and 0.27 m s−1, respectively). Higher uf values were found over shifting sandy surfaces (average 0.35–2.73 m s−1 in other deserts of northern China). Intermediate uf values characterized dry lakebeds (Hexi Corridor, 2.99 m s−1). Collectively, the high zf and uf values over shifting sands indicate a thicker saltation layer and greater potential for particle entrainment. In contrast, gobi surfaces are more prone to forming an intense collision layer under high wind speeds [60], while the zf and uf characteristics of dry lakebeds suggest some similarity in their particle entrainment mechanisms to gobi surfaces [61].

4.3. Applicability and Limitations of the Parameterization Scheme

The parameterization scheme developed in this study, particularly the focus point model characterized by zf and uf parameters, demonstrates robust performance under specific boundary conditions. The scheme is primarily applicable to arid and semi-arid regions with the following constraints: wind speeds ranging from 5 to 12 m s−1, sediment transport intensities corresponding to saltation-dominated regimes, and surfaces with gravel coverage between 30% and 70% for gobi environments.
For cross-regional application, three core factors require particular attention and potential adjustment: First, surface sediment characteristics, especially the grain size distribution and the presence of physical or biological crusts, significantly influence the zf-uf relationship. Regions with finer sediment sizes or higher clay content may exhibit reduced saltation layer thickness. Second, vegetation coverage, which was generally low (<10%) in our study areas, must be considered, as higher vegetation density would substantially alter the aerodynamic roughness and sediment availability. Third, climatic factors, including precipitation frequency and wind regime characteristics (e.g., seasonal variability, dominant wind directions), may necessitate calibration of the threshold friction velocities.
The scheme shows limited applicability in densely vegetated areas, coastal environments with high humidity, or regions experiencing frequent precipitation events where soil moisture dramatically affects sediment transport thresholds. Additionally, surfaces with extreme gravel coverage (>80% or <20%) may require parameter adjustments as the model was calibrated primarily for moderate gravel coverage conditions. We recommend that future applications in new regions incorporate local measurements of surface properties and wind characteristics to validate and, if necessary, recalibrate the zf and u parameters presented herein.

5. Conclusions

Wind velocity and surface characteristics jointly determine sand transport dynamics, as quantified by parameters ( u * and z0) derived from field observations over different surfaces. Our study yields the following key findings:
The slope of the wind profile highlights the transition in surface drag. Under low winds, sandy surfaces exhibited the lowest drag, compared to dry lakebed and gobi. This order reversed under high winds, with the sandy surface showing the highest drag, followed by gobi and dry lakebed.
The response of u * and z0 to increasing wind speed is strongly surface-dependent. Below the transport threshold, gobi surfaces exhibited the highest u * and z0. Once transport was initiated, u * and z0 over sandy surfaces increased sharply, eventually surpassing other surfaces. In contrast, u * responded significantly to wind speed over gobi and sandy surfaces but showed limited sensitivity over dry lakebed. Notably, z0 increased substantially with wind speed over sandy surfaces, while remaining relatively stable over gobi and dry lakebed, highlighting the role of particle movement in modifying surface roughness.
Focal height (zf) and its associated friction velocity (uf) displayed distinct spatial patterns linked to regional surface properties. For sandy surfaces, zf was significantly greater in the Mu Us Sandy Land and Hexi Corridor than in other deserts. For gobi surfaces, zf correlated strongly with surface gravel coverage. The corresponding uf averaged 0.35–3.33 m s−1 for sandy surfaces, 0.27–3.23 m s−1 for gobi, and 1.07–2.99 m s−1 for dry lakebed, underscoring the spatial heterogeneity controlled by local surface characteristics.
The region-specific parameterizations of u * and z0 provided herein offer crucial field-based constraints for improving the accuracy of aeolian transport and dust emission models at regional scales. The aerodynamic parameters obtained in this study provide a critical scientific basis for the design of windbreak and sand fixation projects in arid regions. The parameters zf and uf offer theoretical support for determining the height of sand barriers. In addition to advancing wind-blown sediment dynamics, this work contributes directly to environmental sustainability. Our region-specific parameterizations improve the accuracy of dust emission models, which is critical for developing reliable early-warning systems for sand and dust storms. Effective mitigation of these hazards is essential to protect agricultural productivity, infrastructure, and public health in arid regions. Thus, our findings provide a scientific foundation for evidence-based land management strategies that support ecological security and sustainable development in arid and semi-arid regions worldwide under changing climatic and human activities.
To advance predictive capabilities, future efforts should focus on integrating these aerodynamic parameters with concurrent, high-resolution measurements of sand and dust flux across the diverse dryland landscapes. Furthermore, establishing a unified observation network to systematically quantify the dynamic feedback between wind regimes, surface properties, and sediment mobility will be essential for understanding and forecasting the response of dryland atmospheres to climatic and anthropogenic changes.

Supplementary Materials

The following supporting information can be downloaded at: https://www.mdpi.com/article/10.3390/su18062910/s1. Table S1. Goodness-of-fit metrics of Wind profiles for the mean wind velocity (u) at a height (z) of 2 m for mean velocities of (a) 5 m s−1 shown in Figure 3. Table S2. Goodness-of-fit metrics of Wind profiles for the mean wind velocity (u) at a height (z) of 2 m for mean velocities of (a) 9 m s−1 shown in Figure 3. Table S3. Goodness-of-fit metrics of Wind profiles for the mean wind velocity (u) at a height (z) of 2 m for mean velocities of (a) 11 m s−1 shown in Figure 3. Table S4. Goodness-of-fit metrics of Normalized wind profiles for the mean wind velocity (u) at a height (z) of 2 m for mean velocities of (a) 5 m s−1 shown in Figure 4. Table S5. Goodness-of-fit metrics of Normalized wind profiles for the mean wind velocity (u) at a height (z) of 2 m for mean velocities of (a) 9 m s−1 shown in Figure 4. Table S6. Goodness-of-fit metrics of Normalized wind profiles for the mean wind velocity (u) at a height (z) of 2 m for mean velocities of (a) 11 m s−1 shown in Figure 4. Figure S1. (a) Land surface for the field site of G10, (b) Land surface for the field site of S5, (c) Land surface for the field site of S4, (d) Land surface for the field site of S4V. Figure S2. Sensitivity of Wind-Driven Parameters (zf and uf) to Wind Speed. Figure S3. The statistical characteristics of (a, b, c) the friction velocity (u*) and (d, e, f) aerodynamic roughness length (z0) above the three surface types. Sites: G, gobi; S, sand; D, dry lakebed under free-stream wind speeds of 5 m s−1 (a, d), 9 m s−1 (b, e), and 11 m s−1 (c, f). In the boxplots, horizontal lines represent the median, boxes represent the 25% to 75% interval, and whiskers represent the uncertainties in u* and z0 propagated from instrumental and fitting errors.

Author Contributions

Conceptualization, K.P. and Z.Z.; methodology, K.P. and Z.Z.; software, K.P.; validation, K.P. and Z.Z.; formal analysis, K.P.; investigation, K.P. and Y.Z.; resources, K.P.; data curation, K.P.; writing—original draft preparation, K.P.; writing—review and editing, Z.Z. and G.Q. (deceased); supervision, Z.Z.; funding acquisition, Z.Z. and G.Q. (deceased). All authors have read and agreed to the published version of the manuscript.

Funding

This research was funded by the major program of Inner Monglia (2024JBGS0003-1), the Fundamental Research Funds for the Central Universities (GK202502004; GK202304045), and the National Natural Science Foundation of China (Grants 41971014 and 41930640). We thank the journal’s anonymous reviewers for their efforts to improve our manuscript.

Institutional Review Board Statement

Not applicable.

Informed Consent Statement

Not applicable.

Data Availability Statement

The original contributions presented in this study are included in the article/Supplementary Material. Further inquiries can be directed to the corresponding author.

Acknowledgments

The authors wish to acknowledge the significant contribution of Guangqiang Qian, who passed away on 18 September 2025. Qian made substantial contributions to the writing of this manuscript.

Conflicts of Interest

The authors declare no conflicts of interest.

References

  1. Shao, Y.P. Physics and Modeling of Wind Erosion; Springer: Berlin/Heidelberg, Germany, 2008. [Google Scholar]
  2. Van Pelt, R.S.; Zobeck, T.M.; Potter, K.N.; Stout, J.E.; Popham, T.W. Validation of the wind erosion stochastic simulator (WESS) and the revised wind erosion equation (RWEQ) for single events. Environ. Model. Softw. 2004, 19, 191–198. [Google Scholar] [CrossRef] [Scilit]
  3. Zhang, C.L.; Yang, S.; Pan, X.H.; Zhang, Q.J. Estimation of farmland soil wind erosion using RTK GPS measurements and the 137Cs technique: A case study in Kangbao County, Hebei province, northern China. Soil Tillage Res. 2011, 112, 140–148. [Google Scholar] [CrossRef] [Scilit]
  4. Borrelli, P.; Panagos, P.; Ballabio, C.; Lugato, E.; Weynants, M.; Montanarella, L. Towards a Pan-European Assessment of Land Susceptibility to Wind Erosion. Land. Degrad. Dev. 2016, 27, 1093–1105. [Google Scholar] [CrossRef] [Scilit]
  5. Martin, R.L.; Barchyn, T.E.; Hugenholtz, C.H.; Jerolmack, D.J. Timescale dependence of aeolian sand flux observations under atmospheric turbulence. J. Geophys. Res. Atmos. 2013, 118, 9078–9092. [Google Scholar] [CrossRef] [Scilit]
  6. Shao, Y.P. Wind Erosion and Wind-Erosion Research. In Physics and Modelling of Wind Erosion; Shao, Y., Ed.; Springer: Dordrecht, Germany, 2008; Volume 379, pp. 1–11. [Google Scholar]
  7. Chepil, W.S. Dynamics of wind erosion: 1. Nature of movement of soil by wind. Soil. Sci. 1945, 60, 305–320. [Google Scholar] [CrossRef] [Scilit]
  8. Anderson, R.S.; Haff, P.K. Wind modification and bed response during saltation of sand in air. In Aeolean Grain Transport 1: Mechanics; Barndorff-Nielsen, O.E., Willetts, B.B., Eds.; Springer: Vienna, Austria, 1991; Volume 1, pp. 21–52. [Google Scholar]
  9. Zhang, W.; Wang, Y.; Lee, S.J. Two-phase measurements of wind and saltating sand in an atmospheric boundary layer. Geomorphology 2007, 88, 109–119. [Google Scholar] [CrossRef] [Scilit]
  10. Sherman, D.J.; Farrell, E.J. Aerodynamic roughness lengths over movable beds: Comparison of wind tunnel and field data. J. Geophys. Res. Earth Surf. 2008, 113, F02S08. [Google Scholar] [CrossRef] [Scilit]
  11. Kaimal, J.C.; Finnigan, J.J. Atmospheric Boundary Layer Flows: Their Structure and Measurement; Oxford University Press: New York, NY, USA, 1994. [Google Scholar]
  12. Campbell, G.S.; Norman, J.M. An Introduction to Environmental Biophysics, 2nd ed.; Springer: New York, NY, USA, 1998; pp. 113–128. [Google Scholar]
  13. Mulhearn, P.J.; Finnigan, J.J. Turbulent flow over a very rough, random surface. Bound.-Layer Meteorol. 1978, 15, 109–132. [Google Scholar] [CrossRef] [Scilit]
  14. Cheng, H.; Castro, I.P. Near-wall flow development after a step change in surface roughness. Bound.-Layer. Meteorol. 2002, 105, 411–432. [Google Scholar] [CrossRef] [Scilit]
  15. Li, H.R.; Zou, X.Y.; Zhang, C.L.; Kang, L.Q.; Cheng, H.; Liu, B.; Liu, W.; Fang, Y.; Yang, D.L.; Wu, X.X. Effects of gravel cover on the near-surface airflow field and soil wind erosion. Soil Tillage Res. 2021, 214, 105133. [Google Scholar] [CrossRef] [Scilit]
  16. Zhang, C.L.; Yuan, Y.X.; Zou, X.Y.; Wang, H.T.; Li, Q.; Wang, Z.T.; Wang, R.D. A comparison of the aerodynamic characteristics of four kinds of land surface in wind erosion areas of northern China. Catena 2022, 212, 106112. [Google Scholar] [CrossRef] [Scilit]
  17. Bagnold, R.A. The Physics of Blown Sand and Desert Dunes; Methuen: London, UK, 1941. [Google Scholar]
  18. Blumberg, D.G.; Greeley, R. Field studies of aerodynamic roughness length. J. Arid Environ. 1993, 25, 39–48. [Google Scholar] [CrossRef] [Scilit]
  19. Liu, X.P.; Dong, Z.B.; Wang, X.M. Aerodynamic Roughness of Fixed Sand Beds. J. Desert Res. 2003, 23, 111–117. (In Chinese) [Google Scholar]
  20. Charnock, H. Wind stress on a water surface. Q. J. R. Meteorol. Soc. 1955, 81, 639–640. [Google Scholar] [CrossRef] [Scilit]
  21. Owen, P.R. Saltation of uniform grains in air. J. Fluid. Mech. 1964, 20, 225–242. [Google Scholar] [CrossRef] [Scilit]
  22. Chamberlain, A.C. Roughness length of sea, sand, and snow. Bound.-Layer. Meteorol. 1983, 25, 405–409. [Google Scholar] [CrossRef] [Scilit]
  23. Gillette, D.A.; Stockton, P.H. The effect of nonerodible particles on wind erosion of erodible surfaces. J. Geophys. Res. 1989, 94, 12885–12893. [Google Scholar] [CrossRef] [Scilit]
  24. Gillies, J.A.; Nickling, W.G.; King, J. Drag coefficient and plant form response to wind speed in three plant species: Burning Bush (Euonymus alatus), Colorado Blue Spruce (Picea pungens glauca.), and Fountain Grass (Pennisetum setaceum). J. Geophys. Res. 2002, 107, 4760. [Google Scholar] [CrossRef] [Scilit]
  25. Zhang, Z.C.; Dong, Z.B. Characteristics of aeolian sediment transport over different land surfaces in northern China. Soil Tillage Res. 2014, 143, 106–115. [Google Scholar] [CrossRef] [Scilit]
  26. Li, X.L.; Tong, L.; Niu, J.; Kang, S.Z.; Du, T.S.; Li, S.; Ding, R.S. Spatio-temporal distribution of irrigation water productivity and its driving factors for cereal crops in Hexi Corridor, Northwest China. Agric. Water Manag. 2017, 179, 55–63. [Google Scholar] [CrossRef] [Scilit]
  27. Dong, Z.B.; Wang, H.T.; Liu, X.P.; Wang, X.M. A wind tunnel investigation of the influence of fetch length on the flux profile of a sand cloud blowing over a gravel surface. Earth Surf. Process. Landf. 2004, 29, 1613–1626. [Google Scholar] [CrossRef] [Scilit]
  28. Zhang, Z.C.; Dong, Z.B.; Hu, G.Y.; Parteli, E.J.R. Migration and morphology of asymmetric barchans in the central Hexi Corridor of Northwest China. Geosciences 2018, 8, 204. [Google Scholar] [CrossRef] [Scilit]
  29. Sun, C.H. Research on Response of Vegetation Aboveground Biomass to Groundwater Depth and Climate Change in Ejina Banner. Master’s Thesis, Northwest University, Xi’an, China, 2018. [Google Scholar]
  30. Luo, H.P. Quantifying the Contribution of Dust Sources in Major Cities in Hexi Region Based on Composite Fingerprinting Technology. Ph.D. Thesis, Lanzhou University, Lanzhou, China, 2022. [Google Scholar]
  31. Liang, P.; Chen, B.; Yang, X.P.; Liu, Q.Q.; Li, A.R.; Mackenzie, L.; Zhang, D.G. Revealing the dust transport processes of the 2021 mega dust storm event in northern China. Sci. Bull. 2022, 67, 21–24. [Google Scholar] [CrossRef] [Scilit] [PubMed]
  32. Zhu, Z.; Wu, Z.; Liu, S.; Di, X. An Outline of Chinese Deserts; Science Press: Beijing, China, 1980. (In Chinese) [Google Scholar]
  33. Xu, Z.W.; Hu, R.; Wang, K.X.; Mason, J.A.; Wu, S.Y.; Lu, H.Y. Recent greening (1981–2013) in the Mu Us dune field, north-central China, and its potential causes. Land Degrad. Dev. 2018, 29, 1509–1520. [Google Scholar] [CrossRef] [Scilit]
  34. Xu, Z.W.; Mason, J.A.; Xu, C.; Yi, S.W.; Bathiany, S.; Yizhaq, H.; Zhou, Y.L.; Cheng, J.; Holmgren, M.; Lu, H.Y. Critical transitions in Chinese dunes during the past 12,000 years. Sci. Adv. 2020, 6, Eaay8020. [Google Scholar] [CrossRef] [Scilit] [PubMed]
  35. Wen, Y.L.; Wu, Y.Q.; Tan, L.H.; Li, D.W.; Fu, T.Y. End-member modeling of the grain size record of loess in the Mu Us Desert and implications for dust sources. Quat. Int. 2019, 532, 87–97. [Google Scholar] [CrossRef] [Scilit]
  36. Zhang, Z.C. Measurement and Study on the Characteristic of Aeolian Activities in the Southeastern Tenngger Desert. Ph.D. Thesis, Chinese Academy of Sciences, Beijing, China, 2009. [Google Scholar]
  37. He, Q.; Hu, W.F.; Yang, X.H.; Manmtimin, A.; Zhao, C.M. Research on Wind Profile and Sand Drift Structure in Guaizi Lake Region in the Badain Jaran Desert. Arid Zone Res. 2012, 29, 517–523. (In Chinese) [Google Scholar]
  38. Li, Y.K.; Li, J.R.; Dong, L.; Luo, X.Y.; Han, Z.E.; Wang, R. The wind and sand resistance effect of four vegetation types in Ulan Buhe Desert. J. Desert Res. 2022, 42, 65–73. (In Chinese) [Google Scholar]
  39. Wang, L.; Qiu, Y.N.; Han, Z.Y. Climate, topography and anthropogenic effects on desert greening: A 40-year satellite monitoring in the Tengger desert, northern China. Catena 2022, 209, 105851. [Google Scholar] [CrossRef] [Scilit]
  40. Wang, B.Y.; Gao, Y.; Gao, Y.Y. Spatial-temporal characteristics of wind speed in the Tengger Desert from 1957 to 2017. J. Lanzhou Univ. (Nat. Sci.) 2022, 58, 761–767. (In Chinese) [Google Scholar]
  41. Yang, X.; Scuderi, L.; Liu, T.; Paillou, P.; Li, H.; Dong, J.; Zhu, B.; Jiang, W.; Jochems, A.; Weissmann, G. Formation of the highest sand dunes on Earth. Geomorphology 2011, 135, 108–111. [Google Scholar] [CrossRef] [Scilit]
  42. Dong, Z.B.; Qian, G.Q.; Lv, P.; Hu, G.Y. Investigation of the sand sea with the tallest dunes on Earth: China’s Badain Jaran Sand Sea. Earth-Sci. Rev. 2013, 120, 20–39. [Google Scholar] [CrossRef] [Scilit]
  43. Luo, F.M.; Gao, J.L.; Xin, Z.M.; Bian, K.; Hao, Y.G.; Liu, F. Characteristics of sand-driving wind regime and sediment transport in northeast edge of Ulan Buh Desert. Trans. Chin. Soc. Agric. Eng. 2019, 35, 145–152. (In Chinese) [Google Scholar]
  44. Liu, B.L.; Weimin Zhang, W.M.; Qu, J.J.; Zhang, K.C.; Han, Q.J. Controlling windblown sand problems by an artificial gravel surface: A case study over the gobi surface of the Mogao Grottoes. Geomorphology 2011, 134, 461–469. [Google Scholar] [CrossRef] [Scilit]
  45. Han, G.W.; Huang, Z.L.; Zhang, X.B.; Xin, G.W. Disparities in aeolian sand transport across low and high wind speeds in the atmospheric surface layer. J. Wind Eng. Ind. Aerod. 2025, 257, 105990. [Google Scholar] [CrossRef] [Scilit]
  46. Stull, R.B. An Introduction to Boundary Layer Meteorology; Kluwer Academic Publishers: New York, NY, USA, 1988; pp. 378–381. [Google Scholar]
  47. Dong, Z.B.; Wang, H.T.; Zhang, X.H.; Ayrault, M. Height profile of particle concentration in an aeolian saltating cloud: A wind tunnel investigation by PIV MSD. Geophys. Res. Lett. 2003, 30. [Google Scholar] [CrossRef] [Scilit]
  48. Ho, T.D.; Valance, A.; Dupont, P.; Ould El Moctar, A. Scaling Laws in Aeolian Sand Transport. Phys. Rev. Lett. 2011, 106, 094501. [Google Scholar] [CrossRef] [Scilit]
  49. Shao, Y.; Jung, E.; Leslie, L.M. Numerical prediction of northeast Asian dust storms using an integrated wind erosion modeling system. J. Geophys. Res. Atmos. 2002, 107, 4814. [Google Scholar] [CrossRef] [Scilit]
  50. Shao, Y.P.; Lu, H. A simple expression for wind erosion threshold friction velocity. J. Geophys. Res. Atmos. 2000, 105, 22437–22443. [Google Scholar] [CrossRef] [Scilit]
  51. Greeley, R.; Iversen, J.D. Wind as a Geological Process on Earth, Mars, Venus, and Titan; Cambridge University Press: Cambridge, UK, 1985. [Google Scholar]
  52. Gu, Y.; Liu, Y.; Shi, P.J.; Zhang, G.M.; Yang, Y.Y.; Wang, G.P.; Hu, Z.Y.; Liu, L.Y. Synchronous field measurement of high energy sand saltation on typical desert surfaces, Alxa plateau. Sci. Rep. 2025, 15, 23302. [Google Scholar] [CrossRef] [Scilit]
  53. Guo, Z.C.; Wang, T.; Liu, S.L.; Kang, W.P.; Chen, X.; Feng, K.; Zhang, X.Q.; Zhi, Y. Biomass and vegetation coverage survey in the Mu Us sandy land—Based on unmanned aerial vehicle RGB images. Int. J. Appl. Earth Obs. Geoinf. 2021, 94, 1569–8432. [Google Scholar] [CrossRef] [Scilit]
  54. Tan, L.H.; Zhang, W.M.; Qu, J.J.; Wang, J.Z.; An, Z.S.; Li, F. Aeolian sediment transport over gobi: Field studies atop the Mogao Grottoes, China. Aeolian Res. 2016, 21, 53–60. [Google Scholar] [CrossRef] [Scilit]
  55. Qi, S.; Ren, X.M.; Meng, Z.J.; Dang, X.H.; Li, H.N.; Jia, R.T. Dust Release during Playa Activation in a Typical Semiarid Steppe. Pol. J. Environ. Stud. 2023, 32, 1323–1334. [Google Scholar] [CrossRef] [Scilit]
  56. Aberle, J.; Nikora, V. Statistical properties of armored gravel bed surfaces. Water Resour. Res. 2006, 42, W11414. [Google Scholar] [CrossRef] [Scilit]
  57. Zimbelman, J.R.; Spagnuolo, M.G.; DeSilva, S.L. Aerodynamic roughness height of gravel-covered plains in the Puna of Argentina. Planet. Sci. J. 2023, 4, 102. [Google Scholar] [CrossRef] [Scilit]
  58. Zhang, Q.; Deal, E.; Perron, J.T.; Venditti, J.G.; Benavides, S.J.; Rushlow, M.; Kamrin, K. Fluid-driven transport of round sediment particles: From discrete simulations to continuum modeling. J. Geophys. Res. Earth Surf. 2022, 127, e2021JF006504. [Google Scholar] [CrossRef] [Scilit]
  59. Ralaiarisoa, J.L.; Besnard, J.B.; Furieri, B.; Dupont, P.; Ould El Moctar, A.; Naaim-Bouvet, F.; Valance, A. Transition from Saltation to Collisional Regime in Windblown Sand. Phys. Rev. Lett. 2020, 124, 198501. [Google Scholar] [CrossRef] [Scilit] [PubMed]
  60. Tan, L.; Qu, J.J.; Wang, H.T.; An, Z.S.; Wang, T.; Zhao, S.P. Turbulent flow structures over a gobi surface and their impact on aeolian sand transport. Geophys. Res. Lett. 2023, 50, e2023GL103360. [Google Scholar] [CrossRef] [Scilit]
  61. Nield, J.M.; Wiggs, G.F.S.; King, J.; Bryant, R.G.; Eckardt, F.D.; Thomas, D.S.G.; Washington, R. Climate–surface–pore-water interactions on a salt crusted playa: Implications for crust pattern and surface roughness development measured using terrestrial laser scanning. Earth Surf. Process. Landf. 2016, 41, 738–753. [Google Scholar] [CrossRef] [Scilit]
Figure 1. (a) Location of the study area in China. The detailed locations of field sites in the (b) Hexi Corridor Desert, (c) Heihe River Basin, and (d) Mu Us Sandy Land. Field sites are named G for gobis, S for sandy surfaces, and D for dry lakebeds. The white dotted circle represents a dry lakeded, which is generally scattered in distribution.
Sustainability 18 02910 g001
Figure 2. Photos of the three site types, and the locations of the two-dimensional ultrasonic anemometer installation above a (a) gobi site, (b) sandy site, and (c) dry lakebed site.
Sustainability 18 02910 g002
Figure 3. Wind profiles for the free-stream wind velocity (u) at a height (z) of 2 m for mean velocities of (a,d) 5 m s−1, (b,e) 9 m s−1 and (c,f) 11 m s−1 above the sandy sites (S1 to S9), gobi sites (G1 to G11), and dry lakebed sites (D1 to D3) during the field experiments for which data was available. p < 0.01 for all regressions. R2 and RMSE in Tables S1–S3.
Sustainability 18 02910 g003
Figure 4. Normalized wind profiles for the free-stream wind velocity (u) at a height (z) of 2 m for mean velocities of (a,d) 5 m s−1, (b,e) 9 m s−1 and (c,f) 11 m s−1 above the sandy sites (S1 to S9), gobi sites (G1 to G11), and dry lakebed sites (D1 to D3) during the field experiments for which data was available. p < 0.01 for all regressions. R2 and RMSE in Tables S4–S6.
Sustainability 18 02910 g004
Figure 5. The statistical characteristics of (ac) the friction velocity ( u * ) and (df) aerodynamic roughness length (z0) above the three surface types. Sites: G, gobi; S, sand; D, dry lakebed under free-stream wind speeds of 5 m s−1 (a,d), 9 m s−1 (b,e), and 11 m s−1 (c,f). In the boxplots, horizontal lines represent the median, boxes represent the 25% to 75% interval, and whiskers represent the 95% confidence interval. The uncertainties in u * and z0 propagated from instrumental and fitting errors in Figure S3.
Sustainability 18 02910 g005
Figure 6. Relationships between the friction velocity ( u * ) and the aerodynamic roughness length (z0) above (a) gobi sites (G1 to G10) and dry lakebed surfaces (D1 to D3), (b) sandy surfaces (S1 to S5, and S7 to S8) in northern China. p < 0.01 for all regressions. Table 3 summarizes the regression parameters. The vertical dashed line represents the point at which sand transport began. Bootstrap-derived 95% confidence interval (shaded area).
Sustainability 18 02910 g006
Figure 7. Schematic comparison of static (a) and dynamic (b) roughness effects under aeolian conditions.
Sustainability 18 02910 g007
Table 1. Wind conditions and soil properties at the measurement sites shown in Figure 1 and Figure S1.
LocationSitesU 1 (m s−1)umax (m s−1)Mz (µm)σ (φ Units)Sk (φ Units)K (φ Units) u * t (m s−1)C (%)Crust
Hexi Corridor DesertS18.3013.7no
S26.0213.01150−0.93−0.331.360.39no
S36.8713.28200−0.76−0.040.930.23no
D19.7519.2960−1.71−0.201.130.14yes
D26.6413.6730−1.78−0.270.980.11yes
G18.6314.990.4556no
G29.6517.62170−1.02−0.051.170.4066no
G310.4119.79160−1.43−0.221.350.3960no
Heihe River BasinD34.698.051401.62−0.241.180.06yes
G410.5415.981401.17−0.241.640.3754no
G512.9319.62no
G610.2615.19200−1.26−0.191.470.4339no
G77.5710.33no
G811.5717.94no
G913.2121.311801.59−0.202.100.4161no
Taklimakan DesertG106.5815.97no
S57.2611.321480.24no
Mu Us DesertS48.8017.421850.20no
S4v5.8913.660.20no
Ulan Buhe Desert [38]S6204no
Tengger desert [36]S72170.45no
Badain Jaran Desert [37]S82480.22no
Dunhuang [44]S98.5100–3000.5no
G118.5100–3000.6–0.810no
1 u represents mean wind velocity at a height of 2 m, umax represents the maximum free-stream wind velocity during the measurements, Mz represents the mean particle size, σ represents the surface sediment sorting; Sk represents the surface sediment skewness, K represents the surface sediment kurtosis; u * t represents the threshold friction (shear) velocity for particle entrainment, and C represents the gravel cover. —represents no data. Sites: G, gobi; S, sand; D, dry lakebed. S1 to S5 are sandy surfaces, D1 to D3 are dry lakebed surfaces, and G1 to G11 are gobi (gravel) surfaces. The data of S6, S7, S8 are, respectively, from Li et al. [38], from Zhang et al. [36], and from He et al. [37]. The data of S9 and G11 from Liu et al. [44]. Marked with “–” where values are not provided in the original table due to data unavailability in the literature and the absence of field measurements.
Table 2. Comparison of Wind Velocity Observation Instruments and Parameters Across Study Regions.
LocationPeriodHeight (m)Sampling FrequencyInstrument Accuracy (Wind Speed/Wind Direction)Recording Format
Hexi Corridor Desert10 January 2021–14 January 20210.3, 0.9, 1.3, 2.01 s±2%/±3%1 min average
Heihe River Basin02 May 2022–29 May 20220.3, 0.4, 1.3, 2.01 s±2%/±3%1 min average
Taklimakan Desert12 April 2024–13 April 20240.2, 0.5, 1.0, 1.5, 2.01 s±2%/±3%1 min average
Mu Us Desert28 March 20240.2, 0.5, 1.0, 1.5, 2.01 s±2%/±3%1 min average
Ulan Buhe Desert [38]0.2, 0.5, 1.0, 2.010 s5 min average
Tengger desert [36]1.0, 2.0, 4.0, 8.01 s1 min average
Badain Jaran Desert [37]28 March 2010–01 April 20100.2, 0.5, 1.0, 2.01 s1 min average
Dunhuang gobi [44] 23 August 2009, and 26 May 20090.2, 0.35, 0.5, 0.65, 1, 21 min average
Marked with “–” where values are not provided in the original table.
Table 3. Statistics of Wind Speed and Direction for Different Surface Properties (gobi, sandy and dry lakebed surfaces) in the Study Area During the Observation Period.
LocationG1G2G3G4
Wind speedWSWDWSWDWSWDWSWD
u = 5 m s−15.32 ± 0.46E *, SE5.49 ± 0.51E, SE5.41 ± 0.23E, ESE5.51 ± 0.33W
u = 9 m s−18.97 ± 0.59NE, E, SE9.03 ± 0.58E, SE9.06 ± 0.57E, SE9.00 ± 0.56W, NW
u = 11 m s−110.79 ± 0.54NE, E, SE10.89 ± 0.59E, SE10.97 ± 0.58E, SE11.02 ± 0.57W, NW
Wind speedG5G6G7G8
u = 5 m s−15.57 ± 0.28W5.51 ± 0.30N, NE
u = 9 m s−19.49 ± 0.42NW9.04 ± 0.54W, NW8.84 ± 0.54N, NE9.18 ± 0.57N, NW
u = 11 m s−111.10 ± 0.52NW11.06 ± 0.57W, NW10.19 ± 0.15NE11.02 ± 0.58N, NW
Wind speedG9G10G11S1
u = 5 m s−14.92 ± 0.55N, NEE5.30 ± 0.47E, SE
u = 9 m s−19.22 ± 0.56W, NW9.02 ± 0.58NE7.66E8.90 ± 0.56E, SE
u = 11 m s−111.01 ± 0.56W, NW10.94 ± 0.56NE10.37E10.76 ± 0.50E, SE
Wind speedS2S3S4S4V
u = 5 m s−15.07 ± 0.56NE, E5.15 ± 0.54E, SE5.17 ± 0.56N, NW5.01 ± 0.57W, NW
u = 9 m s−18.86 ± 0.55NE, E8.91 ± 0.56E, SE9.01 ± 0.58NW, N8.74 ± 0.53W, NW
u = 11 m s−110.58 ± 0.45E, ENE10.66 ± 0.32E, SE10.97 ± 0.56NW, N10.66 ± 0.53W, NW
Wind speedS5S6S7S8
u = 5 m s−15.52 ± 0.42NE, E5.93 ± 0.28NW5.05NW5.24NW
u = 9 m s−18.78 ± 0.52NE, E8.92 ± 0.26NW9.39NWNW
u = 11 m s−110.51 ± 0.43NE, ENW10.95NW11.05NW
Wind speedS9D1D2D3
u = 5 m s−1E5.55 ± 0.34E, ENE5.01 ± 0.57E, SE4.72 ± 0.51SW, W
u = 9 m s−17.45E8.98 ± 0.56E, SE8.86 ± 0.57E, NE8.05SW
u = 11 m s−1E10.87 ± 0.53E, SE10.73 ± 0.57E, ENE
* E = East, ENE = East-Northeast, NW = Northwest, etc. Marked with “–” where values are not provided in the original table.
Table 4. Coefficients for the relationships between friction velocity ( u * ) and aerodynamic roughness length (z0).
LocationG1–3G4–9G10D1–2D3S1–3
zf 10.0130.0060.0010.0080.0030.047
uf 11.7563.2261.3343.0181.0743.329
R20.5510.7110.3510.3140.4280.906
RMSE0.0020.0000.0000.0040.0000.001
LocationS4S4VS5S7S8-
zf 10.0150.0250.0010.0010.006-
uf 11.4301.2880.8932.7290.353-
R20.4350.9810.6470.8370.541-
RMSE0.0020.0010.0000.0000.001-
1 zf and uf represent the focus points for height and wind velocity in Equation (5) for the graphs in Figure 6. RMSE, root-mean-square error. p < 0.01 for all regressions. Site types: G, gobi; S, sand; D, dry lakebed.
Disclaimer/Publisher’s Note: The statements, opinions and data contained in all publications are solely those of the individual author(s) and contributor(s) and not of MDPI and/or the editor(s). MDPI and/or the editor(s) disclaim responsibility for any injury to people or property resulting from any ideas, methods, instructions or products referred to in the content.