Article

Multivariate Linkages Between Soil Health, Salinity Stress, and Wheat Yield Under Bio-Organic Management


by
Mahmoud El-Sharkawy
1,*,
Modhi O. Alotaibi
2,3,
Haifa A. S. Alhaithloul
4,
Mohamed Kh ElGhannam
5,
Mokhtar M. M. Gab Alla
6,
Ibrahim El-Akhdar
7 and
Mahmoud M. A. Shabana
5,*
1
Soil and Water Department, Faculty of Agriculture, Tanta University, Tanta P.O. Box 23517, Egypt
2
Department of Biology, College of Science, Princess Nourah bint Abdulrahman University, P.O. Box 84428, Riyadh 11671, Saudi Arabia
3
Environmental and Biomaterial Unit, Natural and Health Sciences Research Center, Princess Nourah bint Abdulrahman University, Riyadh, Saudi Arabia
4
Department of Biology, Collage of Science, Jouf University, Sakaka 72341, Saudi Arabia
5
Soils, Water and Environment Research Institute (SWERI), Agricultural Research Centre (ARC), Giza P.O. Box 12511, Egypt
6
Wheat Research Department, Field Crops Research Institute, Agriculture Research Center (ARC), Giza P.O. Box 12619, Egypt
7
Department of Microbiology, Soils, Water and Environment Research Institute, Agriculture Research Center (ARC), Giza P.O. Box 12112, Egypt
*
Authors to whom correspondence should be addressed.
Sustainability 2026, 18(6), 2902; https://doi.org/10.3390/su18062902
Submission received: 19 January 2026 / Revised: 15 February 2026 / Accepted: 10 March 2026 / Published: 16 March 2026

Abstract

Saline irrigation water is increasingly used in arid and coastal regions, posing serious constraints to soil health and wheat yield, particularly in saline–sodic soils. A two-season field experiment was conducted to evaluate the effects of compost, biofertilizers (Azospirillum brasilense and Azotobacter chroococcum), and their combinations on soil physicochemical properties, microbial activity, wheat growth, yield, and physiological traits under two irrigation water salinity levels (3 and 6 dS m−1). Two wheat varieties differing in salt tolerance (Miser 4 and Sakha 95) were tested. Salinity significantly increased soil EC and ESP and reduced plant growth, yield, and nutrient content, while integrated bio-organic treatments markedly alleviated these adverse effects. Compost combined with Azotobacter chroococcum markedly improved soil physical conditions, enhanced microbial biomass carbon, reduced sodicity indicators, and promoted wheat productivity across both seasons. Multivariate analyses including principal component analysis (PCA), redundancy analysis (RDA), and self-organizing maps (SOMs) revealed a strong positive association between yield traits, microbial activity, and soil fertility, and negative correlations with salinity stress indicators. The results demonstrate that combining compost with biofertilizers induces both immediate and residual improvements in saline–sodic soils, enhances wheat resilience to salinity stress, and offers a sustainable approach for improving cereal production under salt-affected environments.

1. Introduction

Salinity and sodicity are among the most earnest causes of land degradation limiting agricultural productivity in arid and semi-arid regions, particularly in irrigated agroecosystems. Globally, more than 800 million hectares, representing approximately 7% of the world’s land surface, are affected by salt-related constraints, with saline–sodic soils raising heightened challenges due to excessive soluble salts and exchangeable sodium [1,2]. In such soils, high electrical conductivity (EC) and exchangeable sodium percentage (ESP) deteriorate soil structure, reduce water infiltration, impair nutrient availability, and disrupt soil biological activity, ultimately restricting crop growth and yield [3]. Egypt is one of the regions most affected by soil salinity, with approximately 93% of its irrigated lands impacted, resulting in crop yield reductions of up to 30% of total production, and these losses are projected to increase in the future [4].
Irrigation with saline water is increasingly practiced in arid and semi-arid regions due to limited freshwater availability and rising agricultural demand [5,6,7]. In many areas, especially coastal regions and zones reliant on saline groundwater, utilization of salt moderate to high irrigation water has become unavoidable for maintaining crop production. Continuous application of saline water adversely affects soil and plant systems by increasing soil electrical conductivity, limiting root growth, reducing nutrient uptake, and disrupting microbial activity, ultimately decreasing crop productivity [8].
Wheat (Triticum aestivum L.), a staple grain crop worldwide, is commonly more sensitive to salinity, particularly during early growth and reproductive stages [9]. Salt stress decreases wheat productivity through osmotic stress, ion toxicity, nutrient imbalance, and oxidative damage, which collectively impair photosynthesis, biomass accumulation, and grain formation [10,11]. Plants respond to salinity by enhancing the physiological and biochemical defense mechanisms, including proline accumulation and antioxidant enzyme activity; however, these responses often reflect stress severity rather than yield improvement [2,12,13,14].
Conventional reclamation practices for saline–sodic soils rely mainly on chemical amendments such as gypsum; however, these approaches are often costly, localized, and may not ensure long-term soil health [1,15]. In recent years, increasing attention has been directed toward bio-organic amendments as sustainable alternatives capable of improving soil properties and enhancing crop tolerance to salinity stress [16,17]. Compost application and microbial inoculation are widely recognized as sustainable agronomic practices for improving crop productivity and soil fertility, especially under stress-prone environments such as saline–sodic soils. Compost serves as a rich source of stabilized organic matter and essential nutrients, and contributes to improve soil aggregation, organic matter content, cation exchange capacity, and microbial habitat, thereby mitigating sodicity-induced dispersion and enhancing nutrient retention [18]. In salt-affected soils, compost plays a critical role in alleviating sodicity by promoting calcium availability, improving soil porosity, and facilitating sodium leaching, which collectively enhance root growth and nutrient uptake [19].
Similarly, microbial inoculation with Azospirillum brasilense and/or Azotobacter chroococcum as plant growth-promoting rhizobacteria (PGPR) plays a crucial role in enhancing plant performance by directly stimulating plant growth and improving stress tolerance [20]. These beneficial microorganisms alter the sustainable environment under salinity by fixing atmospheric nitrogen, producing phytohormones, improving nutrient uptake, and modulating stress-related metabolites [20]. Under saline conditions, PGPR also contribute to osmotic adjustment and antioxidant regulation, thereby reducing the physiological burden of salt stress on plants [21,22]. The conjugation of biofertilizers with organic amendments may exert synergistic and residual effects that extend beyond a single growing season by enhancing soil biological activity, improving rhizosphere functionality, and sustaining nutrient availability, although the long-term interactions and correlations among these effects remain underexplored. Despite growing evidence supporting the use of bio-organic inputs, their interactive effects with irrigation water salinity, wheat genotype, and seasonal variability in saline–sodic soils remain insufficiently understood.
Therefore, the objectives of this study were to: (i) evaluate the effects of compost, biofertilizers, and their combinations on soil physicochemical and biological properties in saline–sodic soil; (ii) assess wheat growth, yield, nutrient dynamics, and physiological responses under different irrigation salinity levels and across two seasons; and (iii) determine how integrated bio-organic fertilization strategies enhance wheat tolerance, productivity, and soil quality under salt stress conditions. Multivariate analytical techniques were subsequently applied as interpretive tools to explore relationships among soil health indicators, plant stress responses, and productivity outcomes.

2. Materials and Methods

2.1. Experimental Location and Design

Field experiment was conducted during two successful winter seasons of 2023/2024 and 2024/2025 in Sakha Agric. Res. Station Farm, North Delta, Kafr El-Sheikh Governorate, Egypt to study the effect of different applications of biofertilizers, organic fertilizers and their combination on soil characteristics and the performance of two varieties of wheat (Triticum aestivum L.) plants grown using two sources of irrigation water with different salinity levels (3 and 6 dS m−1). The experimental site is located at 31°25′29″ N latitude and 31°04′23″ E longitude, with an elevation of 6 m above sea level. The soil at the location is categorized as Vertisols, and its baseline properties are summarized in Table 1.
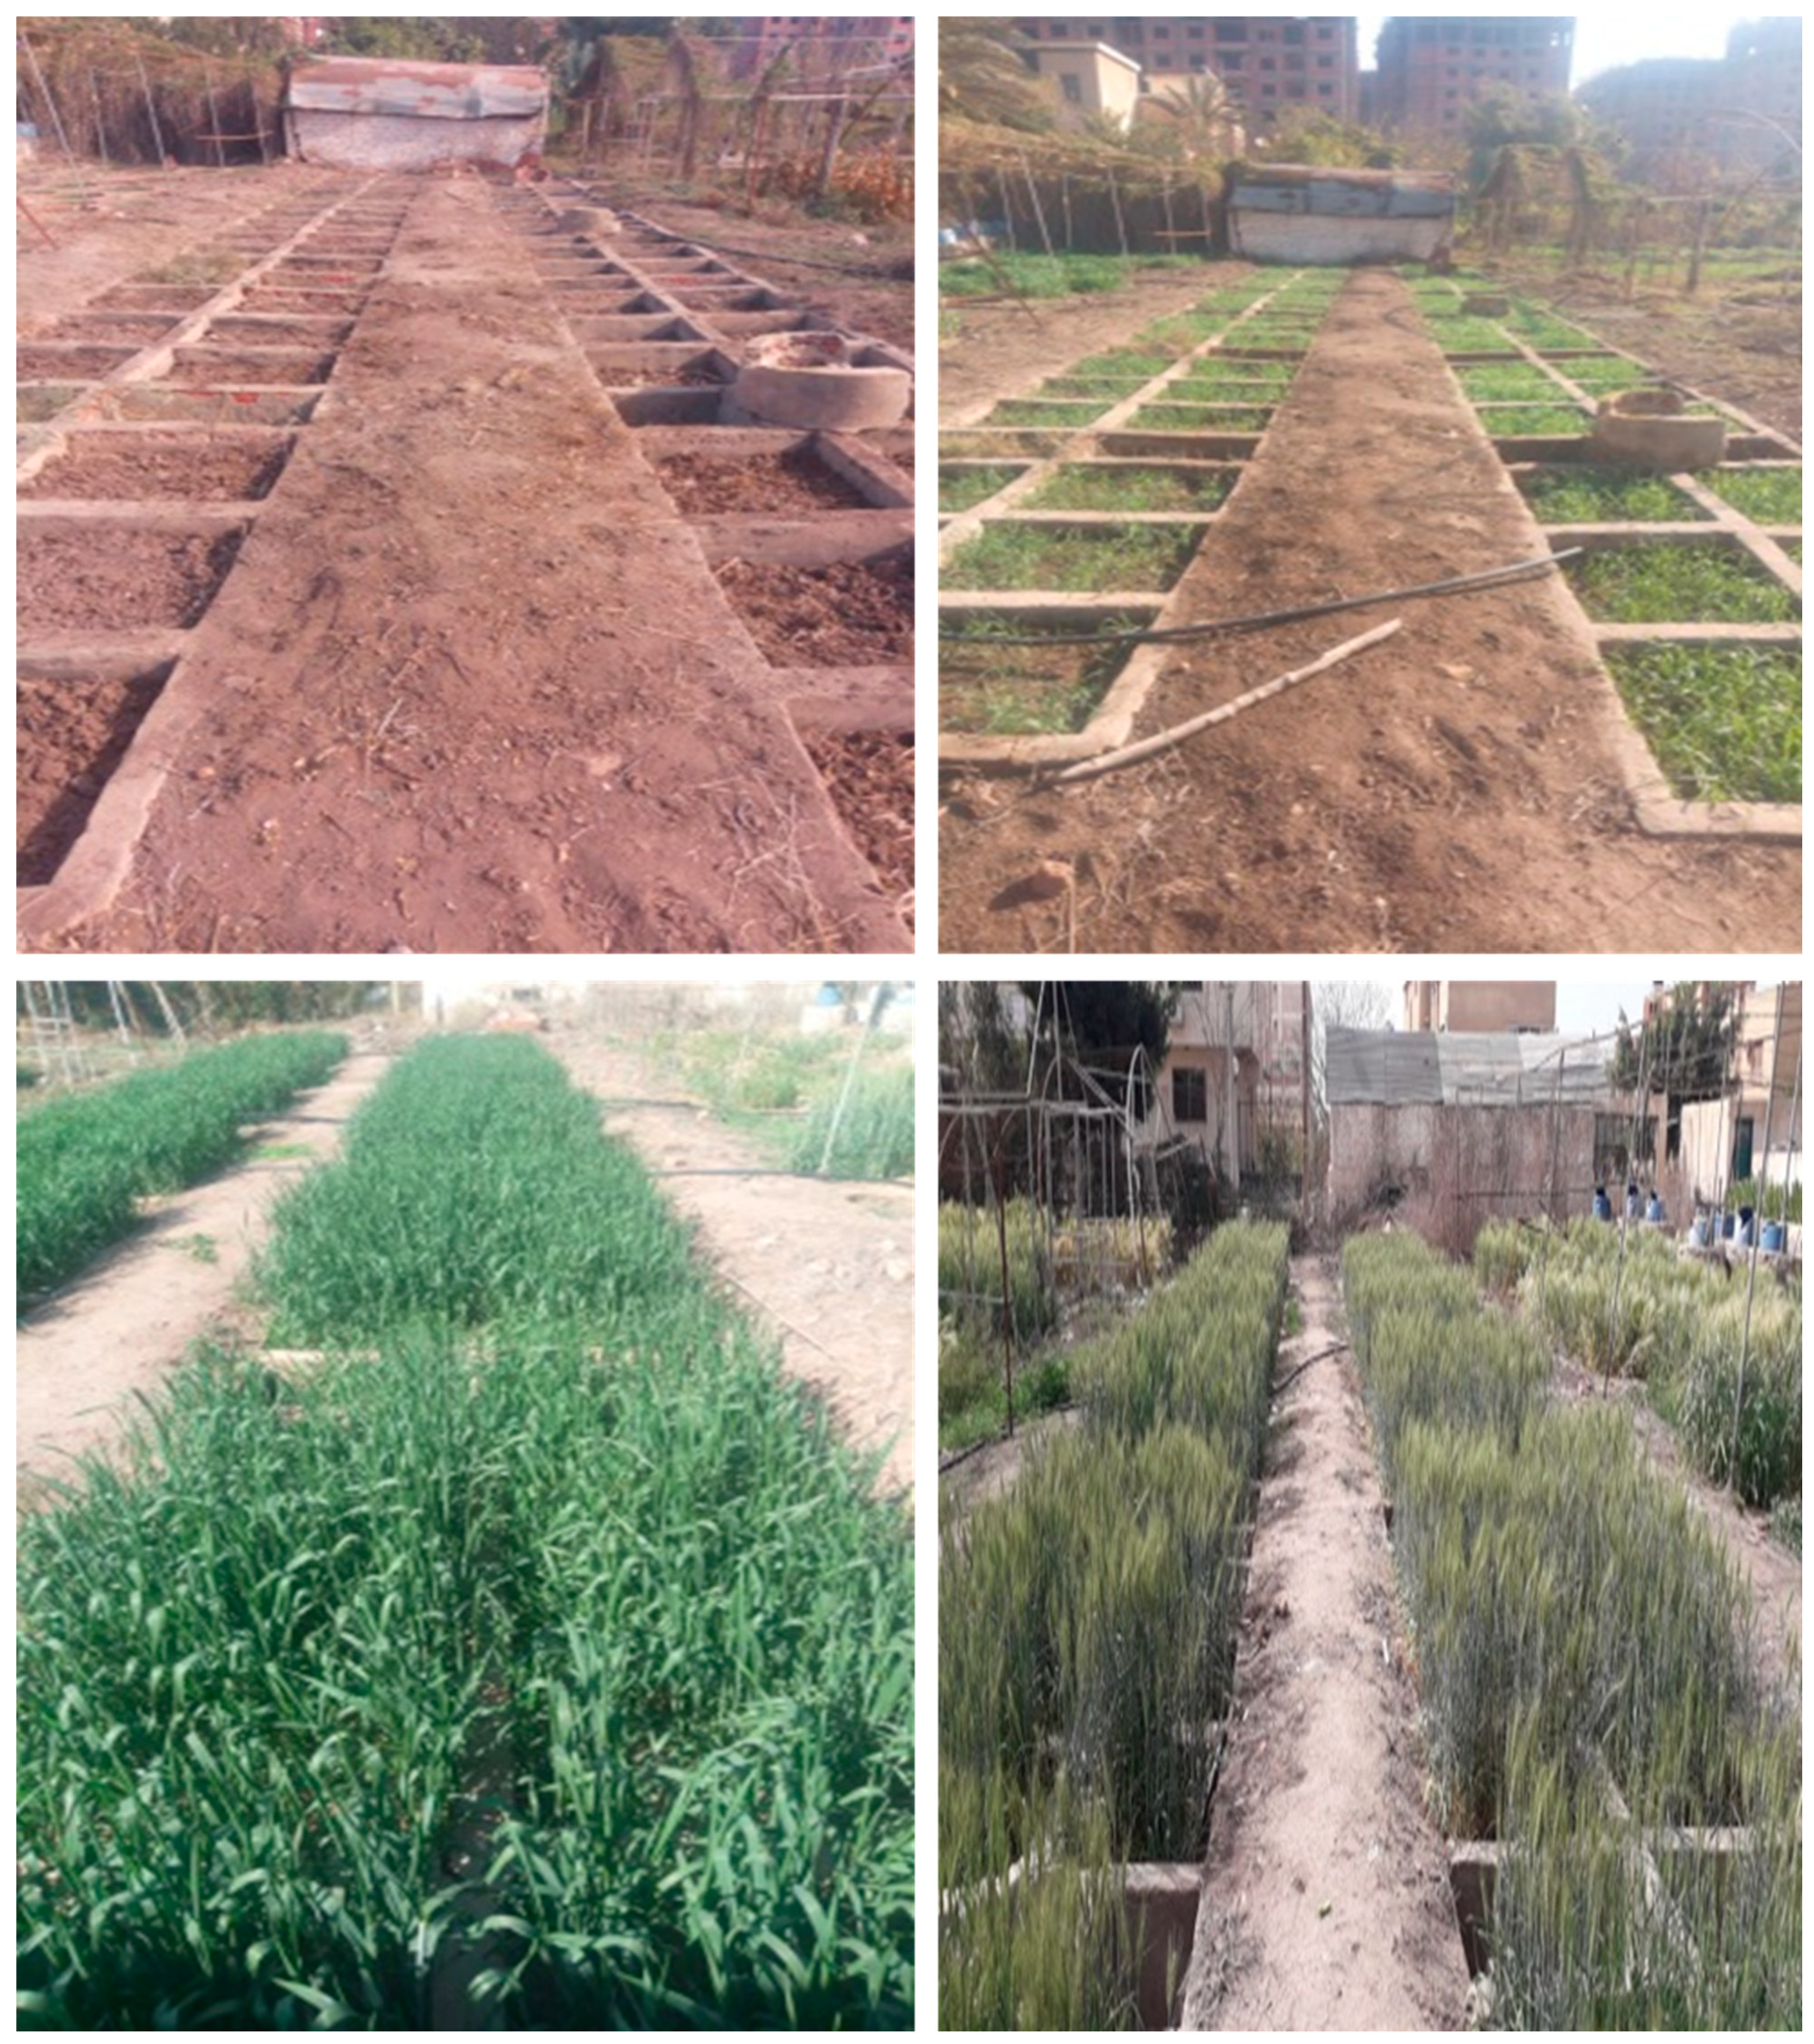
The field was designed for the experiment and set in 96 plots, each measuring 2 m in length and 2 m in width. The experimental layout was conducted in split-split plot design with four replications across two consecutive wheat seasons as shown in Figure 1. The hierarchy of factors was as follows: Main plots were assigned to irrigation water salinity levels comprised (3 and 6 dS m−1) as presented in Table 1. The irrigation was carefully controlled and applied separately to maintain target salinity levels. Within each main plot, sub-plots were assigned to wheat varieties (Miser 4 and Sakha 95). Under each wheat variety, the sub-sub plots involved the application of one of the following 6 treatments:
  • Control (CK) without amendments.
  • Biofertilizer application with Azospirillum brasilense (Bio1).
  • Biofertilizer application with Azotobacter chroococcum (Bio2).
  • Compost (C).
  • C+Bio1.
  • C+Bio2.
The compost and inoculant bacterium species were obtained from Microbiology Department; Soils, Water and Environment Research Institute, Agricultural Research Center, Sakha Agriculture Research Station, Kafr El-Sheikh, Egypt. The compost was applied with soil preparation prior plantation in the rate of 10 t ha−1 as a recommended dose as described by Addisu et al. [23]. The chemical compositions of the compost are presented in Table 1. The studied Azospirillum brasilense and Azotobacter chroococcum were grown in liquid nutrient broth medium with the following composition per Liter: beef Extract 1.0 g, peptone 5.0 g, Yeast Extract 2.0 g, Sodium Chloride 5.0 g, with an ultimate pH adjusted to 6.8 ± 0.2, and incubated at 28 °C. Pure isolates of bacteria were developed in 500 mL flasks comprising 250 mL of nutrient broth on a rotation shaker incubator at 28 °C for 8 h every day. After 3 days of inoculation, peat-based cultures of each species were adjusted following the method described by Difco [24]. Cell suspensions with 107 cfu mL−1 were set to impregnate sterilized peat at a rate of 52 mL liquid culture per 100 g of peat. The inoculated peat was thoroughly mixed and allowed to mature at room temperature for 48 h before inoculated with the seed at planting.
Wheat (Triticum aestivum L.) grain varieties (Misr 4 and Sakha 95) were purchased from Field Crop Research Institute, Agricultural Research Center, Department of Cereals, Sakha Agriculture Research Station, Kafr El-Sheikh, Egypt. Grains were sown at the rate of 144 kg ha−1 on November 15th, and harvested after full maturity on April 7th, in both seasons 2023 and 2024. Phosphorus was supplied as triple super phosphate (44% P2O5) at a rate of 75 kg ha−1 pending field preparation. The nitrogen sourced from urea (46% N) was applied at a rate of 180 kg ha−1, divided into two doses; the premier dose was applied after the first watering irrigation, while the second dose was applied during the subsequent irrigation. The potassium as potassium sulfates (48% K2O) was supplied at 120 kg ha−1, distributed into two applications: the first with the initial irrigation and the second before the tillering stage. All remaining agronomic practices were implemented following the official guidelines recommended by the Ministry of Agriculture for wheat production in the North Delta region.

2.2. Soil Analysis

Surface soil samples from a depth of 0–30 cm were gathered from each experimental unit at the end of each season. These samples subsequently went through combinations of preliminary steps, including air drying, crushing, sieving across a 2.0 mm sieve, and homogenization. Soil pH was analyzed using a pH-meter (model HI2211-02, HANNA, Woonsocket, RI, USA) in soil paste, and electrical conductivity (EC) was measured using EC-meter (model CON2700, EUTECH, Waltham, MA, USA). Particle size distribution was analyzed using the pipette method described by Scheldrick [25]; bulk density and porosity were determined as described by Briggs [26]. A hand penetrometer device was used to determine the soil penetration resistance (SPR) as reported by Herrick and Jones [27]. Soil organic matter was quantified using the Walkley and Black wet oxidation procedure, which involves digestion with 1 N potassium dichromate (K2Cr2O7) and concentrated sulfuric acid, following the method described by Nelson et al. [28]. Available nitrogen (N) by the Kjeldahl technique was determined according to the protocol of extraction with a 2 M KCl solution established by the Soil Survey Staff [29]. Available phosphorus (P) content was measured spectrophotometrically using the ascorbic acid method following the extraction with a 0.5 M sodium bicarbonate solution at pH 8.30, following the procedure outlined by Olsen [30]. The available potassium (K) content was determined using a flame photometer after extraction with 1.0 N ammonium acetate at pH 7, as described by Page et al. [31]. Total concentrations of heavy metals including Mn, Fe, and Zn were determined after digestion by concentrated H2SO4+H2O2 using ICP Spectroscopy (ICP-ISO Prodigy Plus) as reported by Page et al. [31]. Soil sodicity indices were assessed by calculating the sodium adsorption ratio (SAR) and the exchangeable sodium percentage (ESP) based on the method described by El-Sharkawy et al. [32].

2.3. Plant Sampling and Analysis

Wheat plants were sampled at full maturity (120 days after sowing) from each experimental plot to evaluate agronomic performance. The measured growth and yield parameters included grain yield (t ha−1), straw yield (t ha−1), plant height (cm), flag leaf area (FLA, cm2), and ear length (cm). The harvest index was calculated as the ratio of grain dry weight to the total aboveground dry biomass (grain and straw), following the procedure described by [33].
After harvest, wheat grain and straw samples from each treatment were oven-dried at 70 °C to constant weight and finely ground for chemical analysis. Sample digestion was performed using a sulfuric–perchloric acid mixture according to the method described by [34]. Total K content was determined using flame-photometer as described by Cottenie et al. [35]; N and P concentrations were analyzed according to [31].
Total chlorophyll in fresh leaf at the heading stage was determined using Chlorophyll meter (SPAD-502 Plus, Konica Minolta Optics, Inc., Osaka, Japan). Free proline content as micromoles per gram of fresh weight of leaf plant was determined according to Bates et al. [36] by a spectrophotometer (Varian Cary 50 UV-Vis spectrophotometer, Agilent Technologies, Santa Clara, CA, USA), at 520 nm with pure toluene as the blank and proline in 3% sulfosalicylic acid solution for standard curve.
As for antioxidant enzymes activity, at 4 °C, one-gram fresh tissue of flag leaf sample at the heading stage was mixed with combination of sodium phosphate buffer (50 mM at pH 7.0) and ethylenediaminetetraacetic acid (1 mM EDTA) and polyvinylpyrrolidone (2% (w/v) PVP). The homogenate was centrifuged at 10,000× g for 15 min at 4 °C and the supernatant was collected and used for assaying enzyme activity. Peroxidase (POD, EC 1.11.1.7) enzyme activity was assayed according to Kar et al. [37]. The reaction mixture contained guaiacol (0.05%), Potassium phosphate buffer (25 mM at pH 7.0), H2O2 (10 mM) and enzyme. The increase in absorbance at 470 nm as a result of oxidation of guaiacol for 1 min using extinction coefficient of 26.6 mM−1 cm−1 determined enzyme activity.

2.4. Statistical Analysis

The experiment was arranged with three factors (irrigation water salinity, wheat varieties, and bio-organic treatments) under field plot conditions. Data were subjected to three-ways analysis of variance (ANOVA) performed using IBM-SPSS statistics (version 29). Replications were considered random (four replicates), and all other variables were treated as fixed effects with significant levels set to 5%. To compare the means, a Duncan Multiple Range Test (DMRT) was employed with significance set at p < 0.05. Prior to multivariate analyses, all variables were standardized to eliminate scale effects and ensure comparability among soil, physiological, and yield parameters. Principal Component Analysis (PCA), and comparison of variables have been carried out using MATLAB 2022 LLC (version 21.4.0), while self-organizing maps (SOMs) and redundancy analysis (RDA) were conducted using MATLAB software (v. R2022a) to explore the variances and relationships among different quality variables.

3. Results

3.1. Soil Properties

The irrigation with salinity water for two seasons resulted in several variations in soil properties. Table 2 shows the mean physico-chemical properties after two years of wheat seasons. The data demonstrated that the amendment of different organic and biological fertilizers resulted in mitigating the negative effects of salinity under both 3 and 6 dS m−1. The pH was decreased by the application of different treatments, with the combination of compost with either Azospirillum brasilense or Azotobacter chroococcum recording the lowest values in both varieties and salt levels. The electrical conductivity and ESP% were affected by both salt levels and wheat varieties. The Miser 4 variety showed tolerant responses for both salinity and sodicity. The application of C+Bio treatments reduced EC and ESP compared to the control with ranges of 40.0% and 24.15% for EC and 19.78% and 14.89% for ESP% with Miser 4, and ranges of 22.81% and 35.28% for EC, and 24.23% and 19.72% for ESP% with Sakha 95 under 3 and 6 dS m−1 respectively. The integration between compost and biofertilizers ameliorated both OM and MBC under both salt levels of irrigation water and wheat varieties. The OM increased with C+Bio with an average value of 1.33% compared to the 0.80% average of the control in all varieties. Similarly, microbial biomass carbon (MBC) increased to 0.69 mg C g−1 soil under C+Bio, compared to 0.45 mg g−1 soil in the control. All treatments affected the reduction in bulk density of soil compared to the control, with C+Bio treatments resulting in BD reaching around 5% reduction compared to the control in both varieties under both salt levels. The soil penetration resistance (SPR) showed non-significant differences in values with Sakha 95 under both salinity levels. The data showed that Sakha 95 was higher in SPR compared to Miser 4 under both salinity levels. Furthermore, the SPR was affected by different treatment applications with C+Bio2 recording the lowest levels in Miser 4, while C+Bio 1 recorded the lowest levels in the Sakha 95 variety.
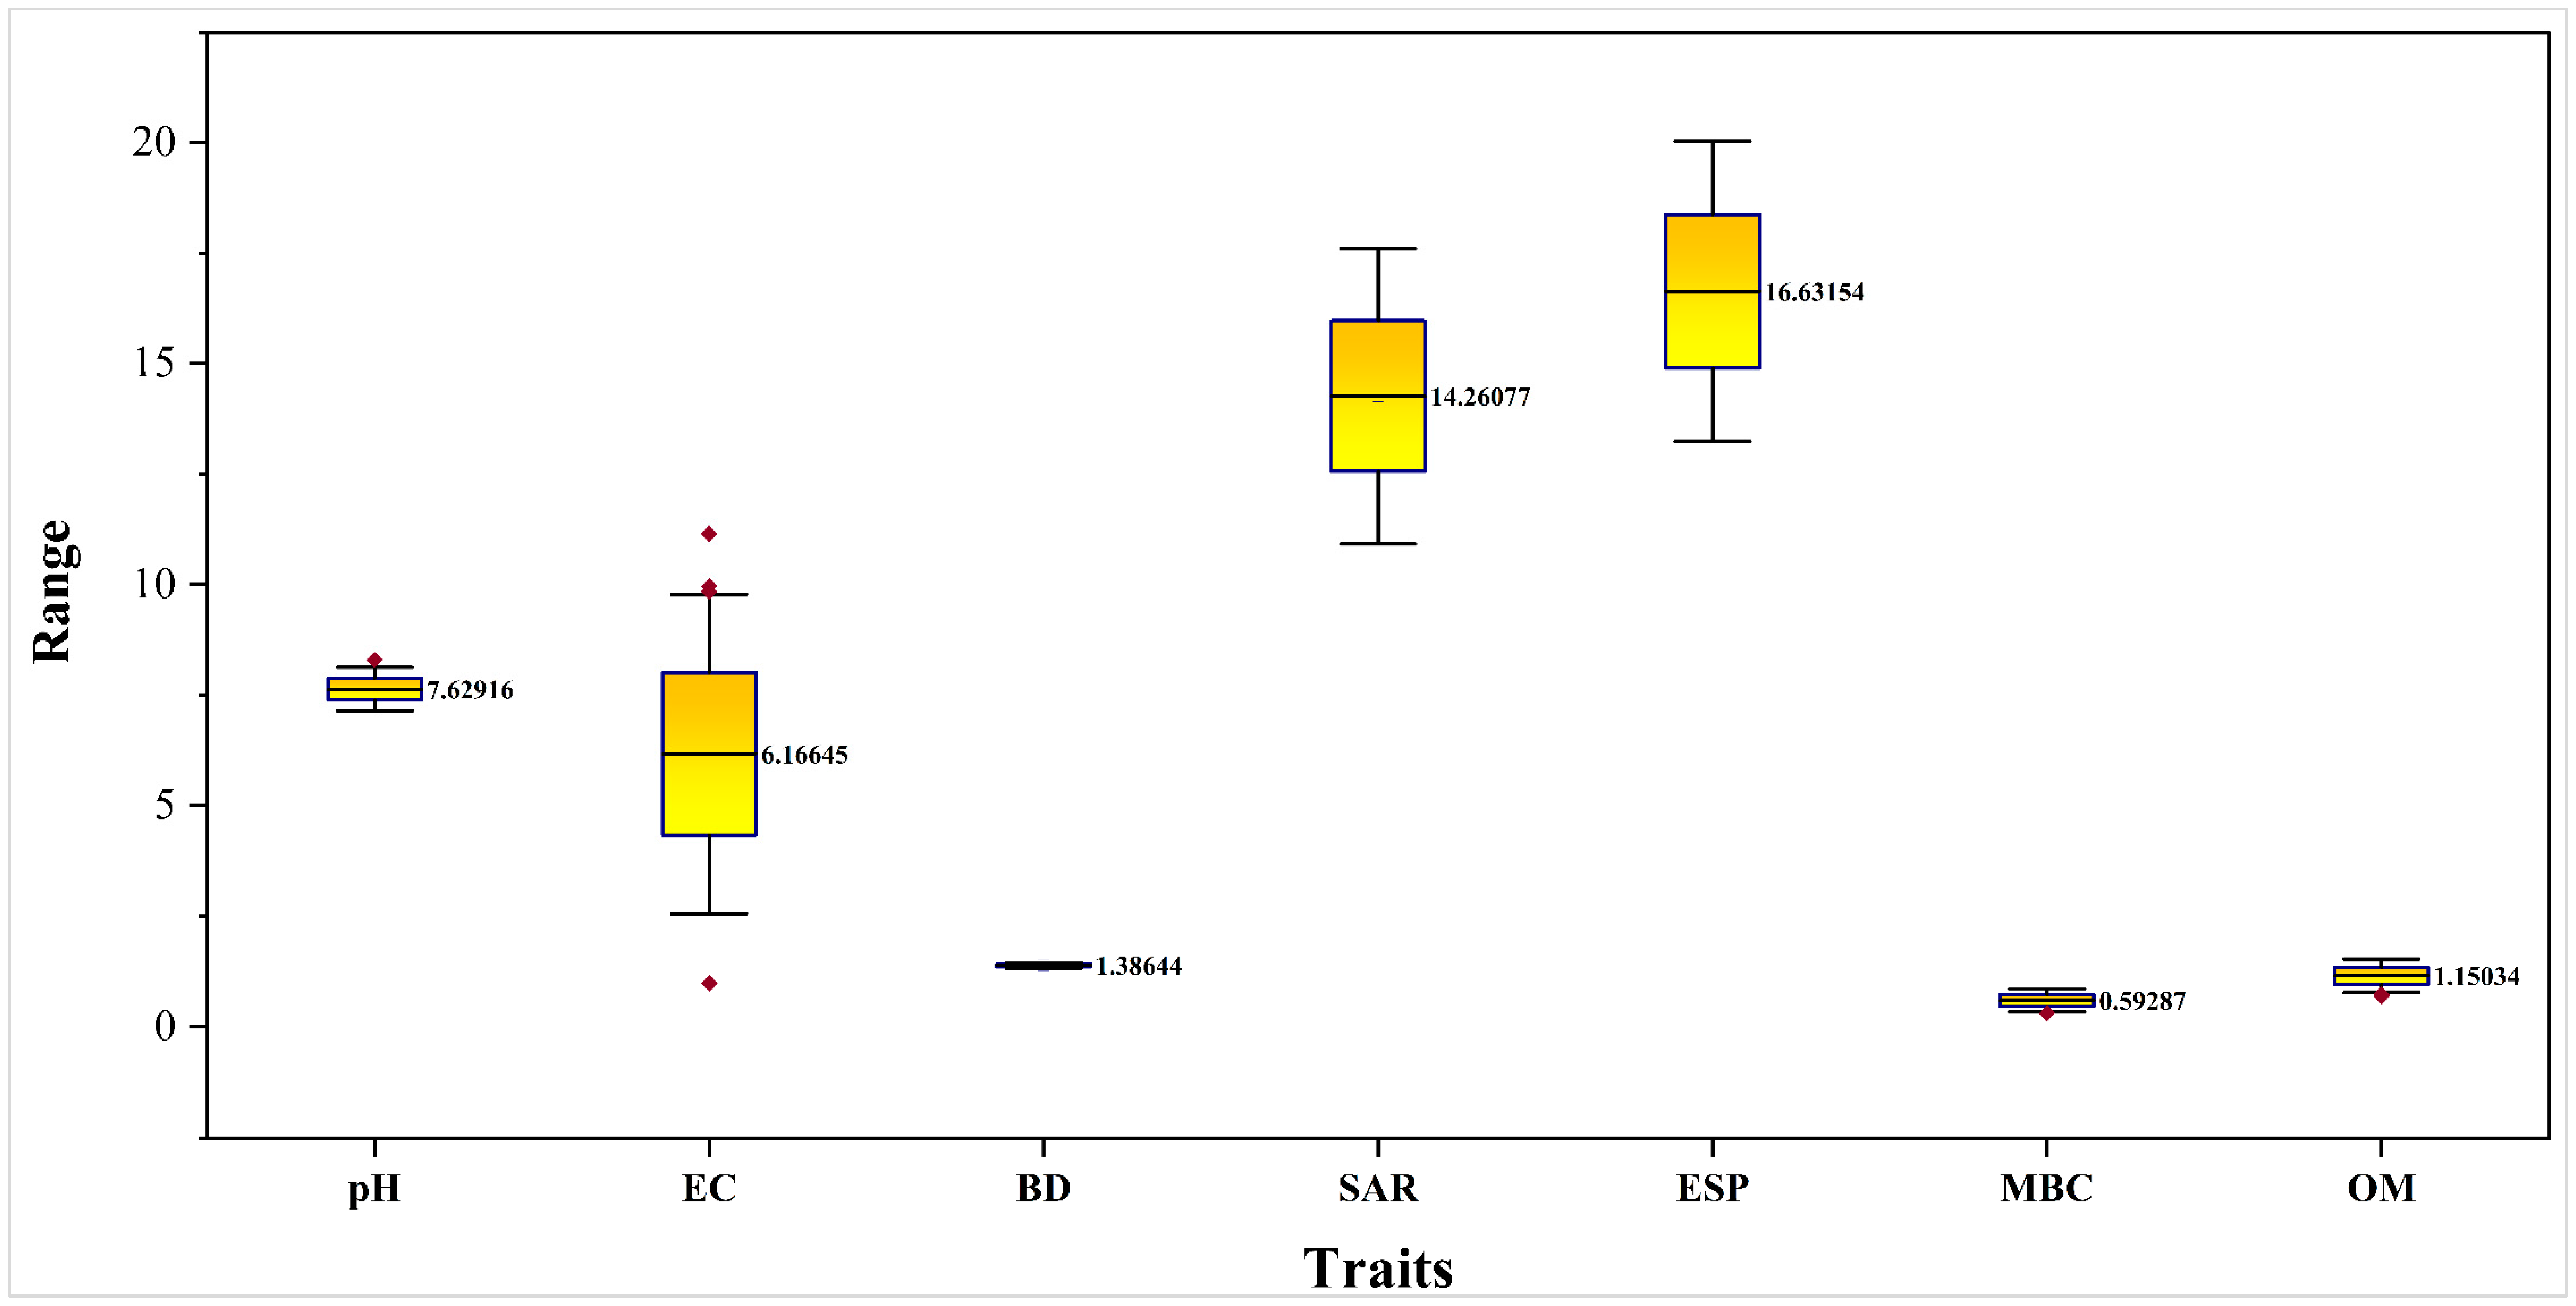
The box plots in Figure 2 show clear variability among the measured soil traits in response to bio-organic fertilizer treatments under the two salinity levels of irrigation water. Soil pH showed a narrow range and remained relatively stable across treatments, with values centered around 7.6. Electrical conductivity (EC) exhibited a wider distribution, reflecting the influence of irrigation water salinity, with median values around 6.17 dS m−1. Bulk density displayed the smallest variability (1.38 g cm−3), indicating minimal structural changes among treatments. In contrast, SAR and ESP showed the greatest fluctuations, with median values of 14.26% and 16.63%, respectively, after two seasons, highlighting their sensitivity to salinity and biofertilizer interactions. Microbial biomass carbon (MBC) and organic matter (OM) displayed moderate variability, with higher medians under biofertilization and compost applications, indicating improvements in soil biological activity and organic content.
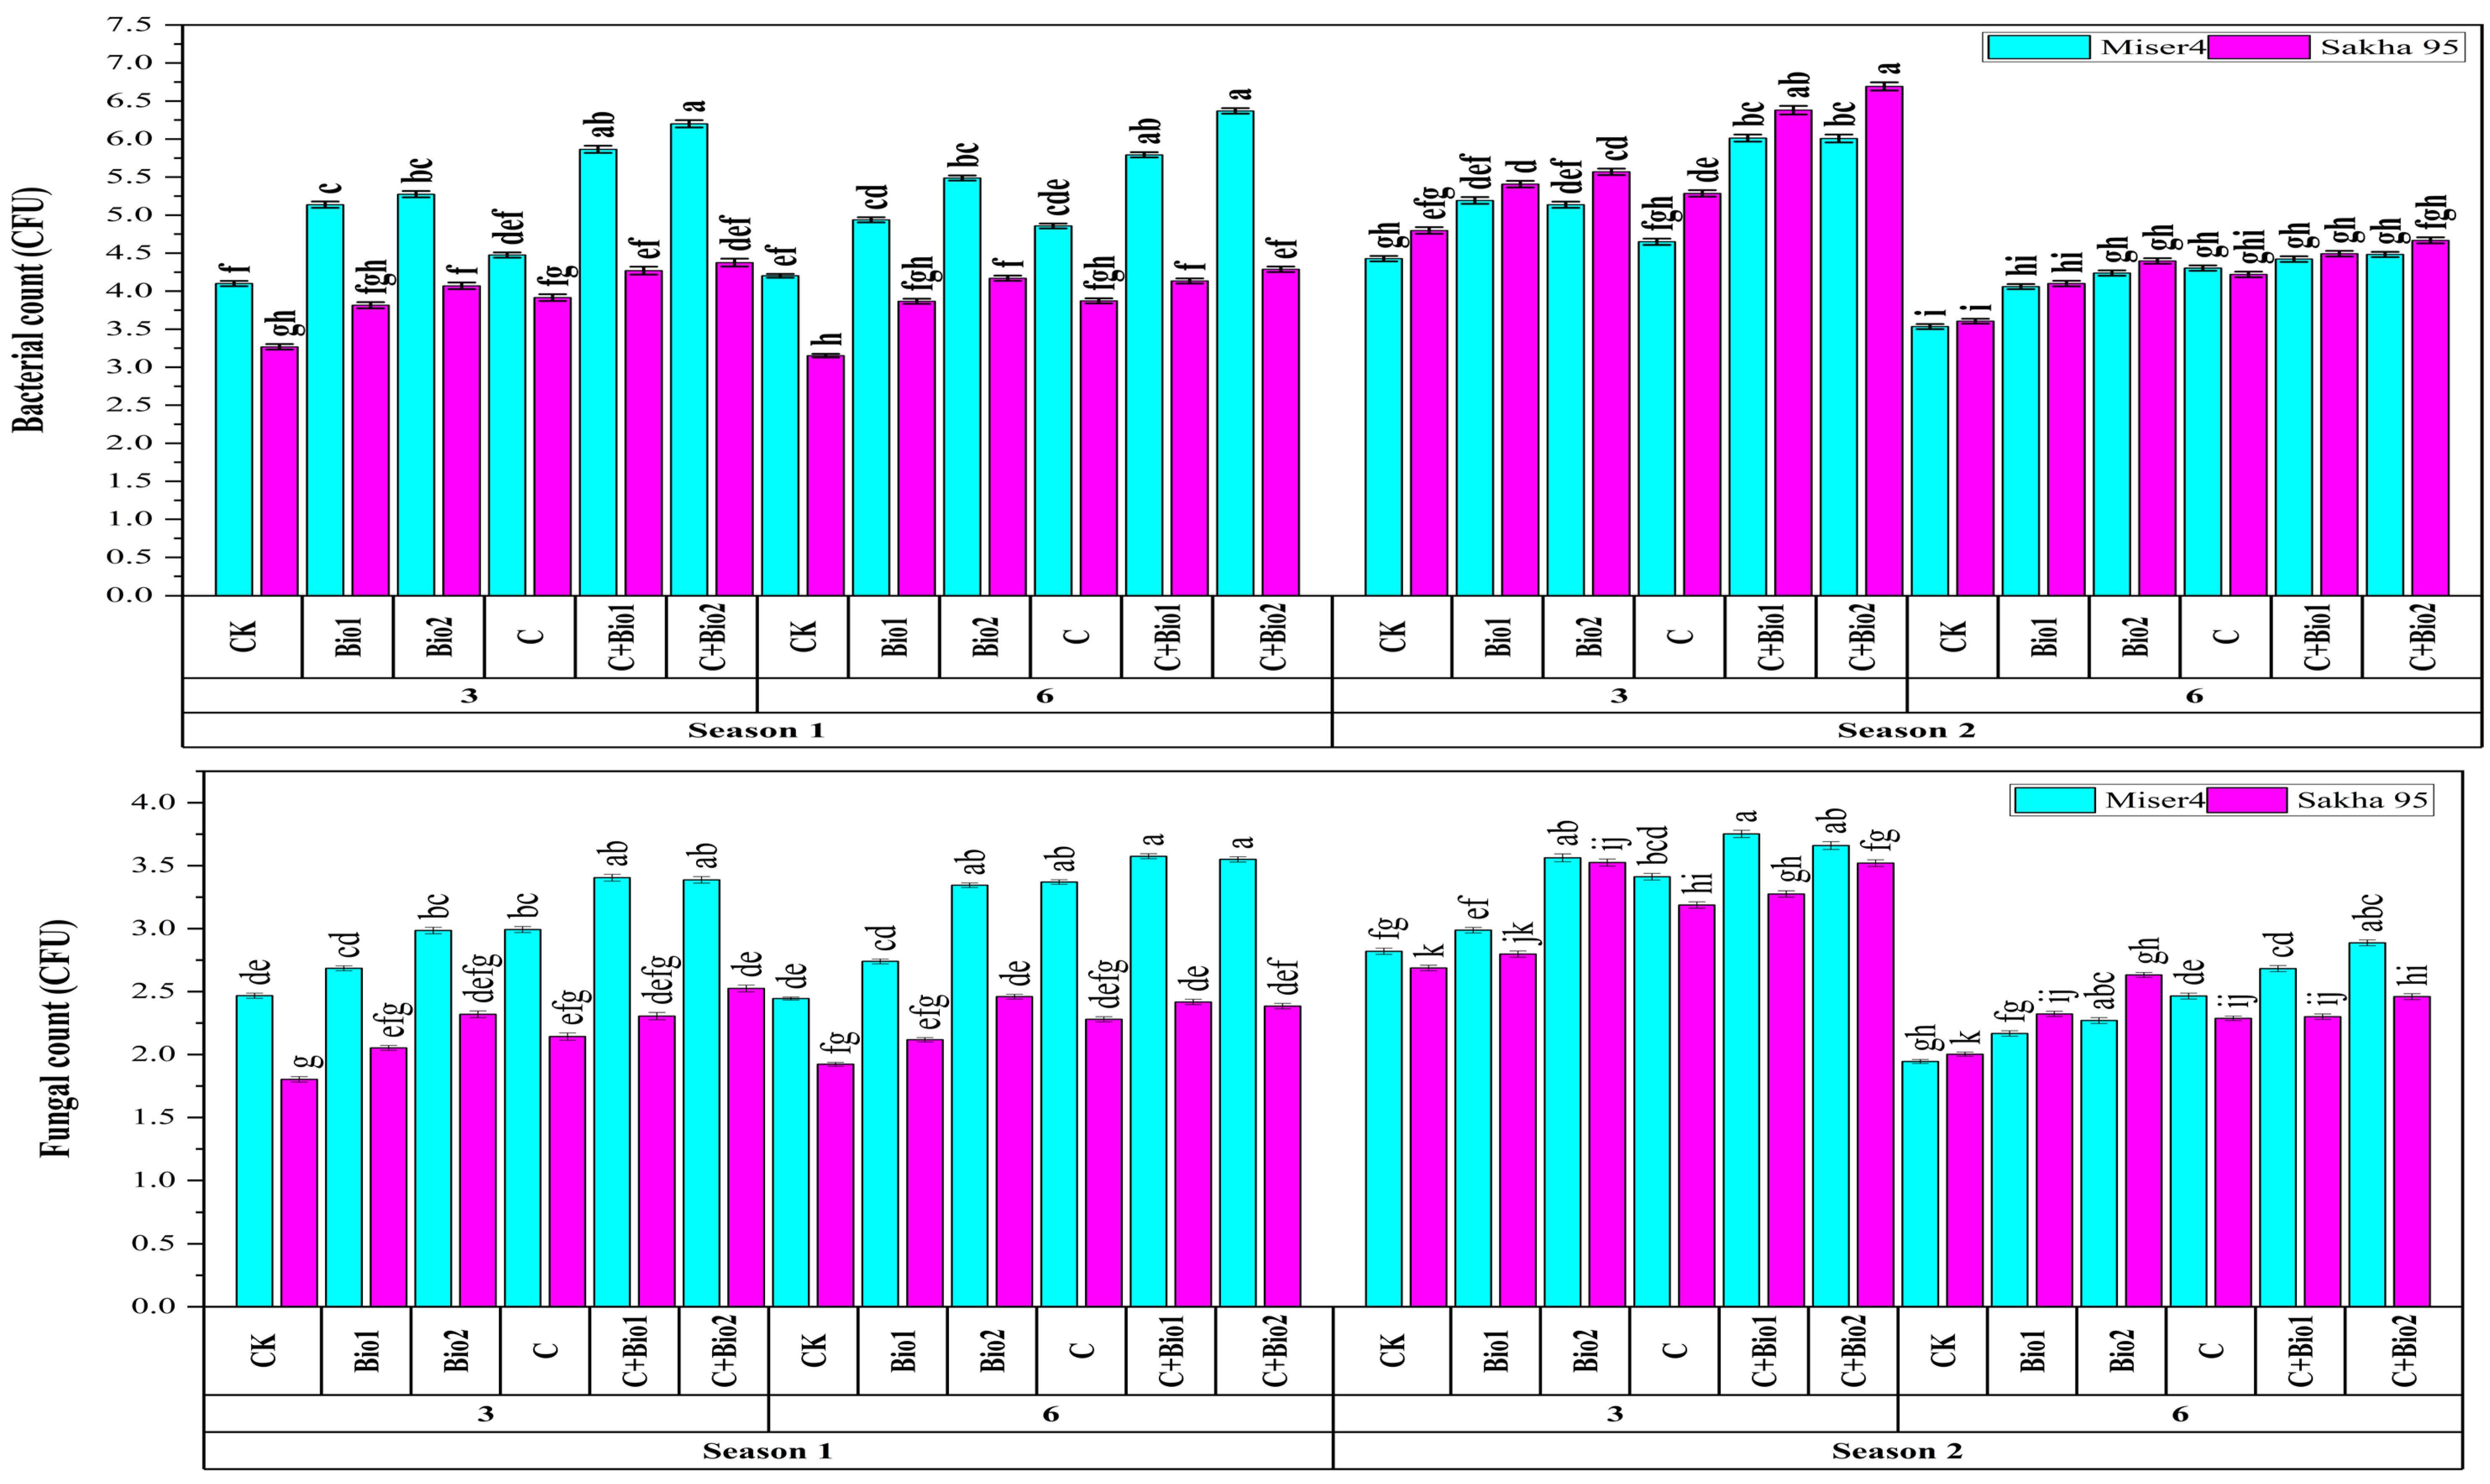
The changes in microbial populations in both seasons under two salt levels of irrigation water with two wheat varieties are interpreted in Figure 3. The application of C+Bio2 treatment showed positive effects in enhancing total soil bacterial counts across seasons and wheat varieties. The Miser 4 variety demonstrated better responses in increasing total counts of bacteria in the first season recording 6.2 and 6.37 CFU under 3 and 6 dS m−1 respectively. In contrast, during the second season, the highest bacterial counts were recorded in the Sakha 95 variety, 6.69 and 4.67 CFU under 3 and 6 dS m−1 respectively. As for fungi count, the fungal population increased with the application of C+Bio in both seasons. The Miser 4 variety showed consistently higher fungal counts than Sakha 95 under both salinity levels. In the first season, fungal counts for Miser 4 averaged 3.48 and 3.63 CFU at 3 and 6 dS m−1, respectively, while in the second season the values were 3.55 and 2.79 CFU. Figure 3 further illustrates that the Sakha 95 variety exhibited an improvement in fungal counts in the second season compared to the first season with all treatments with negative effects with increasing the salinity level.

3.2. Plant Productivity

The analysis of variance in Table 3 demonstrated that salinity exerted a highly significant effect (p < 0.001) on all wheat growth, yield, and physiological traits, with the strongest responses observed for proline and total chlorophyll, confirming the severity of salt stress. Varietal differences and seasonal effects were also significant across most parameters including plant height, ear length, flag leaf area, and proline. The bio-organic treatments caused highly significant improvements in straw yield, plant height, ear length, flag paper area (FPA), and total chlorophyll. Several interactions were also significant, particularly salinity × variety, salinity × treatment, and variety × treatment. The peroxidase content was not affected by any factor except by salinity.
The data in Table 4 illustrated the plant biomass production traits as an average of the two years of planting. The data showed that the combined treatments (C+Bio1 and C+Bio2) consistently produced higher values for most growth and yield parameters, indicating a strong synergistic effect between compost and biofertilizers. Under 3 dS m−1 salinity level, the C+Bio2 recorded the highest grain yield (4.66 and 4.64 t ha−1) without differences with Miser 4 and Saka 95 wheat varieties respectively, whereas straw yield increased significantly with the C+Bio1 treatment. The other traits including plant height, ear length, FPA, and harvest index (HI) take the same trend with C+Bio2 recording the highest values with both wheat varieties except with HI in Miser 4 in which Bio 1 treatment registered the highest value. On the other hand, under the 6 dS m−1 salinity level, the average grain yield after two seasons registered the high values with the application of C+Bio1 with values 4.23 and 3.21 t ha−1 with Miser 4 and Sakha 95 wheat varieties respectively with no significant differences with C+Bio2 treatment. The sole application of compost resulted in increments of straw yield in both wheat varieties. The other traits including plant height, ear length, FPA, and harvest index (HI) take the same trend with C+Bio2 recording the highest values with both wheat varieties except with HI in Miser 4 in which Bio1 treatment registered the highest value. It was noticed that the integration of organic and biofertilizers boosts the grain and straw yield in Miser 4 compared to the Sakha 95 variety under both salt levels.
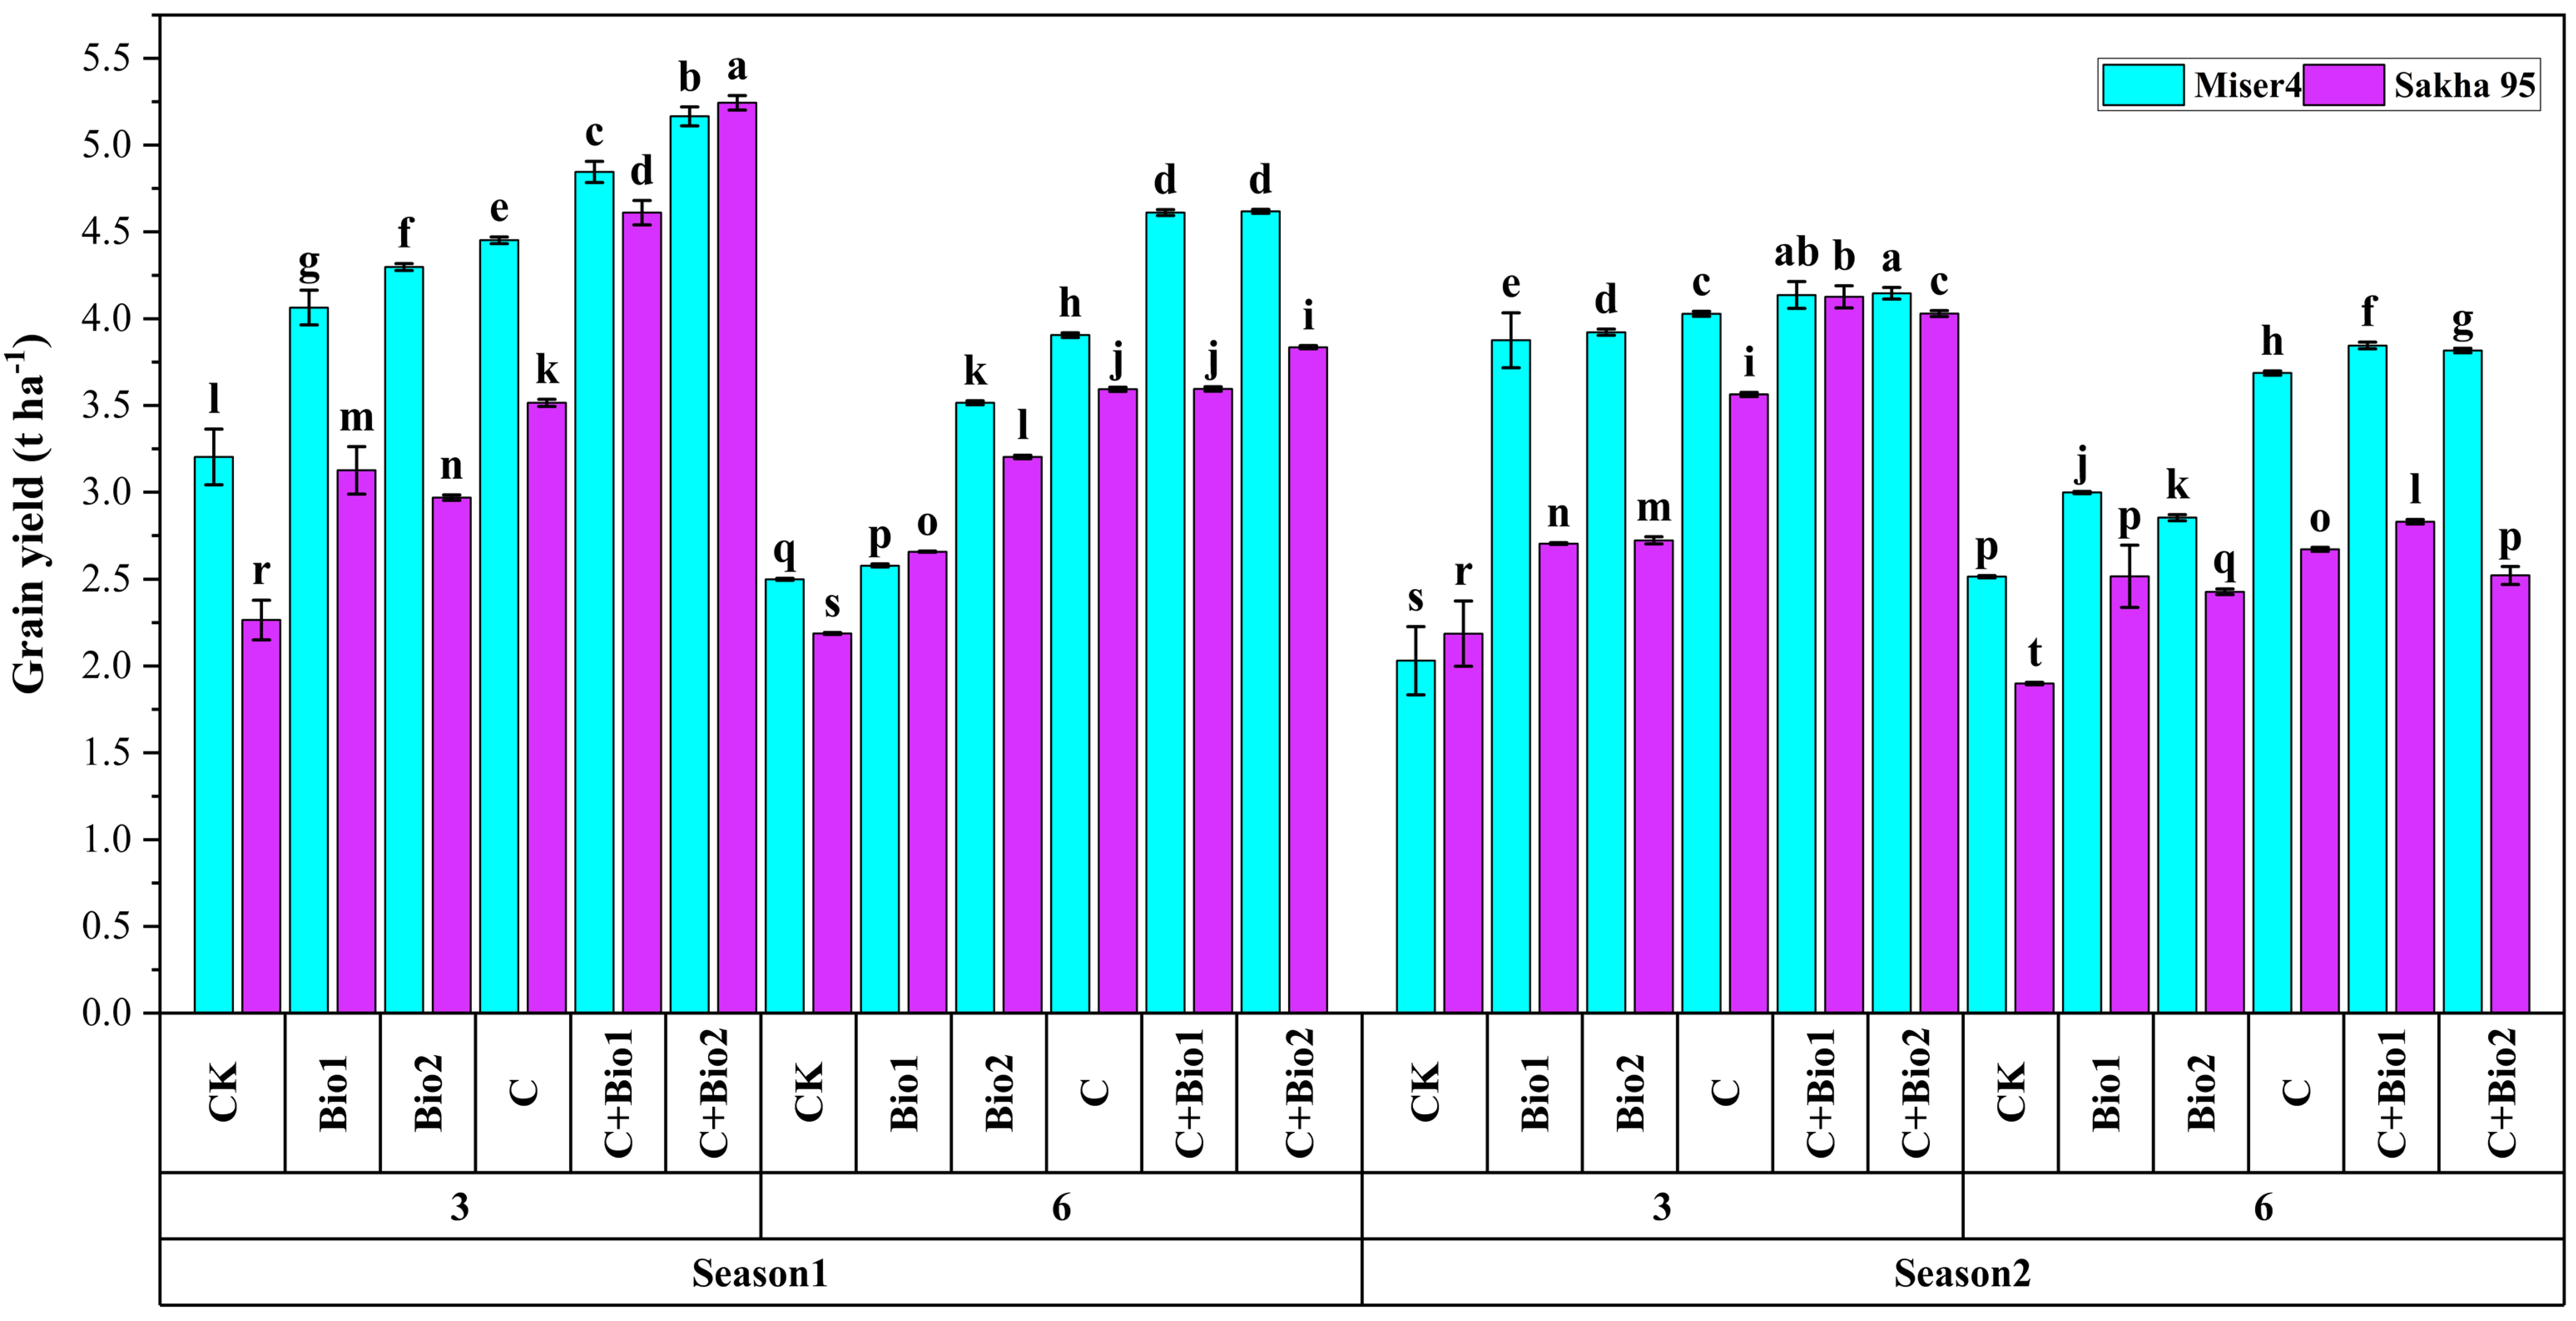
To explore the role of different seasons on wheat grain yield, Figure 4 is presented. The data revealed that increasing salinity resulted in decreasing the grain yield, and the yield in the second season reduced in both wheat varieties. Furthermore, the bio-organic fertilization increased the yield in both seasons and under both varieties compared to the control with C+Bio2 explored the best results. The C+Bio2 treatment registered 61.27% and 84.72% increments in Miser 4 compared to the control in the first season under 3 and 6 dS m−1 respectively, while it recorded 131.47% and 75.33% with the Sakha 95 variety. In the second season, the GY with the application of C+Bio2 treatment was duplicated with Miser 4 under 3 dS m−1 and reached 51.71% increment compared to the control under 6 dS m−1, while it reached 84.22% and 32.77% increments compared to the control with the Sakha 95 variety under 3 and 6 dS m−1 respectively. The chart also showed that the conjunction between compost and biofertilizers has the best effects on mitigating the salinity effects, particularly in the second season with the Miser 4 variety under both salt levels.
Furthermore, the average components of both grains and straw and the physiological responses to the application of organic and biological fertilizers with the irrigation of two levels of salinity water after two seasons of planting are presented in Table 5. The data demonstrated that the combination of compost and biofertilizers, especially Azotobacter chroococcum (C+Bio2), resulted in increasing the grain and straw nutritional content with both wheat varieties and under both salt levels. The data manifested the negative effects of salinity in the NPK content of both varieties in both grains and straw. Under 3 dS m−1, the grain chemical compositions in Sakha 95 registered high increments of 82.96, and 9.84% with C+Bio2 compared to the control in N and P, while K was raised better in Miser 4 with a 12.16% increment compared to the control. Moreover, the same treatment registered high values of N and K in straw (0.982 and 1.61%) with Miser 4. Under 6 dS m−1, the C+Bio2 enhanced NPK in both grains and straw with Sakha 95 recording the highest values of 1.28, 0.631, and 0.691% for grains and 0.981, 0.170, and 1.29% for straw respectively. The Sakha 95 variety responded to the proline content under both salinity levels more than Miser 4 with C+Bio2 registering 34.99% and 8.87% enhancement percentages compared to the control under 3 and 6 dS m−1 respectively, while Miser 4 registered 16.66% and 8.12% increments under 3 and 6 dS m−1 respectively compared to the control. The peroxidase content exhibited no significant differences within treatments with C+Bio 1 registering the highest value of (10.57 U g−1 min−1) with Sakha 95 under 6 dS m−1. The C+Bio2 addition enhanced the total chlorophyll in plants with values of 45.06 and 39.82 mg g−1 under 3 dS m−1, and 31.02 and 32.72 mg g−1 with 6 dS m−1 with Miser 4 and Sakha 95 wheat varieties respectively.

4. Discussion

4.1. Soil Properties

Irrigation with saline water (3 and 6 dS m−1) for two consecutive wheat seasons induced noticeable changes in soil physico-chemical and biological properties. However, the incorporation of compost combined with biofertilizers (Azospirillum brasilense and Azotobacter chroococcum) significantly mitigated the adverse effects of salinity on soil properties under both wheat varieties (Miser 4 and Sakha 95), as shown in Table 2. The integration of compost with biofertilizers (C+Bio) resulted in a marked reduction in soil pH. This reduction is consistent with earlier findings showing that organic amendments release organic acids and stimulate microbial respiration, and improve buffering capacity in saline soils [38]. The improved microbial activity also enhances CO2 production, which forms carbonic acid in the soil solution, contributing further to pH reduction under salinity stress. Electrical conductivity (EC) and exchangeable sodium percentage (ESP) were substantially improved by C+Bio treatments. The observed reduction in soil EC and ESP, particularly under treatments associated with the Miser 4 variety, reflects improvements in soil physico-chemical conditions resulting from compost and biofertilizer application, including enhanced soil aggregation, improved electrolyte balance, increased calcium-mediated cation exchange, and facilitated sodium leaching [39,40]. Biofertilizer application enhanced rhizosphere activity through stimulation of root exudation and microbial polysaccharide production, processes known to improve cation exchange dynamics and reduce sodium adsorption. Organic matter (OM) and microbial biomass carbon (MBC) increased markedly under C+Bio treatments due to the synergistic interaction between compost and inoculated microorganisms, which stimulated microbial proliferation, accelerated decomposition, and promoted carbon stabilization, as reported by Li et al. [41]. Soil bulk density (BD), an important indication of soil compaction, was significantly reduced by the application of compost and biofertilizers. Under C+Bio2 treatment, BD values ranged between 1.34 and 1.36 Mg m−3, representing approximately a 5% reduction compared with the control across both salinity levels. This reduction agrees with findings that higher OM inputs increase total porosity and reduce soil compaction [42]. Several further researchers support the role of OM in improving soil aggregation, mediated through humic substances, root exudates, and microbial-derived compounds, which act as binding agents among soil particles [40,43,44,45], The organic and biological fertilizer amendments have significant influences on soil penetration resistance. Compared with the control, C+Bio treatments reduced, which is consistent with those reports by Celik et al. [42], who attributed the enhancement to the amelioration of the aggregation and soil porosity, which reduces soil compaction. The enhanced biological activity and increased OM likely contributed to loosening the soil matrix and reducing mechanical resistance.
The box plot patterns (Figure 2) reveal how different soil attributes responded to bio-organic fertilizer treatments under saline irrigation in saline–sodic soil, where both salinity and sodicity impose strong constraints on soil chemical balance and structural stability. Soil pH exhibited the narrowest distribution and remained centered around 7.6, reflecting the strong buffering behavior typical of saline–sodic soils, in which high concentrations of soluble salts and exchangeable sodium tend to limit large pH fluctuations even under amendment inputs. Although organic amendments release organic acids, the dominant alkaline salts in saline–sodic soils generally stabilize pH within a moderate to slightly alkaline range [38,46]. Electrical conductivity (EC) displayed a much broader range, indicating significant sensitivity to irrigation water salinity and treatment effects. The relatively high median EC (≈6.17 dS m−1) reflects salt accumulation during the two seasons; however, the variability across treatments suggests that compost and microbial inoculation facilitated partial salt redistribution. In saline–sodic soils, organic matter improves water infiltration and percolation, which promotes the downward leaching of soluble salts [47,48]. This explains the role of soil amendments in reducing EC values despite exposure to saline irrigation. Bulk density (BD) demonstrated minimal variability, which is common in saline–sodic soils where dispersion caused by sodium reduces aggregate stability and complicates short-term structural improvement. Although organic inputs begin to influence porosity, substantial BD changes typically require longer time periods or significant aggregate regeneration [49,50]. Thus, the narrow BD box plots reflect the slow physical recovery of saline–sodic soil structure. In contrast, SAR and ESP displayed the most pronounced fluctuations, underscoring their sensitivity to both salinity levels and the presence of bio-organic amendments. The wide ranges reflect active changes in the sodicity status of the soil. Compost and microbial inoculants can mobilize calcium, reduce sodium distribution, and promote the leaching of monovalent ions which rapidly alter sodic indices even over short timeframes [51]. These substantial variations indicate that sodicity-related restrictions were the most responsive to the treatments applied. The moderate variability observed in OM and MBC, with higher medians under biofertilizer and compost treatments, revealed clear improvements in soil biological activity. Organic amendments are known to enrich labile carbon pools, stimulate microbial proliferation, and enhance enzymatic processes critical for nutrient cycling under salinity stress [52,53]. Elevated MBC particularly confirms the effectiveness of bio-organic fertilizers in restoring microbial functionality, which is often impaired in saline soils. In saline–sodic soils, microbial communities are often suppressed by osmotic and ionic stress; therefore, increases in MBC represent strong evidence of biological recovery [52]. These enhancements also contribute to better soil aggregation and reduced salt stress through microbial exudates and excretion compounds production [54,55].
A more detailed understanding emerges when examining the total bacterial and fungal populations under different water salinity levels and wheat varieties. The patterns of microbial abundance presented in Figure 3 show clear shifts in the soil microbial community structure in response to salinity, wheat variety, and bio-organic fertilization in saline–sodic soil. The consistent increase in bacterial counts with the C+Bio2 treatment across both salinity levels indicates that the combined addition of compost and microbial inoculants substantially improved microbial proliferation, even under osmotic and ionic stress. Saline–sodic soils typically suppress microbial growth due to high sodium concentrations, poor aeration, and restricted nutrient mobility [56]; therefore, the observed enhancement suggests that organic inputs supplied sufficient carbon and improved the microbial environment, while inoculated biofertilizers contributed directly to microbial enrichment [55]. The altered bacterial responses observed in different wheat varieties suggest their varietal differences influenced rhizosphere conditions. Root exudation patterns differ significantly between wheat varieties, affecting microbial recruitment, enzyme activity, and substrate availability [57]. The residual effect of different treatments notably influenced the Sakha 95 variety compared to the Miser 4 variety in the second season, suggesting the seasonal environmental differences or adaptive root responses shifted microbial colonization patterns over time [58]. Fungal populations also responded positively to C+Bio treatments, with a more pronounced varietal differential. Miser 4 consistently supported higher fungal populations than Sakha 95 across both seasons and salt levels, reaching up to 3.63 CFU in the first season. Fungi generally tolerate salinity better than bacteria due to their ability to produce osmo-protectants and form extensive hyphal networks that withstand ionic stress [59]. The reduction in fungal counts at 6 dS m−1, particularly in Sakha 95 during the second season, aligns with the previous concept where severe salinity begins to inhibit fungal sporulation and enzymatic activity [60]. High sodium levels disrupt membrane integrity and reduce mycelial growth, leading to diminished fungal performance under strong sodicity [61]. However, the second-season improvement in Sakha 95 at moderate salinity suggests that bio-organic amendments gradually enhanced soil biological functioning, possibly through cumulative increases in organic carbon and microbial biomass that buffered salinity impacts [62].
Residual effects of bio-organic amendments were confirmed by sustained improvements in key indicators during the second season. Microbial biomass carbon (0.69 mg C g−1 soil), total bacterial and fungal counts, and soil organic matter (1.33%) remained higher under compost combined with biofertilizers compared with untreated saline plots. Simultaneously, soil EC and ESP were reduced by up to 40% and 24%, respectively, while bulk density decreased, and total porosity improved. These persistent changes were associated with higher grain and straw yields even under 6 dS m−1 irrigation. The gradual mineralization of compost and the establishment of beneficial microbial populations likely maintained nutrient cycling, aggregation, and ionic balance beyond the initial season [38], confirming a true residual and system-stabilizing effect in the saline–sodic soil.
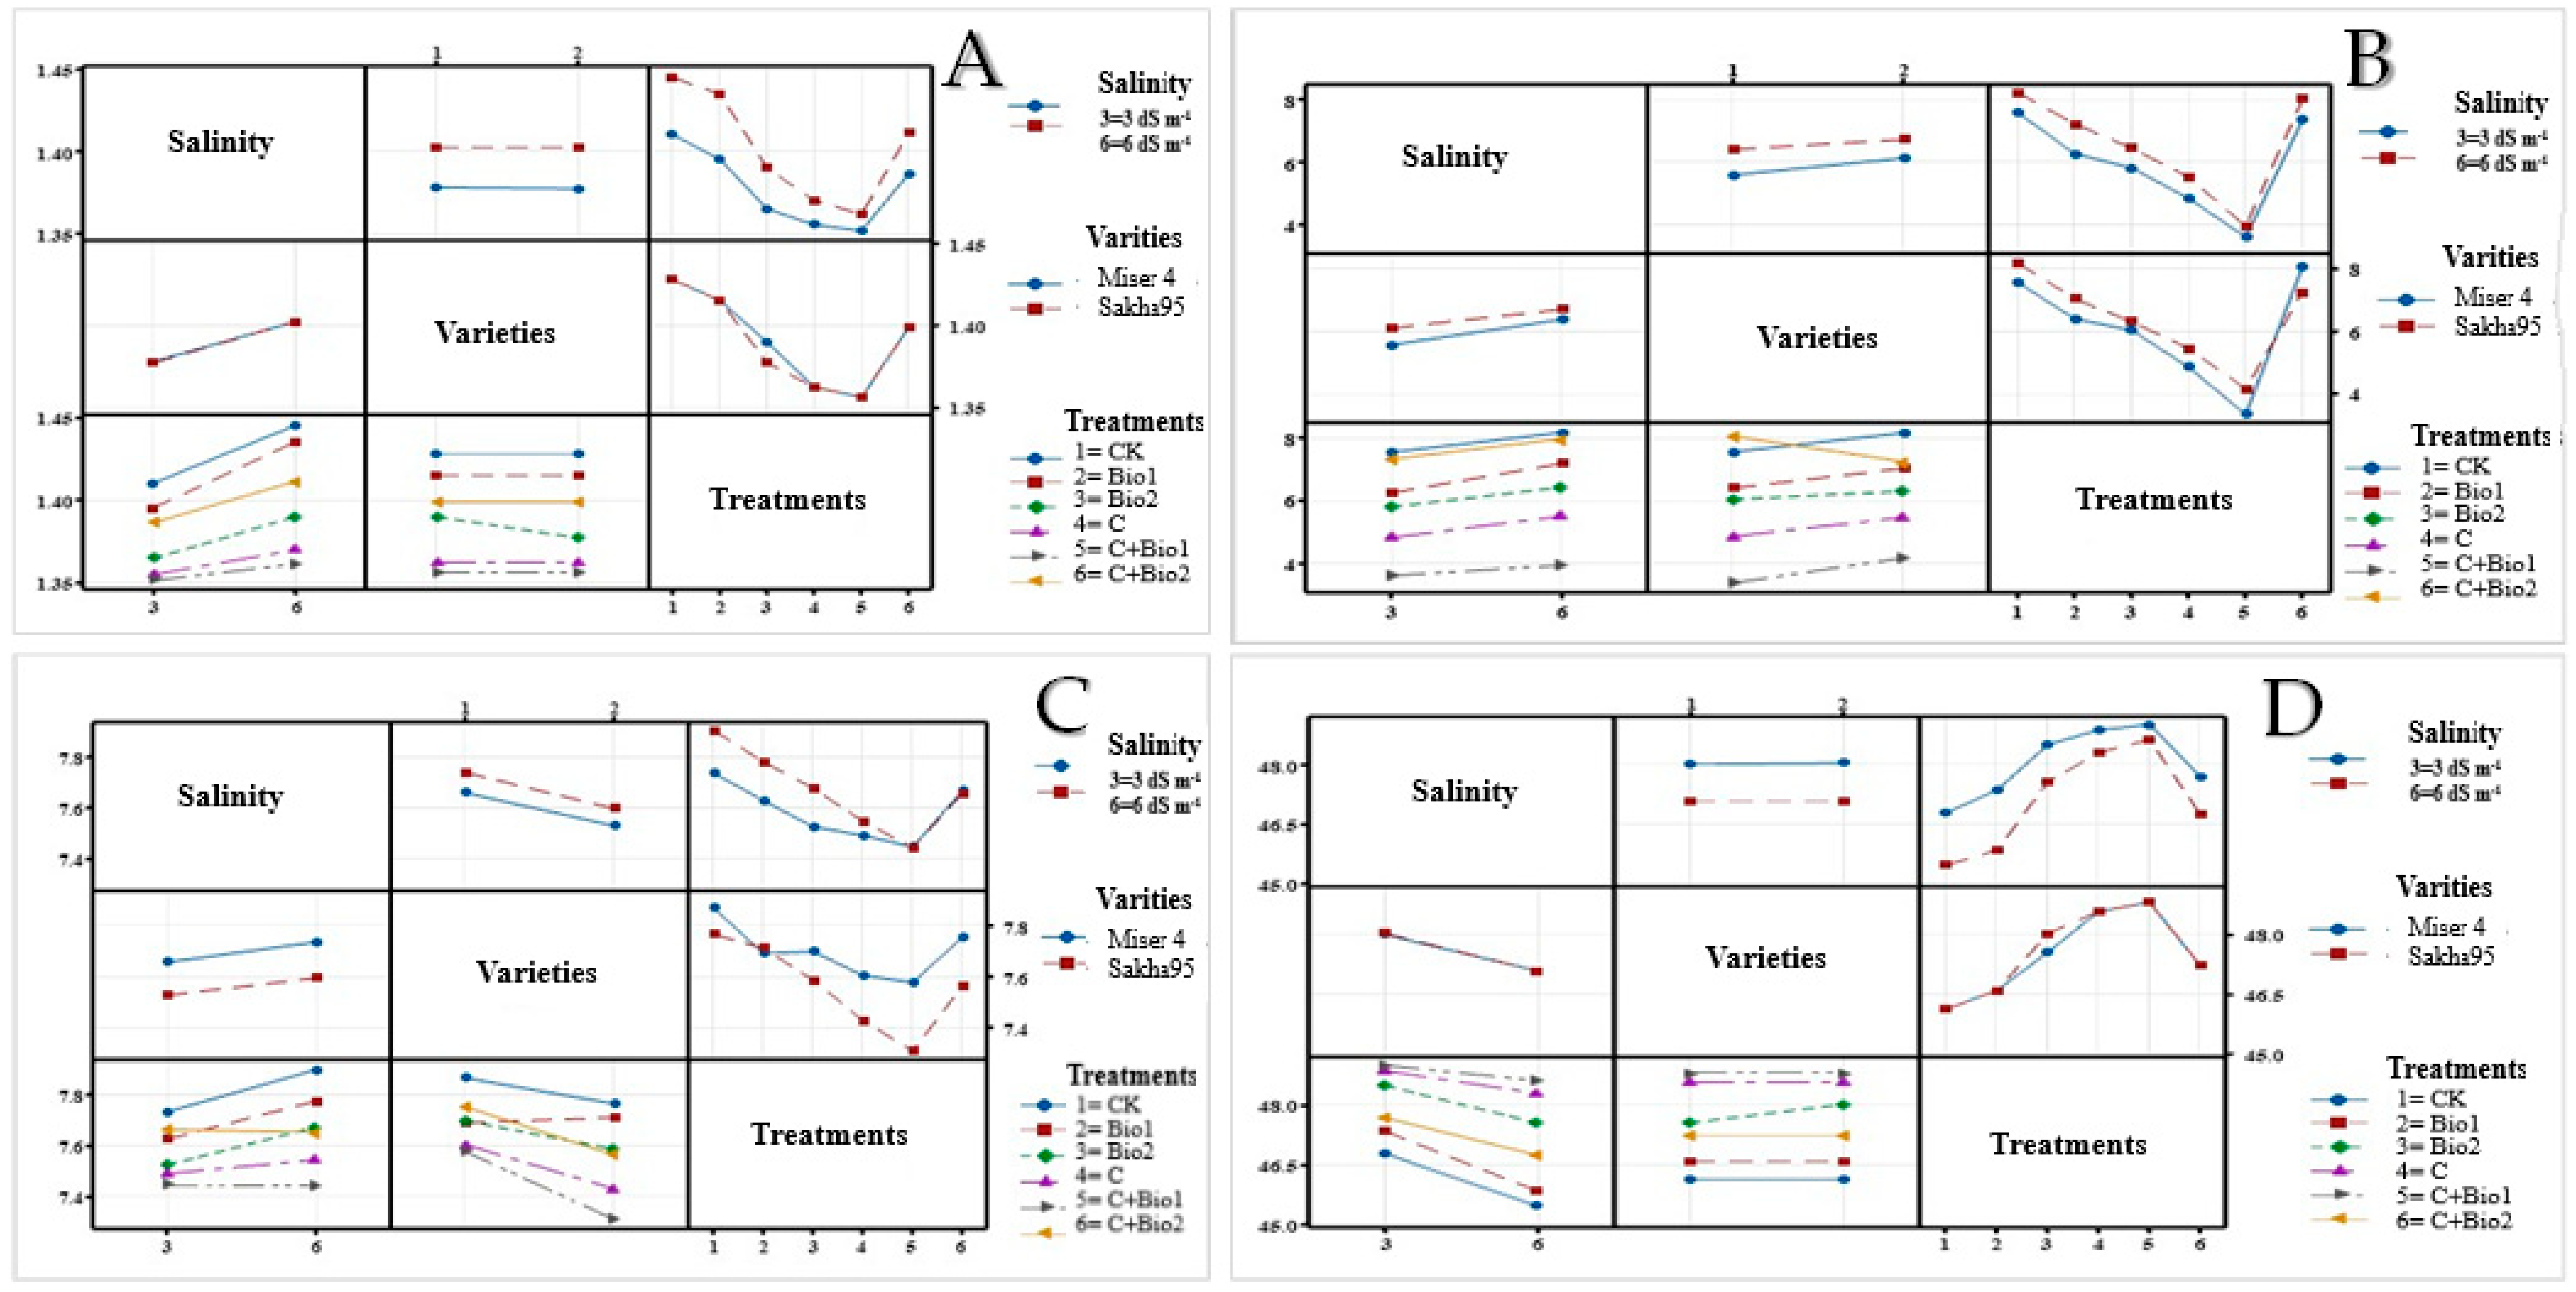
To illustrate the interaction effects of salinity levels (3 and 6 dS m−1), wheat varieties (Miser 4 and Sakha 95), and bio-organic fertilizer treatments across the two seasons on soil physico-chemical properties, Figure 5 is presented. Under both salinity levels, BD declined consistently with the application of compost combined with either A. brasilense or A. chroococcum (Figure 5A), with the greatest reduction observed at the 3 dS m−1 level. The observed decline reflects the ability of organic amendments to alleviate sodicity-induced compaction by improving aggregate stability and increasing organic carbon inputs [63]. The control treatment maintained the highest BD values, while both wheat varieties responded similarly to treatment-induced improvements. The compost and biofertilizer integration explore the dual effects as compost supplies binding agents, while beneficial microbes produce polysaccharides that cement particles together, thereby lowering BD [64]. These structural improvements are confirmed by the porosity results (Figure 5D), which followed an opposite trend to BD. Compost only or its incorporation with biofertilizer produced the highest porosity values, particularly under low salinity. Enhanced microbial activity, root proliferation, and accumulation of humified organic matter create more macropores and biopores and improve aeration then porosity amelioration [65,66]. Conversely, control soils recorded the lowest porosity, indicating less structural conditions. The improvement in porosity was slightly greater in Miser 4 than in Sakha 95, suggesting varietal variability in root–soil interactions and microbial stimulation. The EC exhibited clear sensitivity to salinity and bio-organic inputs (Figure 5B). Higher salinity irrigation water (6 dS m−1) elevated EC values across all treatments, but the application of compost and compost–biofertilizer combinations significantly decreased EC compared to the control.
This reduction indicates enhanced leaching of soluble salts due to improved infiltration and aggregation. Organic matter inputs increase soil hydraulic conductivity, while the proliferation of microbial population improves root activity and alters the ionic composition of the rhizosphere [67]. The decline was more pronounced in the Miser 4 variety, reflecting better ion regulation under stress. The pH values presented a consistent downward trend in all treatments, especially integrated compost–biofertilizer treatments (Figure 5C). The bio-organic additions shifted pH toward more neutral conditions by increasing CO2 production through microbial respiration, releasing organic acids during compost mineralization, and enhancing cation exchange processes [68]. Sakha 95 maintained slightly higher pH values compared to Miser 4, but treatment effects were stable across varieties. Across all measured soil traits, the compost and the combined compost–biofertilizer treatments both made immediate improvements in physical structure and longer-term biological activation. The residual influence of organic matter decomposition, sustained microbial colonization, and improved soil aggregation continued across seasons, contributing to enhanced soil resilience under saline–sodic irrigation.

4.2. Plant Productivity

The strong statistical significance of salinity across all growth, yield, and physiological traits in Table 3 confirms that saline irrigation water produced substantial stress on wheat plants, with osmotic and ionic toxicity clearly disrupting plant metabolism. The pronounced sensitivity of proline and peroxidase accumulation and total chlorophyll to salinity highlights their reliability as physiological indicators of salt stress, as proline acts as an osmo-protectant while chlorophyll content directly reflects photosynthetic impairment under excess salinity conditions [12,69]. Significance of variety and seasons further indicate that wheat responses to salinity are genotype-dependent and modulated by environmental variability, particularly under prolonged exposure across seasons [70]. The plant biomass including FPA, plant height, ear length, and wheat yield were further affected significantly by all factors and their interactions, indicating strong effects and that plant responses depended on both genotype and salinity level as well as the type of bio-organic fertilizers applied.
Despite the salinity and sodicity conditions, the marked improvement in growth and yield traits following bio-organic fertilization (Table 3) demonstrates the effectiveness of integrating compost with beneficial microorganisms in alleviating saline–sodic stress. The appropriate distinction of combined treatments (C+Bio1 and C+Bio2) across salinity levels reflects a synergistic mechanism whereby compost improves soil physical conditions and nutrient availability [71], while Azospirillum brasilense and Azotobacter chroococcum enhance nitrogen fixation, root development, and hormonal balance [72]. These interactions are well illustrated in saline soils, where improved root architecture and rhizosphere activity enhance water and nutrient uptake under stress [73].
Grain and straw yield responses in Table 3 and Table 4 showed clear salinity-dependent patterns, with moderate salinity (3 dS m−1) allowing higher yield expression, particularly under C+Bio2, whereas higher salinity (6 dS m−1) restricted yield potential but still responded positively to bio-organic inputs. The other traits including plant height, ear length, FPA, and HI responded with the same pattern. The higher gain yield recorded in Miser 4 compared to Sakha 95 across both seasons suggests better substantial salt tolerance and a stronger capacity to achieve improved soil and rhizosphere conditions. These results agree with previous findings that salt-tolerant genotypes benefit more from soil amendments due to their superior physiological plasticity and root activity [74]. Seasonal yield decline in the second year (Figure 4) reflects the cumulative stress of saline–sodic irrigation; however, the sustained yield enhancement under compost–biofertilizer treatments indicates a residual ameliorative effect. Organic matter decomposition, gradual improvement of soil structure, and persistence of beneficial microbial populations seemed to maintain productivity over time, particularly under higher salinity [75].
Nutrient composition data in Table 5 further illustrate the role of bio-organic treatments in mitigating salinity-induced nutritional imbalance. Salinity reduced N, P, and K concentrations in both grains and straw, consistent with restricted nutrient uptake caused by ionic competition and reduced root permeability [76]. The noticeable enhancement of NPK content under C+Bio, especially with Azotobacter chroococcum, suggests improved nitrogen availability and nutrient mobilization in the rhizosphere. Biofertilizers are known to solubilize phosphorus, improve potassium uptake, and enhance nutrient translocation under saline conditions [77]. The differential varietal responses, greater K accumulation in Miser 4 and higher N and P in Sakha 95, highlight genotype-specific nutrient regulation strategies under stress [70]. Physiological responses reinforced these trends. Increased proline accumulation under bio-organic treatments indicates enhanced osmotic adjustment and stress tolerance, particularly in Sakha 95, which appeared to rely more on biochemical defense mechanisms than Miser 4, regardless of the excessive yield in Miser 4. In contrast, the insignificant response of peroxidase activity suggests that antioxidant enzyme induction was primarily affected by salinity intensity rather than by fertilization strategy, aligning with reports that enzymatic antioxidants respond mainly to oxidative stress thresholds [78]. The substantial increase in total chlorophyll under compost–biofertilizer treatments reflects improved nitrogen nutrition and reduced ionic toxicity, leading to better photosynthetic efficiency under saline–sodic conditions [79].

4.3. The Soil–Plant Interactions

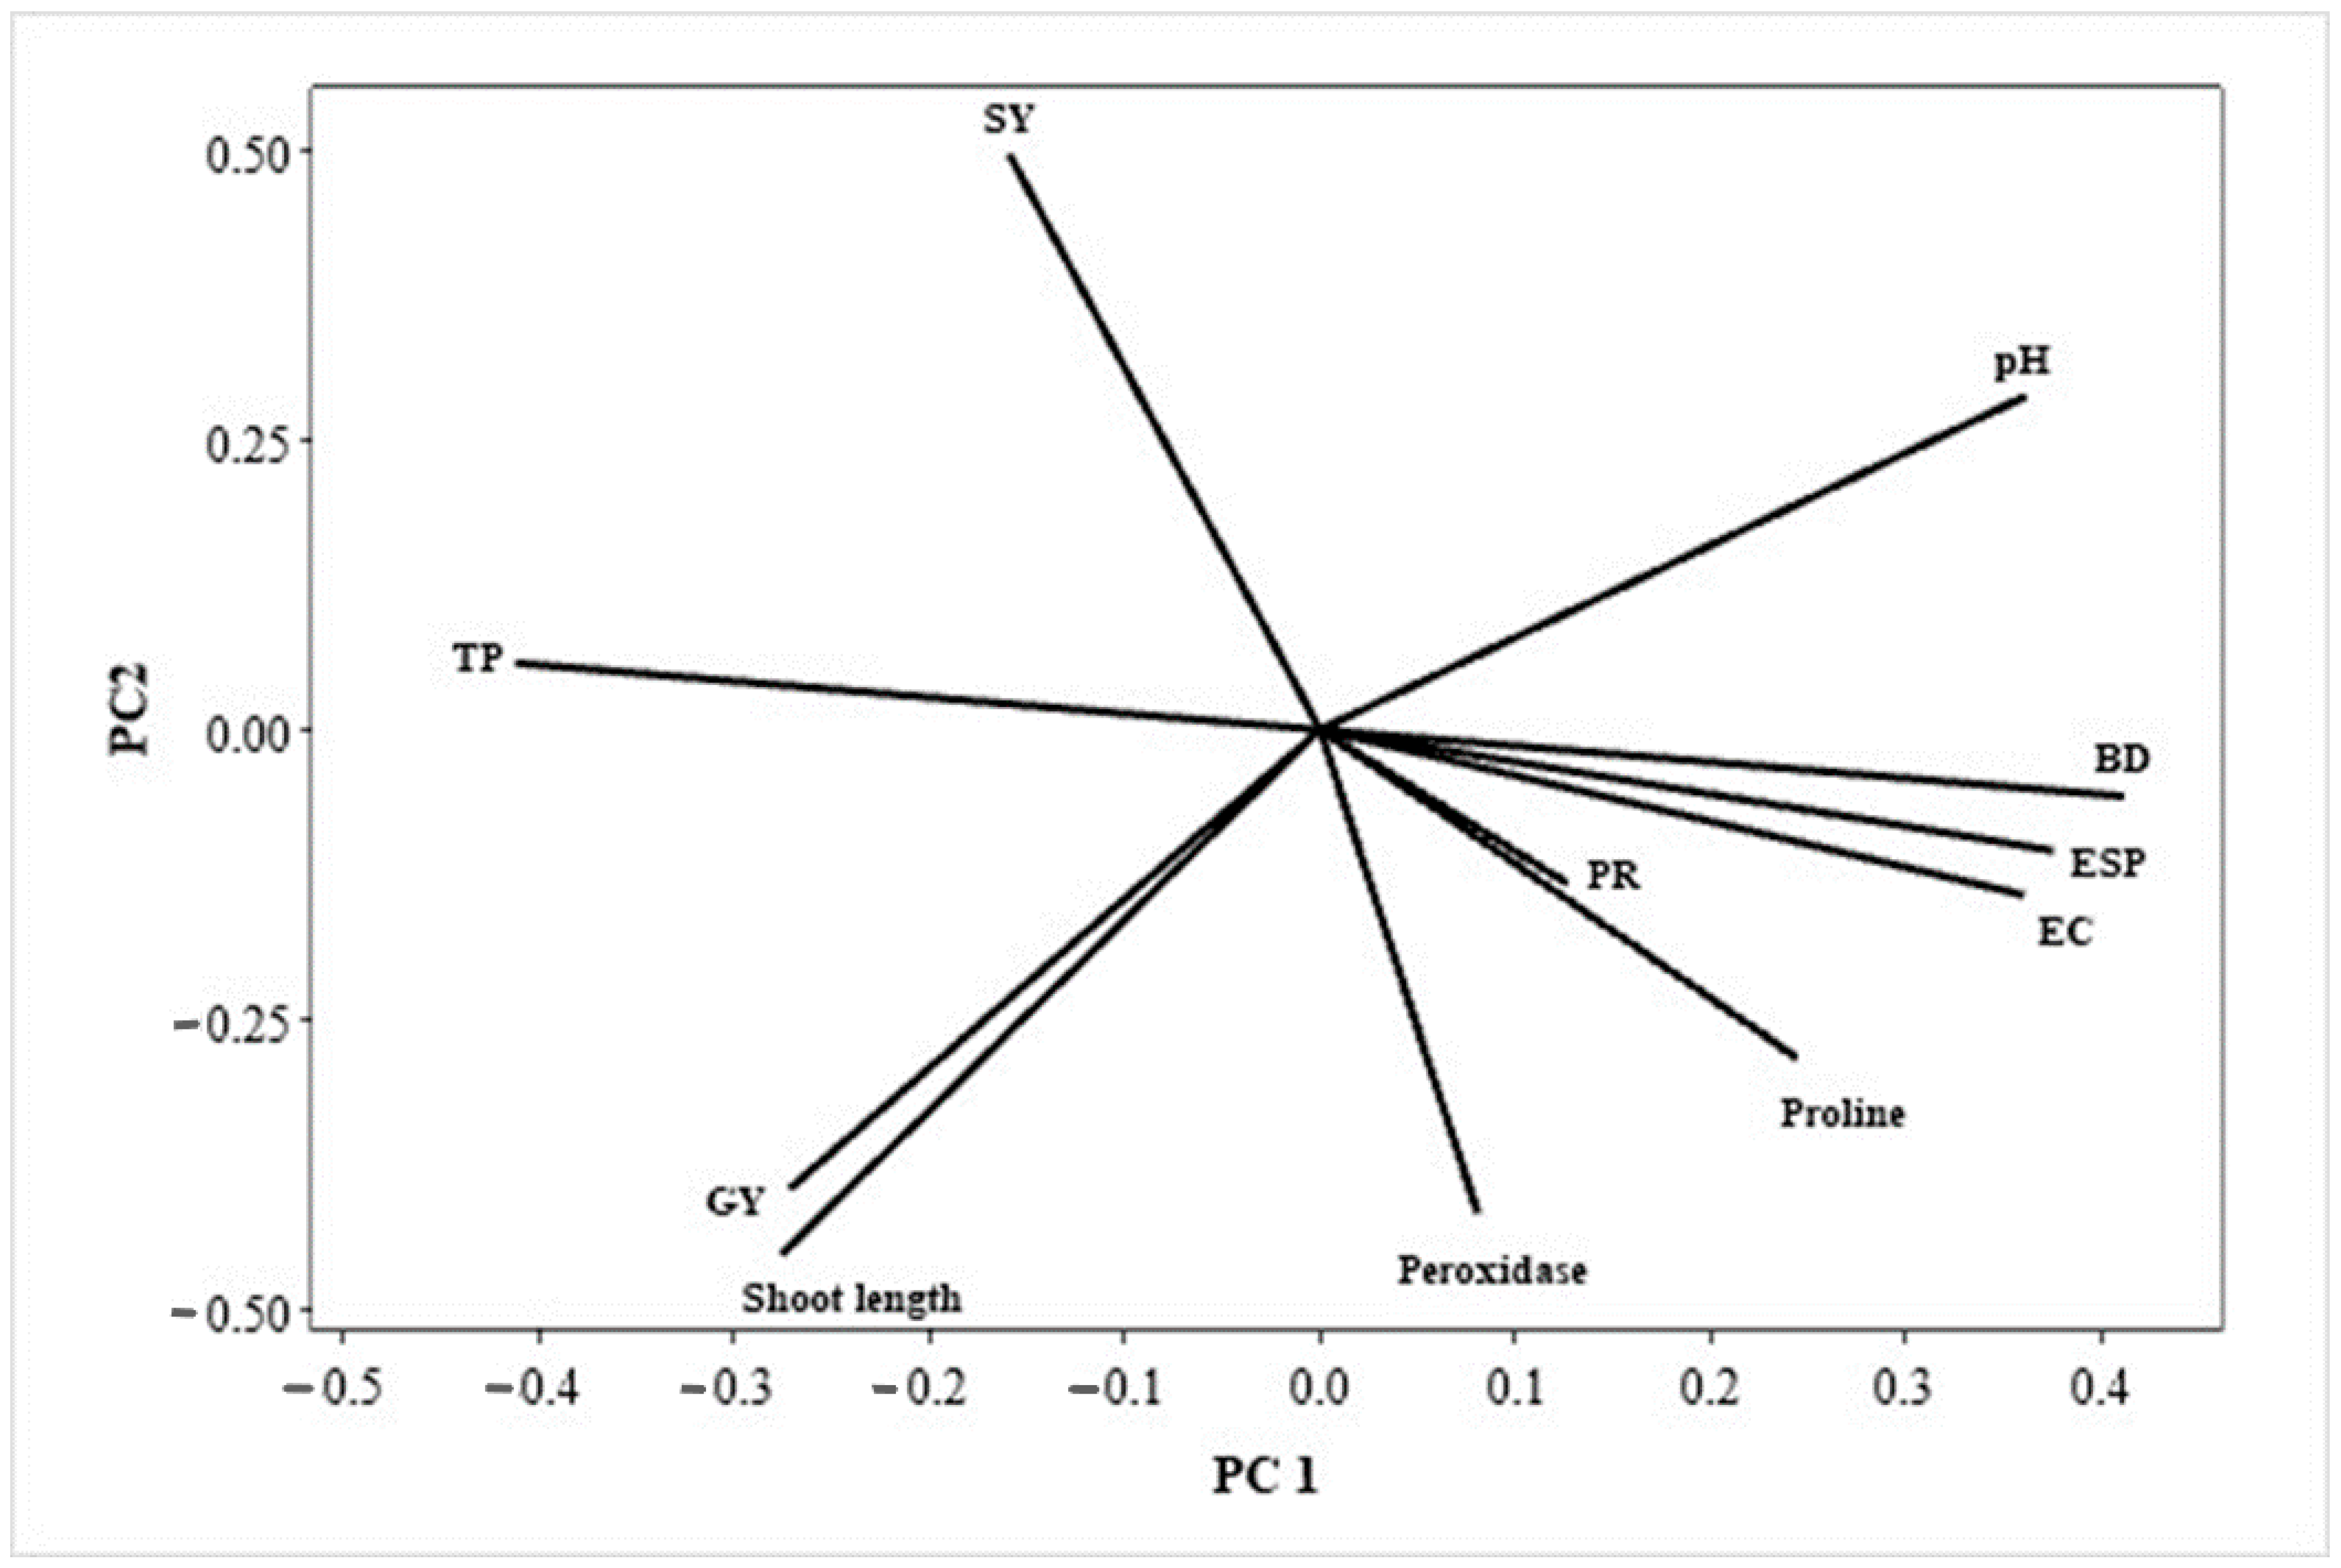
The principal component analysis (PCA) biplot (Figure 6) provides a multivariate synthesis of the relationships among soil physico-chemical properties, wheat growth and yield traits, and physiological stress indicators under saline–sodic irrigation conditions and bio-organic fertilization. The first two principal components (PC1 and PC2) display the dominant variability in the dataset, reflecting the comparable effects of salinity stress versus bio-organic amelioration previously observed across seasons and treatments. PC1 clearly separated stress-related soil and physiological variables from growth- and yield-related traits. Positive PC1 loadings were strongly associated with EC, ESP, BD, SPR, proline, and peroxidase activity. This clustering confirms that increasing salinity and sodicity developed soil structural degradation and ionic stress, which in turn triggered physiological defense responses such as osmolyte accumulation and antioxidant enzyme activation. These associations are consistent with earlier results showing that high salinity significantly increased EC, ESP, proline content, and peroxidase activity while reducing wheat growth and yield. These results reflect the roles of salinity stress mechanisms, where excessive Na+ accumulation disrupts nutrient uptake and induces oxidative stress [12,80]. In contrast, negative PC1 loadings were dominated by GY, shoot length, SY, and total porosity (TP), indicating a strong inverse relationship between soil salinity–sodicity indicators and plant productivity. This antagonistic positioning supports the yield data discussed previously, where bio-organic treatments—particularly compost combined with Azotobacter chroococcum or Azospirillum brasilense—reduced EC and ESP, improved soil structure, and enhanced wheat growth and yield. Improved porosity and reduced bulk density facilitated better root proliferation and water movement, thereby alleviating osmotic stress and improving nutrient acquisition [81,82]. PC2 further distinguished physiological performance and soil reaction from yield behavior.
Positive PC2 loadings were associated mainly with SY and soil pH, suggesting that neutral pH regulation and improved vegetative growth were linked, particularly under compost-based treatments. Conversely, negative PC2 loadings were associated with peroxidase activity and proline content, indicating clear stress responses under high saline–sodic conditions. This pattern aligns with previous findings where pH exhibited limited variability with salinity conditions, while physiological stress variables increased sharply with salinity levels. The close alignment between GY and shoot length indicates a strong positive relationship between vegetative vitality and final yield, confirming that improved early growth led to higher productivity under saline stress [9]. These observations support earlier results when bio-organic fertilization significantly enhanced plant height, FPA, chlorophyll content, and finally grain yield. Conversely, the opposing trend of yield traits related to EC, ESP, and BD highlights the dominant role of soil salinity and sodicity in declining wheat productivity. The positioning of proline and peroxidase lines near EC and ESP lines emphasizes that these biochemical responses were mainly affected by salt stress rather than by growth enhancement. This agrees with the ANOVA results showing that peroxidase was mainly affected by salinity and less responsive to fertilization treatments. Meanwhile, total chlorophyll, which was promoted under bio-organic treatments, is indirectly reflected in the PCA through its association with yield-related traits and its negative relationship with stress indicators, confirming the role of improved nutrient status and reduced ionic toxicity in maintaining photosynthetic capacity [83].
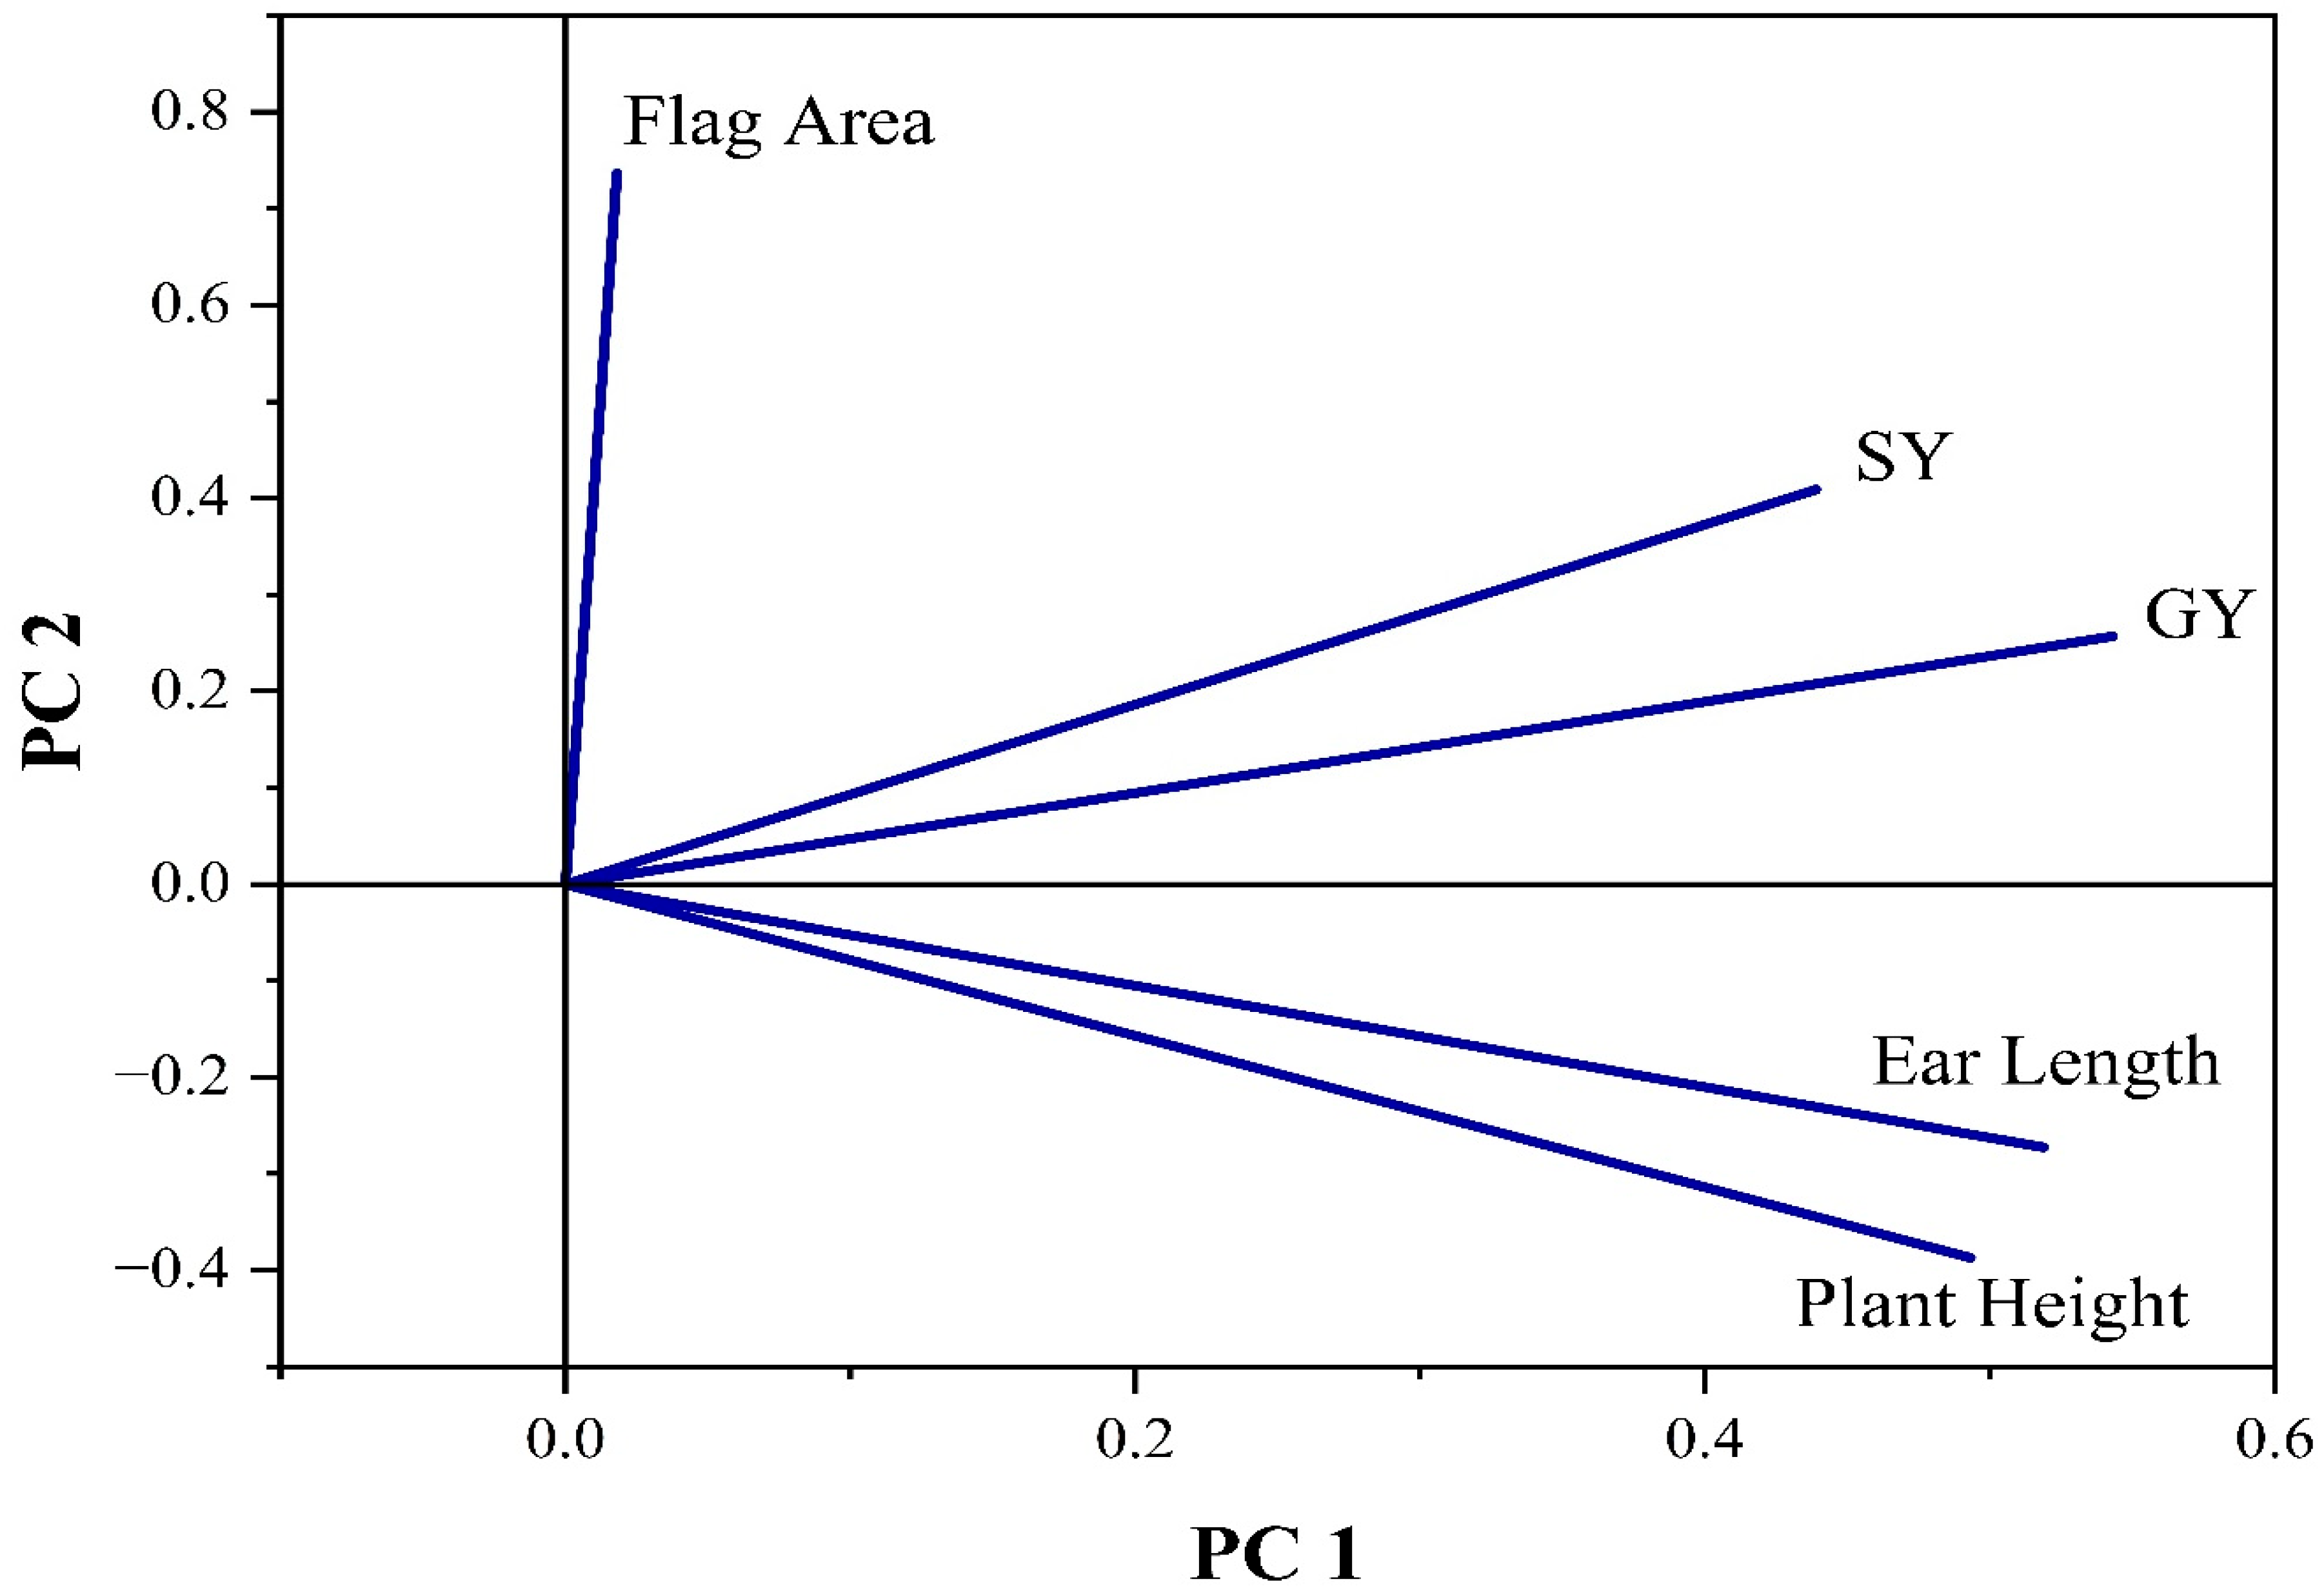
The redundancy analysis (RDA) biplot (Figure 7) further refines the multivariate relationships observed in the PCA by constraining plant growth and yield variables to their explanatory gradients. The chart reveals that GY and SY are strongly aligned along the positive direction of the first component axis, indicating that these traits are primarily driven by the same underlying growth-promoting factors identified previously under bio-organic treatments. Their close lines suggest a tight coupling between biomass accumulation and grain formation in wheat cultivated under saline–sodic conditions. Plant height and ear length load positively on PC1 but take the negative side of PC2, indicating that growth attributes respond differently to environmental gradients than leaf-level traits. In contrast, FPA is predominantly associated with PC2, implying that photosynthetic surface development is likely linked to nutrient availability, improved ionic balance, and reduced oxidative stress rather than simple biomass partitioning [84]. This observation is consistent with earlier physiological data showing that FPA and chlorophyll content were particularly sensitive to bio-organic amendments and microbial inoculation. The differences between FPA and stress-related variables previously observed in PCA confirms that bio-organic inputs alleviated salt-induced growth limitations by enhancing canopy efficiency rather than increasing plant size. This pattern reinforces the role of compost and biofertilizers in improving nitrogen availability, hormone-like activity, and root–shoot signaling under saline–sodic stress, leading to more efficient assimilate production and translocation [85,86]. Overall, the RDA confirms that yield formation under saline–sodic soils is not controlled by a single factor but emerges from coordinated improvements in vegetative growth, photosynthetic capacity, and soil physical quality induced by bio-organic amendments.
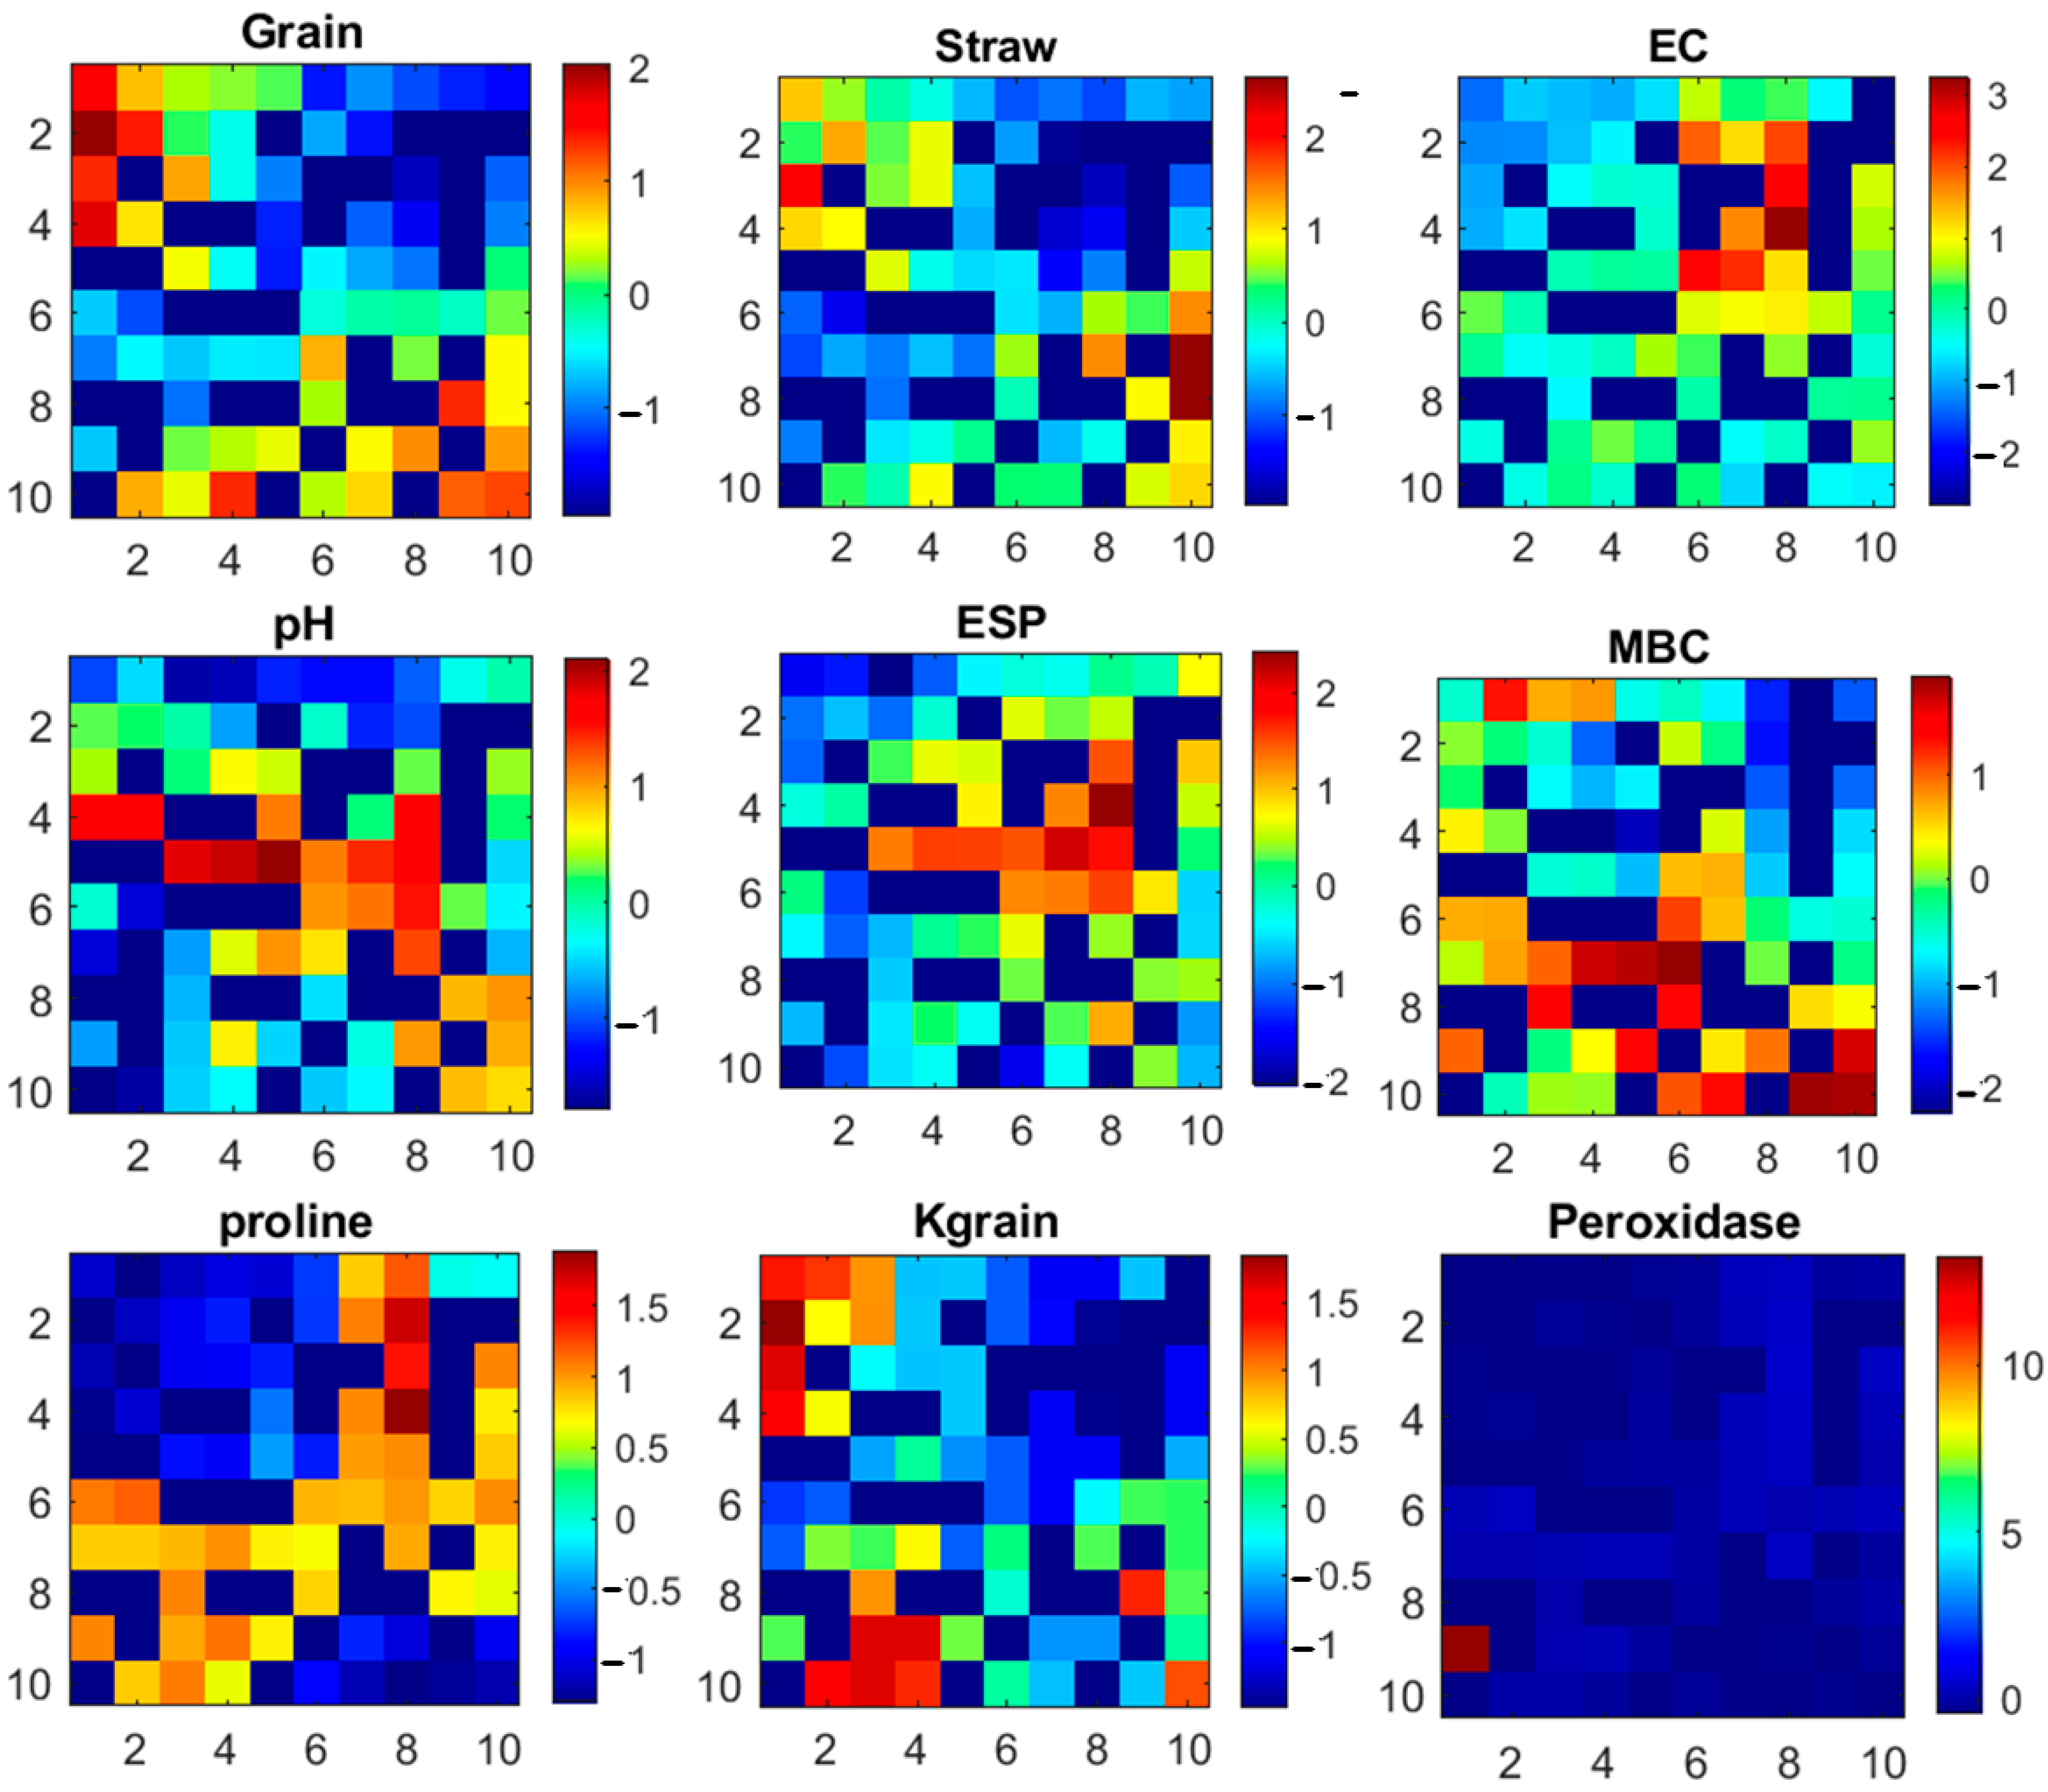
The self-organizing map (SOM) analysis (Figure 8) was applied to explore non-linear relationships among soil physicochemical properties, microbial activity, physiological parameters, and yield components across treatments, salinity levels (3 and 6 dS m−1), and seasons. SOM is an unsupervised artificial neural network that projects multidimensional data onto a two-dimensional grid while preserving similarity patterns among variables [87]. Unlike PCA and RDA, which primarily detect linear associations, SOM enables identification of complex clustering structures typical of saline–sodic agroecosystems. The SOM component planes reveal two clearly contrasting clusters. The first cluster groups grain yield, straw yield, potassium content in grain, and microbial biomass carbon (MBC), indicating strong positive associations among these variables. Their co-localization within the same high-intensity zones suggests that improved microbial activity is closely linked to enhanced nutrient availability and wheat productivity. This pattern supports the observed increases in yield under compost combined with Azotobacter chroococcum, where MBC reached 0.86 mg C g−1 soil and grain yield exceeded 4.5 t ha−1 under 3 dS m−1. The association between MBC and yield variables indicates that microbial-driven nutrient mineralization and improved rhizosphere conditions played a central role in mitigating salinity stress [88]. In contrast, a second cluster is dominated by soil EC, pH, ESP, proline content, and peroxidase activity. These variables occupy opposite regions of the SOM grid relative to yield and MBC, indicating strong negative associations. This spatial separation confirms that salinity and sodicity parameters remain the principal constraints limiting wheat productivity in the studied soil. The co-clustering of EC and ESP reflects their joint contribution to osmotic stress and structural degradation, while the grouping of proline and peroxidase activity indicates that antioxidant and osmo-protective responses were primarily driven by salinity intensity rather than fertilization treatment. This observation is consistent with ANOVA results showing salinity as the only significant factor influencing peroxidase activity [89]. Furthermore, the SOM topology demonstrates that treatments combining compost with biofertilizers consistently map within zones characterized by high yield and low salinity stress indicators across both seasons. This distribution suggests a residual and system-level stabilization effect rather than a short-term nutrient response. The persistence of favorable clusters across seasons indicates that integrated bio-organic fertilization—particularly compost combined with Azotobacter chroococcum—enhanced the functional resilience of the saline–sodic soil–plant system by simultaneously improving microbial activity, nutrient cycling, and physiological performance.
Although compost–bioorganic combinations have been previously evaluated under saline conditions, the present study uniquely integrates controlled saline irrigation, saline–sodic soil constraints, genotype comparison, multi-season residual assessment, and advanced multivariate modeling (PCA, RDA, SOM). The identification of microbial biomass carbon as a central functional mediator linking soil reclamation processes to wheat productivity under saline irrigation provides mechanistic insight beyond conventional treatment comparisons. Future investigations may incorporate molecular-level analyses of stress-responsive genes and develop predictive quantitative models linking soil biological indicators to yield performance under saline irrigation.

5. Conclusions

This two-season field experiment was conducted to evaluate the effects of saline irrigation water (3 and 6 dS m−1) on soil characteristics and wheat (Triticum aestivum L.) growth, yield, and physiological traits, grown in saline–sodic soils, and to assess the ability of compost and biofertilizers (Azospirillum brasilense and Azotobacter chroococcum), applied individually and in combination, to mitigate salinity-induced stress. Two wheat varieties, Miser 4 and Sakha 95, were compared under various bio-organic fertilization regimes, and multivariate analyses (PCA, RDA, and SOM) were employed to detect the key factors that affect wheat productivity and soil health. The results demonstrated that the compost integrated with biofertilizers improved soil properties: EC decreased by up to 40%, ESP by 24%, while OM and MBC increased by 66.25% and 91.1% compared to the control, respectively, indicating enhancement of soil fertility. Bulk density decreased compared to the control by approximately 5%, and SPR was reduced under bio-organic treatments, particularly in Miser 4. The C+Bio2 treatment showed positive effects in enhancing total soil bacterial counts in both seasons with both wheat varieties compared to the control treatment. The Miser 4 variety showed increments of total bacterial counts averaging 6.45 and 4.42 CFU and total fungal counts of 3.52 and 2.71 CFU under 3 and 6 dS m−1 respectively across seasons over the untreated treatment. Salinity severely reduced wheat performance, with grain yield declining by up to 48.61% in Sakha 95 under 6 dS m−1 across seasons compared to the 3 dS m−1 level. In contrast, integrated bio-organic treatments markedly alleviated these negative effects. The combination of compost and Azotobacter chroococcum (C+Bio2) achieved the highest grain yield, reaching 4.66 t ha−1 under 3 dS m−1 for Miser 4, representing a 77.86% increase over the control, and significantly enhanced straw yield, plant height, ear length, FLA, and total chlorophyll content. Multivariate analyses revealed strong positive correlations between microbial activity, nutrient availability, and yield traits, while salinity stress indicators, such as proline, EC, and ESP, were negatively associated with productivity. Self-organizing maps further confirmed the synergistic interactions between compost and biofertilizers in enhancing soil–plant resilience under saline irrigation. The integration of multivariate and neural mapping techniques demonstrates that bio-organic fertilization induces a system-level functional shift in saline–sodic soils irrigated with saline water, rather than merely providing short-term yield enhancement. Although the results from the two-year field trials provide clear evidence of the observed treatment effects, we acknowledge that additional years of data would help capture inter-annual variability in climate, soil conditions, and other environmental factors. Future studies including at least three years of field data would further enhance the generalizability and reliability of the conclusions drawn from this research. Overall, this study demonstrates that integrated bio-organic fertilization can significantly mitigate the adverse effects of saline irrigation in saline–sodic soils, improve wheat productivity, and enhance soil health, with both immediate and residual benefits across successive growing seasons. The findings provide a practical framework for sustainable wheat cultivation in salt-affected regions, particularly in areas reliant on saline or brackish water.

Author Contributions

Conceptualization, M.M.M.G.A., M.K.E. and M.M.A.S.; methodology, M.M.M.G.A., M.E.-S. and M.M.A.S.; software, M.O.A., H.A.S.A., M.M.A.S. and M.E.-S.; validation, I.E.-A., M.K.E. and M.M.M.G.A.; formal analysis, M.M.M.G.A., M.K.E. and M.M.A.S.; investigation, M.O.A., I.E.-A. and M.E.-S.; resources, M.O.A., H.A.S.A., M.M.A.S. and M.E.-S.; data curation, M.M.M.G.A., I.E.-A., M.K.E. and M.E.-S.; writing—original draft preparation, M.K.E., I.E.-A., M.M.A.S. and M.E.-S.; writing—review and editing, M.O.A., H.A.S.A., M.M.A.S. and M.E.-S.; visualization, M.M.M.G.A., I.E.-A., M.K.E. and M.M.A.S.; supervision, M.M.A.S. and M.E.-S.; project administration, M.O.A., H.A.S.A., M.M.A.S. and M.M.M.G.A.; funding acquisition, M.E.-S., H.A.S.A. and M.O.A. All authors have read and agreed to the published version of the manuscript.

Funding

This work was supported by Princess Nourah bint Abdulrahman University Researchers Supporting Project number (PNURSP2026R101), Princess Nourah bint Abdulrahman University, Riyadh, Saudi Arabia.

Institutional Review Board Statement

Not applicable.

Informed Consent Statement

Not applicable.

Data Availability Statement

The datasets used and analyzed during the current study are available from the corresponding authors on reasonable request.

Acknowledgments

The author would like to thank Soil and Water Department, Faculty of Agriculture, Tanta University, Egypt. This work is also supported by the Institute of Soils, Water and Environment Research (SWERI), Agricultural Research Center. Authors are grateful to Princess Nourah bint Abdulrahman University Researchers Supporting Project number (PNURSP2026R101), Princess Nourah bint Abdulrahman University, Riyadh, Saudi Arabia.

Conflicts of Interest

The authors declare no conflicts of interest.

References

  1. Daba, A.W. Rehabilitation of Soil Salinity and Sodicity Using Diverse Amendments and Plants: A Critical Review. Discov. Environ. 2025, 3, 53. [Google Scholar] [CrossRef]
  2. Abdelrady, W.A.; Ma, Z.; Elshawy, E.E.; Wang, L.; Askri, S.M.H.; Ibrahim, Z.; Dennis, E.; Kanwal, F.; Zeng, F.; Shamsi, I.H. Physiological and Biochemical Mechanisms of Salt Tolerance in Barley under Salinity Stress. Plant Stress 2024, 11, 100403. [Google Scholar] [CrossRef]
  3. Minhas, P.S.; Qadir, M. Effects of Irrigation with Saline, Saline-Sodic and Alkali Waters on Soils. In Irrigation Sustainability with Saline and Alkali Waters: Extent, Impacts and Management Guidelines; Minhas, P.S., Qadir, M., Eds.; Springer Nature: Singapore, 2024; pp. 69–110. ISBN 978-981-97-4102-1. [Google Scholar]
  4. Abuzaid, A.S.; El-Komy, M.S.; Shokr, M.S.; El Baroudy, A.A.; Mohamed, E.S.; Rebouh, N.Y.; Abdel-Hai, M.S. Predicting Dynamics of Soil Salinity and Sodicity Using Remote Sensing Techniques: A Landscape-Scale Assessment in the Northeastern Egypt. Sustainability 2023, 15, 9440. [Google Scholar] [CrossRef]
  5. Hussain, M.I.; Farooq, M.; Muscolo, A.; Rehman, A. Crop Diversification and Saline Water Irrigation as Potential Strategies to Save Freshwater Resources and Reclamation of Marginal Soils—A Review. Environ. Sci. Pollut. Res. 2020, 27, 28695–28729. [Google Scholar] [CrossRef]
  6. Su, Y.; Cui, Y.-J.; Dupla, J.-C.; Canou, J. Soil-Water Retention Behaviour of Fine/Coarse Soil Mixture with Varying Coarse Grain Contents and Fine Soil Dry Densities. Can. Geotech. J. 2021, 59, 291–299. [Google Scholar] [CrossRef]
  7. Meng, G.; Zhu, G.; Jiao, Y.; Qiu, D.; Wang, Y.; Lu, S.; Li, R.; Liu, J.; Chen, L.; Wang, Q.; et al. Soil Salinity Patterns Reveal Changes in the Water Cycle of Inland River Basins in Arid Zones. Hydrol. Earth Syst. Sci. 2025, 29, 5049–5063. [Google Scholar] [CrossRef]
  8. Chele, K.H.; Tinte, M.M.; Piater, L.A.; Dubery, I.A.; Tugizimana, F. Soil Salinity, a Serious Environmental Issue and Plant Responses: A Metabolomics Perspective. Metabolites 2021, 11, 724. [Google Scholar] [CrossRef]
  9. EL Sabagh, A.; Islam, M.S.; Skalicky, M.; Ali Raza, M.; Singh, K.; Anwar Hossain, M.; Hossain, A.; Mahboob, W.; Iqbal, M.A.; Ratnasekera, D.; et al. Salinity Stress in Wheat (Triticum aestivum L.) in the Changing Climate: Adaptation and Management Strategies. Front. Agron. 2021, 3, 661932. [Google Scholar] [CrossRef]
  10. Farooq, M.; Zahra, N.; Ullah, A.; Nadeem, F.; Rehman, A.; Kapoor, R.; Al-Hinani, M.S.; Siddique, K.H.M. Salt Stress in Wheat: Effects, Tolerance Mechanisms, and Management. J. Soil Sci. Plant Nutr. 2024, 24, 8151–8173. [Google Scholar] [CrossRef]
  11. ur Rehman, S.; Yang, J.; Zhang, J.; Zhang, L.; Hao, X.; Song, R.; Chen, S.; Wang, G.; Hua, L. Salt Stress in Wheat: A Physiological and Genetic Perspective. Plant Stress 2025, 16, 100832. [Google Scholar] [CrossRef]
  12. Munns, R.; Tester, M. Mechanisms of Salinity Tolerance. Annu. Rev. Plant Biol. 2008, 59, 651–681. [Google Scholar] [CrossRef] [PubMed]
  13. Hasanuzzaman, M.; Raihan, M.R.; Masud, A.A.; Rahman, K.; Nowroz, F.; Rahman, M.; Nahar, K.; Fujita, M. Regulation of Reactive Oxygen Species and Antioxidant Defense in Plants under Salinity. Int. J. Mol. Sci. 2021, 22, 9326. [Google Scholar] [CrossRef] [PubMed]
  14. Luo, P.; Feng, X.; Liu, S.; Jiang, Y. Traditional Uses, Phytochemistry, Pharmacology and Toxicology of Ruta graveolens L.: A Critical Review and Future Perspectives. Drug Des. Devel. Ther. 2024, 18, 6459–6485. [Google Scholar] [CrossRef]
  15. Wang, F.; Zhang, J.; Hu, J.; Wang, H.; Zeng, Y.; Wang, Y.; Huang, P.; Deng, H.; Dahlgren, R.A.; Gao, H.; et al. Simultaneous Suppression of As Mobilization and N2O Emission from NH4+/As-Rich Paddy Soils by Combined Nitrate and Birnessite Amendment. J. Hazard. Mater. 2024, 465, 133451. [Google Scholar] [CrossRef]
  16. Bello, S.K.; Alayafi, A.H.; AL-Solaimani, S.G.; Abo-Elyousr, K.A.M. Mitigating Soil Salinity Stress with Gypsum and Bio-Organic Amendments: A Review. Agronomy 2021, 11, 1735. [Google Scholar] [CrossRef]
  17. Hoque, M.N.; Imran, S.; Hannan, A.; Paul, N.C.; Mahamud, M.A.; Chakrobortty, J.; Sarker, P.; Irin, I.J.; Brestic, M.; Rhaman, M.S. Organic Amendments for Mitigation of Salinity Stress in Plants: A Review. Life 2022, 12, 1632. [Google Scholar] [CrossRef] [PubMed]
  18. Cogger, C.G. Potential Compost Benefits for Restoration Of Soils Disturbed by Urban Development. Compost Sci. Util. 2005, 13, 243–251. [Google Scholar] [CrossRef]
  19. Carter, M.R.; Sanderson, J.B.; MacLeod, J.A. Influence of Compost on the Physical Properties and Organic Matter Fractions of a Fine Sandy Loam throughout the Cycle of a Potato Rotation. Can. J. Soil Sci. 2004, 84, 211–218. [Google Scholar] [CrossRef]
  20. Khoso, M.A.; Wagan, S.; Alam, I.; Hussain, A.; Ali, Q.; Saha, S.; Poudel, T.R.; Manghwar, H.; Liu, F. Impact of Plant Growth-Promoting Rhizobacteria (PGPR) on Plant Nutrition and Root Characteristics: Current Perspective. Plant Stress 2024, 11, 100341. [Google Scholar] [CrossRef]
  21. Al-Turki, A.; Murali, M.; Omar, A.F.; Rehan, M.; Sayyed, R.Z. Recent Advances in PGPR-Mediated Resilience toward Interactive Effects of Drought and Salt Stress in Plants. Front. Microbiol. 2023, 14, 1214845. [Google Scholar] [CrossRef]
  22. Zeng, Y.; Wang, H.; Hu, J.; Zhang, J.; Wang, F.; Wang, T.; Zhou, Q.; Dahlgren, R.A.; Gao, M.; Gao, H.; et al. Illuminated Fulvic Acid Stimulates Denitrification and As(III) Immobilization in Flooded Paddy Soils via an Enhanced Biophotoelectrochemical Pathway. Sci. Total Environ. 2024, 912, 169670. [Google Scholar] [CrossRef]
  23. Addisu, A.; Molla, E.; Dereje, G. Responses of Soil Properties and Yield of Bread Wheat to Compost and Lime Application on Acidic Soils of Banja District Northwestern Ethiopia. Discov. Agric. 2025, 3, 32. [Google Scholar] [CrossRef]
  24. Difco, L. Difco Manual of Dehydrated Culture Media and Reagents for Microbiological and Clinical Laboratory Procedures, 9th ed.; Digestive Ferments Company; Difco Laboratories: Detroit, MI, USA, 1953. [Google Scholar]
  25. Scheldrick, B.H. Particle Size Distribution. In Soil Sampling and Methods of Analysis; Lewis Publishers: Boca Raton, FL, USA, 1993; pp. 499–512. [Google Scholar]
  26. Briggs, D.J. Soils: Sources and Methods in Geography; Butterworths: Washington, DC, USA, 1977; ISBN 0408709111. [Google Scholar]
  27. Herrick, J.E.; Jones, T.L. A Dynamic Cone Penetrometer for Measuring Soil Penetration Resistance. Soil Sci. Soc. Am. J. 2002, 66, 1320–1324. [Google Scholar] [CrossRef]
  28. Nelson, D.W.; Sommers, L.E. Total Carbon, Organic Carbon, and Organic Matter. In Methods of Soil Analysis: Part 3 Chemical Methods; Soil Science Society of America, Inc.: Madison, WI, USA, 1996; Volume 5, pp. 961–1010. [Google Scholar]
  29. Soil, S.S. Keys to Soil Taxonomy; Government Printing Office: Washington, DC, USA, 2014.
  30. Olsen, S.R. Estimation of Available Phosphorus in Soils by Extraction with Sodium Bicarbonate; US Department of Agriculture: Washington, DC, USA, 1954.
  31. Page, A.L.; Miller, R.H.; Keeney, D.R. Methods of Soil Analysis: Part 2 Chemical and Microbiological Properties; Agronomy Monographs; American Society of Agronomy: Madison, WI, USA, 1983. [Google Scholar]
  32. El-Sharkawy, M.; EL-Aziz, M.A.; Khalifa, T. Effect of Nano-Zinc Application Combined with Sulfur and Compost on Saline-Sodic Soil Characteristics and Faba Bean Productivity. Arab. J. Geosci. 2021, 14, 1178. [Google Scholar] [CrossRef]
  33. Metho, L.A.; Hammes, P.S. The Harvest Index of Individual Ears of Four South African Wheat (Triticum aestivum L.) Cultivars. S. Afr. J. Plant Soil 2000, 17, 144–146. [Google Scholar] [CrossRef]
  34. Chapman, H.D.; Pratt, P.F. Method of Analysis for Soils, Plants and Waters, University of California (Riverside) Division of Agriculture Sciences; University of California: Berkeley, CA, USA, 1961. [Google Scholar]
  35. Cottenie, A.; Verloo, M.; Kiekens, L. Chemical Analysis of Plants and Soils; Laboratory of Analytical and Agrochemistry: Gent, Belgium, 1982; Volume 42. [Google Scholar]
  36. Bates, L.S.; Waldren, R.P.; Teare, I.D. Rapid Determination of Free Proline for Water-Stress Studies. Plant Soil 1973, 39, 205–207. [Google Scholar] [CrossRef]
  37. Kar, M.; Mishra, D. Catalase, Peroxidase, and Polyphenoloxidase Activities during Rice Leaf Senescence 1. Plant Physiol. 1976, 57, 315–319. [Google Scholar] [CrossRef]
  38. Leogrande, R.; Vitti, C. Use of Organic Amendments to Reclaim Saline and Sodic Soils: A Review. Arid L. Res. Manag. 2019, 33, 1–21. [Google Scholar] [CrossRef]
  39. Peng, Y.; Zhang, H.; Lian, J.; Zhang, W.; Li, G.; Zhang, J. Combined Application of Organic Fertilizer with Microbial Inoculum Improved Aggregate Formation and Salt Leaching in a Secondary Salinized Soil. Plants 2023, 12, 2945. [Google Scholar] [CrossRef]
  40. Peng, Y.; Zhang, H.; Li, G.; Zhang, J. Microbial Inoculum Improved Soil Aggregate Formation and Increased Cucumber Yield in a Greenhouse under Secondary Salinization Conditions. J. Environ. Manag. 2025, 376, 124576. [Google Scholar] [CrossRef] [PubMed]
  41. Li, R.; Tao, R.; Ling, N.; Chu, G. Chemical, Organic and Bio-Fertilizer Management Practices Effect on Soil Physicochemical Property and Antagonistic Bacteria Abundance of a Cotton Field: Implications for Soil Biological Quality. Soil Tillage Res. 2017, 167, 30–38. [Google Scholar] [CrossRef]
  42. Celik, I.; Gunal, H.; Budak, M.; Akpinar, C. Effects of Long-Term Organic and Mineral Fertilizers on Bulk Density and Penetration Resistance in Semi-Arid Mediterranean Soil Conditions. Geoderma 2010, 160, 236–243. [Google Scholar] [CrossRef]
  43. Ma, S.; Cao, Y.; Lu, J.; Ren, T.; Cong, R.; Lu, Z.; Zhu, J.; Li, X. Response of Soil Aggregation and Associated Organic Carbon to Organic Amendment and Its Controls: A Global Meta-Analysis. Catena 2024, 237, 107774. [Google Scholar] [CrossRef]
  44. Yu, Z.; Zhang, J.; Zhang, C.; Xin, X.; Li, H. The Coupling Effects of Soil Organic Matter and Particle Interaction Forces on Soil Aggregate Stability. Soil Tillage Res. 2017, 174, 251–260. [Google Scholar] [CrossRef]
  45. Zhao, H.; Li, J.; Li, X.; Hu, Q.; Guo, X.; Wang, Y.; Zhao, Y.; Gan, G.Y. Response of Soil Organic Carbon and Bacterial Community to Amendments in Saline-Alkali Soils of the Yellow River Delta. Eur. J. Soil Sci. 2025, 76, e70147. [Google Scholar] [CrossRef]
  46. Zhang, G.; Bai, J.; Jia, J.; Wang, W.; Wang, D.; Zhao, Q.; Wang, C.; Chen, G. Soil Microbial Communities Regulate the Threshold Effect of Salinity Stress on SOM Decomposition in Coastal Salt Marshes. Fundam. Res. 2023, 3, 868–879. [Google Scholar] [CrossRef] [PubMed]
  47. Wong, V.N.L.; Dalal, R.C.; Greene, R.S.B. Carbon Dynamics of Sodic and Saline Soils Following Gypsum and Organic Material Additions: A Laboratory Incubation. Appl. Soil Ecol. 2009, 41, 29–40. [Google Scholar] [CrossRef]
  48. Rezapour, S.; Nouri, A.; Asadzadeh, F.; Qin, R.; Erpul, G. Integrated Organochemical—Microbial Solutions Remediate Degraded Saline-Sodic Soils. Int. Soil Water Conserv. Res. 2025, 13, 992–1007. [Google Scholar] [CrossRef]
  49. Mi, W.; Sun, Y.; Xia, S.; Zhao, H.; Mi, W.; Brookes, P.C.; Liu, Y.; Wu, L. Effect of Inorganic Fertilizers with Organic Amendments on Soil Chemical Properties and Rice Yield in a Low-Productivity Paddy Soil. Geoderma 2018, 320, 23–29. [Google Scholar] [CrossRef]
  50. Chenu, C.; Cosentino, D. Microbial Regulation of Soil Structural Dynamics. In The Architecture and Biology of Soils; Ritz, E., Young, I., Eds.; CAB International: Oxfordshire, UK, 2011; pp. 37–70. [Google Scholar] [CrossRef]
  51. Elmeknassi, M.; Elghali, A.; de Carvalho, H.W.P.; Laamrani, A.; Benzaazoua, M. A Review of Organic and Inorganic Amendments to Treat Saline-Sodic Soils: Emphasis on Waste Valorization for a Circular Economy Approach. Sci. Total Environ. 2024, 921, 171087. [Google Scholar] [CrossRef]
  52. Bastida, F.; Kandeler, E.; Hernández, T.; García, C. Long-Term Effect of Municipal Solid Waste Amendment on Microbial Abundance and Humus-Associated Enzyme Activities Under Semiarid Conditions. Microb. Ecol. 2008, 55, 651–661. [Google Scholar] [CrossRef]
  53. Wu, L.; Zhang, S.; Ma, R.; Chen, M.; Wei, W.; Ding, X. Carbon Sequestration under Different Organic Amendments in Saline-Alkaline Soils. Catena 2021, 196, 104882. [Google Scholar] [CrossRef]
  54. Tao, W.-Q.; Wu, Q.-Q.; Zhang, J.; Chang, T.-T.; Liu, X.-N. Effects of Applying Organic Amendments on Soil Aggregate Structure and Tomato Yield in Facility Agriculture. Plants 2024, 13, 3064. [Google Scholar] [CrossRef]
  55. Guo, L.; Nie, Z.; Zhou, J.; Zhang, S.; An, F.; Zhang, L.; Tóth, T.; Yang, F.; Wang, Z. Effects of Different Organic Amendments on Soil Improvement, Bacterial Composition, and Functional Diversity in Saline–Sodic Soil. Agronomy 2022, 12, 2294. [Google Scholar] [CrossRef]
  56. Wang, M.; Zhao, S.; Wang, L.; Chen, S.; Li, S.; Lei, X.; Sun, X.; Qin, L. Salt Stress-Induced Changes in Microbial Community Structures and Metabolic Processes Result in Increased Soil Cadmium Availability. Sci. Total Environ. 2021, 782, 147125. [Google Scholar] [CrossRef]
  57. Zambelli, A.; Nocito, F.F.; Araniti, F. Unveiling the Multifaceted Roles of Root Exudates: Chemical Interactions, Allelopathy, and Agricultural Applications. Agronomy 2025, 15, 845. [Google Scholar] [CrossRef]
  58. Zhang, Y.; Du, Y.; Mu, Z.; Islam, W.; Zeng, F.; Gonzalez, N.C.T.; Zhang, Z. Impact of Seasonal Changes on Root-Associated Microbial Communities among Phreatophytes of Three Basins in Desert Ecosystem. Front. Plant Sci. 2025, 16, 1554879. [Google Scholar] [CrossRef]
  59. Prajapati, P.; Yadav, M.; Nishad, J.H.; Gautam, V.S.; Kharwar, R.N. Salt Tolerant Fungal Endophytes Alleviate the Growth and Yield of Saline-Affected Wheat Genotype PBW-343. Microbiol. Res. 2024, 278, 127514. [Google Scholar] [CrossRef]
  60. Gupta, S.; Schillaci, M.; Walker, R.; Smith, P.M.C.; Watt, M.; Roessner, U. Alleviation of Salinity Stress in Plants by Endophytic Plant-Fungal Symbiosis: Current Knowledge, Perspectives and Future Directions. Plant Soil 2021, 461, 219–244. [Google Scholar] [CrossRef]
  61. Yang, M.; Zhang, Y.; Tan, X.; Li, L.; OuYang, Q.; Tao, N. Sodium Cuminate Inhibits the Mycelial Growth of Penicillium Digitatum by Inducing Oxidative Stress and Damaging the Cell Membrane. J. Fungi 2025, 11, 612. [Google Scholar] [CrossRef] [PubMed]
  62. Mao, X.; Yang, Y.; Guan, P.; Geng, L.; Ma, L.; Di, H.; Liu, W.; Li, B. Remediation of Organic Amendments on Soil Salinization: Focusing on the Relationship between Soil Salts and Microbial Communities. Ecotoxicol. Environ. Saf. 2022, 239, 113616. [Google Scholar] [CrossRef]
  63. Sree, S.S.; Al-zharani, M.; Nasr, F.A.; Alneghery, L.M.; Kumar, T.T.A.; Sureshkumar, B.T.; Mohamed, J.M.M.; Ravichandran, M.; Dineshkumar, R. Innovative Bio-Amelioration Strategies for Sustainable Reclamation of Salt-Affected Agroecosystems: A Review. Plant Soil 2025, 516, 67–114. [Google Scholar] [CrossRef]
  64. Prisa, D.; Fresco, R.; Spagnuolo, D. Microbial Biofertilisers in Plant Production and Resistance: A Review. Agriculture 2023, 13, 1666. [Google Scholar] [CrossRef]
  65. Piccolo, A.; Drosos, M. The Essential Role of Humified Organic Matter in Preserving Soil Health. Chem. Biol. Technol. Agric. 2025, 12, 21. [Google Scholar] [CrossRef]
  66. Islam, M.D.; Binte, B.I.; Hazzazi, Y.; Kamal, M.Z.U. Factors Affecting Biopore-Root Interaction: A Review. Discov. Agric. 2024, 2, 67. [Google Scholar] [CrossRef]
  67. Zhao, Y.; Bian, Q.; Dong, Z.; Rao, X.; Wang, Z.; Fu, Y.; Chen, B. The Input of Organic Fertilizer Can Improve Soil Physicochemical Properties and Increase Cotton Yield in Southern Xinjiang. Front. Plant Sci. 2025, 15, 1520272. [Google Scholar] [CrossRef]
  68. Hossain, M.B.; Rahman, M.M.; Biswas, J.C.; Miah, M.M.U.; Akhter, S.; Maniruzzaman, M.; Choudhury, A.K.; Ahmed, F.; Shiragi, M.H.K.; Kalra, N. Carbon Mineralization and Carbon Dioxide Emission from Organic Matter Added Soil under Different Temperature Regimes. Int. J. Recycl. Org. Waste Agric. 2017, 6, 311–319. [Google Scholar] [CrossRef]
  69. Ashraf, M.; Foolad, M.R. Crop Breeding for Salt Tolerance in the Era of Molecular Markers and Marker-Assisted Selection. Plant Breed. 2013, 132, 10–20. [Google Scholar] [CrossRef]
  70. El-Sharkawy, M.; Li, J.; AL-Huqail, A.A.; Du, D.; EL-Khamisy, R.R.; El-Gamal, B.A. Sustainable Microbial Strategies for Enhancing Soil Fertility and Wheat (Triticum aestivum L.) Production. J. Soil Sci. Plant Nutr. 2025, 25, 496–513. [Google Scholar] [CrossRef]
  71. Ho, T.T.K.; Tra, V.T.; Le, T.H.; Nguyen, N.-K.-Q.; Tran, C.-S.; Nguyen, P.-T.; Vo, T.-D.-H.; Thai, V.-N.; Bui, X.-T. Compost to Improve Sustainable Soil Cultivation and Crop Productivity. Case Stud. Chem. Environ. Eng. 2022, 6, 100211. [Google Scholar] [CrossRef]
  72. Zhou, L.; Liu, W.; Duan, H.; Dong, H.; Li, J.; Zhang, S.; Zhang, J.; Ding, S.; Xu, T.; Guo, B. Improved Effects of Combined Application of Nitrogen-Fixing Bacteria Azotobacter Beijerinckii and Microalgae Chlorella Pyrenoidosa on Wheat Growth and Saline-Alkali Soil Quality. Chemosphere 2023, 313, 137409. [Google Scholar] [CrossRef] [PubMed]
  73. Pirzada, A.M.; Anwar, T.; Qureshi, W.A.; Qureshi, H.; Siddiqi, E.H.; Zaman, W.; Soufan, W. Salinity Stress Mitigation in Wheat through Synergistic Application of Ascorbic Acid, Nanoparticles and Salvadora Oleoides Extract. Sci. Rep. 2024, 14, 30687. [Google Scholar] [CrossRef]
  74. Flowers, T.J.; Munns, R.; Colmer, T.D. Sodium Chloride Toxicity and the Cellular Basis of Salt Tolerance in Halophytes. Ann. Bot. 2015, 115, 419–431. [Google Scholar] [CrossRef] [PubMed]
  75. Singh, P.; Sharma, S.; Nisar, S.; Choudhary, O.P. Structural Stability and Organic Matter Stabilization in Soils: Differential Impacts of Soil Salinity and Sodicity. J. Soil Sci. Plant Nutr. 2023, 23, 1751–1773. [Google Scholar] [CrossRef]
  76. Liu, T.; Xia, L.; Dong, X.; Wang, J.; Liu, X.; Sun, H.; Fang, Y. Saline Water Concentration Determines the Reduction Pathway for Oat Phosphorus Absorption. Agric. Water Manag. 2025, 307, 109236. [Google Scholar] [CrossRef]
  77. Shahzad, M.; Hayat, R.; Mujtaba, G.; Rehman, W.U.; Nadeem, M. Biofertilizers in Sustainable Agriculture: Mechanisms, Applications, and Future Prospects. Discov. Agric. 2025, 3, 224. [Google Scholar] [CrossRef]
  78. Rao, M.J.; Duan, M.; Zhou, C.; Jiao, J.; Cheng, P.; Yang, L.; Wei, W.; Shen, Q.; Ji, P.; Yang, Y.; et al. Antioxidant Defense System in Plants: Reactive Oxygen Species Production, Signaling, and Scavenging During Abiotic Stress-Induced Oxidative Damage. Horticulturae 2025, 11, 477. [Google Scholar] [CrossRef]
  79. Kumar, S.; Diksha; Sindhu, S.S.; Kumar, R. Biofertilizers: An Ecofriendly Technology for Nutrient Recycling and Environmental Sustainability. Curr. Res. Microb. Sci. 2022, 3, 100094. [Google Scholar] [CrossRef] [PubMed]
  80. Gill, S.S.; Tuteja, N. Reactive Oxygen Species and Antioxidant Machinery in Abiotic Stress Tolerance in Crop Plants. Plant Physiol. Biochem. 2010, 48, 909–930. [Google Scholar] [CrossRef]
  81. Wang, Y.; Guo, T.; Tian, C.; Zhang, K.; Zhao, Z.; Mao, X.; Mai, W. Effects of Root Growth on Salt Leaching and Soil Structure Improvement in Saline Soils: A Case Study of Suaeda Salsa. Agric. Water Manag. 2025, 314, 109533. [Google Scholar] [CrossRef]
  82. Azam, G.; Wickramarachchi, K.; Scanlan, C.; Chen, Y. Deep and Continuous Root Development in Ameliorated Soil Improves Water and Nutrient Uptakes and Wheat Yield in Water-Limited Conditions. Plant Soil 2025, 512, 1405–1420. [Google Scholar] [CrossRef]
  83. Loudari, A.; Mansouri, H.; Colinet, G.; Oukarroum, A. Growth and Physiological Responses of Wheat Plants to Polyphosphate and Orthophosphate Fertilizers Supply under Salt Stress. Plant Physiol. Biochem. 2025, 229, 110509. [Google Scholar] [CrossRef] [PubMed]
  84. Chauhan, J.; Prathibha, M.D.; Singh, P.; Choyal, P.; Mishra, U.N.; Saha, D.; Kumar, R.; Anuragi, H.; Pandey, S.; Bose, B.; et al. Plant Photosynthesis under Abiotic Stresses: Damages, Adaptive, and Signaling Mechanisms. Plant Stress 2023, 10, 100296. [Google Scholar] [CrossRef]
  85. Liu, Y.; Lan, X.; Hou, H.; Ji, J.; Liu, X.; Lv, Z. Multifaceted Ability of Organic Fertilizers to Improve Crop Productivity and Abiotic Stress Tolerance: Review and Perspectives. Agronomy 2024, 14, 1141. [Google Scholar] [CrossRef]
  86. Khalid, F.; Rasheed, Y.; Asif, K.; Ashraf, H.; Maqsood, M.F.; Shahbaz, M.; Zulfiqar, U.; Sardar, R.; Haider, F.U. Plant Biostimulants: Mechanisms and Applications for Enhancing Plant Resilience to Abiotic Stresses. J. Soil Sci. Plant Nutr. 2024, 24, 6641–6690. [Google Scholar] [CrossRef]
  87. Kalteh, A.M.; Hjorth, P.; Berndtsson, R. Review of the Self-Organizing Map (SOM) Approach in Water Resources: Analysis, Modelling and Application. Environ. Model. Softw. 2008, 23, 835–845. [Google Scholar] [CrossRef]
  88. Liu, H.-Q.; Lu, X.-B.; Li, Z.-H.; Tian, C.-Y.; Song, J. The Role of Root-Associated Microbes in Growth Stimulation of Plants under Saline Conditions. Land Degrad. Dev. 2021, 32, 3471–3486. [Google Scholar] [CrossRef]
  89. Kurup, S.S.; Abdul Mohsen Ali Salem, M.; Cheruth, A.J.; Sreeramanan, S.; Purayil, F.T.; Al Amouri, A.W.; Pessarakli, M. Changes in Antioxidant Enzyme Activity in Turfgrass Cultivars Under Various Saline Water Irrigation Levels To Suit Landscapes Under Arid Regions. Commun. Soil Sci. Plant Anal. 2017, 48, 1989–2001. [Google Scholar] [CrossRef]
Figure 1. Wheat growth at different developmental stages as influenced by compost, biofertilizers (Azospirillum brasilense and Azotobacter chroococcum), and their combinations under two irrigation water salinity levels (3 and 6 dS m−1).
Sustainability 18 02902 g001
Figure 2. Box plot of different soil properties comprising pH, electrical conductivity (EC, dS m−1), bulk density (BD, g cm−3), sodium adsorption ratio (SAR%), Exchangeable sodium percentage (ESP%), microbial biomass carbon (MBC, mg C g−1 Soil), and organic matter (OM %) as affected by different biofertilizers including Azospirillum brasilense and Azotobacter chroococcum, compost and their combinations under two levels of irrigation water (3 and 6 dS m−1) in two seasons. Sustainability 18 02902 i001 Upper and lower mean + SD.
Sustainability 18 02902 g002
Figure 3. Effect of different biofertilizers including Azospirillum brasilense and Azotobacter chroococcum, compost and their combinations on soil total counts of bacteria and fungi in two seasons of wheat plants grown under two levels of irrigation water (3 and 6 dS m−1) in two seasons. Columns with the same colors in each season having different upper letters are statistically differences at level (0.05).
Sustainability 18 02902 g003
Figure 4. Seasonal variation in grain yield of wheat plants as affected by different biofertilizers including Azospirillum brasilense and Azotobacter chroococcum, compost and their combinations under two levels of irrigation water (3 and 6 dS m-1) in two seasons. Columns with the same colors in each season having different upper letters are statistically differences at level (0.05).
Sustainability 18 02902 g004
Figure 5. Interaction plots for mean of (A) bulk density (g cm−3), (B) electrical conductivity (dS m−1), (C) pH, and (D) total porosity (%) of soil as affected by different biofertilizers including Azospirillum brasilense and Azotobacter chroococcum, compost and their combinations under two levels of irrigation water (3 and 6 dS m−1) in two seasons of wheat plants.
Sustainability 18 02902 g005
Figure 6. Principal component analysis (PCA) of different soil parameters including total porosity (TP%), pH, bulk density (BD, g cm−3), Exchangeable sodium percentage (ESP%), Electrical conductivity (EC, dS m−1), and soil penetration resistance (PR, N m−2); and plant characteristics comprising proline content (μmole g−1), peroxidase enzyme content (U g−1 min−1), and shoot length (cm) and their correlations to wheat yield (t ha−1) comprising both grain yield (GY) and straw yield (SY) as affected by different biofertilizers including Azospirillum brasilense and Azotobacter chroococcum, compost and their combinations under two levels of irrigation water (3 and 6 dS m−1) in two seasons.
Sustainability 18 02902 g006
Figure 7. Redundancy analysis (RDA) of wheat plant responses including flag area (cm2), ear length (cm), plant height (cm), straw yield (SY, t ha−1), and grain yield (GY, t ha−1) as affected by different biofertilizers including Azospirillum brasilense and Azotobacter chroococcum, compost and their combinations under two levels of irrigation water (3 and 6 dS m−1) in two seasons.
Sustainability 18 02902 g007
Figure 8. Self-organizing map (SOM) of different soil properties including pH, Electrical conductivity ((EC, dS m−1), pH, %), Exchangeable sodium percentage (ESP%), microbial biomass carbon (MBC, mg C g−1 soil), and its corresponding plant responses comprising grain yield (t ha−1), straw yield (t ha−1), proline (μmole g−1), peroxidase (U g−1 min−1), and K content in grains (K grain,%) as affected by different biofertilizers including Azospirillum brasilense and Azotobacter chroococcum, compost and their combinations under two levels of irrigation water (3 and 6 dS m−1) in two seasons. (Each panel represents the component plane of one variable derived from SOM clustering. The color scale indicates the relative magnitude of normalized values within the SOM structure, where blue represents lower values, green intermediate values, and red higher values. The numbers (2–10) correspond to neuron positions within the SOM grid, representing clustered treatment combinations based on similarity in soil and plant response variables.)
Sustainability 18 02902 g008
Table 1. Mean values for some physical and chemical properties of the experimental soil, compost and the two sources of irrigation water before the two seasons.
TraitsValues1st Season2nd Season
SoilWater (1)Water (2)CompostSoilWater (1)Water (2)Compost
pH-7.93 $8.187.736.85 α7.82 $8.197.576.87 α
ECdS m−14.08 $2.916.393.53 α4.38 $2.856.413.48 α
SAR%12.879.0113.94-11.228.9213.96-
ESP%15.1510.7516.18-13.5110.6416.2-
Available (N)mg kg−137.543.94-1.47 *32.743.83 *-1.45 *
Available (P)mg kg−15.97--0.74 *6.14--0.71 *
Available (K)mg kg−1224--1.37 *235--1.29 *
OM%1.31--38.251.26--38.22
CaCO3%2.26--16.322.29--16.59
Sand %18.87---18.61---
Silt%27.37---27.12---
Clay%53.76---54.27---
Texture class-Clayey---Clayey---
F.C%44.42---44.31---
W. P%23.51---23.65---
Bulk densitykg m−31.39---1.38---
TP%47.55---47.92---
SPR N cm−2330---340---
Total Mnmg kg−1---298---287
Total Femg kg−1---3221---3324
Total Znmg kg−1---72---76
*: total nutrient in %, $: soil paste extraction, α: 1:10 extract, EC: electrical conductivity, SAR: sodium adsorption ratio, ESP: exchangeable sodium percentage, OM: organic matter, SPR: soil penetration resistance, W. P: water welting point, F.C: field capacity, TP: total porosity.
Table 2. Mean of soil characteristics as affected by different biofertilizers including Azospirillum brasilense and Azotobacter chroococcum, compost and their combinations under two salt levels (3, 6 dS m−1) in average of two seasons.
Salinity VeritiesTreatmentspHEC ESP OM MBC BD SPR
dS m−1%%mg C g−1 Soilg cm−3N m−2
3 (dS m−1)Miser 4CK7.96 ± 0.66 a5.59 ± 0.46 hi17.80 ± 1.45 f0.93 ± 0.07 k0.46 ± 0.03 i1.42 ± 0.1 e300.05 ± 23.68 abc
Bio17.65 ± 0.64 hi5.24 ± 0.45 jk17.42 ± 1.43 g1.11 ± 0.09 h0.59 ± 0.04 jh1.41 ± 0.1 g295.09 ± 23.69 abc
Bio27.69 ± 0.65 fg5.36 ± 0.44 ij17.35 ± 1.43 g1.18 ± 0.10 ef0.60 ± 0.04 e1.40 ± 0.1 h290.00 ± 22.87 bc
C7.59 ± 0.63 jk4.51 ± 0.35 l15.57 ± 1.25 jk1.23 ± 0.10 d0.66 ± 0.04 cd1.35 ± 0.1 m279.94 ± 22.86 bc
C+Bio17.54 ± 0.63 l3.90 ± 0.29 m14.71 ± 1.24 m1.33 ± 0.18 b0.68 ± 0.05 bc1.36 ± 0.1 m280.09 ± 32.66 bc
C+Bio27.51 ± 0.63 l3.35 ± 0.47 n14.28 ± 1.23 n1.36 ± 0.11 ab0.70 ± 0.05 ab1.35 ± 0.1 no275.52 ± 22.09 c
Sakha 95 CK7.96 ± 0.68 a5.96 ± 0.48 g18.23 ± 1.49 d0.71 ± 0.06 m0.35 ± 0.03 l1.44 ± 0.1 a405.03 ± 31.85 a
Bio17.80 ± 0.65 c5.95 ± 0.38 g18.02 ± 1.46 e1.03 ± 0.08 j0.52 ± 0.04 i1.43 ± 0.1 c395.12 ± 24.50 ab
Bio27.72 ± 0.65 ef5.07 ± 0.34 k18.05 ± 1.50 de1.14 ± 0.10 gh0.58 ± 0.04 fg1.41 ± 0.1 f395.00 ± 31.84 ab
C7.66 ± 0.64 ef5.92 ± 0.47 g14.24 ± 1.22 n1.23 ± 0.10 d0.65 ± 0.04 d1.37 ± 0.1 k324.93 ± 23.12 abc
C+Bio17.66 ± 0.64 gh4.06 ± 0.27 m13.92 ± 1.17 o1.29 ± 0.11 c0.66 ± 0.05 cd1.37 ± 0.1 l320.11 ± 26.14 abc
C+Bio27.62 ± 0.64 gh4.60 ± 0.35 l13.69 ± 1.14 p1.34 ± 0.11 ab0.68 ± 0.05 ab1.36 ± 0.1 l315.59 ± 25.36 abc
6 (dS m−1)Miser 4CK7.75 ± 0.65 ij7.66 ± 0.61 d18.74 ± 1.52 c0.86 ± 0.07 l0.44 ± 0.03 k1.42 ± 0.1 d310.01 ± 25.31 abc
Bio17.65 ± 0.64 de7.32 ± 0.60 e17.71 ± 1.45 f1.07 ± 0.09 i0.55 ± 0.04 h1.39 ± 0.1 i300.09 ± 24.50 abc
Bio27.60 ± 0.63 hi7.23 ± 0.60 e17.65 ± 1.45 f1.18 ± 0.10 ef0.60 ± 0.04 e1.38 ± 0.1 j300.00 ± 24.50 abc
C7.42 ± 0.63 jk6.64 ± 0.54 f16.66 ± 1.30 h1.21 ± 0.11 c0.68 ± 0.05 ab1.35 ± 0.1 n290.10 ± 23.69 bc
C+Bio17.38 ± 0.61 m5.92 ± 0.52 g15.82 ± 1.30 i1.33 ± 0.11 ab0.69 ± 0.05 ab1.35 ± 0.1 no289.94 ± 23.67 bc
C+Bio27.36 ± 0.60 n5.81 ± 0.53 gh15.95 ± 1.29 i1.37 ± 0.11 a0.70 ± 0.05 a1.34 ± 0.11 o290.55 ± 23.72 bc
Sakha 95 CK7.90 ± 0.61 n9.41 ± 0.63 a19.22 ± 1.53 a0.69 ± 0.06 m0.35 ± 0.03 l1.44 ± 0.12 a364.98 ± 33.48 abc
Bio17.80 ± 0.65 b8.72 ± 0.62 b18.95 ± 1.51 b1.02 ± 0.08 j0.52 ± 0.04 i1.44 ± 0.12 b357.62 ± 33.49 abc
Bio27.76 ± 0.65 c8.19 ± 0.61 c18.79 ± 1.50 bc1.15 ± 0.09 fg0.59 ± 0.04 ef1.43 ± 0.12 c362.70 ± 34.29 abc
C7.58 ± 0.63 d7.85 ± 0.47 d15.77 ± 1.30 ij1.21 ± 0.10 de0.65 ± 0.04 d1.37 ± 0.11 k306.00 ± 26.53 abc
C+Bio17.25 ± 0.63 k7.66 ± 0.47 d15.36± 1.27 l1.26 ± 0.10 c0.65 ± 0.05 d1.37 ± 0.11 l305.10 ± 26.14 abc
C+Bio27.28 ± 0.60 o6.09 ± 0.46 g15.43 ± 1.27 kl1.36 ± 0.11 ab0.69 ± 0.05 ab1.36 ± 0.11 m305.42 ± 26.18 abc
BD: bulk density, EC: Electrical conductivity, ESP: Exchangeable sodium percentage, MBC: microbial biomass carbon, OM: organic matter, SPR: soil penetration resistance. Means in the same columns with different letters are significantly different at (0.05) level.
Table 3. Analysis of variances (ANOVA) of wheat plant biomass characteristics as affected by different biofertilizers including Azospirillum brasilense and Azotobacter chroococcum, compost and their combinations under two salt levels (3, 6 dS m−1) in two seasons.
Sources of VariationsDFGYSYPlant HeightEar LengthFPAProlinePeroxidaseTotal Chlorophyll
t ha−1t ha−1cmcmcm2μmole g−1 FWLU g−1 min−1mg g−1 FWL
Salinity (S)115.97 **9.461 **561.08 **33.37 **184.16 **57842.13 **386.84 *5993.33 **
Varieties (V)117.79 **10.963 **3011.64 **40.35 **3642.39 **803.44 **124.0284.27 **
V × S10.011.357 **363.63 **12.01 **0.08 *14.4220.74257.28 **
Season (Se)113.03 **24.269 **560.99 **0.33 **2.080 **110.20 **34.96296.46 **
S × Se10.001.409 *40.40 **21.34 **30.11 **0.1524.6280.50 **
Se × V10.040.12816.33 **0.33 **44.13 **5.5820.4399.55 **
Se × V × S11.13 *1.335 *147.11 **1.33 **0.74 **11.1824.5588.03 **
Treatments (T)515.157.057 **1356.19 **55.84 **506.75 **467.4623.801233.40 **
T × S50.65 **1.563 **17.34 **2.14 **20.04 **39.48 **20.5930.14 **
T × V50.14 **0.358 **45.14 **1.95 **33.10 **76.29 **25.1827.45 **
T × Se50.93 **1.548 **2.60 **3.14 **6.76 **13.72 **22.5024.05 **
T × V × S51.35 **0.693 **45.53 **1.61 **17.44 **17.6729.9825.14 **
T × S × Se50.31 **1.103 **49.49 **1.73 **13.79 **0.9322.8123.32 **
T × V × Se50.18 **0.085 **34.51 **0.73 **88.34 **7.2922.2434.89 **
T × S × V × Se50.14 **0.706 **31.19 **2.52 **5.04 **4.2621.6216.96 **
Residual1200.010.0010.030.000.018.4021.670.26
Total1910.770.62366.052.4038.55330.2724.8074.41
T × S × V × Se LSD (0.05)0.070.050.310.030.215.278.461.13
GY: grain yield, SY: straw yield, FPA: flag paper area. FWL: fresh weight leaf, LSD: least significant difference, *, **: Significant difference at 0.05 and 0.01 probability levels.
Table 4. Mean effects of different biofertilizers including Azospirillum brasilense and Azotobacter chroococcum, compost and their combinations on wheat plant biomass content under two salt levels (3, 6 dS m−1) in average of two seasons.
SalinityVeritiesTreatmentsGrain YieldStraw YieldPlant HeightEar LengthFlag-Paper AreaHarvest Index
t ha−1t ha−1cmcmcm2%
3Miser 4CK2.62 ± 0.03 l3.67 ± 0.02 e83.52 ± 3.21 q7.00 ± 0.03 h63.50 ± 0.02 l41.60 ± 0.01 x
Bio13.97 ± 0.02 f3.19 ± 0.02 h91.03 ± 3.28 l8.00 ± 0.03 f67.02 ± 0.02 g55.47 ± 0.01 b
Bio24.11 ± 0.01 e3.39 ± 0.01 g89.01 ± 1.35 n8.50 ± 0.01 e69.00 ± 0.01 e55.15 ± 0.01 c
C4.24 ± 0.02 d3.98 ± 0.03 d93.48 ± 1.32 h9.00 ± 0.13 d70.98 ± 0.10 b51.69 ± 0.06 i
C+Bio14.49 ± 0.02 b4.07 ± 0.02 c96.53 ± 4.62 g9.50 ± 0.05 c71.52 ± 0.03 a52.40 ± 0.02 h
C+Bio24.66 ± 0.03 a3.94 ± 0.02 d101.19 ± 4.23 e10.52 ± 0.42 a71.63 ± 0.29 a54.04 ± 0.16 e
Sakha 95 CK2.23 ± 0.02 n2.81 ± 0.08 kl90.01 ± 3.44 m7.50 ± 0.03 g54.50 ± 0.02 s44.19 ± 0.10 w
Bio12.91 ± 0.01 j2.87 ± 0.03 k91.03 ± 3.04 l8.50 ± 0.03 e58.02 ± 0.02 r50.36 ± 0.00 m
Bio22.85 ± 0.02 jk3.10 ± 0.03 i96.50 ± 1.49 g9.00 ± 0.01 d60.00 ± 0.01 q47.99 ± 0.01 t
C3.54 ± 0.01 h3.65 ± 0.02 e97.98 ± 1.38 f9.50 ± 0.14 c60.99 ± 0.08 p49.26 ± 0.03 q
C+Bio14.37 ± 0.02 c4.44 ± 0.06 a103.53 ± 4.84 c10.00 ± 0.05 b63.52 ± 0.03 l49.79 ± 0.03 p
C+Bio24.64 ± 0.03 a3.50 ± 0.02 f106.70 ± 4.43 b10.52 ± 0.44 a64.62 ± 0.25 k56.71 ± 0.10 a
6Miser 4CK2.51 ± 0.02 m2.52 ± 0.01 m78.99 ± 3.17 s5.50 ± 0.03 k62.00 ± 0.02 n49.88 ± 0.10 o
Bio12.79 ± 0.01 k2.76 ± 0.08 l82.03 ± 2.80 r6.50 ± 0.03 i65.52 ± 0.02 i50.23 ± 0.01 n
Bio23.18 ± 0.04 i3.36 ± 0.04 g85.08 ± 1.27 p6.50 ± 0.12 i66.00 ± 0.01 h48.95 ± 0.01 r
C3.80 ± 0.03 g4.39 ± 0.03 b86.99 ± 1.22 o8.00 ± 0.04 f68.48 ± 0.10 f47.10 ± 0.04 u
C+Bio14.23 ± 0.08 d3.50 ± 0.02 f92.56 ± 4.15 i9.00 ± 0.36 d69.52 ± 0.03 d54.80 ± 0.05 d
C+Bio24.22 ± 0.05 d4.06 ± 0.01 c92.08 ± 3.59 j9.02 ± 0.03 d70.63 ± 0.29 c50.87 ± 0.09 k
Sakha 95 CK2.04 ± 0.08 o2.36 ± 0.01 n87.00 ± 3.44 o6.00 ± 0.03 i54.75 ± 0.02 s46.66 ± 0.01 v
Bio12.59 ± 0.02 l2.22 ± 0.01 o90.03 ± 3.11 m7.50 ± 0.01 g61.52 ± 0.02 o53.87 ± 0.02 f
Bio22.82 ± 0.03 k2.85 ± 0.03 k91.50 ± 1.39 k9.51 ± 0.15 c62.28 ± 0.01 m50.57 ± 0.01 l
C3.13 ± 0.02 i3.41 ± 0.02 g101.98 ± 1.45 d10.00 ± 0.05 b63.74 ± 0.08 l48.83 ± 0.03 s
C+Bio13.21 ± 0.06 i2.85 ± 0.01 k103.53 ± 4.89 c10.00 ± 0.44 b65.02 ± 0.03 i52.82 ± 0.03 g
C+Bio23.18 ± 0.02 i3.01 ± 0.04 j107.70 ± 4.43 a10.01 ± 0.04 b68.60 ± 0.26 f51.02 ± 0.00 j
Values having the same superscript letters in the same column are not significantly different at 0.05 levels.
Table 5. Mean effects of different biofertilizers including Azospirillum brasilense and Azotobacter chroococcum, compost and their combinations on wheat plant nutrition content and physiological responses under two salt levels (3, 6 dS m−1) in average of two seasons.
SalinityVeritiesTreatmentsGrainStrawProlinePeroxidaseTotal Chlorophyll
NPKNPK
%%%%%%μmole g−1 FWLU g−1 min−1mg g−1 FWL
3 (dS m−1)Miser 4CK1.41 ± 0.01 g0.620 ± 0.00 e0.625 ± 0.01 m0.525 ± 0.00 o0.160 ± 0.001 d1.10 ± 0.00 l54.77 ± 2.53 i4.05 ± 0.19 a26.73 ± 0.41 h
Bio11.58 ± 0.01 f0.620 ± 0.00 e0.635 ± 0.01 k0.630 ± 0.00 k0.160 ± 0.001 d1.12 ± 0.00 k60.93 ± 4.17 gh4.47 ± 0.28 a32.14 ± 0.43 f
Bio 21.68 ± 0.00 e0.620 ± 0.00 e0.645 ± 0.01 i0.755 ± 0.00 h0.160 ± 0.000 d1.19 ± 0.01 h60.97 ± 1.61 gh4.44 ± 22 a34.52 ± 0.31 e
C1.82 ± 0.01 d0.625 ± 0.01 d0.650 ± 0.01 h0.805 ± 0.01 f0.165 ± 0.002 c1.21 ± 0.00 g56.92 ± 1.40 hi4.32 ± 0.14 a36.34 ± 0.19 d
C+Bio11.90 ± 0.01 b0.630 ± 0.00 c0.680 ± 0.01 d0.910 ± 0.00 c0.170 ± 0.001 b1.27 ± 0.01 d56.33 ± 2.80 i4.20 ± 0.14 a41.83 ± 0.54 b
C+Bio21.93 ± 0.02 a0.661 ± 0.01 b0.701 ± 0.01 a0.982 ± 0.01 a0.170 ± 0.007 b1.61 ± 0.01 a63.89 ± 2.84 g4.50 ± 0.26 a45.06 ± 0.35 a
Sakha 95 CK1.04 ± 0.00 n0.620 ± 0.00 e0.625 ± 0.00 m0.560 ± 0.00 n0.160 ± 0.001 d0.90 ± 0.00 s55.25 ± 1.67 i6.06 ± 0.63 a25.32 ± 0.17 i
Bio11.14 ± 0.00 l0.620 ± 0.01 e0.635 ± 0.01 k0.595 ± 0.00 l0.160 ± 0.001 d0.96 ± 0.00 p62.95 ± 3.35 g6.07 ± 0.24 a27.16 ± 0.27 h
Bio 21.38 ± 0.00 h0.625 ± 0.00 d0.650 ± 0.01 h0.760 ± 0.00 g0.160 ± 0.000 d1.14 ± 0.00 j61.42 ± 0.95 h4.94 ± 0.32 a30.64 ± 0.42 g
C1.68 ± 0.01 e0.630 ± 0.01 c0.665 ± 0.01 f0.860 ± 0.01 e0.160 ± 0.002 d1.18 ± 0.01 i61.16 ± 1.34 gh5.35 ± 0.35 a32.08 ± 0.16 f
C+Bio11.83 ± 0.01 c0.630 ± 0.00 c0.680 ± 0.01 d0.915 ± 0.00 b0.165 ± 0.001 c1.27 ± 0.01 d59.69 ± 1.82 ghi4.95 ± 0.40 a36.26 ± 0.24 d
C+Bio21.90 ± 0.02 b0.681 ± 0.01 a0.696 ± 0.01 b0.982 ± 0.04 a0.170 ± 0.007 b1.33 ± 0.01 b74.59 ± 7.44 f4.33 ± 0.44 a39.82 ± 0.32 c
6 (dS m−1)Miser 4CK0.70 ± 0.00 s0.620 ± 0.01 e0.610 ± 0.01 p0.490 ± 0.00 p0.160 ± 0.001 d0.92 ± 0.00 r89.55 ± 0.79 e5.56 ± 0.27 a15.28 ± 0.15 n
Bio10.94 ± 0.00 q0.620 ± 0.01 e0.620 ± 0.00 n0.575 ± 0.00 m0.160 ± 0.001 d1.00 ± 0.00 o94.66 ± 1.59 bcd7.34 ± 0.28 a18.15 ± 0.40 l
Bio 21.02 ± 0.00 o0.620 ± 0.01 e0.630 ± 0.00 l0.665 ± 0.00 j0.165 ± 0.000 c1.03 ± 0.00 n94.76 ± 2.02 bcd6.22 ± 0.25 a19.87 ± 0.19 k
C1.07 ± 0.01 m0.630 ± 0.001 c0.655 ± 0.01 g0.700 ± 0.01 i0.170 ± 0.002 b1.18 ± 0.01 i90.97 ± 2.07 de6.00 ± 0.42 a24.67 ± 0.47 i
C+Bio11.13 ± 0.00 l0.630 ± 0.001 c0.670 ± 0.00 e0.805 ± 0.00 f0.175 ± 0.00 a1.23 ± 0.01 e92.04 ± 2.75 cde5.76 ± 0.43 a27.49 ± 0.27 h
C+Bio21.16 ± 0.01 k0.631 ± 0.003 c0.681 ± 0.01 d0.912 ± 0.004 c0.175 ± 0.001 a1.29 ± 0.01 c96.82 ± 2.64 b8.19 ± 0.07 a31.02 ± 0.19 g
Sakha 95 CK0.88 ± 0.00 r0.620 ± 0.001 e0.615 ± 0.00 o0.525 ± 0.00 o0.160 ± 0.00 d0.86 ± 0.00 t96.57 ± 2.18 bc8.30 ± 0.17 a14.54 ± 0.38 n
Bio10.94 ± 0.00 q0.620 ± 0.00 e0.630 ± 0.00 l0.560 ± 0.00 n0.160 ± 0.00 d0.95 ± 0.00 q96.95 ± 3.10 b7.26 ± 0.24 a16.85 ± 0.23 m
Bio 21.00 ± 0.00 p0.626 ± 0.001 d0.641 ± 0.00 j0.666 ± 0.00 j0.160 ± 0.00 d1.03 ± 0.00 n94.99 ± 3.60 bcd6.79 ± 0.34 a21.66 ± 0.27 j
C1.04 ± 0.01 n0.625 ± 0.01 d0.645 ± 0.01 i0.700 ± 0.01 i0.165 ± 0.00 c1.08 ± 0.01 m96.19 ± 2.03 bc6.88 ± 0.40 a25.06 ± 0.19 i
C+Bio11.20 ± 0.01 j0.630 ± 0.010 c0.680 ± 0.00 d0.875 ± 0.00 d0.170 ± 0.00 b1.22 ± 0.01 f96.80 ± 1.95 b10.57 ± 0.45 a26.99 ± 0.29 h
C+Bio21.28 ± 0.01 i0.631 ± 0.01 c0.691 ± 0.01 c0.981 ± 0.01 a0.170 ± 0.001 b1.29 ± 0.01 c105.14 ± 6.10 a6.06 ± 0.46 a32.72 ± 0.16 f
FWL: fresh weight leaf. Values having the same superscript letters in the same column are not significantly different at 0.05 levels.
Disclaimer/Publisher’s Note: The statements, opinions and data contained in all publications are solely those of the individual author(s) and contributor(s) and not of MDPI and/or the editor(s). MDPI and/or the editor(s) disclaim responsibility for any injury to people or property resulting from any ideas, methods, instructions or products referred to in the content.