Article

Long-Term Land Use/Land Cover Change and Climate-Driven Projection of Soil Organic Carbon Stocks and Sequestration Using the RothC Model in the Northern Nile Delta, Egypt


1
Soils and Water Use Department, National Research Centre, Cairo 12622, Egypt
2
Space and Remote Sensing Research Council, Academy of Scientific Research and Technology (ASRT), Cairo 11562, Egypt
*
Author to whom correspondence should be addressed.
Sustainability 2026, 18(6), 2884; https://doi.org/10.3390/su18062884
Submission received: 5 February 2026 / Revised: 7 March 2026 / Accepted: 12 March 2026 / Published: 15 March 2026
(This article belongs to the Section Soil Conservation and Sustainability)

Abstract

Soil organic carbon (SOC) is a major component of the global carbon cycle. This study aimed to: (i) monitor five decades’ land use/land cover (LULC) changes in the northern Nile delta using Landsat imagery; (ii) quantify baseline SOC stocks (SOCs) in 2021; (iii) project SOCs and potential SOC sequestration (PSOCS) to 2100 under four SSP2-4.5 climate scenarios using RothC model; and (iv) evaluate uncertainty in SOCs and PSOCS projections using the Monte Carlo approach. Sixty soil samples were collected during the winter and summer seasons of 2018/2019 (30 per season). Agricultural land expanded from 12% in 1972 to 35% in 2021, while fish farms, established in the 1990s, accounted for 24% of the area by 2021. SOCs varied across LULC types and seasons. Between 13 and 28% of agricultural land exceeding 7 Mg C ha−1 in summer and winter, respectively. Barren land and sabkha were characterized by low SOCs (<3 Mg C ha−1). Model predictions indicate that mean SOCs will increase from 5.83 (2021) to 6.16 (mid-century), followed by a decline to 5.96 Mg C ha−1 by 2100. Estimated PSOCS range from 0.13 to 0.32 Mg C ha−1. Monte Carlo uncertainty analysis yielded median SOCs between 6.01 and 6.27 Mg C ha−1 and median PSOCS between 0.18 and 0.44 Mg C ha−1, reflecting moderate projection uncertainty.

1. Introduction

Soil organic matter (SOM), composed of plant and animal residues, microbial biomass, and stable humified substances [1], is fundamental to soil health despite constituting a small fraction of mineral soils. Its principal component, soil organic carbon (SOC), regulates nutrient cycling, water retention, and biological activity [2]. SOC also mitigates climate change by sequestering atmospheric carbon dioxide (CO2) into the soil carbon (C) pool [3]. This sequestration is driven mainly by plant photosynthesis and can be enhanced by agricultural management practices [4,5,6]. Because SOC stocks (SOCs) are strongly influenced by land use and management practices, maintaining a positive C balance is essential for sustaining soil quality [7].
Land use/land cover (LULC) change and agricultural practices within the agriculture, forestry and other land use (AFOLU) sector are major sources of greenhouse-gas (GHG) emissions. Between 2007 and 2016, AFOLU contributed about 13% of global CO2 emissions and 23% of net anthropogenic GHG emissions. Simultaneously, terrestrial ecosystems functioned as a net CO2 sink of around 6.0 ± 3.7 Gt CO2 yr−1(Gigatonne = 109 t) [8]. Improved cropland management could sequester 0.9–1.85 PgC yr−1 [9]. However, conversion of natural ecosystems to agriculture typically reduces initial SOC stocks by 30–50% within 50 years in temperate climates [10].
Soil constitutes the largest terrestrial reservoir of organic C. They store more C than the atmosphere (around 800 Pg C) and terrestrial biomass (around 500 Pg C) combined [11,12]. Of the estimated 2500 Pg C in soils, approximately 20% resides in topsoil [13,14]. Recent assessments estimate 1500–2400 Pg C within the upper 1.0 m and up to 3000 Pg C when deeper layers are included [15,16]. Consequently, even small SOC changes induced by LULC conversion, soil disturbance, or altered residue inputs can significantly influence global C dynamics [12,17,18]. SOC sequestration occurs when C inputs exceed C losses [19,20]. This balance underscores the importance of sustainable land management for climate mitigation [11,21].
Understanding long-term SOC dynamics requires process-based modeling. The Rothamsted Carbon model (RothC) is widely applied to simulate monthly SOC turnover in non-waterlogged topsoil over decadal to centennial timescales [22,23]. RothC partitions SOC into one inert organic matter (IOM) pool, and four active C pools; decomposable plant material (DPM), resistant plant material (RPM), microbial biomass (BIO), and humified organic matter (HUM) [23]. Although originally developed for temperate arable soils, RothC has been successfully applied across diverse ecosystems [15,24,25,26,27,28,29,30]. Recent refinements have improved its representation in conservation practices and enhanced predictive performance [31,32].
The Nile delta is among the world’s most climate-vulnerable deltas. It is threatened by sea-level rise (SLR), land subsidence, salinization, and rapid LULC change [33]. Projections indicate that 1500–2600 km2 may be exposed to flooding by 2100 under moderate SLR scenarios [34,35]. In the Kafr El-Sheikh Governorate, studies documented wetland loss, agricultural land conversion, and expansion of fish farms and urban areas [36,37,38,39,40,41]. SOC stocks in the region vary considerably with soil texture, land use, and management history. Higher SOC stocks are typically associated with fine-textured and long-cultivated soils [42,43,44,45]. However, most regional studies rely on static SOC measurements and short-term LULC assessments. Few integrated long-term LULC dynamics, process-based modeling, and uncertainty analysis extend to 2100.
The central scientific question of this study is how will long-term LULC and climate scenarios influence SOCs in the northern Nile delta, and what is the magnitude of uncertainty in projected SOC sequestration to 2100? To address this question, we integrate spatial analysis, field data, modeling, and uncertainty quantification within a unified framework. Specifically, we: (1) monitor five decades’ LULC change (1970s–2010s) in the northern Nile delta using Landsat imagery, (2) quantify and map 2021 topsoil SOCs and its seasonal variability as modeling baseline, (3) simulate future SOCs and potential SOC sequestration (PSOCS) to 2100 under four SSP2-4.5 climate scenarios using RothC model, and (4) quantify uncertainty in SOCs and PSOCS projections using Monte Carlo simulation.
This integrated approach provides the longest LULC reconstruction for the region, the first multi-scenario RothC-based SOCs projections to 2100, and the first quantitative assessment of PSOCS uncertainty in the Nile delta. The findings deliver high-resolution, policy-relevant insights for soil C accounting, climate mitigation, and land-use planning.

2. Materials and Methods

2.1. Study Area

2.1.1. Location and Soils

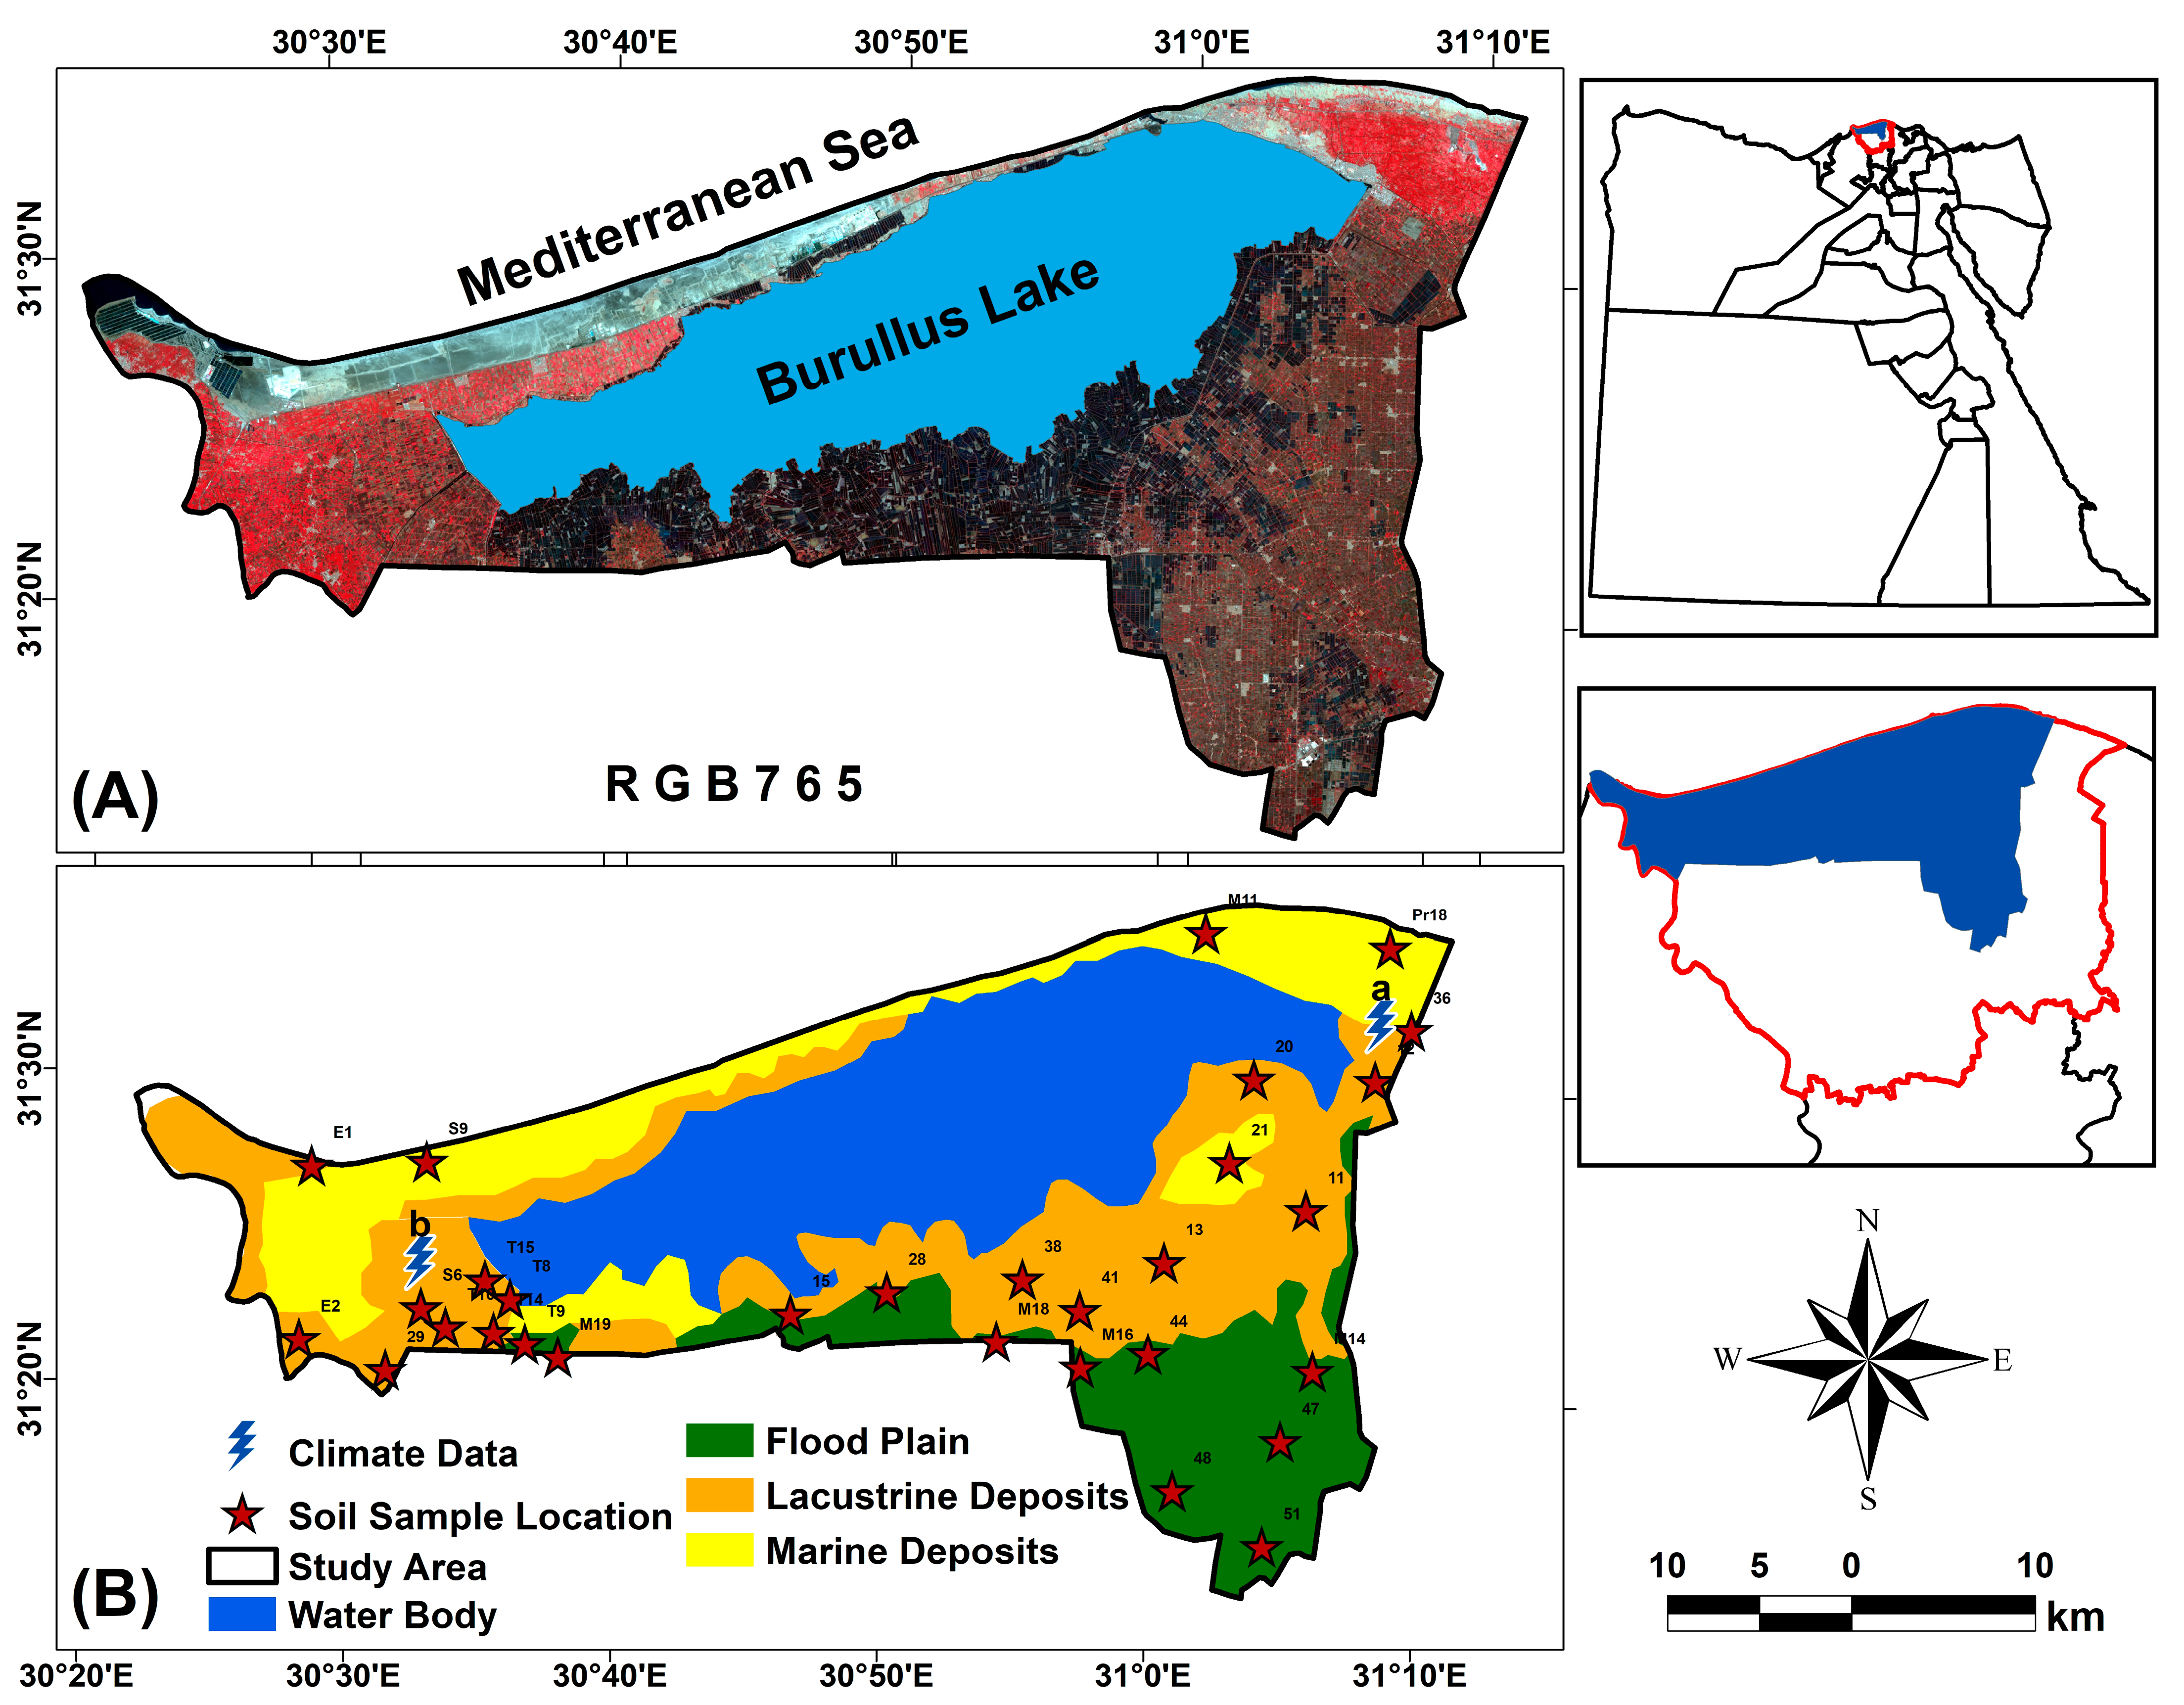
The study area is located in the northern Nile delta within the Kafr El-Sheikh Governorate, Egypt (Figure 1A). It covers approximately 1480 km2 and extends between longitudes 30°20′ and 31°10′ E and latitudes 31°15′ and 31°37′ N. The region is characterized by intensive agricultural activity and substantial land-use pressures. It includes Lake Burullus and its surrounding areas. Lake Burullus, Egypt’s second largest coastal lake, has experienced substantial anthropogenic-driven shrinkage [46]. Guirguis [47] reported losses of 8.6 km2 yr−1 between 1983 and 1991. Hossen and Negm [48] detected lake a reduction in lake area from approximately 32,000 to 18,000 ha between 1984 and 2015. Over a similar period, Khalil [49] reported a decline from 503 to 410 km2. Keshta [39] observed a decrease in marsh and wetland areas from 336 to 185 km2 between 1985 and 2020 due to agricultural expansion and fish farm development. Additionally, water bodies and floating vegetation declined by 16% and 52%, respectively, between 1984 and 2019 [50].
The Nile delta is predominantly composed of Nile alluvial deposits. According to previous studies [51,52,53], three dominant depositional environments occur in the region (Figure 1B): flood plain (fluvial) deposits, lacustrine deposits, and the quaternary marine deposits. Lacustrine deposits occupy approximately one-third of the area, while flood plain and marine deposits together account for another third.
A total of sixty topsoil samples were collected during the winter and summer seasons of 2018/2019 (30 per season) (Figure 1B). The sampling strategy was designed to capture the spatial variability across the three main depositional units within the study area (Figure 1B). Sampling depth followed the IPCC guidelines for SOCs estimation [54]. Soil texture ranges from sandy to clayey across the region. According to the USDA Natural Resources Conservation Service Keys of Soil Taxonomy [55], soils were classified into two orders: Entisols and Aridisols.

2.1.2. Climate

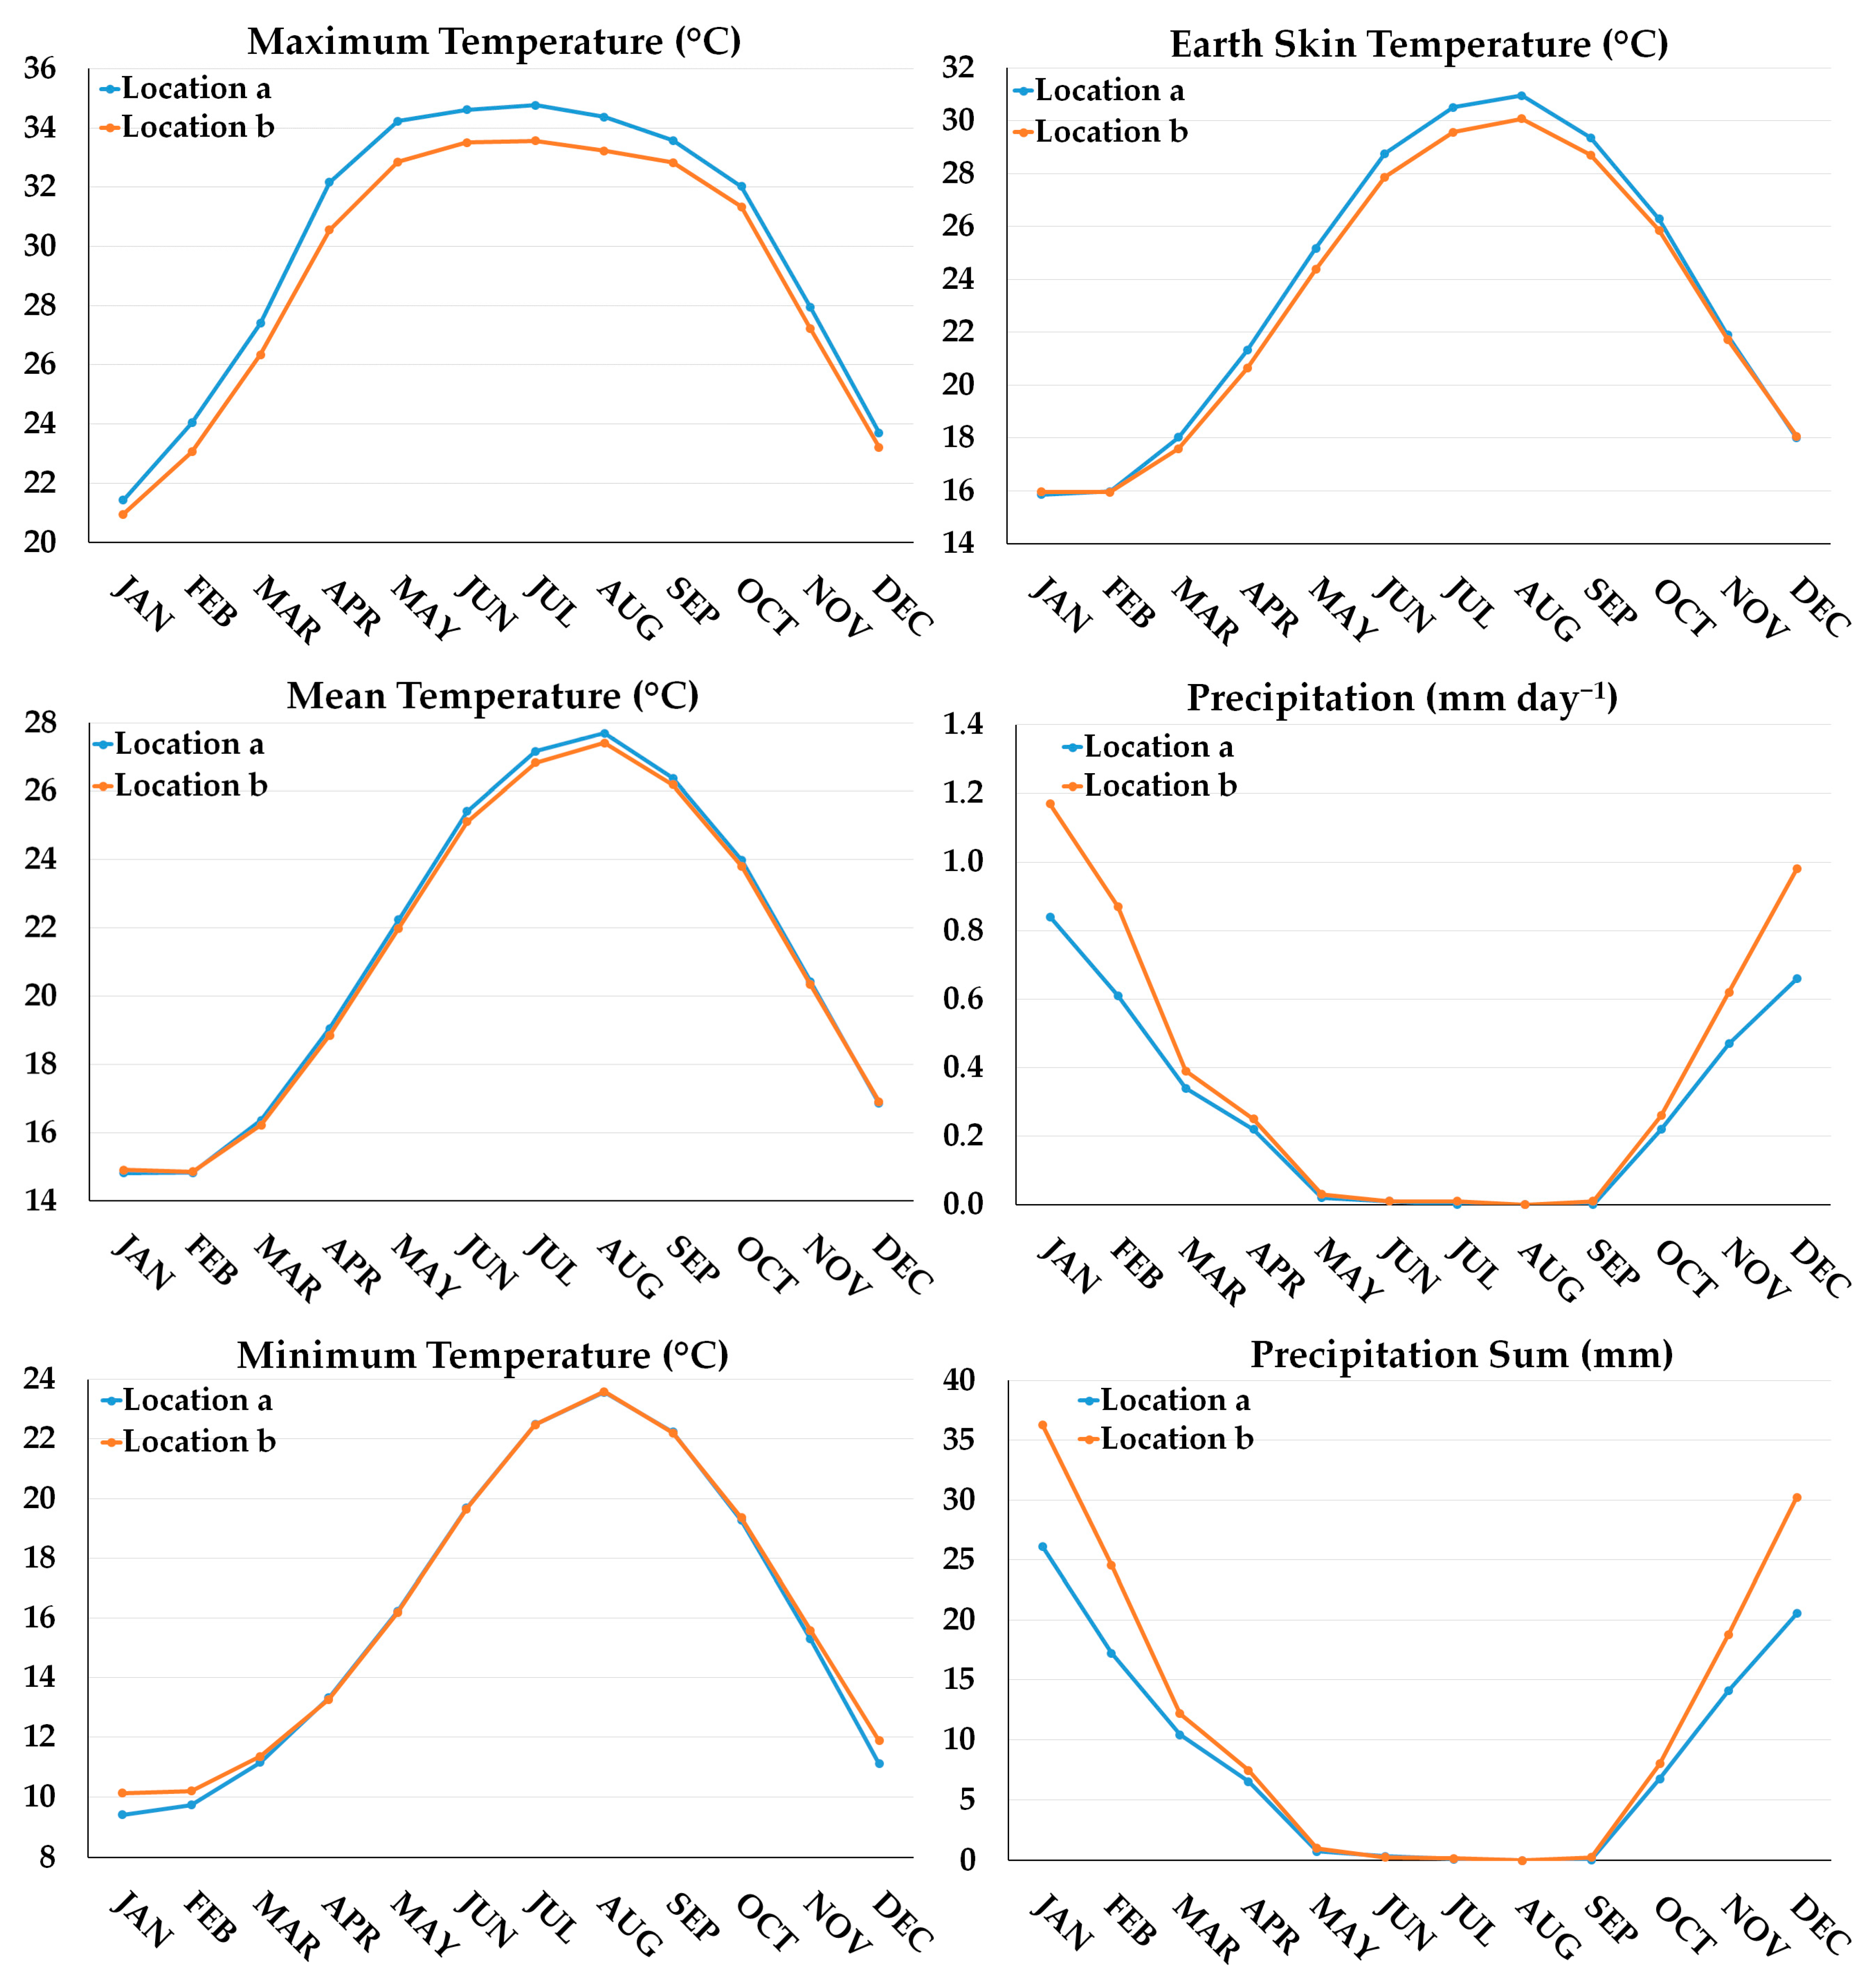
The study area is characterized by a Mediterranean climate, with mild winters, hot summers, and low annual precipitation. Meteorological data for the period 1981–2021 were obtained for two locations on the eastern (a) and western (b) margins of Burullus Lake (Figure 1B). Data were sourced from the NASA Prediction of Worldwide Energy Resources (POWER) (https://power.larc.nasa.gov) database. The dataset includes daily air temperature (maximum, minimum, and mean at 2 m, °C), wind speed (maximum, minimum, and mean at 2 m, m s−1), precipitation (daily and cumulative, mm), and relative humidity (%). Additionally, four soil-related parameters were derived from the climatic records: earth skin temperature (°C), and three soil wetness indices representing moisture condition at the surface, root-zone, and deep-profile. Monthly means were calculated for each site (Table S1 in Supplementary Materials) and averaged over the full 40-year time series (Table S1 and Figure 2).
The eastern site exhibited higher maximum temperatures, with an annual mean approximately 1.5 °C greater than the western site over the 40-year period (Figure 2 and Table S1). Conversely, minimum temperatures were slightly higher in the west by around 0.7 °C (Figure 2 and Table S1). Mean air temperatures were comparable between the two locations, ranging from around 15 °C in winter (January and February) to around 27 °C in summer (July and August) (Figure 2 and Table S1). Wind speed was relatively uniform across the area, with an average of around 4 m s−1 annually (Table S1). Relative humidity was marginally higher at location b (67%) than at location a (66%). This pattern corresponds to greater annual precipitation in the west (139 mm) compared to the east (103 mm) (Table S1). Precipitation exhibited strong seasonality, with minimal rainfall during summer and peak values in January (Figure 2 and Table S1). Earth skin temperature followed a clear seasonal cycle, peaking in summer and reaching a minimum in winter (Figure 2 and Table S1). Soil wetness indices (0–1) were consistently higher at the western site, reflecting higher precipitation and greater soil moisture across all soil depths (Table S1).

2.2. Methodological Framework

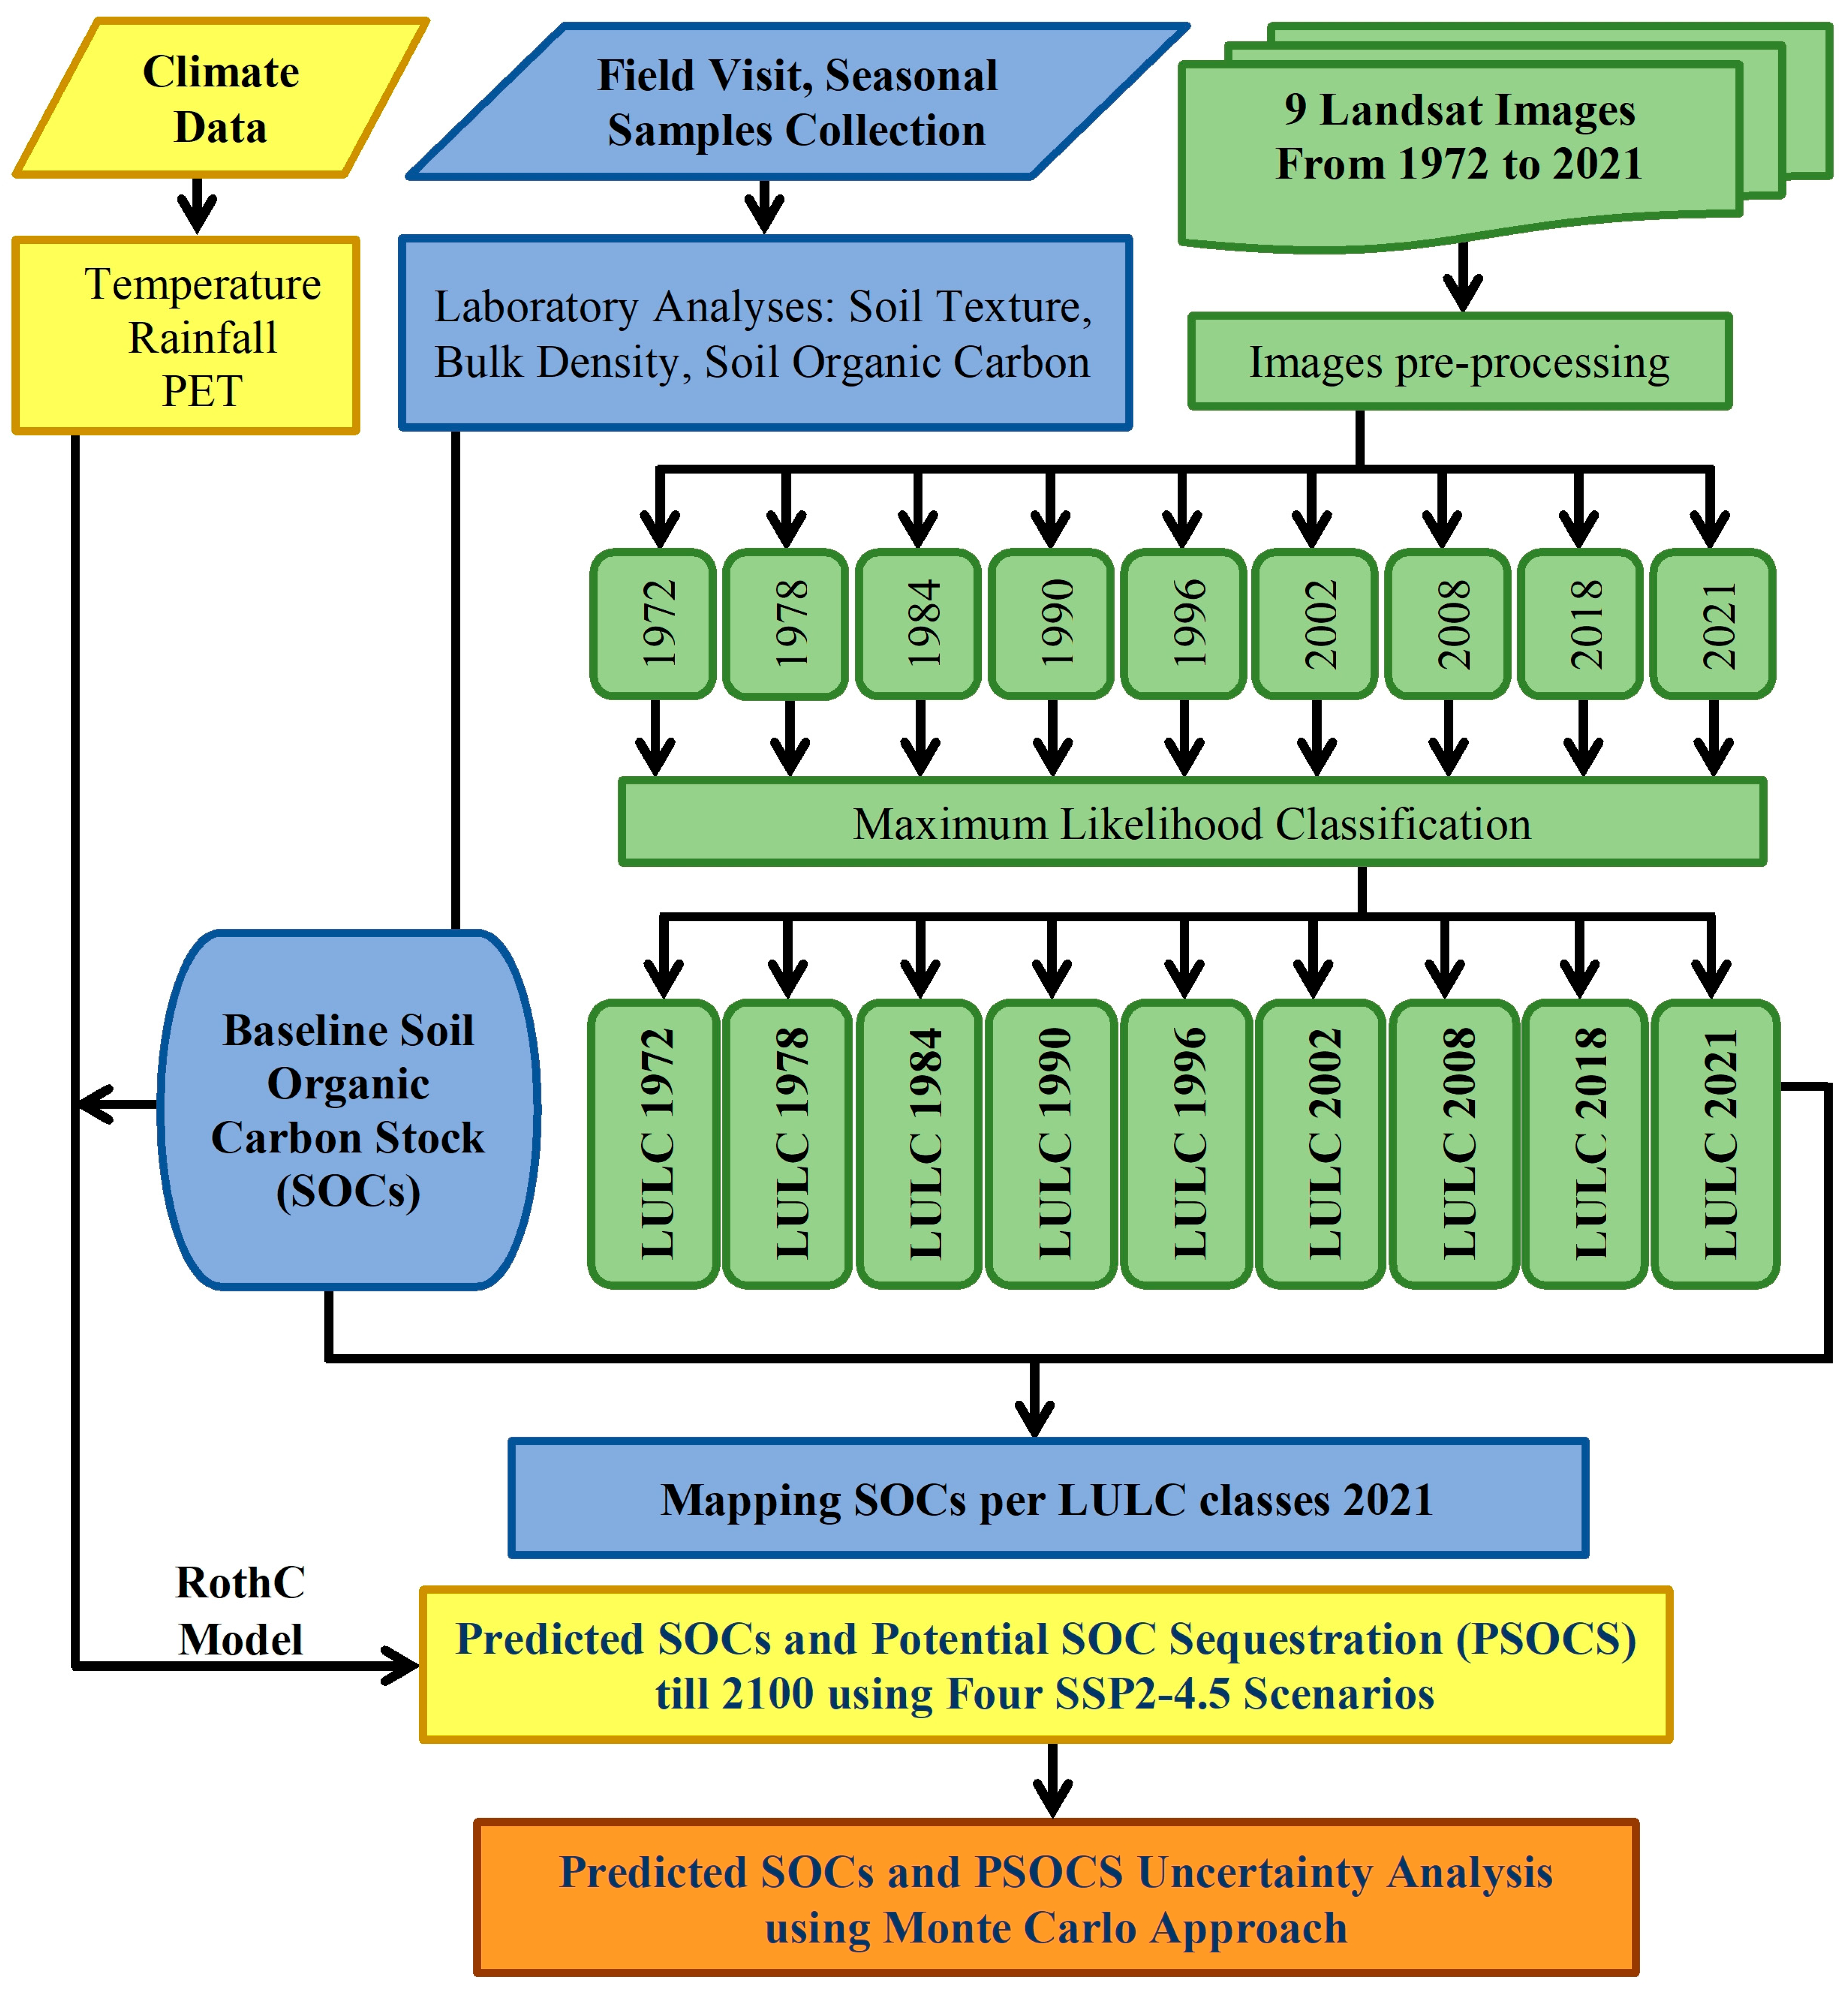
As illustrated in Figure 3, the methodological framework comprised four principal components. First, LULC dynamics were monitored using Landsat imagery of 1972, 1978, 1984, 1990, 1996, 2002, 2008, 2018, and 2021. Second, SOC stocks were quantified and spatially mapped based on soil depth, SOC content, and bulk density. Third, predicted SOCs and PSOCS were simulated through to 2100 using climate data. Finally, the uncertainty associated with projected SOCs and PSOCS was assessed using a Monte Carlo approach.

2.2.1. Land Use/Land Cover Mapping

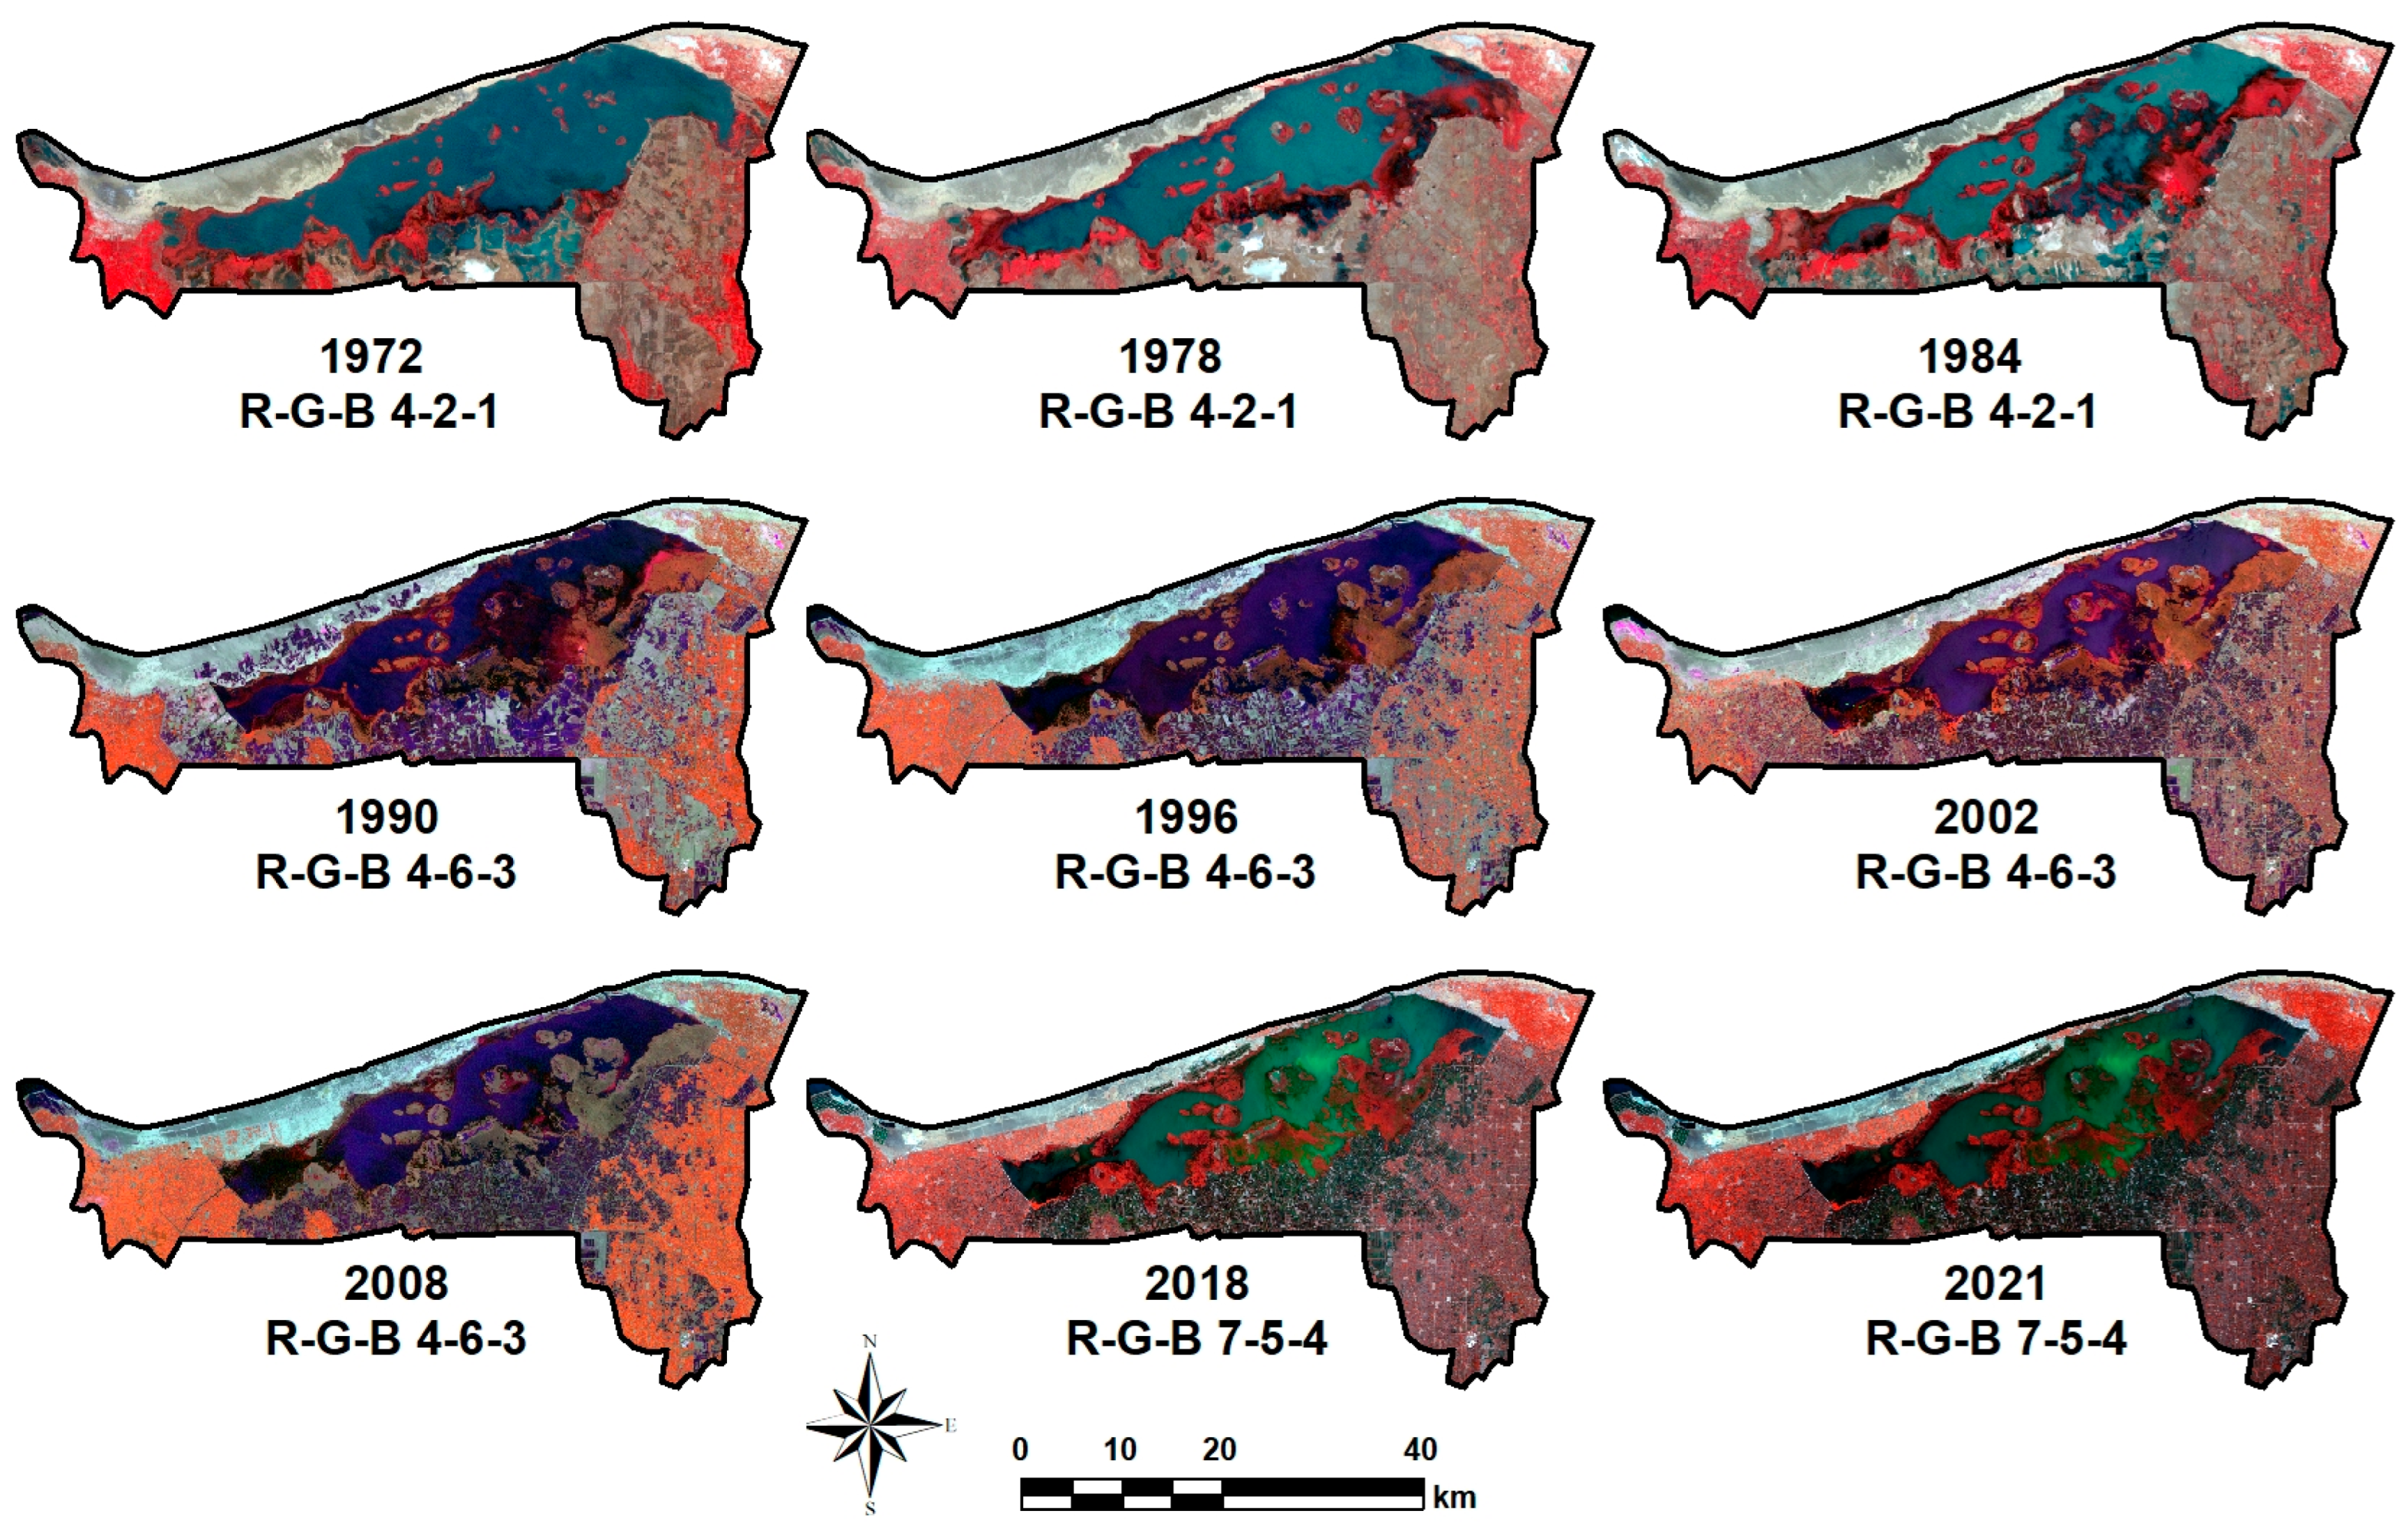
Nine cloud-free Landsat images (1972, 1978, 1984, 1990, 1996, 2002, 2008, 2018, and 2021) were acquired (Table 1) from USGS EarthExplorer (https://earthexplorer.usgs.gov/). All images were geometrically corrected to the UTM zone 36N projection with the WGS84 datum. Image processing and analysis were conducted using ENVI 5.1 (Exelis Visual Information Solutions, Boulder, Colorado) and ArcMap 10.4 [56], applying appropriate band combinations (Table 1 and Figure 4). LULC classification was conducted using a supervised maximum likelihood classifier (MLC). This method was selected for its robustness, proven accuracy, and relative simplicity compared to more complex machine-learning algorithms [57,58,59,60]. Training samples were established for each LULC class and validated using the Google Earth imagery and ground truth points (GTPs). A spectral signature file was generated, and final LULC maps were produced using MLC decision rule.
The accuracy of the classified LULC maps was assessed using a confusion matrix approach. Overall accuracy, the Kappa coefficient, producer’s accuracy, and user’s accuracy were calculated to evaluate both overall and class-specific performance. The complete confusion matrix is provided in Supplementary Table S2.

2.2.2. Laboratory Analyses and Soil Organic Carbon Stock Calculations

Soil samples were air-dried, sieved to <2 mm, and stored for subsequent physiochemical analyses. Particle size distribution was determined following the method of Gee and Or [61]. SOC content was measured using the Walkley–Black method [62]. Bulk density (BD) was determined according to Grossman and Reinsch [63].
Although soil samples were collected in winter 2018 and summer 2019, laboratory analyses were completed in 2021 due to COVID-19-related delays. To ensure temporal consistency, LULC dynamics between 2019 (completion of sampling) and 2021 were checked using Landsat imagery. The analysis indicated no statistically significant LULC changes within the study area during this period. Major LULC transitions occurred primarily before or during 2018–2019. Given this stability, SOC measurements from 2018/2019 were considered representative of 2021 conditions and were integrated with the 2021 LULC map without numerical adjustment. Accordingly, the term “2021 baseline” refers to the year of finalized dataset validation and spatial integration rather than the sampling year. SOCs, expressed as Mega gram C per hectare, Mg C ha−1, was calculated for topsoil using the widely adopted equation proposed by Gue and Gifford [64], and later formalized by IPCC [65]. This approach is consistent with international guidelines for SOCs estimation [66] and support most field-level SOC assessments:
SOCs = D × OC × BD × 10,
where SOCs is the soil organic carbon stock (Mg C ha−1), D is the depth of sampling (cm), OC is the organic carbon (%), BD is the soil bulk density (g cm−3), and 10 is the unit conversion factor. This equation applies to fine-earth fraction (<2 mm). For soils containing coarse fragments, a correction factor of (1- coarse fragments volume/100) was applied as recommended by IPCC [65]. This equation has been widely validated across divers regions. Similar formulations were used by Wairiu and Lal [67] in the Solomon Islands, Yigini and Panagos [68] and Chen et al. [69] in Europe, Zeng et al. [70] and Li et al. [71] in China, Sharma et al. [72] in India, and Abu-hashim et al. [43] and Abd-Elmabod [73] in the Nile delta, Egypt.
The SOCs calculations (Equation (1)) were conducted using soil samples corresponding to four LULC classes, including agricultural land, barren land, dry sabkha, and wet sabkha based on 2021 LULC classified map. Of the 30 samples per season, of which 23 were located within these LULC classes and were therefore included in the SOCs analysis. The remaining seven samples, situated in fish farm facilities and urban surrounding areas, were primarily used as GTPs for classification validation. SOCs values were spatially interpolated and integrated with the 2021 LULC map to generate a spatial SOCs distribution map. These values serve as a baseline for projecting SOCs changes through to 2100.
The descriptive statistics and a Wilcoxon signed-rank test were performed to assess seasonal significant difference in soil characteristics at a 95% confidence interval (α = 0.05). Seasonal SOCs values were also statistically examined. All statistical analyses were achieved using SPSS 26 software [74].

2.2.3. RothC Model for Estimating SOCs and PSOCS Until 2100

Future SOCs and PSOCS (predicted SOCs minus SOCs in 2021) were simulated to 2100 using RothC model under spatially explicit climate projection. Simulations were conducted under four medium-forcing scenarios of Shared Socioeconomic Pathway (SSP2-4.5, “middle-of-the road”) conditions [75,76].
By 2100, projected changes in monthly mean temperature, precipitation summation, and potential evapotranspiration (PET; Penman–Monteith; mm) were as follows; +1.5 °C, −5%, +3% (scenario 1, Sce.1), +1.8 °C, −10%, +5% (scenario 2, Sce.2), +2.2 °C, −15%, +8% (scenario 3, Sce.3), and +2.5 °C, −20%, +12% (scenario 4, Sce.4), respectively. These projections are consistent with reported values for Northern Africa, the Eastern Mediterranean, and Egypt under SSP2-4.5 [8,33,77,78,79,80].
The RothC model was implemented in RStudio 2025.09.2 [81] under a business as usual (BAU) assumption. No changes in land use, management, or cultivation practices were assumed relative to the 2021 baseline [15,29,82]. Soil organic matter dynamics were simulated using the “SoilR” package [83], supported by “deSolve” for solving differential equations [84], “read” package [85], and “dplyr” package [86] for data processing.
The model inputs included (i) projected climate data (2022–2100; temperature, precipitation, and PET); (ii) soil properties (initial SOCs in 2021, C inputs to DPM, RPM, BIO, HUM, and IOM, clay content, and soil depth), with a default DPM/RPM ratio of 1.44 for croplands; and (iii) LULC derived from Landsat imagery of 2021, coded as 1.0 for cultivated and 0.0 for non-cultivated. Parameter calculations followed established RothC model formulations that account for plant litter quality and SOC turnover [29,87,88]. Details are provided in Supplementary Table S3.

2.2.4. Monte Carlo Uncertainty Approach

Uncertainty in projected SOCs and PSOCS was quantified using a Monte Carlo approach [89]. Random realizations of model inputs and parameters were generated from predefined probability distribution functions (PDFs). This approach propagates uncertainty associated with input data, parameterization, and initial conditions through RothC simulations [15,26,90]. The analysis focused on parametric and input-data uncertainty. Considered parameters included annual C inputs, clay content, initial SOC stocks, and climatic variables. Prior to distributional assumptions, these parameters were tested for normality using the Shapiro–Wilk test. The resulting p-values 0.129, 0.398, and 0.192 for annual C inputs, clay content, and initial SOCs, respectively, indicated no significant deviation from normality (α = 0.05). Therefore, normal distributions were assumed, with means equal to parameter estimates and standard deviations derived from measured standard errors [15]. Because these variables are physically bounded, truncated normal distributions were applied. Lower bounds were set at zero for SOC and C inputs, and clay content was constrained to the range 0–100%. Non-physical draws were rejected and resampled. This procedure captures uncertainty arising from measurement error, parameter estimation, and initial conditions.
For each SSP2-4.5 climate realization, 1000 simulations were performed. The RothC model was run at a monthly time step from 2022 to 2100 using the SoilR and dplyr packages in RStudio. The Monte Carlo procedure was applied independently to each climate realization.
This framework quantifies uncertainty associated with input data and parameter estimates within a fixed RothC structure. Structural uncertainty, including alternative process representations or SOCs model formulations, was not evaluated. Scenario-related uncertainty was partially addressed through multiple SSP2-4.5 realizations. Uncertainty associated with alternative climate–socioeconomic pathways or future land-use transitions was beyond the study scope.
Model outputs were summarized as median SOCs and PSOCS trajectory, accompanied by the 5th and 95th percentile representing uncertainty bounds. This probabilistic framework characterizes long-term SOC dynamics under parameter and input uncertainty. It also enables direct comparison between parametric uncertainty and climate-scenario uncertainty [15].

3. Results

3.1. Land Use/Land Cover Classes

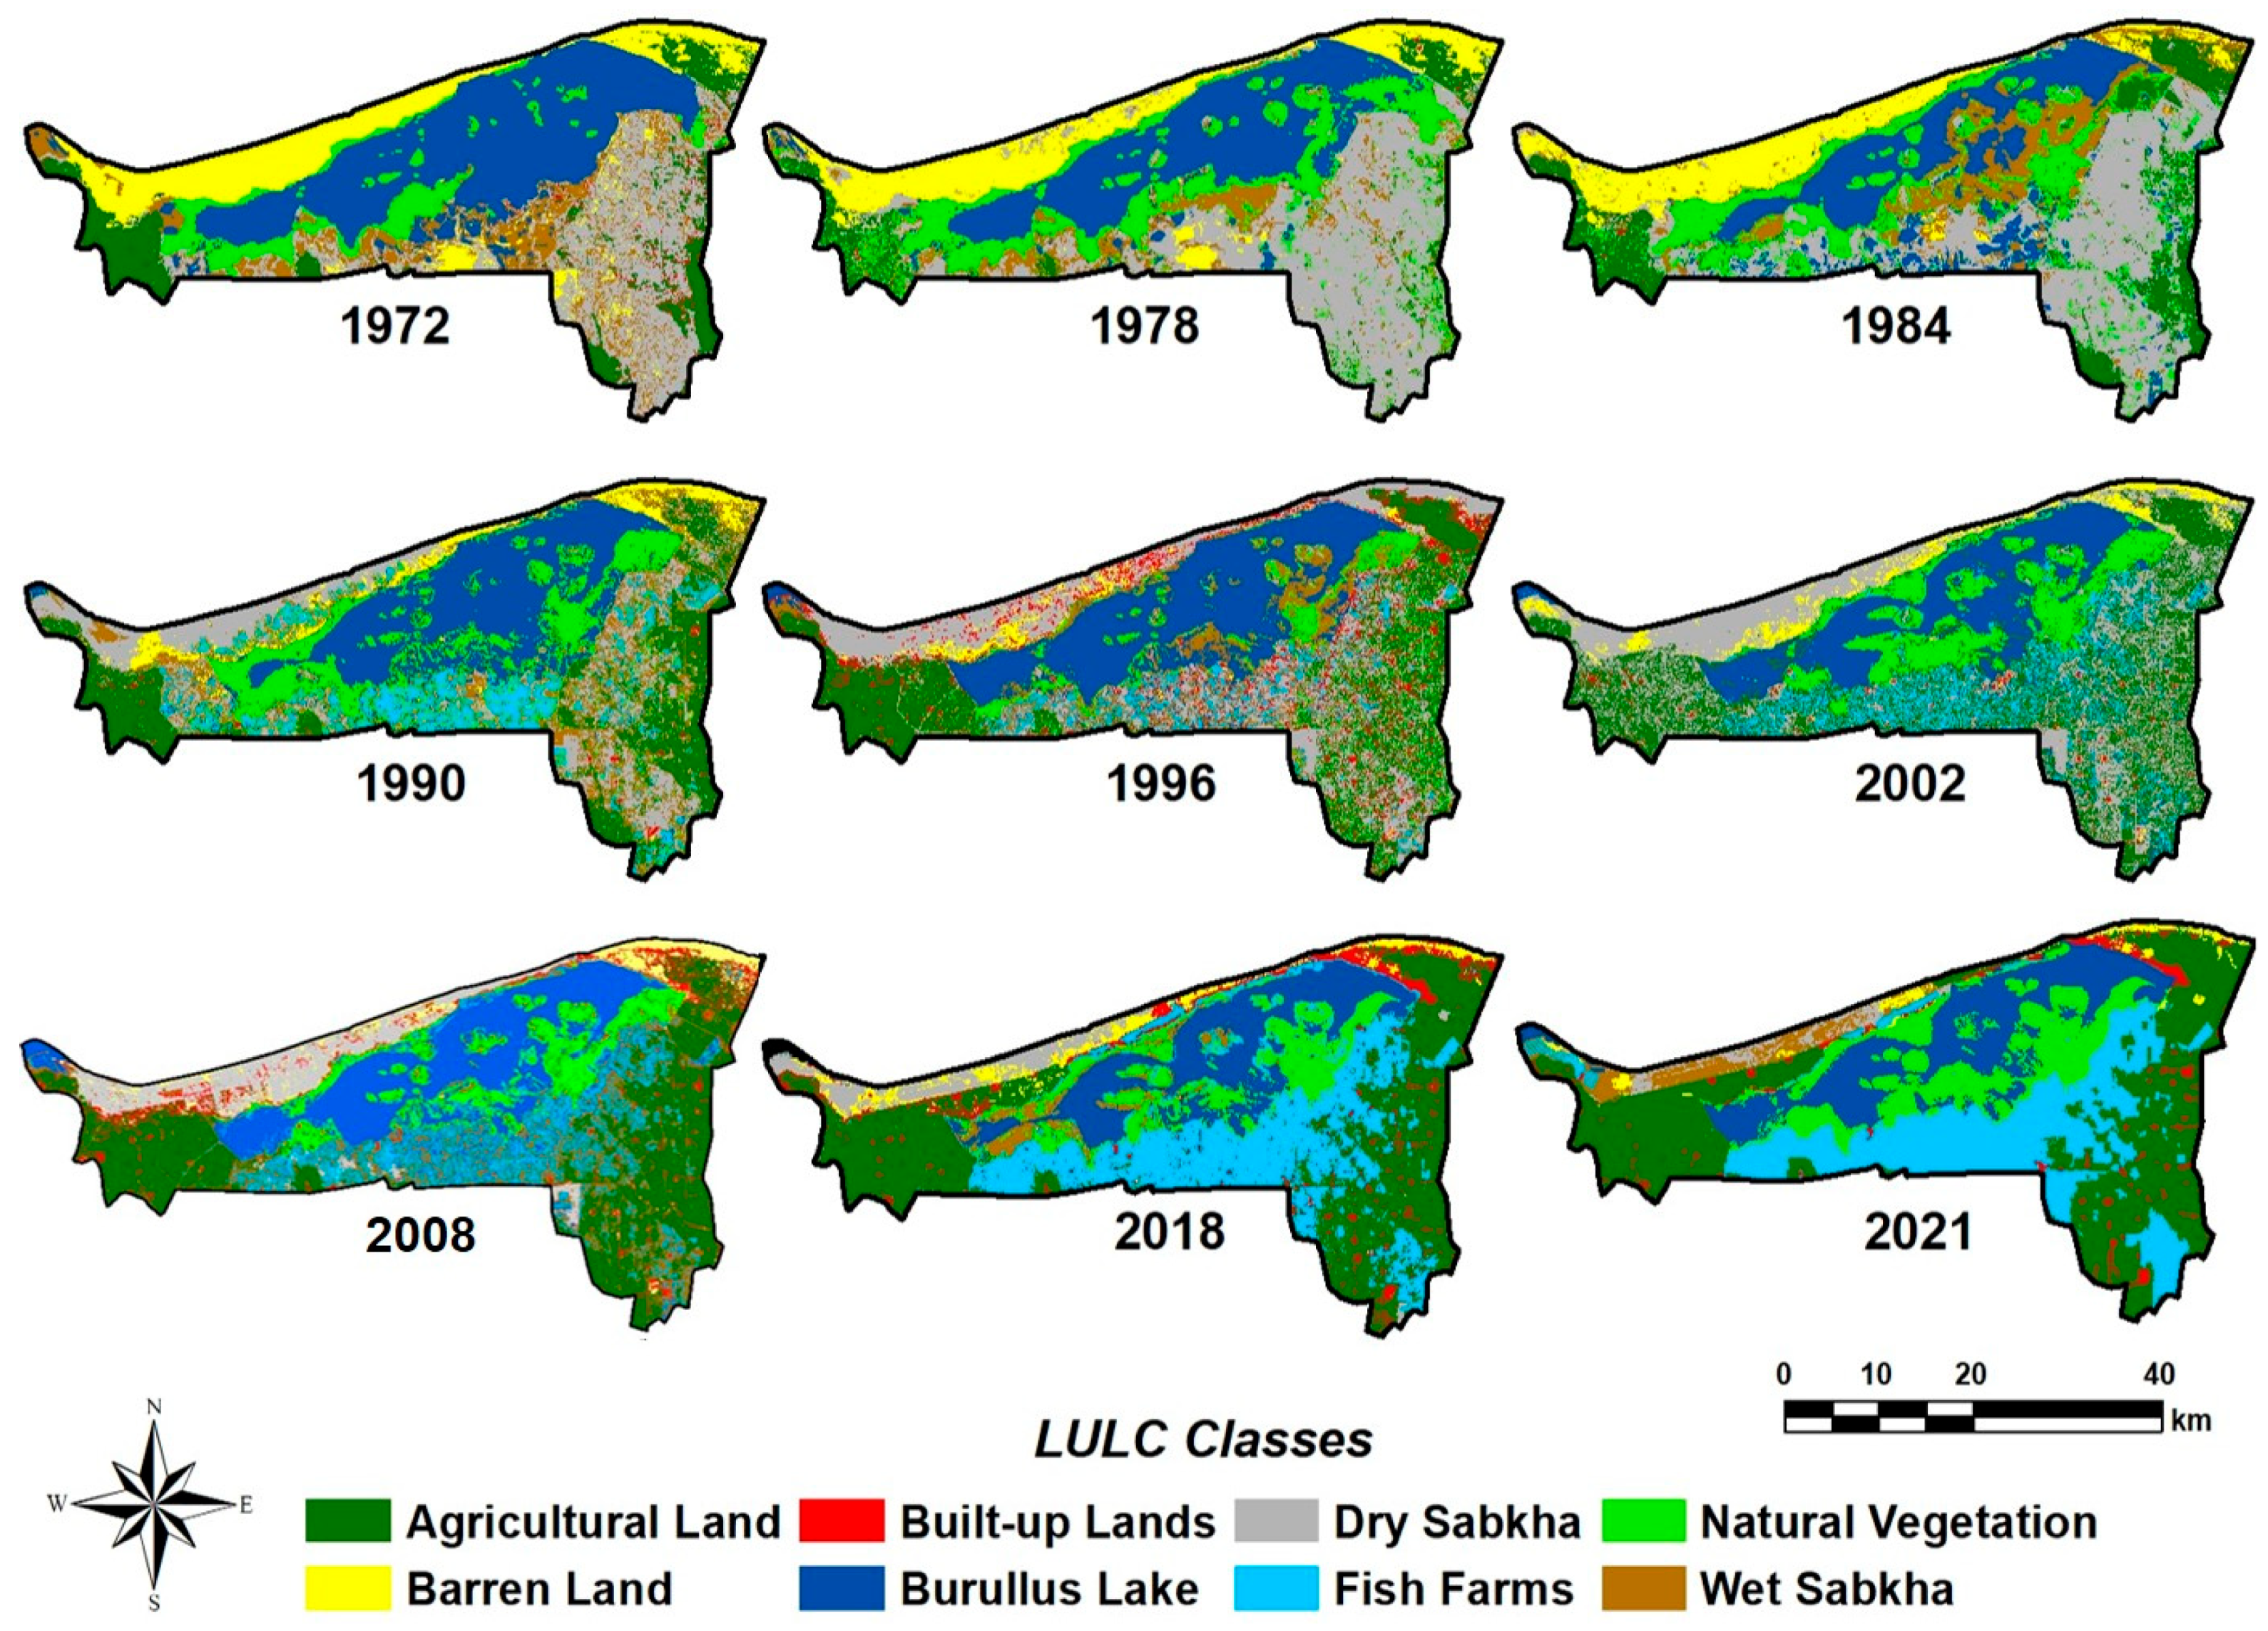
Nine LULC classification maps were produced using the MLC procedure for the years 1972, 1978, 1984, 1990, 1996, 2002, 2008, 2018, and 2021. The spatial extent and proportional coverage of each class are presented in Figure 5 and Table 2, respectively. The identified LULC classes comprise agricultural land, urban/built-up areas, water bodies (mainly Burullus Lake), fish farms, natural vegetation, wet sabkha, dry sabkha, and barren land.
The classified maps demonstrated high performance. The overall accuracy and kappa coefficient were approximately 0.90. The detailed confusion matrix and class-specific accuracy metrics are provided in Supplementary Table S2. Overall classification performance was consistently strong across all years, with a mean overall accuracy of approximately 90%. The lowest accuracy was recorded for the 2008 map (85%), whereas the highest was achieved in 2021 (95%). Class-specific evaluation indicates that agricultural land attained high producer’s and user’s accuracies (approximately 90%), confirming the robustness and reliability of the classification results.
Between 1972 and 2021, agricultural lands and urban areas expanded markedly and consistently. Agricultural lands increased from 181 km2 (12%) in 1972 to 511 km2 (35%) in 2021. Urban areas expanded from 0.66 km2 (0.04%) in 1972 to 64 km2 (4%) in 2021 (Table 2). These trends are clearly illustrated in Figure 5, highlighting sustained agricultural reclamation and urban growth over time.
Fish farms emerged as a dominant land-use class following their establishment in the late 1980s and early 1990s. By 2021, fish farms occupied approximately 348 km2 (24%) of the study area. Their extent increased more than threefold between 2002 and 2021 (Figure 5 and Table 2), underscoring the rapid expansion of aquaculture activities.
The water class exhibited notable temporal fluctuations. Its areal coverage declined from 461 km2 (31%) in 1972 to 276 km2 (19%) in 1984, increased to 330 km2 (22%) in 1996, and subsequently decreased to 232 km2 (16%) by 2018 (Table 2). Natural vegetation associated mainly with the Burullus Lake surface increased from 111 km2 (7%) in 1972 to approximately 16% during the period 1978–1990. Thereafter, it declined to around 9% (130 km2) in 2008 before recovering to 190 km2 (13%) by 2021 (Table 2).
Non-productive LULC classes—including barren land, dry sabkha, and wet sabkha—dominated the landscape during the early study period. Collectively, they accounted for nearly 50% of the total area between 1972 and 1984 (Table 2 and Figure 5). Their combined extent declined to around 36% by 2002 and further decreased to approximately 29% by 2008. By 2021, these classes had dropped sharply to around 7.5% (Figure 5). This substantial decrease reflects extensive LULC conversion over the study period, particularly during the most recent decade.

3.2. Soil Characteristics

Descriptive statistics for laboratory-measured soil properties during winter and summer 2018/2019 are presented in Table 3. The SOC contents range from 0.14 to 1.97% in summer and 0.34 to 2.13% in winter, with an overall mean of around 1.4% (Table 3).
Soil texture fractions exhibited limited seasonal variability. Sand content showed a slight increase in winter (mean = 31.64%) compared to summer (30.11%). Silt and clay contents remained relatively stable across seasons. Mean clay content was approximately 44% in summer and 43% in winter.
The BD values ranged from 0.96 to 1.58 g cm−3 in summer and 1.06 to 1.68 g cm−3 in winter. The mean BD increased modestly from 1.28 to 1.38 g cm−3 (Table 3). SOC displayed moderate variability. In contrast, sand and clay fractions exhibited greater dispersion. Skewness and kurtosis values indicated near-normal distributions for most soil properties. Seasonal differences in soil characteristics were statistically significant (p < 0.001), confirming a strong seasonal signal (Table 3).
Pearson’s correlation analysis revealed strong and consistent relationships among SOC, soil texture fractions, and BD, across both summer and winter seasons (Table 4). SOC measured in summer and winter was perfectly correlated (r = 0.996, p < 0.01), indicating high temporal stability in spatial SOC patterns despite seasonal variation. SOC exhibited a significant negative correlation with sand content in both seasons (summer: r = −0.557; winter: r = −0.564; p < 0.01). In contrast, positive correlations were observed between SOC with silt (r ≈ 0.47; p < 0.05–0.01) and clay content (r ≈ 0.52–0.53; p < 0.01) (Table 4). Sand content was strongly and negatively correlated with both silt and clay (r = −0.84 to −0.94; p < 0.01). BD exhibited weak and non-significant correlations with SOC in both seasons (−0.26 to −0.29), although BD was highly stable seasonally (r = 0.997; p < 0.01) (Table 4).

3.3. Soil Organic Carbon Stock (SOCs)

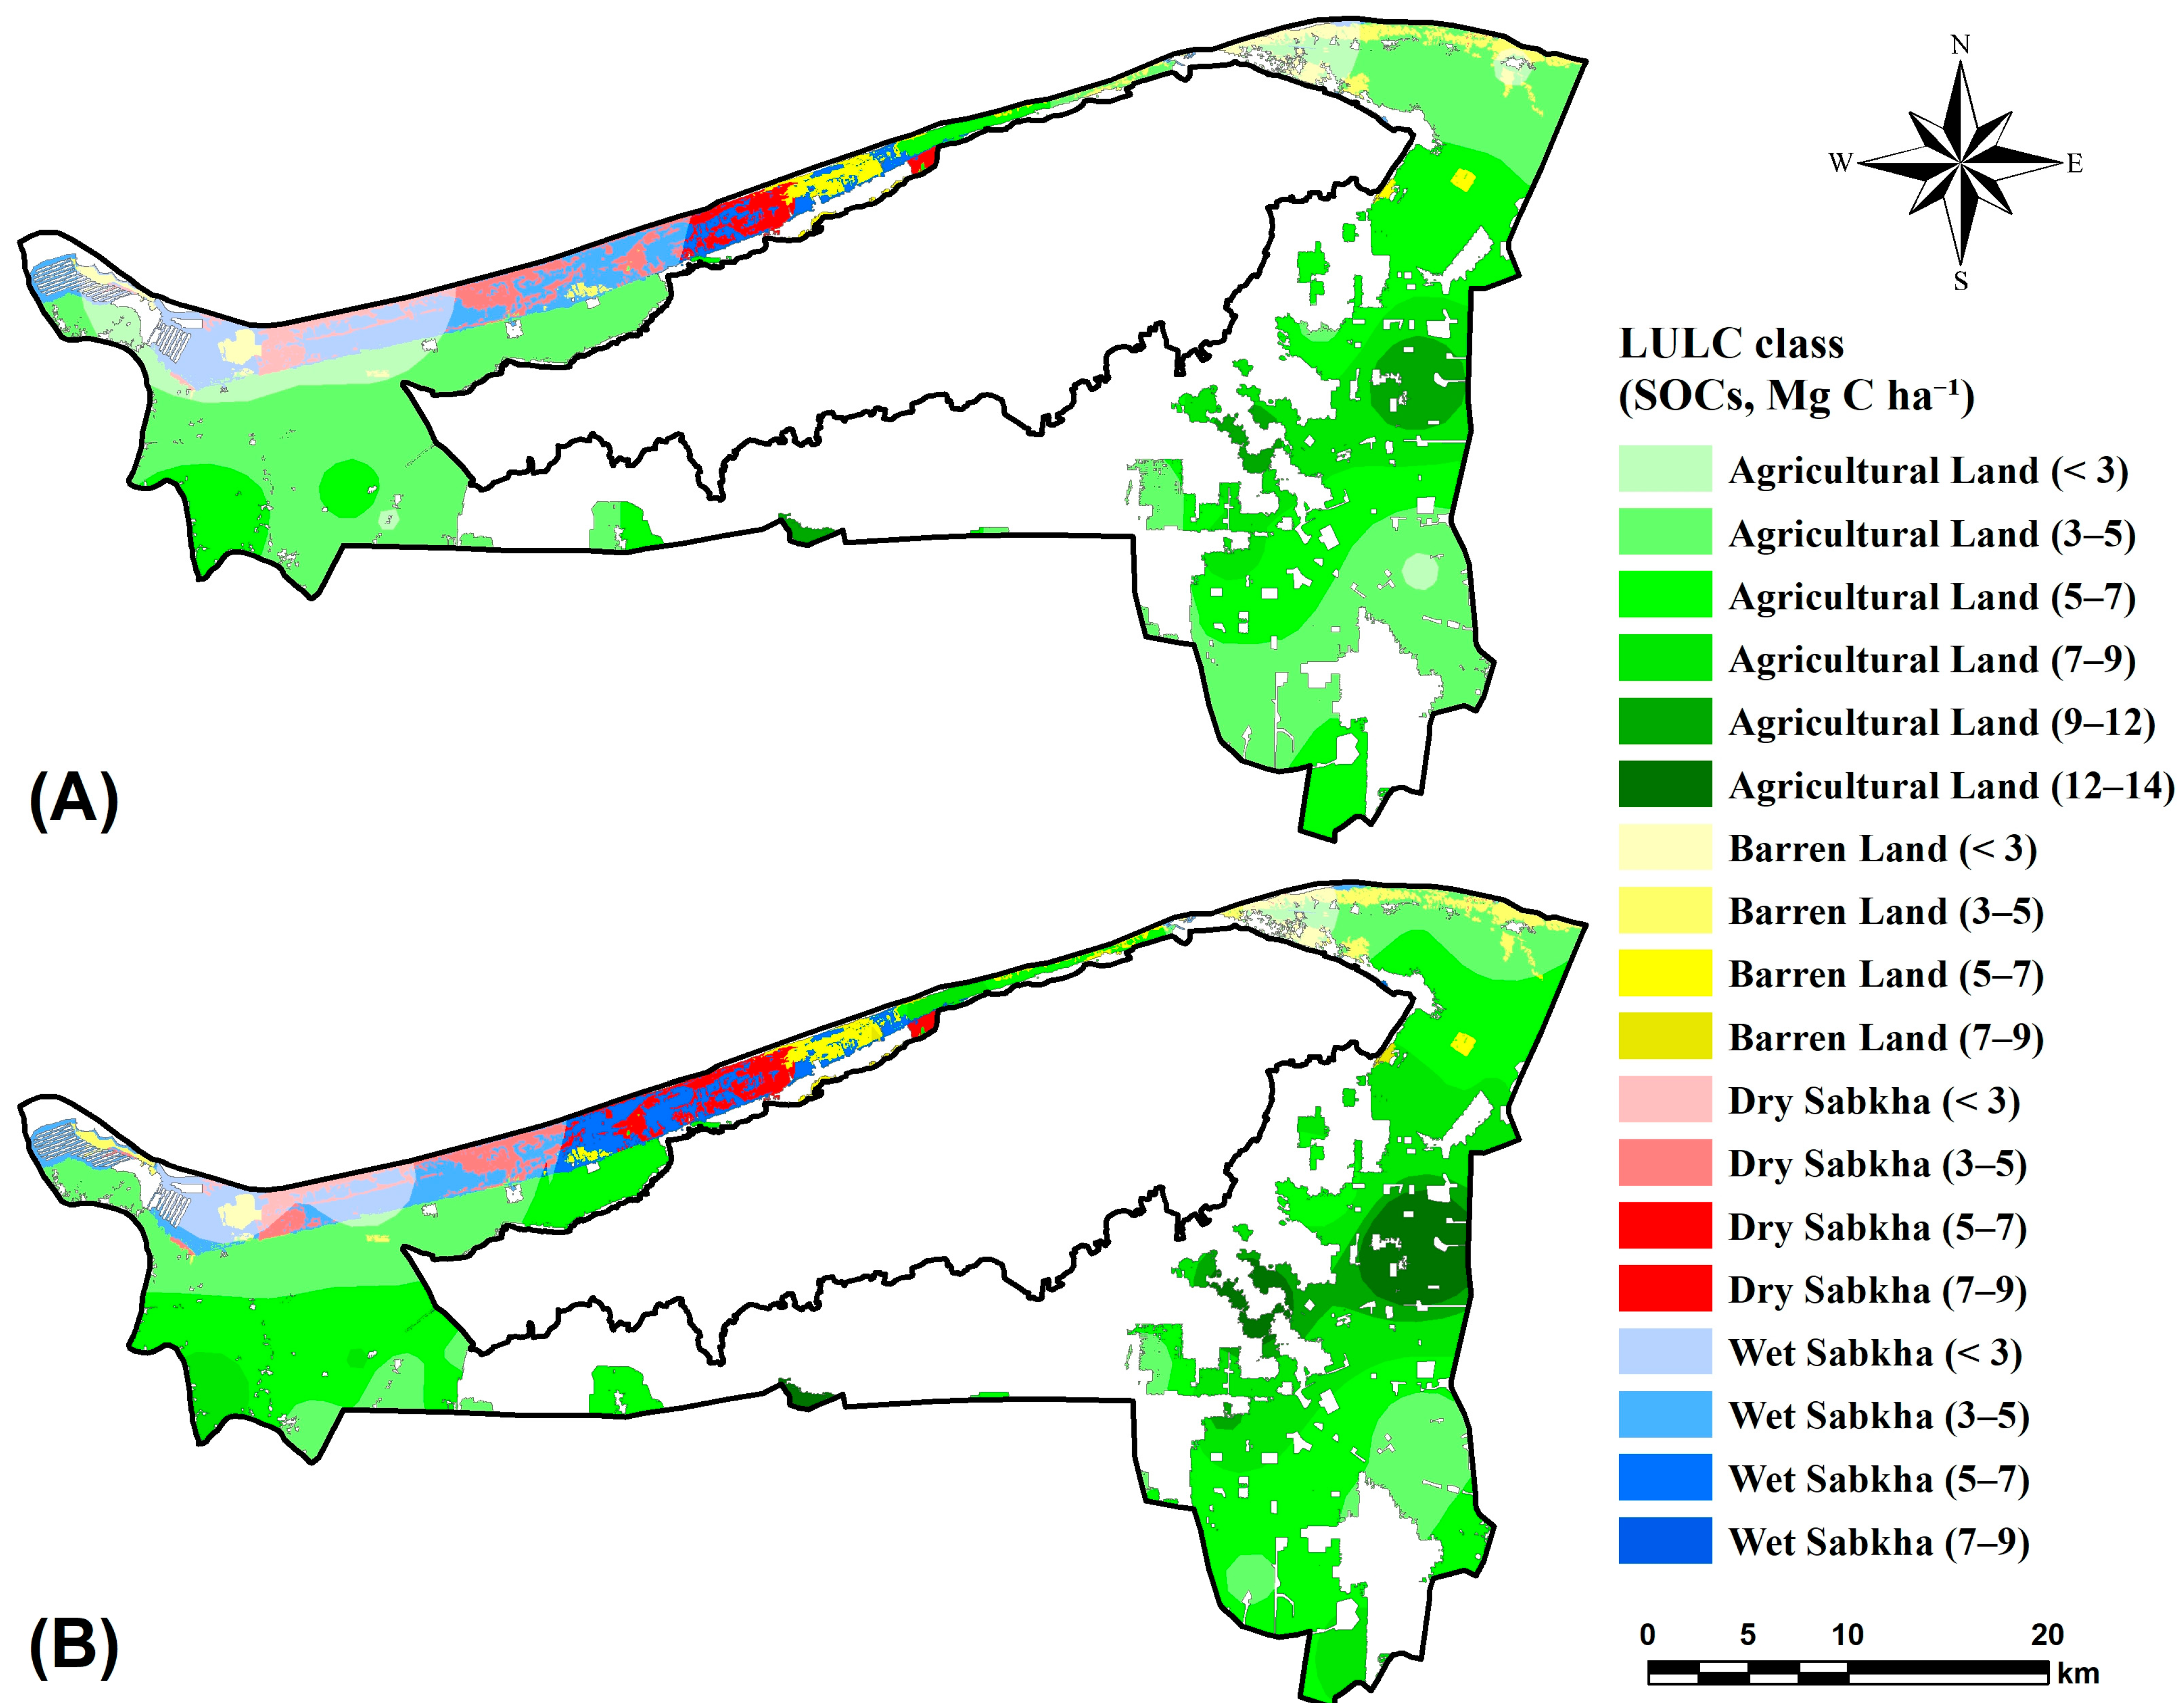
The SOCs calculations were conducted using the 23 soil samples corresponding to four LULC classes—including agricultural land, barren land, dry sabkha, and wet sabkha—based on 2021 LULC classified map (Figure 6). The four LULC classes collectively cover approximately 42% of the study area, excluding fish farms, urban areas, water bodies, and natural vegetation classes in 2021 classified map (Table 2). The spatial distribution of these SOCs is shown in Figure 6, and the proportional coverage of each SOCs class is summarized in Table 5. This distribution provides representative coverage of the LULC classes influencing regional SOCs dynamics. Although the overall sampling density is moderate relative to the total study area, the stratified coverage across geomorphological units supports the representativeness of SOCs estimates and the broader applicability of the methodological workflow to similar deltaic and fragmented coastal environments.
Based on the spatial distribution of SOCs across the four LULC classes (Figure 6), agricultural land dominates the eastern and western parts of the study area, whereas barren land and sabkha are confined to the northern region. SOCs varied markedly among LULC classes and between summer and winter seasons (Figure 6 and Table 5).
In summer, agricultural land exhibited the highest spatial extent of moderate SOCs; the largest proportion (51.8%) of area fell in the 3–5 Mg C ha−1 class. Lower SOCs classes (<3 Mg C ha−1) accounted for 6.1% of agricultural land, while higher SOCs classes (7–9 and 9–12 Mg C ha−1) together comprised only 13.3% of the area. Conversely, barren land and sabkha were dominated by low SOCs classes (<3 and 3–5 Mg C ha−1). For barren land in summer, 37.1% of area was in the <3 Mg C ha−1 class and 34.1% in the 3–5 class, with no representation above 7 Mg C ha−1 (Figure 6 and Table 5). Both dry and wet sabkha showed similar distributions, with the majority of their areas concentrated in the lower classes: for dry sabkha, 31.8% of area had <3 Mg C ha−1 and 38.9% had 35 Mg C ha−1, while wet sabkha had 48.7% and 36.8% in the same classes, respectively.
In winter, SOCs shifted toward higher classes across all LULC types (Figure 6 and Table 5). Agricultural land showed a notable increase in areas within the 5–7 Mg C ha−1 category (43.3%), and the emergence of higher classes (7–9 and 9–12 Mg C ha−1) totaling >22% of its area. The highest SOCs class (12–14 Mg C ha−1) is only observed in the winter season and represents 5.9% of total agricultural land (Figure 6 and Table 5). Barren land and sabkha also exhibited increases in the 5–7 Mg C ha−1 category (34.1–39.4%) compared with summer and show representation in the 7–9 Mg C ha−1 class, albeit at lower proportions (<4%). The lowest class (<3 Mg C ha−1) markedly decreased in all LULC types in winter compared to summer (Figure 6 and Table 5). Total mapped areas were 509 km2 for agricultural land, 27.6 km2 for barren land, 28.3 km2 for dry sabkha, and 53.8 km2 for wet sabkha.
SOCs exhibited clear seasonal differences between summer and winter (Table 6). SOCs ranged from 0.61 to 11.36 Mg C ha−1 in summer and from 1.60 to 13.75 Mg C ha−1 in winter, indicating a wider and generally higher range of C storage during the winter season. Mean SOCs increased from 4.78 Mg C ha−1 in summer to 5.83 Mg C ha−1 in winter, representing a statistically significant seasonal difference (p < 0.001). The SOCs distribution showed moderate variability, with standard deviations of 2.80 Mg C ha−1 (summer) and 3.17 Mg C ha−1 (winter). Median values (50th percentile) increased from 4.28 Mg C ha−1 in summer to 5.30 Mg C ha−1 in winter, while upper quartile values (75th percentile) rose from 6.38 to 7.79 Mg C ha−1, further highlighting enhanced SOC storage during winter.
Both seasonal datasets were positively skewed (skewness = 0.83–1.04) with slightly positive kurtosis (0.65–1.01), indicating a right-tailed distribution with a small number of high SOCs values. Despite the significant seasonal difference in magnitude, SOC stocks measured in summer and winter were almost perfectly correlated (r = 0.997, p < 0.01), suggesting strong temporal stability in the spatial ranking of SOCs across sampling sites.

3.4. Estimated SOCs and PSOCS till 2100

SOCs and PSOCs were predicted to 2100 under four SSP2-4.5 climate scenarios, reflecting progressive increases in temperature (+1.5 to +2.5 °C) and PET (+3% to +12%) and decreasing precipitation (−5% to −20%). The baseline is a calculated SOCs in 2021. The minimum, maximum, and mean values of projected SOCs (Mg C ha−1) and PSOCS (Mg C ha−1) at 10-year intervals are presented in Table 7.
Across the four scenarios, the minimum SOCs values exhibit minimal variation (1.63–1.69 Mg C ha−1), indicating consistent lower bounds across all SSPs and thresholds. Similarly, maximum values vary only slightly, ranging from 14.06 to 14.51 Mg C ha−1. Mean SOCs values remain largely stable across all scenarios and thresholds, with a narrow range of 5.96–6.16 Mg C ha−1 (Table 7). The highest mean values occur under the SSP_Sce1 and SSP_Sce2 scenarios, particularly at the 2050 and 2060 thresholds. The lowest mean is observed under SSP_Sce4 in 2100 (5.96 Mg C ha−1), which may reflect reduced average performance under the highest intensity for SSP_Sce4. A slight declining trend in mean SOCs values is also evident, particularly for SSP_Sce3 and SSP_Sce4 (Table 7). Correspondingly, the minimum PSOCS values display very limited variation (0.03–0.09 Mg C ha−1), whereas maximum values show greater variability, ranging from 0.31 to 0.76 Mg C ha−1. Mean PSOCS values range between 0.13 and 0.32 Mg C ha−1 (Table 7).
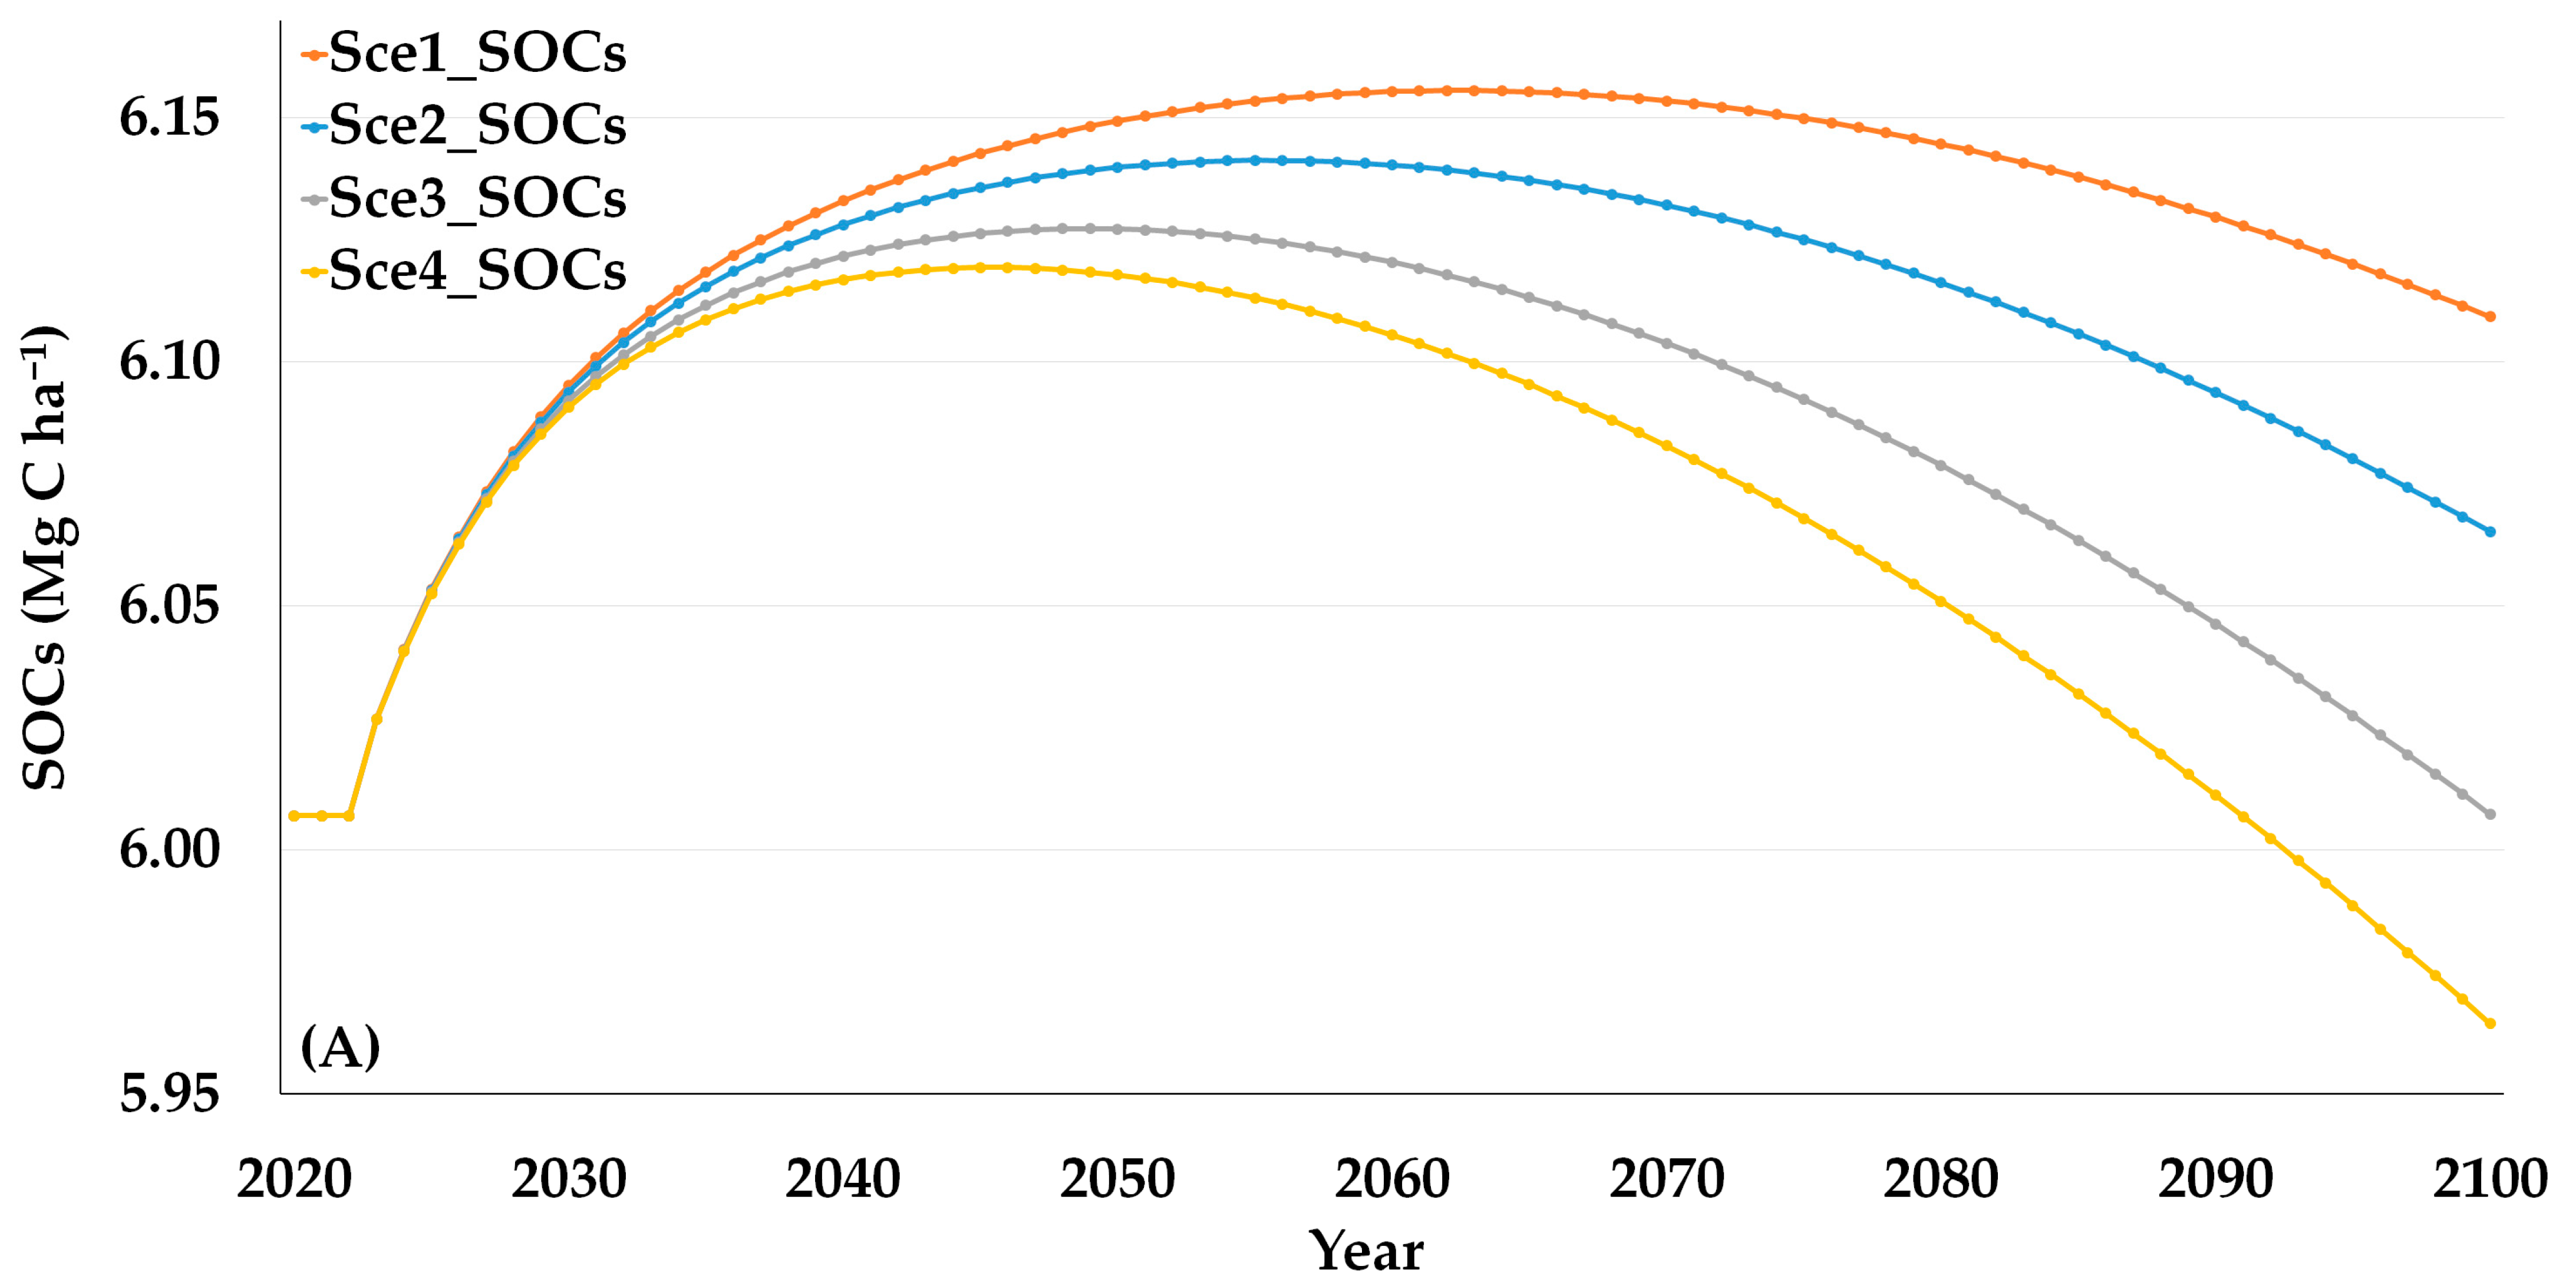
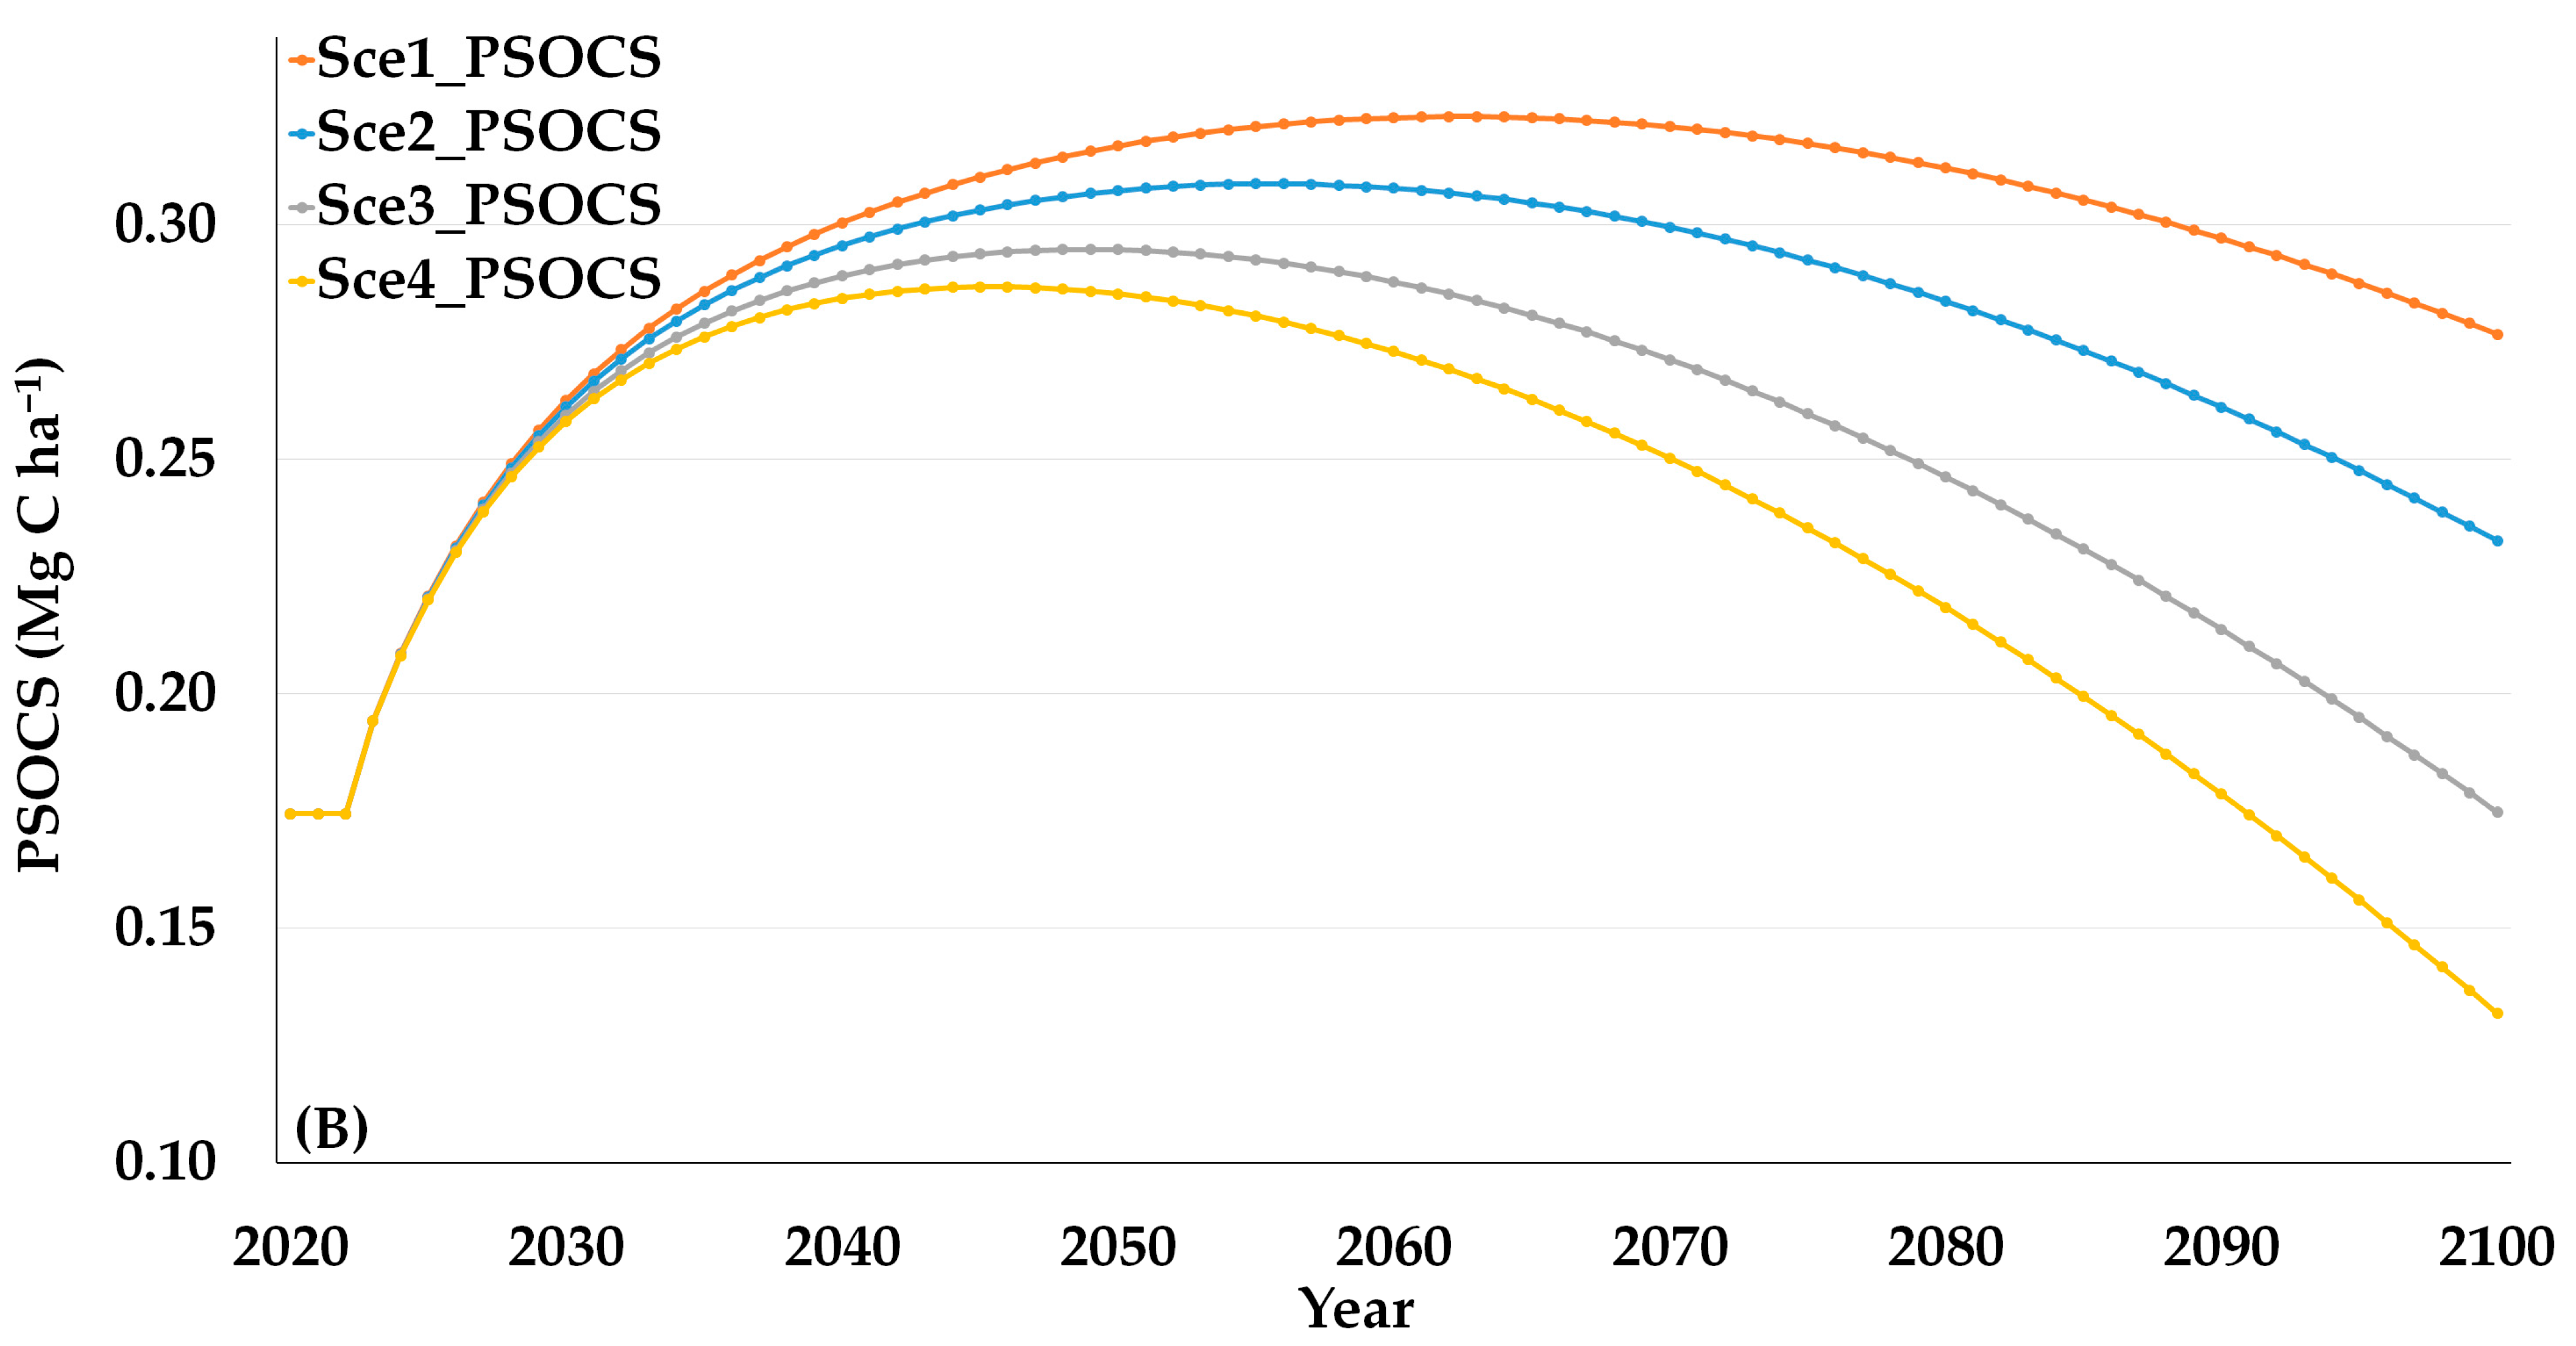
Annual SOCs (Figure 7A) and PSOCS (Figure 7B) were simulated until 2100 using four SSP2-4.5 climate scenarios. The baseline starting with calculated SOCs in 2021 with a consistent value of 5.83 Mg C ha−1 across all scenarios. Under all scenarios, SOCs initially increased during the early decades of the century before plateauing and eventually declining toward 2100 (Figure 7A). Scenario 1 (Sce.1), with the mildest climate change, produced the highest SOCs retention and sequestration rates until around 2050, with SOCs increasing from 5.83 to a peak of 6.16 Mg C ha−1 (Figure 7A). Also, PSOCS rising to 0.32 Mg C ha−1 (Figure 7B). After 2050, Sce.1 exhibited a gradual stabilization of SOCs and PSOCS at mid-century before a slight decline toward the end of the century (6.11, and 0.28 Mg C ha−1 by 2100, respectively).
Progressively stronger warming and moisture stress in Scenario 2 (Sce.2) and Scenario 3 (Sce.3) attenuated SOC accumulation. Peak SOCs under Sce.2 reached 6.14 Mg C ha−1 (mid-century) and declined to 6.07 Mg C ha−1 by 2100. The PSOCS peaking at 0.31 Mg C ha−1 at mid-century and reducing to 0.23 Mg C ha−1 by 2100 (Figure 7A,B). Sce.3, driven by greater temperature increases and precipitation reductions, showed a lower peak (6.13 Mg C ha−1) and stronger decline in sequestration potential to 0.18 Mg C ha−1 by century’s end (Figure 7A,B).
Under the most intense perturbation (Scenario 4, Sce.4), initial SOCs was smallest and reversed earlier, with SOC peaking at 6.13 Mg C ha−1 and declining continuously to 5.96 Mg C ha−1 by 2100. Correspondingly, PSOCS peaked near 0.29 Mg C ha−1 and dropped to 0.13 Mg C ha−1 by 2100. Overall, both absolute SOCs and PSOCS were highest under the mildest climate change scenario and increasingly depressed with greater warming and drying, indicating the strong sensitivity of SOCs dynamics to climatic stressors.

3.5. Monte Carlo Approach of Projected SOCs and PSOCS

Monte Carlo outputs represented median SOC and PSOCS trajectory and associated 5th and 95th percentile uncertainty (Table 8 and Table 9, respectively) at a monthly time step from 2022 to 2100 per each location (number of soil samples = 23). For each scenario, the model outputs were annually averaged per location and then for the entire area at the whole time step. The final parameters were statistically described in Table 8 and Table 9 for projected SOCs and PSOCS, respectively.
The Monte Carlo uncertainty analysis revealed highly consistent projected SOCs across all four SSP2-4.5 climate scenarios (Table 8). The median average of projected SOCs ranged from 6.16 to 6.23 Mg C ha−1 (Table 8). The 5th–95th percentile uncertainty intervals were broad but overlapping for all scenarios, spanning 4.4–8.8 Mg C ha−1. Minimum and maximum median SOCs values showed limited spread among scenarios, with minimum values around 6.00–6.03 Mg C ha−1 and maximum values between 6.22 and 6.27 Mg C ha−1 (Table 8). Accordingly, standard deviations of the median SOCs were low (0.05 Mg C ha−1), with 0.01 Mg C ha−1 corresponding standard errors (Table 8). There was negative skewness for the median across all scenarios (−0.76 to −1.99), indicating a longer lower tail. These distributional characteristics suggest that median SOCs outcomes are mostly stable.
Projected PSOCS followed patterns similar to SOCs (Table 9). The median average of projected PSOCS ranged from 0.33 to 0.40 Mg C ha−1 across scenarios. Despite positive median values, uncertainty bounds were wide, with negative 5th percentiles (−1.44 to −1.48 Mg C ha−1) and positive 95th percentiles (3.0 Mg C ha−1) (Table 9), indicating a substantial probability of both SOC gains and losses over the projection period. For SOCs, differences among scenarios were small. Standard deviations and variances were around 0.0 across scenarios, with left-skewed distributions (Table 9). Overall, these results demonstrate that parametric uncertainty dominates over climate-scenario uncertainty in determining long-term SOC trajectories and sequestration potential in the modeled system.

4. Discussion

4.1. Soil Properties

Descriptive statistics (Table 3) indicated soil characteristics were not normally distributed. Sand content showed a positive skewness, indicating right-sided asymmetry. However, other characteristics exhibited a negative skewness, reflecting left-sided asymmetry distribution. Similar trends were observed for kurtosis, where sand had positive kurtosis, indicated sharper distribution peaks. Whereas other characteristics showed flatter peaks with negative kurtosis. These deviations from normality are common in environmental datasets [91,92,93]. Means and standard deviations for key soil properties are reported in Table 3 to quantitatively support these observations.
Correlation matrix (Table 4) revealed a significant positive correlation between SOC and fine soil fractions (silt and clay), reflecting the role of mineral-associated OC in SOC stabilization. Fine-textured soils afford greater surface area and physicochemical protection for OM, which enhances SOC retention [94,95]. Conversely, SOC was negatively correlated with sand content, reflecting faster OM turnover and weaker SOC stabilization [96]. Supporting these findings, Abu-Hashim et al. [43,97] reported that the clay loam soil (with saturated hydraulic conductivity ranging from 4.5−7.9 cm d−1 and higher clay content) had the highest SOC pool mean of 7.07 kg C m2, whereas the lowest SOC pool of 2.57 kg C m2 was observed in bare soil with a sandy clay loam texture. Bakr and El-Ashry [98] also demonstrated strong correlation between SOM and soil texture, mainly sand and clay fractions. In contrast, Onah et al. [99] observed positive correlation between SOM and sand, but negative correlation with silt and clay.
Seasonal analysis indicated minimal variation in soil texture and SOC, emphasizing the inherent resistance of these properties to short-term climatic fluctuations. Their dynamics appear to be governed primarily by long-term LULC and management changes [100]. SOC was negatively correlated with BD, reflecting improved aggregation and porosity in OM-rich soils [101]. Conversely, BD showed a positive association with sand content and significant seasonal variability, likely driven by changes in soil moisture, tillage, and wetting–drying cycles [102].

4.2. Long-Term LULC Change

The expansion of agricultural land and urban areas reflected sustained population growth, land reclamation efforts, and infrastructure development over the past five decades. Similar trends reported across deltaic and coastal agricultural systems in North Africa and the Middle East [38,41]. The conversion of barren land and sabkha into cropland highlighted intensive human intervention in a land-scarce region. Since 1990s, rapid fish farm expansion has marked a major land-use shift driven by increasing food demand, economic incentives, and declining freshwater availability for traditional agriculture [39].
Fluctuations in the Burullus Lake and natural vegetation reflected interactions among hydrological management, land reclamation, and climate variability. Declines in open water areas align with agricultural and aquaculture encroachment [36,39]. The reduction in barren land, dry sabkha, and wet sabkha from approximately 50% of the study area in the 1970s–1980s to only 7% by 2021 reflects substantial landscape transformation. This change likely resulted from a combination of land reclamation, agricultural expansion, and hydrological variability, including fluctuations in surface water extent. While this transition indicates increased land productivity, it may also reduce natural buffering capacity against flooding, salinity intrusion, and coastal erosion [12,103]. These long-term LULC changes strongly influence SOC dynamics. While conversion to cropland and fish farm can initially increase SOC through enhanced biomass inputs, long-term outcomes depend on management, salinity stress, and hydrological conditions [45,104]. The five-decade LULC analysis offered a critical basis for interpreting SOC patterns and improving SOCs projections under climate change, highlighting the need to integrate land-use planning with climate adaptation in vulnerable delta systems [2,105].

4.3. SOCs Impact on LULC

The LULC-based analysis reveals clear seasonal dynamics and land-cover influences on SOCs (Table 5). Changes in LULC and management strongly impact SOCs and topsoil C storage [67,72]. Higher SOCs in winter across all LULC classes is consistent with reduced decomposition rates and increased soil moisture under cooler conditions, which enhance OM preservation [106].
Barren land and sabkha were dominated by low SOC classes (<5 Mg C ha−1). This reflected limited OM inputs and physiochemical constraints imposed by salinity, alkalinity, and shallow soil profiles. These constraints collectively reduce plant productivity and restrict carbon stabilization processes [107,108,109,110]. In contrast, agricultural lands exhibited higher proportions of intermediate and high SOCs classes, driven by greater organic inputs that enhance C stabilization [111]. The pronounced winter increase in the 5–7 Mg C ha−1 class suggests that seasonal moisture and temperature shifts exert a stronger influence on SOCs in cultivated soils than in barren and sabkha. These findings are consistent with observations in Mediterranean and semi-arid agroecosystems [112,113].
Generally, SOCs distributions reflect the combined influences of climate seasonality, vegetation cover, and soil properties. Winter conditions promote SOC retention, whereas higher temperatures in summer enhance SOC mineralization [114,115,116]. Additionally, increased SOCs in winter lead to increases in the dissolved organic carbon concentrations in adjacent water streams (irrigation and drainage canals) due to runoff influence [117]. Positive SOCs skewness indicates spatial heterogeneity, typical of managed and dryland soils [118]. These findings emphasize the need to account for both seasonal variability and texture-based stabilization processes when targeting PSOCS and parameterizing process-based models such as RothC under future climate scenarios [25,92,119].

4.4. Projected SOCs and PSOCS and Uncertainty Analysis

Future SOCs projections were conducted under a BAU assumption in which post-2021 LULC and management practices remain constant, allowing isolation of climate-driven effects on C dynamics. While this approach reduces compounding uncertainties and clarifies the influence of projected climate change, it does not account for potential future LULC transitions that could substantially modify SOCs trajectories. Incorporating dynamic LULC and management scenarios in future studies would provide a more comprehensive assessment of long-term SOCs responses in rapidly changing deltaic environments.
While LULC change exerts a dominant influence on the spatial distribution of current SOCs, the climate projections applied in this study indicate that rising temperatures and changes in precipitation under SSP2-4.5 will increasingly regulate C stability in the study area. Despite the observed slight increase in projected SOCs, rising temperatures under SSP2-4.5 are expected to accelerate microbial decomposition and increase soil respiration rates, thereby enhancing SOC mineralization and potentially offsetting gains associated with land conversion [8]. Experimental and modeling studies consistently show that SOC turnover exhibits strong temperature sensitivity, particularly in moisture-limited or saline systems, where warming can disproportionately destabilize protected C pools [120]. In addition, projected shifts in precipitation patterns may modify soil moisture regimes, further influencing decomposition kinetics and carbon input dynamics [8].
The close agreement of projected SOCs and PSOCS across the four SSP2-4.5 climate scenarios suggests that climate-scenario uncertainty has a relatively minor influence on long-term SOCs compared with uncertainty in model parameters and inputs. This is consistent with previous RothC-based studies showing that C inputs, soil texture, and decomposition parameters exert stronger control on SOCs than moderate climate differences [121,122,123]. The broad and overlapping uncertainty ranges indicate that plausible variations in C inputs, clay content, and turnover rates can outweigh the effects of differing climate trajectories, particularly under constant management assumptions, as also reported in regional and global SOC modeling studies [15,88,116,124]. Although median PSOCS values were positive across all scenarios, negative lower uncertainty bounds indicate a non-negligible risk of SOCs decline, highlighting the asymmetric nature of sequestration potential. This finding aligns with syntheses emphasizing the high uncertainty for future SOC sequestration, especially where C inputs are marginal or decomposition accelerates under warming [32,66,82,125].
Overall, the study demonstrates the importance of Monte Carlo uncertainty analysis for robust SOCs and PSOCS projections. The uncertainty ranges reported in this study reflect variability in input data, parameter estimates, and initial conditions within a fixed RothC model structure. This approach quantifies parametric uncertainty only. It does not account for structural uncertainty arising from differences in model formulation and process representation across models, which can contribute substantially to variation in projected carbon dynamics [126,127]. Scenario-related uncertainty was partially explored using multiple SSP2-4.5 climate realizations. However, uncertainty associated with other SSP pathways or future LULC transitions was not evaluated. This scenario uncertainty is a widely recognized source of projection spread in environmental models [128]. Therefore, the reported uncertainty bounds should be interpreted as conditional to the selected model structure and scenario assumptions, rather than capturing the full range of possible future SOC outcomes.

5. Conclusions

This study provides an integrated assessment of five decades of LULC change, baseline SOCs, and future SOCs and PSOCS dynamics in the northern Nile delta. Analysis of Landsat imagery from 1972 to 2021 revealed substantial agricultural expansion, urban growth, and fish farm development, accompanied by marked declines in barren land and sabkha areas. While LULC conversion largely explains the present spatial distribution of SOCs, future SOCs trajectories are increasingly affected by projected climate change.
RothC simulations under four SSP2-4.5 climate realizations indicate a mid-century increase in SOCs, followed by slight declines toward 2100. This pattern reflects the interacting effects of climate forcing, where rising temperatures may enhance microbial decomposition and C turnover, potentially offsetting gains from improved land productivity. Although projected changes remain slight in magnitude, they signal growing long-term vulnerability of SOCs under sustained warming, particularly in coastal and saline deltaic systems.
The results highlight that SOCs resilience in the Nile delta depends not only on land-use configuration but also on adaptive management strategies capable of buffering climate-driven C losses. Sustainable soil management, salinity control, and climate-informed land planning will therefore be essential to maintain positive PSOCS and long-term carbon stability. By integrating LULC dynamics with climate projections, this study provides policy-relevant insights for regional C management and supports the development of climate-adaptive LULC strategies in vulnerable delta environments.

Supplementary Materials

The following supporting information can be downloaded at: https://www.mdpi.com/article/10.3390/su18062884/s1, Table S1: The average climatic parameters (1981–2021) for locations a and b (Figure 1B); Table S2: Confusion matrix accuracy assessment of the 1972, 1978, 1984, 1990, 1996, 2002, 2008, 2018, 2021 classified images. All accuracies in percentage (%); Table S3: The RothC model main parameters calculations.

Author Contributions

Conceptualization, methodology, formal analysis, writing—original draft preparation, visualization, supervision, and project administration, N.B. All authors participated in field work, soil samples collection, and laboratory analysis. All authors have read and agreed to the published version of the manuscript.

Funding

This research was funded by Science, Technology & Innovation Funding Authority (STDF), Egypt, grant number 25690.

Institutional Review Board Statement

Not applicable.

Informed Consent Statement

Not applicable.

Data Availability Statement

All data supporting the findings reported in this study are fully presented within the article. Any additional datasets can be made available by the corresponding author.

Conflicts of Interest

The funders had no role in the design of the study; in the collection, analyses, or interpretation of data; in the writing of the manuscript; or in the decision to publish the results.

Abbreviations

The following abbreviations are used in this manuscript:
CCarbon
SOCSoil organic carbon
SOCsSoil organic carbon stock
PSOCSPotential soil organic carbon sequestration
SOMSoil organic matter
CO2Carbon dioxide
GHGGreenhouse-gas
LULCland use/land cover
AFOLUAgriculture, forestry and other land use
RothCRothamsted Carbon model
DPMDecomposable plant material
RPMResistant plant material
BIOMicrobial biomass
HUMHumified organic matter
SLRSea-level rise
MLCMaximum likelihood classifier
GTPsground truth points
BDBulk density
PETPotential evapotranspiration
BAUBusiness as usual
PDFsProbability distribution functions

References

  1. Lehmann, J.; Kleber, M. The contentious nature of soil organic matter. Nature 2015, 528, 60–68. [Google Scholar] [CrossRef]
  2. FAO. RECSOIL: Recarbonization of Global Agricultural Soils. Available online: https://www.fao.org/global-soil-partnership/areas-of-work/recsoil/what-is-soc/en/?utm_source=chatgpt.com (accessed on 2 February 2026).
  3. Yadav, M.; Mittal, R.; Kumari, A.; Bhatia, A.; Khatri, A.; Bhateria, R. Soil Carbon Fractions and Their Role in Climate-Resilient Agriculture: A Review. Sustain. Chem. Clim. Action 2025, 7, 100127. [Google Scholar] [CrossRef]
  4. Bryan, E.; Ringler, C.; Okoba, B.; Koo, J.; Herrero, M.; Silvestri, S. Agricultural management for climate change adaptation, greenhouse gas mitigation, and agricultural productivity: Insights from Kenya. In IFPRI Discussion Paper 1098; Environment and Production Technology Division: Thiruvananthapuram, Kerala, 2011. [Google Scholar]
  5. Bradford, M.A.; Wieder, W.R.; Bonan, G.B.; Fierer, N.; Raymond, P.A.; Crowther, T.W. Managing uncertainty in soil carbon feedbacks to climate change. Nat. Clim. Change 2016, 6, 751–758. [Google Scholar] [CrossRef]
  6. Filippi, P.; Minasny, B.; Cattle, S.R.; Bishop, T.F.A. Chapter Four-Monitoring and Modeling Soil Change: The Influence of Human Activity and Climatic Shifts on Aspects of Soil Spatiotemporally. Adv. Agron. 2016, 139, 153–214. [Google Scholar]
  7. Lal, R.; Negassa, W.; Lorenz, K. Carbon sequestration in soil. Curr. Opin. Environ. Sustain. 2015, 15, 79–86. [Google Scholar] [CrossRef]
  8. IPCC. Climate Change 2021: The Physical Science Basis; Masson-Delmotte, V., Zhai, P., Pirani, A., Connors, S.L., Péan, C., Berger, S., Caud, N., Chen, Y., Goldfarb, L., Gomis, M.I., et al., Eds.; Contribution of Working Group I to the Sixth Assessment Report of the Intergovernmental Panel on Climate Change; Cambridge University Press: Cambridge, UK; New York, NY, USA, 2021; 2409p. [Google Scholar]
  9. Abrar, M.M.; Waqas, M.A.; Mehmood, K.; Fan, R.; Memon, M.S.; Khan, M.A.; Siddique, N.; Xu, M.; Du, J. Organic carbon sequestration in global croplands: Evidenced through a bibliometric approach. Front. Environ. Sci. 2025, 13, 1495991. [Google Scholar] [CrossRef]
  10. Lal, R. Beyond COP21: Potential and challenges of the “4per Thousand” initiative. J. Soil Water Conserv. 2016, 71, 20A–25A. [Google Scholar] [CrossRef]
  11. FAO. Soil Organic Carbon: The Hidden Potential; Food and Agriculture Organization of the United Nations: Rome, Italy, 2017; 90p. [Google Scholar]
  12. Karstens, K.; Bodirsky, B.L.; Dietrich, J.P.; Dondini, M.; Heinke, J.; Kuhnert, M.; Müller, C.; Rolinski, S.; Smith, P.; Weindl, I.; et al. Management-induced changes in soil organic carbon on global croplands. Biogeosciences 2022, 19, 5125–5149. [Google Scholar] [CrossRef]
  13. Tan, Z.X.; Lal, R.; Smeck, N.E.; Calhoun, F.G. Relationships between surface soil organic carbon pool and site variables. Geoderma 2004, 121, 187–195. [Google Scholar] [CrossRef]
  14. Wang, H.; Cai, T.; Tian, X.; Chen, Z.; He, K.; Wang, Z.; Gong, H.; Miao, Q.; Wang, Y.; Chu, Y.; et al. Global patterns of soil organic carbon distribution in the 20–100 cm soil profile for different ecosystems: A global meta-analysis. Earth Syst. Sci. Data 2025, 17, 3375–3390. [Google Scholar] [CrossRef]
  15. Peralta, G.; Di Paolo, L.; Luotto, I.; Omuto, C.; Mainka, M.; Viatkin, K.; Yigini, Y. Global Soil Organic Carbon Sequestration Potential Map (GSOCseq v1.1)-Technical Manual; FAO: Rome, Italy, 2022; 181p. [Google Scholar]
  16. Crézé, C.; Saatchi, S.; Kwon, N.; Yang, Y.; Li, S. High-resolution global map (100 m) of soil organic carbon reveals critical ecosystems for carbon storage. Earth Syst. Sci. Data 2025, preprint. [Google Scholar]
  17. de Blécourt, M.; Corre, M.D.; Paudel, E.; Harrison, R.D.; Brumme, R.; Veldkamp, E. Spatial variability in soil organic carbon in a tropical montane landscape: Associations between soil organic carbon and land use, soil properties, vegetation, and topography vary across plot to landscape scales. Soil 2017, 3, 123–137. [Google Scholar] [CrossRef]
  18. Moinet, G.Y.; Hijbeek, R.; van Vuuren, D.P.; Giller, K.E. Carbon for soils, not soils for carbon. Glob. Change Biol. 2023, 29, 2384–2398. [Google Scholar] [CrossRef]
  19. Smith, P.; Fang, C.; Dawson, J.J.C.; Moncrieff, J.B. Impact of global warming on soil organic carbon. Adv. Agron. 2008, 97, 1–43. [Google Scholar]
  20. Zomer, R.J.; Bossio, D.A.; Sommer, R.; Verchot, L.V. Global sequestration potential of increased organic carbon in cropland soils. Sci. Rep. 2017, 7, 15554. [Google Scholar] [CrossRef]
  21. Govers, G.; Merckx, R.; Van Oost, K.; van Wesemael, B. Managing Soil Organic Carbon for Global Benefits: A STAP Technical Report; Global Environment Facility: Washington, DC, USA, 2013; 72p. [Google Scholar]
  22. Jenkinson, D.S. The turnover of organic carbon and nitrogen in soil. Philos. Trans. R. Soc. B. 1990, 329, 361–368. [Google Scholar] [CrossRef]
  23. Coleman, K.; Jenkinson, D.S. RothC-26.3-A Model for the turnover of carbon in soil. In Evaluation of Soil Organic Matter Models; Powlson, D.S., Smith, P., Smith, J.U., Eds.; NATO ASI Series; Springer: Berlin/Heidelberg, Germany, 1996; Volume 38, pp. 237–246. [Google Scholar]
  24. Farina, R.; Coleman, K.; Whitmore, A.P. Modification of the RothC model for simulations of soil organic C dynamics in dryland regions. Geoderma 2013, 200–201, 18–30. [Google Scholar] [CrossRef]
  25. Afzali, S.F.; Azad, B.; Golabi, M.H.; Francaviglia, R. Using RothC model to simulate soil organic carbon stocks under different climate change scenarios for the rangelands of the arid regions of southern Iran. Water 2019, 11, 2107. [Google Scholar] [CrossRef]
  26. Morais, T.G.; Teixeira, R.F.; Domingos, T. Detailed global modelling of soil organic carbon in cropland, grassland and forest soils. PLoS ONE 2019, 14, e0222604. [Google Scholar] [CrossRef]
  27. Singh, P.; Benbi, D.K. Modeling soil organic carbon with DNDC and RothC models in different wheat-based cropping systems in north-western India. Commun. Soil Sci. Plant Anal. 2020, 51, 1184–1203. [Google Scholar] [CrossRef]
  28. Rotich, H.K.; Onwonga, R.; Koech, O.; Mbau, J. Projected changes in soil organic carbon stocks over a 50-year period under different grazing management systems in semi-arid grasslands of Kenya. J. Rangel. Sci. 2020, 10, 357–369. [Google Scholar]
  29. Geremew, B.; Tadesse, T.; Bedadi, B.; Gollany, H.T.; Tesfaye, K.; Aschalew, A.; Tilaye, A.; Abera, W. Evaluation of RothC model for predicting soil organic carbon stock in north-west Ethiopia. Environ. Chall. 2024, 15, 100909. [Google Scholar] [CrossRef]
  30. Omwoyo, A.M.; Onwonga, R.N.; Wasonga, O.V.; Mwangi, K.J. Sequestration potential of soil organic carbon under selected land use, land cover and climate change scenarios in Kibwezi West dryland, Eastern Kenya. Discov. Soil 2025, 2, 74. [Google Scholar] [CrossRef]
  31. Jordon, M.W.; Smith, P. Modelling soil carbon stocks following reduced tillage intensity: A framework to estimate decomposition rate constant modifiers for RothC-26.3, demonstrated in north-west Europe. Soil Till. Res. 2022, 222, 105428. [Google Scholar] [CrossRef]
  32. Jiang, W.; Lin, Z.; Qin, Z.; Lu, X.; Zhang, W.; Zhang, Q.; Ye, S.; Li, H.; Ge, H.; Wang, G. Climate-management interactions drive soil organic carbon sequestration potential in China’s croplands over 2020–2060. Soil Environ. Health 2025, 3, 100159. [Google Scholar] [CrossRef]
  33. Ali, E.; Cramer, W.; Carnicer, J.; Georgopoulou, E.; Hilmi, N.J.M.; Le Cozannet, G.; Lionello, P. Cross-Chapter Paper 4: Mediterranean Region. In Climate Change 2022: Impacts, Adaptation and Vulnerability; Pörtner, H.O., Roberts, D.C., Tignor, M., Poloczanska, E.S., Mintenbeck, K., Alegría, A., Craig, M., Langsdorf, S., Löschke, S., Möller, V., et al., Eds.; Contribution of Working Group II to the Sixth Assessment Report of the Intergovernmental Panel on Climate Change; Cambridge University Press: Cambridge, UK; New York, NY, USA, 2022; pp. 2233–2272. [Google Scholar]
  34. Abd-Elaty, I.; Kuriqi, A.; Ramadan, E.M.; Ahmed, A.A. Hazards of sea level rise and dams built on the River Nile on water budget and salinity of the Nile Delta aquifer. J. Hydrol. Reg. Stud. 2024, 51, 101600. [Google Scholar] [CrossRef]
  35. Hassan, S.; Saleh, M.; Mohamed, B.; Elhebiry, M.S.; Abdeldayem, A.; Issawy, E.; Zahran, K.; Kamh, S. Environmental risk assessment of the Nile Delta, Egypt, based on radar interferometry, altimetry, and geodetic measurements. Sci. Rep. 2025, 15, 19209. [Google Scholar] [CrossRef]
  36. Dewidar, K.H.M. Detection of land use/land cover changes for the northern part of the Nile delta (Burullus region), Egypt. Int. J. Remote Sens. 2004, 25, 4079–4089. [Google Scholar] [CrossRef]
  37. Morgan, R.S.; El-Araby, A.; Ghabour, T.K.; Abd-Elwahed, M.S. Anthropogenic Impacts on the Land and Water Quality of El-Burullus Wetlands. J. Appl. Sci. Res. 2013, 9, 2833–2841. [Google Scholar]
  38. Bakr, N.; Afifi, A.A. Quantifying land use/land cover change and its potential impact on rice production in the Northern Nile Delta, Egypt. Remote Sen. Appl. Soc. Environ. 2019, 13, 348–360. [Google Scholar] [CrossRef]
  39. Keshta, A.E.; Riter, J.C.A.; Shaltout, K.H.; Baldwin, A.H.; Kearney, M.; Sharaf El-Din, A.; Eid, E.M. Loss of Coastal Wetlands in Lake Burullus, Egypt: A GIS and Remote-Sensing Study. Sustainability 2022, 14, 4980. [Google Scholar] [CrossRef]
  40. Alkhawaga, A.; Zeidan, B.; Elshemy, M. Climate change impacts on water security elements of Kafr El-Sheikh governorate, Egypt. Agri. Water Manag. 2022, 259, 107217. [Google Scholar] [CrossRef]
  41. Alkhawaga, A.; Mohamed, M.; Zeidan, B.; Elshemy, M.; Elshinnawy, A. Assessment of land use/land cover changes for Kafr El-Sheikh governorate, Egypt, utilizing remote sensing. Sci. Rep. 2025, 15, 12600. [Google Scholar] [CrossRef]
  42. Eid, M.E.; Shaltout, K.H. Evaluation of carbon sequestration potentiality of Lake Burullus, Egypt to mitigate climate change. Egypt. J. Aqua. Res. 2013, 39, 31–38. [Google Scholar] [CrossRef]
  43. Abu-hashim, M.; Elsayed, M.; Belal, A.E. Effect of land-use changes and site variables on surface soil organic carbon pool at Mediterranean Region. J. Afr. Earth Sci. 2016, 114, 78–84. [Google Scholar] [CrossRef]
  44. Mohamed, E.S.; Abu-hashim, M.; AbdelRahman, M.A.; Schütt, B.; Lasaponara, R. Evaluating the effects of human activity over the last decades on the soil organic carbon pool using satellite imagery and GIS techniques in the Nile Delta Area, Egypt. Sustainability 2019, 11, 2644. [Google Scholar] [CrossRef]
  45. Arshad, M.; Khedher, K.M.; Ayed, H.; Mouldi, A.; Moghanm, F.S.; El Ouni, M.H.; Benkahla, N.; Laatar, E.; Bilal, M.; Abdel Zaher, M. Effects of land use and cultivation histories on the distribution of soil organic carbon stocks in the area of the Northern Nile Delta in Egypt. Carbon Manag. 2020, 11, 341–354. [Google Scholar] [CrossRef]
  46. El-Asmar, H.M.; Hereher, M.E.; El Kafrawy, S.B. Surface area change detection of the Burullus Lagoon, North of the Nile Delta, Egypt, using water indices: A remote sensing approach. Egypt. J. Remote Sens. Space Sci. 2013, 16, 119–123. [Google Scholar] [CrossRef]
  47. Guirguis, S.K.; Hassan, H.M.; El_Raey, M.; Hussain, M.A. Multi-temporal change of Lake Burullus, Egypt, from 1983 to 1991. Int. J. Remote Sens. 1996, 17, 2915–2921. [Google Scholar] [CrossRef]
  48. Hossen, H.; Negm, A. Change detection in the water bodies of Burullus Lake, Northern Nile Delta, Egypt, using RS/GIS. Proc. Eng. 2016, 154, 951–958. [Google Scholar] [CrossRef]
  49. Khalil, M.T. Physical and Chemical Properties of Egypt’s Coastal Wetlands; Burullus Wetland as a Case Study. In Egyptian Coastal Lakes and Wetlands: Part I—Characteristics and Hydrodynamics; Negm, A., Bek, M., Abdel-Fattah, S., Eds.; The Handbook of Environmental Chemistry; Springer: Berlin/Heidelberg, Germany, 2018; Volume 71, pp. 83–101. [Google Scholar]
  50. Abd El-sadek, E.; Elbeih, S.; Negm, A. Coastal and landuse changes of Burullus Lake, Egypt: A comparison using Landsat and Sentinel-2 satellite images. Egypt. J. Remote Sens. Space Sci. 2022, 25, 815–829. [Google Scholar] [CrossRef]
  51. Ali, R.R. Evaluation of Land Degradation in Some Areas in Middle and North Nile Delta, Egypt. Ph.D. Thesis, Faculty of Agriculture, Cairo University, Giza, Egypt, 2003. [Google Scholar]
  52. Hegazi, A.M.; Afifi, M.Y.; El Shorbagy, M.A.; Elwan, A.A.; El-Demerdashe, S. Egyptian National Action Program to Combat Desertification; Arab Republic of Egypt, Ministry of Agriculture and Land Reclamation: Giza, Egypt; UNCCD: Cairo, Egypt; Desert Research Centre: Cairo, Egypt, 2005; 128p.
  53. Darwish, K.M.; Abdel Kawy, W.A. Quantitative assessment of soil degradation in some areas North Nile Delta, Egypt. Int. J. Geol. 2008, 2, 17–22. [Google Scholar]
  54. IPCC. Agriculture, forestry and other land use. In IPCC Guidelines for National Greenhouse Gas Inventories; Eggleston, H.S., Buendia, L., Miwa, K., Ngara, T., Tanabe, K., Eds.; Prepared by the National Greenhouse Gas Inventories Programme; IGES: Kanagawa, Japan, 2006; Volume 4. [Google Scholar]
  55. Soil Survey Staff. Keys to Soil Taxonomy, 13th ed.; United State Department of Agriculture-Natural Resources Conservation Service: Madison, WI, USA, 2022; p. 410.
  56. ESRI. ArcGIS Desktop: Release 10.4; Environmental Systems Research Institute: Redlands, CA, USA, 2016. [Google Scholar]
  57. Richards, J.A.; Jia, X. Supervised Classification Techniques. In Remote Sensing Digital Image Analysis: An Introduction; Springer: Berlin/Heidelberg, Germany, 2006; pp. 193–247. [Google Scholar]
  58. Li, C.; Wang, J.; Wang, L.; Hu, L.; Gong, P. Comparison of classification algorithms and training sample sizes in urban land classification with Landsat thematic mapper imagery. Remote Sens. 2014, 6, 964–983. [Google Scholar] [CrossRef]
  59. Valero Medina, J.A.; Alzate Atehortúa, B.E. Comparison of maximum likelihood, support vector machines, and random forest techniques in satellite images classification. Tecnura 2019, 23, 3–10. [Google Scholar] [CrossRef]
  60. Bakr, N.; Morsy, I.; Yehia, H.A. Spatio-temporal land use/cover detection and prediction in Mediterranean region: A case study in Idku ecosystem, Egypt. Remote Sen. Appl. Soc. Environ. 2022, 25, 100673. [Google Scholar] [CrossRef]
  61. Gee, G.W.; Or, D. Particle Size Analysis. In Methods of Soil Analysis: Part 4 Physical Methods; Dane, J.H., Topp, G.C., Eds.; Book Series No. 5; Soils Science Society of America: Madison, WI, USA, 2002; pp. 255–293. [Google Scholar]
  62. Walkley, A.; Black, I.A. An examination of Degtjareff method for determining soil organic matter, and a proposed modification of the chromic acid titration method. Soil Sci. 1934, 37, 29–38. [Google Scholar] [CrossRef]
  63. Grossman, R.B.; Reinsch, T.G. Bulk Density and Linear Extensibility: Core Method. In Methods of Soil Analysis: Part 4, Physical Methods; Dane, J.H., Topp, G.C., Eds.; Book Series No. 5; Soils Science Society of America: Madison, WI, USA, 2002; pp. 208–228. [Google Scholar]
  64. Guo, L.B.; Gifford, R.M. Soil carbon stocks and land use change: A meta analysis. Glob. Change Biol. 2002, 8, 345–360. [Google Scholar] [CrossRef]
  65. IPCC. Good Practice Guidance for Land Use, Land-Use Change and Forestry; Penman, J., Gytarsky, M., Hiraishi, T., Krug, T., Kruger, D., Pipatti, R., Buendia, L., Miwa, K., Ngara, T., Tanabe, K., et al., Eds.; Prepared by the National Greenhouse Gas Inventories Programme; IGES: Kanagawa, Japan, 2003; p. 590. [Google Scholar]
  66. FAO. Measuring and Modelling Soil Carbon Stocks and Stock Changes in Livestock Production Systems: Guidelines for Assessment (Version 1); Livestock Environmental Assessment and Performance (LEAP) Partnership, Licence: CC BY-NC-SA 3.0 IGO; FAO: Rome, Italy, 2019; 170p. [Google Scholar]
  67. Wairiu, M.; Lal, R. Soil organic carbon in relation to cultivation and topsoil removal on sloping lands of Kolombangara, Solomon Islands. Soil Tillage Res. 2003, 70, 19–27. [Google Scholar] [CrossRef]
  68. Yigini, Y.; Panagos, P. Assessment of soil organic carbon stocks under future climate and land cover changes in Europe. Sci. Total Environ. 2016, 557–558, 838–850. [Google Scholar] [CrossRef]
  69. Chen, S.; Chen, Z.; Zhang, X.; Luo, Z.; Schillaci, C.; Arrouays, D.; Richer-de-Forges, A.C.; Shi, Z. European topsoil bulk density and organic carbon stock database (0–20 cm) using machine-learning-based pedotransfer functions. Earth Syst. Sci. Data 2024, 16, 2367–2383. [Google Scholar] [CrossRef]
  70. Zeng, R.; Wei, Y.; Huang, J.; Chen, X.; Cai, C. Soil organic carbon stock and fractional distribution across central-south China. Int. Soil Water Conserv. Res. 2021, 9, 620–630. [Google Scholar] [CrossRef]
  71. Li, W.; Yang, Z.; Jiang, J.; Sun, G. Spatial Variation and Stock Estimation of Soil Organic Carbon in Cropland in the Black Soil Region of Northeast China. Agronomy 2024, 14, 2744. [Google Scholar] [CrossRef]
  72. Sharma, G.; Sharma, L.K.; Sharma, K.C. Assessment of land use change and its effect on soil carbon stock using multitemporal satellite data in semiarid region of Rajasthan, India. Ecolog. Proc. 2019, 8, 42. [Google Scholar] [CrossRef]
  73. Abd-Elmabod, S.K.; Fitch, A.C.; Zhang, Z.; Ali, R.R.; Jones, L. Rapid urbanisation threatens fertile agricultural land and soil carbon in the Nile delta. J. Environ. Manag. 2019, 252, 109668. [Google Scholar] [CrossRef] [PubMed]
  74. IBM Corp. IBM SPSS Statistics for Windows, Version 26.0; [Computer Software]; IBM Corp: Armonk, NY, USA, 2019. [Google Scholar]
  75. Riahi, K.; van Vuuren, D.P.; Kriegler, E.; Edmonds, J.; O’Neill, B.C.; Fujimori, S.; Bauer, N.; Calvin, K.; Dellink, R.; Fricko, O.; et al. The Shared Socioeconomic Pathways and their energy, land use, and greenhouse gas emissions implications: An overview. Global Environ. Change 2017, 42, 153–168. [Google Scholar] [CrossRef]
  76. IPCC. Climate Change 2023: Synthesis Report. Contribution of Working Groups I, II and III to the Sixth Assessment Report of the Intergovernmental Panel on Climate Change; Lee, H., Romero, J., Eds.; IPCC: Geneva, Switzerland, 2023; 184p. [Google Scholar]
  77. Almazroui, M.; Saeed, F.; Saeed, S.; Nazrul Islam, M.; Ismail, M.; Klutse, N.A.B.; Siddiqui, M.H. Projected change in temperature and precipitation over Africa from CMIP6. Earth Syst. Environ. 2020, 4, 455–475. [Google Scholar] [CrossRef]
  78. Ajjur, S.B.; Al-Ghamdi, S.G. Evapotranspiration and water availability response to climate change in the Middle East and North Africa. Clim. Change 2021, 166, 28. [Google Scholar] [CrossRef]
  79. Zittis, G.; Almazroui, M.; Alpert, P.; Ciais, P.; Cramer, W.; Dahdal, Y.; Fnais, M.; Francis, D.; Hadjinicolaou, P.; Howari, F.; et al. Climate change and weather extremes in the Eastern Mediterranean and Middle East. Rev. Geophys. 2022, 60, e2021RG000762. [Google Scholar] [CrossRef]
  80. Hamed, M.M.; Salehie, O.; Nashwan, M.S.; Shahid, S. Projection of temperature extremes of Egypt using CMIP6 GCMs under multiple shared socioeconomic pathways. Environ. Sci. Pollut. Res. 2023, 30, 38063–38075. [Google Scholar] [CrossRef]
  81. Posit Team. RStudio: Integrated Development Environment for R, Posit Software; PBC: Boston, MA, USA, 2025; Available online: http://www.posit.co/ (accessed on 2 February 2026).
  82. Gutierrez, S.; Grados, D.; Møller, A.B.; de Carvalho Gomes, L.; Beucher, A.M.; Giannini-Kurina, F.; de Jonge, L.W.; Greve, M.H. Unleashing the sequestration potential of soil organic carbon under climate and land use change scenarios in Danish agroecosystems. Sci. Total Environ. 2023, 905, 166921. [Google Scholar] [CrossRef]
  83. Sierra, C.A.; Mueller, M.; Trumbore, S.E. Models of soil organic matter decomposition: The SoilR package, version 1.0. Geosci. Model Dev. 2012, 5, 1045–1060. [Google Scholar] [CrossRef]
  84. Soetaert, K.; Petzoldt, T.; Setzer, R.W. Solving differential equations in R: Package deSolve. J. Stat. Softw. 2010, 33, 1–25. [Google Scholar] [CrossRef]
  85. Wickham, H.; Hester, J.; Bryan, J. readr: Read Rectangular Text Data, R package version 2.1.6, Posit Software: Boston, MA, USA, 2025. Available online: https://readr.tidyverse.org (accessed on 2 February 2026).
  86. Wickham, H.; François, R.; Henry, L.; Müller, K.; Vaughan, D. dplyr: A Grammar of Data Manipulation, R package version 1.1.4; Posit Software: Boston, MA, USA, 2025; Available online: https://dplyr.tidyverse.org (accessed on 2 February 2026).
  87. Thornthwaite, C.W. An approach toward a rational classification of climate. Geogr. Rev. 1948, 35, 55–94. [Google Scholar] [CrossRef]
  88. Falloon, P.; Smith, P.; Coleman, K.; Marshall, S. Estimating the size of the inert organic matter pool for use in the Rothamsted carbon model. Soil Biol. Biochem. 1998, 30, 1207–1211. [Google Scholar] [CrossRef]
  89. Metropolis, N.; Ulam, S. The Monte Carlo method. J. Am. Stat. Assoc. 1949, 44, 335–341. [Google Scholar] [CrossRef] [PubMed]
  90. Ogle, S.M.; Breidt, F.J.; Easter, M.; Williams, S.; Killian, K.; Paustian, K. Scale and uncertainty in modeled soil organic carbon stock changes for US croplands using a process-based model. Glob. Change Biol. 2010, 16, 810–822. [Google Scholar] [CrossRef]
  91. Newman, M.C. Regression analysis of log-transformed data: Statistical bias and its correction. Environ. Toxicol. Chem. 1993, 12, 1129–1133. [Google Scholar] [CrossRef]
  92. Reimann, C.; Filzmoser, P. Normal and lognormal data distribution in geochemistry: Death of a myth. Consequences for the statistical treatment of geochemical and environmental data. Environ. Geol. 2000, 39, 1001–1014. [Google Scholar] [CrossRef]
  93. Sainani, K.L. Dealing with non-normal data. PM&R 2012, 4, 1001–1005. [Google Scholar]
  94. Cotrufo, M.F.; Ranalli, M.G.; Haddix, M.L.; Six, J.; Lugato, E. Soil carbon storage informed by particulate and mineral-associated organic matter. Nat. Geosci. 2019, 12, 989–994. [Google Scholar] [CrossRef]
  95. Lavallee, J.M.; Soong, J.L.; Cotrufo, M.F. Conceptualizing soil organic matter into particulate and mineral-associated forms to address global change in the 21st century. Glob. Change Biol. 2020, 26, 261–273. [Google Scholar] [CrossRef]
  96. Six, J.; Conant, R.T.; Paul, E.A.; Paustian, K. Stabilization mechanisms of soil organic matter: Implications for C-saturation of soils. Plant Soil 2002, 241, 155–176. [Google Scholar] [CrossRef]
  97. Abu-Hashim, M.; Mohamed, E.; Belal, A.E. Identification of potential soil water retention using hydric numerical model at arid regions by land-use changes. Int. Soil Water Conserv. Res. 2015, 3, 305–315. [Google Scholar] [CrossRef]
  98. Bakr, N.; El-Ashry, S.M. Organic matter determination in arid region soils: Loss-on-ignition versus wet oxidation. Comm. Soil Sci. Plant Anal. 2018, 49, 2587–2601. [Google Scholar] [CrossRef]
  99. Onah, M.C.; Obalum, S.E.; Uzoh, I.M. Vertical distribution of fertility indices and textural properties of a sandy clay loam under short and long-term fallow. Int. J. Agri. Rural Dev. 2021, 24, 5697–5703. [Google Scholar]
  100. Lal, R. Food security impacts of the “4 per Thousand” initiative. Geoderma 2020, 374, 114427. [Google Scholar] [CrossRef]
  101. Blanco-Canqui, H.; Ruis, S.J. Cover crops impacts on soil physical properties: A review. Soil Sci. Soc. Am. J. 2020, 84, 1527–1576. [Google Scholar] [CrossRef]
  102. Hamza, M.A.; Anderson, W.K. Soil compaction in cropping systems: A review of the nature, causes and possible solutions. Soil Tillage Res. 2005, 82, 121–145. [Google Scholar] [CrossRef]
  103. Nicholls, R.J.; Lincke, D.; Hinkel, J.; Brown, S.; Vafeidis, A.T.; Meyssignac, B.; Hanson, S.E.; Merkens, J.L.; Fang, J. A global analysis of subsidence, relative sea-level change and coastal flood exposure. Nat. Clim. Change 2021, 11, 338–342. [Google Scholar] [CrossRef]
  104. Wang, Y.; Luo, G.; Li, C.; Ye, H.; Shi, H.; Fan, B.; Zhang, W.; Zhang, C.; Xie, M.; Zhang, Y. Effects of land clearing for agriculture on soil organic carbon stocks in drylands: A meta-analysis. Glob. Change Biol. 2023, 29, 547–562. [Google Scholar] [CrossRef]
  105. IPCC. Climate Change 2022: Impacts, Adaptation and Vulnerability; Pörtner, H.-O., Roberts, D.C., Tignor, M., Poloczanska, E.S., Mintenbeck, K., Alegría, A., Craig, M., Langsdorf, S., Löschke, S., Möller, V., et al., Eds.; Contribution of Working Group II to the Sixth Assessment Report of the Intergovernmental Panel on Climate Change; Cambridge University Press: Cambridge, UK; New York, NY, USA, 2022; 3056p. [Google Scholar]
  106. Schmidt, M.W.I.; Torn, M.S.; Abiven, S.; Dittmar, T.; Guggenberger, G.; Janssens, I.A.; Kleber, M.; Kögel-Knabner, I.; Lehmann, J.; Manning, D.A.C.; et al. Persistence of soil organic matter as an ecosystem property. Nature 2011, 478, 49–56. [Google Scholar] [CrossRef]
  107. Wong, V.N.; Greene, R.S.B.; Dalal, R.C.; Murphy, B.W. Soil carbon dynamics in saline and sodic soils: A review. Soil Use Manag. 2010, 26, 2–11. [Google Scholar] [CrossRef]
  108. Neiske, F.; Seedtke, M.; Eschenbach, A.; Wilson, M.; Jensen, K.; Becker, J.N. Soil organic carbon stocks and stabilization mechanisms in tidal marshes along estuarine gradients. Geoderma 2025, 456, 117274. [Google Scholar] [CrossRef]
  109. Singh, A. Soil salinization management for sustainable development: A review. J. Environ. Manag. 2021, 277, 111383. [Google Scholar] [CrossRef]
  110. Li, T.; Cui, L.; Filipović, V.; Tang, C.; Lai, Y.; Wehr, B.; Song, X.; Chapman, S.; Liu, H.; Dalal, R.C.; et al. From soil health to agricultural productivity: The critical role of soil constraint management. Catena 2025, 250, 108776. [Google Scholar] [CrossRef]
  111. Paustian, K.; Lehmann, J.; Ogle, S.; Reay, D.; Robertson, G.P.; Smith, P. Climate-smart soils. Nature 2016, 532, 49–57. [Google Scholar] [CrossRef]
  112. Al-Graiti, T.; Szalai, Z.; Ujházy, N.; Fodor, N.; Árendás, T.; Nagy, A.; Szávai, P.; Karlik, M.; Márialigeti, K.; Jakab, G. Seasonal changes of soil organic matter composition in separate carbon pools of a cultivated Chernozem: The role of crops and fertilization. Geoderma Reg. 2025, 40, e00943. [Google Scholar] [CrossRef]
  113. Lembaid, I.; Moussadek, R.; Mrabet, R.; Bouhaouss, A. Modeling soil organic carbon changes under alternative climatic scenarios and soil properties using DNDC model at a semi-arid mediterranean environment. Climate 2022, 10, 23. [Google Scholar] [CrossRef]
  114. Crowther, T.W.; Todd-Brown, K.E.O.; Rowe, C.W.; Wieder, W.R.; Carey, J.C.; Machmuller, M.B.; Snoek, B.L.; Fang, S.; Zhou, G.; Allison, S.D.; et al. Quantifying global soil carbon losses in response to warming. Science 2016, 351, 138–141. [Google Scholar] [CrossRef]
  115. Conant, R.T.; Cerri, C.E.P.; Osborne, B.B.; Paustian, K. Grassland management impacts on soil carbon stocks: A new synthesis. Biogeochemistry 2017, 136, 351–365. [Google Scholar] [CrossRef]
  116. Luo, Y.; Ahlström, A.; Allison, S.D.; Batjes, N.H.; Brovkin, V.; Carvalhais, N.; Chappell, A.; Ciais, P.; Davidson, E.A.; Finzi, A.; et al. Toward more realistic projections of soil carbon dynamics by Earth system models. Glob. Biogeochem. Cycles 2016, 30, 40–56. [Google Scholar] [CrossRef]
  117. Bakr, N.; Shahin, S.A.; Essa, E.F.; Elbana, T.A. Water Quality and Dissolved Organic Carbon Content in Agricultural Streams: Northern Nile Delta Region, Egypt. Water Air Soil Pollut. 2024, 235, 147. [Google Scholar] [CrossRef]
  118. Minasny, B.; Malone, B.P.; McBratney, A.B.; Angers, D.A.; Arrouays, D.; Chambers, A.; Chaplot, V.; Chen, Z.S.; Cheng, K.; Das, B.S.; et al. Soil carbon 4 per mille. Geoderma 2017, 292, 59–86. [Google Scholar] [CrossRef]
  119. Sanderman, J.; Hengl, T.; Fiske, G.J. Soil carbon debt of 12,000 years of human land use. Glob. Change Biol. 2017, 23, 512–533. [Google Scholar] [CrossRef]
  120. Zhou, J.; Shao, G.; Liu, E.; Liu, Q.; Yan, C.; Alharbi, S.A.; Filimonenko, E.; Mei, X.; Kuzyakov, Y. Climate warming and agronomic practice interactively alter soil carbon stock in dry farmland in China. Commun. Earth. Environ. 2025, 6, 788. [Google Scholar] [CrossRef]
  121. Smith, J.O.; Smith, P.; Wattenbach, M.; Zaehle, S.; Hiederer, R.; Jones, R.J.; Montanarella, L.; Rounsevell, M.D.; Reginster, I.; Ewert, F. Projected changes in mineral soil carbon of European croplands and grasslands, 1990–2080. Glob. Change Biol. 2005, 11, 2141–2152. [Google Scholar] [CrossRef]
  122. Farina, R.; Sándor, R.; Abdalla, M.; Álvaro-Fuentes, J.; Bechini, L.; Bolinder, M.A.; Brilli, L.; Chenu, C.; Clivot, H.; De Antoni Migliorati, M.; et al. Ensemble modelling, uncertainty and robust predictions of organic carbon in long-term bare-fallow soils. Glob. Change Biol. 2021, 27, 904–928. [Google Scholar] [CrossRef]
  123. Paramesh, V.; Kumar, P.; Nath, A.J.; Francaviglia, R.; Mishra, G.; Arunachalam, V.; Toraskar, S. Simulating soil organic carbon stock under different climate change scenarios: A RothC model application to typical land-use systems of Goa, India. Catena 2022, 213, 106129. [Google Scholar] [CrossRef]
  124. Spotorno, S.; Gobin, A.; Vazquez, D.A.A.; Gagliano, E.; Del Borghi, A.; Gallo, M. From Soil Carbon towards System Sustainability: Integrating SOC Modelling and Life Cycle Assessment to evaluate environmental trade-offs in Carbon Farming. Farming Syst. 2025, 4, 100195. [Google Scholar] [CrossRef]
  125. Yagasaki, Y.; Shirato, Y. Assessment on the rates and potentials of soil organic carbon sequestration in agricultural lands in Japan using a process-based model and spatially explicit land-use change inventories—Part 2: Future potentials. Biogeosciences 2014, 11, 4443–4457. [Google Scholar] [CrossRef]
  126. Gazioğlu, S. Partitioning uncertainty in model predictions from compartmental modeling of global carbon cycle. Math. Comput. Appl. 2024, 29, 47. [Google Scholar] [CrossRef]
  127. He, X.; Abramoff, R.Z.; Abs, E.; Goll, D.S. Model uncertainty obscures major driver of soil carbon. Nature 2024, 627, E1–E3. [Google Scholar] [CrossRef] [PubMed]
  128. You, C.; Qu, H.; Zhang, S.; Guo, L. Assessment of uncertainties in ecological risk based on the prediction of land use change and ecosystem service evolution. Land 2024, 13, 535. [Google Scholar] [CrossRef]
Figure 1. (A) Location of the study area in the northern Nile delta, Egypt. (B) Spatial distribution of the 30 soil sampling sites across the main depositional units and the locations of the two metrological points (a and b) used for climate data acquisition.
Sustainability 18 02884 g001
Figure 2. Average of 40-year (1981–2021) maximum, minimum, and mean air temperature, earth skin temperature, and precipitation for locations a and b, Northern Nile delta, Egypt.
Sustainability 18 02884 g002
Figure 3. The methodology flowchart for the current research. Colors indicate the four main workflow objectives; (1) monitoring LULC changes using Landsat imagery from 1972 to 2021 (light green); (2) calculating and mapping 2021 SOCs as a baseline (light blue); (3) predicting SOCs and PSOCS to 2100 using RothC model (yellow); and (4) evaluating the uncertainty of projected SOCs and PSOCS using a Monte Carlo approach (orange).
Sustainability 18 02884 g003
Figure 4. The final subset of cloud-free Landsat images covering the study area from 1972 to 2021.
Sustainability 18 02884 g004
Figure 5. Maximum likelihood classification maps showing the final land use/land cover (LULC) classes in the study area from 1972 to 2021.
Sustainability 18 02884 g005
Figure 6. Spatial distribution of SOCs (Mg C ha−1) across LULC classes during summer (A) and winter (B) seasons in the study area.
Sustainability 18 02884 g006
Figure 7. The SOCs (A) and PSOCS (B) under four SSP2-4.5 scenarios until 2100.
Sustainability 18 02884 g007aSustainability 18 02884 g007b
Table 1. Detailed information on the Landsat satellite images utilized in this study.
Imagery DateSpatial ResolutionSpacecraft IDSensor Identifier *Path/RowNo. of BandsBand Combination (R-G-B)
197260 mLandsat-1MSS190/03844-2-1
197860 mLandsat-3MSS190/03844-2-1
198460 mLandsat-5MSS177/03844-2-1
199030 mLandsat-4TM177/03874-7-3
199630 mLandsat-5TM177/03874-7-3
200230 mLandsat-5TM177/03884-7-3
200830 mLandsat-5TM177/03884-7-3
201830 mLandsat-8OLI/TIRS177/038117-5-4
202130 mLandsat-8OLI/TIRS177/038117-5-4
* MSS: multispectral scanner, TM: thematic mapper; OLI: operational land imager; TIRS: thermal infrared sensor.
Table 2. Area coverage by square kilometer (km2) and percentage (%) of land use/land cover (LULC) classes in the study area from 1972 to 2021.
LULC197219781984199019962002200820182021
Agricultural Landkm2180.63187.59209.68256.66304.7368.57407.89479.68510.58
%12.2112.6814.1817.3520.624.9227.5832.4334.52
Fish Farmkm20.000.000.00109.94102.26105.03181.62306.66347.73
%0.000.000.007.436.917.1012.2820.7323.51
Urban Areaskm20.660.930.784.5510.7312.7030.2564.4863.55
%0.040.060.050.310.730.862.054.364.30
Water Bodieskm2460.87337.49276.10315.71329.55297.02283.38231.73257.1
%31.1622.8218.6721.3522.2820.0819.1615.6717.38
Natural Vegetationkm2110.66233.39246.98230.4193.7160.9149.43153.55189.91
%7.4815.7816.7015.5813.1010.8810.1010.3812.84
Barren Landkm2250.89215.78195.8870.4565.8962.2059.3254.3827.86
%16.9614.5913.244.764.464.214.013.681.88
Dry Sabkhakm2315.74350.75398.89355.6326.91327.09235.76113.8128.34
%21.3523.7226.9724.0422.1022.1215.947.701.92
Wet Sabkhakm2159.56153.08150.70135.70145.27145.50131.3674.7253.94
%10.7910.3510.199.189.829.848.885.053.65
Table 3. Descriptive statistical parameters of measured soil properties (number of soil samples = 30).
Soil
Properties
Soil Organic CarbonSandSiltClayBulk Density
%g cm−3
SummerWinterSummerWinterSummerWinterSummerWinterSummerWinter
Minimum0.140.342.857.403.153.003.453.000.961.06
Maximum1.972.1393.4094.0047.4947.2065.2563.901.581.68
Mean1.301.4730.1131.6425.9225.5443.9742.841.281.38
Std. Dev. 10.520.5128.7928.5712.5212.5819.4019.140.140.13
Std. Err. 20.090.095.265.222.292.303.543.490.020.02
Percentile25%1.021.2110.2611.1016.8517.1035.0034.301.231.33
50%1.441.6116.4018.1026.4025.8550.7849.651.301.40
75%1.661.8344.0044.7035.5035.1059.0057.461.351.45
Skewness−0.86−0.831.311.32−0.22−0.23−1.10−1.10−0.53−0.53
Kurtosis−0.15−0.190.320.32−0.76−0.710.01−0.010.730.79
p-value<0.001 *<0.001 *0.008 *<0.001 *<0.001 *
1 Std. Dev., standard deviation; 2 Std. Err., standard error; * p-value is significant at significance level of α = 0.05.
Table 4. Pearson’s correlation matrix of measured soil properties.
Soil
Properties
Soil Organic CarbonSandSiltClayBulk Density
%g cm−3
SummerWinterSummerWinterSummerWinterSummerWinterSummerWinter
SOCSummer1
Winter0.996 **1
SandSummer−0.557 **−0.564 **1
Winter−0.556 **−0.564 **0.999 **1
SiltSummer0.469 *0.475 **−0.845 **−0.845 **1
Winter0.470 *0.476 **−0.843 **−0.846 **0.996 **1
ClaySummer0.523 **0.531 **−0.939 **−0.937 **0.609 **0.608 **1
Winter0.521 **0.529 **−0.938 **−0.937 **0.607 **0.606 **1.000 **1
BDSummer−0.285−0.2740.2870.290−0.194−0.207−0.300−0.2971
Winter−0.274−0.2630.2780.278−0.194−0.201−0.287−0.2840.997 **1
−1–−0.8−0.8–−0.6−0.6–−0.4−0.4–−0.2−0.2–00–0.20.2–0.40.4–0.60.6–0.80.8–1
Correlation is significantCorrelation is not significantCorrelation is significant
** Correlation is significant at the significance level of α = 0.01, * Correlation is significant at the significance level of α = 0.05.
Table 5. Area coverage by square kilometer (km2) and percentage (%) of soil organic carbon stock (SOCs) across four 2021 LULC classes in summer and winter seasons.
SOCs
(Mg C ha−1)
Land Use/Land Cover Classes
Agricultural LandBarren LandDry SabkhaWet Sabkha
km2%km2%km2%km2%
Summer
<331.006.0910.2337.089.0231.8426.1848.65
3–5263.6951.799.4034.0911.0338.9719.7836.76
5–7146.8928.857.9528.838.2629.197.8514.59
7–946.849.20------------------
9–1220.724.07------------------
Winter
<34.920.976.1622.325.6720.0317.2432.04
3–5139.8427.4711.2040.5910.3736.4118.0233.47
5–7220.2443.269.4034.0911.1639.4118.2633.92
7–994.5818.580.833.001.113.920.310.57
9–1219.423.81------------------
12–1430.095.91------------------
Total509.10100.0027.59100.0028.31100.0053.82100.00
Table 6. Descriptive statistical parameters for the calculated SOCs (Mg C ha−1) (number of soil samples= 23).
ParametersSeason
SummerWinter
Minimum0.611.60
Maximum11.3613.75
Mean4.785.83
Standard Deviation2.803.17
Standard Error0.580.66
Percentile25%2.833.65
50%4.285.30
75%6.387.79
Skewness0.831.04
Kurtosis0.651.01
p-value<0.001 *
Pearson Correlation0.997 **
* p-value is significant at significance level of α = 0.05, ** correlation is significant at the significance level of α = 0.01.
Table 7. Minimum, maximum, and mean of projected SOCs (Mg C ha−1) and PSOCS (Mg C ha−1) with 10-year intervals up to 2100 under four SSP2-4.5 climate scenarios (SSP_Sce1, SSP_Sce2, SSP_Sce3, and SSP_Sce4).
ScenarioParameter20302040205020602070208020902100
SSP_Sce1SOCs
(Mg C ha−1)
Minimum1.671.681.691.691.681.681.681.67
Maximum14.3614.4514.4914.5114.5014.4814.4514.40
Mean6.106.136.156.166.156.146.136.11
PSOCS
(Mg C ha−1)
Minimum0.070.080.090.090.080.080.080.07
Maximum0.610.700.740.760.750.730.700.65
Mean0.260.300.320.320.320.310.300.28
SSP_Sce2SOCs
(Mg C ha−1)
Minimum1.671.681.681.681.681.671.671.66
Maximum14.3614.4414.4714.4714.4514.4214.3714.30
Mean6.096.136.146.146.136.126.096.07
PSOCS
(Mg C ha−1)
Minimum0.070.080.080.080.080.070.070.06
Maximum0.610.690.720.720.700.670.620.55
Mean0.260.300.310.310.300.280.260.23
SSP_Sce3SOCs
(Mg C ha−1)
Minimum1.671.681.681.681.671.661.651.64
Maximum14.3614.4314.4414.4314.3914.3314.2514.16
Mean6.096.126.136.126.106.086.056.01
PSOCS
(Mg C ha−1)
Minimum0.070.080.080.080.070.060.050.04
Maximum0.610.680.690.680.640.580.500.41
Mean0.260.290.290.290.270.250.210.17
SSP_Sce4SOCs
(Mg C ha−1)
Minimum1.671.681.681.671.661.651.641.63
Maximum14.3514.4114.4214.3914.3414.2714.1714.06
Mean6.096.126.126.116.086.056.015.96
PSOCS
(Mg C ha−1)
Minimum0.070.080.080.070.060.050.040.03
Maximum0.600.660.670.640.590.520.420.31
Mean0.260.280.290.270.250.220.180.13
Table 8. Descriptive statistical parameters for the Monte Carlo uncertainty approach of projected SOCs using SSP2-4.5 climate scenarios.
Soil Organic Carbon Stock
(Mg C ha−1)
Scenario 1Scenario 2Scenario 3Scenario 4
Median5th95thMedian5th95thMedian5th95thMedian5th95th
Minimum6.034.068.696.004.028.616.014.058.686.014.038.63
Maximum6.274.519.106.224.479.006.224.489.056.224.509.04
Mean6.234.408.846.184.368.776.174.358.826.164.368.75
Standard Deviation0.050.100.130.050.100.120.050.120.120.060.120.10
Standard Error0.010.010.010.010.010.010.010.010.010.010.010.01
Variance0.000.010.020.000.010.020.000.010.010.000.010.01
Percentile25%6.214.328.736.154.308.656.144.268.716.124.278.66
50%6.244.438.826.194.398.746.194.398.796.184.408.73
75%6.274.488.956.214.458.886.214.468.936.214.478.82
Skewness−1.99−0.980.49−1.54−1.080.37−1.15−0.720.40−0.76−0.690.71
Kurtosis4.060.54−1.132.650.88−1.190.84−0.66−1.29−0.50−0.62−0.16
Table 9. The descriptive statistical parameters for the Monte Carlo uncertainty approach of projected PSOCS using SSP2-4.5 climate scenarios.
Potential SOCS
(Mg C ha−1)
Scenario 1Scenario 2Scenario 3Scenario 4
Median5th95thMedian5th95thMedian5th95thMedian5th95th
Minimum0.20−1.772.860.17−1.812.780.18−1.792.840.18−1.802.80
Maximum0.44−1.333.270.39−1.373.170.39−1.363.220.39−1.333.21
Mean0.40−1.443.010.34−1.472.930.34−1.482.990.33−1.472.92
Standard Deviation0.050.100.130.050.100.120.050.120.120.060.120.10
Standard Error0.010.010.010.010.010.010.010.010.010.010.010.01
Variance0.000.010.020.000.010.020.000.010.010.000.010.01
Percentile25%0.38−1.512.890.32−1.542.820.31−1.572.880.29−1.562.83
50%0.41−1.402.990.36−1.442.910.35−1.452.950.34−1.442.89
75%0.44−1.353.120.38−1.383.050.38−1.383.100.38−1.362.99
Skewness−1.92−0.980.48−1.54−1.080.37−1.15−0.720.40−0.76−0.690.71
Kurtosis3.730.52−1.122.630.86−1.190.86−0.67−1.29−0.49−0.62−0.17
Disclaimer/Publisher’s Note: The statements, opinions and data contained in all publications are solely those of the individual author(s) and contributor(s) and not of MDPI and/or the editor(s). MDPI and/or the editor(s) disclaim responsibility for any injury to people or property resulting from any ideas, methods, instructions or products referred to in the content.